.2 Q4 & FY 2025 Financial Results Apollo Commercial Real Estate Finance, Inc. February 10, 2026 Unless otherwise noted, information as of December 31, 2025 It should not be assumed that investments made in the future will be profitable or will equal the performance of the investments shown in this document.
Forward Looking Statements and Other Disclosures This presentation may contain forward-looking statements that are within the meaning of Section 27A of the Securities Act of 1933, as amended, and Section 21E of the Securities Exchange Act of 1934, as amended, and such statements are intended to be covered by the safe harbor provided by the same. Forward-looking statements are subject to substantial risks and uncertainties, many of which are difficult to predict and are generally beyond management’s control. These forward-looking statements may include information about possible or assumed future results of Apollo Commercial Real Estate Finance, Inc.’s (the “Company,” “ARI,” “we,” “us” and “our”) business, financial condition, liquidity, results of operations, plans and objectives. When used in this presentation, the words “believe,” “expect,” “anticipate,” “estimate,” “plan,” “continue,” “intend,” “should,” “may” or similar expressions, are intended to identify forward-looking statements. Statements regarding the following subjects, among others, may be forward-looking: higher interest rates and inflation; market trends in our industry, real estate values, the debt securities markets or the general economy; ARI’s business and investment strategy; ARI’s operating results; ARI’s ability to obtain and maintain financing arrangements; the timing and amounts of expected future fundings of unfunded commitments; and the return on equity, the yield on investments and risks associated with investing in real estate assets including changes in business conditions and the general economy. The forward-looking statements are based on management’s beliefs, assumptions and expectations of future performance, taking into account all information currently available to ARI. Forward-looking statements are not predictions of future events. These beliefs, assumptions and expectations can change as a result of many possible events or factors, not all of which are known to ARI. Some of these factors are described under “Risk Factors,” and “Management’s Discussion and Analysis of Financial Condition and Results of Operations” included in ARI’s Annual Report on Form 10-K for the year ended December 31, 2025 and other filings with the Securities and Exchange Commission (“SEC”), which are accessible on the SEC’s website at www.sec.gov. If a change occurs, ARI’s business, financial condition, liquidity and results of operations may vary materially from those expressed in ARI’s forward-looking statements. Any forward-looking statement speaks only as of the date on which it is made. New risks and uncertainties arise over time, and it is not possible for management to predict those events or how they may affect ARI. Except as required by law, ARI is not obligated to, and does not intend to, update or revise any forward-looking statements, whether as a result of new information, future events or otherwise. This presentation contains information regarding ARI’sfinancial resultsthatiscalculated and presented on the basis of methodologies other than in accordance with accounting principles generally accepted in the United States (“GAAP”), including Distributable Earnings and Distributable Earnings per share. Please refer to page 22 for a definition of “Distributable Earnings” and the reconciliation of the applicable GAAP financial measures to non-GAAP financial measures set forth on page 21. This presentation may contain statistics and other data that in some cases has been obtained from or compiled from information made available by third-party service providers. ARI makes no representation or warranty, expressed or implied, with respect to the accuracy, reasonableness or completeness of such information. Past performance is not indicative nor a guarantee of future returns. Index performance and yield data are shown for illustrative purposes only and have limitations when used for comparison or for other purposes due to, among other matters, volatility, credit or other factors (such as number and types of securities). Indices are unmanaged, do not charge any fees or expenses, assume reinvestment of income and do not employ special investment techniques such as leveraging or short selling. No such index is indicative of the future results of any investment by ARI. Unless the context requires otherwise, references in this presentation to “Apollo” refer to Apollo Global Management, Inc., together with its subsidiaries, and references in this presentation to the “Manager” refer to ACREFI Management, LLC, an indirect subsidiary of Apollo Global Management, Inc. 2
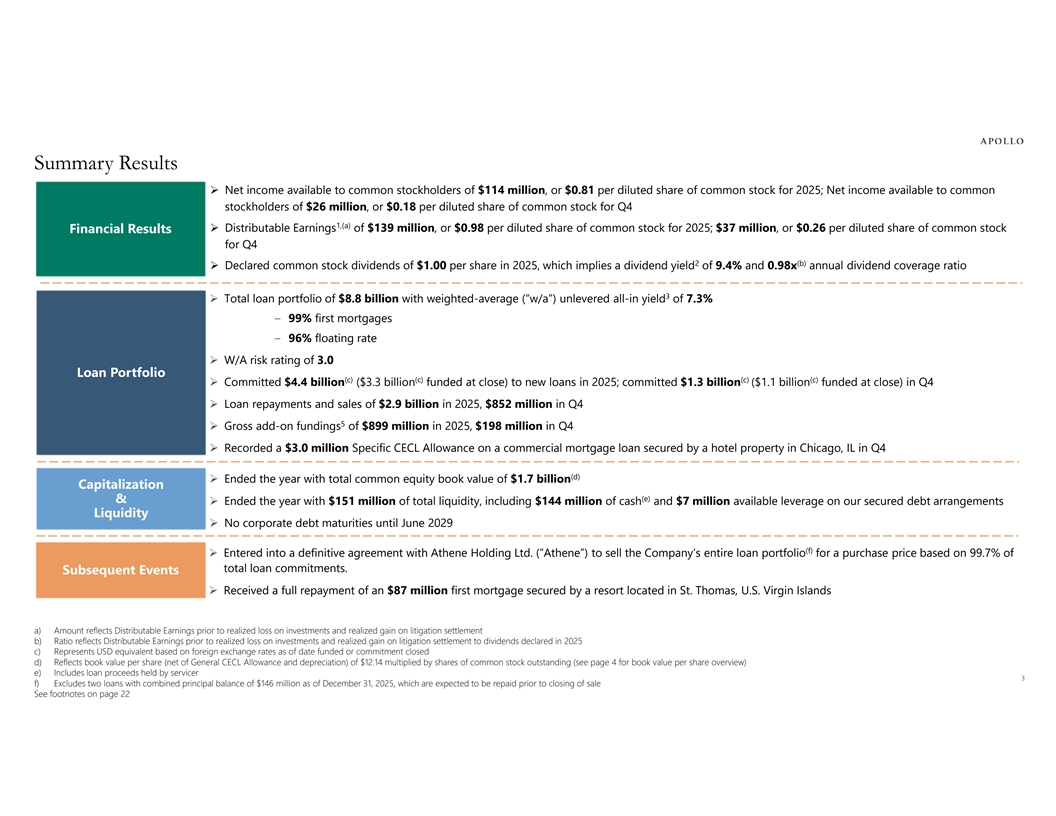
Summary Results Ø Net income available to common stockholders of $114 million, or $0.81 per diluted share of common stock for 2025; Net income available to common stockholders of $26 million, or $0.18 per diluted share of common stock for Q4 1,(a) Ø Distributable Earnings of $139 million, or $0.98 per diluted share of common stock for 2025; $37 million, or $0.26 per diluted share of common stock Financial R Financial Re esults sults for Q4 2 (b) Ø Declared common stock dividends of $1.00 per share in 2025, which implies a dividend yield of 9.4% and 0.98x annual dividend coverage ratio 3 Ø Total loan portfolio of $8.8 billion with weighted-average (“w/a”) unlevered all-in yield of 7.3% – 99% first mortgages – 96% floating rate Ø W/A risk rating of 3.0 Lo Loan P an Po or rt tfolio folio (c) (c) (c) (c) Ø Committed $4.4 billion ($3.3 billion funded at close) to new loans in 2025; committed $1.3 billion ($1.1 billion funded at close) in Q4 Ø Loan repayments and sales of $2.9 billion in 2025, $852 million in Q4 5 Ø Gross add-on fundings of $899 million in 2025, $198 million in Q4 Ø Recorded a $3.0 million Specific CECL Allowance on a commercial mortgage loan secured by a hotel property in Chicago, IL in Q4 (d) Ø Ended the year with total common equity book value of $1.7 billion Capitalization Capitalization (e) & & Ø Ended the year with $151 million of total liquidity, including $144 million of cash and $7 million available leverage on our secured debt arrangements Liquidity Liquidity Ø No corporate debt maturities until June 2029 (f) Ø Entered into a definitive agreement with Athene Holding Ltd. (“Athene”) to sell the Company’s entire loan portfolio for a purchase price based on 99.7% of total loan commitments. Subsequent Ev Subsequent Events ents Ø Received a full repayment of an $87 million first mortgage secured by a resort located in St. Thomas, U.S. Virgin Islands a) Amount reflects Distributable Earnings prior to realized loss on investments and realized gain on litigation settlement b) Ratio reflects Distributable Earnings prior to realized loss on investments and realized gain on litigation settlement to dividends declared in 2025 c) Represents USD equivalent based on foreign exchange rates as of date funded or commitment closed d) Reflects book value per share (net of General CECL Allowance and depreciation) of $12.14 multiplied by shares of common stock outstanding (see page 4 for book value per share overview) e) Includes loan proceeds held by servicer 3 f) Excludes two loans with combined principal balance of $146 million as of December 31, 2025, which are expected to be repaid prior to closing of sale See footnotes on page 22
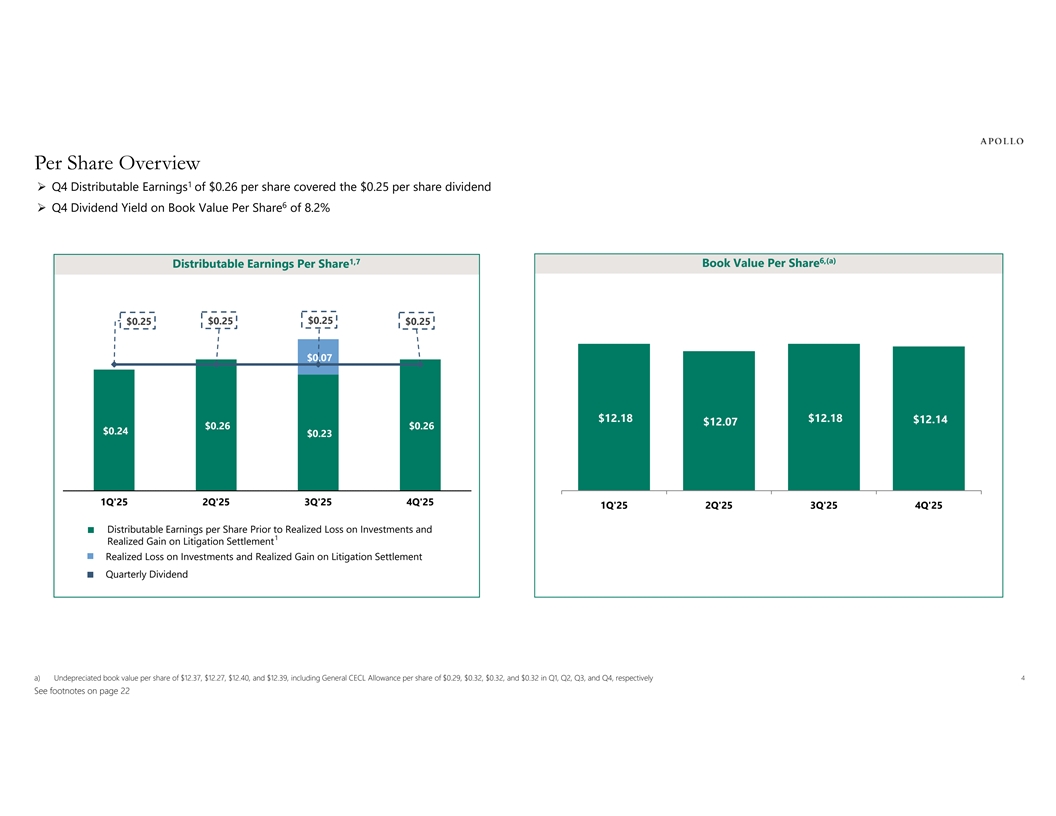
Per Share Overview 1 Ø Q4 Distributable Earnings of $0.26 per share covered the $0.25 per share dividend 6 Ø Q4 Dividend Yield on Book Value Per Share of 8.2% 1,7 6,(a) Book Value Per Share Distributable Earnings Per Share $0.25 $0.25 $0.25 $0.25 $0.07 $12.18 $12.18 $12.14 $12.07 $0.26 $0.26 $0.24 $0.23 1Q'25 2Q'25 3Q'25 4Q'25 1Q'25 2Q'25 3Q'25 4Q'25 Distributable Earnings per Share Prior to Realized Loss on Investments and § 1 Realized Gain on Litigation Settlement Realized Loss on Investments and Realized Gain on Litigation Settlement § Quarterly Dividend § 4 a) Undepreciated book value per share of $12.37, $12.27, $12.40, and $12.39, including General CECL Allowance per share of $0.29, $0.32, $0.32, and $0.32 in Q1, Q2, Q3, and Q4, respectively See footnotes on page 22
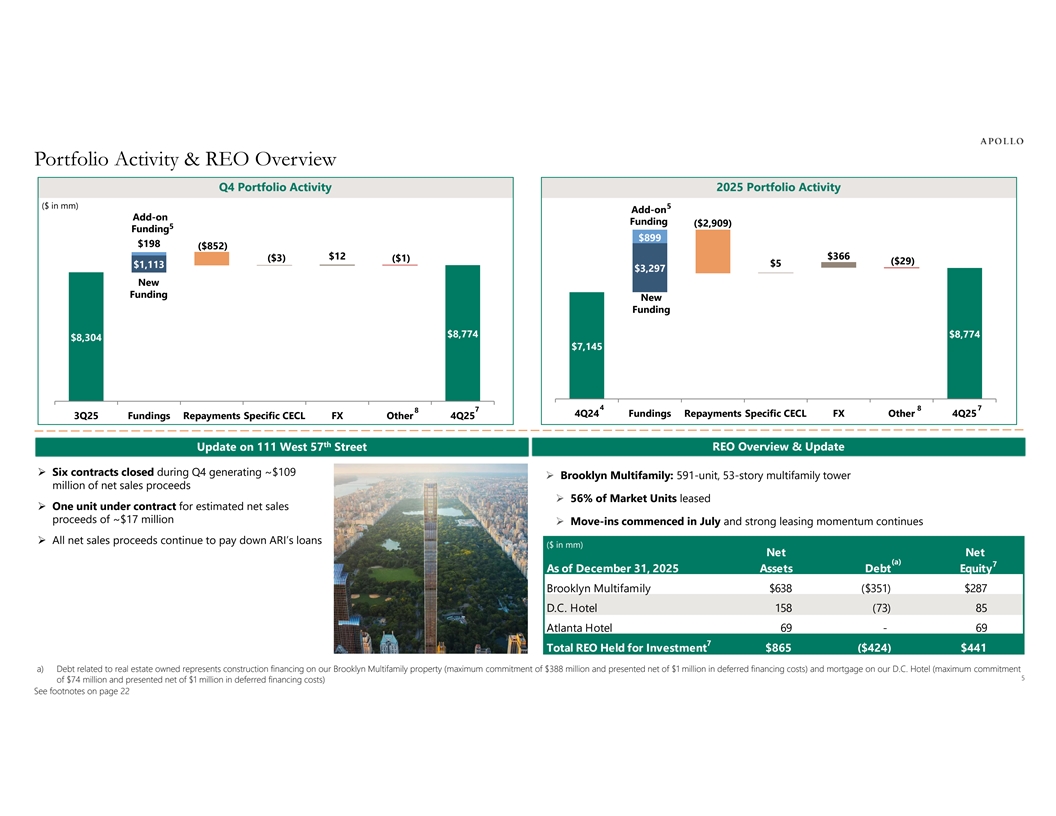
Portfolio Activity & REO Overview Q4 Portfolio Activity 2025 Portfolio Activity ($ in mm) 5 Add-on Add-on Funding ($2,909) 5 Funding $899 $198 ($852) $12 $366 ($3) ($1) ($29) $5 $1,113 $3,297 New Funding New Funding $8,774 $8,774 $8,774 $8,774 $8,304 $7,145 4 8 7 7 8 4Q24 Fundings Repayments Specific CECL FX Other 4Q25 3Q25 Fundings Repayments Specific CECL FX Other 4Q25 th th Update on Update on 111 111 West West 57 57 Street Street REO Overview REO Overview & & Update Update Ø Six contracts closed during Q4 generating ~$109 Ø Brooklyn Multifamily: 591-unit, 53-story multifamily tower million of net sales proceeds Ø 56% of Market Units leased Ø One unit under contract for estimated net sales proceeds of ~$17 million Ø Move-ins commenced in July and strong leasing momentum continues Ø All net sales proceeds continue to pay down ARI’s loans ($ in mm) Net Net (a) 7 As of December 31, 2025 Assets Debt Equity Brooklyn Multifamily $638 ($351) $287 D.C. Hotel 158 (73) 85 Atlanta Hotel 69 - 69 7 Total REO Held for Investment $865 ($424) $441 a) Debt related to real estate owned represents construction financing on our Brooklyn Multifamily property (maximum commitment of $388 million and presented net of $1 million in deferred financing costs) and mortgage on our D.C. Hotel (maximum commitment 5 of $74 million and presented net of $1 million in deferred financing costs) See footnotes on page 22
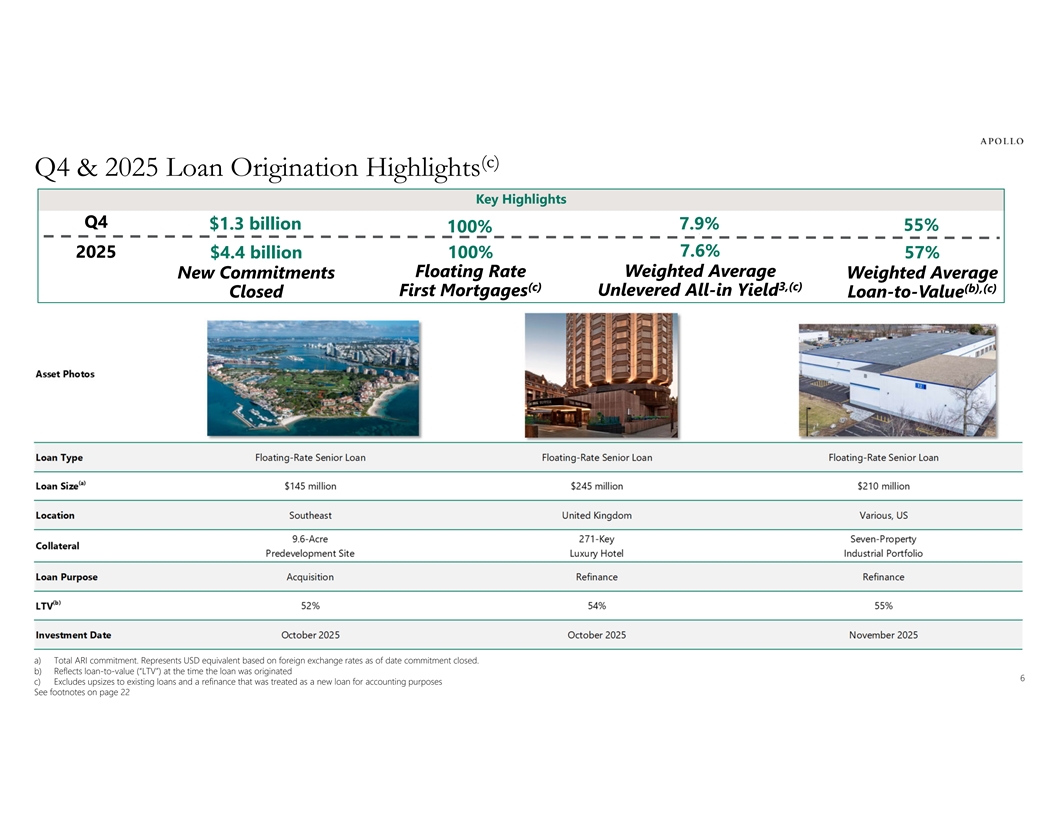
(c) Q4 & 2025 Loan Origination Highlights Key Highlights Q4 $1.3 billion 7.9% 55% 100% ] 7.6% 2025 $4.4 billion 100% 57% ] Floating Rate Weighted Average New Commitments Weighted Average (c) 3,(c) (b),(c) First Mortgages Unlevered All-in Yield Closed Loan-to-Value a) Total ARI commitment. Represents USD equivalent based on foreign exchange rates as of date commitment closed. b) Reflects loan-to-value (“LTV”) at the time the loan was originated 6 c) Excludes upsizes to existing loans and a refinance that was treated as a new loan for accounting purposes See footnotes on page 22
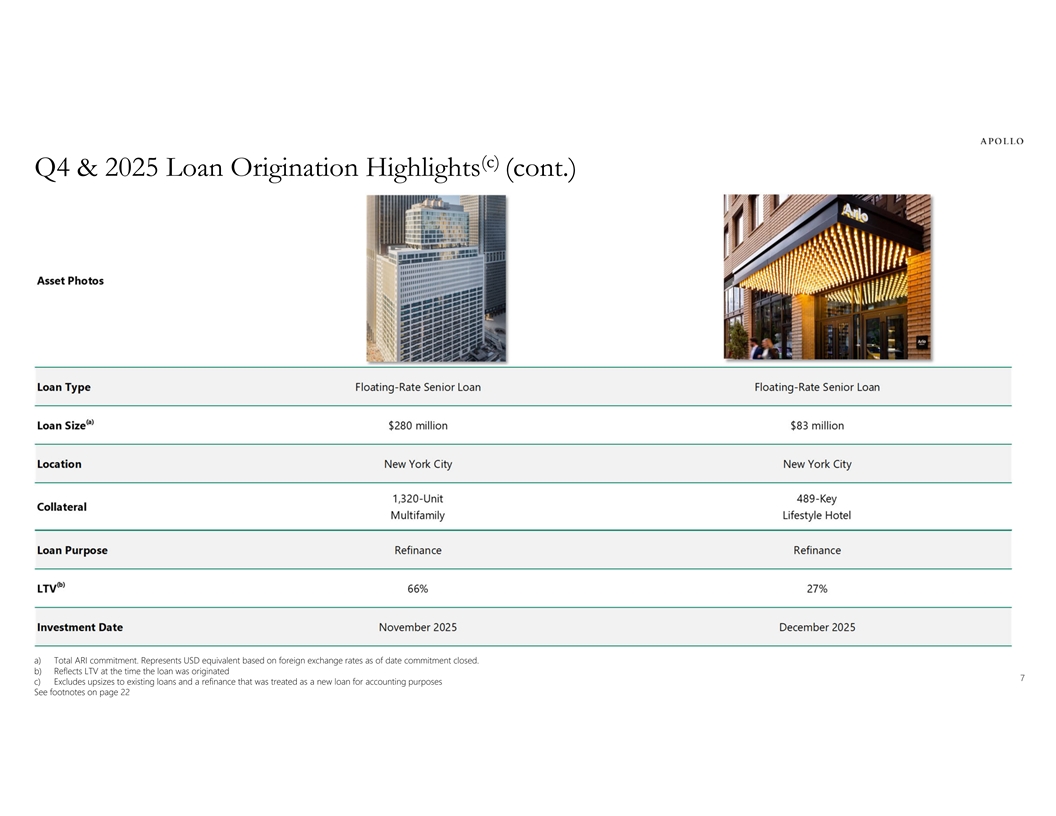
(c) Q4 & 2025 Loan Origination Highlights (cont.) a) Total ARI commitment. Represents USD equivalent based on foreign exchange rates as of date commitment closed. b) Reflects LTV at the time the loan was originated 7 c) Excludes upsizes to existing loans and a refinance that was treated as a new loan for accounting purposes See footnotes on page 22
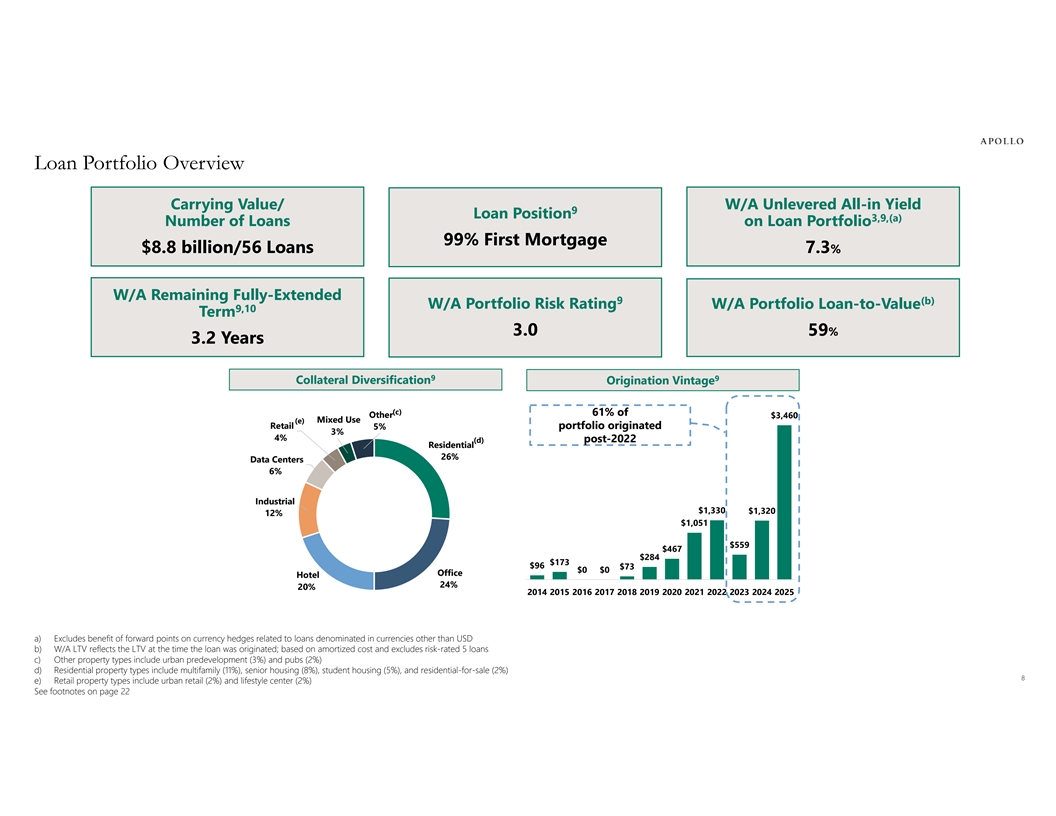
Loan Portfolio Overview Carrying Value/ W/A Unlevered All-in Yield 9 Loan Position 3,9,(a) Number of Loans on Loan Portfolio 99% First Mortgage $8.8 billion/56 Loans 7.3% W/A Remaining Fully-Extended 9 (b) W/A Portfolio Risk Rating W/A Portfolio Loan-to-Value 9,10 Term 3.0 59% 3.2 Years 9 9 Collateral Diversification Origination Vintage (c) 61% of Other $3,460 Mixed Use (e) Retail 5% portfolio originated 3% 4% (d) post-2022 Residential 26% Data Centers 6% Industrial $1,330 $1,320 12% $1,051 $559 $467 $284 $173 $96 $73 $0 $0 Office Hotel 24% 20% 2014 2015 2016 2017 2018 2019 2020 2021 2022 2023 2024 2025 a) Excludes benefit of forward points on currency hedges related to loans denominated in currencies other than USD b) W/A LTV reflects the LTV at the time the loan was originated; based on amortized cost and excludes risk-rated 5 loans c) Other property types include urban predevelopment (3%) and pubs (2%) d) Residential property types include multifamily (11%), senior housing (8%), student housing (5%), and residential-for-sale (2%) 8 e) Retail property types include urban retail (2%) and lifestyle center (2%) See footnotes on page 22
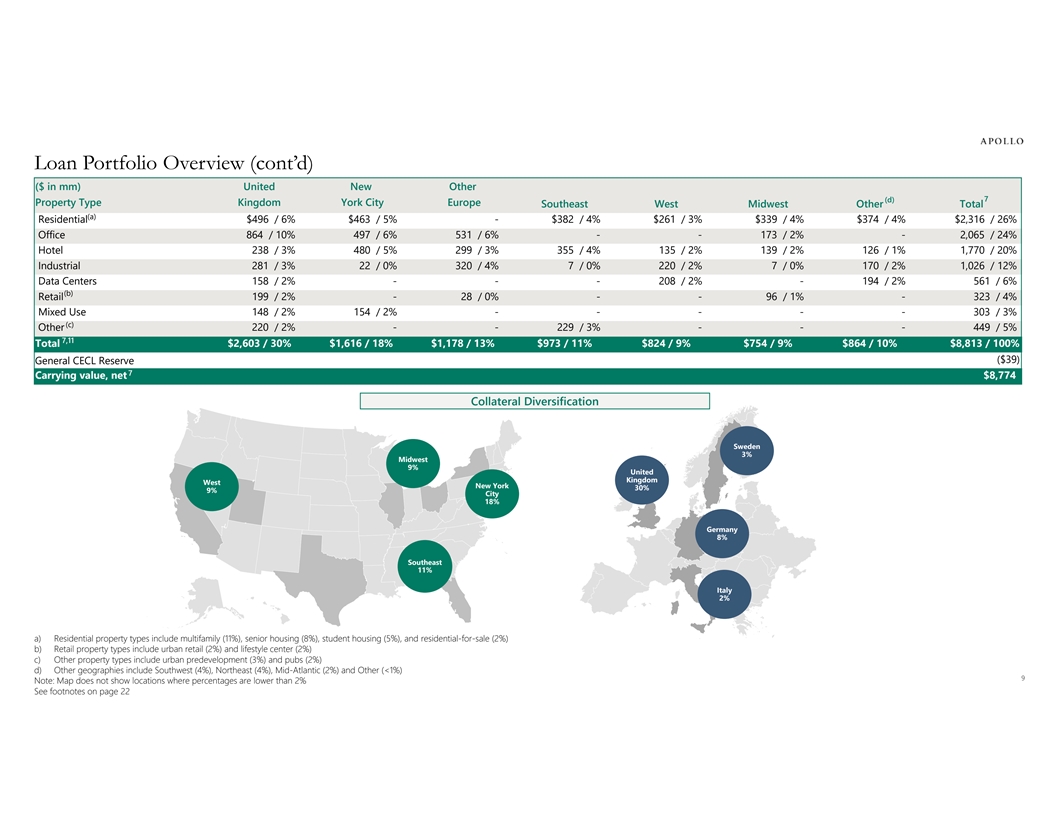
Loan Portfolio Overview (cont’d) ($ in mm) United New Other 7 (d) Property Type Kingdom York City Europe Southeast West Midwest Other Total (a) Residential $496 / 6% $463 / 5% - $382 / 4% $261 / 3% $339 / 4% $374 / 4% $2,316 / 26% Office 864 / 10% 497 / 6% 531 / 6% - - 173 / 2% - 2,065 / 24% Hotel 238 / 3% 480 / 5% 299 / 3% 355 / 4% 135 / 2% 139 / 2% 126 / 1% 1,770 / 20% Industrial 281 / 3% 22 / 0% 320 / 4% 7 / 0% 220 / 2% 7 / 0% 170 / 2% 1,026 / 12% Data Centers 158 / 2% - - - 208 / 2% - 194 / 2% 561 / 6% (b) Retail 199 / 2% - 28 / 0% - - 96 / 1% - 323 / 4% Mixed Use 148 / 2% 154 / 2% - - - - - 303 / 3% (c) Other 220 / 2% - - 229 / 3% - - - 449 / 5% 7,11 Total $2,603 / 30% $1,616 / 18% $1,178 / 13% $973 / 11% $824 / 9% $754 / 9% $864 / 10% $8,813 / 100% ($39) General CECL Reserve 7 Carrying value, net $8,774 Collateral Diversification Sweden 3% Midwest 9% United Kingdom West New York 30% 9% City 18% Germany 8% Southeast 11% Italy 2% Powered by Bing © GeoNames, Microsoft, TomTom Powered by Bing a) Residential property types include multifamily (11%), senior housing (8%), student housing (5%), and residential-for-sale (2%) © GeoNames, Microsoft, Open Places, OpenStreetMap, TomTom b) Retail property types include urban retail (2%) and lifestyle center (2%) c) Other property types include urban predevelopment (3%) and pubs (2%) d) Other geographies include Southwest (4%), Northeast (4%), Mid-Atlantic (2%) and Other (<1%) 9 Note: Map does not show locations where percentages are lower than 2% See footnotes on page 22
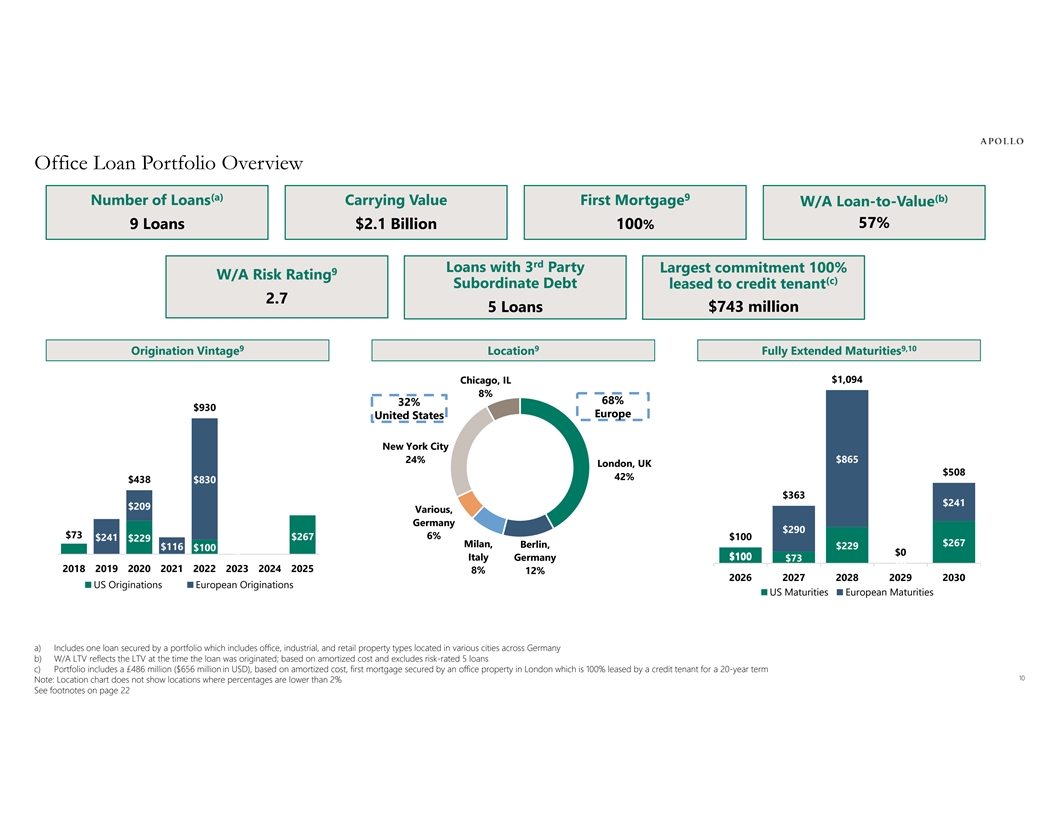
Office Loan Portfolio Overview (a) 9 (b) Number of Loans Carrying Value First Mortgage W/A Loan-to-Value 57% 9 Loans $2.1 Billion 100% rd Loans with 3 Party Largest commitment 100% 9 W/A Risk Rating (c) Subordinate Debt leased to credit tenant 2.7 5 Loans $743 million 9 9 9,10 Origination Vintage Location Fully Extended Maturities $1,094 Chicago, IL 8% 68% 32% $930 Europe United States New York City 24% $865 London, UK $508 42% $438 $830 $363 $241 $209 Various, Germany $290 $73 6% $267 $100 $241 $229 $267 Milan, Berlin, $229 $116 $100 $0 0 $100 Italy Germany $100 $73 $0 2018 2019 2020 2021 2022 2023 2024 2025 8% 12% 2026 2027 2028 2029 2030 US Originations European Originations US Maturities European Maturities a) Includes one loan secured by a portfolio which includes office, industrial, and retail property types located in various cities across Germany b) W/A LTV reflects the LTV at the time the loan was originated; based on amortized cost and excludes risk-rated 5 loans c) Portfolio includes a £486 million ($656 million in USD), based on amortized cost, first mortgage secured by an office property in London which is 100% leased by a credit tenant for a 20-year term 10 Note: Location chart does not show locations where percentages are lower than 2% See footnotes on page 22
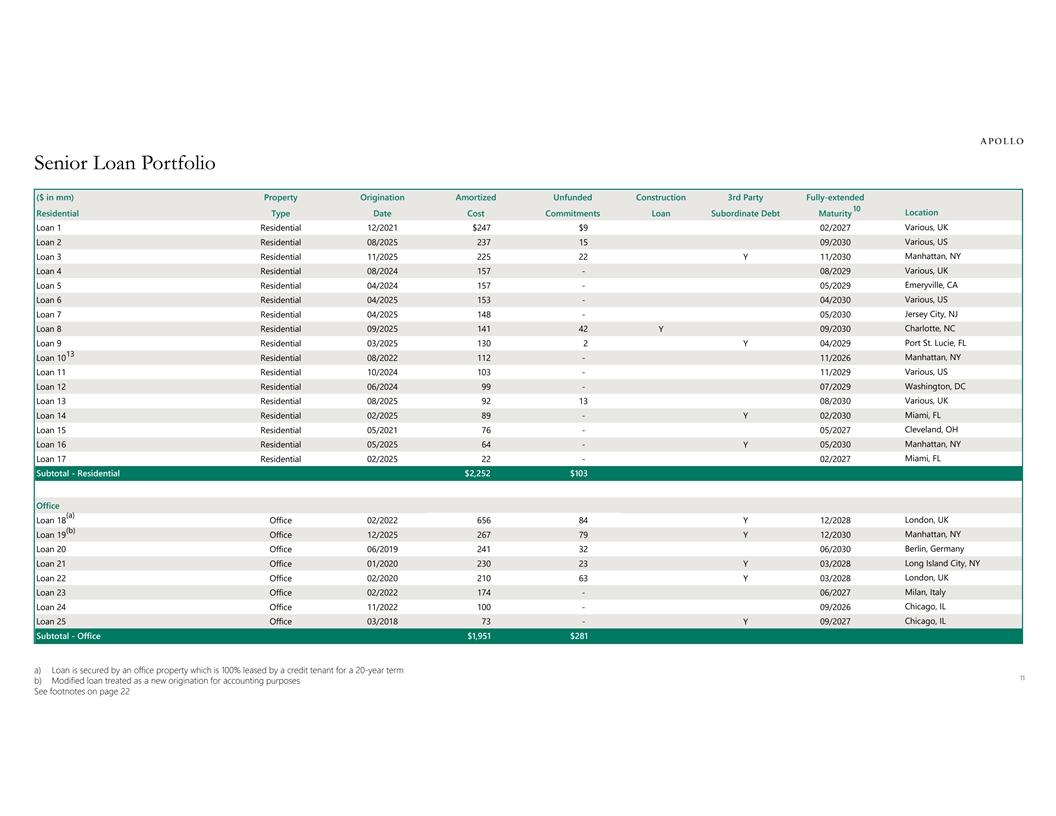
Senior Loan Portfolio ($ in mm) Property Origination Amortized Unfunded Construction 3rd Party Fully-extended 10 Residential Type Date Cost Commitments Loan Subordinate Debt Maturity Location Loan 1 Residential 12/2021 $247 $9 02/2027 Various, UK Loan 2 Residential 08/2025 237 15 09/2030 Various, US Manhattan, NY Loan 3 Residential 11/2025 225 22 Y 11/2030 Various, UK Loan 4 Residential 08/2024 157 - 08/2029 Emeryville, CA Loan 5 Residential 04/2024 157 - 05/2029 Loan 6 Residential 04/2025 153 - 04/2030 Various, US Loan 7 Residential 04/2025 148 - 05/2030 Jersey City, NJ Loan 8 Residential 09/2025 141 42 Y 09/2030 Charlotte, NC Loan 9 Residential 03/2025 130 2 Y 04/2029 Port St. Lucie, FL 13 Manhattan, NY Loan 10 Residential 08/2022 112 - 11/2026 Various, US Loan 11 Residential 10/2024 103 - 11/2029 Loan 12 Residential 06/2024 99 - 07/2029 Washington, DC Loan 13 Residential 08/2025 92 13 08/2030 Various, UK Loan 14 Residential 02/2025 89 - Y 02/2030 Miami, FL Loan 15 Residential 05/2021 76 - 05/2027 Cleveland, OH Manhattan, NY Loan 16 Residential 05/2025 64 - Y 05/2030 Miami, FL Loan 17 Residential 02/2025 22 - 02/2027 Subtotal - Residential $2,252 $103 Office (a) London, UK Loan 18 Office 02/2022 656 84 Y 12/2028 (b) Manhattan, NY Loan 19 Office 12/2025 267 79 Y 12/2030 Loan 20 Office 06/2019 241 32 06/2030 Berlin, Germany Loan 21 Office 01/2020 230 23 Y 03/2028 Long Island City, NY Loan 22 Office 02/2020 210 63 Y 03/2028 London, UK Milan, Italy Loan 23 Office 02/2022 174 - 06/2027 Chicago, IL Loan 24 Office 11/2022 100 - 09/2026 Chicago, IL Loan 25 Office 03/2018 73 - Y 09/2027 Subtotal - Office $1,951 $281 a) Loan is secured by an office property which is 100% leased by a credit tenant for a 20-year term 11 b) Modified loan treated as a new origination for accounting purposes See footnotes on page 22
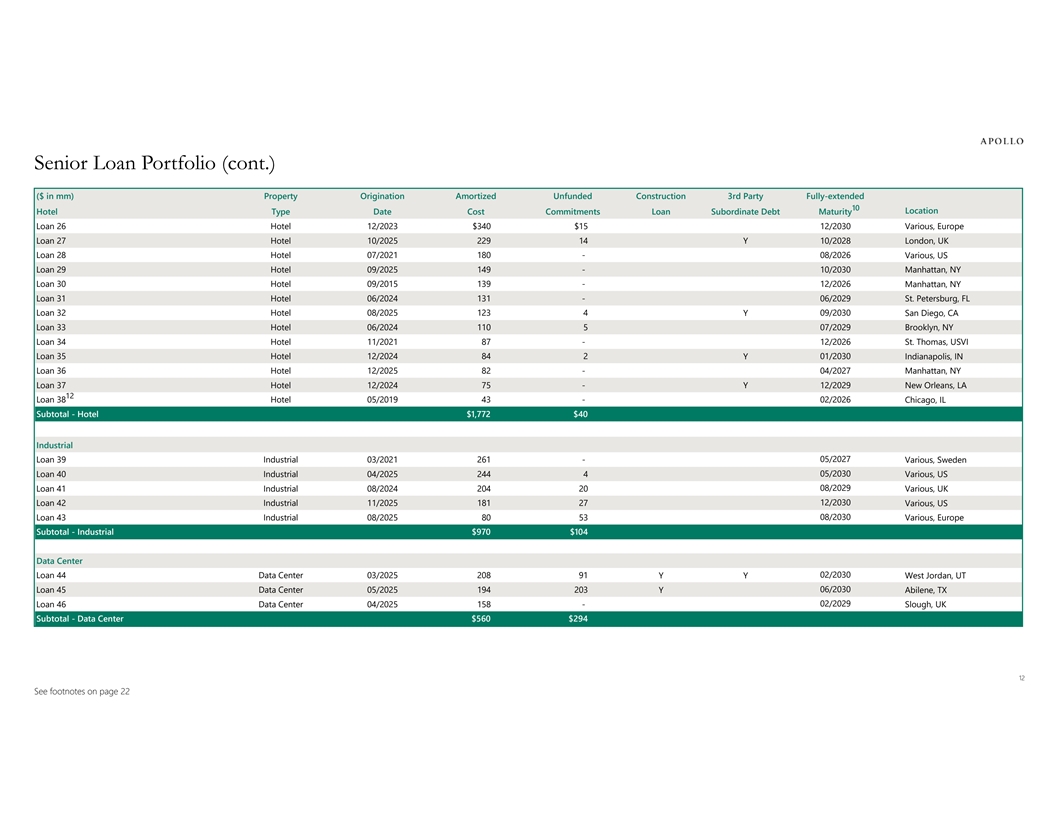
Senior Loan Portfolio (cont.) ($ in mm) Property Origination Amortized Unfunded Construction 3rd Party Fully-extended 10 Location Hotel Type Date Cost Commitments Loan Subordinate Debt Maturity Loan 26 Hotel 12/2023 $340 $15 12/2030 Various, Europe Loan 27 Hotel 10/2025 229 14 Y 10/2028 London, UK Loan 28 Hotel 07/2021 180 - 08/2026 Various, US Loan 29 Hotel 09/2025 149 - 10/2030 Manhattan, NY Loan 30 Hotel 09/2015 139 - 12/2026 Manhattan, NY Loan 31 Hotel 06/2024 131 - 06/2029 St. Petersburg, FL Loan 32 Hotel 08/2025 123 4 Y 09/2030 San Diego, CA Loan 33 Hotel 06/2024 110 5 07/2029 Brooklyn, NY Loan 34 Hotel 11/2021 87 - 12/2026 St. Thomas, USVI Loan 35 Hotel 12/2024 84 2 Y 01/2030 Indianapolis, IN Loan 36 Hotel 12/2025 82 - 04/2027 Manhattan, NY Loan 37 Hotel 12/2024 75 - Y 12/2029 New Orleans, LA 12 Loan 38 Hotel 05/2019 43 - 02/2026 Chicago, IL Subtotal - Hotel $1,772 $40 Industrial Loan 39 Industrial 03/2021 261 - 05/2027 Various, Sweden Loan 40 Industrial 04/2025 244 4 05/2030 Various, US 08/2029 Loan 41 Industrial 08/2024 204 20 Various, UK 12/2030 Loan 42 Industrial 11/2025 181 27 Various, US 08/2030 Loan 43 Industrial 08/2025 80 53 Various, Europe Subtotal - Industrial $970 $104 Data Center 02/2030 Loan 44 Data Center 03/2025 208 91 YY West Jordan, UT 06/2030 Loan 45 Data Center 05/2025 194 203 Y Abilene, TX 02/2029 Loan 46 Data Center 04/2025 158 - Slough, UK Subtotal - Data Center $560 $294 12 See footnotes on page 22
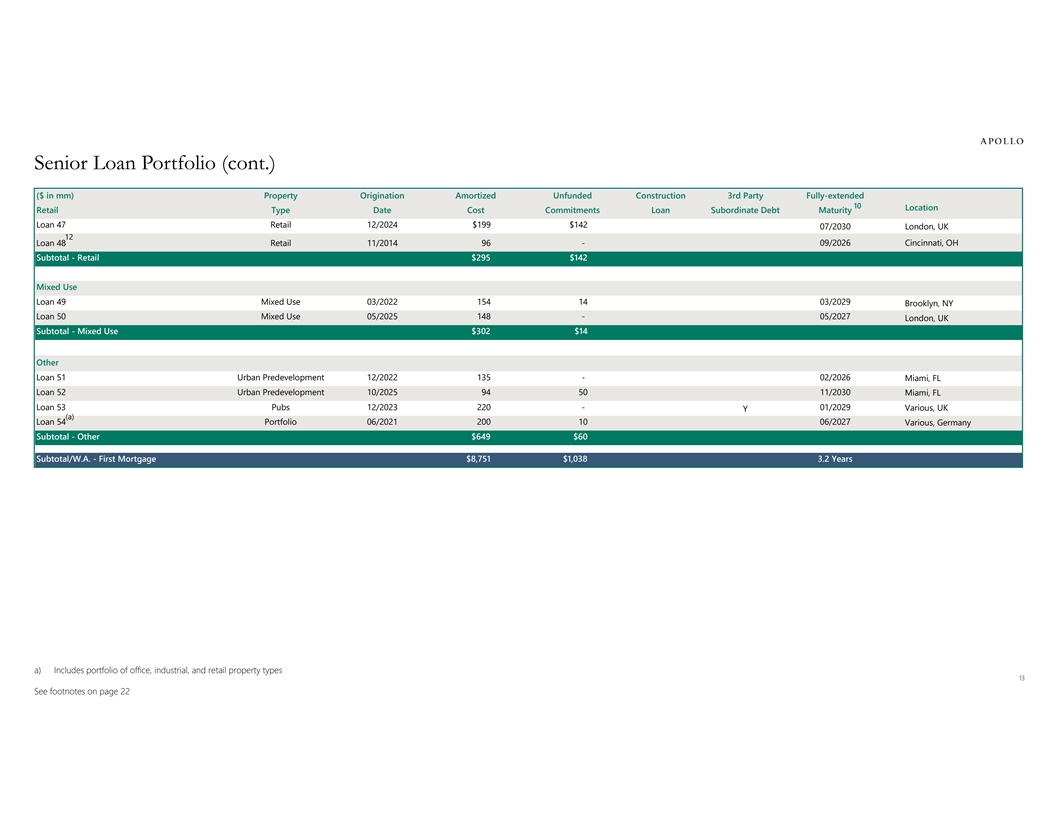
Senior Loan Portfolio (cont.) ($ in mm) Property Origination Amortized Unfunded Construction 3rd Party Fully-extended 10 Location Retail Type Date Cost Commitments Loan Subordinate Debt Maturity Loan 47 Retail 12/2024 $199 $142 07/2030 London, UK 12 Loan 48 Retail 11/2014 96 - 09/2026 Cincinnati, OH Subtotal - Retail $295 $142 Mixed Use Loan 49 Mixed Use 03/2022 154 14 03/2029 Brooklyn, NY Loan 50 Mixed Use 05/2025 148 - 05/2027 London, UK Subtotal - Mixed Use $302 $14 Other Loan 51 Urban Predevelopment 12/2022 135 - 02/2026 Miami, FL Loan 52 Urban Predevelopment 10/2025 94 50 11/2030 Miami, FL Loan 53 Pubs 12/2023 220 - 01/2029 Various, UK Y (a) Loan 54 Portfolio 06/2021 200 10 06/2027 Various, Germany Subtotal - Other $649 $60 Subtotal/W.A. - First Mortgage $8,751 $1,038 3.2 Years a) Includes portfolio of office, industrial, and retail property types 13 See footnotes on page 22
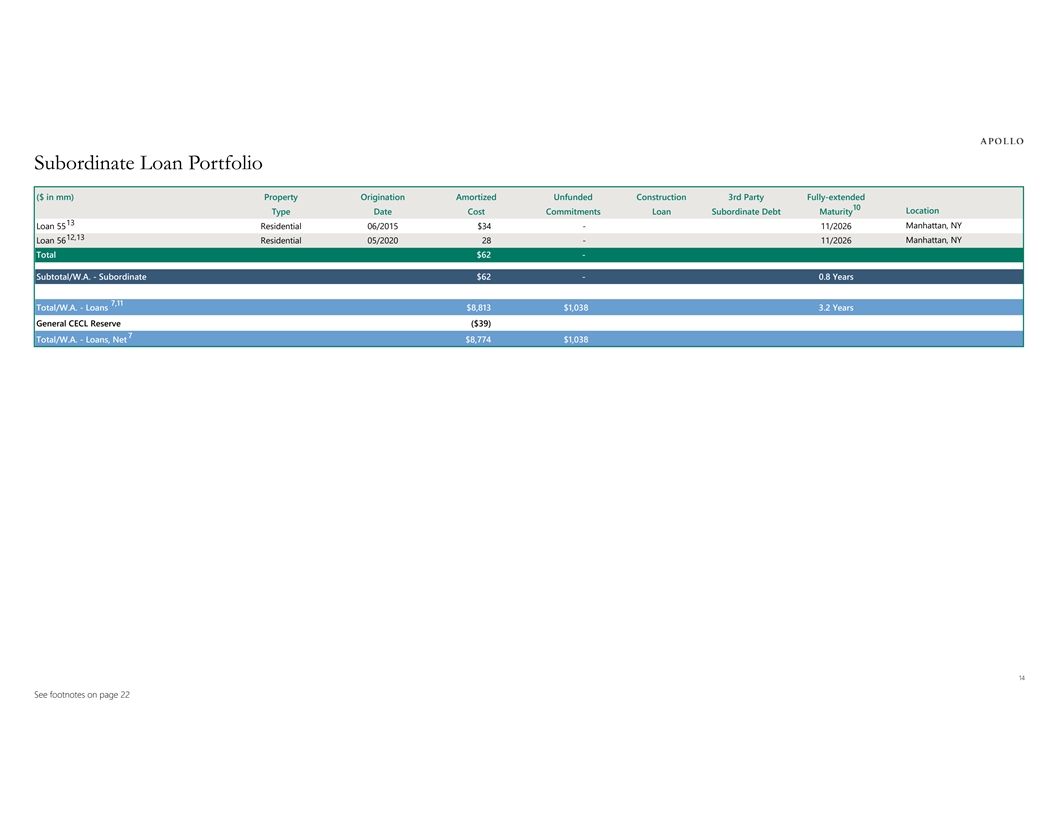
Subordinate Loan Portfolio ($ in mm) Property Origination Amortized Unfunded Construction 3rd Party Fully-extended 10 Location Type Date Cost Commitments Loan Subordinate Debt Maturity 13 Loan 55 Residential 06/2015 $34 - 11/2026 Manhattan, NY 12,13 Manhattan, NY Loan 56 Residential 05/2020 28 - 11/2026 Total $62 - Subtotal/W.A. - Subordinate $62 - 0.8 Years 7,11 Total/W.A. - Loans $8,813 $1,038 3.2 Years General CECL Reserve ($39) 7 Total/W.A. - Loans, Net $8,774 $1,038 14 See footnotes on page 22
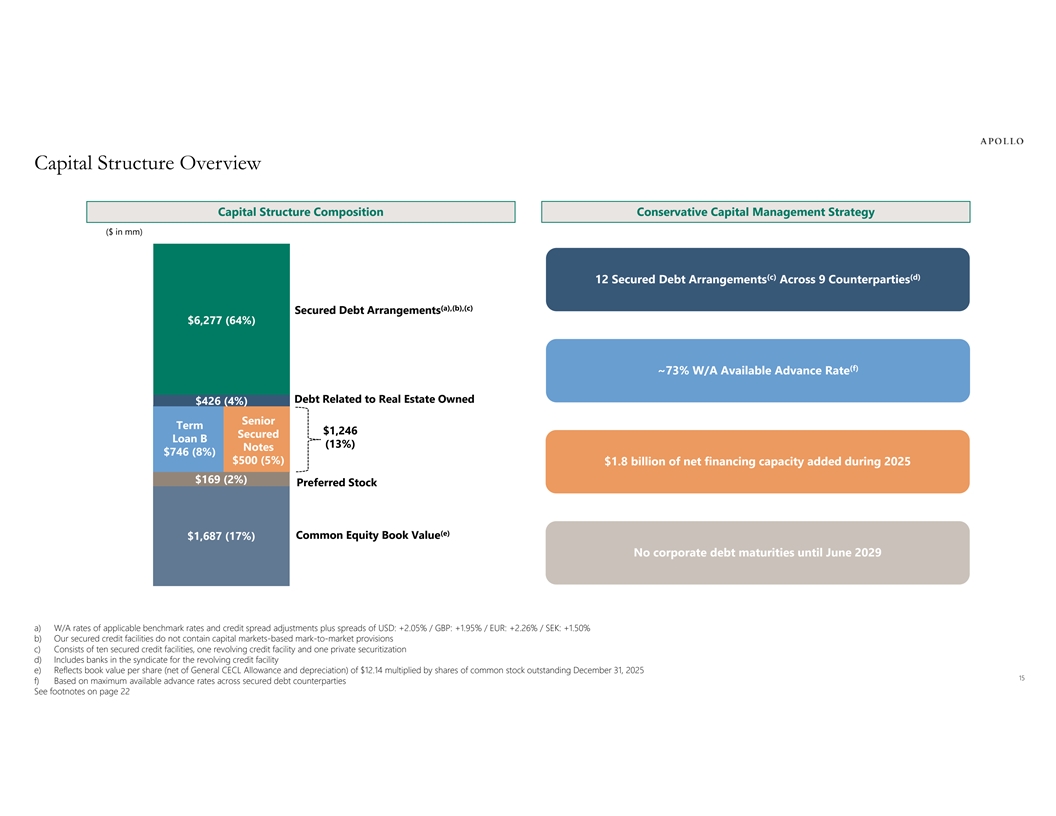
Capital Structure Overview Capital Structure Composition Conservative Capital Management Strategy ($ in mm) (c) (d) 12 Secured Debt Arrangements Across 9 Counterparties (a),(b),(c) Secured Debt Arrangements $6,277 (64%) (f) ~73% W/A Available Advance Rate Debt Related to Real Estate Owned $426 (4%) Senior Term $1,246 Secured Loan B (13%) Notes $746 (8%) $500 (5%) $1.8 billion of net financing capacity added during 2025 $169 (2%) Preferred Stock (e) Common Equity Book Value $1,687 (17%) No corporate debt maturities until June 2029 a) W/A rates of applicable benchmark rates and credit spread adjustments plus spreads of USD: +2.05% / GBP: +1.95% / EUR: +2.26% / SEK: +1.50% b) Our secured credit facilities do not contain capital markets-based mark-to-market provisions c) Consists of ten secured credit facilities, one revolving credit facility and one private securitization d) Includes banks in the syndicate for the revolving credit facility e) Reflects book value per share (net of General CECL Allowance and depreciation) of $12.14 multiplied by shares of common stock outstanding December 31, 2025 15 f) Based on maximum available advance rates across secured debt counterparties See footnotes on page 22
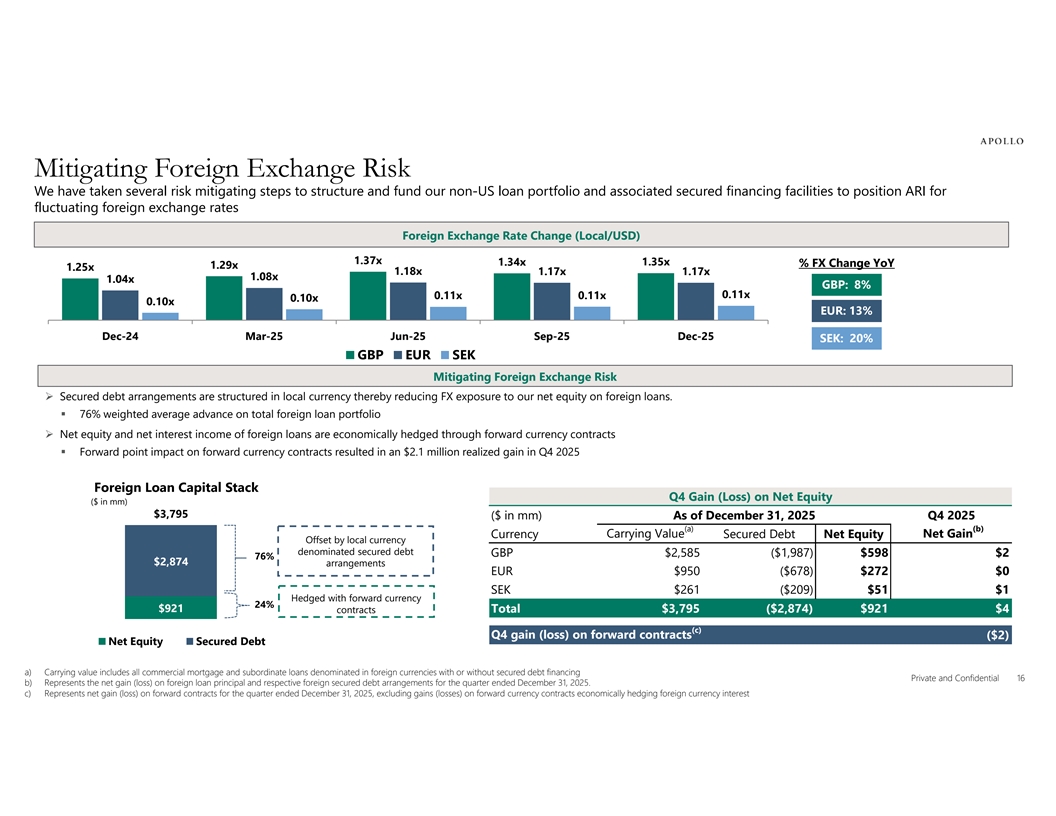
Mitigating Foreign Exchange Risk We have taken several risk mitigating steps to structure and fund our non-US loan portfolio and associated secured financing facilities to position ARI for fluctuating foreign exchange rates Foreign Exchange Rate Change (Local/USD) 1.37x 1.34x 1.35x % FX Change YoY 1.29x 1.25x 1.18x 1.17x 1.17x 1.08x 1.04x GBP: 8% 0.11x 0.11x 0.11x 0.10x 0.10x EUR: 13% Dec-24 Mar-25 Jun-25 Sep-25 Dec-25 SEK: 20% GBP EUR SEK Mitigating Foreign Exchange Risk Ø Secured debt arrangements are structured in local currency thereby reducing FX exposure to our net equity on foreign loans. § 76% weighted average advance on total foreign loan portfolio Ø Net equity and net interest income of foreign loans are economically hedged through forward currency contracts § Forward point impact on forward currency contracts resulted in an $2.1 million realized gain in Q4 2025 Foreign Loan Capital Stack Q4 Gain (Loss) on Net Equity ($ in mm) $3,795 ($ in mm) As of December 31, 2025 Q4 2025 (a) (b) Carrying Value Net Gain Currency Secured Debt Net Equity Offset by local currency denominated secured debt GBP $2,585 ($1,987) $598 $2 76% $2,874 arrangements EUR $950 ($678) $272 $0 SEK $261 ($209) $51 $1 Hedged with forward currency 24% $921 contracts Total $3,795 ($2,874) $921 $4 (c) Q4 gain (loss) on forward contracts ($2) Net Equity Secured Debt a) Carrying value includes all commercial mortgage and subordinate loans denominated in foreign currencies with or without secured debt financing Private and Confidential 16 b) Represents the net gain (loss) on foreign loan principal and respective foreign secured debt arrangements for the quarter ended December 31, 2025. c) Represents net gain (loss) on forward contracts for the quarter ended December 31, 2025, excluding gains (losses) on forward currency contracts economically hedging foreign currency interest
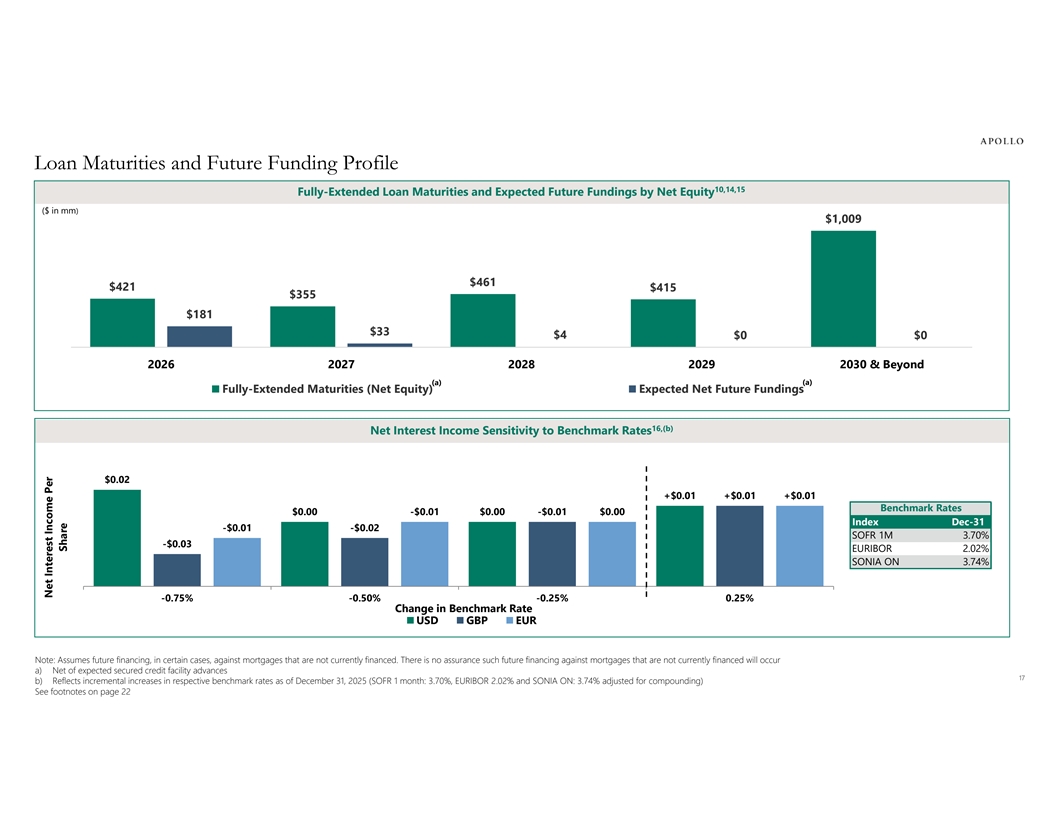
Loan Maturities and Future Funding Profile 10,14,15 Fully-Extended Loan Maturities and Expected Future Fundings by Net Equity ($ in mm) $1,009 $461 $421 $415 $355 $181 $33 $4 $0 $0 2026 2027 2028 2029 2030 & Beyond (a) (a) Fully-Extended Maturities (Net Equity) Expected Net Future Fundings 16,(b) Net Interest Income Sensitivity to Benchmark Rates $0.02 +$0.01 +$0.01 +$0.01 Benchmark Rates $0.00 $0. -$0.0100 -$0.01 $0.00 Index Dec-31 -$0.01 -$0.02 SOFR 1M 3.70% -$0.03 EURIBOR 2.02% SONIA ON 3.74% -0.75% -0.50% -0.25% 0.25% Change in Benchmark Rate USD GBP EUR Note: Assumes future financing, in certain cases, against mortgages that are not currently financed. There is no assurance such future financing against mortgages that are not currently financed will occur a) Net of expected secured credit facility advances 17 b) Reflects incremental increases in respective benchmark rates as of December 31, 2025 (SOFR 1 month: 3.70%, EURIBOR 2.02% and SONIA ON: 3.74% adjusted for compounding) See footnotes on page 22 Net Interest Income Per Share
Appendix Consolidated Balance Sheets Consolidated Statement of Operations Reconciliation of GAAP Net Income to Distributable Earnings 18
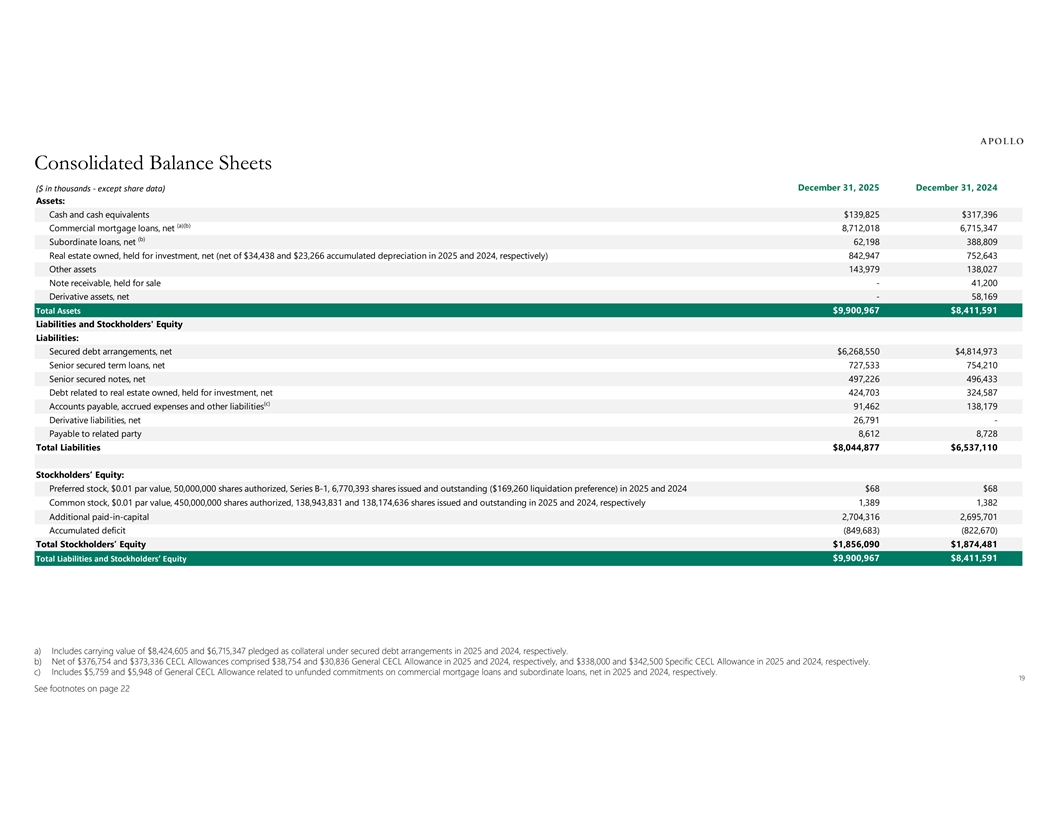
Consolidated Balance Sheets December 31, 2025 December 31, 2024 ($ in thousands - except share data) Assets: Cash and cash equivalents $139,825 $317,396 (a)(b) Commercial mortgage loans, net 8,712,018 6,715,347 (b) Subordinate loans, net 62,198 388,809 Real estate owned, held for investment, net (net of $34,438 and $23,266 accumulated depreciation in 2025 and 2024, respectively) 842,947 752,643 Other assets 143,979 138,027 Note receivable, held for sale - 41,200 Derivative assets, net - 58,169 $9,900,967 $8,411,591 Total Assets Liabilities and Stockholders' Equity Liabilities: Secured debt arrangements, net $6,268,550 $4,814,973 Senior secured term loans, net 727,533 754,210 Senior secured notes, net 497,226 496,433 Debt related to real estate owned, held for investment, net 424,703 324,587 (c) Accounts payable, accrued expenses and other liabilities 91,462 138,179 Derivative liabilities, net 26,791 - Payable to related party 8,612 8,728 Total Liabilities $8,044,877 $6,537,110 Stockholders’ Equity: Preferred stock, $0.01 par value, 50,000,000 shares authorized, Series B-1, 6,770,393 shares issued and outstanding ($169,260 liquidation preference) in 2025 and 2024 $68 $68 Common stock, $0.01 par value, 450,000,000 shares authorized, 138,943,831 and 138,174,636 shares issued and outstanding in 2025 and 2024, respectively 1,389 1,382 Additional paid-in-capital 2,704,316 2,695,701 Accumulated deficit (849,683) (822,670) Total Stockholders’ Equity $1,856,090 $1,874,481 Total Liabilities and Stockholders’ Equity $9,900,967 $8,411,591 a) Includes carrying value of $8,424,605 and $6,715,347 pledged as collateral under secured debt arrangements in 2025 and 2024, respectively. b) Net of $376,754 and $373,336 CECL Allowances comprised $38,754 and $30,836 General CECL Allowance in 2025 and 2024, respectively, and $338,000 and $342,500 Specific CECL Allowance in 2025 and 2024, respectively. c) Includes $5,759 and $5,948 of General CECL Allowance related to unfunded commitments on commercial mortgage loans and subordinate loans, net in 2025 and 2024, respectively. 19 See footnotes on page 22
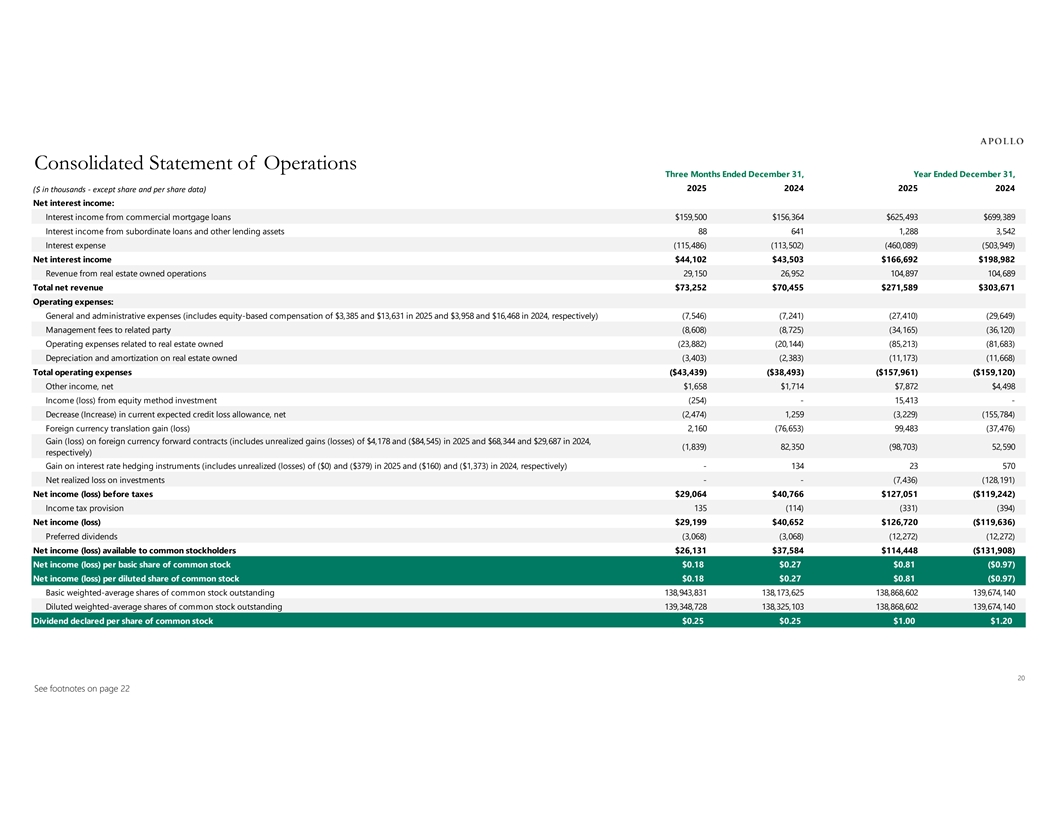
Consolidated Statement of Operations Three Months Ended December 31, Year Ended December 31, ($ in thousands - except share and per share data) 2025 2024 2025 2024 Net interest income: Interest income from commercial mortgage loans $159,500 $156,364 $625,493 $699,389 Interest income from subordinate loans and other lending assets 88 641 1,288 3,542 Interest expense (115,486) (113,502) (460,089) (503,949) Net interest income $44,102 $43,503 $166,692 $198,982 Revenue from real estate owned operations 29,150 26,952 104,897 104,689 Total net revenue $73,252 $70,455 $271,589 $303,671 Operating expenses: General and administrative expenses (includes equity-based compensation of $3,385 and $13,631 in 2025 and $3,958 and $16,468 in 2024, respectively) (7,546) (7,241) (27,410) (29,649) Management fees to related party (8,608) (8,725) (34,165) (36,120) Operating expenses related to real estate owned (23,882) (20,144) (85,213) (81,683) Depreciation and amortization on real estate owned (3,403) (2,383) (11,173) (11,668) Total operating expenses ($43,439) ($38,493) ($157,961) ($159,120) Other income, net $1,658 $1,714 $7,872 $4,498 Income (loss) from equity method investment (254) - 15,413 - Decrease (Increase) in current expected credit loss allowance, net (2,474) 1,259 (3,229) (155,784) Foreign currency translation gain (loss) 2,160 (76,653) 99,483 (37,476) Gain (loss) on foreign currency forward contracts (includes unrealized gains (losses) of $4,178 and ($84,545) in 2025 and $68,344 and $29,687 in 2024, (1,839) 82,350 (98,703) 52,590 respectively) Gain on interest rate hedging instruments (includes unrealized (losses) of ($0) and ($379) in 2025 and ($160) and ($1,373) in 2024, respectively) - 134 23 570 Net realized loss on investments - - (7,436) (128,191) Net income (loss) before taxes $29,064 $40,766 $127,051 ($119,242) Income tax provision 135 (114) (331) (394) Net income (loss) $29,199 $40,652 $126,720 ($119,636) Preferred dividends (3,068) (3,068) (12,272) (12,272) Net income (loss) available to common stockholders $26,131 $37,584 $114,448 ($131,908) Net income (loss) per basic share of common stock $0.18 $0.27 $0.81 ($0.97) Net income (loss) per diluted share of common stock $0.18 $0.27 $0.81 ($0.97) Basic weighted-average shares of common stock outstanding 138,943,831 138,173,625 138,868,602 139,674,140 Diluted weighted-average shares of common stock outstanding 139,348,728 138,325,103 138,868,602 139,674,140 Dividend declared per share of common stock $0.25 $0.25 $1.00 $1.20 20 See footnotes on page 22
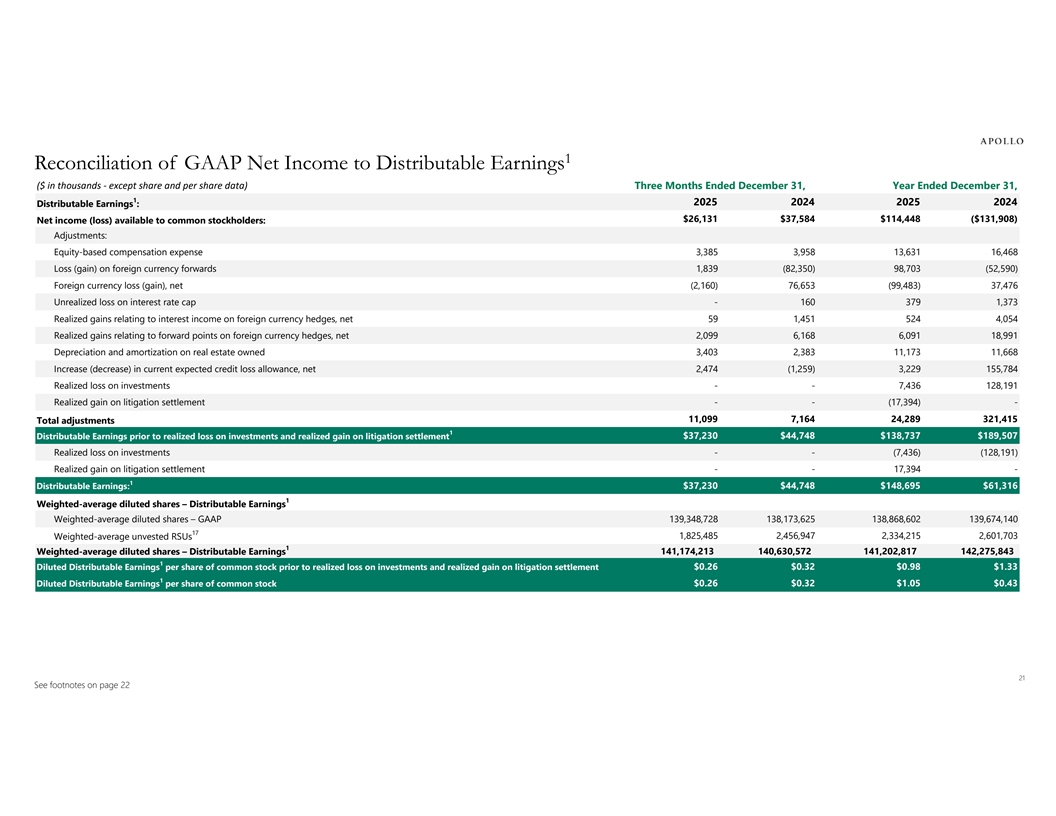
1 Reconciliation of GAAP Net Income to Distributable Earnings ($ in thousands - except share and per share data) Three Months Ended December 31, Year Ended December 31, 1 2025 2024 2025 2024 Distributable Earnings : $26,131 $37,584 $114,448 ($131,908) Net income (loss) available to common stockholders: Adjustments: Equity-based compensation expense 3,385 3,958 13,631 16,468 Loss (gain) on foreign currency forwards 1,839 (82,350) 98,703 (52,590) Foreign currency loss (gain), net (2,160) 76,653 (99,483) 37,476 Unrealized loss on interest rate cap - 160 379 1,373 Realized gains relating to interest income on foreign currency hedges, net 59 1,451 524 4,054 Realized gains relating to forward points on foreign currency hedges, net 2,099 6,168 6,091 18,991 Depreciation and amortization on real estate owned 3,403 2,383 11,173 11,668 Increase (decrease) in current expected credit loss allowance, net 2,474 (1,259) 3,229 155,784 Realized loss on investments - - 7,436 128,191 Realized gain on litigation settlement - - (17,394) - 11,099 7,164 24,289 321,415 Total adjustments 1 $37,230 $44,748 $138,737 $189,507 Distributable Earnings prior to realized loss on investments and realized gain on litigation settlement Realized loss on investments - - (7,436) (128,191) Realized gain on litigation settlement - - 17,394 - 1 Distributable Earnings: $37,230 $44,748 $148,695 $61,316 1 Weighted-average diluted shares – Distributable Earnings Weighted-average diluted shares – GAAP 139,348,728 138,173,625 138,868,602 139,674,140 17 1,825,485 2,456,947 2,334,215 2,601,703 Weighted-average unvested RSUs 1 Weighted-average diluted shares – Distributable Earnings 141,174,213 140,630,572 141,202,817 142,275,843 1 $0.26 $0.32 $0.98 $1.33 Diluted Distributable Earnings per share of common stock prior to realized loss on investments and realized gain on litigation settlement 1 Diluted Distributable Earnings per share of common stock $0.26 $0.32 $1.05 $0.43 21 See footnotes on page 22
Footnotes 1. Distributable Earnings: Distributable Earnings is a non-GAAP financial measure that we define as net income available to common stockholders, computed in accordance with GAAP, adjusted for (i) equity-based compensation expense (a portion of which may become cash-based upon final vesting and settlement of awards should the holder elect net share settlement to satisfy income tax withholding), (ii) any unrealized gains or losses or other non-cash items (including depreciation and amortization on real estate owned) included in net income available to common stockholders, (iii) unrealized income from unconsolidated joint ventures, (iv) foreign currency gains (losses), other than (a) realized gains/(losses) related to interest income, and (b) forward point gains/(losses) realized on our foreign currency hedges, and (v) provision for current expected credit losses. Please see page 21 for a reconciliation of GAAP net income to Distributable Earnings. Distributable Earnings Prior to Realized Loss on Investments and Realized Gain from Litigation Settlement: We believe it is useful to our investors to present Distributable Earnings prior to realized loss on investments and realized gain from litigation settlement to reflect our operating results because (i) our operating results are primarily comprised of earning interest income on our investments net of borrowing and administrative costs, which comprise our ongoing operations and (ii) it has been a useful factor related to our dividend per share because it is one of the considerations when a dividend is determined. We believe that our investors use Distributable Earnings and Distributable Earnings prior to realized loss on investments and realized gain from litigation settlement, or a comparable supplemental performance measure, to evaluate and compare the performance of our company and our peers. 2. Reflects closing share price on February 9, 2026. 3. Weighted Average Unlevered All-in Yield on the loan portfolio is based on the applicable benchmark rates as of period end on the floating rate loans and includes accrual of origination, extension, and exit fees. For non-US deals, yield excludes incremental forward points impact from currency hedging. 4. Includes a $41 million held-for-sale corporate note. The note was sold during the third quarter of 2025. 5. Add-on fundings represent fundings subsequent to loan closing. 6. Book value per share, or “BVPS”, of common stock is common stockholders’ equity divided by shares of common stock outstanding. 7. Amounts and percentages may not foot due to rounding. 8. Other includes changes in General CECL Allowance, cost recovery interest, realized loss on investments, PIK interest, and the accretion of loan costs and fees. 9. Based on loan amortized cost, net of Specific CECL Allowance. 10. Assumes exercise of all extension options. There is no assurance that all or any extension options will be exercised. 11. Gross of $39 million of General CECL Allowance. 12. Amortized cost for these loans is net of the recorded Specific CECL Allowances. 13. Loans are secured by the same property. 14. Future funding dates and amounts are based upon the Manager’s estimates, which are derived from the best information available to the Manager at the time. There is no assurance that the payments will occur in accordance with these estimates or at all, which could affect our operating results. 15. Excludes risk-rated 5 loans. 16. Any such hypothetical impact on interest rates on our variable rate borrowings does not consider the effect of any change in overall economic activity that could occur in a rising interest rate environment. Further, in the event of a change in interest rates of that magnitude, we may take actions to further mitigate our exposure to such a change. However, due to the uncertainty of the specific actions that would be taken and their possible effects, this analysis assumes no changes in our financial structure. There is no assurance that there will be no changes in our financial structure. The analysis incorporates movements in USD, GBP and EUR benchmark rates only. 17. Unvested RSUs are net of incremental shares assumed repurchased under the treasury stock method, if dilutive. There were no incremental shares included in the years ended December 31, 2025 and 2024. 22