HYATT REPORTS FOURTH QUARTER AND FULL YEAR 2025 RESULTS
CHICAGO (February 12, 2026) - Hyatt Hotels Corporation ("Hyatt," "the Company," "we," "us," or "our") (NYSE: H) today reported fourth quarter and full year 2025 results. Highlights include:
•Comparable system-wide hotels RevPAR growth was 4.0% in the fourth quarter and 2.9% for the full year of 2025, compared to the same periods in 2024
•Comparable system-wide all-inclusive resorts Net Package RevPAR growth was 8.3% in the fourth quarter and 8.6% for the full year of 2025, compared to the same periods in 2024
•Net rooms growth was 7.3% for the full year of 2025 and net rooms growth excluding acquisitions was 6.7%
•Pipeline of executed management and franchise contracts was approximately 148,000 rooms, up 7% compared to 2024
•Net income (loss) attributable to Hyatt Hotels Corporation was $(20) million in the fourth quarter and $(52) million for the full year of 2025. Adjusted Net Income was $126 million in the fourth quarter and $209 million for the full year of 2025
•Diluted EPS was $(0.21) in the fourth quarter and $(0.55) for the full year of 2025. Adjusted Diluted EPS was $1.33 in the fourth quarter and $2.19 for the full year of 2025
•Gross fees were $307 million in the fourth quarter, an increase of 4.5% compared to the fourth quarter of 2024, and $1,198 million for the full year of 2025, an increase of 9.0% compared to the full year of 2024
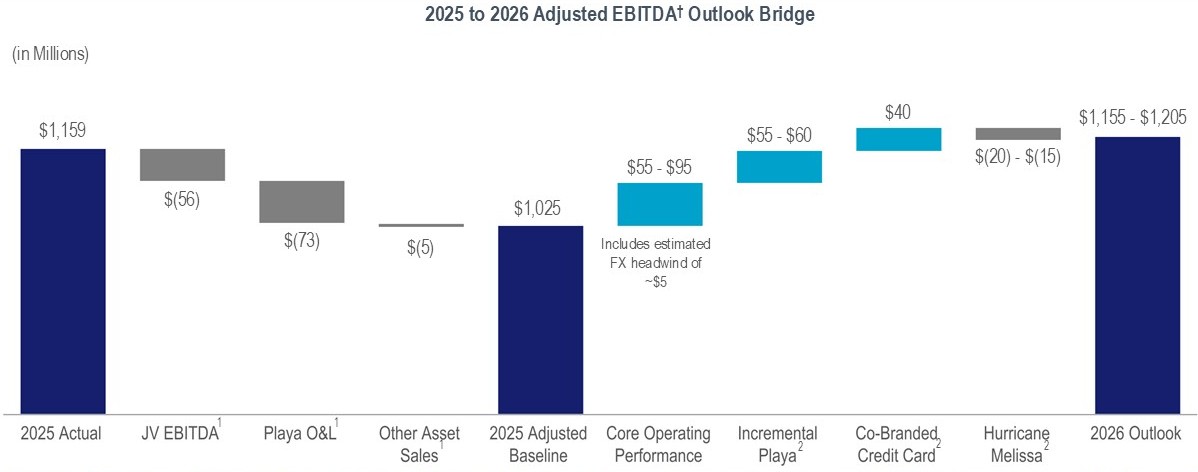
•Adjusted EBITDA was $292 million in the fourth quarter, an increase of 14.6% compared to the fourth quarter of 2024, or an increase of 3.8% after adjusting for assets sold in 2024 and the Playa Hotels Acquisition. Full year 2025 Adjusted EBITDA was $1,159 million, an increase of 5.8% compared to the full year of 2024, or an increase of 7.4% after adjusting for assets sold in 2024 and the Playa Hotels Acquisition
•During the first quarter of 2026, the Company adjusted its definition of Adjusted EBITDA and will no longer include Hyatt's pro rata share of unconsolidated owned and leased hospitality ventures' Adjusted EBITDA
Mark S. Hoplamazian, President and Chief Executive Officer of Hyatt, said, "We ended 2025 with great momentum, marked by strong execution against our strategic priorities and continued progress toward becoming a more brand-focused organization. We achieved exceptional commercial and operating performance in 2025 and expanded our portfolio and network effect through disciplined transactions and strong organic growth."
Mark continued, "As we look to the future, we are focused on accelerating this momentum by further advancing the evolution of our brands, our talent, and our use of technology. Together, we believe these priorities will position Hyatt to become the most responsive, most innovative, and best-performing hospitality company—and ultimately, the most chosen by our stakeholders."
Refer to the table on schedule A-10 for a summary of special items impacting Adjusted Net Income (Loss) and Adjusted Diluted EPS in the three months and years ended December 31, 2025 and December 31, 2024.
Note: All RevPAR growth and ADR growth percentage changes are in constant dollars. All Net Package RevPAR growth and Net Package ADR growth percentage changes are in reported dollars. This release includes references to non-GAAP financial measures. Refer to the non-GAAP reconciliations included in the schedules and the definitions of the non-GAAP measures presented beginning on schedule A-6.
Fourth Quarter Operational Commentary
•RevPAR growth in the fourth quarter was highest among Luxury and Upper Upscale chain scales. Leisure transient continued to be the strongest customer segment, while group also had a strong quarter, helped by the timing of the Rosh Hashanah holiday, which occurred in the third quarter of 2025 compared to the fourth quarter of 2024.
•Net Package RevPAR increased 8.3% in the fourth quarter compared to the same period in 2024, reflecting continued strength in luxury all-inclusive travel.
•Gross fees increased 4.5% in the fourth quarter compared to the same period in 2024, or 5.4% excluding the impact of the Playa Hotels Acquisition.
◦Base management fees: increased 8.1% from the contribution of newly-opened hotels and managed hotel RevPAR growth outside of the United States.
◦Incentive management fees: increased 13.0% led by newly-opened hotels, hotel performance in Asia Pacific, and all-inclusive hotel performance in Europe.
◦Franchise and other fees: decreased 3.8% due to the elimination of franchise fees from the 8 Hyatt Ziva and Hyatt Zilara properties that were part of the Playa Hotels Acquisition and lower demand at select service properties in the United States partially offset by fees from newly opened hotels.
•Owned and leased segment Adjusted EBITDA declined 1.5% in the fourth quarter compared to the fourth quarter of 2024 after adjusting for assets sold in 2024 and the period of ownership of the hotels acquired as part of the Playa Hotels Acquisition due to renovations at certain properties.
•Distribution segment Adjusted EBITDA declined in the fourth compared to the fourth quarter of 2024 due to the impact of Hurricane Melissa and lower booking volumes in four-star and below properties.
Openings and Development
•During the fourth quarter, the Company opened 8,253 rooms, including Park Hyatt Cabo del Sol, marking Hyatt’s first Park Hyatt hotel in Mexico; Andaz One Bangkok, which opened as part of the One Bangkok mixed-use development; and Hyatt Studios Huntsville, reflecting continued expansion of Hyatt's newest extended-stay brand in the United States.
•In 2025, the Company had pipeline growth of 7% compared to 2024. 2025 signings in the United States were up approximately 30% over 2024, including more than 25 Hyatt Select deals signed during the year, and the pipeline of Hyatt Studios properties grew to approximately 70 since announcing the brand in 2023. The pipeline in Asia Pacific increased by 7% compared to 2024, with strong signings activity in Greater China and India, replenishing the pipeline after a strong year of openings.
Transactions
During the fourth quarter, the Company:
•Closed on the sale of Alua Atlántico Golf Resort, Alua Tenerife, and AluaSoul Orotava Valley (the "Alua Portfolio") for a gross purchase price of approximately $140 million and entered into long-term management agreements for each property. Net proceeds were used to repay a portion of the $1.7 billion delayed draw term loan used to finance a portion of the Playa Hotels Acquisition.
•Completed the Playa Real Estate Transaction and used the proceeds to repay the amounts outstanding under the $1.7 billion delayed draw term loan, which was terminated upon repayment. The Company entered into 50-year management agreements for 13 of the 14 properties. The Playa Real Estate Transaction fulfilled Hyatt's commitment announced on February 10, 2025 to sell at least $2 billion of real estate.
Balance Sheet and Liquidity
As of December 31, 2025, the Company reported the following:
•Total debt of $4.3 billion.
•Total liquidity of $2.3 billion, inclusive of:
◦$813 million of cash and cash equivalents, and short-term investments, and
◦$1,497 million of borrowing capacity under Hyatt's revolving credit facility, net of letters of credit outstanding.
•Total remaining share repurchase authorization of $678 million. The Company repurchased $114 million of Class A common stock during the fourth quarter and repurchased a total of $293 million of Class A common stock for the full year of 2025.
•The Company's board of directors has declared a cash dividend of $0.15 per share for the first quarter of 2026. The dividend is payable on March 12, 2026 to Class A and Class B stockholders of record as of March 2, 2026.
2
2026 Outlook
The Company is providing the following outlook for the 2026 fiscal year. Refer to slides 18 and 19 of the fourth quarter 2025 supplemental investor presentation for further details on Gross Fees and Adjusted EBITDA outlook.
During the first quarter of 2026, the Company adjusted its definition of Adjusted EBITDA and will no longer include Hyatt's pro rata share of unconsolidated owned and leased hospitality ventures' Adjusted EBITDA.
2026 Full Year Outlook
2026 Outlook
2025
Change vs. 2025
System-Wide Hotels RevPAR Growth
1.0% to 3.0%
Net Rooms Growth
6.0% to 7.0%
(in millions)
Net income (loss) attributable to Hyatt Hotels Corporation
$235 - $320
$(52)
552% to 715%
Gross Fees
$1,295 - $1,335
$1,198
8% to 11%
Adjusted G&A Expenses1
$440 - $450
$445
(1)% to 1%
Adjusted EBITDA1
$1,155 - $1,205
$1,0252
13% to 18%2
Capital Expenditures
Approx. $135
$220
Approx. (39)%
Adjusted Free Cash Flow1
$580 - $630
$474
22% to 33%
Capital Returns to Shareholders3
$325 - $375
1 Refer to the tables on schedule A-14 for a reconciliation of estimated net income (loss) attributable to Hyatt Hotels Corporation to Adjusted EBITDA, G&A expenses to Adjusted G&A Expenses, and net cash provided by operating activities to Free Cash Flow and Adjusted Free Cash Flow.
2 Reflects a reduction of $78 million on to 2025 owned and leased segment Adjusted EBITDA to account for period of ownership of the Playa hotels and the impact of sold hotels and $56 million of pro rata share of unconsolidated owned and leased hospitality ventures' Adjusted EBITDA to reflect the updated definition of Adjusted EBITDA. Refer to schedule A-11 for further details.
3 The Company expects to return capital to shareholders through a combination of cash dividends on its common stock and share repurchases.
No disposition or acquisition activity beyond what has been completed as of the date of this release has been included in the 2026 outlook. The Company's 2026 outlook is based on a number of assumptions that are subject to change and many of which are outside the control of the Company. If actual results vary from these assumptions, the Company's expectations may change. There can be no assurance that Hyatt will achieve these results.
1Adjustments to 2025: JV EBITDA reflects the Company's updated definition of Adjusted EBITDA effective in the first quarter of 2026. Refer to schedule A-6 for 2025 actuals; Playa O&L reflects the period of ownership of the hotels acquired as part of the Playa Hotels Acquisition and sold on December 30, 2025. Other Asset Sales reflects Adjusted EBITDA earned in 2025 for assets that have been sold. Refer to schedule A-11 for further details on Playa O&L and Other Asset Sales
2Adjustments to 2026 outlook: Incremental Playa reflects the incremental Adjusted EBITDA expected from the Playa Hotels Acquisition. These expectations were shared as part of the supplemental presentation published June 30, 2025; Co-Branded Credit Card reflects the impact of the expanded agreement with Chase to the co-branded credit card programs that was announced on November 5, 2025; Hurricane Melissa reflects the temporary closure of hotels in Jamaica due to the hurricane in October 2025 and includes both Playa and non-Playa hotels.
The Company's 2026 outlook is based on a number of assumptions that are subject to change and many of which are outside the control of the Company. If actual results vary from these assumptions, the Company's expectations may change. There can be no assurance that Hyatt will achieve these results.
3
Conference Call Information
The Company will hold an investor conference call this morning, February 12, 2026, at 9:00 a.m. CT.
Participants may listen to a simultaneous webcast of the conference call, which may be accessed through the Company's website at investors.hyatt.com. Alternatively, participants may access the live call by dialing: 800.715.9871 (U.S. Toll-Free) or 646.307.1963 (International Toll Number) using conference ID# 2303828 approximately 15 minutes prior to the scheduled start time.
A replay of the call will be available Thursday, February 12, 2026 at 12:00 p.m. CT until Thursday, February 19, 2026 at 11:59 p.m. CT by dialing: 800.770.2030 (U.S. Toll-Free) or 647.362.9199 (International Toll Number) using conference ID# 2303828. An archive of the webcast will be available on the Company's website for 90 days.
Forward-Looking Statements in this press release, which are not historical facts, are forward-looking statements within the meaning of the Private Securities Litigation Reform Act of 1995. These statements include statements about the Company's plans, strategies, outlook, the number of properties we expect to open in the future, the expected timing and payment of dividends, the Company's 2026 outlook, including the Company's expected System-wide Hotels RevPAR Growth, Net Rooms Growth, Net Income, Gross Fees, Adjusted G&A Expenses, Adjusted EBITDA, Capital Expenditures, and Adjusted Free Cash Flow, expected capital returns to shareholders, financial performance, prospective or future events and involve known and unknown risks that are difficult to predict. As a result, the Company's actual results, performance or achievements may differ materially from those expressed or implied by these forward-looking statements. In some cases, you can identify forward-looking statements by the use of words such as "may," "could," "expect," "intend," "plan," "seek," "anticipate," "believe," "estimate," "predict," "potential," "continue," "likely," "will," "would" and variations of these terms and similar expressions, or the negative of these terms or similar expressions. Such forward-looking statements are necessarily based upon estimates and assumptions that, while considered reasonable by the Company and the Company's management, are inherently uncertain. Factors that may cause actual results to differ materially from current expectations include, but are not limited to: general economic uncertainty in key global markets and a worsening of global economic conditions or low levels of economic growth; the rate and pace of economic recovery following economic downturns; global supply chain constraints and interruptions, rising costs of construction-related labor and materials, and increases in costs due to inflation or other factors that may not be fully offset by increases in revenues in our business; risks affecting the luxury, resort, and all-inclusive lodging segments; levels of spending in business, leisure, and group segments, as well as consumer confidence; declines in occupancy and average daily rate; limited visibility with respect to future bookings; loss of key personnel; domestic and international political and geopolitical conditions, including political or civil unrest or changes in trade policy; the impact of global tariff policies or regulations; hostilities, or fear of hostilities, including future terrorist attacks, that affect travel; travel-related accidents; natural or man-made disasters, weather and climate-related events, such as hurricanes, earthquakes, tsunamis, tornadoes, droughts, floods, wildfires, oil spills, nuclear incidents, and global outbreaks of pandemics or contagious diseases, or fear of such outbreaks; our ability to successfully achieve specified levels of operating profits at hotels that have performance tests or guarantees in favor of our third-party owners; the impact of hotel renovations and redevelopments; risks associated with our capital allocation plans, share repurchase program, and dividend payments, including a reduction in, or elimination or suspension of, repurchase activity or dividend payments; the seasonal and cyclical nature of the real estate and hospitality businesses; changes in distribution arrangements, such as through internet travel intermediaries; changes in the tastes and preferences of our customers; relationships with colleagues and labor unions and changes in labor laws; the financial condition of, and our relationships with, third-party owners, franchisees, and hospitality venture partners; the possible inability of third-party owners, franchisees, or development partners to access the capital necessary to fund current operations or implement our plans for growth; risks associated with potential acquisitions and dispositions and our ability to successfully integrate completed acquisitions with existing operations or realize anticipated synergies; failure to successfully complete proposed transactions, including the failure to satisfy closing conditions or obtain required approvals; our ability to successfully complete dispositions of certain of our owned real estate assets within targeted timeframes and at expected values; our ability to maintain effective internal control over financial reporting and disclosure controls and procedures; declines in the value of our real estate assets; unforeseen terminations of our management and hotel services agreements or franchise agreements; changes in federal, state, local, or foreign tax law; increases in interest rates, wages, and other operating costs; foreign exchange rate fluctuations or currency restructurings; risks associated with the introduction of new brand concepts, including lack of acceptance of new brands or innovation; general volatility of the capital markets and our ability to access such markets; changes in the competitive environment in our industry, industry consolidation, and the markets where we operate; our ability to successfully grow the World of Hyatt loyalty program and manage the Unlimited Vacation Club paid membership program; cyber incidents and information technology failures; outcomes of legal or administrative proceedings; and violations of regulations or laws related to our franchising business and licensing businesses and our international operations; and other risks discussed in the Company's filings with the SEC, including our annual reports on Form 10-K and quarterly reports on Form 10-Q, which filings are available from the SEC. All forward-looking statements attributable to the Company or persons acting on our behalf are expressly qualified in their entirety by the cautionary statements set forth above. We caution you not to place undue reliance on any forward-looking statements, which are made only as of the date of this press release. We do not undertake or assume any obligation to update publicly any of these forward-looking statements to reflect actual results, new information or future events, changes in assumptions or changes in other factors affecting forward-looking statements, except to the extent required by applicable law. If we update one or more forward-looking statements, no inference should be drawn that we will make additional updates with respect to those or other forward-looking statements.
Non-GAAP Financial Measures
The Company refers to certain financial measures that are not recognized under U.S. generally accepted accounting principles (GAAP) in this press release, including: Adjusted Net Income; Adjusted Diluted EPS; Adjusted EBITDA; Adjusted G&A Expenses; Free Cash Flow; and Adjusted Free Cash Flow. See the schedules to this earnings release, including the "Definitions" section, for additional information and reconciliations of such non-GAAP financial measures.
4
Availability of Information on Hyatt's Website and Social Media Channels
Investors and others should note that Hyatt routinely announces material information to investors and the marketplace using U.S. Securities and Exchange Commission (SEC) filings, press releases, public conference calls, webcasts, and the Hyatt Investor Relations website. The Company uses these channels as well as social media channels (e.g., the Hyatt Facebook account (facebook.com/hyatt); the Hyatt Instagram account (instagram.com/hyatt); the Hyatt LinkedIn account (linkedin.com/company/hyatt); the Hyatt TikTok account (tiktok.com/@hyatt); the Hyatt X account (x.com/hyatt); and the Hyatt YouTube account (youtube.com/user/hyatt)) as a means of disclosing information about the Company's business to its guests, customers, colleagues, investors, and the public. While not all of the information that the Company posts to the Hyatt Investor Relations website or on the Company's social media channels is of a material nature, some information could be deemed to be material. Accordingly, the Company encourages investors, the media, and others interested in Hyatt to review the information that it shares at the Investor Relations link located at the bottom of the page on hyatt.com and on the Company's social media channels. Users may automatically receive email alerts and other information about the Company when enrolling an email address by visiting "Investor Email Alerts" in the "Resources" section of Hyatt's website at investors.hyatt.com. The contents of these websites are not incorporated by reference into this press release or any report or document Hyatt files with the SEC, and any references to the websites are intended to be inactive textual references only.
About Hyatt Hotels Corporation
Hyatt Hotels Corporation, headquartered in Chicago, is a leading global hospitality company guided by its purpose – to care for people so they can be their best. As of December 31, 2025, the Company's portfolio included more than 1,500 hotels and all-inclusive properties in 83 countries across six continents. The Company's offering includes brands in the Luxury Portfolio, including Park Hyatt®, Alila®, Miraval®, Impression by Secrets, and The Unbound Collection by Hyatt®; the Lifestyle Portfolio, including Andaz®, Thompson Hotels®, The Standard®, Dream® Hotels, The StandardX®, Breathless Resorts & Spas®, JdV by Hyatt®, Bunkhouse® Hotels, and Me and All Hotels; the Inclusive Collection, including Zoëtry® Wellness & Spa Resorts, Hyatt Ziva®, Hyatt Zilara®, Secrets® Resorts & Spas, Dreams® Resorts & Spas, Hyatt Vivid® Hotels & Resorts, Bahia Principle Hotels & Resorts, Alua Hotels & Resorts®, and Sunscape® Resorts & Spas; the Classics Portfolio, including Grand Hyatt®, Hyatt Regency®, Destination by Hyatt®, Hyatt Centric®, Hyatt Vacation Club®, and Hyatt®; and the Essentials Portfolio, including Caption by Hyatt®, Unscripted by Hyatt, Hyatt Place®, Hyatt House®, Hyatt Studios®, Hyatt Select, and UrCove. Subsidiaries of the Company operate the World of Hyatt® loyalty program, ALG Vacations®, Mr & Mrs Smith, Unlimited Vacation Club®, Amstar® DMC destination management services, and Trisept Solutions® technology services. For more information, please visit www.hyatt.com.
Percentages on the following schedules may not recompute due to rounding. Not meaningful percentage changes are presented as "NM".
6
Hyatt Hotels Corporation
Consolidated Statements of Income (Loss)
(unaudited)
(in millions, except per share amounts)
Three Months Ended December 31,
Year Ended December 31,
2025
2024
2025
2024
REVENUES:
Base management fees
$
112
$
104
$
446
$
399
Incentive management fees
81
72
272
242
Franchise and other fees
114
118
480
458
Gross fees
307
294
1,198
1,099
Contra revenue
(17)
(13)
(86)
(69)
Net fees
290
281
1,112
1,030
Owned and leased
423
264
1,375
1,174
Distribution
177
205
946
1,023
Other revenues
4
11
39
69
Revenues for reimbursed costs
895
841
3,629
3,352
Total revenues
1,789
1,602
7,101
6,648
DIRECT AND GENERAL AND ADMINISTRATIVE EXPENSES:
General and administrative
139
136
555
548
Owned and leased
336
209
1,122
925
Distribution
169
185
823
875
Other direct costs
7
13
73
94
Transaction and integration costs
43
16
173
42
Depreciation and amortization
80
76
325
333
Reimbursed costs
926
887
3,682
3,457
Total direct and general and administrative expenses
1,700
1,522
6,753
6,274
Net gains (losses) and interest income from marketable securities held to fund rabbi trusts
9
3
50
49
Equity earnings (losses) from unconsolidated hospitality ventures
(6)
(1)
(46)
31
Interest expense
(87)
(52)
(317)
(180)
Gains (losses) on sales of real estate and other
(13)
(22)
(15)
1,245
Asset impairments
(17)
(161)
(40)
(213)
Other income (loss), net
33
105
101
257
Income (loss) before income taxes
8
(48)
81
1,563
Provision for income taxes
(27)
(8)
(130)
(267)
Net income (loss)
$
(19)
$
(56)
$
(49)
$
1,296
Net income attributable to noncontrolling interests
$
1
$
—
$
3
$
—
Net income (loss) attributable to Hyatt Hotels Corporation
$
(20)
$
(56)
$
(52)
$
1,296
EARNINGS (LOSSES) PER CLASS A AND CLASS B SHARE:
Net income (loss) attributable to Hyatt Hotels Corporation—Basic
$
(0.21)
$
(0.58)
$
(0.55)
$
12.99
Net income (loss) attributable to Hyatt Hotels Corporation—Diluted
$
(0.21)
$
(0.58)
$
(0.55)
$
12.65
Basic weighted-average shares outstanding
95.0
96.2
95.5
99.8
Diluted weighted-average shares outstanding
95.0
96.2
95.5
102.4
A - 1
Hyatt Hotels Corporation
Comparable System-wide Hotels Operating Statistics by Geography
Three Months Ended December 31,
(in constant $)
RevPAR
Occupancy
ADR
2025
vs. 2024
2025
vs. 2024
2025
vs. 2024
System-wide hotels (a)
$
146.01
4.0
%
69.4
%
0.5
% pts
$
210.47
3.4
%
United States
$
141.91
0.5
%
66.3
%
(1.2)
% pts
$
213.94
2.2
%
Americas (excluding U.S.)
$
176.93
5.0
%
68.5
%
1.6
% pts
$
258.29
2.7
%
Greater China
$
94.14
6.7
%
73.7
%
2.7
% pts
$
127.80
2.8
%
Asia Pacific (excluding Greater China)
$
177.22
13.4
%
77.2
%
3.4
% pts
$
229.66
8.6
%
Europe
$
186.34
8.0
%
71.5
%
2.5
% pts
$
260.62
4.3
%
Middle East & Africa
$
178.91
9.2
%
73.7
%
1.4
% pts
$
242.86
7.2
%
Owned and leased hotels (b)
$
246.55
7.2
%
71.1
%
—
% pts
$
346.84
7.2
%
(in reported $)
Net Package RevPAR
Occupancy
Net Package ADR
2025
vs. 2024
2025
vs. 2024
2025
vs. 2024
System-wide all-inclusive resorts (c)
$
219.94
8.3
%
74.8
%
1.6
% pts
$
293.94
6.0
%
Americas (excluding U.S.)
$
234.45
7.6
%
73.9
%
2.6
% pts
$
317.36
3.9
%
Europe (d)
$
158.80
13.1
%
78.8
%
(2.5)
% pts
$
201.52
16.8
%
Year Ended December 31,
(in constant $)
RevPAR
Occupancy
ADR
2025
vs. 2024
2025
vs. 2024
2025
vs. 2024
System-wide hotels (a)
$
144.63
2.9
%
70.6
%
0.9
% pts
$
204.88
1.6
%
United States
$
147.00
0.9
%
69.7
%
(0.2)
% pts
$
210.98
1.3
%
Americas (excluding U.S.)
$
176.16
2.9
%
69.0
%
(0.4)
% pts
$
255.20
3.4
%
Greater China
$
87.44
2.8
%
72.3
%
3.2
% pts
$
120.87
(1.8)
%
Asia Pacific (excluding Greater China)
$
155.62
9.5
%
74.1
%
3.0
% pts
$
209.91
4.9
%
Europe
$
189.81
4.7
%
70.4
%
1.8
% pts
$
269.52
1.9
%
Middle East & Africa
$
146.13
10.2
%
70.2
%
3.3
% pts
$
208.24
5.1
%
Owned and leased hotels (b)
$
225.37
5.7
%
71.7
%
0.3
% pts
$
314.22
5.1
%
(in reported $)
Net Package RevPAR
Occupancy
Net Package ADR
2025
vs. 2024
2025
vs. 2024
2025
vs. 2024
System-wide all-inclusive resorts (c)
$
221.77
8.6
%
76.9
%
3.4
% pts
$
288.38
3.8
%
Americas (excluding U.S.)
$
241.08
7.1
%
74.5
%
4.1
% pts
$
323.53
1.2
%
Europe (d)
$
164.40
15.3
%
84.0
%
1.5
% pts
$
195.72
13.3
%
(a) Consists of hotels that the Company manages, franchises, owns, leases, or provides services to, excluding all-inclusive properties.
(b) Excludes unconsolidated hospitality ventures and all-inclusive leased properties.
(c) Consists of all-inclusive properties that the Company manages, leases, or provides services to.
(d) Certain resorts in Europe operate under a hybrid all-inclusive model, which includes various all-inclusive package options as well as rooms-only options.
A - 2
Hyatt Hotels Corporation
Comparable System-wide Hotels Operating Statistics by Brand
Chain scale classification as defined by Smith Travel Research
Three Months Ended December 31,
(in constant $)
RevPAR
Occupancy
ADR
2025
vs. 2024
2025
vs. 2024
2025
vs. 2024
Composite Luxury (a)
$
216.95
6.9
%
71.6
%
1.8
% pts
$
302.94
4.2
%
Grand Hyatt
$
182.55
7.6
%
72.4
%
2.9
% pts
$
252.31
3.3
%
Park Hyatt
$
355.66
9.6
%
71.4
%
(0.3)
% pts
$
498.34
10.0
%
The Unbound Collection by Hyatt
$
188.83
6.7
%
66.4
%
2.9
% pts
$
284.54
2.2
%
Composite Upper Upscale (b)
$
142.04
4.7
%
68.1
%
0.7
% pts
$
208.53
3.6
%
Hyatt Centric
$
175.34
3.3
%
76.8
%
0.8
% pts
$
228.16
2.1
%
Hyatt Regency
$
134.52
4.6
%
66.4
%
0.6
% pts
$
202.70
3.8
%
JdV by Hyatt
$
133.26
12.5
%
70.9
%
4.3
% pts
$
188.08
5.7
%
Composite Upscale (c)
$
102.22
(1.5)
%
68.9
%
(1.1)
% pts
$
148.25
—
%
Hyatt House
$
113.16
(2.7)
%
71.2
%
(1.1)
% pts
$
158.88
(1.2)
%
Hyatt Place
$
98.42
(1.5)
%
68.3
%
(1.1)
% pts
$
144.18
0.2
%
Composite Upper Midscale (d)
$
43.08
1.4
%
77.2
%
0.3
% pts
$
55.82
1.0
%
UrCove
$
42.82
1.4
%
78.1
%
0.3
% pts
$
54.81
0.9
%
(in reported $)
Net Package RevPAR
Occupancy
Net Package ADR
2025
vs. 2024
2025
vs. 2024
2025
vs. 2024
Composite All-inclusive (e)
$
219.94
8.3
%
74.8
%
1.6
% pts
$
293.94
6.0
%
Dreams Resorts & Spas
$
219.69
6.0
%
73.6
%
1.0
% pts
$
298.43
4.5
%
Secrets Resorts & Spas
$
299.01
7.9
%
76.5
%
1.2
% pts
$
390.71
6.2
%
Alua Hotels & Resorts
$
117.48
14.7
%
82.5
%
(2.0)
% pts
$
142.33
17.4
%
Year Ended December 31,
(in constant $)
RevPAR
Occupancy
ADR
2025
vs. 2024
2025
vs. 2024
2025
vs. 2024
Composite Luxury (a)
$
207.71
5.8
%
71.3
%
2.2
% pts
$
291.43
2.6
%
Grand Hyatt
$
179.83
5.0
%
72.8
%
2.8
% pts
$
247.16
1.0
%
Park Hyatt
$
314.27
9.1
%
69.7
%
1.7
% pts
$
450.88
6.4
%
The Unbound Collection by Hyatt
$
205.39
6.8
%
65.8
%
2.0
% pts
$
311.99
3.5
%
Composite Upper Upscale (b)
$
140.64
2.6
%
69.2
%
0.7
% pts
$
203.16
1.5
%
Hyatt Centric
$
162.92
2.9
%
76.1
%
1.3
% pts
$
214.17
1.2
%
Hyatt Regency
$
136.90
2.3
%
68.1
%
0.6
% pts
$
201.01
1.4
%
JdV by Hyatt
$
118.08
6.3
%
67.6
%
3.2
% pts
$
174.78
1.4
%
Composite Upscale (c)
$
106.95
(0.7)
%
71.7
%
0.1
% pts
$
149.22
(0.8)
%
Hyatt House
$
120.69
(1.3)
%
74.5
%
(0.1)
% pts
$
162.01
(1.2)
%
Hyatt Place
$
102.77
(0.5)
%
71.0
%
0.1
% pts
$
144.84
(0.6)
%
Composite Upper Midscale (d)
$
41.49
(1.0)
%
76.1
%
2.2
% pts
$
54.55
(3.9)
%
UrCove
$
40.93
(0.8)
%
76.8
%
2.4
% pts
$
53.29
(3.9)
%
(in reported $)
Net Package RevPAR
Occupancy
Net Package ADR
2025
vs. 2024
2025
vs. 2024
2025
vs. 2024
Composite All-inclusive (e)
$
221.77
8.6
%
76.9
%
3.4
% pts
$
288.38
3.8
%
Dreams Resorts & Spas
$
228.22
4.2
%
75.6
%
1.2
% pts
$
301.91
2.5
%
Secrets Resorts & Spas
$
300.52
9.8
%
75.5
%
4.0
% pts
$
398.25
4.1
%
Alua Hotels & Resorts
$
135.69
15.4
%
87.5
%
1.3
% pts
$
155.03
13.7
%
(a) Includes Alila, Andaz, Destination by Hyatt, Grand Hyatt, Miraval, Park Hyatt, The Unbound Collection by Hyatt, and Thompson Hotels.
(b) Includes Dream Hotels, Hyatt, Hyatt Centric, Hyatt Regency, and JdV by Hyatt.
(c) Includes Hyatt House, Hyatt Place, Me and All Hotels, and Unscripted by Hyatt.
(d) Includes Hyatt Select and UrCove.
(e) Includes Alua Hotels & Resorts, Breathless Resorts & Spas, Dreams Resorts & Spas, Hyatt Zilara, Hyatt Ziva, Impressions by Secrets, Secrets Resorts & Spas, Sunscape Resorts & Spas, and Zoëtry Wellness & Spa Resorts. Certain resorts in Europe operate under a hybrid all-inclusive model, which includes various all-inclusive package options as well as rooms-only options.
A - 3
Hyatt Hotels Corporation
Properties and Rooms by Geography
December 31, 2025
Managed (a)
Franchised
Owned and Leased (b)
Total
Properties
Rooms
Properties
Rooms
Properties
Rooms
Properties
Rooms
Geography:
United States
178
64,048
544
99,568
14
5,672
736
169,288
Americas (excluding U.S.)
39
10,210
49
7,719
4
1,197
92
19,126
Greater China
115
34,252
98
16,527
—
—
213
50,779
Asia Pacific (excluding Greater China)
145
35,259
12
3,528
—
—
157
38,787
Europe
54
12,310
67
11,629
4
1,059
125
24,998
Middle East & Africa
45
10,493
4
779
—
—
49
11,272
System-wide hotels (c)
576
166,572
774
139,750
22
7,928
1,372
314,250
Americas (excluding U.S.)
107
44,108
—
—
—
—
107
44,108
Europe (d)
43
13,143
—
—
6
1,262
49
14,405
System-wide all-inclusive resorts
150
57,251
—
—
6
1,262
156
58,513
System-wide (e)
726
223,823
774
139,750
28
9,190
1,528
372,763
Mr & Mrs Smith (f)
1,260
42,129
Hyatt Vacation Club
22
1,997
Residential
42
4,696
(a) Includes properties that the Company manages or provides services to.
(b) Figures do not include unconsolidated hospitality ventures.
(c) Figures do not include all-inclusive properties.
(d) Certain resorts in Europe operate under a hybrid all-inclusive model, which includes various all-inclusive package options as well as rooms-only options.
(e) Figures do not include Hyatt Vacation Club, Mr & Mrs Smith, and certain residential units.
(f) Represents unaffiliated Mr & Mrs Smith properties available through Hyatt.com, which are not reflected in the system-wide figures above. At December 31, 2025, the Mr & Mrs Smith platform included approximately 2,400 properties (or approximately 109,000 rooms) that pay commissions through the Company's distribution segment revenues.
A - 4
Hyatt Hotels Corporation
Properties and Rooms by Brand
December 31, 2025
Managed (a)
Franchised
Owned and Leased (b)
Total
Brands by Chain Scale:
Properties
Rooms
Properties
Rooms
Properties
Rooms
Properties
Rooms
Luxury (c)
Alila
17
1,947
—
—
—
—
17
1,947
Andaz
29
6,748
1
715
2
507
32
7,970
Destination by Hyatt
11
2,375
11
4,431
—
—
22
6,806
Grand Hyatt
61
32,232
3
1,331
2
904
66
34,467
Miraval
—
—
—
—
3
383
3
383
Park Hyatt
48
8,827
—
—
3
549
51
9,376
The Unbound Collection by Hyatt
18
3,111
34
6,167
—
—
52
9,278
Thompson Hotels
16
3,382
2
472
—
—
18
3,854
Upper Upscale (c)
Bunkhouse
10
498
—
—
—
—
10
498
Dream Hotels
4
808
1
178
—
—
5
986
Hyatt
7
1,206
6
969
1
1,298
14
3,473
Hyatt Centric
35
7,269
37
7,554
1
138
73
14,961
Hyatt Regency
174
73,056
63
22,694
6
3,355
243
99,105
JdV by Hyatt
14
2,267
38
6,069
—
—
52
8,336
The Standard
9
1,386
3
580
—
—
12
1,966
The StandardX
2
187
—
—
—
—
2
187
Upscale (c)
Caption by Hyatt
3
623
2
377
—
—
5
1,000
Hyatt House
24
3,365
121
17,031
—
—
145
20,396
Hyatt Place
87
14,887
363
51,735
4
794
454
67,416
Me and All Hotels
—
—
8
1,364
—
—
8
1,364
Unscripted by Hyatt
6
1,598
2
256
—
—
8
1,854
Upper Midscale (c)
Hyatt Select
—
—
2
203
—
—
2
203
Hyatt Studios
—
—
2
242
—
—
2
242
UrCove
—
—
72
10,147
—
—
72
10,147
All-inclusive
Breathless Resorts & Spas
6
2,311
—
—
—
—
6
2,311
Dreams Resorts & Spas
34
14,712
—
—
—
—
34
14,712
Hyatt Zilara
4
1,320
—
—
—
—
4
1,320
Hyatt Ziva
6
2,578
—
—
—
—
6
2,578
Impression by Secrets
2
323
—
—
—
—
2
323
Secrets Resorts & Spas
28
10,697
—
—
—
—
28
10,697
Zoëtry Wellness & Spa Resorts
7
543
—
—
—
—
7
543
Bahia Principe Hotels & Resorts
22
11,648
—
—
—
—
22
11,648
Hyatt Vivid Hotels & Resorts
2
924
—
—
—
—
2
924
Sunscape Resorts & Spas
9
4,147
—
—
—
—
9
4,147
Alua Hotels & Resorts
26
7,443
—
—
6
1,262
32
8,705
Other
5
1,405
3
7,235
—
—
8
8,640
System-wide
726
223,823
774
139,750
28
9,190
1,528
372,763
Property and rooms counts categorized by brand include properties in our system that are not yet operating under such brand, but are expected to rebrand to such brand at a future date.
(a) Includes properties that the Company manages or provides services to.
(b) Figures do not include unconsolidated hospitality ventures.
(c) Chain scale classification as defined by Smith Travel Research.
A - 5
Hyatt Hotels Corporation
Reconciliation of Non-GAAP Financial Measures: Net Income (Loss) Attributable to Hyatt Hotels Corporation to Adjusted EBITDA and Net Cash Provided by Operating Activities to Free Cash Flow and Adjusted Free Cash Flow
(in millions)
Three Months Ended December 31,
Year Ended December 31,
2025
2024
2025
2024
Net income (loss) attributable to Hyatt Hotels Corporation
$
(20)
$
(56)
$
(52)
$
1,296
Contra revenue
17
13
86
69
Revenues for reimbursed costs
(895)
(841)
(3,629)
(3,352)
Reimbursed costs
926
887
3,682
3,457
Stock-based compensation expense (a)
9
7
68
62
Transaction and integration costs
43
16
173
42
Depreciation and amortization
80
76
325
333
Equity (earnings) losses from unconsolidated hospitality ventures
6
1
46
(31)
Interest expense
87
52
317
180
(Gains) losses on sales of real estate and other
13
22
15
(1,245)
Asset impairments
17
161
40
213
Other (income) loss, net
(33)
(105)
(101)
(257)
Provision for income taxes
27
8
130
267
Net income attributable to noncontrolling interests
1
—
3
—
Pro rata share of unconsolidated owned and leased hospitality ventures' Adjusted EBITDA
14
14
56
62
Adjusted EBITDA
$
292
$
255
$
1,159
$
1,096
(a) Includes amounts recognized in general and administrative expenses, owned and leased expenses, and distribution expenses; excludes amounts recognized in transaction and integration costs.
The table below provides a breakdown for Adjusted EBITDA:
(in millions)
Three Months Ended December 31,
Year Ended December 31,
2025
2024
2025
2024
Management and franchising
$
240
$
219
$
940
$
854
Owned and leased
85
57
259
261
Distribution
7
20
120
140
Overhead
(40)
(41)
(160)
(160)
Eliminations
—
—
—
1
Adjusted EBITDA
$
292
$
255
$
1,159
$
1,096
(in millions)
Year Ended December 31,
2025
2024
Net cash provided by operating activities
$
379
$
633
Capital expenditures
(220)
(170)
Free Cash Flow
$
159
$
463
Cash taxes on asset sales
117
77
Costs associated with the Playa Hotels Acquisition (b)
198
—
Adjusted Free Cash Flow
$
474
$
540
(b) Includes cash paid for transaction and integration costs, interest on the delayed draw term loan facility, and other costs associated with the acquisition.
A - 6
Hyatt Hotels Corporation
Reconciliation of Non-GAAP Financial Measure: G&A Expenses to Adjusted G&A Expenses
Results of operations as presented on the consolidated statements of income (loss) include expenses recognized with respect to deferred compensation plans funded through rabbi trusts. Certain of these expenses are recognized in G&A expenses and are completely offset by the corresponding net gains (losses) and interest income from marketable securities held to fund rabbi trusts, thus having no impact to net income (loss). G&A expenses also include expenses related to stock-based compensation. Below is a reconciliation of this measure excluding the impact of our rabbi trust investments and stock-based compensation expense.
(in millions)
Three Months Ended December 31,
Year Ended December 31,
2025
2024
2025
2024
G&A expenses
$
139
$
136
$
555
$
548
Less: Rabbi trust impact
(8)
(3)
(48)
(46)
Less: Stock-based compensation expense
(8)
(6)
(62)
(58)
Adjusted G&A Expenses
$
123
$
127
$
445
$
444
The table below provides a breakdown for Adjusted G&A Expenses:
(in millions)
Three Months Ended December 31,
Year Ended December 31,
2025
2024
2025
2024
Management and franchising
$
81
$
83
$
275
$
268
Owned and leased
2
3
10
10
Distribution
—
—
—
6
Overhead
40
41
160
160
Adjusted G&A Expenses
$
123
$
127
$
445
$
444
A - 7
Hyatt Hotels Corporation
Reconciliation of Non-GAAP Financial Measure: Net Income (Loss) Attributable to Hyatt Hotels Corporation to Adjusted EBITDA
(in millions)
Three Months Ended December 31, 2025
Hyatt (Ex-Playa)
Playa (b)
Consolidated
Net income (loss) attributable to Hyatt Hotels Corporation
$
60
$
(80)
$
(20)
Contra revenue
17
—
17
Revenues for reimbursed costs
(895)
—
(895)
Reimbursed costs
926
—
926
Stock-based compensation expense (a)
8
1
9
Transaction and integration costs
5
38
43
Depreciation and amortization
80
—
80
Equity (earnings) losses from unconsolidated hospitality ventures
6
—
6
Interest expense
46
41
87
(Gains) losses on sales of real estate and other
(21)
34
13
Asset impairments
17
—
17
Other (income) loss, net
(33)
—
(33)
Provision for income taxes
27
—
27
Net income attributable to noncontrolling interests
1
—
1
Pro rata share of unconsolidated owned and leased hospitality ventures' Adjusted EBITDA
14
—
14
Adjusted EBITDA
$
258
$
34
$
292
(a) Includes amounts recognized in general and administrative expenses, owned and leased expenses, and distribution expenses; excludes amounts recognized in transaction and integration costs.
(b) Includes amounts incurred specifically related to Playa, including amounts recognized by Playa during Hyatt's period of ownership; amounts recognized by Hyatt prior to and following the completion of the acquisition; and amounts related to the Playa Real Estate Transaction. Refer to the table on schedule A-12 for Playa results by quarter.
(in millions)
Year Ended December 31, 2025
Hyatt (Ex-Playa)
Playa (d)
Consolidated
Net income (loss) attributable to Hyatt Hotels Corporation
$
161
$
(213)
$
(52)
Contra revenue
86
—
86
Revenues for reimbursed costs
(3,629)
—
(3,629)
Reimbursed costs
3,682
—
3,682
Stock-based compensation expense (c)
64
4
68
Transaction and integration costs
32
141
173
Depreciation and amortization
324
1
325
Equity (earnings) losses from unconsolidated hospitality ventures
46
—
46
Interest expense
206
111
317
(Gains) losses on sales of real estate and other
(19)
34
15
Asset impairments
40
—
40
Other (income) loss, net
(101)
—
(101)
Provision for income taxes
130
—
130
Net income attributable to noncontrolling interests
3
—
3
Pro rata share of unconsolidated owned and leased hospitality ventures' Adjusted EBITDA
56
—
56
Adjusted EBITDA
$
1,081
$
78
$
1,159
(c) Includes amounts recognized in general and administrative expenses, owned and leased expenses, and distribution expenses; excludes amounts recognized in transaction and integration costs.
(d) Includes amounts incurred specifically related to Playa, including amounts recognized by Playa during Hyatt's period of ownership; amounts recognized by Hyatt prior to and following the completion of the acquisition; and amounts related to the Playa Real Estate Transaction. Refer to the table on schedule A-12 for Playa results by quarter.
A - 8
Hyatt Hotels Corporation
Reconciliation of Non-GAAP Financial Measure: Net Cash Provided by Operating Activities to Free Cash Flow and Adjusted Free Cash Flow
(in millions)
Year Ended December 31, 2025
Hyatt (Ex-Playa)
Playa
Consolidated
Net cash provided by operating activities
$
558
$
(179)
$
379
Capital expenditures
(148)
(72)
(220)
Free Cash Flow
$
410
$
(251)
$
159
Cash taxes on asset sales
117
—
117
Costs associated with the Playa Hotels Acquisition (a)
—
198
198
Adjusted Free Cash Flow
$
527
$
(53)
$
474
(a) Includes cash paid for transaction and integration costs, interest on the delayed draw term loan facility, and other costs associated with the acquisition.
A - 9
Hyatt Hotels Corporation
Reconciliation of Non-GAAP Financial Measure: Net Income (Loss) Attributable to Hyatt Hotels Corporation and Diluted Earnings (Losses) Per Class A and Class B Share to Adjusted Net Income Attributable to Hyatt Hotels Corporation and Adjusted Diluted Earnings Per Class A and Class B Share
(in millions, except per share amounts)
Three Months Ended December 31,
Year Ended December 31,
2025
2024
2025
2024
Net income (loss) attributable to Hyatt Hotels Corporation
$
(20)
$
(56)
$
(52)
$
1,296
Diluted earnings (losses) per share
$
(0.21)
$
(0.58)
$
(0.55)
$
12.65
Special items:
Transaction and integration costs (a)
43
16
173
42
Fund deficits (b)
22
30
27
50
Asset impairments (c)
17
161
40
213
(Gains) losses on sales of real estate and other (d)
13
22
15
(1,245)
Utilization of Avendra and other proceeds (e)
6
5
21
20
Restructuring costs (f)
6
5
57
5
Unconsolidated hospitality ventures (g)
—
(15)
36
(84)
(Gains) losses, net on marketable securities (h)
(1)
(58)
(19)
(54)
Contingent consideration liabilities fair value adjustments (i)
(23)
(19)
(37)
(39)
Other
4
7
4
4
Special items - pre-tax
87
154
317
(1,088)
Income tax (provision) benefit for special items
59
(58)
(56)
167
Total special items - after-tax
$
146
$
96
$
261
$
(921)
Special items impact per diluted share
$
1.54
$
1.00
$
2.74
$
(8.99)
Adjusted net income attributable to Hyatt Hotels Corporation
$
126
$
40
$
209
$
375
Adjusted diluted earnings per share
$
1.33
$
0.42
$
2.19
$
3.66
(a) During the three months ended December 31, 2025 (Q4 2025) and the year ended December 31, 2025 (YTD 2025), we recognized transaction and integration costs primarily related to the Playa Hotels Acquisition and integration costs related to Standard International. During the three months ended December 31, 2024 (Q4 2024) and the year ended December 31, 2024 (YTD 2024), we recognized transaction costs primarily related to Bahia Principe and Standard International and integration costs related to Apple Leisure Group and Standard International. Additionally, during YTD 2024, we recognized integration costs related to Dream Hotel Group and Mr & Mrs Smith. The costs were recognized in transaction and integration costs on our consolidated statements of income (loss).
(b) During Q4 2025, YTD 2025, Q4 2024, and YTD 2024, we recognized net deficits, which we intend to recover in future periods on certain funds due to the timing of revenue and expense recognition. During Q4 2025 and YTD 2025, this fund activity was recognized in revenues for reimbursed costs ($198 million and $820 million, respectively), reimbursed costs ($224 million and $855 million, respectively), depreciation and amortization expenses ($4 million and $19 million, respectively), and other income (loss), net ($8 million and $27 million, respectively), and during Q4 2024 and YTD 2024, this fund activity was recognized in revenues for reimbursed costs ($145 million and $619 million, respectively), reimbursed costs ($186 million and $705 million, respectively), and other income (loss), net ($11 million and $36 million, respectively) on our consolidated statements of income (loss). Figures herein exclude revenues and expenses related to payroll at managed properties where we are the employer and other expenses, which were recognized in revenues for reimbursed costs and reimbursed costs on our consolidated statements of income (loss) but are not considered part of our fund activity.
(c) During Q4 2025, we recognized $17 million of impairment charges related to intangible assets. Additionally, during YTD 2025, we recognized $23 million of impairment charges related to intangible assets, property and equipment, and operating lease right-of-use assets. During Q4 2024, we recognized $161 million of impairment charges related to goodwill and intangible assets. Additionally, during YTD 2024, we recognized $52 million of impairment charges related to property and equipment, definite-lived intangible assets, goodwill, and operating lease right-of-use assets. The impairment charges were recognized in asset impairments on our consolidated statements of income (loss).
(d) During Q4 2025 and YTD 2025, we recognized a $34 million pre-tax loss related to the Playa Real Estate Transaction and a $21 million pre-tax gain related to the sale of the Alua Portfolio. During Q4 2024, we recognized pre-tax losses related to a decrease in the carrying value of the contingent consideration receivable recorded in conjunction with the sale of the Destination Residential Management business in 2023 ($17 million) and related to the sale of Hyatt Regency O'Hare Chicago ($5 million). Additionally, during YTD 2024, we recognized pre-tax gains related to the sales of Hyatt Regency Orlando and an adjacent undeveloped land parcel ($514 million), Park Hyatt Zurich ($257 million), and Hyatt Regency San Antonio Riverwalk ($100 million), the UVC Transaction ($231 million), and the sale of the shares of the entities that own Hyatt Regency Aruba Resort Spa and Casino ($172 million) as well as a $4 million pre-tax loss related to the sale of Hyatt Regency Green Bay. The activity was recognized in gains (losses) on sales of real estate and other on our consolidated statements of income (loss).
(e) During Q4 2025, YTD 2025, Q4 2024, and YTD 2024, we recognized expenses related to the partial utilization of the Avendra LLC sale proceeds for the benefit of our hotels in reimbursed costs ($5 million, $18 million, $5 million, and $19 million, respectively) and depreciation and amortization expenses ($1 million, $3 million, an insignificant amount, and $1 million, respectively) on our consolidated statements of income (loss). The gain recognized in conjunction with the sale of Avendra LLC was included as a special item during the year ended December 31, 2017.
(f) During Q4 2025 and YTD 2025, we recognized restructuring costs as a result of organizational changes in other income (loss), net on our consolidated statements of income (loss).
(g) During YTD 2025, we recognized impairment charges related to certain investments in unconsolidated hospitality ventures. During Q4 2024, we recognized $20 million of gains related to the sale of our ownership interest in two equity method investments and a $5 million impairment charge related to an unconsolidated hospitality venture. Additionally, during YTD 2024, we recognized a $79 million non-cash pre-tax gain related to the dilution of our ownership interest in an unconsolidated hospitality venture and a $10 million impairment charge related to one of our unconsolidated hospitality ventures. The activity was recognized in equity earnings (losses) from unconsolidated hospitality ventures on our consolidated statements of income (loss).
(h) During Q4 2025, YTD 2025, Q4 2024, and YTD 2024, we recognized net gains due to the change in fair value of our marketable securities. Additionally, during YTD 2025, we recognized realized gains on our previously-held ordinary shares in Playa Hotels. The activity was recognized in other income (loss), net on our consolidated statements of income (loss).
(i) During Q4 2025 and YTD 2025, we recognized fair value adjustments related to Dream Hotel Group, Bahia Principe, and Standard International. During Q4 2024 and YTD 2024, we recognized fair value adjustments primarily related to Dream Hotel Group. The fair value adjustments were recognized in other income (loss), net on our consolidated statements of income (loss).
A - 10
Hyatt Hotels Corporation
Adjustments to Owned and Leased Segment from Sold Assets
The schedule below represents the following sold assets including the following owned and leased hotels: Hyatt Regency Aruba Resort Spa and Casino (Q1 2024), Park Hyatt Zurich (Q2 2024), Hyatt Regency San Antonio Riverwalk (Q2 2024), Hyatt Regency Green Bay (Q2 2024), Hyatt Regency Orlando (Q3 2024), Hyatt Regency O'Hare Chicago (Q4 2024), Alua Atlántico Golf Resort (Q4 2025), Alua Tenerife (Q4 2025), and AluaSoul Orotava Valley (Q4 2025) as well as the following unconsolidated hospitality ventures: Park Hyatt Cabo del Sol (Q4 2024) and Hyatt Centric Downtown Nashville (Q4 2024).
(in millions)
Fiscal Year 2025
First Quarter
Second Quarter
Third Quarter
Fourth Quarter
Full Year
Total adjustment to segment revenues from sold assets (a)
$
(12)
$
(10)
$
(14)
$
(11)
$
(47)
Total adjustment to segment Adjusted EBITDA from sold assets (b) (c)
$
(2)
$
—
$
(3)
$
—
$
(5)
Fiscal Year 2024
First Quarter
Second Quarter
Third Quarter
Fourth Quarter
Full Year
Total adjustment to segment revenues from sold assets (a)
$
(119)
$
(82)
$
(42)
$
(24)
$
(267)
Adjustment to segment Adjusted EBITDA from sold hotels (c)
$
(37)
$
(28)
$
(11)
$
(2)
$
(78)
Adjustment to segment Adjusted EBITDA from sold unconsolidated hospitality ventures (d)
(1)
(1)
(1)
—
(3)
Total adjustment to segment Adjusted EBITDA from sold assets
$
(38)
$
(29)
$
(12)
$
(2)
$
(81)
(a) Represents the owned and leased segment revenues contribution in each period for hotels that have been sold as of December 31, 2025 and for which the Company entered into long-term management or franchise agreements upon sale.
(b) Includes certain tax expenses during the Company's period of ownership relating to a hotel sold in 2024.
(c) Represents the owned and leased segment Adjusted EBITDA contribution in each period for hotels that have been sold as of December 31, 2025 and for which the Company entered into long-term management or franchise agreements upon sale; excludes gross fee revenues retained following the sale.
(d) Represents Hyatt's pro rata share of unconsolidated hospitality ventures' Adjusted EBITDA contribution in each period for unconsolidated hospitality ventures that have been sold as of December 31, 2025. Includes the net impact from an unconsolidated hospitality venture, for which our ownership percentage was diluted from 50.0% to 38.8% as a result of its initial public offering.
The schedule below represents the sold assets that were acquired as part of the Playa Hotels Acquisition for their period of ownership in 2025.
(in millions)
Fiscal Year 2025
First Quarter
Second Quarter
Third Quarter
Fourth Quarter
Full Year
Total adjustment to segment revenues from sold Playa assets (a)
$
—
$
(47)
$
(159)
$
(157)
$
(363)
Total adjustment to segment Adjusted EBITDA from sold Playa assets (a)
$
—
$
(14)
$
(27)
$
(32)
$
(73)
(a) Represents the owned and leased segment revenues and Adjusted EBITDA contribution in each period for hotels acquired as part of the Playa Hotels Acquisition that were sold as part of the Playa Real Estate Transaction; excludes gross fee revenues retained following the sale.
A - 11
Hyatt Hotels Corporation
2025 Playa Results by Quarter
(in millions)
Playa Results by Quarter (a)
REVENUES:
Q2 2025
Q3 2025
Q4 2025
Full Year 2025
Gross fees (b)
$
—
$
(2)
$
(3)
$
(5)
Owned and leased
$
47
$
159
$
157
$
363
Distribution
$
—
$
—
$
—
$
—
EXPENSES:
Adjusted G&A Expenses
$
—
$
4
$
4
$
8
Owned and leased (c)
$
33
$
126
$
120
$
279
Distribution
$
—
$
1
$
—
$
1
(a) Includes amounts incurred specifically related to the Playa Hotels Acquisition, including amounts recognized by Playa during Hyatt's period of ownership.
(b) In Q2 2025, Q3 2025, and Q4 2025, gross fees were adjusted to remove an insignificant amount, $4 million, and $4 million, respectively, of intercompany franchise fee revenues earned for properties that were acquired in the Playa Hotels Acquisition and were eliminated in consolidation.
(c) Excludes stock-based compensation expense as amounts are not included in Adjusted EBITDA.
A - 12
Hyatt Hotels Corporation
Pipeline Approximate Mix
December 31, 2025
Approx. Hotels
Approx. Rooms
Geography:
United States
250
31,000
Americas (excluding U.S.)
80
18,000
Greater China
265
54,000
Asia Pacific (excluding Greater China)
165
29,000
Europe
45
9,000
Middle East & Africa
25
7,000
System-wide
830
148,000
Chain Scale: (a)
Luxury (b)
180
39,000
Upper Upscale (c)
190
44,000
Upscale (d)
265
43,000
Upper Midscale (e)
195
22,000
System-wide
830
148,000
Contract Type:
Managed
380
85,000
Franchised
450
63,000
System-wide
830
148,000
(a) Chain scale classification as defined by Smith Travel Research.
(b) Includes Alila, ATONA, Andaz, Breathless Resorts & Spas, Destination by Hyatt, Dreams Resorts & Spas, Grand Hyatt, Hyatt Zilara, Hyatt Ziva, Miraval, Park Hyatt, Secrets Resorts & Spas, The Unbound Collection by Hyatt, Thompson Hotels, and Zoëtry Wellness & Spa Resorts.
(c) Includes Bunkhouse Hotels, Dream Hotels, Hyatt Centric, Hyatt Regency, Hyatt Vivid Hotels & Resorts, JdV by Hyatt, The Standard, and The StandardX.
(d) Includes Alua Hotels & Resorts, Caption by Hyatt, Hyatt House, Hyatt Place, Me and All Hotels, and Unscripted by Hyatt.
(e) Includes Hyatt Studios, Hyatt Select, and UrCove.
A - 13
Hyatt Hotels Corporation
Reconciliation of Non-GAAP Financial Measures: Outlook: Net Income Attributable to Hyatt Hotels Corporation to Adjusted EBITDA; G&A Expenses to Adjusted G&A Expenses; and Net Cash Provided by Operating Activities to Free Cash Flow and Adjusted Free Cash Flow
No additional disposition or acquisition activity beyond what has been completed as of the date of this release has been included in the 2026 outlook. The Company's 2026 outlook is based on a number of assumptions that are subject to change and many of which are outside the control of the Company. If actual results vary from these assumptions, the Company's expectations may change. There can be no assurance that the Company will achieve these results. Results of operations as presented on the consolidated statements of income (loss) include expenses recognized with respect to deferred compensation plans funded through rabbi trusts. Certain of these expenses are recognized in G&A expenses and are completely offset by the corresponding net gains (losses) and interest income from marketable securities held to fund rabbi trusts, thus having no impact to net income (loss). G&A expenses also include expenses related to stock-based compensation. Below is a reconciliation of this forecasted measure excluding the impact of our rabbi trust investments and forecasted stock-based compensation expense.
(in millions)
Year Ending
December 31, 2026
Outlook Range
Low Case
High Case
Net income attributable to Hyatt Hotels Corporation
$
235
$
320
Contra revenue
65
65
Reimbursed costs, net (a)
95
55
Stock-based compensation expense (b)
65
65
Transaction and integration costs
45
35
Depreciation and amortization
310
310
Equity (earnings) losses from unconsolidated hospitality ventures
5
5
Interest expense
260
260
Other (income) loss, net
(110)
(130)
Provision for income taxes
185
215
Net income attributable to noncontrolling interests
—
5
Adjusted EBITDA
$
1,155
$
1,205
(a) Reimbursed costs are presented net of revenues for reimbursed costs as the Company cannot forecast the gross amounts without unreasonable effort.
(b) Includes amounts recognized in general and administrative expenses, owned and leased expenses, and distribution expenses; excludes amounts recognized in transaction and integration costs
Low Case
High Case
G&A expenses
$
502
$
512
Less: Rabbi trust impact
—
—
Less: Stock-based compensation expense
(62)
(62)
Adjusted G&A Expenses
$
440
$
450
Low Case
High Case
Net cash provided by operating activities
$
628
$
678
Capital expenditures
(135)
(135)
Free Cash Flow
$
493
$
543
Cash taxes on asset sales
4
4
Costs associated with the Playa Hotels Acquisition (c)
83
83
Adjusted Free Cash Flow
$
580
$
630
(c) Includes taxes and other costs related to the Playa Hotels Acquisition.
A - 14
Definitions
Adjusted Earnings Before Interest Expense, Taxes, Depreciation, and Amortization ("Adjusted EBITDA")
We use the term Adjusted EBITDA throughout this earnings release. Adjusted EBITDA, as we define it, is a measure that is not recognized in accordance with accounting principles generally accepted in the United States of America ("GAAP"). We define Adjusted EBITDA as net income (loss) attributable to Hyatt Hotels Corporation plus net income (loss) attributable to noncontrolling interests and our pro rata share of unconsolidated owned and leased hospitality ventures' Adjusted EBITDA, primarily based on our ownership percentage of each owned and leased venture, adjusted to exclude the following items:
•payments to customers ("contra revenue"), including performance cure payments and amortization of management and hotel services agreement and franchise agreement assets ("key money assets");
•revenues for reimbursed costs;
•reimbursed costs that we intend to recover over the long term;
•stock-based compensation expense;
•transaction and integration costs;
•depreciation and amortization;
•equity earnings (losses) from unconsolidated hospitality ventures;
•interest expense;
•gains (losses) on sales of real estate and other;
•asset impairments;
•other income (loss), net; and
•benefit (provision) for income taxes.
We calculate consolidated Adjusted EBITDA by adding the Adjusted EBITDA of each of our reportable segments and eliminations to unallocated overhead expenses.
Our board of directors and executive management team focus on Adjusted EBITDA as one of the key performance and compensation measures both on a segment and on a consolidated basis. Adjusted EBITDA assists us in comparing our performance over various reporting periods on a consistent basis because it removes from our operating results the impact of items that do not reflect our core operations both on a segment and on a consolidated basis. Our President and Chief Executive Officer, who is our chief operating decision maker, also evaluates the performance of each of our reportable segments and determines how to allocate resources to those segments, in part, by assessing the Adjusted EBITDA of each segment. In addition, the talent and compensation committee of our board of directors determines the annual variable compensation and long-term incentive compensation for certain members of our management based in part on financial measures including and/or derived from consolidated Adjusted EBITDA, segment Adjusted EBITDA, or some combination of both.
We believe Adjusted EBITDA is useful to investors because it provides investors with the same information that we use internally for purposes of assessing our operating performance and making compensation decisions and facilitates our comparison of results with our prior-period and forecasted results as well as our industry and competitors.
Adjusted EBITDA excludes certain items that can vary widely across different industries and among companies within the same industry, including interest expense and benefit or provision for income taxes, which are dependent on company specifics, including capital structure, credit ratings, tax policies, and jurisdictions in which they operate; depreciation and amortization, which are dependent on company policies including how the assets are utilized as well as the lives assigned to the assets; contra revenue, which is dependent on company policies and strategic decisions regarding payments to hotel owners; and stock-based compensation expense, which varies among companies as a result of different compensation plans companies have adopted.
We exclude revenues for reimbursed costs and reimbursed costs which relate to the reimbursement of payroll costs and system-wide services and programs that we operate for the benefit of our hotel owners as contractually we do not provide services or operate the related programs to generate a profit or bear a loss over the long term. If we collect amounts in excess of amounts spent, we have a commitment to our hotel owners to spend these amounts on the related system-wide services and programs. Additionally, if we spend in excess of amounts collected, we have a contractual right to adjust future collections or expenditures to recover prior-period costs. These timing differences are due to our discretion to spend in excess of revenues earned or less than revenues earned in a single period to ensure that the system-wide services and programs are operated in the best long-term interests of our hotel owners. Over the long term, these programs and services are not designed to impact our economics, either positively or negatively, and instead are designed to result in a cumulative break-even balance. Therefore, we exclude the net impact when evaluating period-over-period changes in our
A - 15
operating results. Adjusted EBITDA includes reimbursed costs related to system-wide services and programs that we do not intend to recover from hotel owners.
Finally, we exclude other items that are not core to our operations and may vary in frequency or magnitude, such as transaction and integration costs, asset impairments, unrealized and realized gains and losses on marketable securities, and gains and losses on sales of real estate and other.
Adjusted EBITDA is not a substitute for net income (loss) attributable to Hyatt Hotels Corporation, net income (loss), or any other measure prescribed by GAAP. There are limitations to using non-GAAP measures such as Adjusted EBITDA. Although we believe that Adjusted EBITDA can make an evaluation of our operating performance more consistent because it removes items that do not reflect our core operations, other companies in our industry may define Adjusted EBITDA differently than we do. As a result, it may be difficult to use Adjusted EBITDA or similarly named non-GAAP measures that other companies may use to compare the performance of those companies to our performance. Because of these limitations, Adjusted EBITDA should not be considered as a measure of the income or loss generated by our business. Our management compensates for these limitations by referencing our GAAP results and using Adjusted EBITDA supplementally.
Adjusted General and Administrative ("G&A") Expenses
Adjusted G&A Expenses, as we define it, is a non-GAAP measure. Adjusted G&A Expenses excludes the impact of deferred compensation plans funded through rabbi trusts and stock-based compensation expense. Adjusted G&A Expenses assists us in comparing our performance over various reporting periods on a consistent basis because it removes from our operating results the impact of items that do not reflect our core operations, both on a segment and consolidated basis.
Adjusted Net Income (Loss) and Adjusted Diluted Earnings (Losses) Per Class A and Class B Share ("EPS")
Adjusted Net Income (Loss) and Adjusted Diluted EPS, as we define them, are non-GAAP measures. We define Adjusted Net Income (Loss) as net income (loss) attributable to Hyatt Hotels Corporation excluding special items, which are those items deemed not to be reflective of ongoing operations. We define Adjusted Diluted EPS as Adjusted Net Income (Loss) per diluted share. We consider Adjusted Net Income (Loss) and Adjusted Diluted EPS to be an indicator of operating performance because excluding special items allows for period-over-period comparisons of our ongoing operations.
Adjusted Net Income (Loss) and Adjusted Diluted EPS are not a substitute for Net Income (Loss) attributable to Hyatt Hotels Corporation, net income (loss), diluted earnings (losses) per share (EPS), or any other measure prescribed by GAAP. There are limitations to using non-GAAP measures such as Adjusted Net Income (Loss) and Adjusted Diluted EPS. Although we believe that Adjusted Net Income (Loss) and Adjusted Diluted EPS can make an evaluation of our operating performance more consistent because they remove special items that are deemed not to be reflective of ongoing operations, other companies in our industry may define Adjusted Net Income (Loss) and Adjusted Diluted EPS differently than we do. As a result, it may be difficult to use Adjusted Net Income (Loss) or Adjusted Diluted EPS or similarly named non-GAAP measures that other companies may use to compare the performance of those companies to our performance. Because of these limitations, Adjusted Net Income (Loss) and Adjusted Diluted EPS should not be considered as measures of the income (loss) and earnings (losses) per share generated by our business. Our management compensates for these limitations by reference to its GAAP results and using Adjusted Net Income (Loss) and Adjusted Diluted EPS supplementally.
Average Daily Rate ("ADR")
ADR represents hotel room revenues divided by the total number of rooms sold in a given period. ADR measures the average room price attained by a property, and ADR trends provide useful information concerning the pricing environment and the nature of the customer base of a property or group of properties. ADR is a commonly used performance measure in our industry, and we use ADR to assess the pricing levels that we are able to generate by customer group, as changes in rates have a different effect on overall revenues and incremental profitability than changes in occupancy, as described below.
A - 16
Comparable system-wide and Comparable owned and leased
"Comparable system-wide" represents all properties we manage, franchise, or provide services to, including owned and leased properties, that are operated for the entirety of the periods being compared and that have not sustained substantial damage, business interruption, or undergone large-scale renovations during the periods being compared. Comparable system-wide also excludes properties for which comparable results are not available. We may use variations of comparable system-wide to specifically refer to comparable system-wide hotels or our all-inclusive resorts, for those properties that we manage, franchise, or provide services to within our management and franchising segment. "Comparable owned and leased" represents owned or leased hotels and/or all-inclusive resorts that are operated and consolidated for the entirety of the periods being compared and have not sustained substantial damage, business interruption, or undergone large-scale renovations during the periods being compared. Comparable owned and leased also excludes properties for which comparable results are not available. Comparable system-wide and comparable owned and leased are commonly used as a basis of measurement in our industry. "Non-comparable system-wide" or "non-comparable owned and leased" represent all properties, including those that do not meet the above definition of "comparable."
Constant Dollar Currency
We report the results of our operations both on an as reported basis, as well as on a constant dollar basis. Constant Dollar Currency, which is a non-GAAP measure, excludes the effects of movements in foreign currency exchange rates between comparative periods. We believe constant dollar analysis provides valuable information regarding our results as it removes currency fluctuations from our operating results. We calculate Constant Dollar Currency by restating prior-period local currency financial results at current-period exchange rates. These restated amounts are then compared to our current-period reported amounts to provide operationally driven variances in our results.
Free Cash Flow and Adjusted Free Cash Flow
Free Cash Flow represents net cash provided by operating activities less capital expenditures. Adjusted Free Cash Flow represents Free Cash Flow less estimated cash taxes on asset sales and costs associated with the Playa Hotels Acquisition. We believe Free Cash Flow and Adjusted Free Cash Flow to be useful liquidity measures to us and investors to evaluate the ability of our operations to generate cash for uses other than capital expenditures, cash taxes on asset sales, and costs associated with the Playa Hotels Acquisition and, after debt service and other obligations, our ability to grow our business through acquisitions and investments, as well as our ability to return cash to shareholders through dividends and share repurchases. Free Cash Flow and Adjusted Free Cash Flow are not necessarily representative of how we will use excess cash. Free Cash Flow and Adjusted Free Cash Flow are not substitutes for net cash provided by operating activities or any other measure prescribed by GAAP. There are limitations to using non-GAAP measures such as Free Cash Flow and Adjusted Free Cash Flow, and management compensates for these limitations by referencing our GAAP results and using Free Cash Flow and Adjusted Free Cash Flow supplementally.
Net Package ADR
Net Package ADR represents net package revenues divided by the total number of rooms sold in a given period. Net package revenues generally include revenue derived from the sale of packages at all-inclusive resorts comprised of rooms, food and beverage, and entertainment revenues, net of compulsory tips paid to employees. Net Package ADR measures the average room price attained by a property, and Net Package ADR trends provide useful information concerning the pricing environment and the nature of the customer base of a property or group of properties. Net Package ADR is a commonly used performance measure in our industry, and we use Net Package ADR to assess the pricing levels that we are able to generate by customer group, as changes in rates have a different effect on overall revenues and incremental profitability than changes in occupancy, as described below.
Net Package Revenue Per Available Room ("RevPAR")
Net Package RevPAR is the product of the Net Package ADR and the average daily occupancy percentage. Net Package RevPAR generally includes revenue derived from the sale of packages comprised of rooms, food and beverage, and entertainment revenues, net of compulsory tips paid to employees. Our management uses Net Package RevPAR to identify trend information with respect to room revenues from comparable properties and to evaluate property performance on a geographical and segment basis. Net Package RevPAR is a commonly used performance measure in our industry.
Net Package RevPAR changes that are driven predominantly by changes in occupancy have different implications for overall revenue levels and incremental profitability than do changes that are driven predominantly by changes in average room rates. For example, increases in occupancy at a property would lead to increases in net package revenues and additional variable operating costs, including housekeeping services, utilities, and room amenity costs. In contrast, changes in average room rates typically have a greater impact on margins and profitability as average room rate changes result in minimal direct impacts to variable operating costs.
A - 17
Occupancy
Occupancy represents the total number of rooms sold divided by the total number of rooms available at a property or group of properties. Occupancy measures the utilization of a property's available capacity. We use occupancy to gauge demand at a specific property or group of properties in a given period. Occupancy levels also help us determine achievable ADR levels as demand for property rooms increases or decreases.
Playa Hotels Acquisition
On June 17, 2025, the Company completed the acquisition of Playa Hotels & Resorts N.V. ("Playa Hotels" or "Playa"), a leading owner, operator, and developer of all-inclusive resorts in Mexico, the Dominican Republic, and Jamaica, for a purchase price of $13.50 per share, or an enterprise value of approximately $2.6 billion, including approximately $900 million of debt, net of cash acquired.
Playa Real Estate Transaction
On December 30, 2025, affiliates of the Company closed on the sale of the real estate portfolio previously acquired from Playa for approximately $2 billion to Tortuga Resorts ("Tortuga"), As previously disclosed, the Company sold one of these properties to a separate third-party buyer on September 18, 2025 for $22 million. Between the completion of the earlier sale and the Tortuga transaction, Hyatt has sold the entire Playa real estate portfolio for a total of $2 billion. Hyatt and Tortuga entered into 50-year management agreements for 13 of 14 properties in the portfolio, with terms consistent with Hyatt's existing all-inclusive fee structure. The remaining property is subject to a separate contractual arrangement.
RevPAR
RevPAR is the product of the ADR and the average daily occupancy percentage. RevPAR does not include non-room revenues, which consist of ancillary revenues generated by a property, such as food and beverage, parking, and other guest service revenues. Our management uses RevPAR to identify trend information with respect to room revenues from comparable properties and to evaluate property performance on a geographical and segment basis. RevPAR is a commonly used performance measure in our industry.
RevPAR changes that are driven predominantly by changes in occupancy have different implications for overall revenue levels and incremental profitability than do changes that are driven predominantly by changes in average room rates. For example, increases in occupancy at a property would lead to increases in room revenues and additional variable operating costs, including housekeeping services, utilities, and room amenity costs, and could also result in increased ancillary revenues, including food and beverage. In contrast, changes in average room rates typically have a greater impact on margins and profitability as average room rate changes result in minimal direct impacts to variable operating costs.
UVC Transaction
During the year ended December 31, 2024, we completed a restructuring of the entity that owns the Unlimited Vacation Club paid membership program business and sold 80% of the entity to an unrelated third party for $80 million. As a result of the transaction, we deconsolidated the entity as we no longer have a controlling financial interest, and we account for our remaining 20% ownership interest as an equity method investment in an unconsolidated hospitality venture. We continue to manage the Unlimited Vacation Club business under a long-term management agreement and license and royalty agreement. The operating results of the Unlimited Vacation Club business prior to the UVC Transaction are reported within our distribution segment.