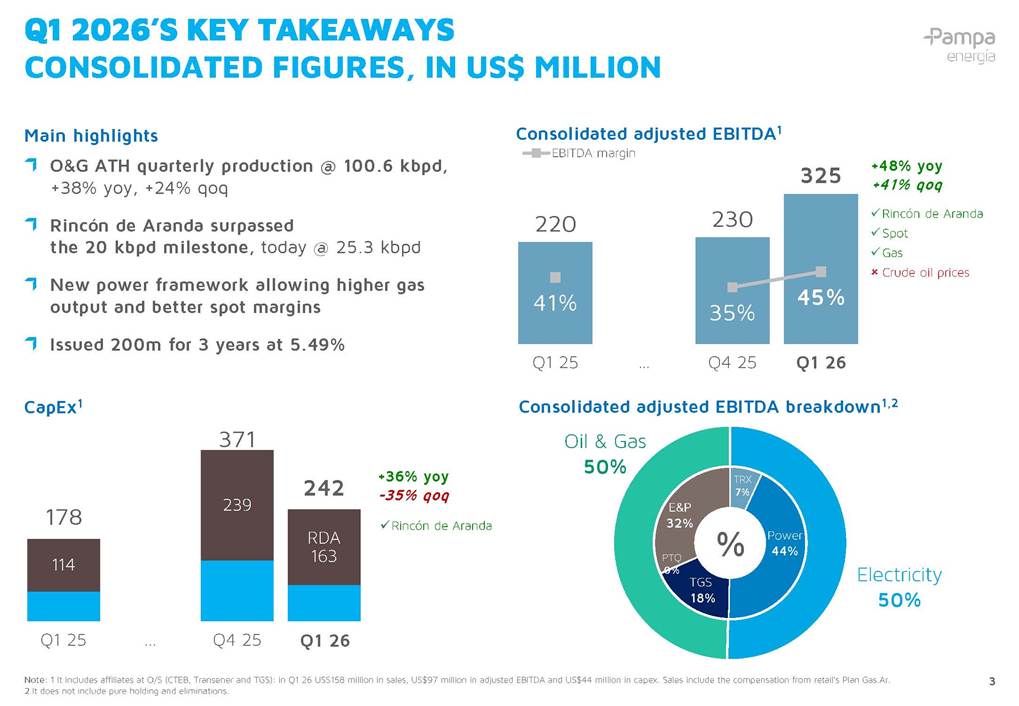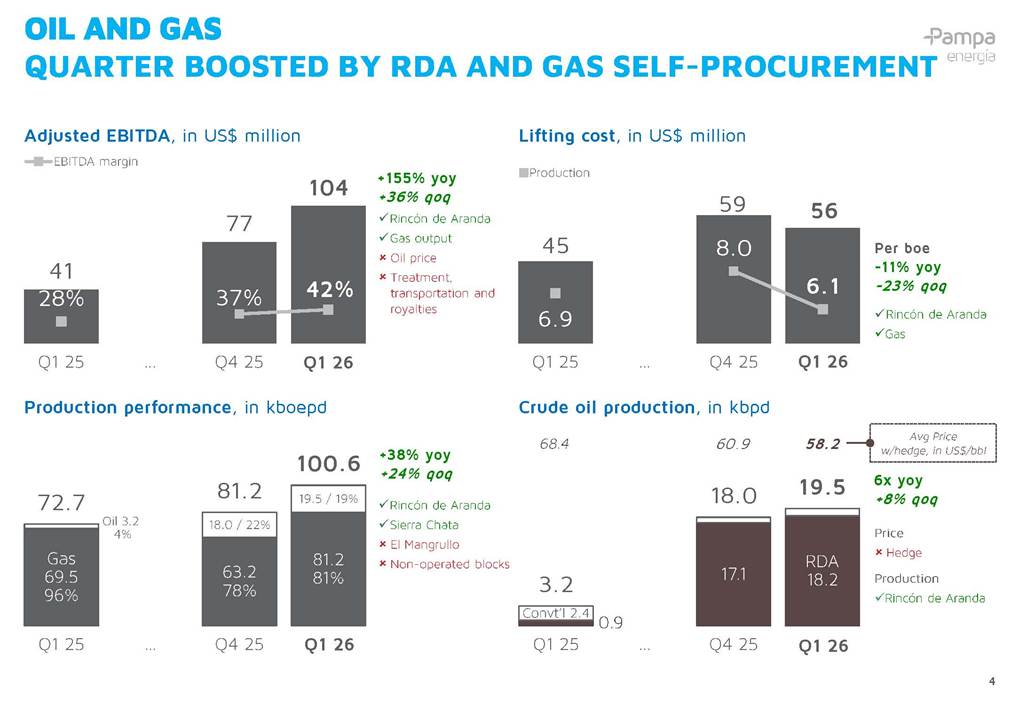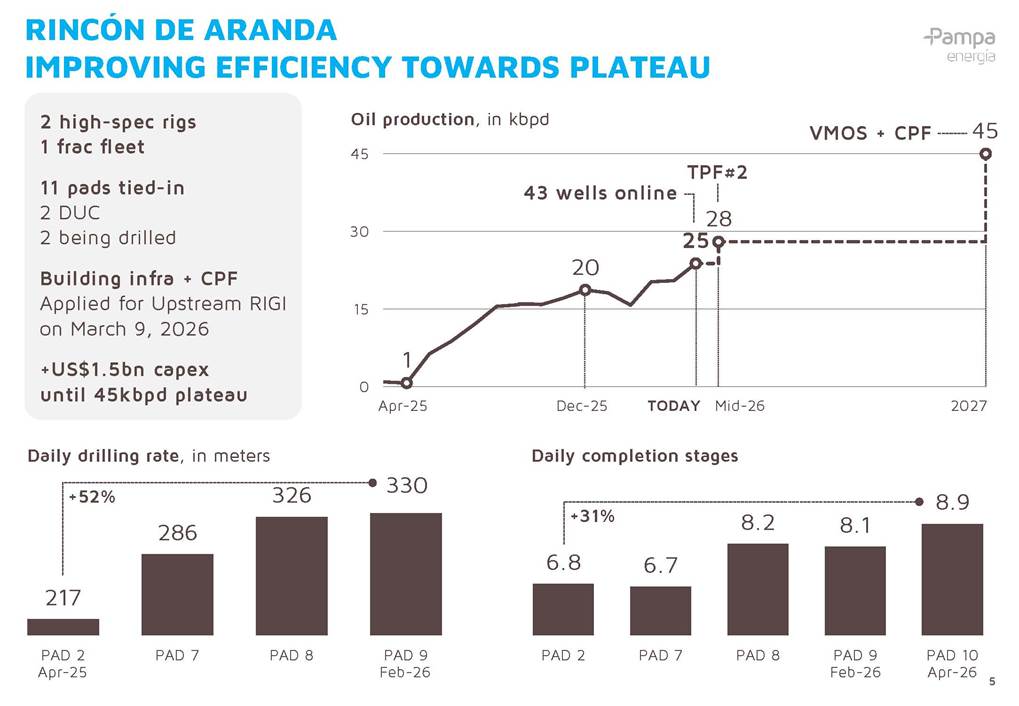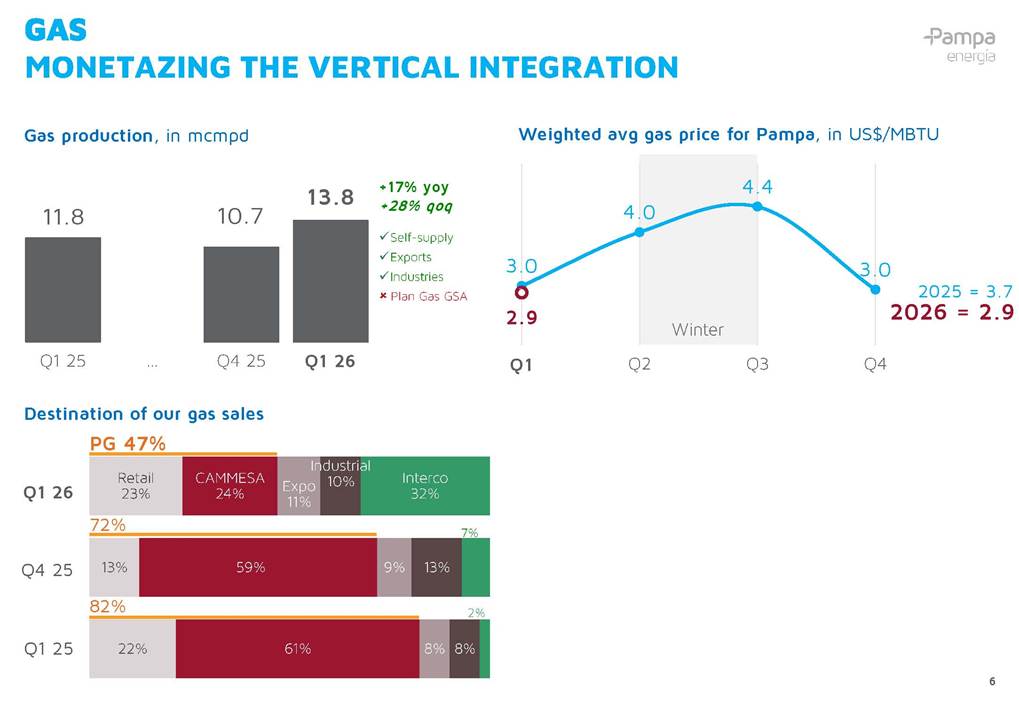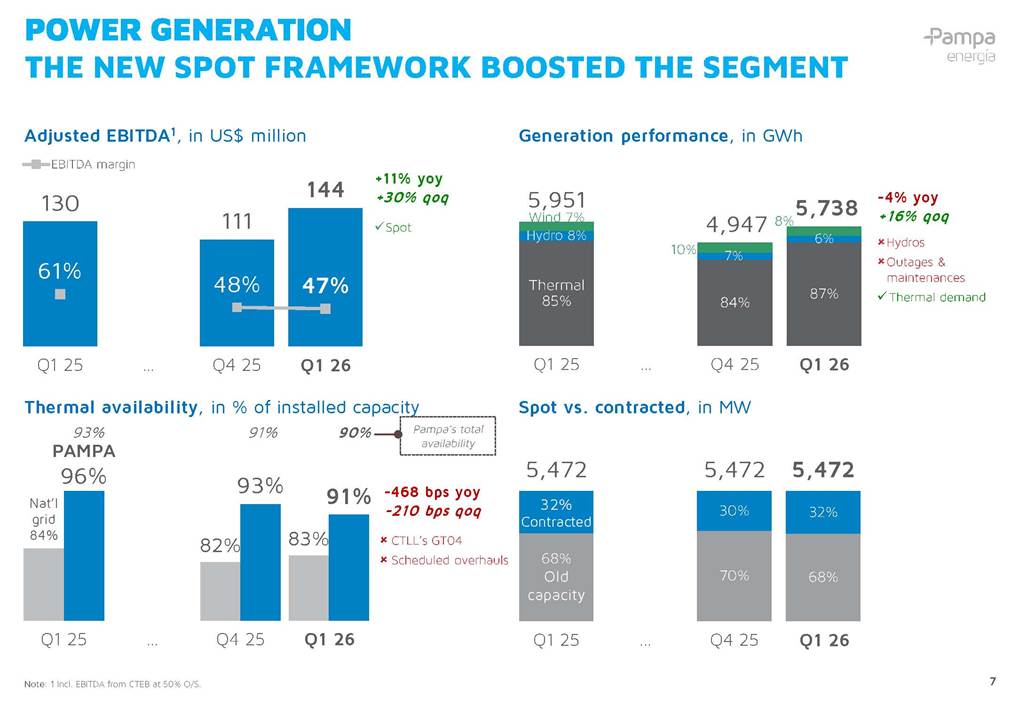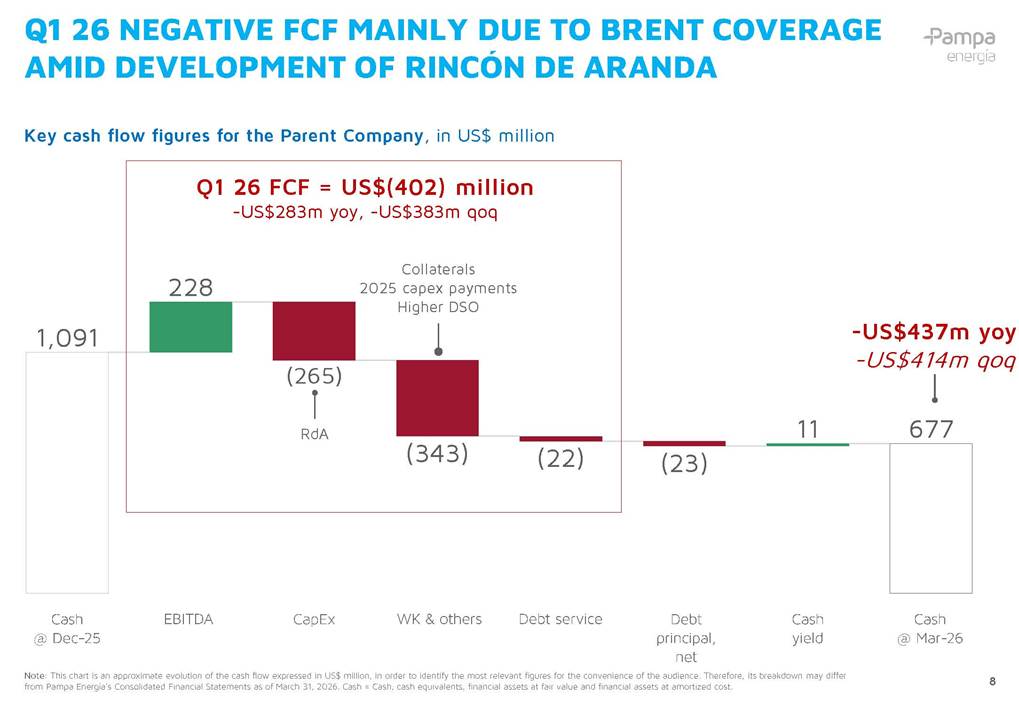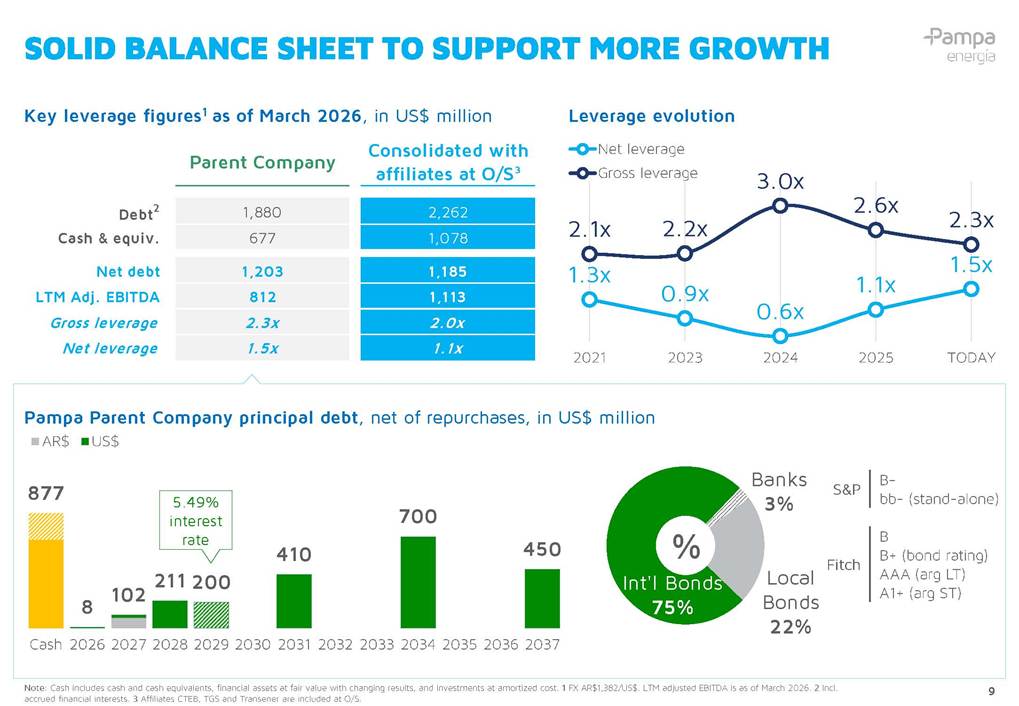
Q1 2026 May 7, 2026 @ 10:00 AM EST/11:00 AM ART RESULTS CALL ThematerialthatfollowsisapresentationofgeneralbackgroundinformationaboutPampaEnergíaS.A.(“Pampa”orthe“Company”)asofthedateofthepresentation.Itisinformationinsummaryformanddoesnotpurporttobecomplete.Itisnotintendedtoberelieduponasadvicetopotentialinvestors.Thispresentationisstrictlyconfidentialandmaynotbedisclosedtoanyotherperson.Norepresentationorwarranty,expressorimplied,ismadeconcerning,andnorelianceshouldbeplacedon,theaccuracy,fairness,orcompletenessoftheinformationpresentedherein. Thispresentationcontainsinformationandstatementsthatareforward-lookingwithinthemeaningofSection27AoftheU.S.SecuritiesActof1933,asamended(the'SecuritiesAct')andSection21EoftheU.S.SecuritiesExchangeActof1934,asamended.Forward-lookingstatementsarestatementsthatarenothistoricalfacts.Thesestatementsareonlypredictionsbasedonourcurrentassumptions,expectationsandprojectionsaboutfutureevents.Forward-lookingstatementsmaybeidentifiedbythewords'believe','expect','anticipate','target',orsimilarexpressions.WhilePampa'smanagementbelievesthattheexpectationsreflectedinsuchforward-lookingstatementsarereasonable,investorsarecautionedthatforward-lookinginformationandstatementsaresubjecttovariousrisksanduncertainties,manyofwhicharedifficulttopredictandaregenerallybeyondthecontrolofPampa,whichcouldcauseactualresultsanddevelopmentstodiffermateriallyfromthoseexpressedin,orimpliedorprojectedby,theforward-lookinginformationandstatements.Theserisksanduncertaintiesinclude,butarenotlimitedto,changingbusiness,regulatory,politicalorothermarketconditionsinArgentinaandelsewhere,thecompletionofournewgenerationprojects,thecompletionofourdistributionandtransmissionsubsidiaries'tariffrevisionprocess,theprospectsforgrowthanticipatedbyourmanagement,andtheotherrisksanduncertaintiesdiscussedinourreportsandotherdocumentsfiledwiththeU.S.SecuritiesandExchangeCommission.Further,Pampaundertakesnoobligationtopubliclyupdateitsforward-lookingstatements,whetherasaresultofnewinformation,futureevents,orotherwise,normakesanyrepresentationorwarranty,expressedorimplied,astotheaccuracyorcompletenessoftheinformationcontainedherein,andnothingcontainedhereinis,orshallberelieduponasapromiseorrepresentationthatanysuchforwardlookingstatementswillbeachieved.Managementisnotmakingandyoushouldnotinferanyrepresentationaboutthelikelyexistenceofanyparticularfuturesetoffactsorcircumstances Thispresentationdoesnotconstituteanoffer,orinvitation,orsolicitationofanoffer,tosubscribefororpurchaseanysecurities.Neitherthispresentationnoranythingcontainedhereinshallformthebasisofanycontractorcommitmentwhatsoever.SecuritiesmaynotbeofferedorsoldintheUnitedStatesunlesstheyareregisteredorexemptfromregistrationundertheSecuritiesAct.AnyofferingofsecuritiestobemadeintheUnitedStateswillbemadebymeansofaprospectusorofferingpreparedinconnectionwithanysuchoffering Unlessotherwiseindicated,thecalculationoftheincomestatementfiguresinUS$isderivedfromthesumof:1PampaEnergiaS.A.stand-alonefinancialresultsintransactionalUS$,2powergenerationandothersubsidiariesfinancialresultsintransactionalUS$,and3thefinancialresultsofTransenerandTGS(holdingandotherssegment)affiliatesexpressedinArgentinepesosdividedbytheexchangerateattheendofperiod. ConversionsfromlocalcurrencyreportingtoUS$shouldnotbeconsideredrepresentationsthatanysuchamountshavebeen,couldhavebeenorcouldbeconvertedintoUS$atthatoratanyotherFX.Moreover,asaresultoffluctuationsintheUS$toAR$exchangerate,theexchangerateusedintheconversionmaynotbeindicativeofcurrentorfutureexchangerates. DISCLAIMER 2 114 239 RDA 163 178 371 242 Q1 25 … Q4 25 Q1 26 220 230 325 41% 35% 45% 0% 10% 20% 30% 40% 50% 60% 70% 80% 90% 100% - 50 100 150 200 250 300 350 Q1 25 … Q4 25 Q1 26 EBITDA margin Consolidated adjusted EBITDA1 Consolidated adjusted EBITDA breakdown1,2 CapEx1 Q1 2026’S KEY TAKEAWAYSCONSOLIDATED FIGURES, IN US$ MILLION 3 Oil & Gas 50% Electricity 50% Power 44% Note:1ItincludesaffiliatesatO/S(CTEB,TransenerandTGS):inQ126US$158millioninsales,US$97millioninadjustedEBITDAandUS$44millionincapex.Salesincludethecompensationfromretail’sPlanGas.Ar.2Itdoesnotincludepureholdingandeliminations. % Q1 26 Q1 26 +36% yoy -35% qoq ✓ Rincón de Aranda +48% yoy +41% qoq ✓ Rincón de Aranda ✓ Spot ✓ Gas Crude oil prices TGS 18% TRX 7% E&P 32% Main highlights O&G ATH quarterly production @ 100.6 kbpd, +38% yoy, +24% qoq Rincón de Aranda surpassed the 20 kbpd milestone, today @ 25.3 kbpd New power framework allowing higher gas output and better spot margins Issued 200m for 3 years at 5.49% PTQ 0% 0.9 17.1 RDA 18.2 Convt’l 2.4 3.2 18.0 19.5 - 5.0 10.0 15.0 20.0 25.0 Q1 25 … Q4 25 Gas 69.5 96% 63.2 78% 81.2 81% Oil 3.2 4% 18.0 / 22% 72.7 81.2 19.5 / 19% 100.6 - 20.0 40.0 60.0 80.0 100.0 120.0 Q1 25 … Q4 25 Q1 26 45 59 56 6.9 8.0 6.1 4.5 5.5 6.5 7.5 8.5 9.5 10.5 11.5 20 25 30 35 40 45 50 55 60 65 Q1 25 … Q4 25 Q1 26 Production 41 77 104 28% 37% 42% 0% 20% 40% 60% 80% 100% 120% 140% 160% 180% 200% - 20 40 60 80 100 120 Q1 25 … Q4 25 Q1 26 EBITDA margin Lifting cost, in US$ million Crude oil production, in kbpd Adjusted EBITDA, in US$ million Production performance, in kboepd OIL AND GASQUARTER BOOSTED BY RDA AND GAS SELF-PROCUREMENT 4 ✓ Rincón de Aranda ✓ Sierra Chata El Mangrullo Non-operated blocks +155% yoy +36% qoq Per boe -11% yoy -23% qoq +38% yoy +24% qoq Q1 26 58.2 Avg Price w/hedge, in US$/bbl Price Hedge Production ✓ Rincón de Aranda 6x yoy +8% qoq 68.4 Q1 26 Q1 26 60.9 ✓ Rincón de Aranda ✓ Gas Q1 26 ✓ Rincón de Aranda ✓ Gas output Oil price Treatment, transportation and royalties 2 high-spec rigs 1 frac fleet 11 pads tied-in2 DUC2 being drilled Building infra + CPFApplied for Upstream RIGI on March 9, 2026 +US$1.5bn capex until 45kbpd plateau 1 20 25 28 45 0 15 30 45 217 286 326 330 PAD 2 PAD 7 PAD 8 PAD 9 Oil production, in kbpd RINCÓN DE ARANDA IMPROVING EFFICIENCY TOWARDS PLATEAU VMOS + CPF TPF#2 Apr-25 Dec-25 Mid-26 2027 43 wells online 6.8 6.7 8.2 8.1 8.9 PAD 2 PAD 7 PAD 8 PAD 9 PAD 10 Daily drilling rate,in meters Daily completion stages TODAY Apr-25 Feb-26 Apr-26 +52% +31% 5 Feb-26 Retail 23% 13% 22% CAMMESA 24% 59% 61% Expo 11% 9% 8% Industrial 10% 13% 8% Interco 32% 7% 2% Winter 3.0 4.0 4.4 3.0 2.9 2.0 2.5 3.0 3.5 4.0 4.5 5.0 Q2 Q3 Q4 11.8 10.7 13.8 - 2.0 4.0 6.0 8.0 10.0 12.0 14.0 16.0 Q1 25 … Q4 25 Q1 26 Weighted avg gas price for Pampa, in US$/MBTU 2025 = 3.7 2026 = 2.9 Destination of our gas sales Gas production, in mcmpd GASMONETAZING THE VERTICAL INTEGRATION 6 +17% yoy +28% qoq Q4 25 Q1 26 Q1 25 Q1 26 ✓ Self-supply ✓ Exports ✓ Industries Plan Gas GSA Q1 82% 72% PG 47% 68% Old capacity 70% 68% 32% Contracted 30% 32% 5,472 5,472 5,472 0 1,000 2,000 3,000 4,000 5,000 6,000 Q1 25 … Q4 25 Q1 26 Nat’l grid 84% 82% 83% PAMPA 96% 93% 91% 70% 75% 80% 85% 90% 95% 100% Q1 25 … Q4 25 Q1 26 Thermal 85% 84% 87% Hydro 8% 7% 6% Wind 7% 10% 8% 5,951 4,947 5,738 - 1,000 2,000 3,000 4,000 5,000 6,000 7,000 Q1 25 … Q4 25 Q1 26 130 111 144 61% 48% 47% 10% 30% 50% 70% 90% 110% 130% 150% - 20 40 60 80 100 120 140 160 Q1 25 … Q4 25 Q1 26 EBITDA margin Generation performance, in GWh Spot vs. contracted, in MW Adjusted EBITDA1, in US$ million POWER GENERATION THE NEW SPOT FRAMEWORK BOOSTED THE SEGMENT 7 Q1 26 Q1 26 Note:1Incl.EBITDAfromCTEBat50%O/S. +11% yoy +30% qoq -4% yoy +16% qoq ✓ Spot Hydros Outages & maintenances ✓ Thermal demand -468 bps yoy -210 bps qoq CTLL’s GT04 Scheduled overhauls Thermal availability, in % of installed capacity Q1 26 90% Pampa’s total availability 93% 91% Q1 26 1,091228(343)(22)(23)11677(265)1234567802004006008001,0001,2001,400 Key cash flow figures for the Parent Company, in US$ million Q1 26 NEGATIVE FCF MAINLY DUE TO BRENT COVERAGE AMID DEVELOPMENT OF RINCÓN DE ARANDA 8 Note: This chart is an approximate evolution of the cash flow expressed in US$ million, in order to identify the most relevant figures for the convenience of the audience. Therefore, its breakdown may differ from Pampa Energía’s Consolidated Financial Statements as of March 31, 2026. Cash = Cash, cash equivalents, financial assets at fair value and financial assets at amortized cost. Q1 26 FCF = US$(402) million -US$283m yoy, -US$383m qoq -US$437m yoy -US$414m qoq Cash @ Dec-25 EBITDA CapEx WK & others Debt principal, net Debt service Cash @ Mar-26 Cash yield RdA Collaterals 2025 capex payments Higher DSO Key leverage figures1 as of March 2026, in US$ million Pampa Parent Company principal debt, net of repurchases, in US$ million SOLID BALANCE SHEET TO SUPPORT MORE GROWTH 9 Note: Cash includes cash and cash equivalents, financial assets at fair value with changing results, and investments at amortizedcost. 1FX AR$1,382/US$. LTM adjusted EBITDA is as of March 2026. 2Incl. accrued financial interests. 3Affiliates CTEB, TGS and Transener are included at O/S. Leverage evolution S&P B- bb-(stand-alone) Fitch B B+ (bond rating) AAA (argLT) A1+ (argST) 1.3x 0.9x 0.6x 1.1x 1.5x 2.1x 2.2x 3.0x 2.6x 2.3x 2021 2023 2024 2025 TODAY Net leverage Gross leverage 877 8 102 211 200 410 700 450 Cash 2026 2027 2028 2029 2030 2031 2032 2033 2034 2035 2036 2037 AR$ US$ 5.49% interest rate Local Bonds 22% Int'l Bonds 75% Banks 3% % Parent CompanyConsolidated with affiliates at O/S3Debt21,8802,262Cash & equiv.6771,078Net debt1,2031,185LTM Adj. EBITDA8121,113Gross leverage2.3x2.0xNet leverage1.5x1.1x THANK YOU Q&A