Free Writing Prospectus Filed Pursuant to Rule 433 Registration Statement No. 333-220930 Dated October 30, 2017 Initial Public Offering NASDAQ: CBTX

Free Writing Prospectus Filed Pursuant to Rule 433 Registration Statement No. 333-220930 Dated October 30, 2017 Initial Public Offering NASDAQ: CBTX

Offering Disclosure CBTX, Inc. (the “Company”, “CBTX”, or “we”) has filed a registration statement (including a prospectus, which is preliminary and subject to completion) with the U.S. Securities and Exchange Commission (the “SEC”) for the offering to which this communication relates. Before you invest, you should read the prospectus in that registration statement and other documents the Company has filed with the SEC for more complete information about the Company and the offering. You may get these documents for free by visiting EDGAR on the SEC website at www.sec.gov. Alternatively, the Company, any underwriter or any dealer participating in the offering will arrange to send you the prospectus if you request it by contacting Stephens Inc., toll-free at (800) 643-9691 or by emailing prospectus@stephens.com or Keefe, Bruyette & Woods, Inc., toll-free at (800) 966-1559 or by emailing kbwsyndicatedesk@kbw.com. The Company is not soliciting an offer to buy securities in any jurisdiction where the offer or sale is not permitted. This presentation includes industry and trade association data, forecasts and information that we have prepared based, in part, upon data, forecasts and information obtained from independent trade associations, industry publications and surveys, government agencies and other information publicly available to us, which information may be specific to particular markets or geographic locations. Some data is also based on our good faith estimates, which are derived from management’s knowledge of the industry and independent sources. Industry publications and surveys and forecasts generally state that the information contained therein has been obtained from sources believed to be reliable. Statements as to our market position are based on market data currently available to us. Although we believe these sources are reliable, we have not independently verified the information. While we are not aware of any misstatements regarding our industry data presented herein, our estimates involve risks and uncertainties and are subject to change based on various factors. Similarly, we believe our internal research is reliable, even though such research has not been verified by any independent sources. Neither the SEC nor any state securities commission has approved or disapproved of the securities of the Company or passed upon the accuracy or adequacy of this presentation. Any representation to the contrary is a criminal offense. Except as otherwise indicated, this presentation speaks as of the date hereof. The delivery of this presentation shall not, under any circumstances, create any implication that there has been no change in the affairs of the Company after the date hereof. Our common stock is not a deposit or savings account. Our common stock is not insured by the Federal Deposit Insurance Corporation or any governmental agency or instrumentality. This presentation (and oral statements made regarding the subject of this presentation) contains certain “forward-looking statements” that are based on various facts and derived utilizing numerous important assumptions and are subject to known and unknown risks, uncertainties and other factors that may cause our actual results, performance or achievements to be materially different from any future results, performance or achievements expressed or implied by such forward-looking statements. Forward-looking statements include the information concerning our preliminary financial results as of and for the three and nine months ended September 30, 2017, our future financial performance, business and growth strategy, projected plans and objectives, as well as projections of macroeconomic and industry trends, which are inherently unreliable due to the multiple factors that impact economic trends, and any such variations may be material. Statements preceded by, followed by or that otherwise include the words “believes,” “expects,” “anticipates,” “intends,” “projects,” “estimates,” “plans” and similar expressions or future or conditional verbs such as “will,” “should,” “would,” “may” and “could” are generally forward-looking in nature and not historical facts, although not all forward-looking statements include the foregoing. Forward-looking statements are based on management’s current expectations and involve risks and uncertainties that could cause actual results to differ materially from the Company’s historical results or those described in our forward-looking statements. This presentation contains non-GAAP financial measures, including tangible equity and tangible book value per share. The non-GAAP financial measures that we discuss in this presentation should not be considered in isolation or as a substitute for the most directly comparable or other financial measures calculated in accordance with GAAP. A reconciliation of the non-GAAP financial measures used in this presentation to the most directly comparable GAAP measures is provided in the Appendix to this presentation. 2
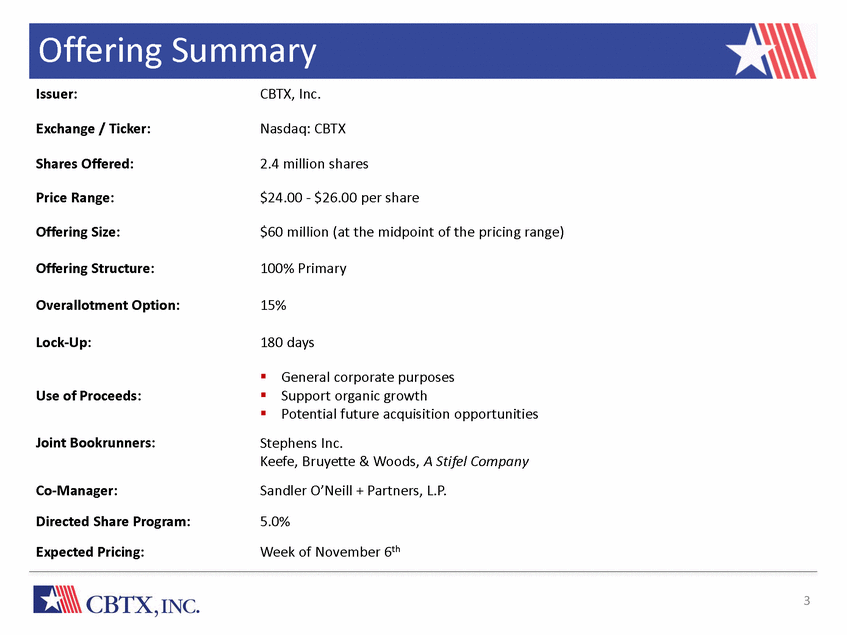
Offering Issuer: Summary CBTX, Inc. Exchange / Ticker: Nasdaq: CBTX Shares Offered: 2.4 million shares Price Range: $24.00 - $26.00 per share Offering Size: $60 million (at the midpoint of the pricing range) Offering Structure: 100% Primary Overallotment Option: 15% Lock-Up: 180 days General corporate purposes Support organic growth Potential future acquisition opportunities Use of Proceeds: Joint Bookrunners: Stephens Inc. Keefe, Bruyette & Woods, A Stifel Company Sandler O’Neill + Partners, L.P. 5.0% Week of November 6th Co-Manager: Directed Share Program: Expected Pricing: 3
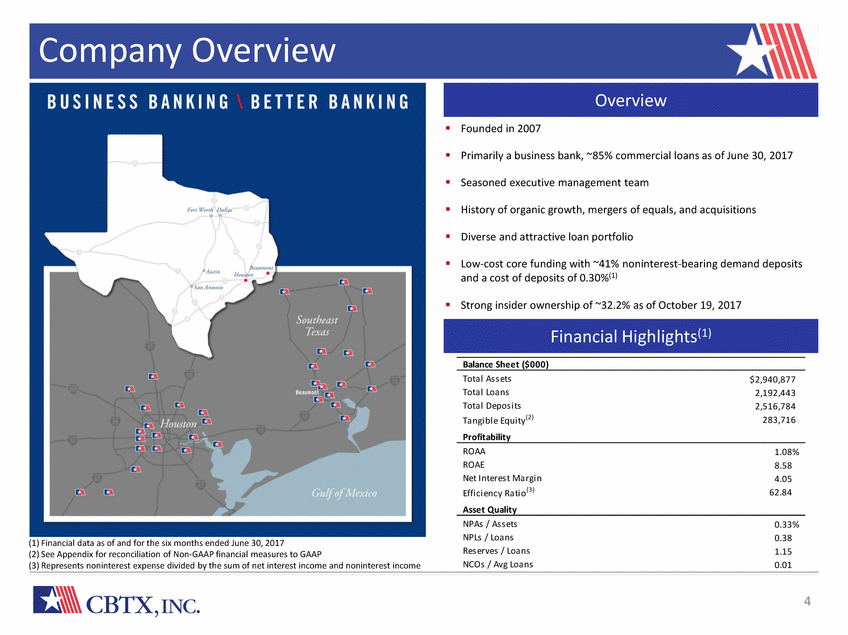
Company Overview Founded in 2007 Primarily a business bank, ~85% commercial loans as of June 30, 2017 Seasoned executive management team History of organic growth, mergers of equals, and acquisitions Diverse and attractive loan portfolio Low-cost core funding with ~41% noninterest-bearing demand deposits and a cost of deposits of 0.30%(1) Strong insider ownership of ~32.2% as of October 19, 2017 Balance Sheet ($000) Tota l As s ets Tota l Loa ns Tota l Depos i ts Ta ngi bl e Equi ty(2) $2,940,877 2,192,443 2,516,784 283,716 Profitability ROAA ROAE Net Interes t Ma rgi n Effi ci ency Ra ti o(3) 1.08% 8.58 4.05 62.84 Asset Quality NPAs / As s ets NPLs / Loa ns Res erves / Loa ns NCOs / Avg Loa ns 0.33% 0.38 1.15 0.01 (1) Financial data as of and for the six months ended June 30, 2017 (2) See Appendix for reconciliation of Non-GAAP financial measures to GAAP (3) Represents noninterest expense divided by the sum of net interest income and noninterest income 4 Financial Highlights(1) Overview
Company Highlights Bob Franklin, Chairman of the Board, CEO and 36-year banking veteran, leads a 10 person executive committee with an average of 38 years of banking experience 34 strategically located branches give the bank a material presence in the expansive Houston and Beaumont markets Sophisticated banking products of a large financial institution with the personalized service of a community bank Key emphasis on developing core loan and deposit relationships led by bankers who support clients through tailored financial solutions Growing, low-cost, core deposit franchise with robust treasury services Conservative credit culture Proven acquirer and integrator – disciplined approach Potential for increased profitability – platform and team with significant scalability and an asset-sensitive balance sheet Significant scarcity value – largest community bank focused on the Houston and Beaumont markets 5
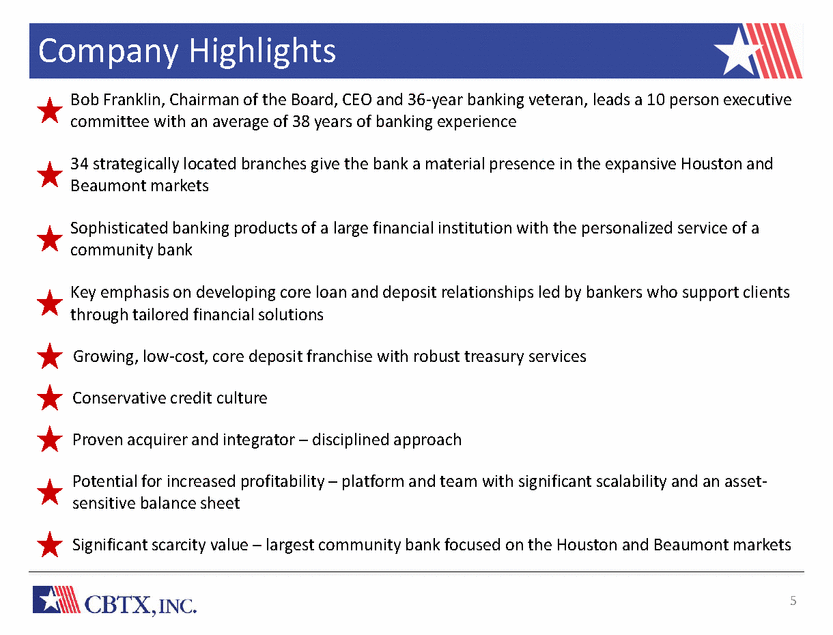
Leadership Team Executive committee consists of 10 highly qualified bankers with an average of 38 years of banking experience Four regional CEOs, with an average of 27 years of banking experience, oversee loan and deposit production and performance goals for their markets Robert “Bob” Franklin, Jr. Chairman of the Board and CEO 10 36 36 Travis Jaggers President 6 45 45 Joe West SEVP and Chief Credit Officer 10 39 39 Donna Dillon SEVP and Chief Administrative Officer 9 33 40 Tracy O’Neill SEVP and Chief HR Officer 2 10 10 Phil Davis EVP and SW Regional CEO 10 28 32 Gary Englert EVP and NE Regional CEO 9 37 37 6 Average – Executive Committee 7 31 38 Average – Regional CEOs 9 26 27 Total 102 411 480 Chris BezdekEVP and SE Regional CEO51515 Brandon BurkEVP and NW Regional CEO102222 Allen GageSEVP and Special Projects24353 Deborah DinsmoreSEVP and Chief Information Officer23232 James L. “Jim” SturgeonSEVP and Chief Risk Officer102240 Robert “Ted” Pigott, Jr.SEVP and Chief Financial Officer71635 J. Pat ParsonsVice Chairman of the Board103344 Officer Title Years at Company Years in Market Years in Industry
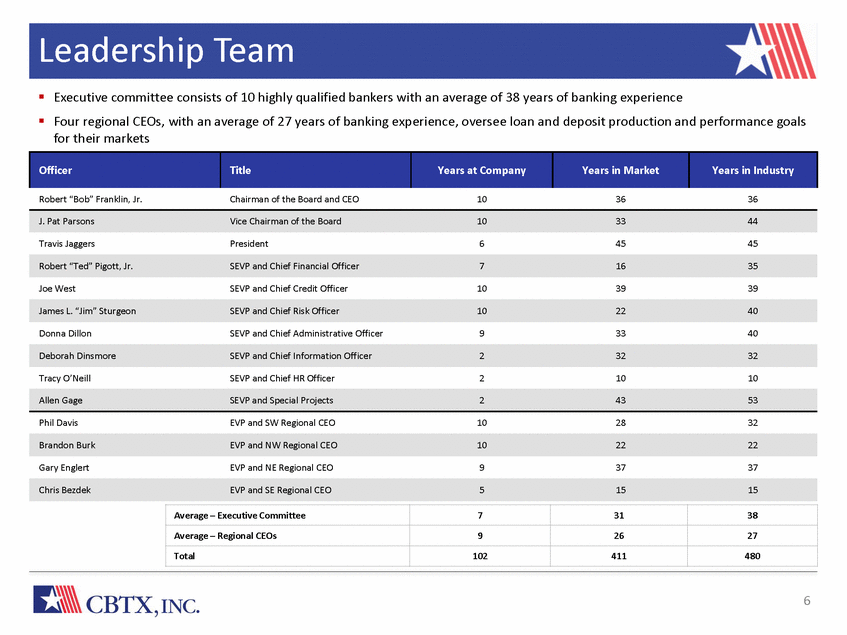
Franchise Expansion 2009 2011 2013 2015 (1) On September 14, 2017, the Company sold the real estate associated with the Deweyville, Texas branch. The branch is expected to close on December 18, 2017. 7 County Acquisition (6) Non-Acquired/De Novo (14) Crosby Acquisition (6) VB Texas MOE (6) MC Bancshares Acquisition (2) Closed/Sold Branches (5)(1) July 2013: VB Texas, Inc. (Vista Bank Texas) • • • • : s Bank, SSB m in assets of ed Sturge eadership team July 2012: Pasadena Branch • Hired Travis Jaggers as President (Dec. ’11) • Built a new facility in Pasadena (July ’12) • Hired team of experienced lenders • Loans: $115mm as of 6/30/17 • Deposits: $193mm as of 6/30/17 equals with VB Texas, Inc. presence in southwest Houston on, CEO of Founders Bank, joined VB February 2015: MC Bancshares, Inc. (Memorial City Bank) • $268mm in assets • Acquired 2 locations near north-south artery in west Houston • Acquired healthcare-focused lending practice May 2015: The Woodlands Branch • Hired new lending team in fast-growing north Houston community • Loans: $54mm as of 6/30/17 • Deposits: $34mm as of 6/30/17 May 2014: Westchase Branch • Hired new lending team in strategic business district in west Houston • Loans: $95mm as of 6/30/17 • Deposits: $44mm as of 6/30/17 $665mm in assets Merger of equals 7 locations in west Houston Robert Franklin and others from Vista Bank’s leadership joined our Bank’s leadership team December 2008: Crosby Bancshares, Inc. (Crosby State Bank) • $439mm in assets • 8 branch locations in east Houston August 2007: County Bancshares, Inc. County Bank, N.A. • $130mm in assets • Initial acquisition and relocation to Beaumont July 2011 Founder • $124m • Merger • Expand • Jim Texas’ l
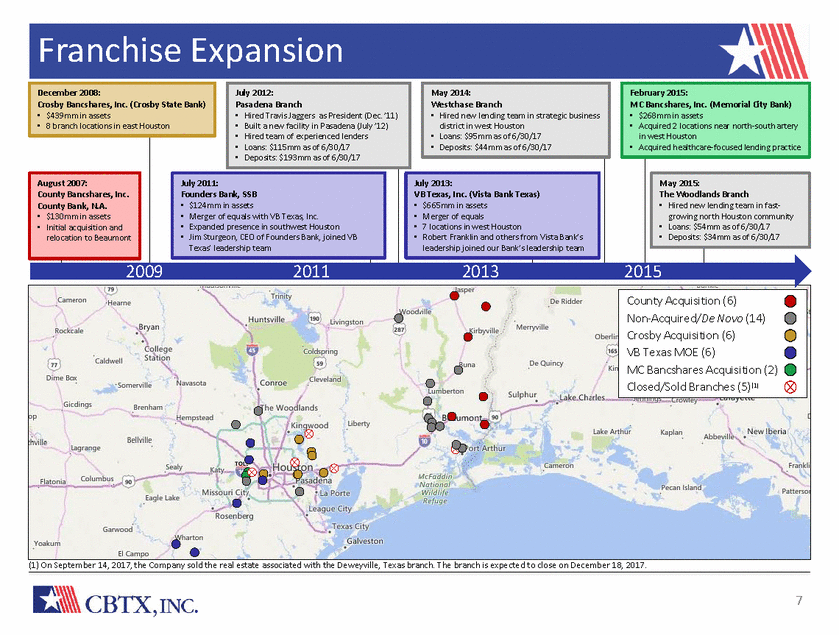
Growth & Transformation Total Assets ROAA (%) 1.08% 0.94% 0.90% 2009 2010 2011 2012 2013 2014 2015 2016 YTD 6/30/17 Beaumont Houston 28.6% 25.8% 41.4% 58.6% 74.2% 71.4% 2009 Note: Figures reflect as of year-end 12/31, with exception of year-to-date data as of 6/30/2017 2013 6/30/17 8 Transformation of Loan Portfolio $2,883 0.85% $2,952 $2,941 $2,629 0.74% 0.59%0.60% $2,451 0.65% $1,711 $1,450 $1,514 $1,252 0.16% Asset and Earnings Growth ($ in Millions)
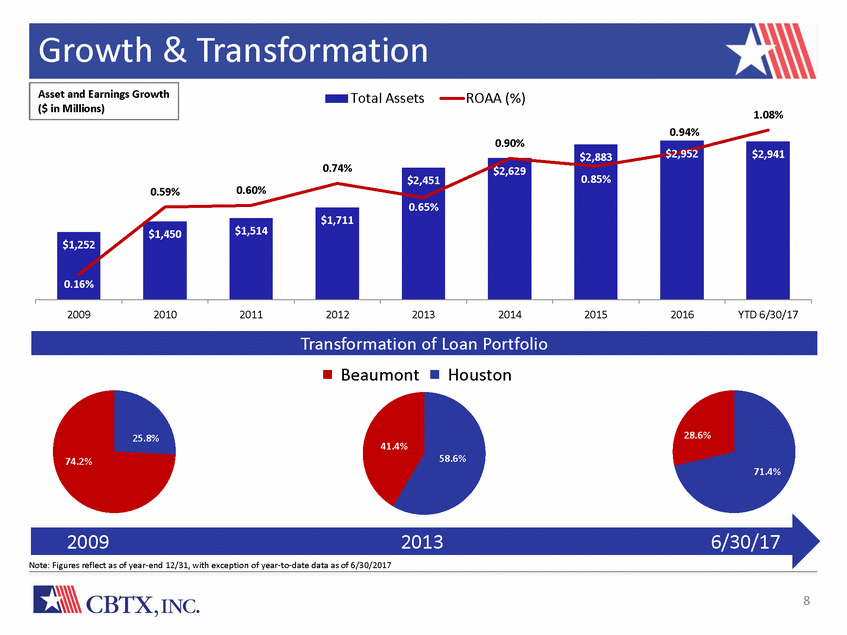
Attractive, Low-Cost Core Deposit Base Proven ability to generate low-cost core deposits to fund loan growth – 87% loan to deposit ratio(1) Business banking focus combined with relationship approach results in: – – 41% noninterest-bearing demand deposits 93% core deposits(2) with minimal reliance on time deposits(1) Attractive cost of deposits of 0.30% 83% of loan customers also have a deposit relationship as of June 30, 2017 Core deposit mix has remained stable while significantly increasing in size 2012 2013 2014 2015 2016 6/30/17 – – Note: Figures reflect as of year-end 12/31, with exception of year-to-date as of 6/30/2017 Noninterest-Bearing DemandOther Core Deposits Jumbo Time Deposits – Expanded treasury services team – Active customer calling effort (1) Financial data as of and for the six months ended June 30, 2017 (2) Core deposits defined as total deposits less jumbo time deposits (time deposits over $100,000) 9 Deposit Base As of June 30, 2017 ($000s)(%) Noninterest Bearing Demand$ 1,030,86541.0 % Interest-Bearing Demand Accounts343,82613.7 Savings & Money Market Accounts786,62931.3 Certificates and Other Time > $100K182,1437.2 Certificates and Other Time < $100K173,3216.9 Total Deposits$ 2,516,784100.0 % Cost of Deposits (%)0.30 % 9.3% 9.3% 8.4% 8.2% 7.1% 7.2% 52.5% 51.8% 52.1% 51.7% 48.6% 49.4% 43.0% 42.4% 40.4% 41.0% 38.6% 39.0% Stable Core Deposit Base

Diversified Loan Portfolio Commercial loans represent approximately 85% of total loans as of June 30, 2017 Core focus on lending to professionals and local small and mid-sized businesses 2012 2013 2014 2015 2016 6/30/17 Key emphasis on developing core relationships Total Commercial Loans Total 1-4 Family Residential, Consumer, Agriculture and Other Loans History of hiring experienced teams of bankers Maintained well-diversified loan portfolio with commercial focus (1) Figures reflect as of year-end 12/31, with exception of year-to-date data as of 6/30/2017 10 Loan Portfolio As of June 30, 2017 ($000s) (%) Commercial and Industrial $ 535,116 24.4 % Commercial Real Estate and Multi-Family 898,266 40.9 Construction and Development 433,966 19.8 1-4 Family Residential 240,073 10.9 Consumer, Agriculture and Other 90,017 4.0 Gross Loans $ 2,197,438 100.0 % Less Deferred Fees and Unearned Discount 4,436 Less Loans Held for Sale 559 Total Loans $ 2,192,443 Yield on Loans (%) 4.83 % 15.7% 15.1% 16.1% 16.0% 15.1% 15.0% 84.3% 84.9% 83.9% 84.0% 84.9% 85.0% Loan Composition Over Time(1)
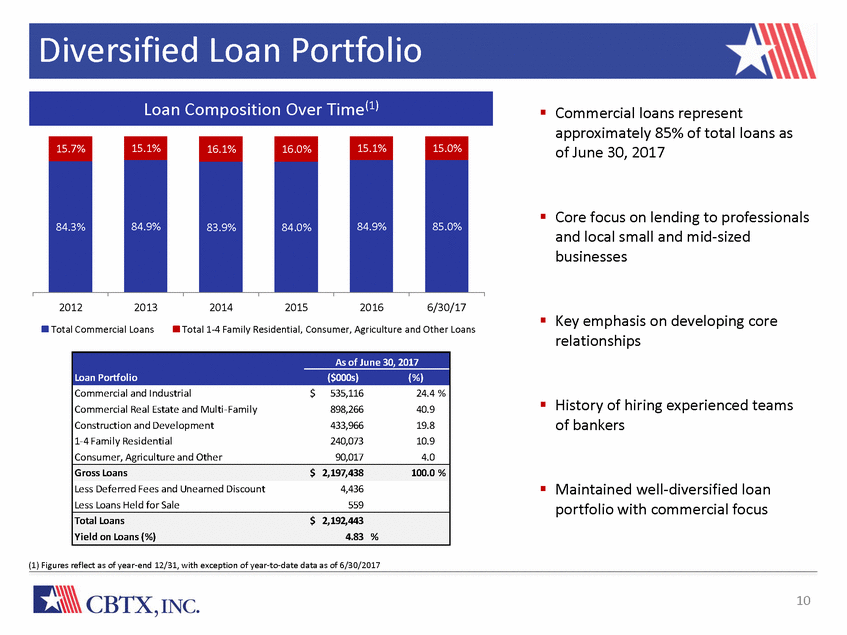
Core Focus on Commercial Loans Industrial Construction/Equipment Rental - Provide operating lines of credit, fixed asset financing and real estate loans to numerous industrial companies involved in the construction, modification, support and maintenance of petrochemical plants Industrial Construction Manufacturing Multifamily 11.2% 4.3% 3.2% Professional/Medical - Provide operating lines of credit, fixed asset financing and real estate loans to medical practices, clinics, law firms and professional service firms Equipment Rental 4.2% Professional / Medical 4.7% Multifamily - Multifamily CRE and multifamily construction portfolios are predominantly Texas based community development projects promoting affordable housing Owner Occupied CRE 19.6% Other Commercial & Industrial 12.3% Non-Owner Occupied CRE - Predominantly local investor projects (i.e. industrial, office and retail buildings with investors/developers whom have long term CBTX relationships) Construction 1-4 Family 4.4% Land & Land Development 6.8% Other Construction 5.6% Non Owner Occupied CRE 17.3% Owner Occupied CRE - Term financing of real estate facilities for businesses and clients Multifamily Construction 6.4% Note: Loan data as of 6/30/2017 and based on Company reports 11 Construction & Development ($434M) Commercial & Industrial ($535M) Commercial Real Estate (“CRE”) ($898M) Commercial Loans Outstanding by Type ($1.867B)
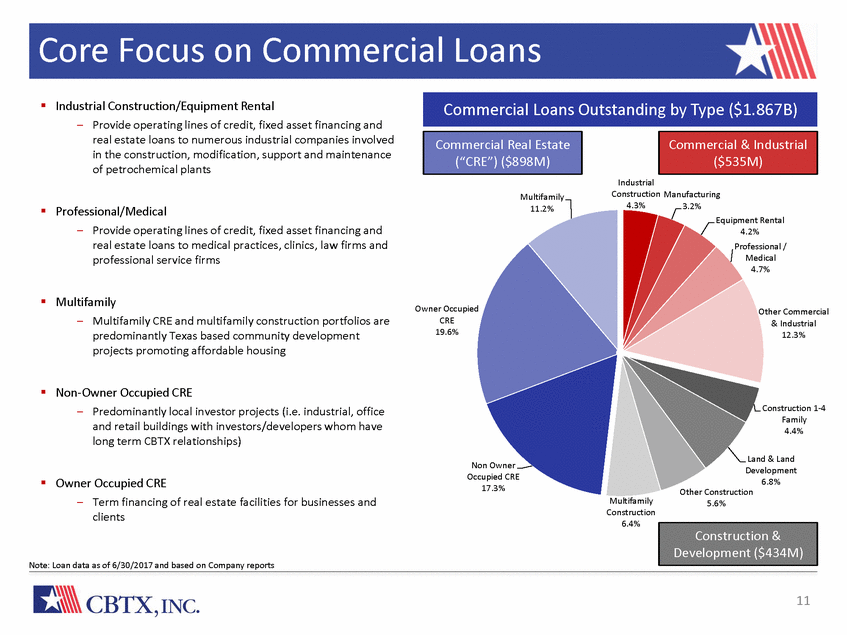
Strong Credit Culture Chief Credit Officer with 39 years experience - Seasoned Regional Credit Officers located in Houston and Beaumont Centralized underwriting, tiered approval requirements based on aggregate relationship size: - - Officer credit authority, credit executive committee, and directors’ loan committee Directors’ Loan Committees meet weekly in each market Receive personal guarantees from the principal, or principals, on the majority of commercial credits USA TX CBTX USATX CBTX 1.12% 3.36% 1.45% 1.49% 1.43% 1.50% 1.23% 0.33% 0.23% 0.19% 0.16% 0.38% 0.01% 2012 2013 2014 2015 2016 6/30/17 2012 2013 2014 2015 2016 6/30/17 Note: Figures reflect as of year-end 12/31, with exception of year-to-date as of 6/30/2017 Note: USA and TX figures based on SNL Financial aggregates for commercial banks 12 2.67% 2.36% 2.07% 1.12% 1.83% 1.71%1.57% 0.73% 0.29% 0.98% 0.66% 0.70% 0.40% 0.49% 0.43%0.46%0.47% 0.28% 0.17% 0.28% 0.15% 0.11% 0.32% Net Charge-Offs / Average Loans NPLs / Loans
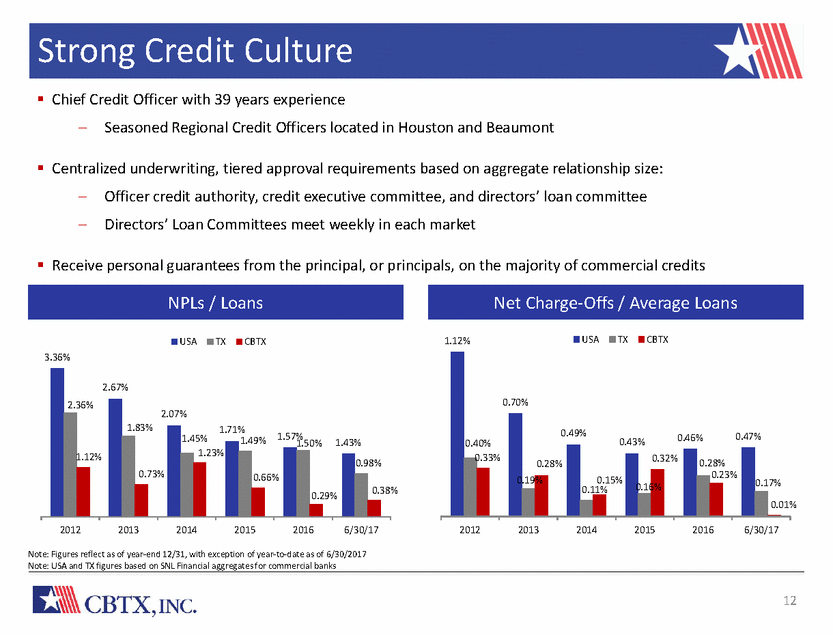
Revenue Growth & Efficiency Improvement Stable net interest margin Efficiency efforts: – Lender efficiency project – increased average loan portfolio per lender by 86% since 2012 Branch rationalization effort – successful and ongoing Investments in people, technology, and systems over past two years Infrastructure capable of supporting a much larger bank Resulting scalability should allow for growth without significant expenses Asset sensitive, with 58.3% variable rate loans as of June 30, 2017 – – – – Increasing revenue and improving efficiency ($ in thousands) 4.31% $160,000 75% 73% $140,000 71% $120,000 69% $100,000 67% $80,000 65% 63% $60,000 $40,000 61% $20,000 59% $-57% 2012 2013 2014 2015 2016 YTD 6/30/17 2012 2013 2014 2015 2016 YTD 6/30/17 (1) Net Interest Income Fee Income NIM Efficiency Ratio NIE / Avg. Assets Note: Figures reflect as of year-end 12/31, with exception of year-to-date as of 6/30/2017 (1) Represents noninterest expense divided by the sum of net interest income and noninterest income 13 3.02% 2.83% 2.61%2.49%2.55%2.58% 67.8% 66.2% 64.2% 62.9%62.7%62.8% 4.02% 3.92%3.85%3.96% 4.05% 13.4% 13.3% 12.9% 86.6% 86.7% 87.1% 13.7% 86.3% 14.9% 85.1% 11.8% 88.2% Improving Efficiency Historical Revenue and NIM
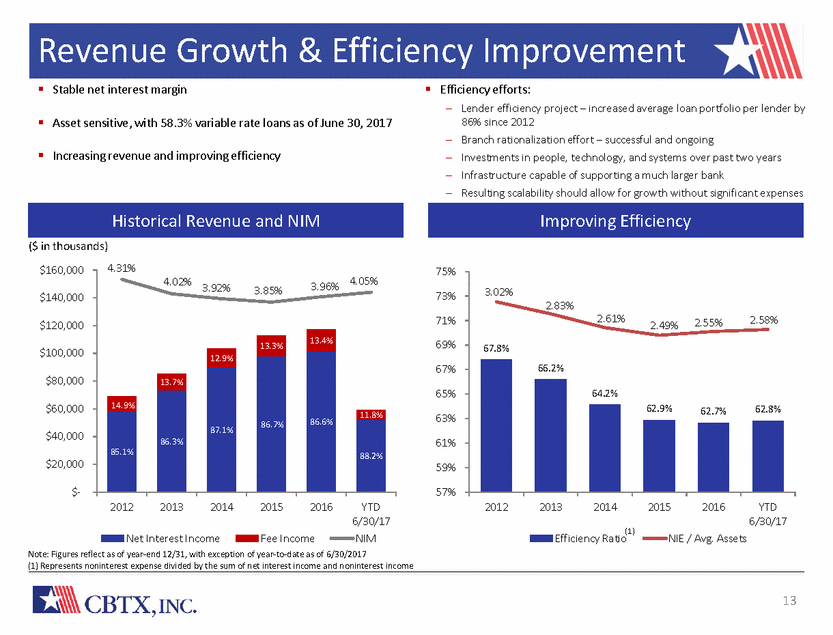
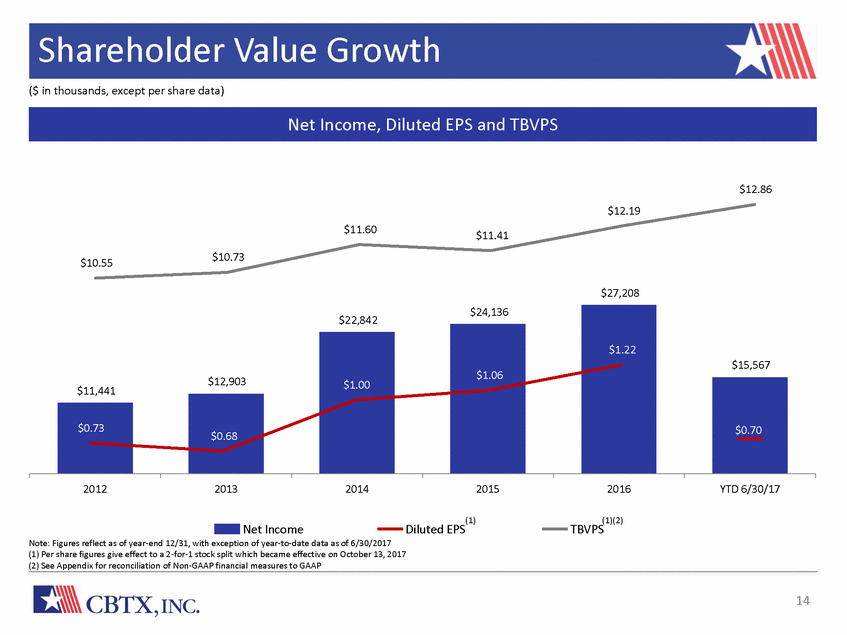
Shareholder ($ in thousands, except per share data) Value Growth $12.86 $12.19 $11.60 $11.41 $10.73 $10.55 $27,208 $22,842 $11,441 2012 2013 2014 2015 2016 YTD 6/30/17 (1) Diluted EPS (1)(2) TBVPS Net Income Note: Figures reflect as of year-end 12/31, with exception of year-to-date data as of 6/30/2017 (1) Per share figures give effect to a 2-for-1 stock split which became effective on October 13, 2017 (2) See Appendix for reconciliation of Non-GAAP financial measures to GAAP 14 $24,136 $1.22 $15,567 $1.06 $12,903 $1.00 $0.70 $0.68 $0.73 Net Income, Diluted EPS and TBVPS
Growth Strategy Organic Growth: - - Continue hiring experienced bankers Identified areas of additional expansion within certain lending verticals: Commercial and industrial Medical SBA lending – - Talent recruitment and retention efforts benefit from becoming public Dedicated focus on gathering core deposits: ~83% of loan customers also have a deposit relationship(1) Sophisticated treasury management capabilities Strategic Acquisitions: - Five whole-bank acquisitions completed – Proven ability to source, acquire, and successfully integrate strategic acquisitions, while remaining disciplined Additive to overall franchise – Talented bankers, sound credit culture, complementary branch footprint Experienced acquirer that consistently pursues acquisition opportunities Additional capital and publicly traded shares may increase M&A potential - - - (1) As of June 30, 2017 15
Opportunity & Investment Rationale Strength of management team Significant insider ownership Relationship-based business bank with a strong credit culture Strength of operating markets Platform and team with significant scalability Track record of growth and expansion Disciplined approach to M&A allows for shareholder value to be enhanced through strategic acquisitions Strong operating performance – – – – ~$3 billion in assets in one of the most desirable banking markets in the country Attractive and improving ROAA Consistent ~4% net interest margin with expected improvement in rising rate environment Low 60s efficiency ratio with scalable infrastructure Significant scarcity value – largest Texas community bank focused on Houston and Beaumont markets 16
Our Brand Promise Our Vision Here to Serve. Our Positioning To experienced business owners, CommunityBank of Texas is the financial partner that delivers a better banking experience. Our Personality Resourceful, Trustworthy, Friendly Responsive, Strong 17
Appendix

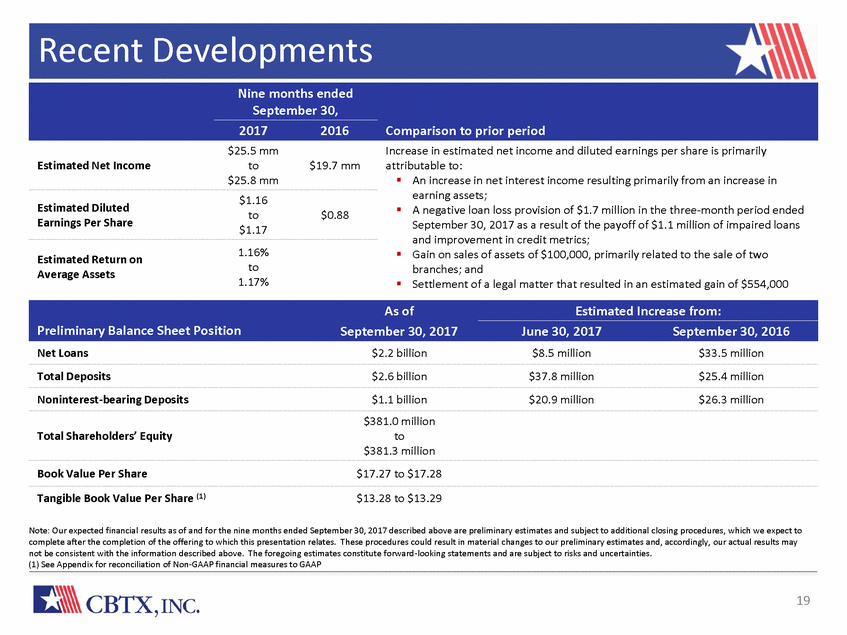
Recent Developments $25.5 mm to $25.8 mm Increase in estimated net income and diluted earnings per share is primarily attributable to: Estimated Net Income $19.7 mm An increase in net interest income resulting primarily from an increase in earning assets; A negative loan loss provision of $1.7 million in the three-month period ended September 30, 2017 as a result of the payoff of $1.1 million of impaired loans and improvement in credit metrics; Gain on sales of assets of $100,000, primarily related to the sale of two branches; and Settlement of a legal matter that resulted in an estimated gain of $554,000 $1.16 to $1.17 Estimated Diluted Earnings Per Share $0.88 1.16% to 1.17% Estimated Return on Average Assets Net Loans $2.2 billion $8.5 million $33.5 million Total Deposits $2.6 billion $37.8 million $25.4 million Noninterest-bearing Deposits $1.1 billion $20.9 million $26.3 million $381.0 million to $381.3 million Total Shareholders’ Equity Book Value Per Share $17.27 to $17.28 Tangible Book Value Per Share (1) $13.28 to $13.29 Note: Our expected financial results as of and for the nine months ended September 30, 2017 described above are preliminary estimates and subject to additional closing procedures, which we expect to complete after the completion of the offering to which this presentation relates. These procedures could result in material changes to our preliminary estimates and, accordingly, our actual results may not be consistent with the information described above. The foregoing estimates constitute forward-looking statements and are subject to risks and uncertainties. (1) See Appendix for reconciliation of Non-GAAP financial measures to GAAP 19 As ofEstimated Increase from: Preliminary Balance Sheet PositionSeptember 30, 2017June 30, 2017September 30, 2016 Nine months ended September 30, 20172016Comparison to prior period
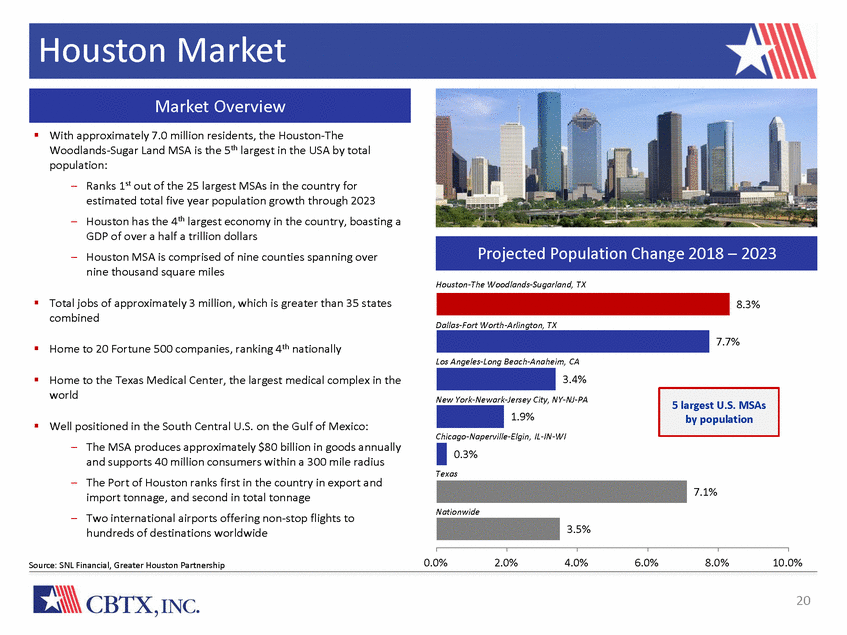
Houston Market With approximately 7.0 million residents, the Houston-The Woodlands-Sugar Land MSA is the 5th largest in the USA by total population: - Ranks 1st out of the 25 largest MSAs in the country for estimated total five year population growth through 2023 Houston has the 4th largest economy in the country, boasting a GDP of over a half a trillion dollars Houston MSA is comprised of nine counties spanning over nine thousand square miles - - Houston-The Woodlands-Sugarland, TX Total jobs of approximately 3 million, which is greater than 35 states combined 8.3% Dallas-Fort Worth-Arlington, TX 7.7% Home to 20 Fortune 500 companies, ranking 4th nationally Los Angeles-Long Beach-Anaheim, CA 3.4% Home to the Texas Medical Center, the largest medical complex in the world New York-Newark-Jersey City, NY-NJ-PA 1.9% Well positioned in the South Central U.S. on the Gulf of Mexico: Chicago-Naperville-Elgin, IL-IN-WI - The MSA produces approximately $80 billion in goods annually and supports 40 million consumers within a 300 mile radius The Port of Houston ranks first in the country in export and import tonnage, and second in total tonnage Two international airports offering non-stop flights to hundreds of destinations worldwide 0.3% Texas - 7.1% Nationwide - 3.5% 0.0% 2.0% 4.0% 6.0% 8.0% 10.0% Source: SNL Financial, Greater Houston Partnership 20 5 largest U.S. MSAs by population Projected Population Change 2018 – 2023 Market Overview
Beaumont Market The Beaumont-Port Arthur MSA is located approximately 85 miles east of downtown Houston off of the Gulf of Mexico The cities of Beaumont, Port Arthur and Orange form the “Golden Triangle,” a major industrial and petrochemical complex: - Six of the eight new U.S. ethylene projects under construction are being built on the Texas Gulf Coast - ExxonMobil recently announced plans to expand their Beaumont polyethylene plant by 65% The ports of Beaumont and Port Arthur are some of the most active ports in the United States - The Port of Beaumont is the fifth largest port in the country by total tonnage 2 BBVA 13 860 17 3 Wel l s Fa rgo & Co. 10 640 12 4 Ca pi ta l One Fi na nci a l Corp. 5 622 12 Dominant market leader – Ranked 1st in total in-market deposits, with approximately 20% market share - Substantial market share and established presence make the market ideal for sourcing low-cost, core funding 5 JPMorga n Cha s e & Co. 6 514 10 6 Fi rs t Fi na nci a l Ba nks ha res 6 438 9 7 Ba nk of Ameri ca Corp. 3 416 8 8 AmTex Ba ncs ha res Inc. 2 176 3 9 Thi rd Coa s t Ba ncs ha res Inc. 2 114 2 10 Mi dSouth Ba ncorp Inc. 3 89 2 Source: forbes.com, portofbeaumont.com, portpa.com, exxonmobil.com, txdot.gov and FDIC 2016 summary of deposits 21 1 CBTX, Inc. 12 $ 1,054 20 % Rank Company Branches Market Share ($M) (%) Beaumont MSA Deposit Market Share (June 30, 2017) Market Overview

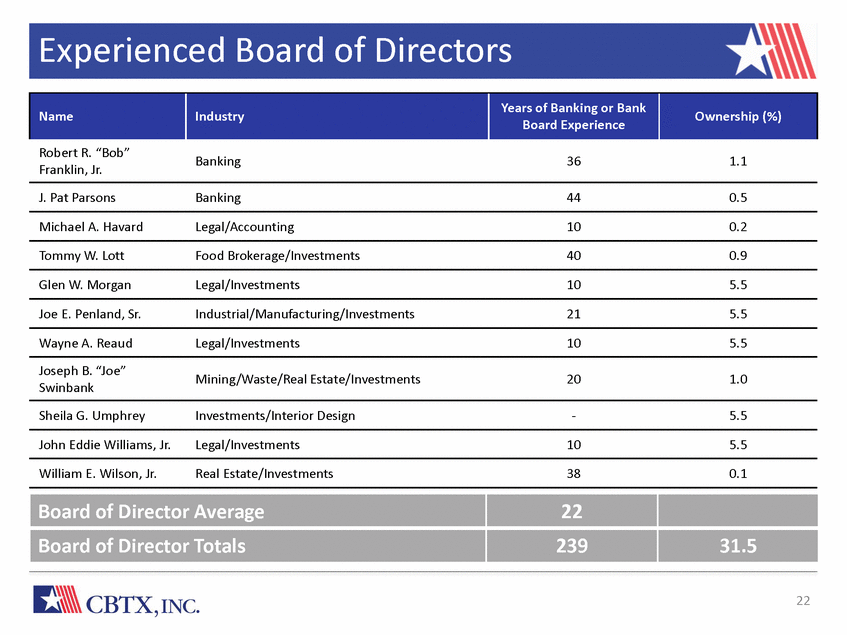
Experienced Board of Directors Robert R. “Bob” Franklin, Jr. Banking 36 1.1 J. Pat Parsons Banking 44 0.5 Michael A. Havard Legal/Accounting 10 0.2 Tommy W. Lott Food Brokerage/Investments 40 0.9 Glen W. Morgan Legal/Investments 10 5.5 Joe E. Penland, Sr. Industrial/Manufacturing/Investments 21 5.5 Wayne A. Reaud Legal/Investments 10 5.5 Joseph B. “Joe” Swinbank Mining/Waste/Real Estate/Investments 20 1.0 Sheila G. Umphrey Investments/Interior Design - 5.5 John Eddie Williams, Jr. Legal/Investments 10 5.5 William E. Wilson, Jr. Real Estate/Investments 38 0.1 22 Board of Director Average 22 Board of Director Totals 239 31.5 Name Industry Years of Banking or Bank Board Experience Ownership (%)
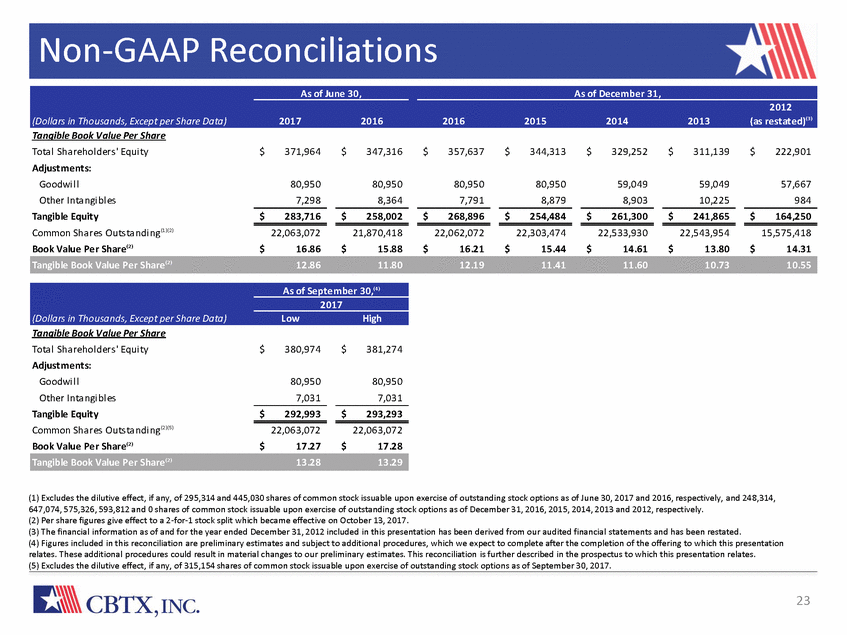
Non-GAAP Reconciliations Tangible Book Value Per Share Tota l Sha rehol ders ' Equi ty Adjustments: Goodwi l l Other Inta ngi bl es Tangible Equity Common Sha res Outs ta ndi ng(1 )(2 ) Book Value Per Share(2 ) $ 371,964 $ 347,316 $ 357,637 $ 344,313 $ 329,252 $ 311,139 $ 222,901 80,950 7,298 80,950 8,364 80,950 7,791 80,950 8,879 59,049 8,903 59,049 10,225 57,667 984 $ 283,716 $ 258,002 $ 268,896 $ 254,484 $ 261,300 $ 241,865 $ 164,250 22,063,072 16.86 21,870,418 15.88 22,062,072 16.21 22,303,474 15.44 22,533,930 14.61 22,543,954 13.80 15,575,418 14.31 $ $ $ $ $ $ $ Tangible Book Value Per Share Tota l Sha rehol ders ' Equi ty Adjustments: Goodwi l l Other Inta ngi bl es Tangible Equity Common Sha res Outs ta ndi ng(2 )(5 ) Book Value Per Share(2 ) $ 380,974 $ 381,274 80,950 7,031 80,950 7,031 $ 292,993 $ 293,293 22,063,072 17.27 22,063,072 17.28 $ $ (1) Excludes the dilutive effect, if any, of 295,314 and 445,030 shares of common stock issuable upon exercise of outstanding stock options as of June 30, 2017 and 2016, respectively, and 248,314, 647,074, 575,326, 593,812 and 0 shares of common stock issuable upon exercise of outstanding stock options as of December 31, 2016, 2015, 2014, 2013 and 2012, respectively. (2) Per share figures give effect to a 2-for-1 stock split which became effective on October 13, 2017. (3) The financial information as of and for the year ended December 31, 2012 included in this presentation has been derived from our audited financial statements and has been restated. (4) Figures included in this reconciliation are preliminary estimates and subject to additional procedures, which we expect to complete after the completion of the offering to which this presentation relates. These additional procedures could result in material changes to our preliminary estimates. This reconciliation is further described in the prospectus to which this presentation relates. (5) Excludes the dilutive effect, if any, of 315,154 shares of common stock issuable upon exercise of outstanding stock options as of September 30, 2017. 23 Tangible Book Value Per Share (2 ) 13.2813.29 (Dollars in Thousands, Except per Share Data) As of September 30,(4 ) 2017 LowHigh Tangible Book Value Per Share (2 ) 12.8611.8012.1911.4111.6010.7310.55 As of June 30, (Dollars in Thousands, Except per Share Data)20172016 As of December 31, 2012 2016201520142013(as restated)(3 )
