Please wait
.2
Cenovus Energy Inc.
Management’s Discussion and Analysis (unaudited)
For the Year Ended December 31, 2025
(Canadian Dollars)
MANAGEMENT’S DISCUSSION AND ANALYSIS 
| | |
For the year ended December 31, 2025 |
This Management’s Discussion and Analysis (“MD&A”) for Cenovus Energy Inc. (which includes references to “we”, “our”, “us”, “its”, the “Company”, or “Cenovus”, and means Cenovus Energy Inc., the subsidiaries of, joint arrangements, and partnership interests held directly or indirectly by, Cenovus Energy Inc.) dated February 18, 2026, should be read in conjunction with our December 31, 2025 unaudited interim Consolidated Financial Statements and accompanying notes (“interim Consolidated Financial Statements”) and our December 31, 2025 audited Consolidated Financial Statements and accompanying notes (“Consolidated Financial Statements”). All of the information and statements contained in this MD&A are made as at February 18, 2026, unless otherwise indicated. This MD&A contains forward-looking information about our current expectations, estimates, projections and assumptions. See the Advisory for information on the risk factors that could cause actual results to differ materially and the assumptions underlying our forward-looking information. Cenovus management (“Management”) prepared the MD&A. The Audit Committee of the Cenovus Board of Directors (“the Board”) reviewed and recommended the MD&A for approval by the Board, which occurred on February 18, 2026. Additional information about Cenovus, including our quarterly and annual reports, Annual Information Form (“AIF”) and Form 40-F, is available on SEDAR+ at sedarplus.ca, on EDGAR at sec.gov and on our website at cenovus.com. Information on or connected to our website, even if referred to in this MD&A, do not constitute part of this MD&A. Cenovus holds equity ownership interests in a number of joint ventures, as classified under IFRS Accounting Standards (as defined below), that are accounted for using the equity method in our Consolidated Financial Statements. Unless otherwise indicated, operational results of these joint ventures are not reflected in this MD&A. For further information, see the Advisory section of this MD&A.
Basis of Presentation
This MD&A and the Consolidated Financial Statements were prepared in Canadian dollars (which includes references to “dollar” or “$”), except where another currency is indicated, and in accordance with International Financial Reporting Standards (“IFRS”) as issued by the International Accounting Standards Board (“IASB”) (the “IFRS Accounting Standards”). Production volumes are presented on a before royalties basis. Refer to the Abbreviations and Definitions section for commonly used oil and gas terms.
| | | | | |
| Cenovus Energy Inc. – 2025 Management's Discussion and Analysis | 2 |
We are a Canadian-based integrated energy company headquartered in Calgary, Alberta. We are one of the largest Canadian-based crude oil and natural gas producers, with upstream operations in Canada and the Asia Pacific region, and one of the largest Canadian-based refiners and upgraders, with downstream operations in Canada and the United States (“U.S.”).
Our upstream operations include oil sands projects in northern Alberta; thermal and conventional crude oil, natural gas and natural gas liquids (“NGLs”) projects across Western Canada; crude oil production offshore Newfoundland and Labrador; and natural gas and NGLs production offshore China and Indonesia. Our downstream operations include upgrading and refining operations in Canada and the U.S., and commercial fuel operations across Canada.
Our operations involve activities across the full value chain to develop, produce, refine, transport and market crude oil, natural gas and refined petroleum products in North America and internationally. Our physically and economically integrated upstream and downstream operations help us mitigate the impact of volatility in light-heavy crude oil price differentials and contribute to our net earnings by capturing value from crude oil, natural gas and NGLs production through to the sale of finished products such as transportation fuels.
For a description of our business segments, see the Reportable Segments section of this MD&A.
Our Strategy
At Cenovus, our purpose is to energize the world to make people’s lives better. Our strategy is focused on maximizing shareholder value over the long-term through sustainable, low-cost, diversified and integrated energy leadership. Our five strategic objectives include: delivering top-tier safety performance and sustainability leadership; maximizing value through competitive cost structures and optimizing margins; a focus on financial discipline, including reaching and maintaining targeted debt levels while positioning Cenovus for resiliency through commodity price cycles; a disciplined approach to allocating capital to projects that generate returns at the bottom of the commodity price cycle; and absolute and per share free funds flow growth.
On December 11, 2025, we released our 2026 corporate guidance, which focused on disciplined capital allocation in support of increasing shareholder returns over time. We will continue to be focused on controlling costs, improving the profitability of our business and optimizing our advantaged portfolio to deliver value for our shareholders. For further details, see the Outlook section of this MD&A and our 2026 corporate guidance dated December 10, 2025, available on our website at cenovus.com.
Our 2025 results reflect strong operational performance in the upstream and downstream business. Despite a weakened commodity price environment, we delivered strong financial results, reached significant milestones in key growth projects and completed strategic acquisitions and divestitures, which enhance our asset portfolio.
•Delivered safe and reliable operations. We delivered safe operations across our business and safely completed turnarounds at Foster Creek, Sunrise and the Toledo Refinery. In late May, we responded to wildfire activity in northern Alberta by temporarily shutting-in production at Christina Lake to ensure the safety of our staff and assets. We resumed production in early June. Safety continues to be our top priority.
•Acquisition of MEG Energy Corp. On November 13, 2025, we completed the acquisition of MEG Energy Corp. (“MEG”) through a plan of arrangement (the “MEG Acquisition”). Purchase consideration for the MEG Acquisition included $3.4 billion in cash partially funded through the receipt of a $2.7 billion term loan facility, and the issuance of 143.9 million Cenovus common shares with a fair value of $3.7 billion. The acquired MEG assets immediately contributed to our Christina Lake production and results.
•Sale of interest in WRB Refining LP. On September 30, 2025, we divested our entire 50 percent interest in the jointly-owned Wood River and Borger refineries held through WRB Refining LP (“WRB”) (the “WRB Divestiture”) for proceeds of US$1.3 billion (C$1.9 billion) after closing adjustments. The divestiture aligns with our strategy of owning and operating assets that are core to our business.
•Record annual upstream production. We achieved record annual upstream production averaging 834.2 thousand BOE per day (2024 – 797.2 thousand BOE per day), primarily due to record annual Oil Sands production averaging 644.1 thousand BOE per day (2024 – 610.7 thousand). Oil Sands production increased due to successful results from new well pads, additional production volumes following the MEG Acquisition and the completion of key growth projects.
| | | | | |
| Cenovus Energy Inc. – 2025 Management's Discussion and Analysis | 3 |
•Completed and advanced key Oil Sands growth projects. We ramped-up production following the completion of the Narrows Lake tie-back to Christina Lake, and we completed the Foster Creek optimization project ahead of schedule. At Sunrise, we brought new well pads online to support continued production growth. At our Lloydminster conventional heavy oil assets, we made progress on our heavy oil development program.
•Achieved Offshore milestones at the West White Rose Project. The topsides were placed atop the concrete gravity structure, and we completed the subsea tie-ins to our existing production system at the SeaRose floating production, storage and offloading unit (“FPSO”). Hookup and commissioning of the platform continued to progress and was substantially completed in the fourth quarter of 2025, despite challenging offshore weather conditions.
•Strong utilization in our downstream assets. Average crude oil throughput (“throughput”) in our downstream assets was 626.6 thousand barrels per day, representing a crude unit utilization of 95 percent, compared with 646.9 thousand barrels per day in 2024, representing crude unit utilization of 90 percent. Our Canadian assets achieved record annual throughput and continue to run at or above capacity, while the completion of turnarounds and operational improvement initiatives in our operated U.S. assets resulted in higher reliability.
•Reported solid financial results. Adjusted Funds Flow was $8.9 billion, an increase of $707 million from 2024, reflecting strong operating performance in our upstream and downstream operations, despite a weakened commodity price environment. Brent and WTI benchmark prices both decreased by 14 percent, partially offset by higher market crack spreads and the narrowing of the WTI-WCS differential. Cash from operating activities was $8.2 billion, a decrease from $9.2 billion in 2024, mainly due to changes in non-cash working capital.
•Closed senior notes offerings. In connection with the closing of the MEG Acquisition and upcoming debt maturities, the Company closed public offerings in Canada and the U.S. of $2.6 billion of senior unsecured notes. The proceeds of the offerings were used to fund the redemption of select senior unsecured notes and for general corporate purposes.
•Completed the redemption of select senior notes. The Company redeemed US$973 million in principal of senior unsecured notes due in 2027 and 2029, in full, including the US$600 million senior unsecured notes assumed with the MEG Acquisition. The Company also redeemed $750 million in principal of senior unsecured notes due in 2027, in full.
•Delivered significant returns to shareholders. We returned $3.8 billion to common and preferred shareholders, including the purchase of 89.4 million common shares for $2.0 billion through our normal course issuer bid (“NCIB”), $1.4 billion through common and preferred share base dividends, and the redemption of the Company’s series 5 and series 7 preferred shares at a price of $25.00 per share for a total of $350 million. Following the MEG Acquisition, we have adjusted our shareholder returns framework to balance deleveraging with shareholder returns.
•Raised our common share base dividend. In the second quarter, the Board approved an 11 percent increase in the base dividend to $0.800 per common share annually. On February 18, 2026, the Board declared a first quarter dividend of $0.200 per common share.
| | | | | |
| Cenovus Energy Inc. – 2025 Management's Discussion and Analysis | 4 |
Summary of Annual Results
| | | | | | | | | | | | | | | | | | | | |
| ($ millions, except where indicated) | | 2025 | | 2024 | | 2023 |
| | | | | | |
Upstream Production Volumes (1) (2) (MBOE/d) | | 834.2 | | | 797.2 | | | 778.7 | |
| | | | | | |
Downstream Total Processed Inputs (3) (4) (Mbbls/d) | | 667.5 | | | 678.0 | | | 586.8 | |
| | | | | | |
Crude Oil Unit Throughput (3) (Mbbls/d) | | 626.6 | | | 646.9 | | | 560.4 | |
| | | | | | |
Downstream Production Volumes (3) (Mbbls/d) | | 687.2 | | | 693.1 | | | 599.2 | |
| | | | | | |
Revenues | | 49,696 | | | 54,277 | | | 52,204 | |
| | | | | | |
Operating Margin (5) | | 10,608 | | | 10,809 | | | 11,022 | |
Operating Margin – Upstream (6) | | 10,403 | | | 11,121 | | | 9,870 | |
Operating Margin – Downstream (6) | | 205 | | | (312) | | | 1,152 | |
| | | | | | |
| Cash From (Used In) Operating Activities | | 8,228 | | | 9,235 | | | 7,388 | |
| | | | | | |
Adjusted Funds Flow (5) | | 8,871 | | | 8,164 | | | 8,803 | |
Per Share – Basic (5) ($) | | 4.90 | | | 4.41 | | | 4.64 | |
Per Share – Diluted (5) ($) | | 4.87 | | | 4.38 | | | 4.54 | |
| | | | | | |
| Capital Investment | | 4,907 | | | 5,015 | | | 4,298 | |
| | | | | | |
Free Funds Flow (5) | | 3,964 | | | 3,149 | | | 4,505 | |
| | | | | | |
Net Earnings (Loss) | | 3,930 | | | 3,142 | | | 4,109 | |
Per Share – Basic ($) | | 2.16 | | | 1.68 | | | 2.15 | |
Per Share – Diluted ($) | | 2.15 | | | 1.67 | | | 2.09 | |
| | | | | | |
| Total Assets | | 63,424 | | | 56,539 | | | 53,915 | |
| | | | | | |
Total Long-Term Liabilities (5) | | 25,472 | | | 19,408 | | | 18,993 | |
| | | | | | |
Long-Term Debt, Including Current Portion | | 11,032 | | | 7,534 | | | 7,108 | |
| | | | | | |
Net Debt | | 8,292 | | | 4,614 | | | 5,060 | |
| | | | | | |
Cash Returns to Common and Preferred Shareholders | | 3,782 | | | 3,246 | | | 2,798 | |
| Common Shares – Base Dividends | | 1,423 | | | 1,255 | | | 990 | |
Base Dividends Per Common Share ($) | | 0.780 | | | 0.680 | | | 0.525 | |
| Common Shares – Variable Dividends | | — | | | 251 | | | — | |
Variable Dividends Per Common Share ($) | | — | | | 0.135 | | | — | |
| Purchase of Common Shares Under NCIB | | 1,995 | | | 1,445 | | | 1,061 | |
| Payment for Purchase of Warrants | | — | | | — | | | 711 | |
| Dividends Paid on Preferred Shares | | 14 | | | 45 | | | 36 | |
Preferred Share Redemption | | 350 | | | 250 | | | — | |
| | | | | | |
| | | | | | |
(1)Refer to the Operating and Financial Results section of this MD&A for a summary of total upstream production by product type.
(2)Includes results of the MEG Acquisition from November 13, 2025.
(3)Represent Cenovus’s net interest in refining operations. Following the WRB Divestiture, all refining operations are wholly-owned.
(4)Total processed inputs include crude oil and other feedstocks. Blending is excluded.
(5)Non-GAAP financial measure or contains a non-GAAP financial measure. See the Specified Financial Measures Advisory of this MD&A.
(6)Specified financial measure. See the Specified Financial Measures Advisory of this MD&A.
| | | | | |
| Cenovus Energy Inc. – 2025 Management's Discussion and Analysis | 5 |
| | |
|
OPERATING AND FINANCIAL RESULTS |
Selected Operating and Financial Results — Upstream
| | | | | | | | | | | | | | | | | | | | | | | | | | | |
| | | | | | | |
| | | | | | | | | Percent Change | | | | | | |
| | | | | | 2025 | | | 2024 | | | |
Production Volumes by Segment (1) (MBOE/d) | | | | | | | | | | | | | | | |
Oil Sands (2) | | | | | | | 644.1 | | 5 | | | 610.7 | | | | |
Conventional (3) | | | | | | | 122.8 | | 2 | | | 119.9 | | | | |
Offshore (4) | | | | | | | 67.3 | | 1 | | | 66.6 | | | | |
Total Production Volumes | | | | | | | 834.2 | | 5 | | | 797.2 | | | | |
| | | | | | | | | | | | | | | |
Production Volumes by Product (1) | | | | | | | | | | | | | | | |
Bitumen (Mbbls/d) | | | | | | | 616.8 | | 4 | | | 591.3 | | | | |
Heavy Crude Oil (Mbbls/d) | | | | | | | 25.1 | | 43 | | | 17.6 | | | | |
Light Crude Oil (5) (Mbbls/d) | | | | | | | 18.1 | | 40 | | | 12.9 | | | | |
NGLs (Mbbls/d) | | | | | | | 28.8 | | (10) | | | 32.0 | | | | |
Conventional Natural Gas (MMcf/d) | | | | | | | 872.4 | | 1 | | | 860.2 | | | | |
Total Production Volumes (MBOE/d) | | | | | | | 834.2 | | 5 | | | 797.2 | | | | |
| | | | | | | | | | | | | | | |
Per-Unit Operating Expenses by Segment (6) ($/BOE) | | | | | | | | | | | | | | | |
Oil Sands (2) | | | | | | | 11.81 | | 4 | | | 11.40 | | | | |
Conventional (3) (7) | | | | | | | 9.84 | | (18) | | | 11.99 | | | | |
Offshore (4) (7) | | | | | | | 16.88 | | (12) | | | 19.27 | | | | |
| | | | | | | | | | | | | | | |
Oil and Gas Reserves (8) (MMBOE) | | | | | | | | | | | | | | | |
Total Proved | | | | | | | 6,135 | | 8 | | | 5,664 | | | | |
Probable | | | | | | | 3,472 | | 24 | | | 2,793 | | | | |
| Total Proved Plus Probable | | | | | | | 9,607 | | 14 | | | 8,457 | | | | |
(1)Refer to the Oil Sands, Conventional and Offshore reportable segments section of this MD&A for a summary of production by product type.
(2)For the year ended December 31, 2025, reported Oil Sands segment production and per-unit operating expenses includes results of the MEG Acquisition from November 13, 2025.
(3)For the year ended December 31, 2025, reported Conventional segment production and per-unit operating expenses include Cenovus’s 30 percent equity interest in the Duvernay Energy Corporation (“Duvernay”) joint venture, which is accounted for using the equity method in the Consolidated Financial Statements. Operating expenses for the Conventional segment, excluding our equity interests in the Duvernay joint venture, was $464 million.
(4)Reported Offshore segment production and per-unit operating expenses include Cenovus’s 40 percent equity interest in the Husky-CNOOC Madura Limited (“HCML”) joint venture, which is accounted for using the equity method in the Consolidated Financial Statements. Operating expenses for the Offshore segment, excluding our equity interests in the HCML joint venture, was $349 million (2024 – $423 million).
(5)Light crude oil corresponds to light crude oil and medium crude oil combined as defined by National Instrument 51-101 “Standards of Disclosure for Oil and Gas Activities” (“NI 51-101”). Cenovus does not produce medium crude oil.
(6)Specified financial measure. See the Specified Financial Measures Advisory of this MD&A.
(7)Contains a non-GAAP financial measure. See the Specified Financial Measures Advisory of this MD&A.
(8)Includes values attributable to Cenovus’s 30 percent equity interest in the Duvernay joint venture and Cenovus’s 40 percent equity interest in the HCML joint venture. See the Advisory – Interests in Joint Ventures section of this MD&A.
Production
Total upstream production increased in 2025, compared with 2024, due to:
•Incremental production at Christina Lake following the MEG Acquisition in November 2025 and the ramp-up of production from Narrows Lake.
•Successful results from new well pads at Foster Creek and the completion of the Foster Creek optimization project, which supported additional production.
•Production resuming at the White Rose field following the completion of the SeaRose asset life extension (“ALE”) project.
The increase was partially offset by the temporary shut-in of production at our Rush Lake facilities in our Lloydminster thermal assets, due to a casing failure at a steam injection well that occurred in the second quarter of 2025. In the fourth quarter, we successfully restarted production and the phased ramp-up is progressing as expected.
| | | | | |
| Cenovus Energy Inc. – 2025 Management's Discussion and Analysis | 6 |
Per-Unit Operating Expenses
For the year ended December 31, 2025, per-unit operating expenses increased in the Oil Sands segment compared with 2024, primarily due to higher fuel costs and higher costs at our Lloydminster thermal assets related to the incident at Rush Lake. Per-unit operating expenses decreased in the Conventional segment primarily due to lower turnaround costs, and processing and gathering costs compared with 2024. Per-unit operating expenses decreased in the Offshore segment compared with 2024, primarily due to higher sales volumes and lower repairs and maintenance expenses as the White Rose field resumed production following the completion of the SeaRose ALE project in the first quarter of 2025.
We continue to focus on controlling costs through securing long-term contracts, working with vendors and purchasing long-lead items to mitigate future cost escalations.
Selected Operating and Financial Results — Downstream
| | | | | | | | | | | | | | | | | | | | | | | |
| | | |
| | | | | | | | | Percent Change | | |
| | | | | | 2025 | | | 2024 |
Crude Oil Unit Throughput by Segment (Mbbls/d) | | | | | | | | | | | |
Canadian Refining | | | | | | | 110.7 | | 22 | | | 90.5 |
U.S. Refining | | | | | | | 515.9 | | (7) | | | 556.4 |
Total Crude Oil Unit Throughput | | | | | | | 626.6 | | (3) | | | 646.9 | |
| | | | | | | | | | | |
Production Volumes by Product (1) (Mbbls/d) | | | | | | | | | | | |
Gasoline | | | | | | | 266.7 | | (5) | | | 280.5 |
Distillates (2) | | | | | | | 210.5 | | (4) | | | 219.9 |
Synthetic Crude Oil | | | | | | | 52.0 | | 27 | | | 41.0 |
Asphalt | | | | | | | 41.8 | | (5) | | | 44.0 |
Ethanol | | | | | | | 5.0 | | 4 | | | 4.8 |
Other | | | | | | | 111.2 | | 8 | | | 102.9 |
Total Production Volumes | | | | | | | 687.2 | | (1) | | | 693.1 |
| | | | | | | | | | | |
Per-Unit Operating Expenses by Segment (3) ($/bbl) | | | | | | | | | | | |
Canadian Refining | | | | | | | 11.59 | | (49) | | | 22.56 |
U.S. Refining | | | | | | | 12.73 | | (2) | | | 12.99 |
| | | | | | | | | | | |
Per-Unit Operating Expenses – Excluding Turnaround Costs by Segment (3) ($/bbl) | | | | | | | | | | | |
| Canadian Refining | | | | | | | 11.54 | | (25) | | | 15.38 |
| U.S. Refining | | | | | | | 10.88 | | (6) | | | 11.55 |
(1)Refer to the Canadian Refining and U.S. Refining reportable segments section of this MD&A for a summary of production by product type.
(2)Includes diesel and jet fuel.
(3)Specified financial measure. See the Specified Financial Measures Advisory of this MD&A. In the Canadian Refining segment, operating expenses represent expenses associated with the Lloydminster Upgrader (“Upgrader”), the Lloydminster Refinery and the commercial fuels business.
Total downstream throughput and refined product production decreased in 2025. The decrease was primarily due to the WRB Divestiture and the impact of turnarounds completed at our Toledo Refinery and non-operated Wood River and Borger refineries during the year. The decrease in throughput and refined product production was partially offset by our Canadian Refining assets running at, or above, full capacity and ongoing operational improvement initiatives at our operated U.S. Refining assets.
In 2025, per-unit operating expenses excluding turnaround costs decreased in the Canadian Refining segment compared with 2024, due to lower project costs and higher total processed inputs. Total processed inputs were lower and operating expenses were higher in 2024, due to a major turnaround completed at the Upgrader in the second quarter of 2024.
In 2025, per-unit operating expenses excluding turnaround costs decreased in the U.S. Refining segment compared with 2024, primarily due to lower controllable operating expenses, partially offset by higher electricity costs.
| | | | | |
| Cenovus Energy Inc. – 2025 Management's Discussion and Analysis | 7 |
Selected Consolidated Financial Results
Revenues
Revenues decreased eight percent compared with 2024, primarily due to a weakened commodity price environment combined with lower U.S. Refining sales volumes following the WRB Divestiture. The decrease was partially offset by higher sales volumes from our upstream assets and Canadian Refining segment.
Operating Margin
Operating Margin is a non-GAAP financial measure and is used to provide a consistent measure of the cash-generating performance of our assets for comparability of our underlying financial performance between periods.
| | | | | | | | | | | | | | | | | |
| | | | | |
| ($ millions) | | | | | 2025 | | 2024 | | |
Gross Sales | | | | | | | | | |
| External Sales | | | | | 52,751 | | | 57,726 | | | |
Intersegment Sales | | | | | 8,941 | | | 8,970 | | | |
| | | | | 61,692 | | | 66,696 | | | |
| Royalties | | | | | (3,055) | | | (3,449) | | | |
| Revenues | | | | | 58,637 | | | 63,247 | | | |
| Expenses | | | | | | | | | |
| Purchased Product | | | | | 30,078 | | | 33,926 | | | |
| Transportation and Blending | | | | | 11,243 | | | 11,331 | | | |
| Operating Expenses | | | | | 6,710 | | | 7,159 | | | |
Realized (Gain) Loss on Risk Management | | | | | (2) | | | 22 | | | |
Operating Margin | | | | | 10,608 | | | 10,809 | | | |
Operating Margin by Segment
Years Ended December 31, 2025 and 2024
Operating Margin decreased compared with 2024, primarily due to:
•Lower Realized Sales Prices impacting revenues in our Oil Sands segment due to lower benchmark WTI prices, partially offset by a narrower WTI-WCS differential.
•Increased operating expenses in our Oil Sands segment due to higher fuel costs and costs related to the incident at Rush Lake.
The decreases were partially offset by:
•The increase in Oil Sands production discussed above, which includes the accretive impact from the MEG Acquisition.
•Lower operating expenses and higher sales volumes in our Canadian Refining segment, as discussed above.
| | | | | |
| Cenovus Energy Inc. – 2025 Management's Discussion and Analysis | 8 |
Cash From (Used in) Operating Activities and Adjusted Funds Flow
Adjusted Funds Flow is a non-GAAP financial measure commonly used in the oil and gas industry to assist in measuring a company’s ability to finance its capital programs and meet its financial obligations.
| | | | | | | | | | | | | | | | | |
| | | | |
| ($ millions) | | | | | 2025 | | 2024 | | |
| Cash From (Used in) Operating Activities | | | | | 8,228 | | | 9,235 | | | |
| (Add) Deduct: | | | | | | | | | |
Settlement of Decommissioning Liabilities | | | | | (280) | | | (234) | | | |
| Net Change in Non-Cash Working Capital | | | | | (363) | | | 1,305 | | | |
Adjusted Funds Flow | | | | | 8,871 | | | 8,164 | | | |
Adjusted Funds Flow was higher in 2025, compared with 2024, primarily due to lower current tax expense and lower cash-settled long-term incentive costs, partially offset by higher integration, transaction and other costs, and lower Operating Margin.
Cash from operating activities decreased in 2025, compared with 2024, primarily due to changes in non-cash working capital, partially offset by higher Adjusted Funds Flow, as discussed above. The net change in non-cash working capital was primarily due to an increase in accounts receivable, and decreases in accounts payable and income tax payable, partially offset by a decrease in inventories, excluding the impact of the MEG Acquisition and the WRB Divestiture.
Net Earnings (Loss)
Net earnings in 2025 was $3.9 billion (2024 – $3.1 billion). The increase was primarily due to unrealized foreign exchange gains in 2025 compared with losses in 2024, and lower income tax expense, partially offset by higher depreciation, depletion and amortization expense and lower Operating Margin.
Net Debt
| | | | | | | | | | | | | | | | | |
As at December 31, ($ millions) | 2025 | | | | 2024 | | | | |
| Short-Term Borrowings | — | | | | | 173 | | | | | |
| Current Portion of Long-Term Debt | — | | | | | 192 | | | | | |
| Long-Term Portion of Long-Term Debt | 11,032 | | | | | 7,342 | | | | | |
| Total Debt | 11,032 | | | | | 7,707 | | | | | |
| Cash and Cash Equivalents | (2,740) | | | | | (3,093) | | | | | |
Net Debt | 8,292 | | | | | 4,614 | | | | | |
Total Debt and Net Debt increased as at December 31, 2025, primarily due to the receipt of a $2.7 billion term loan facility and the issuance of $2.6 billion of senior unsecured notes. The increase was partially offset by the redemption and repayment of senior unsecured notes totaling $2.3 billion, which includes the US$600 million notes assumed in the MEG Acquisition, and unrealized foreign exchange gains due to the strengthening of the Canadian dollar. The increase in Net Debt was further offset by the receipt of proceeds from the WRB Divestiture.
| | | | | |
| Cenovus Energy Inc. – 2025 Management's Discussion and Analysis | 9 |
Capital Investment (1)
| | | | | | | | | | | | | | | | | | | |
| | | | | | | |
| ($ millions) | | | | | | 2025 | | 2024 | | |
| Upstream | | | | | | | | | | | |
| Oil Sands | | | | | | | 2,944 | | | 2,714 | | | |
| Conventional | | | | | | | 453 | | | 421 | | | |
| Offshore | | | | | | | 934 | | | 1,145 | | | |
| Total Upstream | | | | | | | 4,331 | | | 4,280 | | | |
| Downstream | | | | | | | | | | | |
| Canadian Refining | | | | | | | 117 | | | 208 | | | |
| U.S. Refining | | | | | | | 442 | | | 488 | | | |
| Total Downstream | | | | | | | 559 | | | 696 | | | |
| Corporate and Eliminations | | | | | | | 17 | | | 39 | | | |
| Total Capital Investment | | | | | | | 4,907 | | | 5,015 | | | |
(1)Includes expenditures on property, plant and equipment (“PP&E”), exploration and evaluation (“E&E”) assets, and capitalized interest. Excludes capital expenditures related to joint ventures accounted for using the equity method in the Consolidated Financial Statements.
Capital investment in 2025 was mainly related to:
•Sustaining, optimization and redevelopment programs in the Oil Sands segment, including the drilling of stratigraphic test wells as part of our integrated winter program.
•The progression of the West White Rose project.
•Growth projects in our Oil Sands segment, including the progression of the drilling program at our Lloydminster conventional heavy oil assets, the Sunrise growth program, the optimization project at Foster Creek and the Narrows Lake tie-back to Christina Lake.
•Reliability and sustaining activities in our refining segments.
•Drilling, completion, tie-in and infrastructure projects in the Conventional segment.
Drilling Activity
| | | | | | | | | | | | | | | | | | | | | | | |
| Net Stratigraphic Test Wells and Observation Wells | | Net Production Wells (1) |
| 2025 | | 2024 | | 2025 | | 2024 |
Foster Creek | 76 | | | 85 | | | 46 | | | 22 | |
Christina Lake (2) | 68 | | | 61 | | | 27 | | | 23 | |
| Sunrise | 21 | | | 40 | | | 11 | | | 14 | |
Lloydminster Thermal | 68 | | | 53 | | | 12 | | | 22 | |
| Lloydminster Conventional Heavy Oil | 2 | | | 19 | | | 83 | | | 49 | |
| | | | | | | |
Other (3) | — | | | — | | | 5 | | | — | |
| 235 | | | 258 | | | 184 | | | 130 | |
(1)Steam-assisted gravity drainage (“SAGD”) well pairs in the Oil Sands segment are counted as a single producing well.
(2)Includes results of the MEG Acquisition from November 13, 2025.
(3)Includes new resource plays.
Stratigraphic test wells were drilled to help identify future well pad locations and to further evaluate our assets. Observation wells were drilled to gather information and monitor reservoir conditions.
| | | | | | | | | | | | | | | | | | | | | | | | | | | | | | | | | | | |
| 2025 | | 2024 |
| (net wells) | Drilled | | Completed | | Tied-in | | Drilled | | Completed | | Tied-in |
Conventional (1) | 53 | | | 54 | | | 54 | | | 36 | | | 31 | | | 31 | |
(1)Includes values attributable to Cenovus’s 30 percent equity interest in the Duvernay joint venture.
In the Offshore segment, no wells were drilled or completed in 2025 (2024 – drilled and evaluated one exploration well in China).
| | | | | |
| Cenovus Energy Inc. – 2025 Management's Discussion and Analysis | 10 |
| | |
|
COMMODITY PRICES UNDERLYING OUR FINANCIAL RESULTS |
Key performance drivers for our financial results include commodity prices, quality and location price differentials, refined product prices and refining crack spreads, as well as the U.S./Canadian dollar and Chinese Yuan (“RMB”)/Canadian dollar exchange rates. The following table shows selected market benchmark prices and average exchange rates to assist in understanding our financial results.
Selected Benchmark Prices and Exchange Rates (1)
| | | | | | | | | | | | | | | | | | | | | | | | | | | | | | | | | | | | | | | | | | |
| | | | | | | | | | | | | | Year Ended December 31, |
| (Average US$/bbl, unless otherwise indicated) | | | Q4 2025 | | Percent Change | | | | | | | Q4 2024 | | 2025 | | Percent Change | | 2024 |
Dated Brent | | | 63.69 | | | (15) | | | | | | | | 74.69 | | | 69.06 | | | (14) | | | 80.76 | |
| WTI | | | 59.14 | | | (16) | | | | | | | | 70.27 | | | 64.81 | | | (14) | | | 75.72 | |
Differential Dated Brent – WTI | | | 4.55 | | | 3 | | | | | | | | 4.42 | | | 4.25 | | | (16) | | | 5.04 | |
| WCS at Hardisty | | | 47.94 | | | (17) | | | | | | | | 57.71 | | | 53.68 | | | (12) | | | 60.97 | |
Differential WTI – WCS at Hardisty | | | 11.20 | | | (11) | | | | | | | | 12.56 | | | 11.13 | | | (25) | | | 14.75 | |
WCS at Hardisty (C$/bbl) | | | 66.89 | | | (17) | | | | | | | | 80.74 | | | 75.07 | | | (10) | | | 83.52 | |
| WCS at Nederland | | | 55.63 | | | (15) | | | | | | | | 65.69 | | | 61.74 | | | (11) | | | 69.69 | |
Differential WTI – WCS at Nederland | | | 3.51 | | | (23) | | | | | | | | 4.58 | | | 3.07 | | | (49) | | | 6.03 | |
| Condensate (C5 at Edmonton) | | | 57.01 | | | (19) | | | | | | | | 70.66 | | | 63.36 | | | (13) | | | 72.94 | |
Differential Condensate – WTI Premium/(Discount) | | | (2.13) | | | (646) | | | | | | | | 0.39 | | | (1.45) | | | (48) | | | (2.78) | |
Differential Condensate – WCS at Hardisty Premium/(Discount) | | | 9.07 | | | (30) | | | | | | | | 12.95 | | | 9.68 | | | (19) | | | 11.97 | |
Condensate (C$/bbl) | | | 79.54 | | | (20) | | | | | | | | 98.84 | | | 83.63 | | | (16) | | | 99.92 | |
| Synthetic at Edmonton | | | 57.84 | | | (19) | | | | | | | | 71.11 | | | 64.47 | | | (14) | | | 75.07 | |
Differential Synthetic – WTI Premium/(Discount) | | | (1.30) | | | (255) | | | | | | | | 0.84 | | | (0.34) | | | (48) | | | (0.65) | |
Synthetic at Edmonton (C$/bbl) | | | 80.69 | | | (19) | | | | | | | | 99.45 | | | 90.15 | | | (12) | | | 102.83 | |
| Refined Product Prices | | | | | | | | | | | | | | | | | | |
| Chicago Regular Unleaded Gasoline (“RUL”) | | | 70.66 | | | (11) | | | | | | | | 78.95 | | | 80.81 | | | (10) | | | 89.95 | |
| Chicago Ultra-low Sulphur Diesel (“ULSD”) | | | 90.70 | | | 2 | | | | | | | | 89.28 | | | 91.13 | | | (7) | | | 97.47 | |
Refining Benchmarks | | | | | | | | | | | | | | | | | | |
Chicago 3-2-1 Crack Spread (2) | | | 18.20 | | | 50 | | | | | | | | 12.12 | | | 19.44 | | | 16 | | | 16.74 | |
Group 3 3-2-1 Crack Spread (2) | | | 19.25 | | | 52 | | | | | | | | 12.66 | | | 20.63 | | | 23 | | | 16.81 | |
| Renewable Identification Numbers (“RINs”) | | | 6.04 | | | 50 | | | | | | | | 4.02 | | | 5.81 | | | 55 | | | 3.74 | |
Upgrading Differential (3) (C$/bbl) | | | 13.53 | | | (27) | | | | | | | | 18.64 | | | 14.92 | | | (22) | | | 19.21 | |
| Natural Gas Prices | | | | | | | | | | | | | | | | | | |
AECO (4) (C$/Mcf) | | | 2.23 | | | 51 | | | | | | | | 1.48 | | | 1.68 | | | 15 | | | 1.46 | |
NYMEX (5) (US$/Mcf) | | | 3.55 | | | 27 | | | | | | | | 2.79 | | | 3.43 | | | 51 | | | 2.27 | |
| Foreign Exchange Rates | | | | | | | | | | | | | | | | | | |
US$ per C$1 – Average | | | 0.717 | | | — | | | | | | | | 0.715 | | | 0.716 | | | (2) | | | 0.730 | |
US$ per C$1 – End of Period | | | 0.730 | | | 5 | | | | | | | | 0.695 | | | 0.730 | | | 5 | | | 0.695 | |
RMB per C$1 – Average | | | 5.084 | | | (1) | | | | | | | | 5.142 | | | 5.144 | | | (2) | | | 5.255 | |
(1)These benchmark prices are not our Realized Sales Prices and represent approximate values. For our Realized Sales Prices refer to the Netback tables in the upstream reportable segments section of this MD&A.
(2)The average 3-2-1 crack spread is an indicator of the adjusted refining margin and is valued on a last-in, first-out accounting basis.
(3)The upgrading differential is the difference between synthetic crude oil at Edmonton and Lloydminster Blend crude oil at Hardisty. The upgrading differential does not precisely mirror the configuration and the product output of our Canadian Refining assets; however, it is used as a general market indicator.
(4)Alberta Energy Company (“AECO”) 5A natural gas daily index.
(5)New York Mercantile Exchange (“NYMEX”) natural gas monthly index.
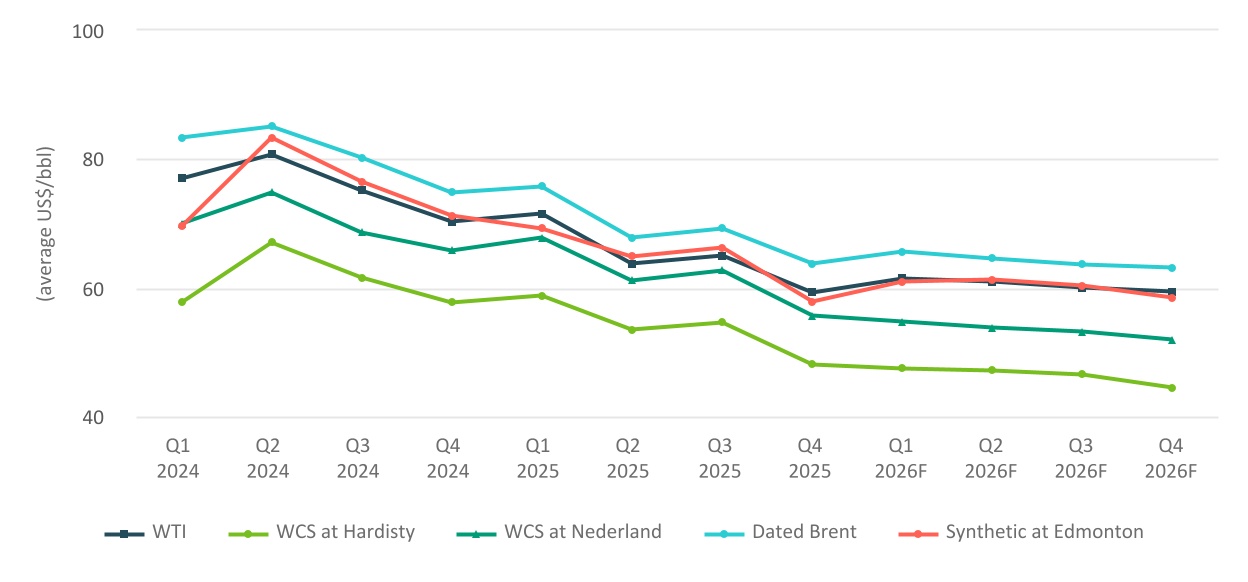
Crude Oil and Condensate Benchmarks
In 2025, global crude oil benchmark prices, Brent and WTI, decreased compared with 2024, as global supply exceeded demand leading to inventory builds throughout the year. Global crude oil production increased considerably in 2025 as OPEC+ continued to unwind production cuts, while non-OPEC countries, including the United States, Canada and Brazil, also increased supply. Year-over-year demand growth in 2025 weakened compared with 2024 due to a combination of weaker macroeconomic conditions, trade tensions, and other softer industrial activity in major consuming regions.
| | | | | |
| Cenovus Energy Inc. – 2025 Management's Discussion and Analysis | 11 |
WTI is an important benchmark for Canadian crude oil since it reflects inland North American crude oil prices, and the Canadian dollar equivalent is the basis for determining royalty rates for a number of our crude oil properties.
WCS is a blended heavy oil which consists of both conventional heavy oil and unconventional diluted bitumen. The WCS at Hardisty differential to WTI is a function of the quality differential of light and heavy crude, and the cost of transport. The WTI-WCS differential at Hardisty narrowed in 2025, compared with 2024, due to:
•The Trans Mountain Pipeline expansion project (“TMX”) increasing market access for WCS crude.
•Low inventory levels in the Western Canadian Sedimentary Basin as well as strong global demand for heavy crudes.
•Strong pricing for fuel oil in which heavy grades yield more versus light grades.
WCS at Nederland is a heavy oil benchmark for sales of our product at the U.S. Gulf Coast (“USGC”). The WTI-WCS at Nederland differential is representative of the heavy oil quality differential and is influenced by global heavy oil refining capacity and global heavy oil supply. In 2025, the WTI-WCS at Nederland differential narrowed compared with 2024, due to strong global demand for heavy crudes, as well as other factors as mentioned above.
In Canada, we upgrade heavy crude oil and bitumen into a sweet synthetic crude oil, the Husky Synthetic Blend (“HSB”), at the Upgrader. The price realized for HSB is primarily driven by the price of WTI, and by the supply and demand of sweet synthetic crude oil from Western Canada, which influences the WTI-Synthetic differential.
In 2025, synthetic crude oil at Edmonton strengthened relative to WTI compared with 2024. The strength in pricing relative to 2024 was a function of deep discounts in the first quarter of 2024 due to high synthetic crude oil production in Alberta and the supply of light crude oil being above pipeline capacity on light crude oil pipelines with limited local storage capacity.
Crude Oil Benchmark Prices (1)
(1)Forward pricing as at February 2, 2026.
Blending condensate with bitumen enables our production to be transported through pipelines. Our blending ratios, calculated as diluent volumes as a percentage of total blended volumes, range from approximately 20 percent to 35 percent. The Condensate-WCS differential is an important benchmark, as a higher premium generally results in a decrease in Operating Margin when selling a barrel of blended crude oil. When the supply of condensate in Alberta does not meet the demand, Edmonton condensate prices may be driven by USGC condensate prices plus the cost to transport the condensate to Edmonton. Our blending costs are also impacted by the timing of purchases and deliveries of condensate into inventory to be available for use in blending, as well as timing of blended product sales.
In 2025, the average Edmonton condensate benchmark traded at a smaller discount to WTI compared with 2024, due to the same factors impacting the synthetic crude oil to WTI differential, as discussed above, as well as tight Canadian supply and low Canadian inventories.
Refining Benchmarks
RUL and ULSD benchmark prices are representative of inland refined product prices and are used to derive the Chicago 3-2-1 market crack spread. The 3-2-1 market crack spread is an indicator of the adjusted refining margin generated by converting three barrels of crude oil into two barrels of regular unleaded gasoline and one barrel of ultra-low sulphur diesel, using current-month WTI-based crude oil feedstock prices and valued on a last-in, first-out basis.
| | | | | |
| Cenovus Energy Inc. – 2025 Management's Discussion and Analysis | 12 |
In 2025, refined product crack spreads in Chicago and Group 3 increased compared with 2024. The increase can be largely attributed to strong product cracks as unplanned global and North American refinery outages supported refined product pricing and new refining capacity has been slow to ramp up. The average cost of RINs was higher in 2025, compared with 2024, due to weaker U.S. production and imports of renewable diesel and biodiesel causing a decline in RINs generation.
North American refining crack spreads are expressed on a WTI basis, while refined products are generally set by global prices. The strength of refining market crack spreads in the U.S. Midwest and Midcontinent generally reflects the differential between Brent and WTI benchmark prices.
Our adjusted refining margin is affected by various other factors such as the quality and purchase location of crude oil feedstock, refinery configuration and product output. The benchmark market crack spreads do not precisely mirror the configuration and product output of our refineries, or the location we sell product; however, they are used as a general market indicator.
Refined Product Benchmarks (1)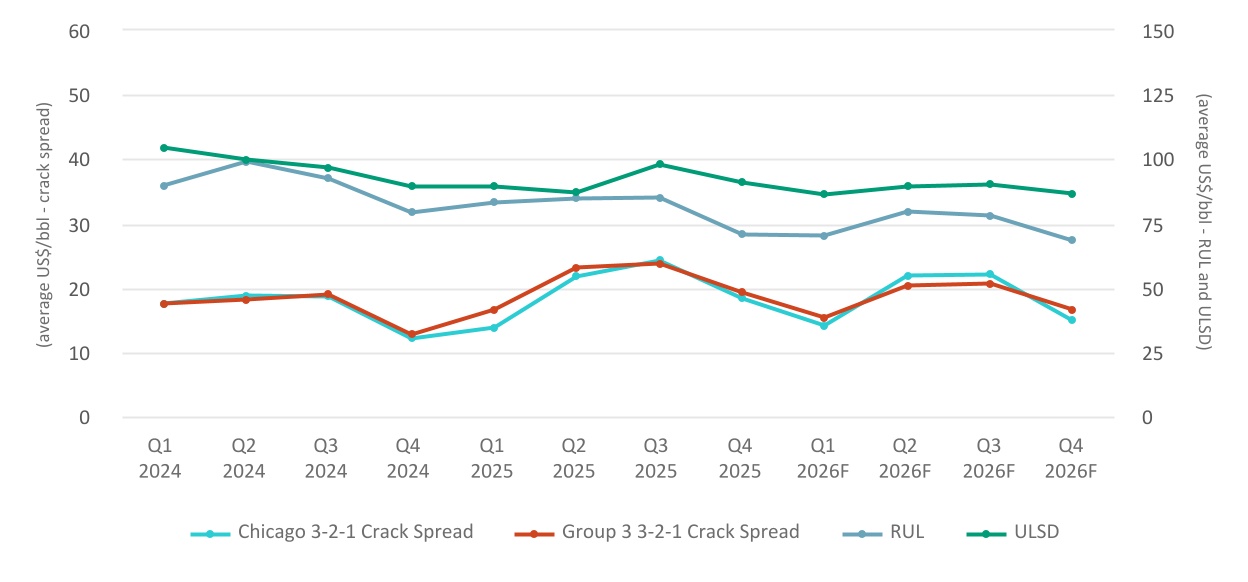
(1)Forward pricing as at February 2, 2026.
Natural Gas Benchmarks
In 2025, AECO prices increased compared with 2024, though not as much as the increase in NYMEX pricing. NYMEX prices increased more than AECO as NYMEX prices were supported by strong liquified natural gas (“LNG”) demand, while AECO prices were impacted by limited Western Canadian takeaway capacity, causing the AECO discount to NYMEX to widen. In 2025, both Western Canadian and U.S. natural gas production increased compared with 2024. The price received for our Asia Pacific natural gas production is largely based on long-term contracts.
Foreign Exchange Benchmarks
Our revenues are subject to foreign exchange exposure as the sales prices of our crude oil, NGLs, natural gas and refined products are determined by reference to U.S. dollar benchmark prices. An increase in the value of the Canadian dollar compared with the U.S. dollar has a negative impact on our reported revenue. In addition to our revenues being denominated in U.S. dollars, a significant portion of our long-term debt is also U.S. dollar denominated. As the Canadian dollar strengthens or weakens, our U.S. dollar debt gives rise to unrealized foreign exchange gains or losses, respectively, when translated to Canadian dollars. Changes in foreign exchange rates also impact the translation of our U.S. and Asia Pacific operations.
In 2025, on average, the Canadian dollar weakened relative to the U.S. dollar compared with 2024, positively impacting our reported revenues and negatively impacting our U.S. Refining operating expenses. A portion of our long-term sales contracts in the Asia Pacific region are priced in RMB. An increase in the value of the Canadian dollar relative to the RMB will decrease the revenues received in Canadian dollars from the sale of natural gas commodities in the region. In 2025, on average, the Canadian dollar weakened relative to RMB, compared with 2024, positively impacting our reported revenues.
| | | | | |
| Cenovus Energy Inc. – 2025 Management's Discussion and Analysis | 13 |
Interest Rate Benchmarks
Our interest income, short-term and floating rate borrowing costs, reported decommissioning liabilities and fair value measurements are impacted by fluctuations in interest rates. A change in interest rates could change our net finance costs, affect how certain liabilities are measured, and impact our cash flow and financial results.
As at December 31, 2025, the Bank of Canada’s policy interest rate was 2.25 percent. On January 28, 2026, the Bank of Canada held the policy interest rate at 2.25 percent.
Commodity Price Outlook
Global crude oil prices softened in 2025 as supply growth outpaced demand following the unwinding of OPEC+ voluntary cuts. Entering 2026, markets remain oversupplied, but price direction is uncertain and subject to volatility driven by policy decisions and geopolitical developments. OPEC+ policy continues to remain crucial to global oil supply and demand balances, and prices. Sanctions on Russian and Iranian crude and refined products have introduced persistent logistical challenges and altered trade flows globally. Policies regarding these regions will continue to be key factors that will drive energy supply. Policy and sanction uncertainty related to Venezuelan crude exports continues to influence global heavy crude oil supply and trade flows.
The global trade war and ongoing geopolitical tensions have the potential to reduce global GDP growth and oil demand, while increasing recessionary risks; however, the actual effects have been less pronounced than expected, and repeated pauses to tariffs have limited the direct economic impacts. There is potential for heightened price volatility across all commodities to continue until there is a firm resolution on the duration and magnitude of tariffs.
In addition to the above, our commodity pricing outlook for the next 12 months is influenced by the following:
•OPEC+ policy and the pace at which OPEC+ unwinds production cuts.
•In the near-term, there is a higher risk of a tariff-induced global economic slowdown that could slow oil demand.
•We expect the WTI-WCS at Hardisty differential will remain largely tied to global supply factors and heavy crude oil processing capacity, as long as supply does not exceed Canadian crude oil export capacity.
•Refined product prices and market crack spreads are likely to continue to fluctuate, adjusting for seasonal trends and refinery utilization in North America and globally.
•AECO and NYMEX natural gas prices are expected to remain volatile. The prospect of new LNG facilities in the U.S. and Canada coming into service or ramping up in the next year could increase demand and support North American natural gas prices. Weather will also continue to be a key driver of demand and impact prices.
•We expect the Canadian dollar to continue to be impacted by the pace at which the U.S. Federal Reserve Board and the Bank of Canada raise or lower benchmark lending rates relative to each other, the U.S. Administration’s policies toward Canada-U.S. trade, crude oil prices and emerging macro-economic factors.
Most of our upstream crude oil and downstream refined product production is exposed to movements in the WTI crude oil price. Our integrated upstream and downstream operations help us to mitigate the impact of commodity price volatility. Crude oil production in our upstream assets is blended with condensate and butane and is used as crude oil feedstock at our downstream refining operations. Condensate extracted from our blended crude oil is sold back to our Oil Sands segment.
Our refining capacity is primarily focused in the U.S. Midwest, along with smaller exposures in the USGC and Alberta, exposing us to market crack spreads in these markets. We will continue to monitor market fundamentals and optimize run rates at our refineries accordingly.
Our exposure to crude oil differentials includes light-heavy and light-medium price differentials. The light-medium price differential exposure is focused on light-medium crudes in the U.S. Midwest market region where we have the majority of our refining capacity, and to a lesser degree, in the USGC and Alberta. Our exposure to light-heavy crude oil price differentials is composed of a global light-heavy component, a regional component in markets we transport barrels to, as well as the Alberta differentials, which could be subject to transportation constraints.
While we expect to see volatility in crude oil prices, we have the ability to partially mitigate the impact of crude oil and refined product differentials through the following:
•Transportation commitments and arrangements – using our existing firm service commitments for takeaway capacity and supporting transportation projects that move crude oil from our production areas to consuming markets, including tidewater markets.
•Integration – heavy oil refining capacity allows us to capture value from both the WTI-WCS differential for Canadian crude oil and spreads on refined products.
•Monitoring market fundamentals and optimizing run rates at our refineries accordingly.
•Traditional crude oil storage tanks in various geographic locations.
| | | | | |
| Cenovus Energy Inc. – 2025 Management's Discussion and Analysis | 14 |
Key Priorities for 2026
Our 2026 priorities are focused on top-tier safety performance, integration of MEG, maintaining and growing our competitive advantages in our heavy oil value chain, advancing our major projects and progressing our sustainability initiatives, while continuing to focus on cost leadership and balancing shareholder returns with deleveraging.
Top-tier Safety Performance
Safe and reliable operations are our number one priority. We strive to ensure safe and reliable operations across our portfolio, and aim to be best-in-class operators for each of our major assets and businesses.
Integration of MEG
The MEG Acquisition is expected to further strengthen our oil sands assets by integrating top-tier adjacent assets at Christina Lake. In 2026, we plan to complete a fully integrated development plan for Christina Lake intended to increase production, reduce costs and capture synergies across the combined asset.
Heavy Oil Value Chain
Our heavy oil value chain includes all of our bitumen and heavy oil producing, midstream and pipeline-connected downstream assets. Across the value chain, we will focus on increasing our optionality, optimizing our working capital, improving our margins and reducing our break-even pricing.
Project Execution
Investing in future growth and profitability is a priority for us with several key projects underway, including the West White Rose project, the Amine Claus project at Foster Creek, the Christina Lake North expansion project, the Sunrise growth program and development of our Lloydminster assets.
Downstream Competitiveness
A competitive, reliable downstream business is essential to our integrated business. It allows us to be agile in our response to fluctuating demand for refined products and serves as a natural partial hedge to heavy oil differentials.
We will continue to implement operational improvements to our downstream assets to maximize the long-term profitability of our assets.
Returns to Shareholders
Maintaining a strong balance sheet with the resilience to withstand price volatility and capitalize on opportunities throughout the commodity price cycle is a key element of Cenovus’s capital allocation framework. Upon closing of the MEG Acquisition, we adjusted our shareholder returns framework to balance deleveraging with shareholder returns. Our long-term Net Debt target of $4.0 billion remains unchanged and the adjusted framework allows us to make progress towards this target. For further details, see the Liquidity and Capital Resources section of this MD&A.
Cost Leadership
We aim to maximize shareholder value through a continued focus on low-cost structures and margin optimization across our business. We are focused on reducing operating, capital, and general and administrative costs, realizing the full value of our integrated strategy, while making decisions that support long-term value for Cenovus.
Sustainability
Sustainability is central to Cenovus’s culture. We have established goals in our sustainability focus areas and we continue to advance work to support progress against these commitments.
The Government of Canada and the Government of Alberta have announced a framework aimed at strengthening federal-provincial collaboration in the energy sector to support a number of overlapping goals, including Canada’s greenhouse gas (“GHG”) emissions reduction ambitions. We continue to support our commitment to the Pathways Alliance, including efforts to reach agreements with the federal and provincial governments that provide sufficient fiscal and regulatory support to progress large-scale carbon capture projects, while maintaining global competitiveness.
Cenovus’s updated social commitments and 2024 Corporate Social Responsibility report, highlighting our performance in safety, Indigenous reconciliation, and acceptance and belonging, are available on our website at cenovus.com.
| | | | | |
| Cenovus Energy Inc. – 2025 Management's Discussion and Analysis | 15 |
2026 Corporate Guidance
Our 2026 corporate guidance dated December 10, 2025, is available on our website at cenovus.com.
Our 2026 corporate guidance for total capital investment is between $5.0 billion and $5.3 billion. This includes $3.5 billion to $3.6 billion directed towards sustaining capital to maintain base production and support continued safe and reliable operations, and between $1.2 billion and $1.4 billion of investment directed towards growth projects, such as:
•The Christina Lake North expansion project.
•The drilling program and ramping-up of production at the West White Rose field.
•The Sunrise growth program and the development of our Lloydminster assets.
The following table is a sub-set of our full updated guidance for 2026:
| | | | | | | | | | | | | | | | | |
| Capital Investment ($ millions) | | Production (MBOE/d) | | Crude Oil Unit Throughput (Mbbls/d) |
| Upstream | | | | | |
| Oil Sands | 3,500 - 3,600 | | 755 - 780 | | |
| Conventional | 450 - 500 | | 120 - 125 | | |
| Offshore | 450 - 500 | | 70 - 80 | | |
Upstream Total | 4,400 - 4,600 | | 945 - 985 | | |
| | | | | |
Downstream | | | | | |
Canadian Refining | | | | | 105 - 110 |
U.S. Refining | | | | | 325 - 340 |
Downstream Total | 600 - 700 | | | | 430 - 450 |
| | | | | |
| Corporate and Eliminations | Up to 25 | | | | |
Our Operations
The Company operates through the following reportable segments:
Upstream Segments
•Oil Sands, includes the development and production of bitumen and heavy oil in northern Alberta and Saskatchewan. Cenovus’s oil sands assets include Foster Creek, Sunrise, Lloydminster thermal and Lloydminster conventional heavy oil assets, as well as Christina Lake, which includes the results of the MEG Acquisition completed in November 2025. Cenovus jointly owns and operates pipeline gathering systems and terminals through the equity-accounted investment in Husky Midstream Limited Partnership (“HMLP”). The sale and transportation of Cenovus’s production and third-party commodity trading volumes are managed and marketed through access to capacity on third-party pipelines and storage facilities in both Canada and the U.S. to optimize product mix, delivery points, transportation commitments and customer diversification.
•Conventional, includes assets rich in NGLs and natural gas in Alberta and British Columbia in the Edson, Clearwater and Rainbow Lake operating areas, in addition to the Northern Corridor, which includes Elmworth and Wapiti. The segment also includes interests in numerous natural gas processing facilities. Cenovus’s NGLs and natural gas production is marketed and transported, with additional third-party commodity trading volumes, through access to capacity on third-party pipelines, export terminals and storage facilities. These provide flexibility for market access to optimize product mix, delivery points, transportation commitments and customer diversification.
•Offshore, includes offshore operations, exploration and development activities in the east coast of Canada and the Asia Pacific region, representing China and the equity-accounted investment in HCML, which is engaged in the exploration for, and production of, NGLs and natural gas in offshore Indonesia.
| | | | | |
| Cenovus Energy Inc. – 2025 Management's Discussion and Analysis | 16 |
Downstream Segments
•Canadian Refining, includes the owned and operated Lloydminster upgrading and asphalt refining complex, which converts heavy oil and bitumen into synthetic crude oil, diesel, asphalt and other ancillary products. Cenovus also owns and operates the Bruderheim crude-by-rail terminal and two ethanol plants. The Company’s commercial fuels business across Canada is included in this segment. Cenovus markets its production and third-party commodity trading volumes in an effort to use its integrated network of assets to maximize value.
•U.S. Refining, includes the refining of crude oil to produce gasoline, diesel, jet fuel, asphalt and other products at the wholly-owned Lima, Superior and Toledo refineries. On September 30, 2025, Cenovus divested its entire 50 percent interest in the jointly-owned Wood River and Borger refineries held through WRB with operator Phillips 66. The U.S. Refining segment included the WRB results up to the date of divestiture. Cenovus markets its own and third-party refined products.
Corporate and Eliminations
Corporate and Eliminations, includes Cenovus-wide costs for general and administrative, financing activities, gains and losses on risk management for corporate-related derivative instruments and foreign exchange. Eliminations include adjustments for feedstock and internal usage of crude oil, natural gas, condensate, other NGLs and refined products between segments; transloading services provided to the Oil Sands segment by the Company’s crude-by-rail terminal; the sale of condensate extracted from blended crude oil production in the Canadian Refining segment and sold to the Oil Sands segment; and unrealized profits in inventory. Eliminations are recorded based on market prices.
UPSTREAM
Oil Sands
In 2025, we:
•Delivered safe and reliable operations, including the safe execution of turnarounds at Foster Creek and Sunrise.
•Completed the MEG Acquisition, which immediately contributed to our Christina Lake results.
•Produced 644.1 thousand BOE per day (2024 – 610.7 thousand BOE per day).
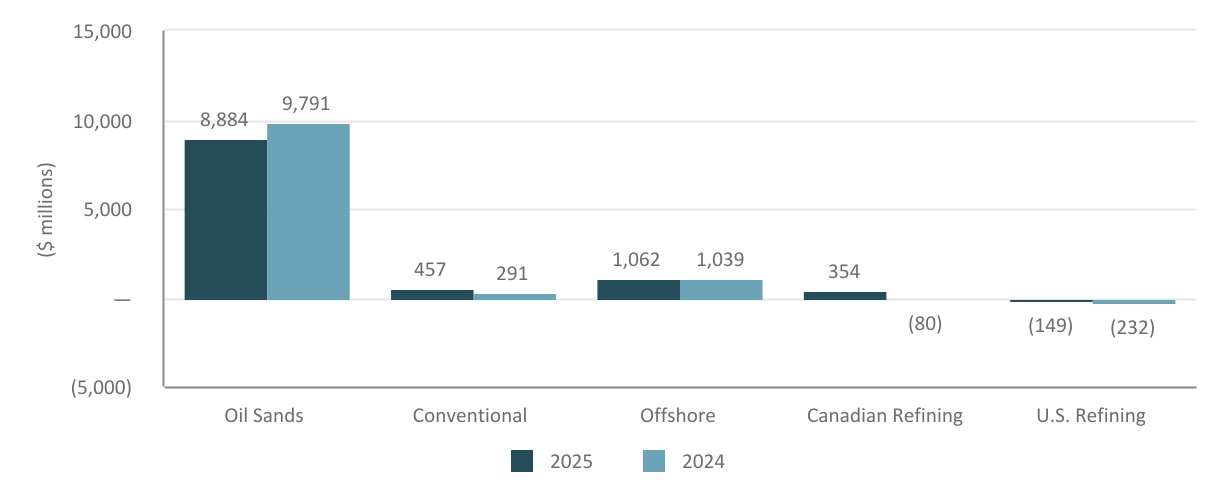
•Generated Operating Margin of $8.9 billion (2024 – $9.8 billion).
•Averaged a Netback of $38.37 per barrel (2024 – $44.88 per barrel).
•Invested capital of $2.9 billion for sustaining activities and growth projects.
In 2025, we completed the Narrows Lake tie-back to Christina Lake and ramped-up production. All major process units at the Foster Creek optimization project were brought online and the project was completed ahead of schedule, supporting incremental production. At Sunrise, we brought new well pads online to support continued production growth. At our Lloydminster conventional heavy oil assets, we made progress on our heavy oil development program.
Financial Results
| | | | | | | | | | | | | | | | | |
| | | | | |
| ($ millions) | | | | | 2025 | | 2024 | | |
| Gross Sales | | | | | | | | | |
External Sales | | | | | 21,541 | | | 21,857 | | | |
Intersegment Sales | | | | | 6,786 | | | 6,590 | | | |
| | | | | 28,327 | | | 28,447 | | | |
| Royalties | | | | | (2,920) | | | (3,274) | | | |
| Revenues | | | | | 25,407 | | | 25,173 | | | |
| Expenses | | | | | | | | | |
| Purchased Product | | | | | 2,886 | | | 1,851 | | | |
| Transportation and Blending | | | | | 10,875 | | | 11,000 | | | |
Operating | | | | | 2,754 | | | 2,511 | | | |
| Realized (Gain) Loss on Risk Management | | | | | 8 | | | 20 | | | |
| Operating Margin | | | | | 8,884 | | | 9,791 | | | |
Unrealized (Gain) Loss on Risk Management | | | | | 3 | | | (16) | | | |
| Depreciation, Depletion and Amortization | | | | | 3,433 | | | 3,117 | | | |
| Exploration Expense | | | | | 11 | | | 2 | | | |
| (Income) Loss from Equity-Accounted Affiliates | | | | | (38) | | | (14) | | | |
| Segment Income (Loss) | | | | | 5,475 | | | 6,702 | | | |
| | | | | |
| Cenovus Energy Inc. – 2025 Management's Discussion and Analysis | 17 |
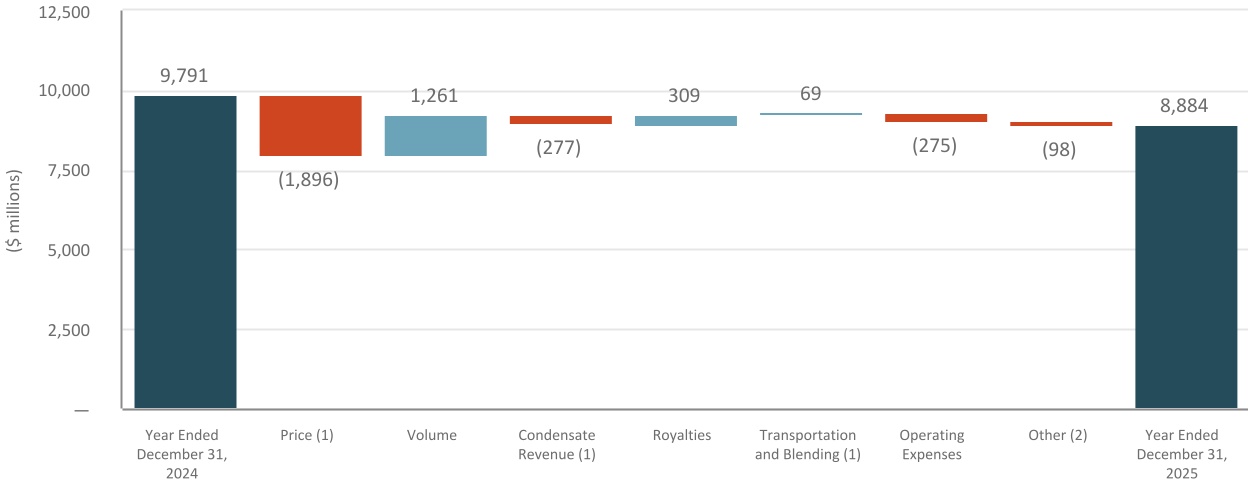
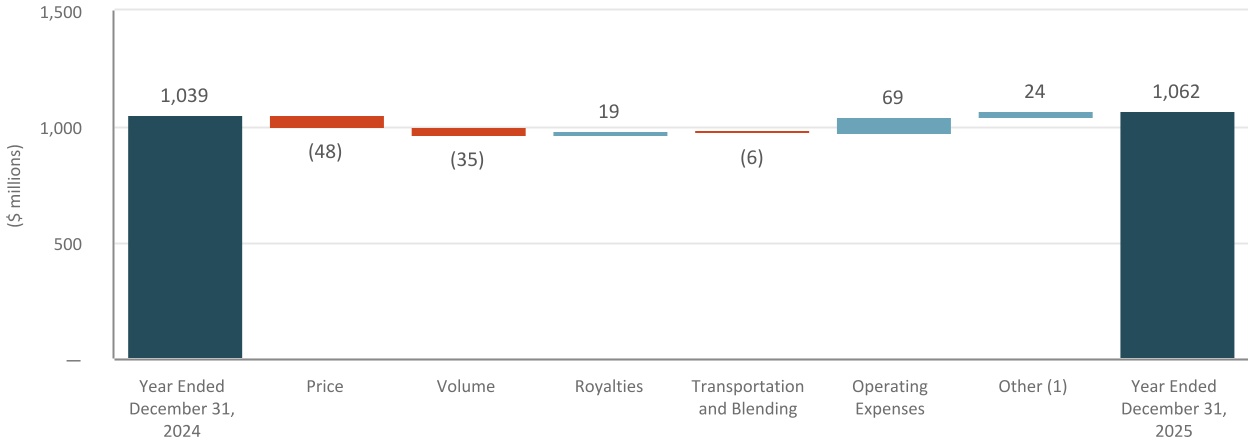
Operating Margin Variance
Year Ended December 31, 2025
(1)Reported revenues include the value of condensate sold as heavy oil blend. Condensate costs are recorded in transportation and blending expenses. The crude oil price excludes the impact of condensate purchases. Changes to price include the impact of realized risk management gains and losses.
(2)Includes third-party sourced volumes, construction and other activities not attributable to the production of crude oil or natural gas.
Operating Results
| | | | | | | | | | | | | | | | | | | | |
| | | | | | | | |
| | | | | 2025 | | 2024 | | | | | |
Total Sales Volumes (1) (MBOE/d) | | | | | 644.7 | | | 599.5 | | | | | | |
| | | | | | | | | | | | |
Crude Oil Production by Asset (Mbbls/d) | | | | | | | | | | | | |
| Foster Creek | | | | | 206.1 | | | 196.0 | | | | | | |
Christina Lake (2) | | | | | 254.3 | | | 234.2 | | | | | | |
Sunrise | | | | | 53.8 | | | 49.6 | | | | | | |
| Lloydminster Thermal | | | | | 102.6 | | | 111.5 | | | | | | |
| Lloydminster Conventional Heavy Oil | | | | | 25.1 | | | 17.6 | | | | | | |
Total Crude Oil Production (3) (Mbbls/d) | | | | | 641.9 | | | 608.9 | | | | | | |
Natural Gas (1) (MMcf/d) | | | | | 13.8 | | | 11.1 | | | | | | |
Total Production (MBOE/d) | | | | | 644.1 | | | 610.7 | | | | | | |
| | | | | | | | | | | | |
Netback (4) ($/bbl) | | | | | | | | | | | | |
Realized Sales Price | | | | | 72.07 | | | 80.20 | | | | | | |
Royalties | | | | | 12.61 | | | 14.92 | | | | | | |
Transportation and Blending | | | | | 9.28 | | | 9.00 | | | | | | |
Operating | | | | | 11.81 | | | 11.40 | | | | | | |
Total Netback ($/bbl) | | | | | 38.37 | | | 44.88 | | | | | | |
| | | | | | | | | | | | |
| | | | | | | | | | | | |
(1)Bitumen, heavy crude oil and natural gas. Natural gas is a conventional natural gas product type.
(2)Includes results of the MEG Acquisition from November 13, 2025.
(3)Crude oil production is primarily bitumen, except for Lloydminster conventional heavy oil, which is heavy crude oil.
(4)Contains a non-GAAP financial measure. See the Specified Financial Measures Advisory of this MD&A.
Revenues
Gross sales were relatively consistent in 2025 compared with 2024, due to lower Realized Sales Prices, offset by higher sales volumes.
| | | | | |
| Cenovus Energy Inc. – 2025 Management's Discussion and Analysis | 18 |
Price
Our bitumen and heavy oil production must be blended with condensate to reduce its viscosity in order to transport it to market through pipelines. Within our Netback calculations, our realized bitumen and heavy oil sales price excludes the impact of purchased condensate; however, it is influenced by the price of condensate. As the cost of condensate used for blending increases relative to the price of blended crude oil or our blend ratio increases, our realized bitumen and heavy oil sales price decreases.
Our Realized Sales Price decreased in 2025 compared with 2024, mainly due to a lower WTI benchmark price, partially offset by a narrower WTI-WCS differential.
Cenovus makes storage and transportation decisions to use our marketing and transportation infrastructure, including storage and pipeline assets, in order to optimize product mix, delivery points, transportation commitments and customer diversification. To price protect our inventories associated with storage or transport decisions, Cenovus may employ various price alignment and volatility management strategies, including risk management contracts, to reduce volatility in future cash flows and improve cash flow stability.
In 2025, approximately 37 percent (2024 – 33 percent) of our sales volumes were sold at destinations outside of Alberta and approximately 25 percent (2024 – 20 percent) of our sales volumes were sold to our downstream operations.
Production Volumes
Oil Sands crude oil production increased in 2025, compared with 2024, primarily due to:
•Incremental production at Christina Lake following the MEG Acquisition in November 2025 and the ramp-up of production from Narrows Lake.
•Successful results from new well pads at Foster Creek and the completion of the Foster Creek optimization project, which supported additional production.
•Strong base production and additional volumes from new development wells at our Lloydminster conventional heavy oil assets.
The increase was partially offset by the temporary shut-in of production at our Rush Lake facilities following an incident in the second quarter of 2025.
Royalties
Royalty calculations for our Oil Sands segment are based on government prescribed royalty regimes in Alberta and Saskatchewan.
In Alberta, oil sands royalties are based on government prescribed pre- and post-payout royalty rates, which are determined on a sliding scale using the Canadian dollar equivalent WTI benchmark price.
Royalties for a pre-payout project are based on a monthly calculation that applies a royalty rate (ranging from one percent to nine percent, based on the Canadian dollar equivalent WTI benchmark price) to the gross revenues from the project. Sunrise is a pre-payout project.
Royalties for a post-payout project are based on an annualized calculation which uses the greater of: (1) the gross revenues multiplied by the applicable royalty rate (one percent to nine percent, based on the Canadian dollar equivalent WTI benchmark price); or (2) the net revenues of the project multiplied by the applicable royalty rate (25 percent to 40 percent, based on the Canadian dollar equivalent WTI benchmark price). Gross revenues are a function of sales revenues less diluent costs and transportation costs. Net revenues are calculated as sales revenues less diluent costs, transportation costs, and allowed operating and capital costs.
In Saskatchewan, royalty calculations are based on an annual rate that is applied to each project, which includes each project's Crown and freehold split. For Crown royalties, the pre-payout calculation is based on one percent of product revenues and the post-payout calculation is based on 20 percent of operating margin. The freehold calculation is limited to post-payout projects and is based on an eight percent rate.
| | | | | |
| Cenovus Energy Inc. – 2025 Management's Discussion and Analysis | 19 |
Effective Royalty Rate (1)
| | | | | | | | | | | | | | | | | | | | |
| | | | | | | | |
Percent | | | | | 2025 | | 2024 | | | | | |
| Foster Creek | | | | | 22.5 | | | 24.0 | | | | | | |
| Christina Lake | | | | | 25.3 | | | 27.3 | | | | | | |
Sunrise | | | | | 6.2 | | | 6.1 | | | | | | |
Lloydminster (2) | | | | | 12.2 | | | 11.7 | | | | | | |
| Total Effective Royalty Rate | | | | | 20.0 | | | 21.0 | | | | | | |
(1)Effective royalty rates are equal to royalty expense divided by product revenue, net of transportation expenses, excluding realized (gain) loss on risk management.
(2)Composed of Lloydminster thermal and Lloydminster conventional heavy oil assets.
In 2025, Oil Sands royalties decreased compared with 2024, mainly due to lower realized pricing, partially offset by higher sales volumes. The Oil Sands effective royalty rate decreased, primarily due to lower realized prices and lower Alberta sliding scale oil sands royalty rates, combined with annual adjustments in 2025.
Expenses
Transportation and Blending
In 2025, blending expenses decreased compared with 2024, primarily due to lower condensate prices, partially offset by higher sales volumes.
In 2025, transportation expenses and per-unit transportation expenses increased compared with 2024, primarily due to higher sales volumes on TMX and increased pipeline transportation rates on shipments to U.S. destinations, partially offset by lower sales volumes at U.S. destinations.
Per-Unit Transportation Expenses (1)
| | | | | | | | | | | | | | | | | |
| | | | | |
| ($/bbl) | | | | | 2025 | | 2024 | | |
Foster Creek | | | | | 14.36 | | | 13.57 | | | |
Christina Lake | | | | | 6.86 | | | 6.53 | | | |
Sunrise | | | | | 15.42 | | | 16.07 | | | |
Lloydminster (2) | | | | | 3.23 | | | 3.95 | | | |
Total Oil Sands | | | | | 9.28 | | | 9.00 | | | |
(1)Specified financial measure. See the Specified Financial Measures Advisory of this MD&A.
(2)Includes Lloydminster thermal and Lloydminster conventional heavy oil assets.
At Foster Creek, per-unit transportation expenses increased primarily due to higher sales volumes sold at West Coast destinations through the use of TMX, increasing to 32 percent (2024 – 20 percent), partially offset by lower rail costs. In 2025, our sales volumes to U.S. destinations were relatively consistent at 36 percent, compared with 37 percent in 2024.
At Christina Lake, per-unit transportation expenses increased primarily due to higher pipeline rates and higher sales volumes at West Coast destinations through the use of TMX, which increased to one percent, compared with no sales volumes in 2024. In 2025, our sales volumes to U.S. destinations were relatively consistent at 17 percent, compared with 18 percent in 2024.
At Sunrise, per-unit transportation expenses decreased primarily due to lower sales volumes at U.S. destinations, partially offset by higher use of TMX. In 2025, 36 percent of our sales volumes were sold at U.S. destinations (2024 – 67 percent) and 51 percent of our sales volumes were sold at West Coast destinations (2024 – 18 percent).
At Lloydminster, per-unit transportation expenses decreased primarily due to sales volumes at U.S. destinations decreasing to one percent compared with three percent in 2024.
Operating
Primary drivers of our operating expenses in 2025 were fuel, repairs and maintenance, and workforce. Total operating expenses in 2025 increased compared with 2024, primarily due to higher fuel costs and higher costs at our Lloydminster thermal assets related to the incident at Rush Lake.
| | | | | |
| Cenovus Energy Inc. – 2025 Management's Discussion and Analysis | 20 |
Per-Unit Operating Expenses (1)
| | | | | | | | | | | | | | | | | | | | | | | | | | | |
| | | | | | | |
($/bbl) | | | | | | | 2025 | | Percent
Change | | 2024 | | | | |
| Foster Creek | | | | | | | | | | | | | | | |
Fuel | | | | | | | 2.12 | | | 1 | | | 2.10 | | | | | |
Non-Fuel | | | | | | | 7.64 | | | (2) | | | 7.77 | | | | | |
Total | | | | | | | 9.76 | | | (1) | | | 9.87 | | | | | |
| Christina Lake | | | | | | | | | | | | | | | |
| Fuel | | | | | | | 2.23 | | | 7 | | | 2.09 | | | | | |
| Non-Fuel | | | | | | | 5.98 | | | (9) | | | 6.54 | | | | | |
Total | | | | | | | 8.21 | | | (5) | | | 8.63 | | | | | |
| Sunrise | | | | | | | | | | | | | | | |
| Fuel | | | | | | | 3.68 | | | 27 | | | 2.89 | | | | | |
| Non-Fuel | | | | | | | 13.85 | | | 21 | | | 11.47 | | | | | |
Total | | | | | | | 17.53 | | | 22 | | | 14.36 | | | | | |
Lloydminster (2) | | | | | | | | | | | | | | | |
| Fuel | | | | | | | 2.98 | | | 9 | | | 2.74 | | | | | |
| Non-Fuel | | | | | | | 17.03 | | | 15 | | | 14.78 | | | | | |
Total | | | | | | | 20.01 | | | 14 | | | 17.52 | | | | | |
| | | | | | | | | | | | | | | |
| Total Oil Sands | | | | | | | | | | | | | | | |
| Fuel | | | | | | | 2.46 | | | 7 | | | 2.30 | | | | | |
| Non-Fuel | | | | | | | 9.35 | | | 3 | | | 9.10 | | | | | |
| Total | | | | | | | 11.81 | | | 4 | | | 11.40 | | | | | |
(1)Specified financial measure. See the Specified Financial Measures Advisory of this MD&A.
(2)Includes Lloydminster thermal and Lloydminster conventional heavy oil assets.
Per-unit fuel expenses increased in 2025, compared with 2024, due to higher AECO benchmark pricing and increased consumption volumes from well pads coming online at our Sunrise assets.
Foster Creek per-unit non-fuel costs decreased slightly in 2025, compared with 2024, primarily due to higher sales volumes, partially offset by higher turnaround costs in the second quarter of 2025.
Christina Lake per-unit non-fuel costs decreased in 2025, primarily due to higher sales volumes and lower turnaround expenses, compared with 2024.
Sunrise per-unit non-fuel costs increased in 2025, compared with 2024, primarily due to turnaround activities in the second and third quarters of 2025, partially offset by higher sales volumes.
Lloydminster per-unit non-fuel costs increased in 2025, compared with 2024, due to higher costs related to the Rush Lake incident in the second quarter of 2025.
Conventional
In 2025, we:
•Delivered safe and reliable operations.
•Produced 122.8 thousand BOE per day (2024 – 119.9 thousand BOE per day).
•Generated Operating Margin of $457 million, an increase of $166 million from 2024.
•Earned a Netback of $10.37 per BOE (2024 – $6.48 per BOE).
•Invested capital of $453 million, primarily related to drilling, completion, tie-in and infrastructure projects.
| | | | | |
| Cenovus Energy Inc. – 2025 Management's Discussion and Analysis | 21 |
Financial Results
| | | | | | | | | | | | | | | | | |
| | | | | |
| ($ millions) | | | | | 2025 | | 2024 | | |
| | | | | | | | | |
| Gross Sales | | | | | | | | | |
External Sales | | | | | 1,305 | | | 1,211 | | | |
Intersegment Sales | | | | | 1,355 | | | 1,848 | | | |
| | | | | 2,660 | | | 3,059 | | | |
| Royalties | | | | | (55) | | | (76) | | | |
| Revenues | | | | | 2,605 | | | 2,983 | | | |
| Expenses | | | | | | | | | |
| Purchased Product | | | | | 1,337 | | | 1,823 | | | |
Transportation and Blending | | | | | 351 | | | 320 | | | |
| Operating | | | | | 464 | | | 555 | | | |
| Realized (Gain) Loss on Risk Management | | | | | (4) | | | (6) | | | |
| Operating Margin | | | | | 457 | | | 291 | | | |
Unrealized (Gain) Loss on Risk Management | | | | | (4) | | | 4 | | | |
| Depreciation, Depletion and Amortization | | | | | 479 | | | 442 | | | |
| Exploration Expense | | | | | 22 | | | 1 | | | |
| (Income) Loss From Equity-Accounted Affiliates | | | | | — | | | 2 | | | |
| Segment Income (Loss) | | | | | (40) | | | (158) | | | |
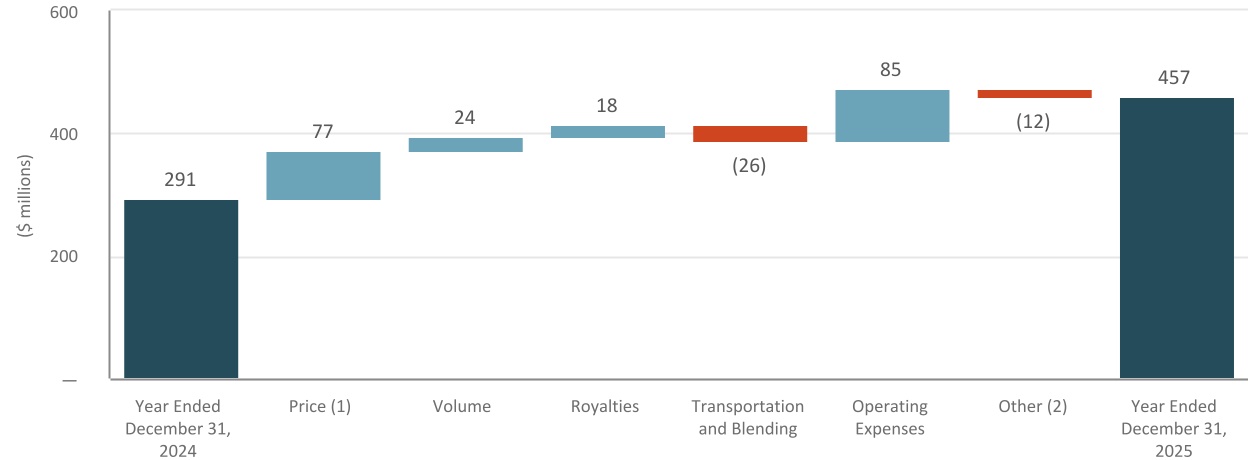
Operating Margin Variance
Year Ended December 31, 2025
(1)Changes to price include the impact of realized risk management gains and losses.
(2)Includes reclassification of costs primarily related to third-party cogeneration, processing and transportation.
| | | | | |
| Cenovus Energy Inc. – 2025 Management's Discussion and Analysis | 22 |
Operating Results
| | | | | | | | | | | | | | | | | |
| | | | | |
| | | | | 2025 | | 2024 | | |
Total Sales Volumes (1) (MBOE/d) | | | | | 122.8 | | | 119.9 | | | |
| | | | | | | | | |
Realized Sales Price (1) (2) ($/BOE) | | | | | | | | | |
Light Crude Oil ($/bbl) | | | | | 78.50 | | | 92.68 | | | |
NGLs ($/bbl) | | | | | 51.83 | | | 54.62 | | | |
Conventional Natural Gas ($/Mcf) | | | | | 3.13 | | | 2.51 | | | |
| | | | | | | | | |
Production by Product (1) | | | | | | | | | |
Light Crude Oil (Mbbls/d) | | | | | 5.0 | | | 4.9 | | | |
NGLs (Mbbls/d) | | | | | 21.2 | | | 21.0 | | | |
Conventional Natural Gas (MMcf/d) | | | | | 579.3 | | | 563.8 | | | |
Total Production (MBOE/d) | | | | | 122.8 | | 119.9 | | |
| | | | | | | | | |
Conventional Natural Gas Production (percentage of total) | | | | | 79 | | | 78 | | | |
Crude Oil and NGLs Production (percentage of total) | | | | | 21 | | | 22 | | | |
| | | | | | | | | |
Effective Royalty Rate (1) (3) (percent) | | | | | 8.0 | | | 10.3 | | | |
| | | | | | | | | |
Netback (1) (2) ($/BOE) | | | | | | | | | |
Realized Sales Price | | | | | 26.95 | | | 25.18 | | | |
Royalties | | | | | 1.30 | | | 1.73 | | | |
Transportation and Blending | | | | | 5.44 | | | 4.98 | | | |
Operating | | | | | 9.84 | | | 11.99 | | | |
Total Netback ($/BOE) | | | | | 10.37 | | | 6.48 | | | |
| | | | | | | | | |
| | | | | | | | | |
| | | | | | | | | |
| | | | | | | | | |
| | | | | | | | | |
| | | | | | | | | |
(1)For the year ended December 31, 2025, reported production volumes, sales volumes, associated per-unit values and effective royalty rates include Cenovus’s 30 percent equity interest in the Duvernay joint venture.
(2)Contains a non-GAAP financial measure. See the Specified Financial Measures Advisory of this MD&A.
(3)Effective royalty rates are equal to royalty expense divided by product revenue, net of transportation expenses, excluding realized (gain) loss on risk management.
Revenues
Gross sales decreased in 2025, compared with 2024, due to lower commodity trading volumes sourced from third parties, partially offset by higher Realized Sales Prices and sales volumes.
Price
Our total Realized Sales Price increased in 2025, compared with 2024, primarily due to higher sales volumes to U.S. destinations. In 2025, 31 percent of our natural gas sales volumes were sold at U.S. destinations (2024 – 28 percent) where NYMEX natural gas benchmark prices increased to US$3.43 per Mcf (2024 – US$2.27 per Mcf). The year-over-year increase was also due to AECO natural gas benchmark prices increasing to $1.68 per Mcf (2024 – $1.46 per Mcf).
Production Volumes
Production volumes increased in 2025, compared with 2024, primarily due to strong base performance. In 2024, production volumes were lower due to turnaround activities.
Royalties
The Conventional assets are subject to royalty regimes in Alberta and British Columbia. Royalties and the effective royalty rate decreased in 2025, compared with 2024, primarily due to overall lower benchmark prices used to calculate our royalties.
Expenses
Transportation
Our transportation expenses reflect charges for the movement of crude oil, NGLs and natural gas from the point of production to where the product is sold. In 2025, transportation expenses and per-unit transportation expenses increased compared with 2024, due to increased pipeline transportation rates.
| | | | | |
| Cenovus Energy Inc. – 2025 Management's Discussion and Analysis | 23 |
Operating
Primary drivers of operating expenses in 2025 were repairs and maintenance, workforce and property tax costs. Total operating expenses and per-unit operating expenses decreased compared with 2024, primarily due to lower turnaround costs, and processing and gathering costs.
Offshore
In 2025, we:
•Delivered safe and reliable operations.
•Produced 67.3 thousand BOE per day of light crude oil, NGLs and natural gas (2024 – 66.6 thousand BOE per day).
•Generated Operating Margin of $1.1 billion, an increase of $23 million from 2024.
•Averaged a Netback of $52.27 per BOE (2024 – $52.38 per BOE).
•Invested capital of $934 million, mainly related to the progression of the West White Rose project.
In 2025, we have made significant progress on the West White Rose project. The topsides were placed atop the concrete gravity structure, and we completed the subsea tie-ins to our existing production system at the SeaRose FPSO. Hookup and commissioning of the platform continued to progress and was substantially completed in the fourth quarter of 2025, despite challenging offshore weather conditions. First oil is anticipated in the second quarter of 2026.
Financial Results
| | | | | | | | | | | | | | | | | | | | | | | | | | | | | | | | | | | |
| |
| 2025 | | 2024 |
| ($ millions) | Atlantic | | Asia Pacific | | Offshore | | Atlantic | | Asia Pacific | | Offshore |
| Gross Sales | | | | | | | | | | | |
External Sales | 420 | | 1,088 | | 1,508 | | 322 | | 1,250 | | 1,572 |
Intersegment Sales | — | | — | | — | | — | | — | | — |
| 420 | | 1,088 | | 1,508 | | 322 | | 1,250 | | 1,572 |
Royalties | (4) | | (76) | | (80) | | (2) | | (97) | | (99) |
| Revenues | 416 | | 1,012 | | 1,428 | | 320 | | 1,153 | | 1,473 |
| Expenses | | | | | | | | | | | |
| Purchased Product | — | | — | | — | | — | | — | | — |
Transportation and Blending | 17 | | — | | 17 | | 11 | | — | | 11 |
Operating | 226 | | 123 | | 349 | | 290 | | 133 | | 423 |
Operating Margin (1) | 173 | | 889 | | 1,062 | | 19 | | 1,020 | | 1,039 |
| Depreciation, Depletion and Amortization | | | | | 440 | | | | | | 563 |
| Exploration Expense | | | | | 8 | | | | | | 66 |
| (Income) Loss from Equity-Accounted Affiliates | | | | | (31) | | | | | | (53) |
| Segment Income (Loss) | | | | | 645 | | | | | | 463 |
(1)Atlantic and Asia Pacific Operating Margin are non-GAAP financial measures. See the Specified Financial Measures Advisory of this MD&A.
| | | | | |
| Cenovus Energy Inc. – 2025 Management's Discussion and Analysis | 24 |
Operating Margin Variance
Year Ended December 31, 2025
(1)Includes other activities not attributable to the production of crude oil and natural gas.
Operating Results
| | | | | | | | | | | | | | | |
| | | |
| | | | | 2025 | | 2024 |
Sales Volumes | | | | | | | |
Atlantic (Mbbls/d) | | | | | 11.3 | | | 8.0 | |
Asia Pacific (MBOE/d) | | | | | | | |
| China | | | | | 38.3 | | 42.6 |
Indonesia (1) | | | | | 15.9 | | 16.0 |
| Total Asia Pacific | | | | | 54.2 | | 58.6 |
Total Sales Volumes (MBOE/d) | | | | | 65.5 | | 66.6 | |
| | | | | | | |
| Production by Product | | | | | | | |
Atlantic – Light Crude Oil (Mbbls/d) | | | | | 13.1 | | 8.0 |
Asia Pacific (1) | | | | | | | |
NGLs (Mbbls/d) | | | | | 7.6 | | 11.0 |
Conventional Natural Gas (MMcf/d) | | | | | 279.3 | | 285.3 |
Total Asia Pacific (MBOE/d) | | | | | 54.2 | | 58.6 |
Total Production (MBOE/d) | | | | | 67.3 | | 66.6 |
| | | | | | | |
Effective Royalty Rate (2) (percent) | | | | | | | |
| Atlantic | | | | | 1.0 | | | 0.7 | |
Asia Pacific (1) | | | | | 11.1 | | | 9.5 | |
| | | | | | | |
| | | | | | | |
(1)Reported sales volumes, production volumes and royalty rates reflect Cenovus’s 40 percent equity interest in the HCML joint venture.
(2)Effective royalty rates are equal to royalty expense divided by product revenue, net of transportation expenses, excluding realized (gain) loss on risk management.
| | | | | |
| Cenovus Energy Inc. – 2025 Management's Discussion and Analysis | 25 |
Netbacks (1)
| | | | | | | | | | | | | | | | | | | | | | | | | | |
| 2025 |
| ($/BOE, except where indicated) | Atlantic ($/bbl) | | China | Indonesia | Total Offshore (2) |
| | | | | | | | |
Realized Sales Price | | 97.11 | | | 77.81 | | | 59.31 | | | 76.66 | |
Royalties | | 0.95 | | | 5.43 | | | 14.34 | | | 6.81 | |
| Transportation and Blending | | 4.04 | | | — | | | — | | | 0.70 | |
| Operating Expenses | | 54.07 | | | 8.16 | | | 11.39 | | | 16.88 | |
Netback | | 38.05 | | | 64.22 | | | 33.58 | | | 52.27 | |
| | | | | | | | | | | | | | | | | | | | | | | | | | |
| 2024 |
| ($/BOE, except where indicated) | Atlantic ($/bbl) | | China | Indonesia | Total Offshore (2) |
| | | | | | | | |
Realized Sales Price | | 109.58 | | | 80.26 | | | 57.82 | | | 78.40 | |
Royalties | | 0.72 | | | 6.19 | | | 9.32 | | | 6.29 | |
| Transportation and Blending | | 3.81 | | | — | | | — | | | 0.46 | |
| Operating Expenses | | 97.70 | | | 7.61 | | | 10.93 | | | 19.27 | |
Netback | | 7.35 | | | 66.46 | | | 37.57 | | | 52.38 | |
(1)Contains a non-GAAP financial measure. See the Specified Financial Measures Advisory of this MD&A.
(2)Reported per-unit values reflect Cenovus’s 40 percent equity interest in the HCML joint venture.
Revenues
Gross sales decreased in 2025, compared with 2024, due to lower sales volumes in China and lower Realized Sales Prices, partially offset by higher sales volumes in our Atlantic operations.
Price
Our Atlantic Realized Sales Price decreased in 2025, compared with 2024, due to lower Brent benchmark pricing. The prices we receive for natural gas sold in Asia Pacific are set under long-term contracts.
Production Volumes
Light crude oil production from the White Rose and Terra Nova fields are offloaded from the SeaRose and Terra Nova FPSO vessels, respectively, to tankers and stored at an onshore terminal before shipment to buyers, which results in a timing difference between production and sales.
Atlantic production increased in 2025, compared with 2024, primarily due to production resuming at the White Rose field in the first quarter of 2025 following completion of the SeaRose ALE project. Atlantic production was lower in 2024, as production at the White Rose field was suspended in late December 2023 in preparation for the project.
Asia Pacific production decreased in 2025, compared with 2024, primarily due to lower contracted sales volumes in China.
Royalties
Royalty rates at the White Rose and Terra Nova fields are governed by an agreement with the Government of Newfoundland and Labrador which limits royalties to one percent of gross revenues until certain costs incurred have been recovered. For the year ended December 31, 2025, the Atlantic effective royalty rate was relatively consistent compared with 2024.
Royalty rates in Asia Pacific are governed by production-sharing contracts, in which production is shared with the Chinese and Indonesian governments.
Expenses
Transportation
Transportation expenses include the costs of transporting crude oil from the SeaRose and Terra Nova FPSOs to onshore terminals and storage costs. Transportation expenses for the year ended December 31, 2025, increased to $17 million (2024 – $11 million), primarily due to higher Atlantic sales volumes.
Operating
Primary drivers of our Atlantic operating expenses in 2025 were repairs and maintenance, costs related to vessels and air services, and workforce. Operating expenses decreased compared with 2024, primarily due to lower repairs and maintenance, and vessels and air service costs as the SeaRose ALE project was completed in the first quarter of 2025. Per-unit operating expenses decreased compared with 2024, due to higher sales volumes and lower costs related to the SeaRose ALE project, as discussed.
| | | | | |
| Cenovus Energy Inc. – 2025 Management's Discussion and Analysis | 26 |
Primary drivers of our China operating expenses in 2025 were repairs and maintenance, workforce and insurance costs. Per-unit operating expenses increased in 2025, compared with 2024, primarily due to lower sales volumes.
Primary drivers of our Indonesia operating expenses in 2025 were repairs and maintenance, and workforce costs. Per-unit operating expenses increased, compared with 2024, due to higher repairs and maintenance costs, partially offset by lower vessel costs.
DOWNSTREAM
Canadian Refining
In 2025, we:
•Delivered safe and reliable operations.
•Achieved record annual throughput of 110.7 thousand barrels per day and crude unit utilization of 103 percent (2024 – 90.5 thousand barrels per day and 84 percent, respectively).
•Incurred per-unit operating expenses excluding turnaround costs of $11.54 per barrel (2024 – $15.38 per barrel).
•Generated Operating Margin of $354 million, an increase of $434 million from 2024.
•Invested capital of $117 million, primarily focused on sustaining activities.
Financial and Operating Results
| | | | | | | | | | | | | | | |
| | | |
($ millions) | | | | | 2025 | | 2024 |
| | | | | | | |
| | | | | | | |
| | | | | | | |
| Revenues | | | | | 5,079 | | | 5,310 | |
| | | | | | | |
| | | | | | | |
| Purchased Product | | | | | 4,128 | | | 4,483 | |
Gross Margin (1) | | | | | 951 | | | 827 | |
| Expenses | | | | | | | |
| Operating | | | | | 597 | | | 907 | |
| Operating Margin | | | | | 354 | | | (80) | |
| Depreciation, Depletion and Amortization | | | | | 178 | | | 185 | |
| Segment Income (Loss) | | | | | 176 | | | (265) | |
| | | | | | | |
| | | | | | | |
| | | | | | | |
| | | | | | | |
| | | | | | | |
| | | | | | | |
| | | | | | | |
| | | | | | | |
| | | | | | | |
| | | | | | | |
| | | | | | | |
| | | | | | | |
| | | | | | | |
| | | | | | | |
| | | | | | | |
| | | | | | | |
| | | | | | | |
| | | | | | | |
| | | | | | | |
| | | | | | | |
(1)Non-GAAP financial measure. See the Specified Financial Measures Advisory of this MD&A.
| | | | | | | | | | | | | | | |
| | | |
($ millions, except where indicated) | | | | | 2025 | | 2024 |
| | | | | | | |
| | | | | | | |
| Gross Margin | | | | | 951 | | 827 |
Add (Deduct): | | | | | | | |
Inventory Holding (Gain) Loss (1) | | | | | 3 | | (2) |
Adjusted Gross Margin (2) | | | | | 954 | | 825 |
| | | | | | | |
| | | | | | | |
| | | | | | | |
| | | | | | | |
Adjusted Refining Margin (3) ($/bbl) | | | | | 19.57 | | 20.72 |
| | | | | | | |
| | | | | | | |
(1)Inventory holding (gain) loss reflects the difference between the cost of volumes produced at current-period costs and the cost of volumes produced under the first-in, first-out (“FIFO”) or weighted average cost basis, as required by IFRS Accounting Standards.
(2)Non-GAAP financial measure. See the Specified Financial Measures Advisory of this MD&A.
(3)Contains a non-GAAP financial measure. See the Specified Financial Measures Advisory of this MD&A. Revenues from the Upgrader, the Lloydminster Refinery and the commercial fuels business for the year ended December 31, 2025, were $4.8 billion (2024 – $5.0 billion).
Revenues, Adjusted Gross Margin and Adjusted Refining Margin
The Upgrader processes blended heavy crude oil and bitumen into high-value synthetic crude oil and low-sulphur diesel. Upgrading Gross Margin is primarily dependent on the differential between the sales price of synthetic crude oil and diesel, and the cost of heavy crude oil and bitumen feedstock.
The Lloydminster Refinery processes blended heavy crude oil into asphalt, bulk distillates and industrial products. Gross Margin is largely dependent on asphalt and industrial products pricing, and the cost of heavy crude oil feedstock.
Revenues decreased compared with 2024, due to lower refined product pricing partially offset by higher sales volumes.
Adjusted Gross Margin increased in 2025, compared with 2024, primarily due to lower feedstock costs as a result of lower benchmark crude pricing and higher sales volumes, partially offset by lower refined product pricing and the narrowing of the WTI-WCS differential.
Adjusted Refining Margin decreased in 2025, as the increase in Adjusted Gross Margin, as discussed above, was more than offset by the increase in total processed inputs.
| | | | | |
| Cenovus Energy Inc. – 2025 Management's Discussion and Analysis | 27 |
| | | | | | | | | | | | | | | |
| | | |
| (Mbbls/d, except where indicated) | | | | | 2025 | | 2024 |
| | | | | | | |
| | | | | | | |
| | | | | | | |
| | | | | | | |
| | | | | | | |
| | | | | | | |
| | | | | | | |
| | | | | | | |
| | | | | | | |
| | | | | | | |
| | | | | | | |
| | | | | | | |
Operable Capacity | | | | | 108.0 | | | 108.0 | |
| | | | | | | |
Total Processed Inputs | | | | | 119.4 | | | 96.6 | |
| | | | | | | |
| Crude Oil Unit Throughput | | | | | 110.7 | | | 90.5 | |
| | | | | | | |
Crude Unit Utilization (percent) | | | | | 103 | | | 84 | |
| | | | | | | |
Total Production | | | | | 127.3 | | | 103.1 | |
| Synthetic Crude Oil | | | | | 52.0 | | | 41.0 | |
| Asphalt | | | | | 17.9 | | | 15.7 | |
| Diesel | | | | | 15.2 | | | 10.8 | |
Other | | | | | 37.2 | | | 30.8 | |
| Ethanol | | | | | 5.0 | | | 4.8 | |
The Upgrader and Lloydminster Refinery source their crude oil feedstock from our Oil Sands segment. In 2025, 14 percent of our Oil Sands segment’s sales volumes were purchased by our Canadian Refining segment (2024 – 12 percent).
Throughput and total production increased in 2025, compared with 2024. In 2025, our assets ran at, or above, full capacity due to ongoing improvement initiatives and high asset reliability. In 2024, we safely completed the largest turnaround in the history of the Upgrader, which decreased throughput and increased operating expenses.
Operating Expenses
The following table and discussion represent operating expenses associated with the Upgrader, the Lloydminster Refinery and the commercial fuels business.
| | | | | | | | | | | | | | | |
| | | |
| ($ millions, except where indicated) | | | | | 2025 | | 2024 |
| | | | | | | |
| Operating Expenses – Upgrading and Refining | | | | | 505 | | | 798 | |
Operating Expenses – Excluding Turnaround Costs | | | | | 503 | | | 544 | |
Operating Expenses – Turnaround Costs | | | | | 2 | | | 254 | |
| | | | | | | |
Per-Unit Operating Expenses (1) ($/bbl) | | | | | 11.59 | | | 22.56 | |
Per-Unit Operating Expenses – Excluding Turnaround Costs | | | | | 11.54 | | | 15.38 | |
Per-Unit Operating Expenses – Turnaround Costs | | | | | 0.05 | | | 7.18 | |
(1)Specified financial measure. See the Specified Financial Measures Advisory of this MD&A.
Primary drivers of operating expenses were workforce, and repairs and maintenance.
In 2025, operating expenses decreased compared with 2024, mainly due to lower turnaround costs and other project costs. Turnaround costs and other project costs were higher in 2024 due to the turnaround completed at the Upgrader, as discussed above.
Operating expenses excluding turnaround costs decreased in 2025, compared with 2024, due to lower project costs.
In 2025, the decrease in operating expenses, combined with increased total processed inputs, resulted in decreased per-unit operating expense metrics compared with 2024.
U.S. Refining
In 2025, we:
•Delivered safe and reliable operations.
•Recorded throughput of 515.9 thousand barrels per day compared with 556.4 thousand barrels per day in 2024 and crude unit utilization of 94 percent (2024 – 91 percent).
•Decreased per-unit operating expenses excluding turnaround costs to $10.88 per barrel (2024 – $11.55 per barrel).
•Recorded an Operating Margin shortfall of $149 million (2024 – $232 million).
•Invested capital of $442 million, primarily focused on reliability and sustaining activities.
•Completed the WRB Divestiture on September 30, 2025.
| | | | | |
| Cenovus Energy Inc. – 2025 Management's Discussion and Analysis | 28 |
Financial and Operating Results
| | | | | | | | | | | | | | | |
| | | |
($ millions) | | | | | 2025 | | 2024 |
| | | | | | | |
| | | | | | | |
| | | | | | | |
| Revenues | | | | | 24,118 | | | 28,308 | |
| | | | | | | |
| | | | | | | |
| Purchased Product | | | | | 21,727 | | | 25,769 | |
Gross Margin (1) | | | | | 2,391 | | | 2,539 | |
| Expenses | | | | | | | |
| | | | | | | |
| Operating | | | | | 2,546 | | | 2,763 | |
| Realized (Gain) Loss on Risk Management | | | | | (6) | | | 8 | |
| Operating Margin | | | | | (149) | | | (232) | |
| Unrealized (Gain) Loss on Risk Management | | | | | (5) | | | 8 | |
| Depreciation, Depletion and Amortization | | | | | 566 | | | 462 | |
| Segment Income (Loss) | | | | | (710) | | | (702) | |
| | | | | | | |
| | | | | | | |
| | | | | | | |
| | | | | | | |
| | | | | | | |
| | | | | | | |
| | | | | | | |
| | | | | | | |
| | | | | | | |
| | | | | | | |
| | | | | | | |
| | | | | | | |
| | | | | | | |
| | | | | | | |
| | | | | | | |
| | | | | | | |
| | | | | | | |
| | | | | | | |
| | | | | | | |
| | | | | | | |
| | | | | | | |
(1)Non-GAAP financial measure. See the Specified Financial Measures Advisory of this MD&A.
| | | | | | | | | | | | | | | |
| | | |
| ($ millions, except where indicated) | | | | | 2025 | | 2024 |
| | | | | | | |
| | | | | | | |
| | | | | | | |
| Gross Margin | | | | | 2,391 | | | 2,539 | |
Add (Deduct): | | | | | | | |
Inventory Holding (Gain) Loss (1) | | | | | 298 | | | (23) | |
Adjusted Gross Margin (2) | | | | | 2,689 | | | 2,516 | |
| | | | | | | |
| | | | | | | |
Adjusted Refining Margin (2) ($/bbl) | | | | | 13.44 | | | 11.83 | |
| | | | | | | |
Weighted Average Crack Spread, Net of RINs (US$/bbl) | | | | | 13.85 | | | 13.01 | |
Weighted Average Crack Spread, Net of RINs (C$/bbl) | | | | | 19.34 | | | 17.82 | |
| | | | | | | |
| | | | | | | |
Adjusted Market Capture (2) (percent) | | | | | 69 | | | 67 | |
| | | | | | | |
| | | | | | | |
| | | | | | | |
| | | | | | | |
| | | | | | | |
| | | | | | | |
| | | | | | | |
| | | | | | | |
| | | | | | | |
| | | | | | | |
| | | | | | | |
| | | | | | | |
| | | | | | | |
| | | | | | | |
| | | | | | | |
| | | | | | | |
| | | | | | | |
| | | | | | | |
| | | | | | | |
| | | | | | | |
| | | | | | | |
(1)Inventory holding (gain) loss reflects the difference between the cost of volumes produced at current-period costs and the cost of volumes produced under the FIFO or weighted average cost basis, as required by IFRS Accounting Standards.
(2)Non-GAAP financial measure or contains a non-GAAP financial measure. See the Specified Financial Measures Advisory of this MD&A.
Revenues
Revenues decreased in 2025, compared with 2024, primarily due to lower sales volumes as a result of the WRB Divestiture and lower refined product pricing.
Adjusted Gross Margin, Adjusted Refining Margin and Adjusted Market Capture
Benchmark market crack spreads do not precisely mirror the refinery configuration for crude diet and product yields, or the location we sell product; however, they are used as a general market indicator.
In 2025, the Chicago 3-2-1 crack spread increased 16 percent and the Group 3 3-2-1 crack spread increased 23 percent compared with 2024. The increase in crack spreads was partially offset by a 55 percent increase in the average cost of RINs, compared with 2024.
Year-over-year, Adjusted Gross Margin increased primarily due to improved reliability, the receipt of Small Refinery Exemption waivers, and a pipeline settlement. The increase in weighted average crack spreads, net of RINs, was offset by the narrowing of the WTI-WCS differential.
Adjusted Refining Margin, which is the Adjusted Gross Margin on a per-barrel basis, is affected by many factors. Some of these factors include the type of crude oil feedstock processed; refinery configuration and the proportion of gasoline, distillates and secondary product output; and the cost of feedstock.
Adjusted Refining Margin and Adjusted Market Capture increased in 2025, compared with 2024, due to the increase in Adjusted Gross Margin discussed above and lower total processed inputs.
| | | | | |
| Cenovus Energy Inc. – 2025 Management's Discussion and Analysis | 29 |
| | | | | | | | | | | | | | | |
| | | |
| (Mbbls/d, except where indicated) | | | | | 2025 | | 2024 |
| | | | | | | |
| | | | | | | |
| | | | | | | |
| | | | | | | |
| | | | | | | |
| | | | | | | |
| | | | | | | |
| | | | | | | |
| | | | | | | |
| | | | | | | |
| | | | | | | |
| | | | | | | |
| | | | | | | |
| | | | | | | |
| | | | | | | |
| | | | | | | |
Operable Capacity (1) | | | | | 549.9 | | | 612.3 | |
| | | | | | | |
| Total Processed Inputs | | | | | 548.1 | | | 581.4 | |
| | | | | | | |
| Crude Oil Unit Throughput | | | | | 515.9 | | | 556.4 | |
| Heavy Crude Oil | | | | | 197.9 | | | 219.6 | |
| Light/Medium Crude Oil | | | | | 318.0 | | | 336.8 | |
| | | | | | | |
Crude Unit Utilization (1) (percent) | | | | | 94 | | | 91 | |
| | | | | | | |
Total Refined Product Production | | | | | 559.9 | | | 590.0 | |
| Gasoline | | | | | 266.7 | | | 280.5 | |
Distillates (2) | | | | | 195.3 | | | 209.1 | |
| Asphalt | | | | | 23.9 | | | 28.3 | |
| Other | | | | | 74.0 | | | 72.1 | |
(1)For the year ended December 31, 2025, reported operable capacity and crude unit utilization reflects the weighted average impact of the WRB Divestiture, which closed on September 30, 2025.
(2)Includes diesel and jet fuel.
Throughput and refined product production decreased in 2025, compared with 2024. The decrease was primarily due to the WRB Divestiture on September 30, 2025, and turnarounds at our Toledo Refinery and non-operated Wood River and Borger refineries during the year. For the nine months ended September 30, 2025, WRB recorded crude oil throughput of 238.7 thousand barrels per day and refined product production of 248.8 thousand barrels per day net to Cenovus. The decreased throughput and refined product production was partially offset by improved reliability across our operated refineries, driven by ongoing operational improvements made to the U.S. Refining business. In 2024, throughput and refined product production were affected by the turnarounds at the Lima Refinery and non-operated Borger Refinery.
Operating Expenses
| | | | | | | | | | | | | | | |
| | | |
| ($ millions, except where indicated) | | | | | 2025 | | 2024 |
Operating Expenses | | | | | 2,546 | | | 2,763 | |
Operating Expenses – Excluding Turnaround Costs | | | | | 2,176 | | | 2,457 | |
Operating Expenses – Turnaround Costs | | | | | 370 | | | 306 | |
| | | | | | | |
Per-Unit Operating Expenses (1) ($/bbl) | | | | | 12.73 | | | 12.99 | |
Per-Unit Operating Expenses – Excluding Turnaround Costs | | | | | 10.88 | | | 11.55 | |
Per-Unit Operating Expenses – Turnaround Costs | | | | | 1.85 | | | 1.44 | |
(1)Specified financial measure. See the Specified Financial Measures Advisory of this MD&A.
Primary drivers of operating expenses were repairs and maintenance, workforce and turnaround costs.
Operating expenses decreased in 2025, compared with 2024, primarily due to lower repairs and maintenance, and project costs, partially offset by an increase in turnaround costs. Overall operating expenses were lower in 2025, compared with 2024, due in part to the WRB Divestiture in September 2025.
Turnaround costs increased compared with 2024, due to the turnaround completed at the Toledo Refinery and at the non-operated Wood River and Borger refineries. In 2024, turnarounds were completed at the Lima Refinery and the non-operated Borger refinery.
Operating expenses excluding turnaround costs and related per-unit metrics for 2025 decreased compared with 2024. This was mainly due to lower controllable operating expenses, including lower repairs and maintenance and project costs, as well as the positive benefits of ongoing business improvement initiatives and improved reliability in our operated downstream assets. The decreases in operating expenses excluding turnaround costs were partially offset by higher electricity costs.
| | | | | |
| Cenovus Energy Inc. – 2025 Management's Discussion and Analysis | 30 |
CORPORATE AND ELIMINATIONS
Financial Results
| | | | | | | | | | | | | | | |
| | | |
| ($ millions) | | | | | 2025 | | 2024 |
| Realized (Gain) Loss on Risk Management | | | | | (20) | | | 24 | |
| Unrealized (Gain) Loss on Risk Management | | | | | (9) | | | 16 | |
| | | | | | | |
General and Administrative | | | | | 812 | | | 794 | |
| Finance Costs, Net | | | | | 569 | | | 514 | |
| Integration, Transaction and Other Costs | | | | | 234 | | | 166 | |
| Foreign Exchange (Gain) Loss, Net | | | | | (361) | | | 462 | |
| (Gain) Loss on Divestiture of Assets | | | | | (87) | | | (119) | |
| | | | | | | |
Other (Income) Loss, Net | | | | | (115) | | | (55) | |
General and Administrative
Primary drivers of our general and administrative expenses in 2025 were workforce and information technology related costs. The increase in general and administrative costs was primarily due to higher long-term incentive costs, partially offset by general cost saving initiatives.
Finance Costs, Net
Net finance costs were higher in 2025, compared with 2024, primarily due to lower interest income, and higher interest expenses on higher average debt. Refer to the Liquidity and Capital Resources section of this MD&A for further details on long-term debt.
The annualized weighted average interest rate on outstanding debt for 2025 was 4.5 percent (2024 – 4.5 percent).
Integration, Transaction and Other Costs
In 2025, we incurred $234 million in integration, transaction and other costs largely due to integration and transaction costs from the MEG Acquisition and costs related to the standardization of data governance to enhance efficiency and effectiveness of the Company’s information technology systems.
In 2024, we incurred costs of $166 million, primarily related to modernizing and replacing certain information technology systems, optimizing business processes and standardizing data across the Company.
Foreign Exchange (Gain) Loss, Net
| | | | | | | | | | | | | | | |
| | | |
| ($ millions) | | | | | 2025 | | 2024 |
| Unrealized Foreign Exchange (Gain) Loss | | | | | (424) | | | 550 | |
| Realized Foreign Exchange (Gain) Loss | | | | | 63 | | | (88) | |
| | | | | (361) | | | 462 | |
Unrealized foreign exchange losses and gains were primarily due to the translation of U.S. denominated debt. As at December 31, 2025, the Canadian dollar strengthened five percent relative to the U.S. dollar at December 31, 2024. As at December 31, 2024, the Canadian dollar was eight percent weaker relative to the U.S. dollar at December 31, 2023. In 2025, realized foreign exchange losses were primarily related to working capital and the repayment of U.S. denominated debt.
(Gain) Loss on Divestiture of Assets
In 2025, the Company recorded a before-tax gain of $119 million related to the WRB Divestiture. The Company also divested certain Lloydminster thermal assets in the Oil Sands segment and recorded a before-tax loss of $58 million.
Prior to the closing of the MEG Acquisition, the Company held an aggregate of 25.0 million common shares of MEG. The acquisition-date fair value of the previously held MEG common shares was estimated to be $775 million and the net carrying value was $752 million. Cenovus recognized a revaluation gain of $23 million, which is recorded in gain (loss) on divestiture of assets in net earnings (loss).
In 2024, we recorded a before-tax gain of $65 million on the divestiture of assets related to Duvernay, and a before-tax gain of $51 million for the sale of non-core assets in our Conventional segment.
| | | | | |
| Cenovus Energy Inc. – 2025 Management's Discussion and Analysis | 31 |
Income Taxes
| | | | | | | | | | | | | | | |
| | | |
| ($ millions) | | | | | 2025 | | 2024 |
| Current Tax | | | | | | | |
| Canada | | | | | 540 | | | 1,141 | |
| United States | | | | | (1) | | | 9 | |
| Asia Pacific | | | | | 198 | | | 214 | |
| Other International | | | | | 41 | | | 39 | |
| Total Current Tax Expense (Recovery) | | | | | 778 | | | 1,403 | |
| Deferred Tax Expense (Recovery) | | | | | (231) | | | (474) | |
| | | | | 547 | | | 929 | |
For the year ended December 31, 2025, the decline in current income tax expense was primarily due to the impact of the MEG Acquisition. The effective tax rate for 2025 was 12.2 percent (2024 – 22.8 percent). The lower effective tax rate in 2025 is primarily attributable to the reclassification of the cumulative foreign currency translation adjustment associated with the WRB Divestiture, which is not tax effected.
Our effective tax rate is a function of the relationship between total tax expense (recovery) and the amount of earnings (loss) before income taxes. The effective tax rate differs from the statutory tax rate for many reasons, including but not limited to, different tax rates between jurisdictions, non-taxable foreign exchange (gains) losses, adjustments for changes in tax rates and other legislation.
Tax interpretations, regulations and legislation in the various jurisdictions in which Cenovus and its subsidiaries operate are subject to change. We believe that our provision for income taxes is adequate. There are usually a number of tax matters under review, and with consideration of the current economic environment, income taxes are subject to measurement uncertainty. The timing of the recognition of income and deductions for the purpose of current tax expense is determined by relevant tax legislation.
Our results for the fourth quarter of 2025 reflect strong operational performance in the upstream business, lower throughput in our downstream operations, mainly due to the impact of the WRB Divestiture, and financial results impacted by a declining commodity price environment compared with the third quarter of 2025.
•Upstream production averaged 917.9 thousand BOE per day, an increase of 85.0 thousand BOE per day from the third quarter of 2025, mainly due to completion of the MEG Acquisition in November 2025. In addition, production increased due to successful development and optimization programs at our Lloydminster thermal assets.
•In the quarter, we achieved milestones for key projects. We fully ramped-up production at the Narrows Lake tie-back to Christina Lake project. All major process units at the Foster Creek optimization project were brought online and the project was completed ahead of schedule, supporting incremental production. At Sunrise, the first of the new well pads in the east development area commenced steam injection.
•Commissioning of the platform at the West White Rose project continued despite challenging weather conditions. Construction and welding is complete and integration testing is underway.
•Downstream throughput decreased 35 percent from the third quarter of 2025 to 465.5 thousand barrels per day, due to the WRB Divestiture.
•Benchmark WTI prices decreased from US$64.93 per barrel to US$59.14 per barrel, and WCS at Hardisty decreased from US$54.54 per barrel to US$47.94 per barrel in the fourth quarter of 2025. Additionally, the Chicago 3-2-1 crack spread and the Group 3 3-2-1 crack spread fell 25 percent and 19 percent, respectively, from the third quarter of 2025 to US$18.20 and US$19.25 per barrel, respectively.
•U.S. Refining Adjusted Market Capture increased 41 percent from the third quarter to 106 percent, driven by the receipt of a pipeline settlement in the quarter and continued reliability, which allowed us to take advantage of market conditions.
•Cash from operating activities increased to $2.4 billion from $2.1 billion in the third quarter of 2025, and Adjusted Funds Flow increased to $2.7 billion, an eight percent increase from the third quarter, as the lower Operating Margin was more than offset by lower current tax expense.
•We returned $1.1 billion to shareholders through common and preferred share base dividends of $380 million, and $714 million through our NCIB.
| | | | | |
| Cenovus Energy Inc. – 2025 Management's Discussion and Analysis | 32 |
Summary of Quarterly Results
| | | | | | | | | | | | | | | | | | | | | | | | | | | | | | | | | | | | | | | | | | | | | |
| | | | | | | | | | | | | | | | | | | | | | | | | |
| | | | | | | 2025 | | 2024 | |
| ($ millions, except where indicated) | | | | | | | | | | | | | Q4 | Q3 | Q2 | Q1 | | Q4 | Q3 | Q2 | Q1 | | | | |
Average Commodity Prices (1) (US$/bbl) | | | | | | | | | | | | | | | | | | | | | | | | | |
| Dated Brent | | | | | | | | | | | | | 63.69 | | 69.07 | | 67.82 | | 75.66 | | | 74.69 | | 80.18 | | 84.94 | | 83.24 | | | | | |
| WTI | | | | | | | | | | | | | 59.14 | | 64.93 | | 63.74 | | 71.42 | | | 70.27 | | 75.09 | | 80.57 | | 76.96 | | | | | |
| WCS at Hardisty | | | | | | | | | | | | | 47.94 | | 54.54 | | 53.47 | | 58.75 | | | 57.71 | | 61.54 | | 66.96 | | 57.65 | | | | | |
| Differential WTI-WCS at Hardisty | | | | | | | | | | | | | 11.20 | | 10.39 | | 10.27 | | 12.67 | | | 12.56 | | 13.55 | | 13.61 | | 19.31 | | | | | |
Chicago 3-2-1 Crack Spread (2) | | | | | | | | | | | | | 18.20 | | 24.24 | | 21.64 | | 13.68 | | | 12.12 | | 18.62 | | 18.76 | | 17.45 | | | | | |
Group 3 3-2-1 Crack Spread (2) | | | | | | | | | | | | | 19.25 | | 23.72 | | 23.07 | | 16.48 | | | 12.66 | | 18.95 | | 18.13 | | 17.50 | | | | | |
| RINs | | | | | | | | | | | | | 6.04 | | 6.33 | | 6.12 | | 4.76 | | | 4.02 | | 3.89 | | 3.39 | | 3.68 | | | | | |
Upstream Production Volumes (3) | | | | | | | | | | | | | | | | | | | | | | | | | |
Bitumen (Mbbls/d) | | | | | | | | | | | | | 696.2 | | 615.2 | | 552.1 | | 602.5 | | | 608.6 | | 569.6 | | 591.7 | | 595.4 | | | | | |
Heavy Crude Oil (Mbbls/d) | | | | | | | | | | | | | 28.1 | | 25.4 | | 25.0 | | 21.8 | | | 18.0 | | 16.3 | | 18.1 | | 17.9 | | | | | |
Light Crude Oil (Mbbls/d) | | | | | | | | | | | | | 22.3 | | 16.3 | | 17.0 | | 16.8 | | | 12.3 | | 13.6 | | 13.5 | | 12.5 | | | | | |
NGLs (Mbbls/d) | | | | | | | | | | | | | 27.9 | | 27.8 | | 29.9 | | 29.8 | | | 31.7 | | 31.0 | | 33.0 | | 32.4 | | | | | |
Conventional Natural Gas (MMcf/d) | | | | | | | | | | | | | 860.4 | | 889.5 | | 851.4 | | 887.9 | | | 873.3 | | 844.6 | | 867.2 | | 855.8 | | | | | |
Total Production Volumes (MBOE/d) | | | | | | | | | | | | | 917.9 | | 832.9 | | 765.9 | | 818.9 | | | 816.0 | | 771.3 | | 800.8 | | 800.9 | | | | | |
| | | | | | | | | | | | | | | | | | | | | | | | | |
Downstream Total Processed Inputs (4) (Mbbls/d) | | | | | | | | | | | | | 498.4 | | 757.6 | | 714.9 | | 700.5 | | | 700.5 | | 674.4 | | 652.9 | | 683.8 | | | | | |
Crude Oil Unit Throughput (4) (Mbbls/d) | | | | | | | | | | | | | 465.5 | | 710.7 | | 665.8 | | 665.4 | | | 666.7 | | 642.9 | | 622.7 | | 655.2 | | | | | |
Downstream Production Volumes (4) (Mbbls/d) | | | | | | | | | | | | | 527.5 | | 770.3 | | 729.4 | | 722.4 | | | 722.6 | | 685.2 | | 659.5 | | 702.1 | | | | | |
| | | | | | | | | | | | | | | | | | | | | | | | | |
Revenues | | | | | | | | | | | | | 10,883 | | 13,195 | | 12,319 | | 13,299 | | | 12,813 | | 13,819 | | 14,582 | | 13,063 | | | | | |
| | | | | | | | | | | | | | | | | | | | | | | | | |
Operating Margin (5) | | | | | | | | | | | | | 2,777 | | 2,954 | | 2,066 | | 2,811 | | | 2,274 | | 2,408 | | 2,936 | | 3,191 | | | | | |
Operating Margin – Upstream (6) | | | | | | | | | | | | | 2,628 | | 2,590 | | 2,137 | | 3,048 | | | 2,670 | | 2,731 | | 3,089 | | 2,631 | | | | | |
Operating Margin – Downstream (6) | | | | | | | | | | | | | 149 | | 364 | | (71) | | (237) | | | (396) | | (323) | | (153) | | 560 | | | | | |
| | | | | | | | | | | | | | | | | | | | | | | | | |
| Cash From (Used in) Operating Activities | | | | | | | | | | | | | 2,408 | | 2,131 | | 2,374 | | 1,315 | | | 2,029 | | 2,474 | | 2,807 | | 1,925 | | | | | |
| | | | | | | | | | | | | | | | | | | | | | | | | |
Adjusted Funds Flow (5) | | | | | | | | | | | | | 2,674 | | 2,466 | | 1,519 | | 2,212 | | | 1,601 | | 1,960 | | 2,361 | | 2,242 | | | | | |
Per Share – Basic (5) ($) | | | | | | | | | | | | | 1.47 | | 1.38 | | 0.84 | | 1.21 | | | 0.88 | | 1.06 | | 1.27 | | 1.20 | | | | | |
Per Share – Diluted (5) ($) | | | | | | | | | | | | | 1.46 | | 1.38 | | 0.84 | | 1.21 | | | 0.87 | | 1.05 | | 1.26 | | 1.19 | | | | | |
| | | | | | | | | | | | | | | | | | | | | | | | | |
Capital Investment | | | | | | | | | | | | | 1,360 | | 1,154 | | 1,164 | | 1,229 | | | 1,478 | | 1,346 | | 1,155 | | 1,036 | | | | | |
| | | | | | | | | | | | | | | | | | | | | | | | | |
Free Funds Flow (5) | | | | | | | | | | | | | 1,314 | | 1,312 | | 355 | | 983 | | | 123 | | 614 | | 1,206 | | 1,206 | | | | | |
| | | | | | | | | | | | | | | | | | | | | | | | | |
Excess Free Funds Flow (5) | | | | | | | | | | | | | (1,597) | | 745 | | (306) | | 373 | | | (416) | | 146 | | 735 | | 832 | | | | | |
| | | | | | | | | | | | | | | | | | | | | | | | | |
Net Earnings (Loss) | | | | | | | | | | | | | 934 | | 1,286 | | 851 | | 859 | | | 146 | | 820 | | 1,000 | | 1,176 | | | | | |
Per Share – Basic ($) | | | | | | | | | | | | | 0.51 | | 0.72 | | 0.47 | | 0.47 | | | 0.08 | | 0.44 | | 0.53 | | 0.62 | | | | | |
Per Share – Diluted ($) | | | | | | | | | | | | | 0.50 | | 0.72 | | 0.45 | | 0.47 | | | 0.07 | | 0.42 | | 0.53 | | 0.62 | | | | | |
| | | | | | | | | | | | | | | | | | | | | | | | | |
| Total Assets | | | | | | | | | | | | | 63,424 | | 53,573 | | 55,820 | | 56,380 | | | 56,539 | | 54,680 | | 56,000 | | 54,994 | | | | | |
| | | | | | | | | | | | | | | | | | | | | | | | | |
| | | | | | | | | | | | | | | | | | | | | | | | | |
| | | | | | | | | | | | | | | | | | | | | | | | | |
| Long-Term Debt, Including Current Portion | | | | | | | | | | | | | 11,032 | | 7,156 | | 7,241 | | 7,524 | | | 7,534 | | 7,199 | | 7,275 | | 7,227 | | | | | |
| | | | | | | | | | | | | | | | | | | | | | | | | |
Net Debt | | | | | | | | | | | | | 8,292 | | 5,255 | | 4,934 | | 5,079 | | | 4,614 | | 4,196 | | 4,258 | | 4,827 | | | | | |
| | | | | | | | | | | | | | | | | | | | | | | | | |
Cash Returns to Common and Preferred Shareholders | | | | | | | | | | | | | 1,094 | | 1,274 | | 819 | | 595 | | | 706 | | 1,070 | | 1,034 | | 436 | | | | | |
| Common Shares – Base Dividends | | | | | | | | | | | | | 376 | | 356 | | 364 | | 327 | | | 330 | | 329 | | 334 | | 262 | | | | | |
Base Dividends Per Common Share ($) | | | | | | | | | | | | | 0.200 | | 0.200 | | 0.200 | | 0.180 | | | 0.180 | | 0.180 | | 0.180 | | 0.140 | | | | | |
| Common Shares – Variable Dividends | | | | | | | | | | | | | — | | — | | — | | — | | | — | | — | | 251 | | — | | | | | |
Variable Dividends Per Common Share ($) | | | | | | | | | | | | | — | | — | | — | | — | | | — | | — | | 0.135 | | — | | | | | |
| Purchase of Common Shares Under NCIB | | | | | | | | | | | | | 714 | | 918 | | 301 | | 62 | | | 108 | | 732 | | 440 | | 165 | | | | | |
| | | | | | | | | | | | | | | | | | | | | | | | | |
| Dividends Paid on Preferred Shares | | | | | | | | | | | | | 4 | | — | | 4 | | 6 | | | 18 | | 9 | | 9 | | 9 | | | | | |
| Preferred Share Redemption | | | | | | | | | | | | | — | | — | | 150 | | 200 | | | 250 | | — | | — | | — | | | | | |
(1)These benchmark prices are not our Realized Sales Prices and represent approximate values.
(2)The average 3-2-1 crack spread is an indicator of the refining margin and is valued on a last-in, first-out accounting basis.
(3)Includes results of the MEG Acquisition from November 13, 2025.
(4)Represent Cenovus’s net interest in refining operations. Following the WRB Divestiture, all refining operations are wholly-owned.
(5)Non-GAAP financial measure or contains a non-GAAP financial measure. See the Specified Financial Measures Advisory of this MD&A.
(6)Specified financial measure. See the Specified Financial Measures Advisory of this MD&A.
| | | | | |
| Cenovus Energy Inc. – 2025 Management's Discussion and Analysis | 33 |
Fourth Quarter 2025 Results Compared with the Fourth Quarter 2024
The summary below compares financial and operating results for the three months ended December 31, 2025, compared with the same period in 2024.
Upstream Production Volumes
Total upstream production increased 101.9 thousand BOE per day in the fourth quarter of 2025, compared with 2024, primarily due to:
•Incremental production at Christina Lake following the MEG Acquisition in November 2025 and the ramp-up of production from Narrows Lake.
•Successful results from new well pads at Foster Creek and the completion of the Foster Creek optimization project, which supported additional production.
•Production resuming at the White Rose field following the completion of the SeaRose ALE project.
The increases were partially offset by the temporary shut-in of production at our Rush Lake facilities following an incident in the second quarter of 2025. In the fourth quarter, we successfully restarted production and the phased ramp-up is progressing as expected.
Downstream Refining Throughput and Production
Canadian Refining operations were strong in the fourth quarter with crude unit utilization of 105 percent (2024 – 97 percent). Throughput increased 8.5 thousand barrels per day to 112.9 thousand barrels per day and production increased 12.9 thousand barrels per day to 131.3 thousand barrels per day compared with 2024. In 2025, our assets ran at, or above full capacity due to ongoing improvement initiatives and continued high asset reliability.
U.S. Refining crude unit utilization increased to 97 percent (2024 – 92 percent) due to higher reliability and ongoing operational improvements. Throughput decreased 209.7 thousand barrels per day to 352.6 thousand barrels per day and total refined product production decreased 208.0 thousand barrels per day to 396.2 thousand barrels per day compared with 2024, primarily due to the WRB Divestiture.
Operating Margin
Three Months Ended December 31, 2025 and 2024
Operating Margin increased compared with the fourth quarter of 2024, primarily due to:
•Higher sales volumes in our Oil Sands and Canadian Refining segments.
•Higher market crack spreads in our U.S. Refining segment and the receipt of a pipeline settlement during the quarter.
The increase was partially offset by:
•Lower Realized Sales Prices impacting revenues in our Oil Sands segment due to lower benchmark WTI prices, partially offset by a narrower WTI-WCS differential.
•Increased operating expenses in our Oil Sands segment due to higher fuel costs.
| | | | | |
| Cenovus Energy Inc. – 2025 Management's Discussion and Analysis | 34 |
Cash From (Used in) Operating Activities and Adjusted Funds Flow
Cash from operating activities increased $379 million to $2.4 billion in the fourth quarter of 2025, compared with the fourth quarter of 2024, primarily due to lower current tax expense and higher Operating Margin, partially offset by the changes in non-cash working capital. The 2025 net change in non-cash working capital was primarily due to decreases in accounts receivable. In 2024, the net change in non-cash working capital was primarily due to increases in accounts payable and taxes payable, combined with a decrease in accounts receivable, partially offset by increased inventories.
Adjusted Funds Flow increased to $2.7 billion in the fourth quarter of 2025, compared with $1.6 billion in 2024, primarily due to lower current tax expense and higher Operating Margin, partially offset by integration, transaction and other costs related to the MEG Acquisition.
Net Earnings (Loss)
Net earnings were $934 million in the fourth quarter of 2025 compared with $146 million in the fourth quarter of 2024. The increase was primarily due to an increase in Operating Margin and foreign exchange gains, compared with losses in 2024, partially offset by an increase in depreciation, depletion and amortization.
Capital Investment
Capital investment was $1.4 billion in the fourth quarter of 2025, compared with $1.5 billion in the fourth quarter of 2024, as we continued our sustaining activities and upstream growth projects.
| | | | | | | | | | | | | | | | | | | | | | | | | | | | | |
As at December 31, 2025 (before royalties) (1) (2) | Bitumen (3) (MMbbls) | | Light and Medium Oil (MMbbls) | | NGLs (MMbbls) | | Conventional Natural Gas (4) (Bcf) | | Total (MMBOE) |
| Total Proved | 5,697 | | | 87 | | | 59 | | | 1,745 | | | 6,135 | |
| Probable | 3,227 | | | 71 | | | 28 | | | 878 | | | 3,472 | |
| Total Proved Plus Probable | 8,924 | | | 158 | | | 87 | | | 2,622 | | | 9,607 | |
| | | | | | | | | | | | | | | | | | | | | | | | | | | | | |
As at December 31, 2024 (before royalties) (1) (2) | Bitumen (3) (MMbbls) | | Light and Medium Oil (MMbbls) | | NGLs (MMbbls) | | Conventional Natural Gas (4) (Bcf) | | Total (MMBOE) |
| | | | | | | | | |
| | | | | | | | | |
| | | | | | | | | |
| | | | | | | | | |
| | | | | | | | | |
| | | | | | | | | |
| | | | | | | | | |
| | | | | | | | | |
| | | | | | | | | |
| | | | | | | | | |
| | | | | | | | | |
| | | | | | | | | |
| | | | | | | | | |
| | | | | | | | | |
| | | | | | | | | |
| | | | | | | | | |
| | | | | | | | | |
| | | | | | | | | |
| | | | | | | | | |
| | | | | | | | | |
| | | | | | | | | |
| | | | | | | | | |
| | | | | | | | | |
| | | | | | | | | |
| | | | | | | | | |
| | | | | | | | | |
| | | | | | | | | |
| | | | | | | | | |
| Total Proved | 5,179 | | | 91 | | | 69 | | | 1,950 | | | 5,664 | |
| | | | | | | | | |
| | | | | | | | | |
| | | | | | | | | |
| | | | | | | | | |
| Probable | 2,500 | | | 77 | | | 37 | | | 1,071 | | | 2,793 | |
| Total Proved Plus Probable | 7,679 | | | 168 | | | 107 | | | 3,021 | | | 8,457 | |
(1)Totals may not sum due to rounding.
(2)Includes values attributable to Cenovus’s 30 percent equity interest in the Duvernay joint venture and 40 percent equity interest in the HCML joint venture.
(3)Includes heavy crude oil that is not material.
(4)Includes shale gas that is not material.
The following developments occurred in 2025 compared with 2024:
•Bitumen gross total proved and gross total proved plus probable reserves increased by 518 million barrels and 1,245 million barrels, respectively. The changes were due to the MEG Acquisition, extensions due to continuing development of, and updates to development plans for the Oil Sands segment, and technical revisions due to improvements to recovery performance at Sunrise and Lloydminster thermal. These increases were partially offset by current year production and negative technical revisions resulting from recovery factor changes at Christina Lake and Foster Creek, and a minor disposition at Lloydminster thermal.
•Light and medium oil gross total proved and gross total proved plus probable reserves decreased by four million barrels and 10 million barrels, respectively. The changes were due to current year production and negative technical revisions due to updates to the Conventional segment development plans. These decreases were partially offset by extensions due to updates to the Conventional segment development plans.
•NGLs gross total proved and gross total proved plus probable reserves decreased by 10 million barrels and 20 million barrels, respectively. The changes were due to current year production, negative technical revisions due to updates to the Conventional segment development plans and negative technical revisions due to reductions to recovery performance in Indonesia. These reductions were partially offset by extensions due to updates to the Conventional segment development plans and technical revisions due to improvements to recovery performance in China.
| | | | | |
| Cenovus Energy Inc. – 2025 Management's Discussion and Analysis | 35 |
•Conventional natural gas gross total proved and gross total proved plus probable reserves decreased by 205 billion cubic feet and 399 billion cubic feet, respectively. The changes were due to current year production, negative technical revisions due to updates to the Conventional segment development plans and negative technical revisions due to reductions to recovery performance in Indonesia. These reductions were partially offset by extensions due to updates to the Conventional segment development plans, technical revisions due to increases to original natural gas in place volumes in China and minor acquisitions in the Conventional segment.
The reserves data is presented as at December 31, 2025, using an average of the forecast prices, inflation and exchange rates (“Average Forecast”) by McDaniel & Associates Consultants Ltd., GLJ Ltd. and Sproule ERCE. The Average Forecast is dated January 1, 2026. Comparative information as at December 31, 2024, uses the January 1, 2025, Average Forecast.
Additional information with respect to the evaluation and reporting of our reserves in accordance with NI 51-101 is contained in our AIF for the year ended December 31, 2025. Our AIF is available on SEDAR+ at sedarplus.ca, on EDGAR at sec.gov and on our website at cenovus.com. Material risks and uncertainties associated with estimates of reserves are discussed in the Risk Management and Risk Factors section and the Advisory section of this MD&A.
| | |
|
LIQUIDITY AND CAPITAL RESOURCES |
Our capital allocation framework enables us to preserve our balance sheet, provide flexibility in both high and low commodity price environments, and deliver value to shareholders.
We expect to fund our near-term cash requirements through cash from operating activities, the prudent use of our cash and cash equivalents, and other sources of liquidity. Our other sources of liquidity include draws on our committed credit facility, draws on our uncommitted demand facilities, and other corporate and financial opportunities, which provide timely access to funding to supplement cash flow. We remain committed to maintaining our investment grade credit ratings at S&P Global Ratings, Moody’s Ratings, Morningstar DBRS and Fitch Ratings. The cost and availability of borrowing, and access to sources of liquidity and capital are dependent on current credit ratings and market conditions.
| | | | | | | | | | | | | | | | | |
| | | |
($ millions) | | | | | 2025 | | 2024 |
| Cash From (Used In) | | | | | | | |
| Operating Activities | | | | | 8,228 | | | 9,235 | |
| Investing Activities | | | | | (7,677) | | | (5,126) | |
| Net Cash Provided (Used) Before Financing Activities | | | | | 551 | | | 4,109 | |
| Financing Activities | | | | | (749) | | | (3,505) | |
| Effect of Foreign Exchange on Cash and Cash Equivalents | | | | | (155) | | | 262 | |
| Increase (Decrease) in Cash and Cash Equivalents | | | | | (353) | | | 866 | |
| | | | | | | |
| | | | | | | |
As at December 31, ($ millions) | | | | | 2025 | | 2024 |
Cash and Cash Equivalents | | | | | 2,740 | | | 3,093 | |
Total Debt | | | | | 11,032 | | | 7,707 | |
Cash From (Used in) Operating Activities
In 2025, cash from operating activities decreased compared with 2024, primarily due to changes in non-cash working capital, partially offset by lower current tax expense and lower cash-settled long-term incentive costs. Non-cash working capital decreased cash from operating activities by $363 million, primarily due to an increase in accounts receivable, and decreases in accounts payable and income tax payable, partially offset by a decrease in inventories, excluding the impact of the MEG Acquisition and the WRB Divestiture.
In 2024, the change in non-cash working capital was a source of cash of $1.3 billion due to lower accounts receivable, higher accounts payable and higher taxes payable, partially offset by higher inventories.
Cash From (Used in) Investing Activities
Cash used in investing activities increased in 2025 compared with 2024. Cash used in investing activities primarily relates to capital investment and the MEG Acquisition, partially offset by proceeds from the WRB Divestiture.
Cash From (Used in) Financing Activities
In 2025, cash used in financing activities was $749 million, compared with $3.5 billion in 2024, primarily due to the redemption of certain senior unsecured notes and higher share purchases under the Company’s NCIB, partially offset by an increase in long-term debt from the receipt of a $2.7 billion term loan facility and the issuance of $2.6 billion of senior unsecured notes.
| | | | | |
| Cenovus Energy Inc. – 2025 Management's Discussion and Analysis | 36 |
Working Capital
Working capital as at December 31, 2025, was $3.6 billion (December 31, 2024 – $3.1 billion). The increase was primarily driven by higher accounts receivable and lower accounts payable, partially offset by lower inventories.
We anticipate that we will continue to meet our payment obligations as they come due.
Returns to Shareholders Target
Maintaining a strong balance sheet, with the resilience to withstand price volatility and capitalize on opportunities throughout the commodity price cycle, is a key element of Cenovus’s capital allocation framework. Our Net Debt target is $4.0 billion and represents a Net Debt to Adjusted Funds Flow ratio target of approximately 1.0 times at the bottom of the commodity pricing cycle, which we believe is a WTI price of approximately US$45.00 per barrel.
Upon closing of the MEG Acquisition, we adjusted our shareholder returns framework as follows:
•While Net Debt is above $6.0 billion, the Company will target to return approximately 50 percent of Excess Free Funds Flow to shareholders, with the remainder allocated to deleveraging.
•When Net Debt is between $6.0 billion and $4.0 billion, the Company will target to return approximately 75 percent of Excess Free Fund Flow to shareholders, with the remainder allocated to deleveraging.
Our long-term Net Debt target of $4.0 billion remains unchanged, and upon reaching the targeted levels, we plan to return approximately 100 percent of Excess Free Funds Flow to shareholders over time while stewarding Net Debt near $4.0 billion. Working capital movements, foreign exchange rate changes and other factors may result in periods where shareholder returns are less than, or exceed, Excess Free Funds Flow and Net Debt is above or below our target. The allocation of Excess Free Funds Flow to shareholder returns may be accelerated, deferred or reallocated between quarters at Management’s discretion.
As at December 31, 2025, our Net Debt position was $8.3 billion and, as a result, our returns to shareholders target for the three months ended March 31, 2026, will be 50 percent of the first quarter’s Excess Free Funds Flow.
Short-Term Borrowings
There were no direct borrowings on our uncommitted demand facilities as at December 31, 2025, or December 31, 2024. On September 30, 2025, Cenovus completed the WRB Divestiture, which included the Company’s proportionate share of the WRB uncommitted demand facilities outstanding of US$225 million (C$313 million). Cenovus’s proportionate share of the WRB uncommitted demand facilities outstanding as at December 31, 2024, was US$120 million (C$173 million).
Long-Term Debt, Including Current Portion
| | | | | | | | | | | | | | |
As at December 31, ($ millions) | | 2025 | | 2024 |
| Term Loan Facility | | 2,700 | | — |
U.S. Dollar Denominated Senior Unsecured Notes | | 5,887 | | 5,470 |
Canadian Dollar Senior Unsecured Notes | | 2,450 | | 2,000 |
| Total Debt Principal | | 11,037 | | 7,470 |
Upon maturity on July 15, 2025, the Company repaid its 5.38 percent senior unsecured notes with a principal of US$133 million, in full.
We obtained a $2.7 billion term loan facility maturing on February 28, 2029, to fund a portion of the cash consideration for the MEG Acquisition. Upon closing of the MEG Acquisition, we assumed MEG’s U.S. dollar senior unsecured notes with a principal of US$600 million. The notes were subsequently redeemed on December 1, 2025, in full.
On November 20, 2025, the Company closed public offerings in Canada and the U.S. of senior unsecured notes of $2.6 billion, composed of $650 million 4.25 percent notes due in 2033, $550 million 4.60 percent notes due in 2035, US$500 million 4.65 percent notes due in 2031 and US$500 million 5.40 percent notes due in 2036.
On December 1, 2025, the Company redeemed its 4.25 percent senior unsecured notes with a principal of US$373 million, in full. On December 22, 2025, the Company redeemed its 3.60 percent senior unsecured notes with a principal of $750 million, in full.
As at December 31, 2025, we were in compliance with all of the terms of our debt agreements, which includes the terms of our committed credit facility and term loan facility. We are required to maintain a debt to capitalization ratio, as defined in the debt agreements, not to exceed 65 percent. We are below this limit.
| | | | | |
| Cenovus Energy Inc. – 2025 Management's Discussion and Analysis | 37 |
Available Sources of Liquidity
The following sources of liquidity are available as at December 31, 2025:
| | | | | | | | | | | | | | | | | |
| ($ millions) | Maturity | | | | | | | | Amount Available |
| Cash and Cash Equivalents | n/a | | | | | | | | 2,740 | |
Committed Credit Facility (1) | | | | | | | | | |
Revolving Credit Facility – Tranche A | September 19, 2029 | | | | | | | | 3,300 | |
Revolving Credit Facility – Tranche B | September 19, 2028 | | | | | | | | 2,200 | |
| | | | | | | | | |
Uncommitted Demand Facilities (2) | n/a | | | | | | | | 1,116 | |
(1)No amounts were drawn on the committed credit facility as at December 31, 2025 (December 31, 2024 – $nil).
(2)Represents amounts available for cash draws. Our uncommitted demand facilities include $1.5 billion, of which $1.4 billion may be drawn for general purposes, or the full amount can be available to issue letters of credit. As at December 31, 2025, there were outstanding letters of credit aggregating to $341 million (December 31, 2024 – $355 million) and no direct borrowings (December 31, 2024 – $nil).
On September 19, 2025, Cenovus renewed its existing committed credit facility to extend the maturity dates by more than one year. As at December 31, 2025, the committed credit facility consists of a $3.3 billion tranche maturing on September 19, 2029, and a $2.2 billion tranche maturing on September 19, 2028. As at December 31, 2025, no amount was drawn on the credit facility (December 31, 2024 – $nil).
Base Shelf Prospectus
On November 28, 2025, Cenovus filed a base shelf prospectus that allows the Company to offer, from time to time, debt securities, common shares, preferred shares, subscription receipts, warrants, share purchase contracts and units in Canada, the U.S. and elsewhere as permitted by law. The base shelf prospectus will expire in December 2028. Offerings under the base shelf prospectus are subject to market conditions on terms set forth in one or more prospectus supplements.
Financial Metrics
We monitor our capital structure and financing requirements using, among other things, Total Debt, the Net Debt to Adjusted EBITDA ratio, the Net Debt to Adjusted Funds Flow ratio and the Net Debt to Capitalization ratio. Refer to Note 22 of the Consolidated Financial Statements for further details.
We define Net Debt as short-term borrowings and the current and long-term portions of long-term debt, net of cash and cash equivalents, and short-term investments. The components of the ratios include Capitalization, Adjusted Funds Flow and Adjusted EBITDA. We define Capitalization as Net Debt plus Shareholder’s Equity. We define Adjusted Funds Flow, as used in the Net Debt to Adjusted Funds Flow ratio, as cash from (used in) operating activities, less settlement of decommissioning liabilities and net change in operating non-cash working capital calculated on a trailing twelve-month basis. We define Adjusted EBITDA, as used in the Net Debt to Adjusted EBITDA ratio, as net earnings (loss) before finance costs, net, income tax expense (recovery), DD&A, E&E asset write-downs, goodwill impairments, (income) loss from equity-accounted affiliates, unrealized (gain) loss on risk management, net foreign exchange (gain) loss, (gain) loss on divestiture of assets, re-measurement of contingent payments and other (income) loss, net calculated on a trailing twelve-month basis. These ratios are used to steward our overall debt position and are measures of our overall financial strength.
| | | | | | | | | | | | | |
| As at December 31, | 2025 | | 2024 | | |
Net Debt to Adjusted EBITDA Ratio (times) | 0.9 | | 0.5 | | |
Net Debt to Adjusted Funds Flow Ratio (times) | 0.9 | | 0.6 | | |
Net Debt to Capitalization Ratio (percent) | 21 | | | 13 | | | |
Our Net Debt to Adjusted EBITDA ratio and our Net Debt to Adjusted Funds Flow ratio targets are approximately 1.0 times and Net Debt at or below $4.0 billion over the long-term at a WTI price of US$45.00 per barrel. These measures may fluctuate periodically outside this range due to factors such as persistently high or low commodity prices or the strengthening or weakening of the Canadian dollar relative to the U.S. dollar. Our objective is to maintain a high level of capital discipline and manage our capital structure to help ensure we have sufficient liquidity through all stages of the economic cycle. To ensure financial resilience, we may, among other actions, adjust capital and operating spending, steward working capital, draw down on our credit facilities or repay existing debt, adjust dividends paid to shareholders, purchase our common or preferred shares for cancellation, issue new debt, or issue new shares.
Our Net Debt to Adjusted EBITDA ratio, Net Debt to Adjusted Funds Flow ratio and Net Debt to Capitalization ratio as at December 31, 2025, increased compared with December 31, 2024, primarily as a result of higher Net Debt. See the Operating and Financial Results section of this MD&A for more information on changes in Net Debt.
| | | | | |
| Cenovus Energy Inc. – 2025 Management's Discussion and Analysis | 38 |
Share Capital and Stock-Based Compensation Plans
Our common shares are listed on the Toronto Stock Exchange (“TSX”) and New York Stock Exchange (“NYSE”). Our cumulative redeemable preferred shares series 1 and 2 are listed on the TSX. On March 31, 2025, and June 30, 2025, Cenovus exercised its right to redeem all 8.0 million of the Company’s series 5 preferred shares and all 6.0 million of the Company’s series 7 preferred shares, respectively. The preferred shares were redeemed at a price of $25.00 per share for a total of $350 million.
As at December 31, 2025, there were approximately 1,883.4 million common shares outstanding (December 31, 2024 – 1,825.0 million common shares) and 12.0 million preferred shares outstanding (December 31, 2024 – 26.0 million preferred shares). Total purchase consideration for the MEG Acquisition included the issuance of 143.9 million Cenovus common shares. Refer to Note 4 of the Consolidated Financial Statements for further details.
Cenovus has established an employee benefit plan trust (the “Trust”). The Trust, through an independent trustee, acquires Cenovus’s common shares on the open market, which are held to satisfy the Company’s obligations under certain stock-based compensation plans. For the year ended December 31, 2025, the Trust purchased 7.1 million common shares (2024 – 2.0 million common shares) for a total of $155 million (2024 – $43 million) and distributed 3.8 million common shares (2024 – nil) for a total of $82 million (2024 – $nil) under the employee benefit plan. As at December 31, 2025, there were 5.3 million common shares held by the Trust (December 31, 2024 – 2.0 million common shares). Refer to Note 26 of the Consolidated Financial Statements for further details.
As at December 31, 2025, there were approximately 1.2 million common share purchase warrants (“Cenovus Warrants”) outstanding (December 31, 2024 – 3.6 million). Each Cenovus Warrant entitled the holder to acquire one common share for a period of five years from the date of issue at an exercise price of $6.54 per common share. The Cenovus Warrants expired on January 1, 2026. Refer to Note 26 of the Consolidated Financial Statements for further details.
Refer to Note 28 of the Consolidated Financial Statements for further details on our stock option plans and our performance share unit, restricted share unit and deferred share unit plans. Our outstanding share data is as follows:
| | | | | | | | | | | |
| As at February 13, 2026 | Units Outstanding (thousands) | | Units Exercisable (thousands) |
Common Shares | 1,879,261 | | n/a |
| | | |
| Series 1 First Preferred Shares | 10,740 | | n/a |
| Series 2 First Preferred Shares | 1,260 | | n/a |
Stock Options | 10,626 | | 4,647 |
| Other Stock-Based Compensation Plans | 21,089 | | 1,832 |
Common Share Dividends
In 2025, we declared and paid base dividends of $1.4 billion or $0.780 per common share (2024 – $1.3 billion or $0.680 per common share) and variable dividends of $nil (2024 – $251 million or $0.135 per common share).
On February 18, 2026, the Board declared a first quarter base dividend of $0.200 per common share. The dividend is payable on March 31, 2026, to common shareholders of record as at March 13, 2026.
The declaration of common share dividends is at the sole discretion of the Board and is considered quarterly.
Cumulative Redeemable Preferred Share Dividends
| | | | | | | | | | | | | | | | | |
| | | |
| ($ millions) | | | | | 2025 | | 2024 |
| Series 1 First Preferred Shares | | | | | 7 | | 7 |
| Series 2 First Preferred Shares | | | | | 1 | | 2 |
| Series 3 First Preferred Shares | | | | | — | | 12 |
| Series 5 First Preferred Shares | | | | | 2 | | 9 |
| Series 7 First Preferred Shares | | | | | 4 | | 6 |
| Total Preferred Share Dividends Declared | | | | | 14 | | 36 |
For the year ended December 31, 2025, dividends of $14 million were paid on the preferred shares (2024 – $45 million).
On February 18, 2026, the Company’s Board of Directors declared first quarter preferred share dividends of $2 million payable on March 31, 2026, to preferred shareholders of record as at March 13, 2026.
The declaration of preferred share dividends is at the sole discretion of the Board and is considered quarterly.
| | | | | |
| Cenovus Energy Inc. – 2025 Management's Discussion and Analysis | 39 |
Share Repurchases
On November 7, 2025, the Company received approval from the TSX to renew the Company’s NCIB program to purchase up to 120.3 million common shares during the period from November 11, 2025, to November 10, 2026.
| | | | | | | | | | | | | | | | | |
| | | |
| | | | | 2025 | | 2024 |
Common Shares Purchased and Cancelled Under NCIB (millions of common shares) | | | | | 89.4 | | | 55.9 | |
Weighted Average Price per Common Share ($) | | | | | 21.87 | | | 25.38 | |
Purchase of Common Shares Under NCIB ($ millions) | | | | | 1,995 | | | 1,445 | |
From January 1, 2026, to February 13, 2026, the Company purchased an additional 5.0 million common shares for $126 million. As at February 13, 2026, the Company can further purchase up to 107.9 million common shares under the NCIB.
Contractual Commitments and Obligations
We have obligations for goods and services entered into in the normal course of business. Obligations that have original maturities of less than one year are excluded from our total commitments disclosed below. For further information, see Note 34 to the Consolidated Financial Statements.
| | | | | | | | | | | | | | | | | | | | | | | | | | | | | | | | | | | | | | | | | |
| As at December 31, 2025 | | | | | | | | | | | | | |
| ($ millions) | 1 Year | | 2 Years | | 3 Years | | 4 Years | | 5 Years | | Thereafter | | Total |
| Commitments | | | | | | | | | | | | | |
Transportation and Storage (1) (2) | 2,603 | | 2,623 | | 2,775 | | 2,802 | | 2,531 | | 23,591 | | 36,925 |
| | | | | | | | | | | | | |
Real Estate | 64 | | 65 | | 65 | | 69 | | 70 | | 474 | | 807 |
Obligation to Fund HCML | 99 | | 94 | | 54 | | 42 | | 41 | | 59 | | 389 |
Other Long-Term Commitments | 547 | | 184 | | 151 | | 117 | | 111 | | 484 | | 1,594 |
Total Commitments | 3,313 | | 2,966 | | 3,045 | | 3,030 | | 2,753 | | 24,608 | | 39,715 |
| Long-Term Debt (Principal and Interest) | 473 | | 489 | | 1,717 | | 3,303 | | 330 | | 9,718 | | 16,030 |
Lease Liabilities (Principal and Interest) (3) | 519 | | 485 | | 437 | | 371 | | 317 | | 2,719 | | 4,848 |
| Decommissioning Liabilities | 222 | | 228 | | 210 | | 232 | | 257 | | 7,568 | | 8,717 |
| | | | | | | | | | | | | |
| Total Commitments and Obligations | 4,527 | | 4,168 | | 5,409 | | 6,936 | | 3,657 | | 44,613 | | 69,310 |
(1)Includes transportation commitments that are subject to regulatory approval or were approved but are not yet in service of $7.7 billion (December 31, 2024 – $854 million), of which $1.6 billion were assumed from the MEG Acquisition. Terms are up to 15 years on commencement.
(2)As at December 31, 2025, includes $1.7 billion related to transportation and storage commitments with HMLP (December 31, 2024 – $1.8 billion).
(3)Lease contracts related to office space, a pipeline, storage tanks, terminals, railcars, vessels, refining equipment, a natural gas processing plant, caverns, fleet vehicles, our commercial fuels network and other field equipment.
Through the MEG Acquisition, the Company assumed $8.3 billion of various transportation and storage commitments.
As at December 31, 2025, outstanding letters of credit issued as security for performance under certain contracts totaled $341 million (December 31, 2024 – $355 million).
Legal Proceedings
We are involved in a limited number of legal claims associated with the normal course of operations. We believe that any liabilities that might arise from such matters, to the extent not provided for, are not likely to have a material effect on our Consolidated Financial Statements.
Transactions with Related Parties
Husky Midstream Limited Partnership
The Company holds a 35 percent interest in and is the operator of HMLP. The Company charges HMLP for construction and management services, and incurs costs for the use of HMLP’s pipeline systems, as well as transportation and storage services. Access fees and transportation and storage services are based on contractually agreed rates with HMLP.
| | | | | | | | | | | | | | | | | |
| ($ millions) | | | | | 2025 | | 2024 |
| Revenues from Construction and Management Services | | | | | 164 | | 155 |
| Transportation Expenses | | | | | 258 | | 278 |
For the year ended December 31, 2025, the Company received $40 million of distributions from HMLP (2024 – $65 million) and paid $2 million in contributions (2024 – $51 million).
| | | | | |
| Cenovus Energy Inc. – 2025 Management's Discussion and Analysis | 40 |
Husky-CNOOC Madura Limited
Cenovus holds a 40 percent equity interest in the jointly-controlled entity HCML. For the year ended December 31, 2025, the Company received $94 million of distributions from HCML (2024 – $107 million) and paid $nil in contributions (2024 – $nil).
| | |
|
RISK MANAGEMENT AND RISK FACTORS |
Risk Governance
Our Enterprise Risk Management (“ERM”) program drives the identification, measurement, prioritization, and management of our risks and is integrated with the Cenovus Operations Integrity Management System (“COIMS”). We continuously monitor our risk profile and industry best practices. The ERM Policy, approved by our Board, outlines our risk management principles, expectations, and the roles and responsibilities of all staff. Our risk management framework aligns with International Organization for Standardization (“ISO”) in its ISO 31000 – Risk Management Guidelines. The results of our ERM program are documented in consolidated risk reports presented to our Board and through regular updates.
Risk Factors
We are exposed to various risks through the pursuit of our strategic objectives. Some of these risks impact the energy industry as a whole and others are unique to our operations. The following discussion describes the financial, operational, regulatory, environmental, reputational, climate-change related and other risks to Cenovus. Each risk identified in this MD&A may individually, or in combination with other risks, have a material impact on, among other things, our business, financial condition, results of operations, cash flows, reputation, ability to pursue our strategic priorities, meet our targets or outlooks, goals, initiatives and ambitions, ability to respond to changes in our operating environment, access to capital, cost of borrowing, access to liquidity, ability to fund share repurchases, dividend payments and/or business plans, fulfill our obligations and/or the market price of our securities. These factors should be considered when investing in securities of Cenovus.
Financial Risk
Commodity Prices
Our financial performance is significantly dependent on prevailing commodity prices. Prices for crude oil, refined products, natural gas, NGLs and other related products are impacted by a number of factors, including, but not limited to: global and regional supply of, and demand for, these commodities; the ability of producers and governments to replace supply; processing and export capacity; export or import restrictions; domestic and global economic conditions; inflation; changes to interest rates; the impact of tariffs and responses thereto (including by governments, our trade partners and customers), which may include, without limitation, counter-tariffs, surtaxes, countermeasures, countervailing duties, antidumping duties, special duties, export taxes on Cenovus’s products, and restrictions on imports and exports, such as export controls, sanctions or other measures; central bank policies; market competitiveness; the actions of OPEC and other oil exporting nations, including, but not limited to, compliance or non-compliance with quotas agreed upon by OPEC members and decisions by OPEC regarding whether and to what extent to impose production quotas on its members; developments related to the market for these commodities; inventory levels of these commodities; seasonal trends; refinery availability; current and potential future environmental laws and regulations; emissions, including, but not limited to, carbon; market pricing and the accessibility and liquidity of these and related markets; prices and availability of alternate sources of energy; actions of governments and regulatory bodies; enforcement of laws and regulations; shifts or changes in governmental policy; public sentiment towards the use of non-renewable resources; political instability and social conditions in countries producing these commodities; market access constraints and transportation restrictions or interruptions; terrorist threats; technological developments; economic sanctions; outbreak of a pandemic, war or other international or regional conflict and any related government action or military exercise; the occurrence of natural disasters; and weather conditions.
The focus on the timing and pace of the transition to a lower-carbon economy and resulting trends will likely continue to affect global energy demand and usage, including the composition of the types of energy generally used by industry and individual consumers. Under certain aggressive low-carbon scenarios, potential demand erosion could contribute to commodity price fluctuations and structural commodity price declines. However, it is not currently possible to predict the timelines for, and precise effects of, the transition to a lower-carbon economy.
The financial performance of our oil sands operations could also be impacted by discounted or reduced commodity prices for our oil sands production relative to certain international benchmark prices, due, in part, to potential constraints on the ability to transport and sell products to domestic and international markets, and the quality of crude oil produced. Of particular importance to us are condensate cost and supply, and the price differentials between bitumen and both light to medium crude oil and heavy crude oil. Bitumen is more expensive for refineries to process and therefore generally trades at a discount to the market price for light to medium crude oil and heavy crude oil, which, along with higher condensate costs, can adversely affect our financial condition.
| | | | | |
| Cenovus Energy Inc. – 2025 Management's Discussion and Analysis | 41 |
The financial performance of our refining operations is impacted by the relationship, or margin, between refined product prices and the prices of refinery feedstock. Refining margins are subject to factors such as, but not limited to, prices of refinery feedstock; capacity and utilization rates at existing refineries; global and regional demand for refined products; market conditions for refined products; and seasonal demand. Sales volumes, prices, inventory levels and inventory values will fluctuate accordingly. Future refining margins are uncertain and decreases in refining margins may have a negative impact on our business, results of operations, cash flows and financial condition.
All of these factors are beyond our control and can result in a high degree of both cost and price volatility.
We integrate the potential impact of a variety of factors and scenarios into our business planning processes, including commodity price fluctuations, climate change and GHG regulations, including the cost of carbon. To mitigate uncertainty, we evaluate our business plans under a range of scenarios. Although Management believes that our assumptions and estimates are reasonable, reflect current, pending and potential future states and are informed by external scenarios, they are based on numerous assumptions and estimates that, if false, may have a material adverse effect on our business, financial condition and results of operations. As such, variations between actual outcomes and our assumptions and estimates may have a material adverse effect on our business, financial condition, results of operations, reputation and cash flows.
Fluctuations in commodity prices, associated price differentials and refining margins may impact our financial condition, results of operations, cash flows, growth, access to capital, cost of borrowing, ability to meet guidance targets, the value of our assets, the level of shareholder returns, and ability to maintain our business and fund projects. A substantial decline in these commodity prices or an extended period of low commodity prices may result in: an inability to meet all our financial obligations as they come due; a delay or cancellation of existing or future drilling, development or construction programs; curtailment in production; unutilized long-term transportation commitments; and/or low utilization levels at our refineries.
The commodity price risks noted above, as well as other risks such as market access constraints and transportation restrictions, reserves replacement and reserves estimates, and cost management that are more fully described herein, may have a material impact on our business, financial condition, results of operations, cash flows and reputation, and may, along with the comparison of the carrying value of our assets to our market capitalization, be considered indicators of impairment.
As discussed in this MD&A, we conduct an assessment, at each reporting date, of the carrying value of our assets in accordance with IFRS Accounting Standards. If crude oil, refined product, natural gas and NGL prices decline significantly and remain at low levels for an extended period, or if the costs to develop or produce such resources significantly increase, the carrying value of our assets may be subject to impairment and our net earnings could be adversely affected.
Risks Associated with Tariffs and International Trade
Discussions continue regarding current and future economic arrangements between Canada and the U.S., and the U.S.’s relationships with other global trading partners, and there remains significant uncertainty over whether tariffs, surtaxes, or other restrictive trade measures or countermeasures will be implemented or maintained and, if so, the scope, impact, and duration of any such measures. Potential measures could include, among others, increased tariffs on Canadian energy imports into the U.S. or other jurisdictions, controls or restrictions on cross-border supply chains, changes to existing preferential trade agreements such as the United States-Mexico-Canada Agreement or cross-border energy agreements, or additional regulatory barriers that could impact our ability to access international markets and conduct business efficiently.
Restrictive trade measures or countermeasures, if implemented for any period of time, could have a significant impact on the market for crude oil, NGLs, natural gas and refined petroleum products in North America and internationally and could result in, among other things, a high degree of both cost and price volatility, a relative weakening of the Canadian dollar, widening differentials, and decreased demand for our products and services. Any or all such effects may have a material adverse impact on our business, results of operations and financial condition.
Additionally, restrictive trade measures or countermeasures or export controls imposed on our products or operations could reduce our ability to compete in the global market. We also rely on the importation of specialized equipment, raw materials and technology from various global suppliers. Any restrictions, controls, or increases in tariffs on these goods could lead to higher costs for these essential inputs, thereby having a negative effect on our financial position and cash flows.
Risks Associated with Financial Risk Management Activities
Our Board-approved Market Risk Management Policy allows Management to use approved derivative financial instruments as needed, within authorized limits, to help mitigate the impact of changes in crude oil and condensate prices and differentials, NGLs and natural gas spreads, basis and prices, electricity prices, refined product, and crack spread margins, as well as fluctuations in foreign exchange and interest rates. We may also use derivative instruments and physical positions in various operational markets to help optimize our supply costs or sales of our production, or fixed-price commitments for the purchase or sale of crude oil, refined products, natural gas, NGLs and other related products.
| | | | | |
| Cenovus Energy Inc. – 2025 Management's Discussion and Analysis | 42 |
Notwithstanding the anticipated benefits of undertaking these risk management and trading activities, the use thereof may expose us to risks which may cause significant loss, including risks related to: changes in the valuation of the risk management instrument being poorly correlated to the change in the valuation of the underlying exposures; change in price of the underlying commodity or market value of the instrument or physical position; lack of market liquidity; insufficient counterparties to transact with; counterparty default; deficiency in systems or controls; human error; the unenforceability of contracts; and any inability to fulfill our delivery obligations related to the underlying physical transaction. These financial instruments may also limit the benefit to us of commodity prices, interest or foreign exchange rate changes.
Additionally, Cenovus may engage in trading activities other than for hedging purposes. These activities, including the trading of energy products, are exposed to market variables and commodity price risk. As part of these activities, the Company may enter into physical contracts and other financial instruments. Such trading activities may expose Cenovus to additional risks including: market price risk; liquidity risk; counterparty risk; and increased earnings volatility.
For details of our financial instruments, including classification, assumptions made in the calculation of fair value and additional discussion on exposure of risks and the management of those risks, see Notes 31 and 32 of the Consolidated Financial Statements.
Impact of Financial Risk Management Activities
Cenovus may employ various price alignment and volatility management strategies, including financial risk management contracts, to reduce volatility in future cash flows and improve cash flow stability.
Transactions typically span across numerous time periods. As such, these transactions reside across both realized and unrealized risk management. As the financial contracts settle, they will flow from unrealized to realized risk management gains and losses.
The discussion below summarizes the sensitivities of the fair value of our risk management positions to fluctuations in commodity prices and foreign exchange rates, with all other variables held constant. Management believes the price fluctuations identified below are a reasonable measure of volatility. The impact of the below on the Company’s open risk management positions could result in an unrealized gain (loss) impacting earnings before income tax as follows:
| | | | | | | | | | | | | | |
As at December 31, 2025 | Sensitivity Range | Increase | | Decrease |
| Crude Oil and Condensate Commodity Price | ± US$10.00/bbl Applied to WTI, Condensate and Related Hedges | — | | — |
Crude Oil and Condensate Differential Price (1) | ± US$2.50/bbl Applied to Differential Hedges Tied to Production | 1 | | (1) |
| WCS (Hardisty) Differential Price | ± US$2.50/bbl Applied to WCS Differential Hedges Tied to Production | 13 | | (13) |
| Refined Products Commodity Price | ± US$10.00/bbl Applied to Heating Oil and Gasoline Hedges | (4) | | 4 |
| Natural Gas Commodity Price | ± US$0.50/Mcf Applied to Natural Gas Hedges Tied to Production | — | | — |
| Natural Gas Basis Price | ± US$0.50/Mcf Applied to Natural Gas Basis Hedges | — | | — |
| Power Commodity Price | ± C$10.00/MWh (2) Applied to Power Hedges | 39 | | (39) |
| | | | |
(1)Excluding WCS at Hardisty.
(2)One thousand kilowatts of electricity per hour (“MWh”).
For further information on our risk management positions, see Notes 31 and 32 of the Consolidated Financial Statements.
Credit, Liquidity and Availability of Future Financing
The future development of our business may be dependent on our ability to access external capital, including, but not limited to, debt and equity financing. Among other things, unpredictable financial markets, a sustained commodity price downturn or significant unanticipated expenses, or a change in law, market fundamentals, our credit ratings, business operations or investor or lender policy or sentiment, may impede our ability to secure and maintain cost-effective financing.
Our ability to access capital and secure insurance coverage, at reasonable costs, or at all, is limited by the capacity of the applicable markets, which may be adversely affected if investors, insurers, or other relevant stakeholders adopt more restrictive decarbonization policies.
An inability to access capital on terms acceptable to us, or at all, could affect our ability to make future capital expenditures, to maintain desirable financial ratios and to meet our financial obligations as they come due, potentially resulting in a material adverse effect on our business, financial condition, results of operations, cash flows, ability to comply with various financial and operating covenants, credit ratings and reputation.
| | | | | |
| Cenovus Energy Inc. – 2025 Management's Discussion and Analysis | 43 |
Our ability to service our debt will depend upon, among other things, our future financial and operating performance, which will be affected by prevailing economic, business, regulatory, market and other conditions, some of which are beyond our control. If our operating and financial results are not sufficient to service current or future indebtedness, we may take actions such as: reducing or suspending share repurchases; reducing or suspending dividends; reducing or delaying business activities, investments or capital expenditures; selling assets; restructuring or refinancing our debt; or seeking additional capital that could have less favourable terms.
We are required to comply with various financial and operating covenants under our credit facility and the indentures governing our debt securities. Non-compliance with these covenants may lead to restrictions on access to capital or accelerated repayment.
Credit Ratings
A downgrade in any of our credit ratings, a negative change in the Company's credit ratings outlook, or the withdrawal of a rating by a rating agency could adversely affect the cost and availability of borrowing, access to sources of liquidity and capital, and our business relationships with counterparties, operating partners and suppliers. Credit ratings are based on our financial and operational strength and several factors not entirely within our control, including, but not limited to, conditions affecting the oil and gas and refining industries generally, industry risks associated with the transition to a lower-carbon economy, government policies and the general state of the economy.
If one or more of our credit ratings falls below certain ratings thresholds, we may be obligated to post additional collateral in the form of cash, letters of credit or other financial instruments to establish or maintain business arrangements. Failure to provide adequate credit risk assurance to counterparties and suppliers may result in foregoing opportunities or having contracts terminated.
Exposure to Counterparties
In the normal course of business, we enter into contracts with suppliers, partners, lenders, customers and other counterparties. If such parties do not fulfill their contractual obligations on a timely basis or at all, we may suffer financial losses or delays to our development plans, or we may have to forego other opportunities, all of which could materially impact our business, results of operations and financial condition.
Foreign Exchange Rates
Cenovus’s revenues are predominantly based on U.S. dollar benchmark prices, and a significant portion of our long-term debt and interest expense is denominated in U.S. dollars, while many of our operating and capital costs are in Canadian dollars. A portion of our long-term sales contracts in Asia Pacific are priced in RMB. Fluctuations in foreign exchange rates, particularly the U.S./Canadian dollar and RMB/Canadian dollar, may affect our results and could have a material adverse effect on our cash flows and financial condition.
Interest Rates
Fluctuations in interest rates could negatively affect Cenovus’s financial performance. This risk arises during the refinancing of maturing long-term debt, when issuing new debt, or through changes in borrowing costs on floating-rate instruments. We are also exposed to interest rate variability on existing credit facilities used to support liquidity. Additionally, shifts in interest rates could change our net finance costs and could impact how certain liabilities are recorded. Collectively, these factors could have an impact on Cenovus’s financial results.
Dividend Payments and Purchase of Securities
The payment of dividends, whether base, variable or preferred, the continuation of our dividend reinvestment plan and any potential purchase by Cenovus of our securities is at the discretion of our Board and is dependent upon, among other things, financial performance, debt covenants, satisfying solvency tests, our ability to meet financial obligations as they come due, working capital requirements, future tax obligations, future capital requirements, commodity prices and other risks identified in the Risk Management and Risk Factors section of this MD&A. The frequency and amount of variable dividend payments, if any, may vary significantly over time as a result of our Net Debt and Excess Free Funds Flow, amount of share buybacks and other factors inherent within our capital allocation framework, including Management’s discretion to accelerate, defer or reallocate any Excess Free Funds Flow to shareholder returns between quarters. Our Net Debt and Excess Free Funds Flow may vary as a result of, among other things, our business plans, results of operations, acquisitions and dispositions, financial condition and impact of any of the risks identified in the Risk Management and Risk Factors section of this MD&A. The Company can provide no assurance that it will continue to pay base or variable dividends or authorize share buybacks at the current rate, or at all, as any share repurchases and payment of dividends is at the discretion of our Board.
| | | | | |
| Cenovus Energy Inc. – 2025 Management's Discussion and Analysis | 44 |
Disclosure Controls and Procedures (“DC&P”) and Internal Control Over Financial Reporting (“ICFR”)
Based on their inherent limitations, DC&P and ICFR may not prevent or detect misstatements, and even those controls determined to be effective can only provide reasonable assurance with respect to financial statement preparation and presentation. Failure to adequately prevent, detect and correct misstatements could have a material adverse effect on our business, financial condition, results of operations, cash flows and reputation.
Management has limited the scope of the design of DC&P and ICFR for the business acquired from MEG for the current reporting period, as permitted under National Instrument 52‑109, “Certification and Disclosure in Issuers’ Annual and Interim Filings” (“NI 52-109”). Management continues to integrate the acquired operations and expects to complete its assessment and alignment of DC&P and ICFR with Cenovus’s control environment during 2026. For further details, see the Control Environment section of this MD&A.
Operational Risk
Operational Considerations (Safety, Environment and Reliability)
Our operations are subject to risks generally affecting the oil and gas and refining industries and normally incidental to: (i) the storing, transporting, processing and marketing of crude oil, refined products, natural gas, NGLs and other related products; (ii) the drilling and completion of crude oil and natural gas wells; (iii) the operation and development of crude oil and natural gas properties; (iv) the operation of refineries, terminals, pipelines and other transportation and distribution facilities, including at facilities operated by our partners or third parties; and (v) the development and operation of projects relating to our sustainability goals, including carbon capture, utilization and storage projects. These risks include, but are not limited to: the effects of government actions, laws or regulations, policies and initiatives, including as a result of new or existing administrations in the jurisdictions in which we conduct operations, development or exploration; encountering unexpected formations or pressures; premature declines of reservoir pressure or productivity; fires; flooding; geologic activity arising from fracking or carbon capture, utilization and storage projects; explosions; blowouts; loss of containment; gaseous leaks; power outages; migration of harmful substances into water systems; releases or spills, including releases or spills from offshore operations, shipping vessels or other marine transport incidents; aviation, railcar or road transportation incidents; iceberg incidents; accidents or damage caused by third parties or otherwise occurring in the operation of our business; uncontrollable flows of crude oil, natural gas or well fluids; failure to follow operating procedures or operate within established operating parameters; adverse weather conditions including, but not limited to, adverse sea conditions, extreme weather events, wildfires and natural disasters; corrosion; pollution; freeze-ups and other similar events; the breakdown or failure of equipment, pipelines, facilities, wells and projects; the breakdown or failure of operational and information technology and systems and processes, any compromise thereof or released data; regular or unforeseen maintenance; equipment underperformance; failure to maintain adequate supplies of spare parts; operator error; shortages of skilled labour; labour disputes and strikes; disputes with owners or operators of interconnected facilities and carriers; planned or unplanned operational disruptions or apportionment on third-party systems or refineries, which may prevent the full utilization of such party’s facilities and pipelines; spills at truck terminals and hubs; spills associated with the loading and unloading of potentially harmful substances; loss of product; price, quality and unavailability of feedstock, including condensate; epidemics or pandemics; protests, blockades or other acts of activism; geopolitical factors including but not limited to war, vandalism or terrorism, or other regional or international conflict or action; and catastrophic events, including, but not limited to, accidents or hazards that may occur at or during transport to or from commercial or industrial sites.
Climate change may result in an increased level of operational risk requiring increased or additional mitigation measures. Systemic climatic changes or extreme climatic conditions may increase our exposure to, and magnitude of, the impact of physical climate risks, such as floods, drought, wildfires, earthquakes, hurricanes, typhoons, storms, extreme temperatures and other extreme weather events or natural disasters. Severe weather conditions may result in an operational incident with the potential to result in spills, asset damage and production, refining disruption or safety and reliability of operations.
If any such risks materialize, they may: interrupt operations; impair our ability to achieve our sustainability goals; cause loss of life or personal injury; result in loss of or damage to equipment, property, operational and information technology and control systems and data, which may result in reduced revenue from reduced capacity or business interruption, or increased costs related to asset repair; cause environmental damage that may include polluting water, land or air; cause reputational damage; and may result in regulatory action, fines, penalties, civil suits or criminal or regulatory charges against us, any of which may have a material adverse effect on our business, financial condition, results of operations, cash flows and reputation.
We maintain a comprehensive insurance program in respect of our assets and operations. However, not all potential occurrences and disruptions in respect of our assets or operations are insured or are insurable, and we cannot guarantee that our insurance coverage will be available or sufficient to fully cover any claims that may arise from such occurrences or disruptions. The occurrence of an event that is not fully covered by our insurance program could have a material adverse effect on our business, financial condition, results of operations and cash flows.
| | | | | |
| Cenovus Energy Inc. – 2025 Management's Discussion and Analysis | 45 |
Market Access Constraints and Transportation Restrictions
Our production is transported through, and our refineries are reliant on various pipelines and terminals, as well as rail, marine and truck networks, to transport feedstock and refined products to and from third-party, or Cenovus, owned and/or operated, facilities. The impacts of tariffs and responses thereto (including by governments, our trade partners and customers), which may include, without limitation, tariffs, surtaxes, countermeasures, countervailing duties, antidumping duties, special duties, export taxes on Cenovus’s products, and restrictions on imports and exports, such as export controls, sanctions or other measures, or disruptions in, or restricted availability of, pipeline, terminal, marine, rail or truck transport systems, could limit the ability to deliver production volumes and adversely affect commodity prices, sales volumes and/or the prices received for our products, projected production growth, upstream or refining operations and cash flows. These interruptions and restrictions may be caused or intensified by, among other things, the inability of the pipeline, terminal or marine, rail or truck networks to operate, or may be related to capacity constraints if supply into the system exceeds the infrastructure capacity. There can be no certainty that third-party pipeline projects for new or expanded capacity will be approved or constructed or that such projects would provide sufficient transportation capacity.
There is no certainty that rail, marine and truck transport and other alternative types of transportation for our production will be sufficient to address gaps caused by operational constraints on the pipeline system. In addition, our rail, marine and truck shipments may be impacted by service delays, changes to laws and regulations, labour issues, inclement weather, vessel, railcar or truck availability, geopolitical factors, war, terrorism, or other international or regional conflict, or other rail, marine or truck transport incidents and could adversely impact sales volumes or the price received for product, or impact our reputation or result in legal liability, loss of life or personal injury, loss of equipment or property or environmental damage. Should laws and regulations change, the costs of complying with those changes will likely be passed on to Cenovus and may adversely affect our ability to transport by rail, marine or truck or the economics associated with such transportation. Finally, planned or unplanned shutdowns, outages or closures of our refineries or third-party systems can limit our ability to receive or deliver product with negative implications on our business, financial condition, results of operations and cash flows.
Reserves Replacement
If we fail to acquire, develop or find additional crude oil and natural gas reserves, our reserves and production will decline materially from their current levels. Our business, reputation, financial condition, results of operations and cash flows are highly dependent upon successfully producing from current reserves and acquiring, discovering or developing additional reserves. Exploring for, developing or acquiring reserves is capital intensive. To the extent our cash flow is insufficient to fund capital expenditures and external sources of capital become limited or unavailable, our ability to make the necessary capital investments to maintain and expand our crude oil and natural gas reserves will be impaired. In addition, we may be unable to find and develop or acquire additional reserves to replace our crude oil and natural gas production at acceptable costs.
The production rate of oil and gas properties tends to decline as reserves are depleted, while the associated operating costs increase. Maintaining an inventory of developable projects to support future production of crude oil and natural gas depends on, among other things: obtaining and renewing rights to explore, develop and produce crude oil, refined products, natural gas, NGLs and other related products; drilling success; completing long-lead time capital intensive projects on budget and on schedule; and the application of successful exploitation techniques on mature properties.
Reserve Estimates
There are numerous uncertainties inherent in estimating quantities of reserves, including many factors beyond our control. In general, estimates of economically recoverable crude oil and natural gas reserves and associated future net cash flows and revenue are based on a number of variable factors and assumptions including, but not limited to: geological and engineering estimates; product prices; future operating and capital costs; historical production from the properties and the assumed effects of regulation by governmental agencies, including royalty payments and taxes, and environmental and emissions-related laws and regulations and taxes; initial production rates; production decline rates; and the availability, proximity and capacity of oil and gas gathering systems, pipelines, rail, truck and marine transportation and processing facilities, all of which may cause actual results to vary materially from estimates.
All such estimates are uncertain, and classifications of reserves are only attempts to define the degree of uncertainty involved. The accuracy of any reserves estimate is a matter of interpretation and judgment and is a function of the quality and quantity of available data, which may have been gathered over time. For those reasons, estimates of the economically recoverable crude oil and natural gas reserves attributable to any particular group of properties, and classification of such reserves based on risk of recovery and estimates of future net revenue expected therefrom, as prepared by different engineers or by the same engineers at different times, may vary substantially. Our actual production, revenues, taxes, and development and operating expenditures with respect to our reserves may vary from current estimates and such variances may be material.
| | | | | |
| Cenovus Energy Inc. – 2025 Management's Discussion and Analysis | 46 |
Estimates with respect to reserves are often based on volumetric calculations and upon analogy to similar types of reserves, rather than upon actual production history. Estimates based on these methods are generally less reliable than those based on actual production history. Subsequent evaluation of the same reserves based on production history will result in variations in the estimated reserves, which may be material. The evaluation of reserves is a continuous process which can be significantly impacted by a variety of internal and external influences, and periodic revisions are required as a result of newly acquired technical data, technology improvements or changes in performance, pricing, economic conditions, market availability or regulatory requirements.
Non-Producing or Undeveloped Reserves
A significant portion of our bitumen reserves, as well as a portion of our light and medium oil, NGLs and conventional natural gas reserves, are classified as undeveloped and will require significant expenditures to render them capable of production. These reserves may not ultimately be developed or produced, either because it may not be commercially viable to do so or for other reasons. As these reserves are non-producing and/or undeveloped, their estimation relies on geological and recovery performance analogs that assume success case outcomes that may not materialize. These reserves are expected to be developed over multiple decades, with decisions regarding the priority and timing of development depending on a range of factors, including economic conditions, government regulations such as production limits, observed reservoir performance, development plan optimization, facility capacity, pipeline constraints, the overall size of the development program and strategic considerations. As a result, developments may be delayed, advanced, or cancelled, and the associated reserves may be revised and/or reclassified or removed from the reserves base.
SAGD Bitumen Recovery Process
The SAGD bitumen recovery process is energy intensive and consumes significant amounts of natural gas in the production of steam that is used in the recovery process. The amount of steam required in the recovery process varies and therefore impacts natural gas and related emissions costs. Geological characteristics, in concert with the actual development and operating practices employed, directly influence the efficiency of steam chamber conformance and propagation. Variability in these factors can materially affect bitumen mobility, steam‑oil ratios and recovery factors, which may differ materially from estimates informed by geological and recovery performance analogs, which are inherently less reliable than actual production history. Variability of any of these development or operational considerations may reduce production, increase costs or lead to revisions to reserves estimates or development plans. A large increase in costs could cause certain projects that rely on the SAGD bitumen recovery process to become economically challenged, which could have a negative effect on our business and financial condition.
Operational issues may adversely affect the stability and performance of the SAGD bitumen recovery process. The requirement to maintain reservoir integrity, under sustained steam‑injection can impact production timing, costs and recovery performance. Operational issues and reservoir integrity related events, may result in production curtailments, increased costs, regulatory involvement or revisions to future development plans and reserve estimates.
Cost Management and Inflation
Development, operating and construction costs are affected by a number of factors including, but not limited to: development, adoption and success of new technologies, including those related to our GHG emissions reduction goals; inflationary price pressure; changes in regulatory compliance costs; scheduling delays; interruptions to existing market access infrastructure; failure to maintain quality construction and manufacturing standards; equipment limitations, including the cost or availability of oil and gas field equipment; commodity prices; higher steam-oil ratios in our Oil Sands operations; economic sanctions; restrictive trade measures or countermeasures; changing government policies (including but not limited to environmental policies), laws and regulations; supply chain disruptions, including force majeure; and access to skilled labour and critical third-party services. Such higher costs may not be fully offset through corresponding increases in commodity prices and other sources of funding. Inflation and any governmental response thereto, such as the imposition of higher interest rates or wage controls, our inability to manage costs, or our inability to secure equipment, materials, skilled labour or third-party services necessary to our business activities for the expected price, on the expected timeline, or at all, could have a material adverse effect on our business, financial condition, results of operations and cash flows.
Technology, Information Systems and Data Privacy
We rely heavily on technology, including operations technology and information technology, to effectively run our business. This includes all core technology assets and services, both on-premises and third-party systems, such as networks, computer hardware and software, telecommunications, mobile applications, cloud services and other technologies, including artificial intelligence (“AI”). The organization is introducing AI through a deliberate, strategically governed approach, beginning with pilot‑phase use cases that focus on improving productivity and enhancing decision‑support capabilities. If we cannot access, use, secure, upgrade or maintain these systems and services or if our information is lost, corrupted or disclosed, operations could be disrupted.
| | | | | |
| Cenovus Energy Inc. – 2025 Management's Discussion and Analysis | 47 |
In the ordinary course of business, we collect, use and store sensitive business data, including intellectual property, proprietary information and personal information. Despite security measures, our systems and services may be exposed to risks such as cyber-attacks, espionage, activism, terrorism, war or geopolitical instability, natural disasters, or human errors or malfeasance. Additional risks also include cyber fraud through attacks that bypass controls, impersonate staff or business partners to divert payments or financial assets, or use ransomware to demand payment or block systems access.
Any incident, breach, or disruption of our internal or third-party technology systems or services, including where a threat actor bypasses our cybersecurity measures or business process controls, could result in theft, loss or misuse of internal, confidential, business, financial, proprietary, personal or other sensitive data.
Cyber incidents, privacy or security breaches, or misuse of technology or data (including those involving AI), could also result in business interruption, financial loss, remediation and recovery costs, legal claims or proceedings, liability under law or regulations (including those related to AI, cybersecurity, data processing, or privacy), regulatory penalties or fines (where applicable), operational disruption, reputational damage and other material adverse effects on our business.
The regulatory landscape governing technology use is constantly evolving across all jurisdictions where we operate, covering data processing and transfers, cybersecurity and data protection, third-party risk, AI and privacy. The rapid growth of generative AI tools and embedded features increases technology and data privacy risks through potential misuse, biased or incorrect automated decision-making, or unauthorized exposure of Cenovus’s sensitive data.
Failure to comply with laws or regulatory standards, including the use or misuse of AI or inadequate protection of personal data, could result in legal action against the Company by governmental entities or others, fines and penalties (where authorized under relevant law), reputational harm, or may have a negative impact on our financial performance. Compliance with continuously evolving legislation may also increase our operating costs.
Competition
We compete with other producers, refiners and marketers in all aspects, including access to capital, the exploration and development of new and existing sources of supply, the acquisition of crude oil and natural gas interests, and the refining, distribution and marketing of oil and gas products. Resource inventory quality, operating and, or, capital costs, and market access are the primary controllable drivers of financial performance in the energy industry. Cenovus invests in technology innovation and continuous improvement in an effort to reduce costs and improve financial returns to maintain a competitive position relative to peers. The broader hydrocarbon industry also competes with alternative energy sources including renewable fuels and electricity, which compete for market share. Failure to maintain a competitive position relative to hydrocarbon industry peers and alternative energy sources could result in adverse effects to our business, financial condition, cash flows and reputation.
Project Execution
We manage a variety of growth and optimization projects across our global portfolio of assets. In addition, we have other projects in various stages of planning and development, including maintenance and turnaround projects, and projects related to our GHG emissions reduction goals. The wide range of risks associated with project development and execution, as well as the commissioning and integration of new facilities with existing assets, can impact the economic viability of our projects. These risks include, but are not limited to: our ability to obtain the necessary environmental and regulatory approvals; our ability to obtain favourable contract terms or to be granted access within land-use agreements; our ability to access, implement and use operational and information technologies and data, including improvements thereto; risks relating to schedule, contractor performance, engineering and design, transportation and installation of project components, resources and costs, including the availability and cost of materials, equipment and qualified personnel; the impact of supply chain disruptions; the impact of general economic, business and market conditions including inflationary pressures; the impact of weather conditions; risk related to the accuracy of project cost estimates; our ability to finance capital expenditures and expenses on a cost effective basis; our ability to identify or complete strategic transactions; and the effect of changing government laws and regulations, including as a result of new or existing administrations in the jurisdictions in which we conduct operations, development or exploration; and public expectations in relation to the impacts of oil and gas operations on the environment and those associated with GHG emissions abatement initiatives. The commissioning and integration of new infrastructure and facilities within our existing asset base could cause delays in achieving performance targets and objectives. Failure to manage these risks could affect our safety and environmental record and have a material adverse effect on our financial condition, results of operations, cash flows and reputation.
| | | | | |
| Cenovus Energy Inc. – 2025 Management's Discussion and Analysis | 48 |
Joint Ventures and Partnerships
Some of our assets are not operated or controlled by us or are held in partnership with others, including through joint ventures and we are, at times, dependent upon our partners for the successful execution and operation of various projects and assets, their management of operational issues and their reporting. In addition, certain of our projects under development, including those related to our GHG emissions reduction goals, are expected to be constructed and operated in collaboration with third parties. Therefore, our results of operations, cash flows and progress towards our GHG emissions reduction goals may be affected by the actions of third-party operators or partners in areas where our ability to control and manage risks may be reduced.
Our partners may have objectives and interests that may not align with, or may conflict with, our interests. No assurance can be provided that our future demands or expectations relating to such assets and projects will be satisfactorily met in a timely manner or at all. If a dispute with a partner or partners were to occur over the development and operation of a project, or if a partner or partners were unable to fund their contractual share of the expenditures, a project could be delayed, and we could be partially or totally liable for our partner’s or partners’ share of the project. Should one of our partners become insolvent, we may similarly be directed by applicable regulators to carry out obligations on behalf of our partner or partners and may not be able to obtain reimbursement for these costs. Failure to manage these partner risks could have a material adverse effect on our business, financial condition, results of operations, progress towards our GHG emissions reduction goals, reputation and cash flows.
Existing and Emerging Technologies
We depend on, among other things, the availability and scalability of existing and emerging technologies to meet our business goals, including our sustainability goals. Limitations related to the development, adoption and success of these technologies or limited development of disruptive technologies could have a negative impact on our long-term business resilience.
Governmental Policy
Shifts in governmental policy by new or existing administrations can impact our operations and ability to grow our business. Restrictions on fossil fuel-based energy use and cross-border economic activity can impact supply of, demand for, and pricing of our products and services, and our opportunities for continued growth.
Cenovus works with all levels of government in the jurisdictions in which we conduct business operations, development or exploration to ensure we remain competitive, risks are understood and mitigation strategies are implemented; however, we cannot predict the timelines for, and precise effects of, changes in governmental policy which may adversely affect our business, results of operations, financial condition or reputation.
Regulatory Risk
The crude oil, natural gas, NGLs and refining industries in general, and our operations in particular, are subject to regulation and intervention under various levels of legislation in the countries in which we operate, seek to explore, develop and produce crude oil, refined products, natural gas, NGLs and other related products. Regulated areas of our operations include, but are not limited to: land tenure; permitting of projects; royalties; taxes (including income taxes and tariffs); government fees; production rates; environmental protection; occupational and process safety management; protection of certain species or lands; cumulative effects and/or impacts from all types of industrial development; environmental plans, laws and regulations; the reduction of GHG and other emissions; the export and import of crude oil, refined products, natural gas, NGLs and other related products; the transportation of crude oil, refined products, natural gas, NGLs and other related products by pipeline, rail, marine or truck transport; generation, handling, storage, transportation, treatment and disposal of hazardous substances; the awarding, acquisition and maintenance of exploration, development and production rights; the imposition of specific drilling obligations; control over the development, abandonment, remediation and reclamation of fields (including restrictions on production) and/or facilities; and possible expropriation or cancellation of contract rights. See “Environmental Plans and Regulations Risks” below. Any changes to applicable regulatory regimes, including the implementation of new laws or regulations or enforcement initiatives, repeal of any existing laws or regulations, or the modification or changed interpretation of existing laws or regulations, could impact our existing and planned projects requiring increased capital investment, operating expenses or compliance costs, which could adversely impact our financial condition, results of operations, cash flows and reputation.
| | | | | |
| Cenovus Energy Inc. – 2025 Management's Discussion and Analysis | 49 |
Regulatory Approvals
Our operations require us to obtain approvals from various regulatory authorities and there are no guarantees that we will be able to obtain and maintain on acceptable conditions, or at all, all necessary licences, permits and other approvals required to conduct activities (including, without limitation, certain exploration, development and operating activities) related to our projects. In addition, obtaining certain approvals from regulatory authorities can involve, among other things, stakeholder consultation, Indigenous consultation (including consensus seeking, collaboration or consent), environmental impact assessments and public hearings. Regulatory approvals obtained may be subject to the satisfaction of certain conditions including, but not limited to: security deposit obligations; ongoing regulatory oversight of projects; mitigating or avoiding project impacts; environmental and habitat assessments; and other commitments or obligations. The failure to obtain applicable regulatory approvals or satisfy any conditions on a timely basis or satisfactory terms could result in increased costs, project delays and may limit Cenovus’s ability to develop or expand proposed projects efficiently or at all.
Decommissioning
We are subject to decommissioning, abandonment, remediation and reclamation (“Decommissioning”) liabilities for our operations and development and exploration activities, including those imposed by regulation under various levels of legislation in the jurisdictions in which we conduct operations, development or exploration.
We maintain estimates of our Decommissioning liabilities; however, it is possible that these costs may change materially before Decommissioning due to regulatory and legislation changes, technological changes, ecological risks, changes to Decommissioning timelines and inflation, among other variables.
We have an ongoing environmental monitoring program of owned and leased retail locations, and former owned or leased retail locations where we have retained environmental liability and perform remediation where required to comply with contractual and legal obligations. The costs of such remediation may not be determinable due to the unknown timing and extent of corrective actions that may be required.
The impact on our business of any legislative, regulatory or policy decisions relating to the Decommissioning liability regulatory regimes in the jurisdictions in which we conduct operations, development or exploration cannot be reliably or accurately estimated and may be affected by changes in governmental policy, including as a result of new or existing administrations in the jurisdictions in which we conduct operations, development or exploration. Any cost recovery or other measures taken by applicable regulatory bodies may impact Cenovus and could materially and adversely affect, among other things, our business, financial condition, results of operations and cash flows.
Royalty Regimes
Our cash flows may be directly affected by changes to royalty and mineral tax regimes. The governments of the jurisdictions where we have producing assets receive royalties on the production of hydrocarbons from lands in which they respectively own the mineral rights and which we produce under agreement with each respective government. Government regulation of royalties and mineral tax is subject to change for a number of reasons, including, among other things, political factors. In Canada, there are certain provincial mineral taxes payable on hydrocarbon production from lands other than Crown lands. The potential for changes in the royalty and mineral tax regimes applicable in the jurisdictions in which we conduct operations, development or exploration, or changes to how existing royalty and mineral tax regimes are interpreted and applied by the applicable governments, creates uncertainty relating to the ability to accurately estimate future royalty rates or mineral taxes and could have a significant impact on our business, financial condition, results of operations and cash flows. An increase in the royalty rates or mineral taxes in jurisdictions where we have producing assets would reduce our earnings and could make, in the respective jurisdiction, future capital expenditures or existing operations uneconomic and may reduce the value of our associated assets.
Indigenous Land and Rights Claims
In Canada, Aboriginal and/or treaty rights held by Indigenous peoples are protected under the Constitution. Impacts to these Aboriginal and/or treaty rights must be considered in areas where Cenovus operates. The successful assertion of Indigenous title or other Indigenous rights claims on lands where we operate could have a material adverse impact on our operations or pace of growth.
Opposition by Indigenous communities to our Company, operations, activities, development or exploration on Crown land leases, may adversely impact our reputation and our ability to execute operational or exploration plans. Other impacts may include diversion of Management’s time and resources, increased legal, regulatory and other advisory expenses, and impeding our ability to explore, develop and continue to operate projects. In addition, changes in law related to Indigenous rights and title may have a material adverse impact on our business and operations.
| | | | | |
| Cenovus Energy Inc. – 2025 Management's Discussion and Analysis | 50 |
Furthermore, Indigenous title or other Indigenous rights claims, as well as opposition by Indigenous communities, can affect the oil and gas and refining industries as a whole. Legal challenges or opposition to major infrastructure projects such as pipelines, railways, or export terminals may result in delays, cancellations, or increased costs. These outcomes may adversely impact our operations, pace of growth, share price and development plans, even if our Company is not directly involved in the development or operation of such projects.
Climate Change-Related Risks
There is international concern regarding climate change and a significant focus on the timing and pace of the transition to a lower-carbon economy. Governments, financial institutions, insurance companies, non-governmental organizations (“NGOs”), environmental and governance organizations, rating agencies, institutional investors, social and environmental activists, shareholders and individuals are seeking to implement, among other things, regulatory and policy changes, changes in investment patterns, and modifications in energy consumption habits and trends which, individually and collectively, are intended to, or have the effect of, accelerating the reduction in the global consumption of fossil fuel-based energy, the conversion of energy usage to less carbon-intensive forms and the general migration of energy usage away from fossil fuel-based forms of energy. A transition to a lower carbon economy could increase the demand for lower emissions and alternative energy sources. Changes in customer behaviour related to reduced energy consumption could impact Cenovus’s customers and in turn, the demand for Cenovus’s products. Transition to a lower carbon economy could also pose a risk to Cenovus if it is unable to diversify its operations on pace with such a transition.
In addition, climate change-related regulatory, climatic and transition risks can also have industry-wide effects, particularly through their influence on major infrastructure projects. Regulatory changes, market trends, or policy shifts may lead to delays, cancellations, or increased costs for projects critical to the industry. Such impacts may indirectly affect our operations, growth prospects, share price and development plans, even if our Company is not directly involved in the development or operation of such projects.
Climate change and its associated impacts may increase our exposure to, and magnitude of, each of the risks identified in the Risk Management and Risk Factors section of this MD&A. Overall, we are not able to estimate at this time the degree to which climate change-related regulatory, climatic conditions and climate-related transition risks could impact our business, financial condition and results of operations. Our business, financial condition, results of operations, cash flows, reputation, regulatory approvals, access to capital and insurance, cost of borrowing, ability to fund dividend payments and/or business plans may, in particular, without limitation, be adversely impacted as a result of climate change and its associated impacts.
Climate Change Regulations
Cenovus operates in several jurisdictions that regulate, or have proposed to regulate, GHG emissions, often with a view to transitioning to a lower-carbon economy. Some of these regulations are in effect, while others remain in various phases of discussion, review, or implementation, creating policy uncertainty. Further ambiguity exists as a result of the timing and possible impact of any contemplated or emerging regulations, including, but not limited to, how new and existing regulations may be harmonized and synchronized with already existing or contemplated requirements across jurisdictions. Furthermore, policy uncertainty exists as a result of changing government administrations, making the policy and cost impact to the business uncertain and unpredictable. Additional climate change regulations, including the implementation of regulations not currently contemplated, and changes to existing and future regulations, may adversely affect Cenovus’s business, financial condition, results of operations, regulatory approvals and cash flows, which impacts cannot be reliably or accurately estimated. Examples of such regulatory change include, but are not limited to, carbon pricing, regulation or limiting of GHG emissions, standards for carbon intensity of liquid fossil fuels, renewable fuel standards, vehicle emissions standards, sales targets for electric vehicles and regulation of electricity generation.
Changes in environmental and emissions legislation and regulations by government authorities could require changes to facility design and operations, potentially increasing the cost of construction, operation and abandonment. Other possible effects from emerging regulations may include, but are not limited to, increased compliance costs, penalties, permitting delays, a general shift away from fossil fuel-based energy, reduced future demand (and corresponding price levels) for our products, substantial costs to generate or purchase emission credits or allowances and higher prices for essential inputs (such as condensate), any of which may increase operating expenses. Further, emission allowances or offset credits may not be available for acquisition or may not be an economically viable option; required emissions reductions may not be technically or economically feasible to implement, in whole or in part; and failure to access resources or technology to meet emissions reduction requirements or other compliance mechanisms may have a material adverse effect to the business, resulting in, among other things, fines, permitting delays, penalties, shutting in production, and/or the suspension of operations.
The extent and magnitude of any adverse impacts of current or future regulations cannot be reliably or accurately estimated, in part because certain legislative and regulatory requirements have not been finalized, others are subject to change, and uncertainty exists with respect to additional measures being considered, the timeframes for compliance and that actual costs and impacts may be different than anticipated and such differences may be material.
| | | | | |
| Cenovus Energy Inc. – 2025 Management's Discussion and Analysis | 51 |
Labour Relations
We depend on unionized labour for the operation of certain facilities and may be subject to employee relations and labour disputes, which could disrupt operations at such facilities. As of December 31, 2025, approximately 11 percent of our employees were represented by unions under collective bargaining agreements, which includes approximately 47 percent of our U.S. and one percent of our Canadian workforce.
At unionized worksites there is risk that strikes, or work stoppages could occur, which may have a material adverse effect on our business. The Company may also incur significant costs associated with mitigation and emergency operations plans to ensure continuity of operations in the event of a strike or lockout. Future unionization efforts of Cenovus’s non-represented workforce may result in higher wage, benefits and other adverse employment consequences related to flexibility and management rights.
Lastly, we did see increased unionization activity in 2025, which resulted in the unionization of an asset in our Atlantic Region which was previously unrepresented. Changes to the workplace resulting from transactions may increase unionization drive.
2026 will be a busy negotiating period across the organization, as all current collective agreements will expire and are open for renegotiation. Renegotiations of our existing collective bargaining agreements may result in terms that are more or less favourable to us.
Any of these actions may have a material adverse effect on our business, safety, reputation, financial condition, results of operations and cash flows.
Leadership and Talent
Our success depends on strong leadership and a highly skilled, capable workforce. If we are unable to attract, develop and retain key personnel and diverse critical talent with the behaviours, leadership experience, technical and professional competencies needed to support our desired organizational and safety culture, we may face material adverse impacts to our business, safety, reputation, financial condition, results of operations and cash flows. Inadequate management of human-resources–related risks could also result in financial and/or reputational losses or risks, including those arising from actions that do not comply with applicable employment laws.
Additionally, insufficient succession planning or gaps in our talent pipeline for leadership positions could disrupt operations and slow organizational progress.
The integration of new personnel acquired in transactions may result in increased attrition rates in the workforce (including the loss of key employees), disruption of ongoing employment relationships and increased employment-related litigation.
Lastly, failure to sustain a culture that supports safety, inclusion and strong performance may undermine our strategic execution.
Security and Terrorist Threats
Security threats and terrorist activities may impact our personnel, or those of partners, customers and suppliers, which could result in injury, loss of life, extortion, hostage situations and/or kidnapping or unlawful confinement, destruction or damage to property of Cenovus or others, impact to the environment and business interruption. A security threat or terrorist attack targeted at a facility, terminal, pipeline, rail or trucking network, office or offshore vessel/installation owned or operated by Cenovus or any of our systems, services, infrastructure, market access routes, or partnerships could result in the interruption or cessation of key elements of our operations. The risk profile for security and terrorist threats may vary based on geography, international developments and geopolitical risk levels, and the outcomes of such incidents could have a material adverse effect on our business, safety, reputation, financial condition, results of operations and cash flows.
International Developments and Geopolitical Risk
We are exposed to the financial and operational risks associated with operating in the Asia Pacific region. Our business includes both operated and non-operated assets in the South China Sea and requires cooperation agreements with our partner, China National Offshore Oil Corporation or its subsidiaries (collectively, “CNOOC”). Additionally, the Asia Pacific business includes non-operated assets offshore in the Indonesia Madura Strait, held through and operated by the joint venture, HCML with delegation to CNOOC.
| | | | | |
| Cenovus Energy Inc. – 2025 Management's Discussion and Analysis | 52 |
Developments impacting international trade, particularly between Canada and the U.S., the U.S. and China, Canada and China, and the EU and China, including military exercises, changes in laws or enforcement of existing laws, exchange rate fluctuations, trade disputes, the renegotiation or nullification of agreements or treaties, new or increased tariffs and responses thereto (including by governments, our trade partners and customers), which may include, without limitation, retaliatory tariffs, surtaxes, countermeasures, countervailing duties, antidumping duties, export or import taxes on Cenovus’s products, and restrictions on imports and exports, such as export controls, sanctions and other measures, may negatively impact development projects, markets and cause weaker macroeconomic conditions or drive political or national sentiment, weakening demand for crude oil, refined products, natural gas, NGLs and other related products, which could materially and adversely affect, among other things, our business, financial condition, results of operations and cash flows.
We may be affected by changes to bilateral relationships, the frameworks and global norms that govern international trade and other geopolitical developments. This includes acute shocks (such as civil unrest or sanctions) and chronic stresses (such as political or business disputes, and other forms of conflict, including military conflict) that may pose longer-term threats to our business. Unilateral action by, or changes in relations between, countries in which we operate, including the U.S. and China, and such countries’ approaches to multilateralism and trade protectionism can impact our ability to access markets, technology, talent and capital. Similarly, political developments such as we are currently seeing in Venezuela may lead to short- or longer-term impacts in regional and global oil and gas markets. Disruptions or unanticipated changes of this nature may affect our ability to sell our products for optimum value or access inputs required for effective operations and have the potential to adversely affect our financial condition.
Litigation and Claims
From time-to-time, we may receive demands, or be involved in disputes, regulatory orders, investigations, proceedings, arbitrations and/or litigation (“Claims”) arising out of, or related to, our business, operations and/or contractual relationships. Due to the nature of our business and operations, we may be subject to various types of Claims including, but not limited to, failure to comply with applicable laws and regulations such as those related to health and safety, climate change, competition, public statements and marketing, the environment, breach of contract, negligence, product liability, antitrust, bribery and other forms of corruption, tax, securities class actions, derivative actions, patent infringement, privacy, employment, human rights, labour relations, personal injury and other Claims, any of which may be material.
In recent years there has been an increase in climate change-related demands, disputes and litigation in various jurisdictions including the U.S. and Canada and investigations into how climate-related goals are established and promoted. While many of the climate change-related actions are in preliminary stages of litigation, and in some cases assert novel or untested causes of action, there can be no assurance that legal, societal, scientific and political developments will not increase the likelihood of successful climate change-related litigation against energy producers, like Cenovus. We may be subject to adverse publicity associated with such matters, which may negatively affect public perception and our reputation, regardless of whether we are found responsible.
We may be required to incur substantial expenses and devote significant resources in respect of any such Claims. In addition, any such Claims could result in unfavourable judgments, orders, decisions, fines, sanctions, penalties, monetary damages, temporary or permanent suspensions of operations or restrictions on our business. The outcome of any such Claims can be difficult to assess or quantify and may have a material adverse effect on our business, safety, reputation, financial condition, results of operations and cash flows.
Environmental Plans and Regulations Risks
All phases of our operations are subject to environmental plans and regulation, oversight and enforcement pursuant to a variety of laws and regulations imposed by various levels of governments in the jurisdictions in which we conduct operations, development or exploration, including land management plans, laws and regulations. Compliance with applicable regulations may result in approval delays for projects, critical licences and permits, stricter standards and enforcement, larger fines and liabilities, the introduction of emissions limits, litigation, increased capital and operating expenses, increased compliance costs and increased costs for closure, controls/limits on land and resource access, reclamation, and ecological restoration. Third-party NGOs, citizen activist groups and Indigenous communities can also influence environmental laws and regulations in the jurisdictions in which we conduct our operations, development or exploration, including the U.S. and Canada. We anticipate that further changes in environmental laws and regulations will occur. The complexities of changes in environmental laws and regulations make it difficult to predict the potential future impact to our business.
U.S. environmental and health and safety regulations and their aggressive enforcement from regulators present challenges and risks to our U.S. operations. These risks can arise if new emissions standards, water quality standards, occupational or process safety management requirements, or regulation of emerging contaminants are finalized or the government develops new interpretations that can increase compliance costs, require capital projects, lengthen project implementation times, and have an adverse effect on our business, financial condition, results of operations and cash flows.
| | | | | |
| Cenovus Energy Inc. – 2025 Management's Discussion and Analysis | 53 |
Canadian Species at Risk Act
The Canadian federal Species at Risk Act (“SARA”) and associated agreements, as well as provincial regulation regarding threatened or endangered species and their habitat, may limit the pace and the amount of development or activity in areas identified as critical habitat for species of concern. The extent and magnitude of any potential adverse impacts of legislation on project development and operations are difficult to predict, as uncertainty exists as to whether jurisdictional plans and actions undertaken will be sufficiently stringent to satisfy the SARA and associated provisions. Similarly, uncertainty exists with respect to the outcome of litigation that could be initiated with respect to federal duties and obligations pursuant to the SARA.
Canadian Federal Air Quality Management System
The Multi-Sector Air Pollutants Regulations (“MSAPR”), under the Canadian Environmental Protection Act, 1999, set mandatory national air pollutant emission standards to protect the environment and health of Canadians. It established nitrogen oxides emission limits for specific equipment, including stationary engines, boilers and heaters, across several industrial sectors. We anticipate that the MSAPRs will result in adverse impacts to Cenovus, including, but not limited to, capital investment required to retrofit existing equipment and increased operating costs.
Canadian Ambient Air Quality Standards (“CAAQS”) for nitrogen dioxide, sulphur dioxide, fine particulate matter and ozone were introduced as part of a national Air Quality Management System. Provinces may implement the CAAQS at the regional air zone level and air zone management actions may include more stringent emissions standards applicable to industrial sources from approval holders in regions where we operate that may result in adverse impacts including, but not limited to, capital investment to retrofit existing facilities and increased operating costs.
Review of Environmental and Regulatory Processes
Increased or evolving environmental assessment obligations imposed by various levels of governments in the jurisdictions in which we conduct operations, development or exploration may create risk of increased costs, project development delays and an increased number of conditions. The regulatory frameworks within the jurisdictions where we conduct operations, development or exploration are constantly evolving and may become more onerous or costly, which may impede our ability to economically develop our resources. The extent and magnitude of any adverse impacts of changes to such regulatory frameworks on project development and operations cannot be estimated at this time.
Water Regulation
We utilize fresh water in certain operations, which is obtained in accordance with respective jurisdictions’ regulations, including through water licences. If water fees increase, the terms of water licences change or there are restrictions in the amount of water available for our use, production could decline or operating expenses could increase, both of which may have a material adverse effect on our business and financial condition. There can be no assurance that current or future water licences will be continued or approved. This may adversely affect our business, including the ability to operate our assets and execute development plans.
Our U.S. refineries are subject to water discharge requirements that necessitate treatment of wastewater prior to discharging. Non-compliance with these requirements can lead to enforcement actions by regulators, including issuance of fines, orders to upgrade treatment plants and suspension of operations. Federal and state regulators in the U.S. are currently addressing per- and polyfluoroalkyl substances (“PFAS”) in water discharge permits by requiring installation of additional wastewater treatment units and requiring monitoring of PFAS in discharges.
Hydraulic Fracturing
Legislative and regulatory initiatives have been introduced related to stakeholder claims that hydraulic fracturing techniques are harmful to surface water and drinking water sources and are increasing the frequency of seismic activity. New laws, regulations or permitting requirements regarding hydraulic fracturing may lead to limitations or restrictions to oil and gas development activities, operational delays, increased compliance costs, restrictions to freshwater usage, additional operating requirements or increased third-party or governmental claims, resulting in increased cost of doing business, as well as impacting the amount of natural gas and oil that we are ultimately able to produce from our reserves.
Sustainability Focus Areas and Goals
We have established meaningful goals in our sustainability focus areas and continue to allocate resources and progress tangible plans to meet these ambitions. To achieve these goals and to respond to changing market demand, we may incur additional costs and invest in innovation. It is possible that the benefits of these investments may be less than we expect, which may have an adverse effect on our business, financial condition and reputation.
| | | | | |
| Cenovus Energy Inc. – 2025 Management's Discussion and Analysis | 54 |
Generally, our sustainability goals depend on our ability to execute our current business strategy, which can be impacted by the numerous risks and uncertainties associated with our business and the industry in which we operate, as outlined in the Risk Management and Risk Factors section of this MD&A. Investors and stakeholders may compare companies based on sustainability-related performance, including climate-related performance. Failure to achieve our sustainability goals, or a perception among key stakeholders that our sustainability goals are insufficient or unattainable, could adversely affect our reputation and our ability to attract capital and insurance coverage, and could result in claims that we misrepresented our goals or our ability to achieve them.
There is also a risk that some or all of the expected benefits and opportunities of achieving the various sustainability goals may fail to materialize, may cost more to achieve than we expect or may not occur within the anticipated time periods or at all. In addition, there is a risk that the actions we take in implementing ambitions relating to our sustainability focus areas may, among other things, increase our capital expenditures and thereby impair our ability to invest in other aspects of our business, which could have a negative impact on our future operating and financial results.
Climate and GHG Emissions Reduction Goals
Our ability to meet our GHG emissions reduction goals is subject to numerous risks and uncertainties and our actions taken in implementing such goals may also expose us to certain additional and/or heightened litigation, financial and operational risks. A reduction in GHG emissions relies on, among other things, our ability to develop, access and implement commercially viable and scalable emissions reduction strategies, and related technology and products. If we are unable to implement these strategies and technologies as planned without negatively impacting our expected operations or cost structure, or such strategies or technologies do not perform as expected, we may be unable to meet our GHG emissions reduction goals on the planned timeline, or at all. In those circumstances, this could result in claims that we misrepresented our goals or our ability to achieve them.
Furthermore, longer-term goals are inherently less certain due to the longer timeframe and certain factors outside of our control, including the commercial application of future technologies that may be necessary for us to achieve such goals, and the cooperation and actions of third parties, including Pathways Alliance. The Pathways Alliance’s proposed carbon capture and storage project is of particular relevance, and if this project is delayed or does not proceed, Cenovus’s ability to achieve its GHG reduction goals and ambitions will be delayed and may not be achieved.
In addition, achieving our GHG emissions reduction goals relies on the existence of a favourable and stable regulatory framework that includes, among other things, support from various levels of government, including financial support and shared capital cost commitments, which may not develop in a manner consistent with our expectations, or at all. Achieving our GHG emissions reduction goals will also require capital expenditures and Company resources, with the potential that actual costs may differ from our original estimates and the differences may be material. Furthermore, the cost of investing in emissions-reduction technologies, and the resulting change in the deployment of resources and focus, could have a negative impact on our business, financial condition, results of operations and cash flows.
Water Stewardship Goals
Our ability to meet our water stewardship goals will depend on the commercial viability and scalability of relevant water reduction strategies, and related steam and water usage technology and products. There are risks associated with relying largely or partly on new technologies, the incorporation of such technologies into new or existing operations and acceptance of new technologies in the market. In the event we are unable to effectively deploy the necessary strategies and technologies as planned, without negatively impacting our expected operations or cost structure, or such strategies or technologies do not perform as expected, progress toward our goals could be interrupted, delayed or abandoned. In those circumstances, this could result in claims that we misrepresented our goals or our ability to achieve them.
Biodiversity Goals
Our ability to meet our biodiversity ambitions is subject to various operational, environmental and regulatory risks, which could impose significant costs, restrictions, liabilities and obligations on us. See “Decommissioning” above. In addition, an increase in operating costs, changes to market conditions and access to additional capital, if needed, could result in our inability to fund, and meet, our biodiversity goals on the current timelines, or at all. In some cases, meeting our biodiversity ambitions has operational implications for reduced operational footprint and accelerated abandonment, reclamation and restoration. In the event that we do not meet our goals, this could result in claims that we misrepresented our goals or our ability to achieve them.
Indigenous Reconciliation Goals
A failure or delay in achieving our Indigenous reconciliation ambitions or continuing to advance Indigenous reconciliation initiatives may adversely affect our relationship with neighbouring Indigenous businesses and communities, and our reputation.
| | | | | |
| Cenovus Energy Inc. – 2025 Management's Discussion and Analysis | 55 |
Acceptance and Belonging Goals
The acceptance and belonging of our staff plays a critical role in strengthening our business performance and culture. A failure or delay in achieving our acceptance and belonging ambitions could have a material adverse effect on our recruitment activities, retention efforts and reputation with our stakeholders.
Reputation Risk
We rely on our reputation to build and maintain positive relationships with investors and other stakeholders, to recruit and retain staff and to be viewed as a credible, trusted company. All of our actions can influence public or key stakeholder opinions and decisions, which may adversely affect our share price, development plans or ability to continue operations.
Development of fossil fuel-based energy, and oil sands in particular, has received considerable attention on the subjects of environmental impact, climate change, GHG emissions and Indigenous reconciliation. Concerns about oil sands may, directly or indirectly, impair the profitability of our current oil sands projects and the viability of future oil sands projects by creating significant regulatory, economic and operating uncertainty, and could lead to constrained access to insurance, liquidity and capital, and affect demand for our products.
Shareholder activism has been increasing in the oil and gas industry, and investors may from time-to-time attempt to effect changes to our business, governance or reporting practices with respect to climate change or otherwise, whether by shareholder proposals, public campaigns, proxy solicitations or otherwise. Such actions, successful or not, could adversely impact our business by distracting from core business operations, incurring increased advisory fees and related costs, interfering with our ability to successfully execute on strategic transactions and plans, affecting our ability to attract and retain staff, creating significant fluctuation in our share price, and provoking perceived uncertainty about the future direction of our business.
Internet search functions are increasingly using AI to summarize search results, often sourcing information from sites containing misinformation or inaccuracies. Investors and other stakeholders seeking information about Cenovus may be directed to falsehoods or incomplete information about the company, potentially impacting perceptions and decisions about our business or operations and incurring staff time to mitigate.
Other Risks
Dilutive Effect
We are authorized to issue, among other classes of shares, an unlimited number of common shares for consideration and on terms and conditions as established by our Board, without the approval of our shareholders in certain instances. Any future issuances of Cenovus common shares or other securities exercisable or convertible into, or exchangeable for, Cenovus common shares may result in dilution to present and prospective Cenovus shareholders. The issuance of additional Cenovus common shares upon exercise, from time-to-time, of securities convertible into Cenovus common shares, including equity awards granted to our directors and officers, will have a further dilutive effect on the ownership interest of shareholders of Cenovus. Such dilutive effect on Cenovus's earnings per share could adversely affect the market price of Cenovus common shares and the value of our shareholders' investments.
Risks Relating to Acquisitions and Divestitures
We have completed, and may complete in the future, acquisitions and divestitures for various strategic reasons. We may not be able to complete such transactions on favourable terms, on a timely basis, or at all. The integration of acquired assets and operations may result in the disruption of business and may divert Management’s focus and resources from other strategic opportunities and operational matters during the process. This may result in increased costs and could adversely affect our ability to achieve the anticipated benefits of such transactions, as well as other strategic opportunities or operational matters. Acquiring assets requires assessments of their characteristics which are inexact and inherently uncertain and, as such, the acquired assets may not produce or operate as expected, may not have the anticipated benefits or synergies and may be subject to increased costs and liabilities. Further, we may not be able to obtain or realize upon contractual indemnities from a seller for liabilities created prior to an acquisition.
Various factors could materially affect our ability to dispose of assets in the future and may also reduce the proceeds or value realized from such divestitures. We may also retain certain liabilities or agree to indemnification obligations in a sale transaction, which may be difficult to quantify at the time of the transaction and could be material.
Should any of the risks associated with acquisitions or divestitures materialize, they could have an adverse effect on our business, financial condition or reputation.
| | | | | |
| Cenovus Energy Inc. – 2025 Management's Discussion and Analysis | 56 |
Risks Related to Significant Shareholders of Cenovus
The sale into the market of Cenovus common shares held by significant shareholders of Cenovus, Hutchison Whampoa Europe Investments S.à r.l. (“Hutchison”) and L.F. Investments S.à r.l. (“L.F. Investments”, together with Hutchison, the “Significant Shareholders”) or market perception regarding any intention of the Significant Shareholders to sell Cenovus common shares, could adversely affect market prices for our common shares. In addition, the Significant Shareholders may be able to impact certain matters requiring Cenovus shareholder approval. While the Significant Shareholders were subject to certain voting and selling restrictions pursuant to standstill agreements each shareholder entered into with Cenovus, such agreements expired on January 1, 2026.
Income and Property Tax Laws
Our operations are subject to complex and continually evolving tax laws and regulations in multiple jurisdictions. Evolving jurisprudence and changes in legislation, regulations or governmental policy could adversely affect our financial results and ability to achieve strategic objectives. Tax authorities may challenge our filings, and audits or disputes could result in additional liabilities.
Pandemic Risk
Pandemics, epidemics or outbreaks constitute ongoing risks to the Company, with their ultimate impacts remaining uncertain and subject to change. Such events, along with any measures implemented by Cenovus or governmental authorities to protect the health and safety of personnel and ensure business continuity, may give rise to legal disputes, diminished demand and pricing for key commodities, and could adversely affect the Company’s business performance, financial condition and reputation.
Fighting Against Forced Labour and Child Labour in Supply Chains Act
The Fighting Against Forced Labour and Child Labour in Supply Chains Act requires Cenovus to publish an annual report on steps taken to assess and mitigate the risk of forced or child labour in its business and supply chains. Canadian customs regulations also prohibit importing goods produced with forced, child and prison labour, as well as the possession, purchase, sale, exchange, acquisition or disposition of these goods after they have been imported. Heightened regulatory scrutiny and evolving legislation, and our response to these changes, may disrupt our supply chains, affecting availability or cost of goods and materials, procurement processes, productivity, operating costs and financial condition. There is a risk that our supply chain may use or be alleged to use forced or child labour and gathering sufficient information from suppliers to assess and mitigate such risks may be challenging. Our due diligence and mitigation activities might not identify or mitigate all risks, exposing Cenovus to reputational harm. The Government of Canada may expand these requirements, but the timing and impact of any such expansion remains uncertain.
A discussion of additional risks, should they arise after the date of this MD&A, which may impact our business, prospects, financial condition, results of operations and cash flows, and in some cases our reputation, can be found in our subsequently filed MD&A, available on SEDAR+ at sedarplus.ca, on EDGAR at sec.gov and at cenovus.com.
| | | | | |
| Cenovus Energy Inc. – 2025 Management's Discussion and Analysis | 57 |
| | |
|
CRITICAL ACCOUNTING JUDGMENTS, ESTIMATION UNCERTAINTIES AND ACCOUNTING POLICIES |
Management is required to make estimates and assumptions, as well as use judgment, in the application of accounting policies that could have a significant impact on our financial results. Actual results may differ from estimates and those differences may be material. The estimates and assumptions used are subject to updates based on experience and the application of new information. Our material accounting policies are reviewed annually by the Audit Committee of the Board. Further details on the basis of preparation and our material accounting policies can be found in the notes to the Consolidated Financial Statements.
Critical Judgments in Applying Accounting Policies
Critical judgments are those judgments made by Management in the process of applying accounting policies that have the most significant effect on the amounts recorded in the Company’s Consolidated Financial Statements.
Identification of Cash-Generating Units
Cash-generating units (“CGUs”) are defined as the lowest level of integrated assets for which there are separately identifiable cash flows that are largely independent of cash flows from other assets or groups of assets. The classification of assets and allocation of corporate assets into CGUs requires significant judgment and interpretation. Factors considered in the classification include the integration between assets, shared infrastructures, the existence of common sales points, geography, geologic structure, and the manner in which Management monitors and makes decisions about its operations. The recoverability of the Company’s upstream, refining, crude-by-rail, railcars, storage tanks and corporate assets are assessed at the CGU level. As such, the determination of a CGU could have a significant impact on impairment losses and impairment reversals.
Assessment of Impairment Indicators or Impairment Reversals
PP&E, E&E assets and right-of-use assets are reviewed separately for indicators of impairment on a quarterly basis or when facts and circumstances suggest that the carrying amount may exceed its recoverable amount. Impairment losses recognized in prior periods, other than goodwill impairments, are assessed at each reporting date for any indicators that the impairment losses may no longer exist or may have decreased. The identification of indicators of impairment or reversal of impairment requires significant judgment.
Exploration and Evaluation Assets
The application of the Company’s accounting policy for E&E expenditures requires judgment in determining whether it is likely that future economic benefit exists when activities have not reached a stage where technical feasibility and commercial viability can be reasonably determined. Factors such as drilling results, future capital programs, future operating expenses, as well as estimated reserves and resources are considered. In addition, Management uses judgment to determine when E&E assets are reclassified to PP&E. In making this determination, various factors are considered, including the existence of reserves, and whether the appropriate approvals have been received from regulatory bodies and the Company’s internal approval process.
Joint Arrangements
The classification of a joint arrangement that is held in a separate vehicle as either a joint operation or a joint venture requires judgment.
On September 30, 2025, Cenovus divested its entire 50 percent interest in WRB, which was a jointly-controlled entity. The joint arrangement met the definition of a joint operation under IFRS 11, “Joint Arrangements” (“IFRS 11”); therefore, the Company recognized its share of the assets, liabilities, revenues and expenses in its consolidated results up to the date of divestiture.
In determining the classification of its joint arrangement under IFRS 11, the Company considered the following:
•The original intention of the joint arrangement was to form an integrated North American heavy oil business. Partnerships are “flow-through” entities.
•The agreements required the partners to make contributions if funds were insufficient to meet the obligations or liabilities of the corporation and partnership. The past and future development of WRB was dependent on funding from the partners by way of capital contribution commitments, notes payable and loans.
•WRB had third-party debt facilities to cover short-term working capital requirements.
•Phillips 66, as operator of WRB, either directly or through wholly-owned subsidiaries, provided marketing services, purchased necessary feedstock, and arranged for transportation and storage, on the partners' behalf as the agreements prohibited the partners from undertaking these roles themselves. In addition, the joint arrangement did not have employees and, as such, was not capable of performing these roles.
•In the arrangement, output was taken by the partners, indicating that the partners had the rights to the economic benefits of the assets and the obligation for funding the liabilities of the arrangement.
| | | | | |
| Cenovus Energy Inc. – 2025 Management's Discussion and Analysis | 58 |
Key Sources of Estimation Uncertainty
Critical accounting estimates are those estimates that require Management to make particularly subjective or complex judgments about matters that are inherently uncertain. Estimates and underlying assumptions are reviewed on an ongoing basis, and any revisions to accounting estimates are recorded in the period in which the estimates are revised.
The evolving worldwide demand for energy and global advancement of alternative sources of energy that are not sourced from fossil fuels could change assumptions used to determine the recoverable amount of the Company’s PP&E and E&E assets and could affect the carrying value of those assets, may affect future development or viability of exploration prospects, may curtail the expected useful lives of oil and gas assets thereby accelerating depreciation charges and may accelerate decommissioning obligations increasing the present value of the associated provisions. The timing in which global energy markets transition from carbon-based sources to alternative energy is highly uncertain. Environmental considerations are built into estimates through the use of key assumptions used to estimate fair value including forward commodity prices, forward crack spreads, net of renewable identification numbers. and discount rates. The energy transition could impact the future prices of commodities. Pricing assumptions used in the determination of recoverable amounts incorporate market expectations and the evolving worldwide demand for energy.
The following are the key estimates, assumptions and judgments at the end of the reporting period that, if changed, could result in a material adjustment to the carrying amount of assets and liabilities within the next financial year.
Crude Oil and Natural Gas Reserves
There are a number of inherent uncertainties associated with estimating crude oil and natural gas reserves. Reserves estimates are dependent upon variables including the expected future production volumes, future development and operating expenses, forward commodity prices, estimated royalty payments and taxes. Changes in these variables could significantly impact the reserves estimates which would affect the impairment test recoverable amount and DD&A expense of the Company’s crude oil and natural gas assets in the Oil Sands, Conventional and Offshore segments. The Company’s reserves are evaluated annually and reported to the Company by its independent qualified reserves evaluators (“IQREs”).
Recoverable Amounts
Determining the recoverable amount of a CGU or an individual asset requires the use of estimates and assumptions, which are subject to change as new information becomes available. For the Company’s upstream assets, these estimates include quantity of reserves, expected future production volumes, future development and operating expenses, forward commodity prices and discount rates. Recoverable amounts for the Company’s downstream assets use assumptions such as refined product production, forward crude oil prices, forward crack spreads, net of RINs, future operating expenses, future capital expenditures and discount rates. Changes in assumptions used in determining the recoverable amount could affect the carrying value of the related assets.
Decommissioning Costs
Provisions are recorded for the future decommissioning and restoration of the Company’s upstream assets, refining assets and crude-by-rail terminal at the end of their economic lives. Management uses judgment to assess the existence of liabilities and estimate the future value. The actual cost of decommissioning and restoration is uncertain and cost estimates may change in response to numerous factors including changes in legal requirements, technological advances, inflation and the timing of expected decommissioning and restoration. In addition, Management determines the appropriate discount rate at the end of each reporting period. This discount rate, which is credit-adjusted, is used to determine the present value of the estimated future cash outflows required to settle the obligation and may change in response to numerous market factors.
Fair Value of Assets Acquired and Liabilities Assumed in a Business Combination
The fair value of assets acquired, liabilities assumed and assets given up in a business combination, including contingent consideration and goodwill, if any, is estimated based on information available at the date of acquisition. Various valuation techniques are applied for measuring fair value including market comparable transactions and discounted cash flows. For the Company’s upstream assets, key assumptions in the discounted cash flow models used to estimate fair value include forward commodity prices, expected future production volumes, quantity of reserves, discount rates, and future development and operating expenses. Estimated production volumes and quantity of reserves for acquired oil and gas properties were developed by internal geology and engineering professionals, and IQREs. Changes in these variables could significantly impact the carrying value of the net assets acquired.
Income Tax Provisions
The determination of the Company’s income and other tax liabilities requires interpretation of complex laws and regulations often involving multiple jurisdictions. There are usually a number of tax matters under review; therefore, income taxes are subject to measurement uncertainty.
| | | | | |
| Cenovus Energy Inc. – 2025 Management's Discussion and Analysis | 59 |
Deferred income tax assets are recorded to the extent that it is probable that the deductible temporary differences will be recoverable in future periods. The recoverability assessment involves a significant amount of estimation including an evaluation of when the temporary differences will reverse, an analysis of the amount of future taxable earnings, the availability of cash flow to offset the tax assets when the reversal occurs and the application of tax laws. There are some transactions for which the ultimate tax determination is uncertain. To the extent that assumptions used in the recoverability assessment change, there may be a significant impact on the Consolidated Financial Statements of future periods.
New Accounting Standards and Interpretations not yet Adopted
Financial Instruments
On May 30, 2024, the IASB issued amendments to IFRS 9, “Financial Instruments”, and IFRS 7, “Financial Instruments: Disclosures”. The amendments include clarifications on the derecognition of financial liabilities and the classification of certain financial assets. In addition, new disclosure requirements for equity instruments designated as fair value through other comprehensive income (loss) were added. The amendments are effective for annual periods beginning on or after January 1, 2026, and will be applied retrospectively. The amendments to IFRS 9 and IFRS 7 will not have a material impact on the Consolidated Financial Statements.
Presentation and Disclosure in Financial Statements
On April 9, 2024, the IASB issued IFRS 18, “Presentation and Disclosure in Financial Statements” (“IFRS 18”), which will replace International Accounting Standard 1, “Presentation of Financial Statements”. IFRS 18 will establish a revised structure for the Consolidated Statements of Comprehensive Income (Loss) and improve comparability across entities and reporting periods.
IFRS 18 is effective for annual periods beginning on or after January 1, 2027. The standard is to be applied retrospectively, with certain transition provisions. The Company is continuing to evaluate the impacts of adopting IFRS 18 on the Consolidated Financial Statements. Cenovus will adopt IFRS 18 effective January 1, 2027, using the retrospective approach.
Management, including our President & Chief Executive Officer and Executive Vice-President & Chief Financial Officer, assessed the design and effectiveness of ICFR and DC&P as at December 31, 2025. In making its assessment, Management used the Committee of Sponsoring Organizations of the Treadway Commission Framework in Internal Control – Integrated Framework (2013) to evaluate the design and effectiveness of ICFR. Based on our evaluation, Management has concluded that both ICFR and DC&P were effective as at December 31, 2025.
On November 13, 2025, Cenovus completed the MEG Acquisition. As permitted by and in accordance with, NI 52-109, and guidance issued by the U.S. Securities and Exchange Commission, Management has limited the scope and design of ICFR and DC&P to exclude the controls, policies and procedures in respect of the business acquired from MEG. Such scope limitation is primarily due to the time required for Management to assess the ICFR and DC&P relating to the business acquired from MEG in a manner consistent with our other operations. Further integration will take place throughout the remainder of 2026 as processes and systems align.
Assets attributable to MEG as at December 31, 2025, represented approximately 18 percent of Cenovus’s total assets, and revenues attributable to MEG for the period of November 13, 2025, to December 31, 2025, represented approximately one percent of Cenovus’s total revenues for the three months ended December 31, 2025.
Internal control systems, no matter how well designed, have inherent limitations. Therefore, even those systems determined to be effective can provide only reasonable assurance with respect to financial statement preparation and presentation. Also, projections of any evaluation of effectiveness to future periods are subject to the risk that controls may become inadequate because of changes in conditions, or that the degree of compliance with the policies or procedures may deteriorate.
| | | | | |
| Cenovus Energy Inc. – 2025 Management's Discussion and Analysis | 60 |
Oil and Gas Information
Barrels of Oil Equivalent – natural gas volumes are converted to BOE on the basis of six Mcf to one bbl. BOE may be misleading, particularly if used in isolation. A conversion ratio of one bbl to six Mcf is based on an energy equivalency conversion method primarily applicable at the burner tip and does not represent value equivalency at the wellhead. Given that the value ratio based on the current price of crude oil compared with natural gas is significantly different from the energy equivalency conversion ratio of 6:1, utilizing a conversion on a 6:1 basis is not an accurate reflection of value.
Interests in Joint Ventures
Cenovus holds interests in a number of joint ventures, as classified under IFRS Accounting Standards, that are accounted for using the equity method of accounting in our Consolidated Financial Statements, including a 30 percent equity ownership interest in Duvernay and a 40 percent equity ownership interest in HCML. Unless otherwise indicated, the operational events and results from these equity interests including, without limitation, production, reserves, revenues, costs and expenses may not be reflected in the Consolidated Financial Statements or this MD&A. As a result, the disclosure in the AIF in respect to certain equity method investees may differ from corresponding information in this MD&A. Readers are directed to the information contained under the heading “Reserves Data and Other Oil and Gas Information” in the AIF for further information regarding Cenovus’s interests in Duvernay and HCML.
Forward-looking Information
This document contains forward-looking statements and other information (collectively “forward-looking information”) about the Company’s current expectations, estimates and projections, made in light of the Company’s experience and perception of historical trends. Although the Company believes that the expectations represented by such forward-looking information are reasonable, there can be no assurance that such expectations will prove to be correct.
This forward-looking information is identified by words such as “advance”, “aim”, “allocate”, “anticipate”, “believe”, “commit”, “continue”, “could”, “deliver”, “expect”, “F”, “focus”, “grow”, “maintain”, “may”, “maximize”, “mitigate”, “on track”, “objective”, “ongoing”, “opportunities”, “optimize”, “plan”, “position”, “potential”, “priority”, “progress”, “strategy”, “steward”, “strive”, “target”, and “will”, or similar expressions and includes suggestions of future outcomes, including, but not limited to, statements about: our five strategic objectives; shareholder value and returns; top-tier safety performance; safety priorities; sustainability leadership and progressing sustainability initiatives; focus on cost leadership and balancing shareholder returns with deleveraging; our commitment to the Pathways Alliance foundational project, including efforts to reach agreements with governments; maximizing value and profitability; disciplined capital allocation; cash flow and commodity price volatility and stability; price alignment and volatility management strategies; dividends; focus on cost and sustainability improvements; liquidity; our 2026 corporate guidance; factors influencing commodity outlook; the Company’s key priorities for 2026; the impact of the global trade war; realizing the full value of our integrated strategy; capitalizing on opportunities; Net Debt targets pursuant to the shareholder returns framework; allocating Excess Free Funds Flow to shareholder returns; absolute and per share Free Funds Flow growth; project execution; growing our competitive advantages in our heavy oil value chain and reliable operations; monitoring market fundamentals and optimizing run rates at our refineries; safe and reliable operations; being best-in-class operators; maintaining a strong balance sheet; costs; margins; long-term value for Cenovus; progressing hookup and commissioning of the platform at the West White Rose project; progressing growth projects, including the Amine Claus project at Foster Creek, the Christina Lake North expansion project, the Sunrise growth program and the development of our Lloydminster assets; our sustainability focus areas, goals, plans and commitments; provision for income taxes; funding near-term cash requirements; credit ratings; meeting payment obligations; general outlook for crude oil and refined product prices; price volatility and geopolitical risks; impact of current and future economic arrangements between Canada and the U.S. including tariffs and other measures and countermeasures and responses thereto on market access and transportation; the use of derivatives, financial instruments and physical positions as financial risk management activities; trading activities, including trading of energy products, for purposes other than hedging Net Debt to Adjusted Funds Flow ratio; the Company’s capital allocation framework; Net Debt to Adjusted EBITDA ratio; Net Debt to Capitalization ratio; introduction of artificial intelligence pilot-phase; maintaining sufficient liquidity; financial resilience; liabilities from legal proceedings; transportation and storage commitments; and the Company’s outlook for commodities and the Canadian dollar, the factors that affect such outlook, and the influences and effects on Cenovus.
Readers are cautioned not to place undue reliance on forward-looking information as the Company’s actual results may differ materially from those expressed or implied. Developing forward-looking information involves reliance on a number of assumptions and consideration of certain risks and uncertainties, some of which are specific to the Company and others that apply to the industry generally. The factors or assumptions on which the forward-looking information is based include, but are not limited to: forecast bitumen, crude oil and natural gas, NGLs, condensate and refined products prices, and light-heavy and light-medium crude oil price differentials; the Company’s ability to realize the anticipated benefits of acquisitions; the accuracy of any assessments undertaken in connection with acquisitions; forecast production and crude throughput volumes and timing
| | | | | |
| Cenovus Energy Inc. – 2025 Management's Discussion and Analysis | 61 |
thereof; forecast prices and costs, projected capital investment levels, the flexibility of capital spending plans and associated sources of funding; the absence of significant adverse changes to government policies, legislation and regulations (including related to climate change Indigenous relations, title or rights claims, royalty regimes, interest rates, inflation, foreign exchange rates, global economic activity, competitive conditions, trade sanctions, restrictive trade measures or countermeasures, and the supply and demand for bitumen, crude oil and natural gas, NGLs, condensate and refined products and the political, economic and social stability of jurisdictions in which the Company operates; the absence of significant disruption of operations, including as a result of harsh weather, natural disaster, accident, third-party actions, civil unrest or other similar events; the prevailing climatic conditions in the Company’s operating locations; achievement of further cost reductions and sustainability thereof; applicable royalty regimes, including expected royalty rates; future improvements in availability of product transportation capacity; increase to the Company’s share price and market capitalization over the long-term; opportunities to purchase shares for cancellation at prices acceptable to the Company; the Company’s ability to use financial risk management activities and physical positions to manage its exposure to fluctuations in commodity prices and, foreign exchange and interest rates, optimize supply costs or sales of production; the Company’s ability to use fixed-price commitments for the purchase or sale of commodities; the sufficiency of cash balances, internally generated cash flows, existing credit facilities, management of the Company’s asset portfolio and access to capital and insurance coverage to pursue and fund future investments and development plans and dividends, including any increase thereto; realization of expected capacity to store within the Company’s oil sands reservoirs barrels not yet produced, including that the Company will be able to time production and sales of its inventory at later dates when demand has increased, pipeline and/or storage capacity has improved and future crude oil differentials have narrowed; the WTI-WCS differential in Alberta remains largely tied to global supply factors and heavy crude oil processing capacity, as long as supply does not exceed Canadian crude oil export capacity; the Company’s ability to produce from oil sands facilities on an unconstrained basis; estimates of quantities of oil, bitumen, NGLs from properties and other sources not currently classified as proved; the accuracy of accounting estimates and judgments; the Company’s ability to obtain necessary regulatory and partner approvals; the successful, timely and cost effective implementation of capital projects, development projects or stages thereof; the Company’s ability to meet current and future obligations; estimated abandonment and reclamation costs, including associated levies and regulations applicable thereto; the Company’s ability to obtain and retain qualified staff and equipment in a timely and cost-efficient manner; the Company’s ability to complete acquisitions and divestitures, including with desired transaction metrics and within expected timelines; the accuracy of climate scenarios and assumptions, including third-party data on which the Company relies; ability to access and implement all technology and equipment necessary to achieve expected future results, including in respect of sustainability targets and the Pathways Alliance project, and the commercial viability and scalability of related technology and products; expected benefits of investments in sustainability focus areas; collaboration with the government, Pathways Alliance and other industry organizations; market and business conditions; forecast inflation and other assumptions inherent in the Company’s 2026 guidance available on cenovus.com and as set out below; and other risks and uncertainties described from time to time in the filings the Company makes with securities regulatory authorities.
2026 guidance dated December 10, 2025, and available on cenovus.com, assumes: Brent prices of US$64.00 per barrel, WTI prices of US$60.00 per barrel; WCS of US$47.50 per barrel; Differential WTI-WCS of US$12.50 per barrel; AECO natural gas prices of $2.50 per Mcf; Chicago 3-2-1 crack spread of US$20.00 per barrel; RINs of US$6.00 per barrel; and an exchange rate of $0.72 US$/C$.
The risk factors and uncertainties that could cause the Company’s actual results to differ materially from the forward-looking information, include, but are not limited to: the Company’s ability to realize the anticipated benefits of acquisitions in a timely manner or at all; the Company’s ability to successfully integrate acquired business with its own in a timely and cost effective manner or at all; unforeseen or underestimated liabilities associated with acquisitions; risks associated with acquisitions and divestitures; the Company’s ability to access or implement some or all of the technology necessary to efficiently and effectively operate its assets and achieve expected future results including in respect of sustainability targets and the Pathways Alliance project and the commercial viability and scalability of related technology and products; the effect of new significant shareholders; volatility of and other assumptions regarding commodity prices; the duration and impact of any market downturn; the Company’s ability to integrate upstream and downstream operations to help mitigate the impact of volatility in light-heavy crude oil differentials and contribute to its net earnings; foreign exchange risk, including related to agreements denominated in foreign currencies; the Company’s continued liquidity being sufficient to sustain operations through a prolonged market downturn; WTI-WCS differential at Hardisty does not remain largely tied to global supply factors and heavy crude processing capacity; the Company’s ability to realize the expected impacts of its capacity to store within its oil sands reservoirs barrels not yet produced, including possible inability to time production and sales at later dates when pipeline and/or storage capacity and crude oil differentials have improved; the effectiveness of the Company’s risk management program; the accuracy of the Company’s outlook for commodity prices and currency and interest rates; changes in laws or enforcement of existing laws, exchange rate fluctuations, trade disputes, trade agreements or treaties, new or increased tariffs, economic sanctions and other restrictive trade measures or countermeasures, and responses thereto; product supply and demand; the accuracy of the Company’s share price and market capitalization assumptions; market competition, including from alternative energy sources; risks inherent in the Company’s marketing operations, including credit risks, exposure to counterparties and partners, including the ability and willingness of such parties to satisfy contractual obligations in a timely manner; risks inherent
| | | | | |
| Cenovus Energy Inc. – 2025 Management's Discussion and Analysis | 62 |
in the operation of the Company’s crude-by-rail terminal, including health, safety and environmental risks; the Company’s ability to maintain desirable ratios of Net Debt to Adjusted EBITDA and Net Debt to Adjusted Funds Flow; the Company’s ability to access various sources of debt and equity capital, generally, and on acceptable terms; the Company’s ability to finance growth and sustaining capital expenditures; the ability to complete and optimize drilling, completion, tie in and infrastructure projects; the ability of the Company to ramp-up activities at its refineries on its anticipated timelines; changes in credit ratings applicable to the Company or any of its securities; changes to the Company’s dividend plans; the Company’s ability to utilize tax losses in the future; tax audits and reassessments; the accuracy of the Company’s reserves, future production and future net revenue estimates; the accuracy of factors influencing decisions on the priority and timing of development of undeveloped reserves; potential disruptions and risks associated with the adoption, development and integration of AI; the accuracy of the Company’s accounting estimates and judgements; the Company’s ability to replace and expand crude oil and natural gas reserves; the costs to acquire exploration rights, undertake geological studies, appraisal drilling and project developments; potential requirements under applicable accounting standards for impairment or reversal of estimated recoverable amounts of some or all of the Company’s assets or goodwill from time to time; the Company’s ability to maintain its relationships with its partners and to successfully manage and operate its integrated operations and business; reliability of the Company’s assets including in order to meet production targets; potential disruption or unexpected technical difficulties in developing new products and refining processes; the occurrence of unexpected events resulting in operational interruptions, including at facilities operated by our partners or third parties, such as blowouts, fires, explosions, railcar incidents or derailments, aviation incidents, iceberg collisions, gaseous leaks, migration of harmful substances, loss of containment, releases or spills, including releases or spills from offshore facilities and shipping vessels at terminals or hubs and as a result of pipeline or other leaks, corrosion, epidemics and pandemics; and catastrophic events, including, but not limited to, war, adverse sea conditions, extreme weather events, natural disasters, acts of activism, vandalism and terrorism, and other accidents or hazards that may occur at or during transport to or from commercial or industrial sites and other accidents or similar events; refining and marketing margins; cost escalations, including inflationary pressures on operating costs, such as labour, materials, natural gas and other energy sources used in oil sands processes and downstream operations and increased insurance deductibles or premiums; the cost and availability of equipment necessary to the Company’s operations; potential failure of products to achieve or maintain acceptance in the market; risks associated with the energy industry’s and the Company’s reputation, social licence to operate and litigation related thereto; legal challenges or opposition to infrastructure projects associated with Indigenous title or other rights claims; unexpected cost increases or technical difficulties in operating, constructing or modifying refining or refining facilities; unexpected difficulties in producing, transporting or refining bitumen and/or crude oil into petroleum and chemical products; risks associated with technology and equipment and its application to the Company’s business, including potential cyberattacks; geo-political and other risks associated with the Company’s international operations; risks associated with climate change and the Company’s assumptions relating thereto; the timing and the costs of well and pipeline construction; the Company’s ability to access markets and to secure adequate and cost effective product transportation including sufficient pipeline, crude-by-rail, marine or alternate transportation, including to address any gaps caused by constraints in the pipeline system or storage capacity; availability of, and the Company’s ability to attract and retain, critical talent and integrate new personnel acquired in transactions; possible failure to obtain and retain qualified leadership and personnel, and equipment in a timely and cost efficient manner; changes in labour demographics and relationships, including with any unionized workforces; unexpected abandonment and reclamation costs; changes in the regulatory frameworks, permits and approvals in any of the locations in which the Company operates or to any of the infrastructure upon which it relies; climate change-related regulatory, climactic transition risks; failure to achieve our sustainability goals, or a perception among key stakeholders that our actions or goals are insufficient or unattainable; government actions or regulatory initiatives to curtail energy operations or pursue broader climate change agendas; changes to regulatory approval processes and land use designations, royalty, tax, environmental, GHG, carbon, climate change and other laws or regulations, or changes to the interpretation of such laws and regulations, as adopted or proposed, the impact thereof and the costs associated with compliance; the expected impact and timing of various accounting pronouncements, rule changes and standards on the Company’s business, its financial results and Consolidated Financial Statements; changes in general economic, market and business conditions; OPEC+ policy; actions of OPEC and non-OPEC members, including compliance or non-compliance with agreed upon quotas and decisions to impose production quotas; the political, social and economic conditions in the jurisdictions in which the Company operates or supplies; the status of the Company’s relationships with the communities in which it operates, including with Indigenous communities; the occurrence of unexpected events such as protests, pandemics, war, terrorist threats and the instability resulting therefrom; and risks associated with existing and potential future lawsuits, shareholder proposals and regulatory actions against the Company. In addition, there are risks that the effect of actions taken by us in attempting to achieve goals for sustainability focus areas may have a negative impact on our existing business, growth plans and future results from operations, or that the benefits may be less than expected.
| | | | | |
| Cenovus Energy Inc. – 2025 Management's Discussion and Analysis | 63 |
Except as required by applicable securities laws, Cenovus disclaims any intention or obligation to publicly update or revise any forward‐looking statements, whether as a result of new information, future events or otherwise. Readers are cautioned that the foregoing lists are not exhaustive and are made as at the date hereof. Events or circumstances could cause our actual results to differ materially from those estimated or projected and expressed in, or implied by, the forward-looking information. For a full discussion of the Company’s material risk factors, see Risk Management and Risk Factors in the Company’s most recently filed Annual MD&A, and the risk factors described in other documents the Company files from time to time with securities regulatory authorities in Canada, available on SEDAR+ at sedarplus.ca, and with the U.S. Securities and Exchange Commission on EDGAR at sec.gov, and on the Company’s website at cenovus.com.
Information on or connected to the Company’s website at cenovus.com does not form part of this MD&A unless expressly incorporated by reference herein.
ABBREVIATIONS AND DEFINITIONS
Abbreviations
The following abbreviations and definitions are used in this document:
| | | | | | | | | | | | | | | | | |
| Crude Oil and NGLs | Natural Gas | Other |
| | | | | |
| bbl | barrel | Mcf | thousand cubic feet | BOE | barrel of oil equivalent |
| Mbbls/d | thousand barrels per day | MMcf | million cubic feet | MBOE/d | thousand barrels of oil
equivalent per day |
| MMbbls | million barrels | MMcf/d | million cubic feet per day | MMBOE | million barrels of oil equivalent |
| WCS | Western Canadian Select | Bcf | billion cubic feet | DD&A | depreciation, depletion and
amortization |
| WTI | West Texas Intermediate | | | GHG | greenhouse gas |
| | | | FPSO | floating production, storage and
offloading unit |
| | | | NCIB | normal course issuer bid |
| | | | AECO | Alberta Energy Company |
| | | | NYMEX | New York Mercantile Exchange |
| | | | OPEC | Organization of Petroleum
Exporting Countries |
| | | | OPEC+ | OPEC and a group of 11
non-OPEC members |
| | | | USGC | U.S. Gulf Coast |
| | | | | |
| Cenovus Energy Inc. – 2025 Management's Discussion and Analysis | 64 |
SPECIFIED FINANCIAL MEASURES
Certain financial measures in this document do not have a standardized meaning as prescribed by IFRS Accounting Standards including Operating Margin, Operating Margin by asset, Adjusted Funds Flow, Adjusted Funds Flow Per Share – Basic, Adjusted Funds Flow Per Share – Diluted, Free Funds Flow, Excess Free Funds Flow, Total Long-Term Liabilities, Realized Sales Price, Conventional, Offshore and Asia Pacific Per-Unit Operating Expenses, Netbacks (including the total Netback per BOE), Gross Margin, Adjusted Gross Margin, Adjusted Refining Margin and Adjusted Market Capture.
These measures may not be comparable to similar measures presented by other issuers. These measures are described and presented in order to provide shareholders and potential investors with additional measures for analyzing our ability to generate funds to finance our operations and information regarding our liquidity. This additional information should not be considered in isolation, or as a substitute for, measures prepared in accordance with IFRS Accounting Standards. The definition and reconciliation, if applicable, of each specified financial measure is presented in this Advisory and may also be presented in the Operating and Financial Results section of this MD&A. Refer to the Specified Financial Measures Advisory of the relevant period’s MD&A for reconciliations of Operating Margin, Adjusted Funds Flow, Free Funds Flow and Excess Free Funds Flow for prior period information from 2025, 2024 and 2023 that is not found below.
Non-GAAP Financial Measures and Non-GAAP Ratios
Operating Margin
Operating Margin and Operating Margin by asset are non-GAAP financial measures, and Operating Margin for upstream or downstream operations are specified financial measures. These are used to provide a consistent measure of the cash-generating performance of our operations and assets for comparability of our underlying financial performance between periods. Operating Margin is defined as revenues less purchased product, transportation and blending expenses, operating expenses, plus realized gains less realized losses on risk management activities. Items within the Corporate and Eliminations segment are excluded from the calculation of Operating Margin. The following tables provide a reconciliation to our Consolidated Financial Statements.
Operating Margin
| | | | | | | | | | | | | | | | | | | | | | | | | | | | | | | | | | | |
| Three Months Ended December 31, |
| 2025 | | 2024 | | 2025 | | 2024 | | 2025 | | 2024 |
| ($ millions) | Upstream (1) | | Downstream (1) | | Total |
| Gross Sales | | | | | | | | | | | |
| External Sales | 6,373 | | 6,050 | | 5,180 | | 7,677 | | 11,553 | | 13,727 |
Intersegment Sales | 1,914 | | 2,190 | | 134 | | 160 | | 2,048 | | 2,350 |
| 8,287 | | 8,240 | | 5,314 | | 7,837 | | 13,601 | | 16,077 |
Royalties | (670) | | (914) | | — | | — | | (670) | | (914) |
| Revenues | 7,617 | | 7,326 | | 5,314 | | 7,837 | | 12,931 | | 15,163 |
| Expenses | | | | | | | | | | | |
Purchased Product | 1,271 | | 1,000 | | 4,574 | | 7,364 | | 5,845 | | 8,364 |
Transportation and Blending | 2,832 | | 2,816 | | — | | — | | 2,832 | | 2,816 |
Operating | 893 | | 842 | | 591 | | 866 | | 1,484 | | 1,708 |
| Realized (Gain) Loss on Risk Management | (7) | | (2) | | — | | 3 | | (7) | | 1 |
| Operating Margin | 2,628 | | 2,670 | | 149 | | (396) | | 2,777 | | 2,274 |
(1)Found in Note 1 of the interim Consolidated Financial Statements.
| | | | | |
| Cenovus Energy Inc. – 2025 Management's Discussion and Analysis | 65 |
| | | | | | | | | | | | | | | | | | | | | | | | | | | | | | | | | | | | | | | | | |
| Year Ended December 31, | | |
| 2025 | | 2024 | | | | 2025 | | 2024 | | | | 2025 | | 2024 | | |
| ($ millions) | Upstream (1) | | Downstream (1) | | Total |
| Gross Sales | | | | | | | | | | | | | | | | | |
| External Sales | 24,354 | | 24,640 | | | | 28,397 | | 33,086 | | | | 52,751 | | 57,726 | | |
Intersegment Sales | 8,141 | | 8,438 | | | | 800 | | 532 | | | | 8,941 | | 8,970 | | |
| 32,495 | | 33,078 | | | | 29,197 | | 33,618 | | | | 61,692 | | 66,696 | | |
Royalties | (3,055) | | (3,449) | | | | — | | — | | | | (3,055) | | (3,449) | | |
| Revenues | 29,440 | | 29,629 | | | | 29,197 | | 33,618 | | | | 58,637 | | 63,247 | | |
| Expenses | | | | | | | | | | | | | | | | | |
Purchased Product | 4,223 | | 3,674 | | | | 25,855 | | 30,252 | | | | 30,078 | | 33,926 | | |
Transportation and Blending | 11,243 | | 11,331 | | | | — | | — | | | | 11,243 | | 11,331 | | |
Operating | 3,567 | | 3,489 | | | | 3,143 | | 3,670 | | | | 6,710 | | 7,159 | | |
| Realized (Gain) Loss on Risk Management | 4 | | 14 | | | | (6) | | 8 | | | | (2) | | 22 | | |
| Operating Margin | 10,403 | | 11,121 | | | | 205 | | (312) | | | | 10,608 | | 10,809 | | |
(1)Found in Note 1 of the Consolidated Financial Statements.
Operating Margin by Asset
| | | | | | | | | | | | | | | | | | | | | | | | | |
| | | Year Ended December 31, 2025 |
| ($ millions) | | | | | | | Atlantic | | Asia Pacific | | Offshore (1) |
| Gross Sales | | | | | | | 420 | | 1,088 | | 1,508 |
Royalties | | | | | | | (4) | | (76) | | (80) |
| Revenues | | | | | | | 416 | | 1,012 | | 1,428 |
| Expenses | | | | | | | | | | | |
| Purchased Product | | | | | | | — | | — | | — |
Transportation and Blending | | | | | | | 17 | | — | | 17 |
Operating | | | | | | | 226 | | 123 | | 349 |
| Operating Margin | | | | | | | 173 | | 889 | | 1,062 |
| | | | | | | | | | | | | | | | | | | | | | | | | |
| | | Year Ended December 31, 2024 |
| ($ millions) | | | | | | | Atlantic | | Asia Pacific | | Offshore (1) |
| Gross Sales | | | | | | | 322 | | 1,250 | | 1,572 |
Royalties | | | | | | | (2) | | (97) | | (99) |
| Revenues | | | | | | | 320 | | 1,153 | | 1,473 |
| Expenses | | | | | | | | | | | |
| Purchased Product | | | | | | | — | | — | | — |
Transportation and Blending | | | | | | | 11 | | — | | 11 |
Operating | | | | | | | 290 | | 133 | | 423 |
| Operating Margin | | | | | | | 19 | | 1,020 | | 1,039 |
(1)Found in Note 1 of the Consolidated Financial Statements.
Adjusted Funds Flow, Free Funds Flow and Excess Free Funds Flow
Adjusted Funds Flow is a non-GAAP financial measure commonly used in the oil and gas industry to assist in measuring a company’s ability to finance its capital programs and meet its financial obligations, in total and on a per-share basis. Adjusted Funds Flow is defined as cash from (used in) operating activities, excluding settlement of decommissioning liabilities and net change in operating non-cash working capital. Operating non-cash working capital is composed of accounts receivable and accrued revenues, income tax receivable, inventories (excluding non-cash inventory write-downs and reversals), accounts payable and accrued liabilities, and income tax payable. Adjusted Funds Flow Per Share – Basic is defined as Adjusted Funds Flow divided by the basic weighted average number of shares. Adjusted Funds Flow Per Share – Diluted is defined as Adjusted Funds Flow divided by the diluted weighted average number of shares.
Free Funds Flow is a non-GAAP financial measure used to assist in measuring the available funds the Company has after financing its capital programs. Free Funds Flow is defined as cash from (used in) operating activities, excluding settlement of decommissioning liabilities and net change in operating non-cash working capital, minus capital investment.
| | | | | |
| Cenovus Energy Inc. – 2025 Management's Discussion and Analysis | 66 |
Excess Free Funds Flow is a non-GAAP financial measure used by the Company to deliver shareholder returns and allocate capital according to our shareholder returns and capital allocation framework. Excess Free Funds Flow is defined as Free Funds Flow minus base dividends paid on common shares, dividends paid on preferred shares, net purchases of common shares under the employee benefit plan, other uses of cash (including settlement of decommissioning liabilities and principal repayment of leases), and expenditures for acquisitions net of cash acquired, plus proceeds from, or payments related to, divestitures.
| | | | | | | | | | | | | | | | | | | | | | | | | |
| Three Months Ended December 31, | | Year Ended December 31, | | |
| ($ millions) | 2025 | | 2024 | | 2025 | | 2024 | | |
| Cash From (Used in) Operating Activities | 2,408 | | | 2,029 | | | 8,228 | | | 9,235 | | | |
| (Add) Deduct: | | | | | | | | | |
Settlement of Decommissioning Liabilities | (82) | | | (64) | | | (280) | | | (234) | | | |
| Net Change in Non-Cash Working Capital | (184) | | | 492 | | | (363) | | | 1,305 | | | |
| Adjusted Funds Flow | 2,674 | | | 1,601 | | | 8,871 | | | 8,164 | | | |
Capital Investment | 1,360 | | | 1,478 | | | 4,907 | | | 5,015 | | | |
Free Funds Flow | 1,314 | | | 123 | | | 3,964 | | | 3,149 | | | |
| Add (Deduct): | | | | | | | | | |
| Base Dividends Paid on Common Shares | (376) | | | (330) | | | (1,423) | | | (1,255) | | | |
| Dividends Paid on Preferred Shares | (4) | | | (18) | | | (14) | | | (45) | | | |
Purchase of Common Shares Under Employee
Benefit Plan | (61) | | | (43) | | | (155) | | | (43) | | | |
Settlement of Decommissioning Liabilities | (82) | | | (64) | | | (280) | | | (234) | | | |
| Principal Repayment of Leases | (84) | | | (80) | | | (350) | | | (299) | | | |
| Acquisitions, Net of Cash Acquired | (3,430) | | | (3) | | | (3,666) | | | (22) | | | |
Acquisition of Ownership Interest in MEG Energy Corp. (1) | (752) | | | — | | | (752) | | | — | | | |
| Proceeds From Divestitures | 1,878 | | | (1) | | | 1,891 | | | 46 | | | |
Excess Free Funds Flow | (1,597) | | | (416) | | | (785) | | | 1,297 | | | |
(1)Represents the acquired MEG common shares purchased prior to the closing of the MEG Acquisition. For further information, refer to Note 3 of the interim Consolidated Financial Statements.
Total Long-Term Liabilities
Total Long-Term Liabilities is a non-GAAP financial measure. The measure is disclosed to fulfill the requirements of National Instrument 51-102, “Continuous Disclosure Obligations” and is defined as total liabilities less total current liabilities.
| | | | | | | | | | | | | | | | | | | | | | | |
| As at December 31, |
| ($ millions) | 2025 | | | | | 2024 | | | | | 2023 |
Total Liabilities | 31,786 | | | | | | 26,770 | | | | | | 25,203 | |
Less: Total Current Liabilities | 6,314 | | | | | | 7,362 | | | | | | 6,210 | |
Total Long-Term Liabilities | 25,472 | | | | | | 19,408 | | | | | | 18,993 | |
Gross Margin, Adjusted Gross Margin, Adjusted Refining Margin and Adjusted Market Capture
Gross Margin and Adjusted Gross Margin are non-GAAP financial measures that are used to evaluate the performance of our downstream operations. We define Gross Margin as revenues less purchased product and Adjusted Gross Margin as revenues less purchased product, excluding the impact of inventory holding gains or losses.
Inventory holding gains or losses reflects the difference between the cost of volumes produced at current-period costs, which is an indication of current market conditions, and the cost of volumes produced under the FIFO or weighted average cost basis as required by IFRS Accounting Standards, which generally reflects the market conditions at the time feedstock was purchased. The purchase and sale of inventories creates a timing difference that could be anywhere from several weeks to several months. This measure is an estimate of the impact of current-period costs to FIFO or weighted average cost, and assumes that all opening volumes are sold in the current period. Cenovus uses inventory holding gains or losses to analyze the performance of our assets and increase comparability with refining peers.
Adjusted Refining Margin and Adjusted Market Capture contain non-GAAP financial measures. Adjusted Refining Margin is used to evaluate our downstream operations after adjusting for inventory holding gains or losses. Adjusted Market Capture is used in our U.S. Refining segment to provide an indication of margin captured relative to what was available in the market based on widely-used benchmarks. These measures are useful to consistently measure the performance of our downstream operations.
| | | | | |
| Cenovus Energy Inc. – 2025 Management's Discussion and Analysis | 67 |
We define Adjusted Refining Margin as Adjusted Gross Margin divided by total processed inputs and Adjusted Market Capture as Adjusted Refining Margin divided by the weighted average 3-2-1 market benchmark crack, net of RINs, expressed as a percentage. The weighted average crack spread, net of RINs, is calculated on Cenovus’s operable capacity-weighted average of the Chicago and Group 3 3-2-1 benchmark market crack spreads, net of RINs.
We previously disclosed Refining Margin and Market Capture, which did not exclude the effect of inventory holding gains or losses. As of March 31, 2025, we have added Adjusted Gross Margin, and replaced our definitions of Refining Margin and Market Capture to exclude the impact of inventory holding gains or losses. We believe these changes provide more comparability and accuracy when measuring the performance of our downstream operations.
Comparative period information has been provided below for these new metrics.
Canadian Refining
| | | | | | | | | | | | | | | | | | | | | |
| Three Months Ended December 31, 2025 | | | | |
($ millions, except where indicated) | Lloydminster Upgrader and Lloydminster Refinery Total | | Other (1) | | Total Canadian Refining (2) | | | | |
Revenues | 1,078 | | 78 | | 1,156 | | | | |
| Purchased Product | 862 | | 48 | | 910 | | | | |
| Gross Margin | 216 | | 30 | | 246 | | | | |
Add (Deduct): | | | | | | | | | |
| Inventory Holding (Gain) Loss | 4 | | — | | 4 | | | | |
| Adjusted Gross Margin | 220 | | 30 | | 250 | | | | |
| | | | | | | | | |
Total Processed Inputs (Mbbls/d) | 122.6 | | | | | | | | |
| | | | | | | | | |
| | | | | | | | | |
Adjusted Refining Margin ($/bbl) | 19.57 | | | | | | | | |
(1)Includes ethanol operations and crude-by-rail operations.
(2)Revenues and purchased product are found in Note 1 of the interim Consolidated Financial Statements.
| | | | | | | | | | | | | | | | | |
| Three Months Ended December 31, 2024 |
($ millions, except where indicated) | Lloydminster Upgrader and Lloydminster Refinery Total | | Other (1) | | Total Canadian Refining (2) |
Revenues | 1,207 | | 56 | | 1,263 |
| Purchased Product | 1,032 | | 36 | | 1,068 |
| Gross Margin | 175 | | 20 | | 195 |
Add (Deduct): | | | | | |
| Inventory Holding (Gain) Loss | — | | — | | — |
| Adjusted Gross Margin | 175 | | 20 | | 195 |
| | | | | |
Total Processed Inputs (Mbbls/d) | 112.1 | | | | |
| | | | | |
| | | | | |
Adjusted Refining Margin ($/bbl) | 16.96 | | | | |
(1)Includes ethanol operations and crude-by-rail operations.
(2)Revenues and purchased product are found in Note 1 of the interim Consolidated Financial Statements.
| | | | | |
| Cenovus Energy Inc. – 2025 Management's Discussion and Analysis | 68 |
| | | | | | | | | | | | | | | | | | | | | |
| | | | | Year Ended December 31, 2025 |
| | | | | | | | | |
($ millions, except where indicated) | | | | | Lloydminster Upgrader and Lloydminster Refinery Total | | Other (1) | | Total Canadian Refining (2) |
| Revenues | | | | | 4,781 | | 298 | | 5,079 |
| Purchased Product | | | | | 3,932 | | 196 | | 4,128 |
| Gross Margin | | | | | 849 | | 102 | | 951 |
Add (Deduct): | | | | | | | | | |
| Inventory Holding (Gain) Loss | | | | | 3 | | — | | 3 |
| Adjusted Gross Margin | | | | | 852 | | 102 | | 954 |
| | | | | | | | | |
Total Processed Inputs (Mbbls/d) | | | | | 119.4 | | | | |
| | | | | | | | | |
| | | | | | | | | |
Adjusted Refining Margin ($/bbl) | | | | | 19.57 | | | | |
| | | | | | | | | |
| | | | | | | | | |
(1)Includes ethanol operations and crude-by-rail operations.
(2)Revenues and purchased product are found in Note 1 of the Consolidated Financial Statements.
| | | | | | | | | | | | | | | | | |
| Year Ended December 31, 2024 |
| | | | | |
($ millions, except where indicated) | Lloydminster Upgrader and Lloydminster Refinery Total | | Other (1) | | Total Canadian Refining (2) |
| Revenues | 5,014 | | 296 | | 5,310 |
| Purchased Product | 4,278 | | 205 | | 4,483 |
| Gross Margin | 736 | | 91 | | 827 |
| Add (Deduct): | | | | | |
| Inventory Holding (Gain) Loss | (4) | | 2 | | (2) |
| Adjusted Gross Margin | 732 | | 93 | | 825 |
| | | | | |
Total Processed Inputs (Mbbls/d) | 96.6 | | | | |
| | | | | |
Adjusted Refining Margin ($/bbl) | 20.72 | | | | |
(1)Includes ethanol operations and crude-by-rail operations.
(2)Revenues and purchased product are found in Note 1 of the Consolidated Financial Statements.
| | | | | |
| Cenovus Energy Inc. – 2025 Management's Discussion and Analysis | 69 |
U.S. Refining
| | | | | | | | | | | | | | | | | | | | | | | | |
| Three Months Ended December 31, | | Year Ended December 31, | |
($ millions, except where indicated) | 2025 | | 2024 | | 2025 | | 2024 | |
Revenues (1) | 4,158 | | | 6,574 | | | 24,118 | | | 28,308 | | |
Purchased Product (1) | 3,664 | | | 6,296 | | | 21,727 | | | 25,769 | | |
| Gross Margin | 494 | | | 278 | | | 2,391 | | | 2,539 | | |
Add (Deduct): | | | | | | | | |
| Inventory Holding (Gain) Loss | 134 | | | 45 | | | 298 | | | (23) | | |
| Adjusted Gross Margin | 628 | | | 323 | | | 2,689 | | | 2,516 | | |
| | | | | | | | |
Total Processed Inputs (Mbbls/d) | 375.8 | | | 588.4 | | | 548.1 | | | 581.4 | | |
| | | | | | | | |
| | | | | | | | |
Adjusted Refining Margin ($/bbl) | 18.17 | | | 5.98 | | | 13.44 | | | 11.83 | | |
| | | | | | | | |
Operable Capacity (2) (Mbbls/d) | 364.8 | | | 612.3 | | | 549.9 | | | 612.3 | | |
| | | | | | | | |
Operable Capacity by Regional Benchmark (percent) | | | | | | | | |
Chicago 3-2-1 Crack Spread Weighting | 88 | | | 81 | | | 82 | | | 81 | | |
| Group 3 3-2-1 Crack Spread Weighting | 12 | | | 19 | | | 18 | | | 19 | | |
| | | | | | | | |
Benchmark Prices and Exchange Rate | | | | | | | | |
Chicago 3-2-1 Crack Spread (US$/bbl) | 18.20 | | | 12.12 | | | 19.44 | | | 16.74 | | |
Group 3 3-2-1 Crack Spread (US$/bbl) | 19.25 | | | 12.66 | | | 20.63 | | | 16.81 | | |
RINs (US$/bbl) | 6.04 | | | 4.02 | | | 5.81 | | | 3.74 | | |
US$ per C$1 – Average | 0.717 | | | 0.715 | | | 0.716 | | | 0.730 | | |
| | | | | | | | |
Weighted Average Crack Spread, Net of RINs ($/bbl) | 17.14 | | | 11.47 | | | 19.34 | | | 17.82 | | |
| | | | | | | | |
| | | | | | | | |
Adjusted Market Capture (percent) | 106 | | | 52 | | | 69 | | | 67 | | |
(1)Found in Note 1 of the interim Consolidated Financial Statements.
(2)For the year ended December 31, 2025, reported operable capacity reflects the weighted average impact of the WRB Divestiture, which closed on September 30, 2025.
Netback Reconciliations and Realized Sales Price
Netback is a non-GAAP financial measure commonly used in the oil and gas industry to assist in measuring operating performance. Our Netback calculation is substantially aligned with the definition found in the Canadian Oil and Gas Evaluation Handbook. Netback is defined as gross sales less royalties, transportation and blending, and operating expenses. Netbacks do not reflect non-cash write-downs or reversals of product inventory until it is realized when the product is sold and exclude risk management activities. Condensate or butane (diluent) is blended with crude oil to transport it to market. Netback per barrel of oil equivalent contains a non-GAAP measure. Netbacks per barrel of oil equivalent reflect our margin on a per-barrel of oil equivalent basis. Per-unit measures are divided by sales volumes.
Realized Sales Price contains a non-GAAP measure. It includes our gross sales, purchased diluent costs and profit from optimization activities, such as cogeneration, third-party processing and trading. Conventional, Offshore and Asia Pacific Per-Unit Operating Expenses contain non-GAAP measures. As of March 31, 2025, modifications were made to our Conventional Netback to include our 30 percent equity interest in the Duvernay joint venture. These modifications resulted in minor adjustments that are captured in the netback calculation on a prospective basis. Offshore and Asia Pacific operating expenses, as used in the basis of our Netback calculations, reflect our 40 percent equity interest in the HCML joint venture. The Duvernay and HCML joint ventures are accounted for using the equity method in the interim Consolidated Financial Statements.
The following tables provide a reconciliation of Netback to Operating Margin found in our interim Consolidated Financial Statements.
| | | | | |
| Cenovus Energy Inc. – 2025 Management's Discussion and Analysis | 70 |
Oil Sands
| | | | | | | | | | | | | | | | | | | | | | | | |
| Basis of Netback Calculation |
Three Months Ended December 31, 2025 ($ millions) | Foster Creek | Christina Lake | Sunrise | Lloydminster (1) | | | | | | Total Oil Sands (2) |
| Gross Sales | 1,439 | | 1,752 | | 377 | | 762 | | | | | | | 4,330 | |
| Royalties | (231) | | (337) | | (20) | | (92) | | | | | | | (680) | |
| Revenues | 1,208 | | 1,415 | | 357 | | 670 | | | | | | | 3,650 | |
| Expenses | | | | | | | | | | |
| Purchased Product | — | | — | | — | | — | | | | | | | — | |
| Transportation and Blending | 228 | | 224 | | 77 | | 37 | | | | | | | 566 | |
| Operating | 183 | | 253 | | 85 | | 224 | | | | | | | 745 | |
| Netback | 797 | | 938 | | 195 | | 409 | | | | | | | 2,339 | |
| Realized (Gain) Loss on Risk Management | | | | | | | | | | (2) | |
| Operating Margin | | | | | | | | | | 2,341 | |
| | | | | | | | | | | | | | | | | | | | | | | |
| Basis of Netback Calculation | Adjustments | | |
Three Months Ended December 31, 2025 ($ millions) | Total Oil Sands (2) | | Condensate | Third-party Sourced | Other (3) | | Total Oil Sands (4) |
| Gross Sales | 4,330 | | | 2,180 | | 827 | | (125) | | | 7,212 | |
| Royalties | (680) | | | — | | — | | 41 | | | (639) | |
| Revenues | 3,650 | | | 2,180 | | 827 | | (84) | | | 6,573 | |
| Expenses | | | | | | | |
| Purchased Product | — | | | — | | 827 | | 64 | | | 891 | |
| Transportation and Blending | 566 | | | 2,180 | | — | | (9) | | | 2,737 | |
| Operating | 745 | | | — | | — | | (23) | | | 722 | |
| Netback | 2,339 | | | — | | — | | (116) | | | 2,223 | |
| Realized (Gain) Loss on Risk Management | (2) | | | — | | — | | — | | | (2) | |
| Operating Margin | 2,341 | | | — | | — | | (116) | | | 2,225 | |
(1)Includes Lloydminster thermal and Lloydminster conventional heavy oil assets.
(2)Includes bitumen and heavy oil.
(3)Other includes reclassification of costs primarily related to third-party cogeneration, processing and transportation, as well as adjustments to reflect the cost of volumes produced on acquired inventory.
(4)These amounts, excluding Netback, are found in Note 1 of the interim Consolidated Financial Statements.
| | | | | | | | | | | | | | | | | | | | | | | | |
| Basis of Netback Calculation |
Three Months Ended December 31, 2024 ($ millions) | Foster Creek | Christina Lake | Sunrise | Lloydminster (1) | | | | | | Total Oil Sands (2) |
| Gross Sales | 1,454 | | 1,646 | | 380 | | 871 | | | | | | | 4,351 | |
| Royalties | (283) | | (455) | | (19) | | (117) | | | | | | | (874) | |
| Revenues | 1,171 | | 1,191 | | 361 | | 754 | | | | | | | 3,477 | |
| Expenses | | | | | | | | | | |
| Purchased Product | — | | — | | — | | — | | | | | | | — | |
| Transportation and Blending | 281 | | 137 | | 59 | | 44 | | | | | | | 521 | |
| Operating | 163 | | 187 | | 72 | | 200 | | | | | | | 622 | |
| Netback | 727 | | 867 | | 230 | | 510 | | | | | | | 2,334 | |
| Realized (Gain) Loss on Risk Management | | | | | | | | | | (3) | |
| Operating Margin | | | | | | | | | | 2,337 | |
(1)Includes Lloydminster thermal and Lloydminster conventional heavy oil assets.
(2)Includes bitumen and heavy oil.
| | | | | |
| Cenovus Energy Inc. – 2025 Management's Discussion and Analysis | 71 |
| | | | | | | | | | | | | | | | | | | | | | | |
| Basis of Netback Calculation | Adjustments | | |
Three Months Ended December 31, 2024 ($ millions) | Total Oil Sands (1) | | Condensate | Third-party Sourced | Other (2) | | Total Oil Sands (3) |
| Gross Sales | 4,351 | | | 2,181 | | 465 | | 94 | | | 7,091 | |
| Royalties | (874) | | | — | | — | | — | | | (874) | |
| Revenues | 3,477 | | | 2,181 | | 465 | | 94 | | | 6,217 | |
| Expenses | | | | | | | |
| Purchased Product | — | | | — | | 465 | | 65 | | | 530 | |
| Transportation and Blending | 521 | | | 2,181 | | — | | 33 | | | 2,735 | |
| Operating | 622 | | | — | | — | | (7) | | | 615 | |
| Netback | 2,334 | | | — | | — | | 3 | | | 2,337 | |
| Realized (Gain) Loss on Risk Management | (3) | | | — | | — | | — | | | (3) | |
| Operating Margin | 2,337 | | | — | | — | | 3 | | | 2,340 | |
(1)Includes bitumen and heavy oil.
(2)Other includes construction, transportation and blending.
(3)These amounts, excluding Netback, are found in Note 1 of the interim Consolidated Financial Statements.
| | | | | | | | | | | | | | | | | | | | | | | | |
| Basis of Netback Calculation |
Year Ended December 31, 2025 ($ millions) | Foster Creek | Christina Lake | Sunrise | Lloydminster (1) | | | | | | Total Oil Sands (2) |
| Gross Sales | 5,938 | | 6,252 | | 1,479 | | 3,247 | | | | | | | 16,916 | |
| Royalties | (1,093) | | (1,414) | | (73) | | (379) | | | | | | | (2,959) | |
| Revenues | 4,845 | | 4,838 | | 1,406 | | 2,868 | | | | | | | 13,957 | |
| Expenses | | | | | | | | | | |
| Purchased Product | — | | — | | — | | — | | | | | | | — | |
| Transportation and Blending | 1,090 | | 638 | | 301 | | 149 | | | | | | | 2,178 | |
| Operating | 741 | | 763 | | 342 | | 926 | | | | | | | 2,772 | |
| Netback | 3,014 | | 3,437 | | 763 | | 1,793 | | | | | | | 9,007 | |
| Realized (Gain) Loss on Risk Management | | | | | | | | | | 8 | |
| Operating Margin | | | | | | | | | | 8,999 | |
| | | | | | | | | | | | | | | | | | | | | | | |
| Basis of Netback Calculation | Adjustments | | |
Year Ended December 31, 2025 ($ millions) | Total Oil Sands (2) | | Condensate | Third-party Sourced | Other (3) | | Total Oil Sands (4) |
| Gross Sales | 16,916 | | | 8,636 | | 2,578 | | 197 | | | 28,327 | |
| Royalties | (2,959) | | | — | | — | | 39 | | | (2,920) | |
| Revenues | 13,957 | | | 8,636 | | 2,578 | | 236 | | | 25,407 | |
| Expenses | | | | | | | |
| Purchased Product | — | | | — | | 2,578 | | 308 | | | 2,886 | |
| Transportation and Blending | 2,178 | | | 8,636 | | — | | 61 | | | 10,875 | |
| Operating | 2,772 | | | — | | — | | (18) | | | 2,754 | |
| Netback | 9,007 | | | — | | — | | (115) | | | 8,892 | |
| Realized (Gain) Loss on Risk Management | 8 | | | — | | — | | — | | | 8 | |
| Operating Margin | 8,999 | | | — | | — | | (115) | | | 8,884 | |
(1)Includes Lloydminster thermal and Lloydminster conventional heavy oil assets.
(2)Includes bitumen and heavy oil.
(3)Other includes reclassification of costs primarily related to third-party cogeneration, processing and transportation, as well as adjustments to reflect the cost of volumes produced on acquired inventory.
(4)These amounts, excluding Netback, are found in Note 1 of the Consolidated Financial Statements.
| | | | | |
| Cenovus Energy Inc. – 2025 Management's Discussion and Analysis | 72 |
| | | | | | | | | | | | | | | | | | | | | | | | |
| Basis of Netback Calculation |
Year Ended December 31, 2024 ($ millions) | Foster Creek | Christina Lake | Sunrise | Lloydminster (1) | | | | | | Total Oil Sands (2) |
| Gross Sales | 5,837 | | 6,428 | | 1,574 | | 3,724 | | | | | | | 17,563 | |
| Royalties | (1,176) | | (1,601) | | (78) | | (413) | | | | | | | (3,268) | |
| Revenues | 4,661 | | 4,827 | | 1,496 | | 3,311 | | | | | | | 14,295 | |
| Expenses | | | | | | | | | | |
| Purchased Product | — | | — | | — | | — | | | | | | | — | |
| Transportation and Blending | 937 | | 554 | | 294 | | 185 | | | | | | | 1,970 | |
| Operating | 682 | | 733 | | 263 | | 819 | | | | | | | 2,497 | |
| Netback | 3,042 | | 3,540 | | 939 | | 2,307 | | | | | | | 9,828 | |
| Realized (Gain) Loss on Risk Management | | | | | | | | | | 20 | |
| Operating Margin | | | | | | | | | | 9,808 | |
| | | | | | | | | | | | | | | | | | | | | | | |
| Basis of Netback Calculation | Adjustments | | |
Year Ended December 31, 2024 ($ millions) | Total Oil Sands (2) | | Condensate | Third-party Sourced | Other (3) | | Total Oil Sands (4) |
| Gross Sales | 17,563 | | | 8,913 | | 1,531 | | 440 | | | 28,447 | |
| Royalties | (3,268) | | | — | | — | | (6) | | | (3,274) | |
| Revenues | 14,295 | | | 8,913 | | 1,531 | | 434 | | | 25,173 | |
| Expenses | | | | | | | |
| Purchased Product | — | | | — | | 1,531 | | 320 | | | 1,851 | |
| Transportation and Blending | 1,970 | | | 8,913 | | — | | 117 | | | 11,000 | |
| Operating | 2,497 | | | — | | — | | 14 | | | 2,511 | |
| Netback | 9,828 | | | — | | — | | (17) | | | 9,811 | |
| Realized (Gain) Loss on Risk Management | 20 | | | — | | — | | — | | | 20 | |
| Operating Margin | 9,808 | | | — | | — | | (17) | | | 9,791 | |
(1)Includes Lloydminster thermal and Lloydminster conventional heavy oil assets.
(2)Includes bitumen and heavy oil.
(3)Other includes reclassification of costs primarily related to third-party cogeneration, processing and transportation, as well as adjustments to reflect the cost of volumes produced on acquired inventory.
(4)These amounts, excluding Netback, are found in Note 1 of the Consolidated Financial Statements.
Conventional
| | | | | | | | | | | | | | | | | | | | |
| Basis of Netback Calculation | | Adjustments | | |
Three Months Ended December 31, 2025 ($ millions) | Conventional (1) | | Third-party Sourced | Other (1) (2) | | Conventional (3) |
| Gross Sales | 323 | | | 386 | | 29 | | | 738 | |
| Royalties | (13) | | | — | | 2 | | | (11) | |
| Revenues | 310 | | | 386 | | 31 | | | 727 | |
| Expenses | | | | | | |
| Purchased Product | — | | | 386 | | — | | | 386 | |
| Transportation and Blending | 61 | | | — | | 31 | | | 92 | |
| Operating | 90 | | | — | | 5 | | | 95 | |
| Netback | 159 | | | — | | (5) | | | 154 | |
| Realized (Gain) Loss on Risk Management | (5) | | | — | | — | | | (5) | |
| Operating Margin | 164 | | | — | | (5) | | | 159 | |
| | | | | | |
(1)For the three months ended December 31, 2025, reported netbacks are inclusive of revenues and expenses related to the Duvernay joint venture.
(2)Other includes reclassification of costs primarily related to third-party cogeneration, processing and transportation.
(3)These amounts, excluding Netback, are found in Note 1 of the interim Consolidated Financial Statements.
| | | | | |
| Cenovus Energy Inc. – 2025 Management's Discussion and Analysis | 73 |
| | | | | | | | | | | | | | | | | | | | |
| Basis of Netback Calculation | | Adjustments | | |
Three Months Ended December 31, 2024 ($ millions) | Conventional | | Third-party Sourced | Other (1) | | Conventional (2) |
| Gross Sales | 273 | | | 470 | | 33 | | | 776 | |
| Royalties | (15) | | | — | | — | | | (15) | |
| Revenues | 258 | | | 470 | | 33 | | | 761 | |
| Expenses | | | | | | |
| Purchased Product | — | | | 470 | | — | | | 470 | |
| Transportation and Blending | 52 | | | — | | 27 | | | 79 | |
| Operating | 118 | | | — | | 5 | | | 123 | |
| Netback | 88 | | | — | | 1 | | | 89 | |
| Realized (Gain) Loss on Risk Management | 1 | | | — | | — | | | 1 | |
| Operating Margin | 87 | | | — | | 1 | | | 88 | |
| | | | | | |
(1)Other includes reclassification of costs primarily related to third-party cogeneration, processing and transportation.
(2)These amounts, excluding Netback, are found in Note 1 of the interim Consolidated Financial Statements.
| | | | | | | | | | | | | | | | | | | | |
| Basis of Netback Calculation | | Adjustments | | |
Year Ended December 31, 2025 ($ millions) | Conventional (1) | | Third-party Sourced | Other (1) (2) | | Conventional (3) |
| Gross Sales | 1,208 | | | 1,337 | | 115 | | | 2,660 | |
| Royalties | (58) | | | — | | 3 | | | (55) | |
| Revenues | 1,150 | | | 1,337 | | 118 | | | 2,605 | |
| Expenses | | | | | | |
| Purchased Product | — | | | 1,337 | | — | | | 1,337 | |
| Transportation and Blending | 244 | | | — | | 107 | | | 351 | |
| Operating | 441 | | | — | | 23 | | | 464 | |
| Netback | 465 | | | — | | (12) | | | 453 | |
| Realized (Gain) Loss on Risk Management | (4) | | | — | | — | | | (4) | |
| Operating Margin | 469 | | | — | | (12) | | | 457 | |
| | | | | | |
(1)For the year ended December 31, 2025, reported netbacks are inclusive of revenues and expenses related to the Duvernay joint venture.
(2)Other includes the reclassification of costs primarily related to third-party cogeneration, processing and transportation.
(3)These amounts, excluding Netback, are found in Note 1 of the Consolidated Financial Statements.
| | | | | | | | | | | | | | | | | | | | |
| Basis of Netback Calculation | | Adjustments | | |
Year Ended December 31, 2024 ($ millions) | Conventional | | Third-party Sourced | Other (1) | | Conventional (2) |
| Gross Sales | 1,105 | | | 1,823 | | 131 | | | 3,059 | |
| Royalties | (76) | | | — | | — | | | (76) | |
| Revenues | 1,029 | | | 1,823 | | 131 | | | 2,983 | |
| Expenses | | | | | | |
| Purchased Product | — | | | 1,823 | | — | | | 1,823 | |
| Transportation and Blending | 218 | | | — | | 102 | | | 320 | |
| Operating | 526 | | | — | | 29 | | | 555 | |
| Netback | 285 | | | — | | — | | | 285 | |
| Realized (Gain) Loss on Risk Management | (6) | | | — | | — | | | (6) | |
| Operating Margin | 291 | | | — | | — | | | 291 | |
| | | | | | |
(1)Other includes the reclassification of costs primarily related to third-party cogeneration, processing and transportation.
(2)These amounts, excluding Netback, are found in Note 1 of the Consolidated Financial Statements.
| | | | | |
| Cenovus Energy Inc. – 2025 Management's Discussion and Analysis | 74 |
Offshore
| | | | | | | | | | | | | | | | | | | | | | | | | | | | | | | | | | | |
| Basis of Netback Calculation | | Adjustments | | |
Three Months Ended December 31, 2025 ($ millions) | Atlantic | China | Indonesia (1) | Total
Asia Pacific | | Total Offshore | | Equity Adjustment (1) | Other (2) | | Total Offshore (3) |
| Gross Sales | 64 | | 275 | | 83 | | 358 | | | 422 | | | (83) | | (2) | | | 337 | |
| Royalties | (1) | | (20) | | (14) | | (34) | | | (35) | | | 14 | | 1 | | | (20) | |
| Revenues | 63 | | 255 | | 69 | | 324 | | | 387 | | | (69) | | (1) | | | 317 | |
| Expenses | | | | | | | | | | | |
| Purchased Product | — | | — | | — | | — | | | — | | | — | | (6) | | | (6) | |
| Transportation and Blending | 3 | | — | | — | | — | | | 3 | | | — | | — | | | 3 | |
| Operating | 39 | | 35 | | 22 | | 57 | | | 96 | | | (21) | | 1 | | | 76 | |
| Netback | 21 | | 220 | | 47 | | 267 | | | 288 | | | (48) | | 4 | | | 244 | |
| Realized (Gain) Loss on Risk Management | | | | | | — | | | — | | — | | | — | |
| Operating Margin | | | | | | 288 | | | (48) | | 4 | | | 244 | |
| | | | | | | | | | | | | | | | | | | | | | | | | | | | | | | | | | | |
| Basis of Netback Calculation | | Adjustments | | |
Three Months Ended December 31, 2024 ($ millions) | Atlantic | China | Indonesia (1) | Total
Asia Pacific | | Total Offshore | | Equity Adjustment (1) | Other (2) | | Total Offshore (3) |
| Gross Sales | 58 | | 315 | | 110 | | 425 | | | 483 | | | (110) | | — | | | 373 | |
| Royalties | — | | (25) | | (27) | | (52) | | | (52) | | | 27 | | — | | | (25) | |
| Revenues | 58 | | 290 | | 83 | | 373 | | | 431 | | | (83) | | — | | | 348 | |
| Expenses | | | | | | | | | | | |
| Purchased Product | — | | — | | — | | — | | | — | | | — | | — | | | — | |
| Transportation and Blending | 2 | | — | | — | | — | | | 2 | | | — | | — | | | 2 | |
| Operating | 65 | | 35 | | 20 | | 55 | | | 120 | | | (19) | | 3 | | | 104 | |
| Netback | (9) | | 255 | | 63 | | 318 | | | 309 | | | (64) | | (3) | | | 242 | |
| Realized (Gain) Loss on Risk Management | | | | | | — | | | — | | — | | | — | |
| Operating Margin | | | | | | 309 | | | (64) | | (3) | | | 242 | |
(1)Revenues and expenses related to the HCML joint venture.
(2)Includes other activities not attributable to the production of crude oil and natural gas.
(3)These amounts, excluding Netback, are found in Note 1 of the interim Consolidated Financial Statements.
| | | | | | | | | | | | | | | | | | | | | | | | | | | | | | | | | | | |
| Basis of Netback Calculation | | Adjustments | | |
Year Ended December 31, 2025 ($ millions) | Atlantic | China | Indonesia (1) | Total
Asia Pacific | | Total Offshore | | Equity Adjustment (1) | Other (2) | | Total Offshore (3) |
| Gross Sales | 401 | | 1,088 | | 343 | | 1,431 | | | 1,832 | | | (343) | | 19 | | | 1,508 | |
| Royalties | (4) | | (76) | | (83) | | (159) | | | (163) | | | 83 | | — | | | (80) | |
| Revenues | 397 | | 1,012 | | 260 | | 1,272 | | | 1,669 | | | (260) | | 19 | | | 1,428 | |
| Expenses | | | | | | | | | | | |
| Purchased Product | — | | — | | — | | — | | | — | | | — | | — | | | — | |
| Transportation and Blending | 17 | | — | | — | | — | | | 17 | | | — | | — | | | 17 | |
| Operating | 223 | | 114 | | 66 | | 180 | | | 403 | | | (58) | | 4 | | | 349 | |
| Netback | 157 | | 898 | | 194 | | 1,092 | | | 1,249 | | | (202) | | 15 | | | 1,062 | |
| Realized (Gain) Loss on Risk Management | | | | | | — | | | — | | — | | | — | |
| Operating Margin | | | | | | 1,249 | | | (202) | | 15 | | | 1,062 | |
(1)Revenues and expenses related to the HCML joint venture.
(2)Includes other activities not attributable to the production of crude oil and natural gas.
(3)These amounts, excluding Netback, are found in Note 1 of the Consolidated Financial Statements.
| | | | | |
| Cenovus Energy Inc. – 2025 Management's Discussion and Analysis | 75 |
| | | | | | | | | | | | | | | | | | | | | | | | | | | | | | | | | | | |
| Basis of Netback Calculation | | Adjustments | | |
Year Ended December 31, 2024 ($ millions) | Atlantic | China | Indonesia (1) | Total
Asia Pacific | | Total Offshore | | Equity Adjustment (1) | Other (2) | | Total Offshore (3) |
| Gross Sales | 322 | | 1,250 | | 339 | | 1,589 | | | 1,911 | | | (339) | | — | | | 1,572 | |
| Royalties | (2) | | (97) | | (55) | | (152) | | | (154) | | | 55 | | — | | | (99) | |
| Revenues | 320 | | 1,153 | | 284 | | 1,437 | | | 1,757 | | | (284) | | — | | | 1,473 | |
| Expenses | | | | | | | | | | | |
| Purchased Product | — | | — | | — | | — | | | — | | | — | | — | | | — | |
| Transportation and Blending | 11 | | — | | — | | — | | | 11 | | | — | | — | | | 11 | |
| Operating | 287 | | 119 | | 64 | | 183 | | | 470 | | | (56) | | 9 | | | 423 | |
| Netback | 22 | | 1,034 | | 220 | | 1,254 | | | 1,276 | | | (228) | | (9) | | | 1,039 | |
| Realized (Gain) Loss on Risk Management | | | | | | — | | | — | | — | | | — | |
| Operating Margin | | | | | | 1,276 | | | (228) | | (9) | | | 1,039 | |
(1)Revenues and expenses related to the HCML joint venture.
(2)Includes other activities not attributable to the production of crude oil and natural gas.
(3)These amounts, excluding Netback, are found in Note 1 of the Consolidated Financial Statements.
Upstream Sales Volumes (1)
The following table provides the sales volumes used to calculate Netback:
| | | | | | | | | | | | | | | | | | | | | | | |
| Three Months Ended December 31, | | Year Ended December 31, |
| (MBOE/d) | 2025 | | 2024 | | 2025 | | 2024 |
Oil Sands (2) | | | | | | | |
| Foster Creek | 227.5 | | | 184.0 | | | 208.0 | | | 188.8 | |
| Christina Lake | 315.3 | | | 245.7 | | | 254.8 | | | 231.9 | |
| Sunrise | 60.3 | | | 52.2 | | | 53.5 | | | 50.0 | |
Lloydminster | 134.4 | | | 125.9 | | | 126.8 | | | 127.7 | |
| Total Oil Sands | 737.5 | | | 607.8 | | | 643.1 | | | 598.4 | |
| | | | | | | |
Conventional (3) | 120.4 | | | 117.8 | | | 122.8 | | | 119.9 | |
| | | | | | | |
| Offshore | | | | | | | |
| Atlantic | 8.0 | | | 6.2 | | | 11.3 | | | 8.0 | |
| Asia Pacific | | | | | | | |
| China | 38.4 | | | 42.6 | | | 38.3 | | | 42.6 | |
Indonesia (4) | 15.6 | | | 19.6 | | | 15.9 | | | 16.0 | |
| Total Asia Pacific | 54.0 | | | 62.2 | | | 54.2 | | | 58.6 | |
| Total Offshore | 62.0 | | | 68.4 | | | 65.5 | | | 66.6 | |
| | | | | | | |
| | | | | | | |
| | | | | | | |
| | | | | | | |
(1)Sales volumes exclude the impact of purchased condensate.
(2)Includes bitumen and heavy crude oil sales.
(3)For the three months and year ended December 31, 2025, reported sales volumes reflect Cenovus’s 30 percent equity interest in the Duvernay joint venture.
(4)Reported sales volumes reflect Cenovus’s 40 percent equity interest in the HCML joint venture.
Other Specified Financial Measures
Per-Unit Operating Expenses
Per-unit operating expenses are specified financial measures used to evaluate the performance of our upstream and downstream operations. Our upstream per-unit operating expenses are defined as total operating expenses divided by sales volumes and are part of our Netback calculation, which can be found above.
We define Canadian Refining per-unit operating expenses as total operating expenses from the Upgrader, the Lloydminster Refinery and the commercial fuels business, divided by total processed inputs. We define U.S. Refining per-unit operating expenses as operating expenses divided by total processed inputs.
Per-Unit Transportation Expenses
Per-unit transportation expenses are specified financial measures used to measure transportation expenses on a per-unit basis in our upstream segments. We define per-unit transportation expenses as the total transportation expenses divided by sales volumes. Our upstream per-unit transportation expenses are part of the transportation and blending line in our Netback calculation, which can be found above.
| | | | | |
| Cenovus Energy Inc. – 2025 Management's Discussion and Analysis | 76 |