| National Bank Holdings Corporation Fixed Income Investor Presentation February 2026 |

| Legal Disclaimers Confidentiality This presentation (“Presentation”) contains proprietary and confidential information of National Bank Holdings Corporation and its affiliates (the “Company”) and is provided solely for the purpose of obtaining a rating from Moody’s Investor Services, Inc. Any review, distribution, reproduction, or disclosure of this Presentation, in whole or in part, without the prior written consent of the Company, is strictly prohibited. The Company retains all rights, title, and interest—including intellectual property rights—to the content herein. No license or ownership rights are granted to the recipient. Cautionary Note Regarding Forward-Looking Statements This presentation contains forward-looking statements within the meaning of the Private Securities Litigation Reform Act of 1995. These statements do not discuss historical facts but instead relate to expectations, beliefs, plans, predictions, forecasts, objectives, assumptions or future events or performance. Forward-looking statements are generally identified by words such as “anticipate,” “believe,” “can,” “would,” “should,” “could,” “may,” “predict,” “seek,” “potential,” “will,” “estimate,” “target,” “plan,” “project,” “continuing,” “ongoing,” “expect,” “intend,” “goal,” “focus,” “maintains,” “future,” “ultimately,” “likely,” “ensure,” “strategy,” “objective,” and similar words or phrases. These statements are only predictions and involve estimates, known and unknown risks, assumptions and uncertainties. We have based these statements largely on our current expectations and projections about future events and financial trends that we believe may affect our financial condition, liquidity, results of operations, business strategy and growth prospects. Although we believe that the expectations reflected in these forward-looking statements are reasonable as of the date made, actual results may prove to be materially different from the results expressed or implied by the forward-looking statements due to a number of factors, including, but not limited to, business and economic conditions along with external events, both generally and in the financial services industry; susceptibility to credit risk and fluctuations in the value of real estate and other collateral securing a significant portion of our loan portfolio, including with regards to real estate acquired through foreclosure, and the accuracy of appraisals related to such real estate; changes impacting monetary supply and the businesses of our clients and counterparties, including levels of market interest rates, inflation, currency values, monetary, fiscal, and international trade policy, and the volatility of trading markets; our ability to maintain sufficient liquidity to meet the requirements of deposit withdrawals and other business needs; our desire to raise additional capital in connection with strategic growth initiatives and our ability to access the capital markets when desired or on favorable terms; changes in the fair value of our investment securities can fluctuate due to market conditions outside of our control; our investments in financial technology companies and initiatives may subject us to material financial, reputational and strategic risks; the allowance for credit losses and fair value adjustments may be insufficient to absorb losses in our loan portfolio; any service interruptions, cyber incidents or other breaches relating to our technology systems, security systems or infrastructure or those of our third-party providers; the occurrence of fraud or other financial crimes within our business; competition from other financial services providers, including traditional financial institutions and financial technology companies, and the effects of disintermediation within the banking business including consolidation within the industry; changes to federal government lending programs like the Small Business Administration’s Preferred Lender Program and the Federal Housing Administration’s insurance programs, including the impact of changes in regulations, budget appropriations and a prolonged government shutdown on such programs; impairment of our mortgage servicing rights, disruption in the secondary market for mortgage loans, declines in real estate values, or being required to repurchase mortgage loans or reimburse investors; claims and litigation related to our fiduciary responsibilities in connection with our trust and wealth business; our ability to manage and execute our organic growth and acquisition strategies, including our ability to realize the expected benefits of our acquisition strategies; developments in technology, such as artificial intelligence, the success of our digital growth strategy, and our ability to incorporate innovative technologies in our business and provide products and services that satisfy our clients’ expectations for convenience and security; our ability to integrate Vista Bank into our business may be more difficult, costly or time consuming than expected and we may fail to realize the anticipated benefits or cost savings of the merger; failure to obtain regulatory approvals or consummate attractive acquisitions or continue to increase organic loan growth would restrict our growth plans; the accuracy of projected operating results for assets and businesses we acquire as well as our ability to drive organic loan growth to replace loans in our existing portfolio with comparable loans as loans are paid down; our ability to comply with and manage costs related to extensive and potentially expanding government regulation and supervision, including current and future regulations affecting bank holding companies and depository institutions; our ability to execute our capital allocation strategy, including paying dividends or repurchasing shares, is subject to regulatory limitations; the application of any increased assessment rates imposed by the Federal Deposit Insurance Corporation; claims or legal action brought against us by third parties or government agencies; the loss of our executive officers and key personnel; changes to federal, state and local laws and regulations along with executive orders applicable to our business, including tax laws; and other factors, risks, trends and uncertainties described elsewhere in our other filings with the Securities and Exchange Commission. The forward-looking statements are made as of the date of this presentation, and we undertake no obligation to update any forward-looking statement to reflect events or circumstances after the date on which the statement is made or to reflect the occurrence of unanticipated events or circumstances, except as required by applicable law. About Non-GAAP Financial Measures Certain financial measures and ratios we present are supplemental measures that are not required by, or are not presented in accordance with, U.S. generally accepted accounting principles (GAAP). We refer to these financial measures and ratios as “non-GAAP financial measures.” We consider the use of select non-GAAP financial measures and ratios to be useful for financial and operational decision making and useful in evaluating period-to-period comparisons. We believe that these non-GAAP financial measures provide meaningful supplemental information regarding our performance by excluding certain expenditures or assets that we believe are not indicative of our primary business operating results. We believe that management and investors benefit from referring to these non-GAAP financial measures in assessing our performance and when planning, forecasting, analyzing and comparing past, present and future periods. These non-GAAP financial measures should not be considered a substitute for financial information presented in accordance with GAAP and you should not rely on non-GAAP financial measures alone as measures of our performance. The non-GAAP financial measures we present may differ from non-GAAP financial measures used by our peers or other companies. We compensate for these differences by providing the equivalent GAAP measures whenever we present the non-GAAP financial measures and by including a reconciliation of the impact of the components adjusted for in the non-GAAP financial measure so that both measures and the individual components may be considered when analyzing our performance. A reconciliation of non-GAAP financial measures to the comparable GAAP financial measures is included in the Reconciliation of Non-GAAP Measures section of the Appendix. Market and Industry Data This presentation may reference certain market, industry and demographic data, forecasts and other statistical information that we have obtained from various independent third-party industry sources and publications. We believe that these sources and estimates are reliable but have not independently verified them. Although we are not aware of any misstatements regarding the economic, employment, industry and other market data presented herein, these estimates involve inherent risks and uncertainties and are based on assumptions that are subject to change. No Offer or Solicitation; Registration Statement This Presentation does not constitute or form part of any offer to sell, or a solicitation of an offer to purchase, any securities of the Company. Neither the SEC nor any other regulatory body has approved or disapproved of the securities of the Company or passed upon the accuracy or adequacy of this Presentation. Any representation to the contrary is a criminal offense. The Company will file a registration statement (including a prospectus) and a preliminary prospectus supplement with the SEC for the offering to which this Presentation relates. Before you invest, you should read the prospectus and the preliminary prospectus supplement included in the registration statement and other documents the Company has filed with the SEC for more complete information about the Company and this offering. You may obtain these documents for free by visiting EDGAR on the SEC website at sec.gov Alternatively, we will arrange to send you copies of the prospectus and the preliminary prospectus supplement relating to the proposed offering if you request it by emailing Piper Sandler & Co. at fsg-dcm@psc.com. Further Information: This presentation should be read together with “Management’s Discussion and Analysis of Financial Condition and Results of Operations” and the consolidated financial statements and the related notes thereto included in our Form 10-K and quarterly reports |
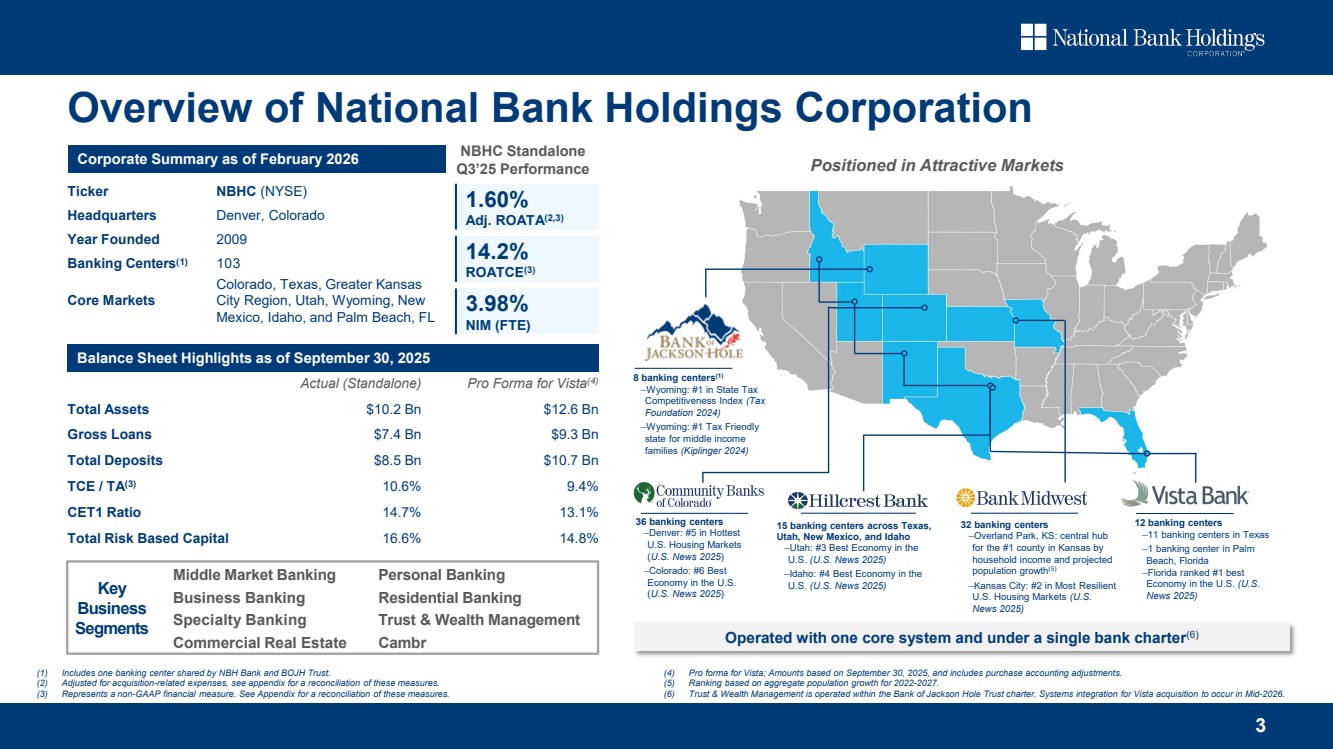
| Actual (Standalone) Pro Forma for Vista(4) Total Assets $10.2 Bn $12.6 Bn Gross Loans $7.4 Bn $9.3 Bn Total Deposits $8.5 Bn $10.7 Bn TCE / TA(3) 10.6% 9.4% CET1 Ratio 14.7% 13.1% Total Risk Based Capital 16.6% 14.8% Ticker NBHC (NYSE) Headquarters Denver, Colorado Year Founded 2009 Banking Centers(1) 103 Core Markets Colorado, Texas, Greater Kansas City Region, Utah, Wyoming, New Mexico, Idaho, and Palm Beach, FL 3 8 banking centers(1) ‒Wyoming: #1 in State Tax Competitiveness Index (Tax Foundation 2024) ‒Wyoming: #1 Tax Friendly state for middle income families (Kiplinger 2024) 32 banking centers ‒Overland Park, KS: central hub for the #1 county in Kansas by household income and projected population growth(5) ‒Kansas City: #2 in Most Resilient U.S. Housing Markets (U.S. News 2025) 15 banking centers across Texas, Utah, New Mexico, and Idaho ‒Utah: #3 Best Economy in the U.S. (U.S. News 2025) ‒Idaho: #4 Best Economy in the U.S. (U.S. News 2025) 36 banking centers ‒Denver: #5 in Hottest U.S. Housing Markets (U.S. News 2025) ‒Colorado: #6 Best Economy in the U.S. (U.S. News 2025) Middle Market Banking Business Banking Specialty Banking Commercial Real Estate Personal Banking Residential Banking Trust & Wealth Management Cambr Key Business Segments Overview of National Bank Holdings Corporation (1) Includes one banking center shared by NBH Bank and BOJH Trust. (2) Adjusted for acquisition-related expenses, see appendix for a reconciliation of these measures. (3) Represents a non-GAAP financial measure. See Appendix for a reconciliation of these measures. (4) Pro forma for Vista; Amounts based on September 30, 2025, and includes purchase accounting adjustments. (5) Ranking based on aggregate population growth for 2022-2027. (6) Trust & Wealth Management is operated within the Bank of Jackson Hole Trust charter. Systems integration for Vista acquisition to occur in Mid-2026. Operated with one core system and under a single bank charter(6) Positioned in Attractive Markets Corporate Summary as of February 2026 Balance Sheet Highlights as of September 30, 2025 12 banking centers ‒11 banking centers in Texas ‒1 banking center in Palm Beach, Florida ‒Florida ranked #1 best Economy in the U.S. (U.S. News 2025) 1.60% Adj. ROATA(2,3) 14.2% ROATCE(3) NBHC Standalone Q3’25 Performance 3.98% NIM (FTE) |
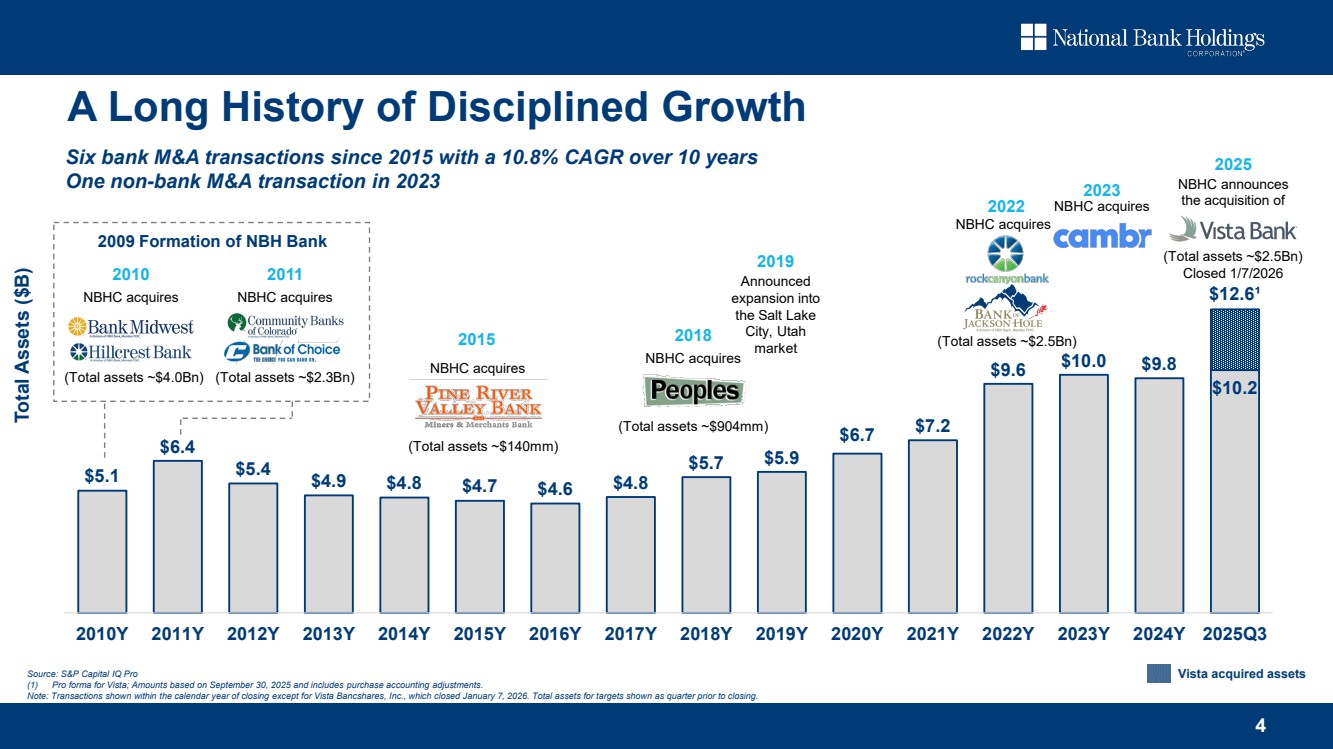
| $5.1 $6.4 $5.4 $4.9 $4.8 $4.7 $4.6 $4.8 $5.7 $5.9 $6.7 $7.2 $9.6 $10.0 $9.8 $10.2 $12.6¹ 2010Y 2011Y 2012Y 2013Y 2014Y 2015Y 2016Y 2017Y 2018Y 2019Y 2020Y 2021Y 2022Y 2023Y 2024Y 2025Q3 4 Total Assets ($B) 2025 NBHC announces the acquisition of (Total assets ~$2.5Bn) Closed 1/7/2026 2022 NBHC acquires (Total assets ~$2.5Bn) 2018 NBHC acquires (Total assets ~$904mm) 2015 NBHC acquires (Total assets ~$140mm) Six bank M&A transactions since 2015 with a 10.8% CAGR over 10 years One non-bank M&A transaction in 2023 NBHC acquires 2023 A Long History of Disciplined Growth Source: S&P Capital IQ Pro (1) Pro forma for Vista; Amounts based on September 30, 2025 and includes purchase accounting adjustments. Note: Transactions shown within the calendar year of closing except for Vista Bancshares, Inc., which closed January 7, 2026. Total assets for targets shown as quarter prior to closing. Vista acquired assets 2019 Announced expansion into the Salt Lake City, Utah market 2010 NBHC acquires (Total assets ~$4.0Bn) 2011 NBHC acquires (Total assets ~$2.3Bn) 2009 Formation of NBH Bank |
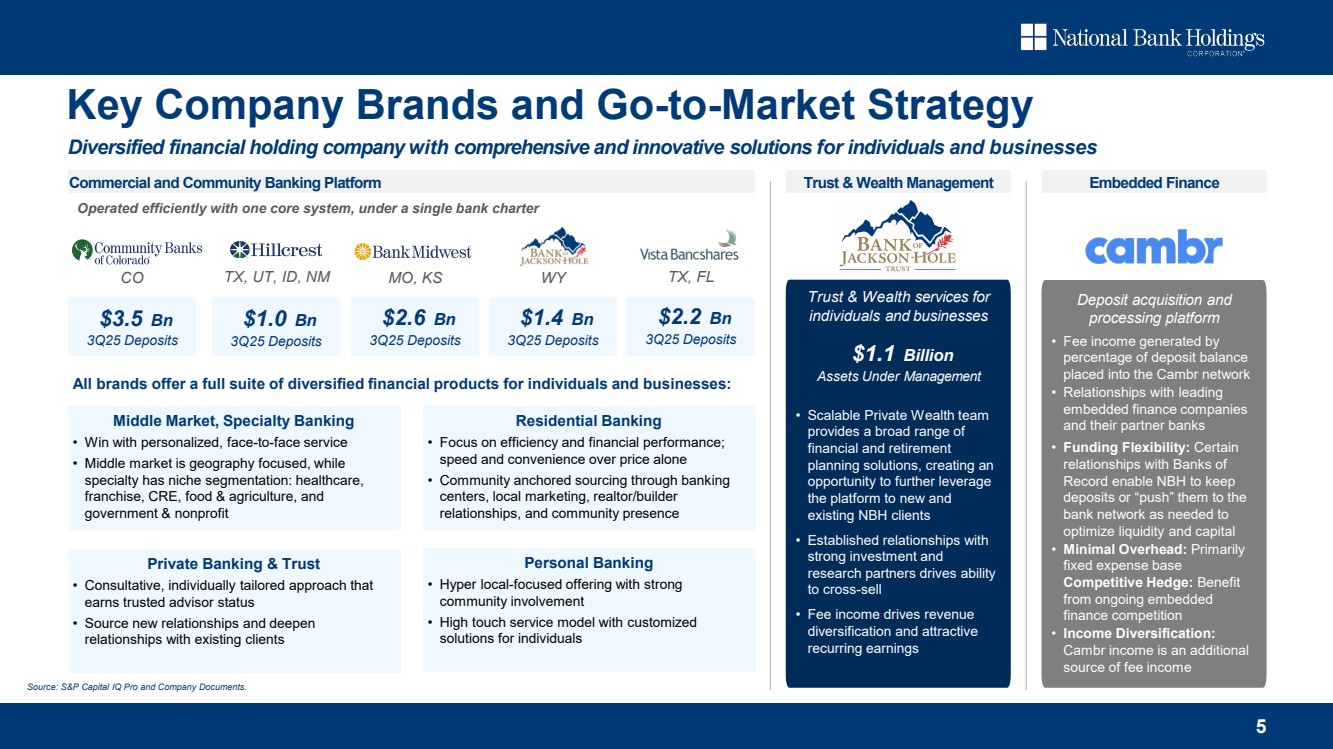
| 5 Key Company Brands and Go-to-Market Strategy Diversified financial holding company with comprehensive and innovative solutions for individuals and businesses • Scalable Private Wealth team provides a broad range of financial and retirement planning solutions, creating an opportunity to further leverage the platform to new and existing NBH clients • Established relationships with strong investment and research partners drives ability to cross-sell • Fee income drives revenue diversification and attractive recurring earnings Deposit acquisition and processing platform • Fee income generated by percentage of deposit balance placed into the Cambr network • Relationships with leading embedded finance companies and their partner banks • Funding Flexibility: Certain relationships with Banks of Record enable NBH to keep deposits or “push” them to the bank network as needed to optimize liquidity and capital • Minimal Overhead: Primarily fixed expense base Competitive Hedge: Benefit from ongoing embedded finance competition • Income Diversification: Cambr income is an additional source of fee income Trust & Wealth services for individuals and businesses $1.1 Billion Assets Under Management CO $3.5 Bn 3Q25 Deposits All brands offer a full suite of diversified financial products for individuals and businesses: Commercial and Community Banking Platform Trust & Wealth Management Embedded Finance Operated efficiently with one core system, under a single bank charter Residential Banking • Focus on efficiency and financial performance; speed and convenience over price alone • Community anchored sourcing through banking centers, local marketing, realtor/builder relationships, and community presence Middle Market, Specialty Banking • Win with personalized, face-to-face service • Middle market is geography focused, while specialty has niche segmentation: healthcare, franchise, CRE, food & agriculture, and government & nonprofit Private Banking & Trust • Consultative, individually tailored approach that earns trusted advisor status • Source new relationships and deepen relationships with existing clients Personal Banking • Hyper local-focused offering with strong community involvement • High touch service model with customized solutions for individuals Source: S&P Capital IQ Pro and Company Documents. TX, UT, ID, NM $1.0 Bn 3Q25 Deposits MO, KS $2.6 Bn 3Q25 Deposits WY $1.4 Bn 3Q25 Deposits TX, FL $2.2 Bn 3Q25 Deposits |
| John Steinmetz EVP & Managing Director of Strategic Initiatives at NBH Bank 23 years in banking 6 Experienced Management Team Tim Laney Chairman & Chief Executive Officer 44 years in banking Aldis Birkans President 27 years in financial industry Richard Newfield Chief Risk Management Officer 41 years in banking Angela Petrucci Chief Administrative Officer & General Counsel 25 years in legal and banking Nicole Van Denabeele Chief Financial Officer 22 years in financial industry Dan Sznewajs Chief Corporate Development Officer & Treasurer 22 years in financial industry |
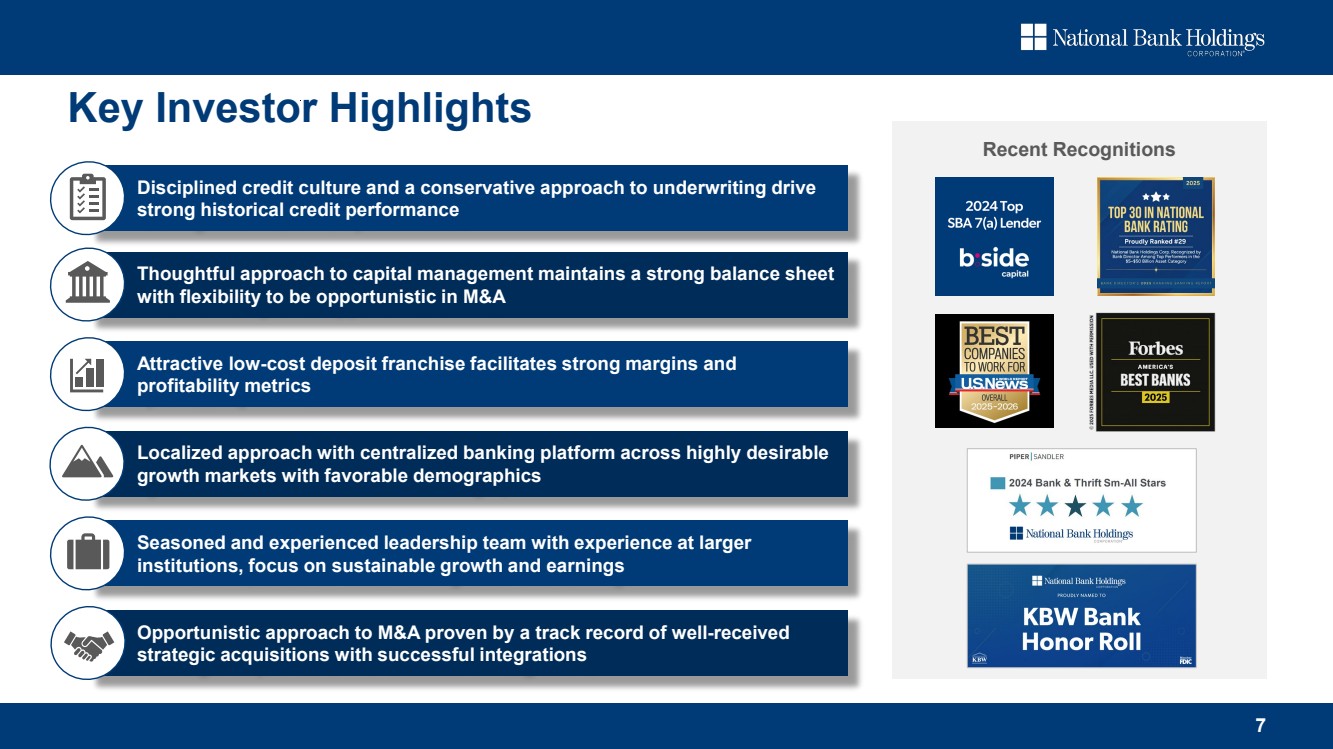
| Recent Recognitions 7 Key Investor Highlights Disciplined credit culture and a conservative approach to underwriting drive strong historical credit performance Thoughtful approach to capital management maintains a strong balance sheet with flexibility to be opportunistic in M&A Attractive low-cost deposit franchise facilitates strong margins and profitability metrics Localized approach with centralized banking platform across highly desirable growth markets with favorable demographics Seasoned and experienced leadership team with experience at larger institutions, focus on sustainable growth and earnings Opportunistic approach to M&A proven by a track record of well-received strategic acquisitions with successful integrations |
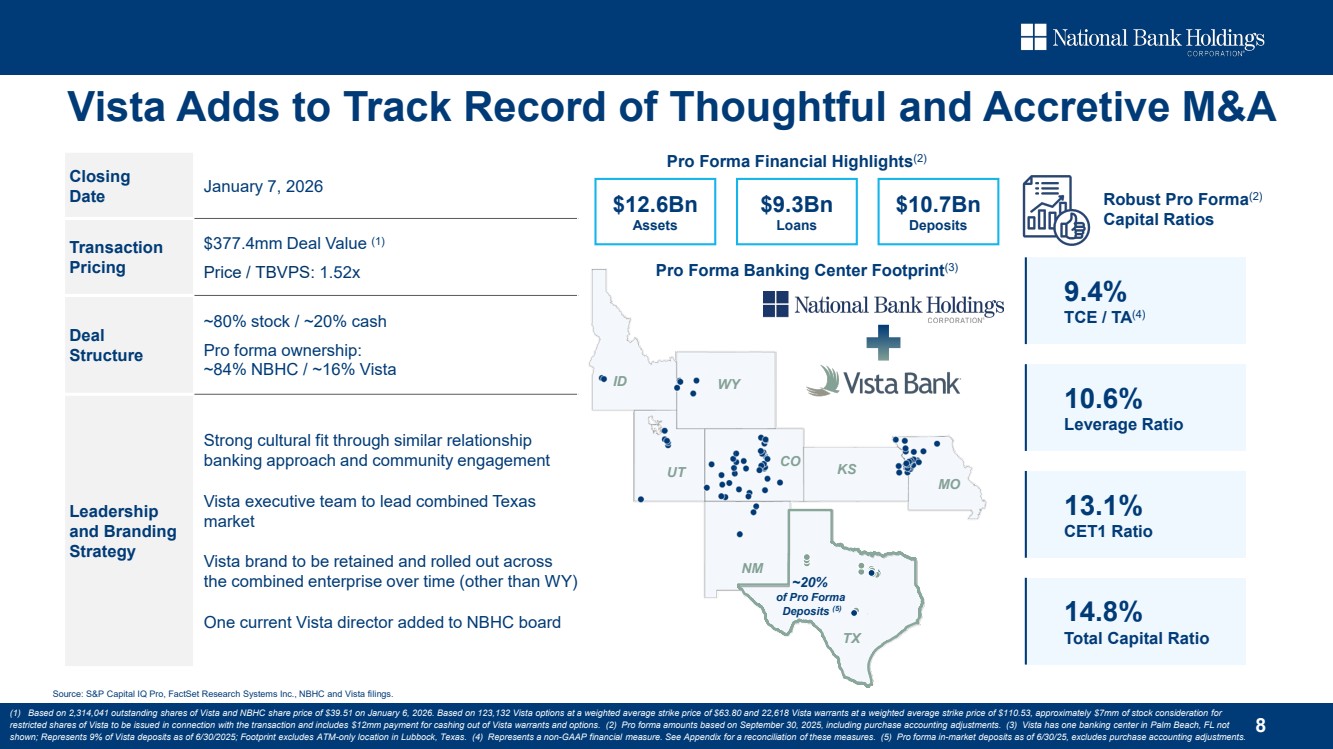
| CO UT MO TX KS NM ID WY 8 Vista Adds to Track Record of Thoughtful and Accretive M&A Pro Forma Banking Center Footprint(3) ~20% of Pro Forma Deposits (5) Closing Date January 7, 2026 Transaction Pricing $377.4mm Deal Value (1) Price / TBVPS: 1.52x Deal Structure ~80% stock / ~20% cash Pro forma ownership: ~84% NBHC / ~16% Vista Leadership and Branding Strategy Strong cultural fit through similar relationship banking approach and community engagement Vista executive team to lead combined Texas market Vista brand to be retained and rolled out across the combined enterprise over time (other than WY) One current Vista director added to NBHC board (1) Based on 2,314,041 outstanding shares of Vista and NBHC share price of $39.51 on January 6, 2026. Based on 123,132 Vista options at a weighted average strike price of $63.80 and 22,618 Vista warrants at a weighted average strike price of $110.53, approximately $7mm of stock consideration for restricted shares of Vista to be issued in connection with the transaction and includes $12mm payment for cashing out of Vista warrants and options. (2) Pro forma amounts based on September 30, 2025, including purchase accounting adjustments. (3) Vista has one banking center in Palm Beach, FL not shown; Represents 9% of Vista deposits as of 6/30/2025; Footprint excludes ATM-only location in Lubbock, Texas. (4) Represents a non-GAAP financial measure. See Appendix for a reconciliation of these measures. (5) Pro forma in-market deposits as of 6/30/25, excludes purchase accounting adjustments. Source: S&P Capital IQ Pro, FactSet Research Systems Inc., NBHC and Vista filings. Robust Pro Forma(2) Capital Ratios 9.4% TCE / TA(4) 10.6% Leverage Ratio 13.1% CET1 Ratio 14.8% Total Capital Ratio $12.6Bn Assets $9.3Bn Loans $10.7Bn Deposits Pro Forma Financial Highlights(2) |
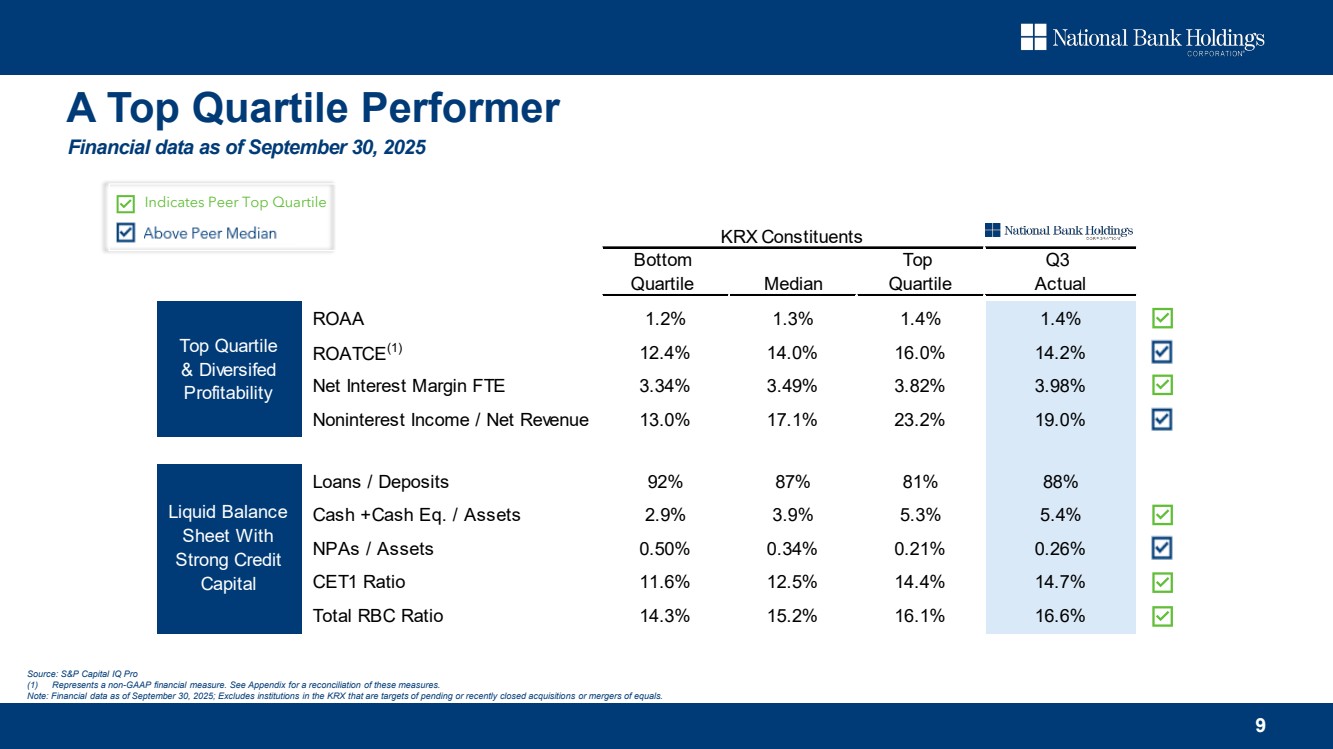
| 9 A Top Quartile Performer Indicates Peer Top Quartile Above Peer Median KRX Constituents Bottom Top Q3 Quartile Median Quartile Actual ROAA 1.2% 1.3% 1.4% 1.4% ROATCE(1) 12.4% 14.0% 16.0% 14.2% Net Interest Margin FTE 3.34% 3.49% 3.82% 3.98% Noninterest Income / Net Revenue 13.0% 17.1% 23.2% 19.0% Loans / Deposits 92% 87% 81% 88% Cash +Cash Eq. / Assets 2.9% 3.9% 5.3% 5.4% NPAs / Assets 0.50% 0.34% 0.21% 0.26% CET1 Ratio 11.6% 12.5% 14.4% 14.7% Total RBC Ratio 14.3% 15.2% 16.1% 16.6% Top Quartile & Diversifed Profitability Liquid Balance Sheet With Strong Credit Capital Source: S&P Capital IQ Pro (1) Represents a non-GAAP financial measure. See Appendix for a reconciliation of these measures. Note: Financial data as of September 30, 2025; Excludes institutions in the KRX that are targets of pending or recently closed acquisitions or mergers of equals. Financial data as of September 30, 2025 |
| Financial Performance All financial metrics reflect NBHC on a standalone basis, unless otherwise noted |
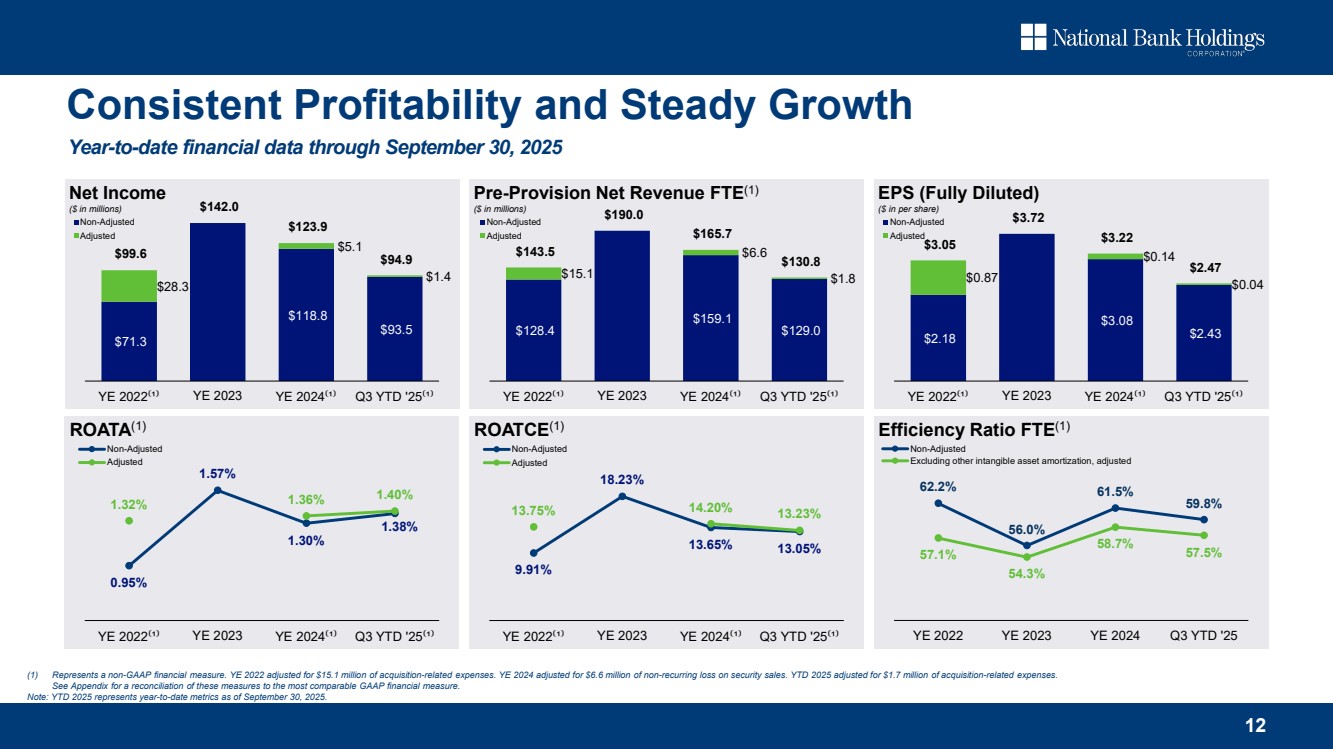
| Deposits Approximately 77% FDIC insured deposits Capital Ratios 14.69% Common Equity Tier 1 Ratio Announced the definitive agreement and plan of merger with Vista Bancshares, Inc. (“Vista”) with an approximate aggregate transaction value of $377.4 million(1). Vista operates in Dallas-Ft. Worth, Austin, and Lubbock, Texas, as well as Palm Beach, Florida. Following the recent completion of the transactions, the combined company has approximately $12.6 billion(2) in assets and $10.7 billion(2) in deposits. Quarterly adjusted net income increased $2.6 million, or 7.6%, to $36.6 million(3), or $0.96 per diluted share(3)(4) Adjusted return on average tangible assets of 1.60%(3)(4) and adjusted return on average tangible common equity of 14.72%(3)(4) The net interest margin FTE widened 11 basis points to 3.98% compared to the same period prior year Solid capital with tangible common equity to tangible assets ratio of 10.57%(4) and tier 1 leverage ratio of 11.49% Grew tangible book value per share 10.2% over prior year Cash/investment securities portfolio with an average duration of 2.9 years Generated quarterly loan fundings totaling $421.2 million, bringing total year-to-date loan fundings to $1.0 billion Executed $8.8 million of share buybacks in the third quarter Expense 60.65% efficiency ratio FTE(5) / 57.32% adjusted(3)(4)(5) ACL / Loans 1.19% Loans Loans outstanding of $7.4 billion Net Income $35.3 million / $36.6 million adjusted (3)(4) 3.98% Net interest margin FTE 11 Q3 2025 Financial Highlights Source: S&P Capital IQ Pro (1) Based on NBHC’s closing price on January 6, 2026. (2) Pro forma for Vista; Amounts based on September 30, 2025, and includes purchase accounting adjustments. (3) Adjusted for acquisition-related expenses related to the recent acquisition of Vista. (4) Represents a non-GAAP financial measure. See Appendix for a reconciliation of these measures to the most comparable GAAP financial measure. (5) Excluding other intangible asset amortization. |
| 12 Consistent Profitability and Steady Growth (1) Represents a non-GAAP financial measure. YE 2022 adjusted for $15.1 million of acquisition-related expenses. YE 2024 adjusted for $6.6 million of non-recurring loss on security sales. YTD 2025 adjusted for $1.7 million of acquisition-related expenses. See Appendix for a reconciliation of these measures to the most comparable GAAP financial measure. Note: YTD 2025 represents year-to-date metrics as of September 30, 2025. Year-to-date financial data through September 30, 2025 $71.3 $118.8 $93.5 $28.3 $5.1 $1.4 $99.6 $142.0 $123.9 $94.9 YE 2022⁽¹⁾ YE 2023 YE 2024⁽¹⁾ Q3 YTD '25⁽¹⁾ Net Income ($ in millions) Non-Adjusted Adjusted $128.4 $159.1 $129.0 $15.1 $6.6 $1.8 $143.5 $190.0 $165.7 $130.8 YE 2022⁽¹⁾ YE 2023 YE 2024⁽¹⁾ Q3 YTD '25⁽¹⁾ Pre-Provision Net Revenue FTE(1) ($ in millions) Non-Adjusted Adjusted $2.18 $3.08 $2.43 $0.87 $0.14 $0.04 $3.05 $3.72 $3.22 $2.47 YE 2022⁽¹⁾ YE 2023 YE 2024⁽¹⁾ Q3 YTD '25⁽¹⁾ EPS (Fully Diluted) ($ in per share) Non-Adjusted Adjusted 0.95% 1.57% 1.30% 1.38% 1.32% 1.36% 1.40% YE 2022⁽¹⁾ YE 2023 YE 2024⁽¹⁾ Q3 YTD '25⁽¹⁾ ROATA(1) Non-Adjusted Adjusted 9.91% 18.23% 13.65% 13.05% 13.75% 14.20% 13.23% YE 2022⁽¹⁾ YE 2023 YE 2024⁽¹⁾ Q3 YTD '25⁽¹⁾ ROATCE(1) Non-Adjusted Adjusted 62.2% 56.0% 61.5% 59.8% 57.1% 54.3% 58.7% 57.5% YE 2022 YE 2023 YE 2024 Q3 YTD '25 Efficiency Ratio FTE(1) Non-Adjusted Excluding other intangible asset amortization, adjusted |
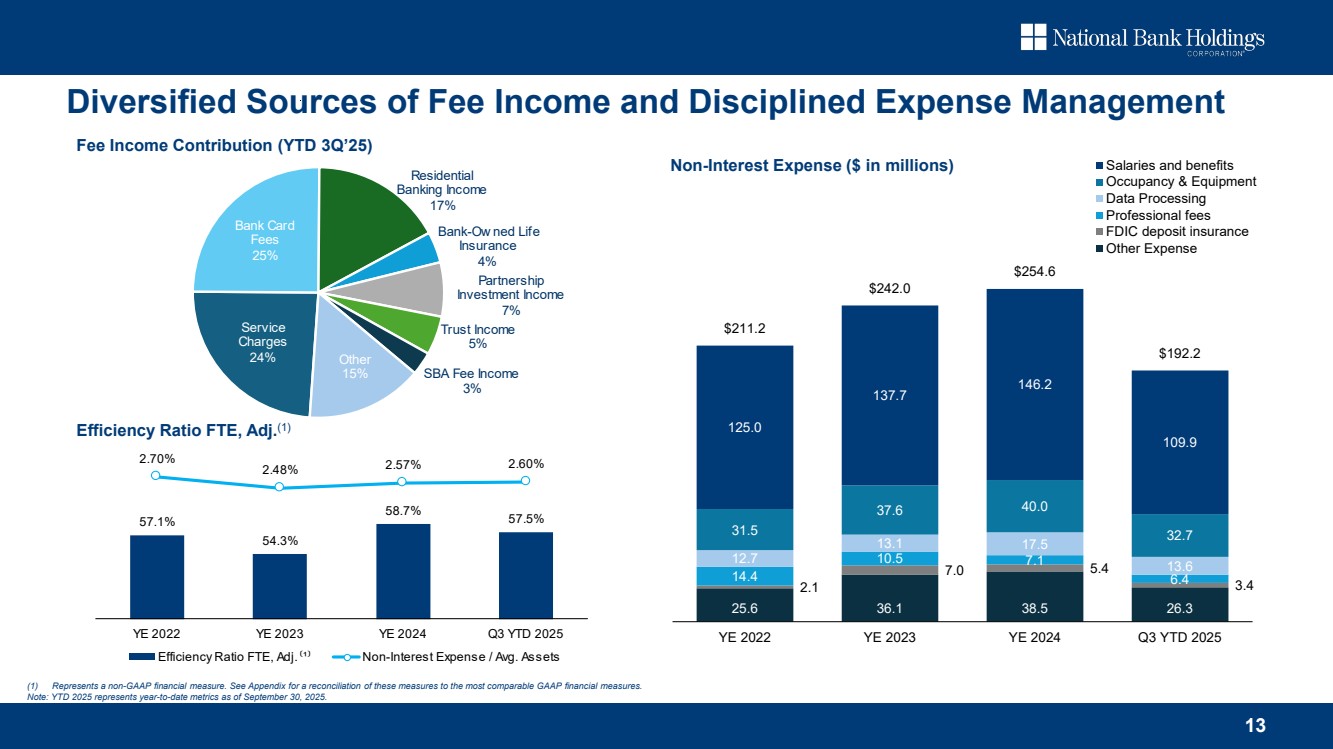
| 25.6 36.1 38.5 26.3 2.1 7.0 5.4 3.4 14.4 10.5 7.1 6.4 12.7 13.1 17.5 13.6 31.5 37.6 40.0 32.7 125.0 137.7 146.2 109.9 $211.2 $242.0 $254.6 $192.2 YE 2022 YE 2023 YE 2024 Q3 YTD 2025 Salaries and benefits Occupancy & Equipment Data Processing Professional fees FDIC deposit insurance Other Expense Service Charges 24% Bank Card Fees 25% Residential Banking Income 17% Bank-Ow ned Life Insurance 4% Partnership Investment Income 7% Trust Income 5% SBA Fee Income 3% Other 15% 13 Diversified Sources of Fee Income and Disciplined Expense Management Non-Interest Expense ($ in millions) 57.1% 54.3% 58.7% 57.5% 2.70% 2.48% 2.57% 2.60% 0 . 0 0 % 0 . 5 0 % 1 . 0 0 % 1 . 5 0 % 2 . 0 0 % 2 . 5 0 % 3 . 0 0 % 4 5 . 0 % 5 0 . 0 % 5 5 . 0 % 6 0 . 0 % 6 5 . 0 % 7 0 . 0 % YE 2022 YE 2023 YE 2024 Q3 YTD 2025 Efficiency Ratio FTE, Adj.⁽¹⁾ Non-Interest Expense / Avg. Assets Fee Income Contribution (YTD 3Q’25) Efficiency Ratio FTE, Adj.(1) (1) Represents a non-GAAP financial measure. See Appendix for a reconciliation of these measures to the most comparable GAAP financial measures. Note: YTD 2025 represents year-to-date metrics as of September 30, 2025. |
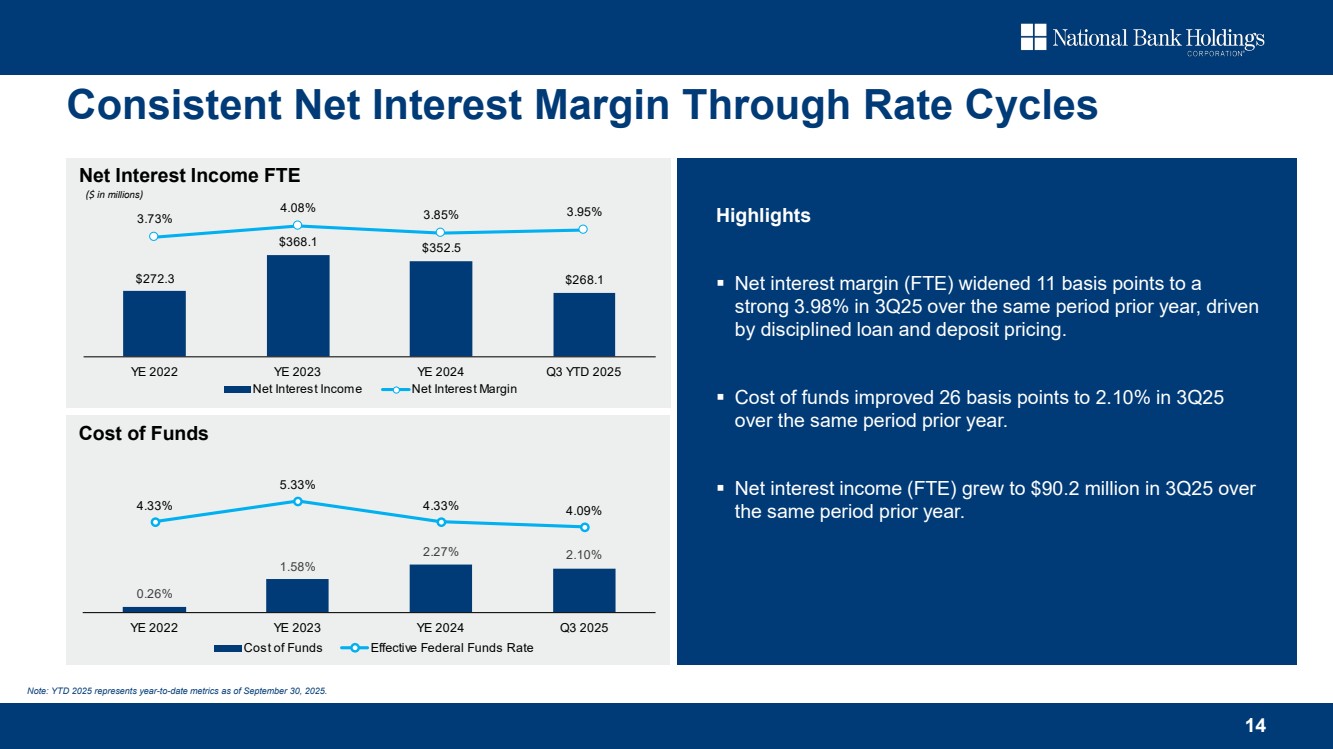
| Highlights Net interest margin (FTE) widened 11 basis points to a strong 3.98% in 3Q25 over the same period prior year, driven by disciplined loan and deposit pricing. Cost of funds improved 26 basis points to 2.10% in 3Q25 over the same period prior year. Net interest income (FTE) grew to $90.2 million in 3Q25 over the same period prior year. $272.3 $368.1 $352.5 $268.1 3.73% 4.08% 3.85% 3.95% 0 . 0 0 % 0 . 5 0 % 1 . 0 0 % 1 . 5 0 % 2 . 0 0 % 2 . 5 0 % 3 . 0 0 % 3 . 5 0 % 4 . 0 0 % $ 100 . 0 $ 150 . 0 $ 200 . 0 $ 250 . 0 $ 300 . 0 $ 350 . 0 $ 400 . 0 $ 450 . 0 YE 2022 YE 2023 YE 2024 Q3 YTD 2025 Net Interest Income Net Interest Margin 14 Net Interest Income FTE ($ in millions) 0.26% 1.58% 2.27% 2.10% 4.33% 5.33% 4.33% 4.09% YE 2022 YE 2023 YE 2024 Q3 2025 Cost of Funds Effective Federal Funds Rate Cost of Funds Consistent Net Interest Margin Through Rate Cycles Note: YTD 2025 represents year-to-date metrics as of September 30, 2025. |
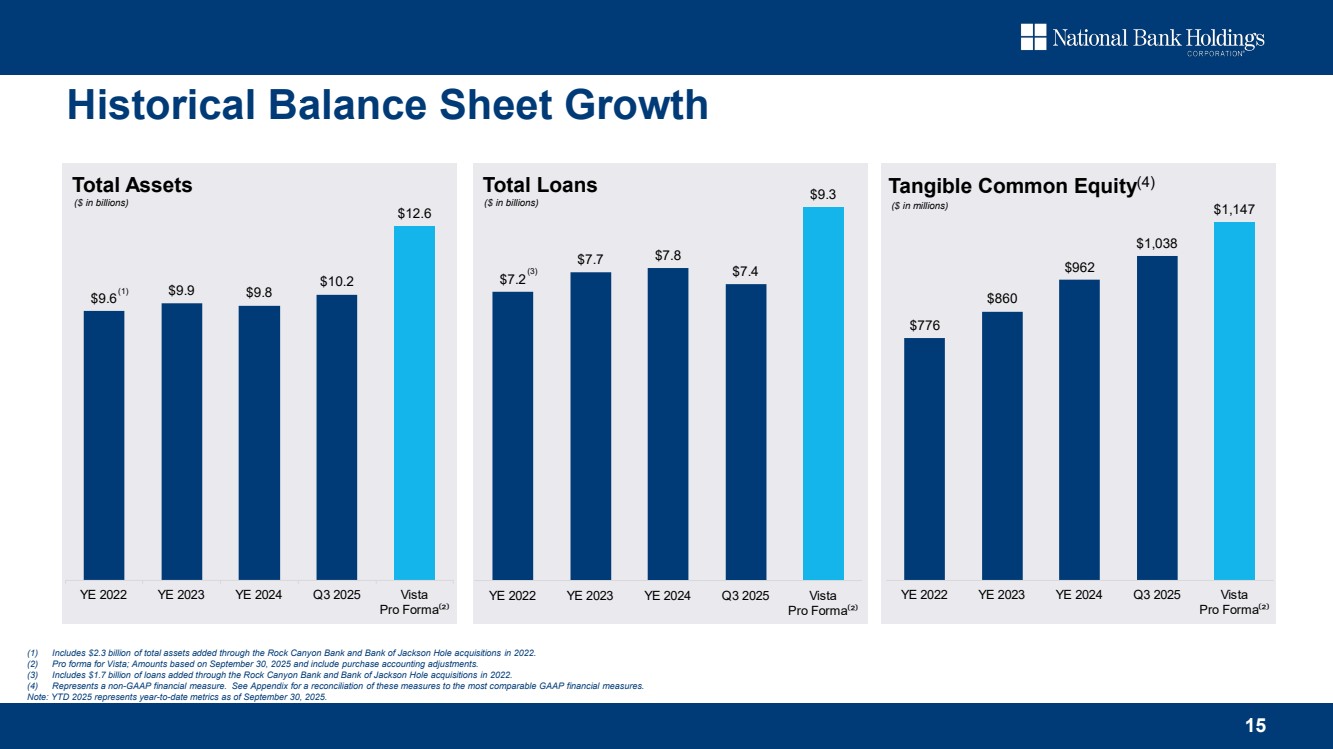
| 15 Historical Balance Sheet Growth $9.6 $9.9 $9.8 $10.2 $12.6 YE 2022 YE 2023 YE 2024 Q3 2025 Vista Pro Forma⁽²⁾ ($ in billions) ($ in billions) (1) (1) Includes $2.3 billion of total assets added through the Rock Canyon Bank and Bank of Jackson Hole acquisitions in 2022. (2) Pro forma for Vista; Amounts based on September 30, 2025 and include purchase accounting adjustments. (3) Includes $1.7 billion of loans added through the Rock Canyon Bank and Bank of Jackson Hole acquisitions in 2022. (4) Represents a non-GAAP financial measure. See Appendix for a reconciliation of these measures to the most comparable GAAP financial measures. Note: YTD 2025 represents year-to-date metrics as of September 30, 2025. Total Assets $7.2 $7.7 $7.8 $7.4 $9.3 YE 2022 YE 2023 YE 2024 Q3 2025 Vista Pro Forma⁽²⁾ Total Loans (3) $776 $860 $962 $1,038 $1,147 YE 2022 YE 2023 YE 2024 Q3 2025 Vista Pro Forma⁽²⁾ Tangible Common Equity(4) ($ in millions) |
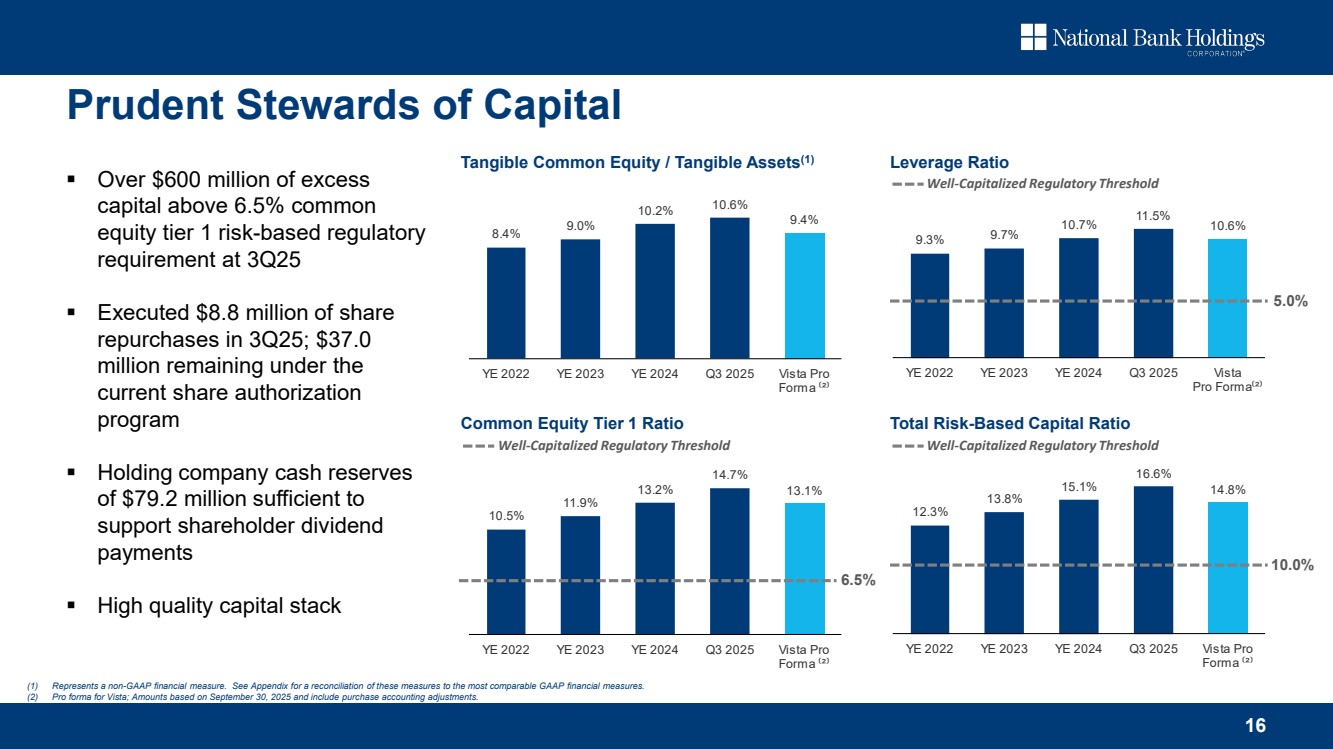
| 8.4% 9.0% 10.2% 10.6% 9.4% YE 2022 YE 2023 YE 2024 Q3 2025 Vista Pro Forma ⁽²⁾ 16 Over $600 million of excess capital above 6.5% common equity tier 1 risk-based regulatory requirement at 3Q25 Executed $8.8 million of share repurchases in 3Q25; $37.0 million remaining under the current share authorization program Holding company cash reserves of $79.2 million sufficient to support shareholder dividend payments High quality capital stack Prudent Stewards of Capital (1) Represents a non-GAAP financial measure. See Appendix for a reconciliation of these measures to the most comparable GAAP financial measures. (2) Pro forma for Vista; Amounts based on September 30, 2025 and include purchase accounting adjustments. Tangible Common Equity / Tangible Assets(1) Leverage Ratio Common Equity Tier 1 Ratio Total Risk-Based Capital Ratio 10.5% 11.9% 13.2% 14.7% 13.1% YE 2022 YE 2023 YE 2024 Q3 2025 Vista Pro Forma ⁽²⁾ 9.3% 9.7% 10.7% 11.5% 10.6% YE 2022 YE 2023 YE 2024 Q3 2025 Vista Pro Forma⁽²⁾ 12.3% 13.8% 15.1% 16.6% 14.8% YE 2022 YE 2023 YE 2024 Q3 2025 Vista Pro Forma ⁽²⁾ 5.0% Well-Capitalized Regulatory Threshold 10.0% 6.5% Well-Capitalized Regulatory Threshold Well-Capitalized Regulatory Threshold |
| Credit |

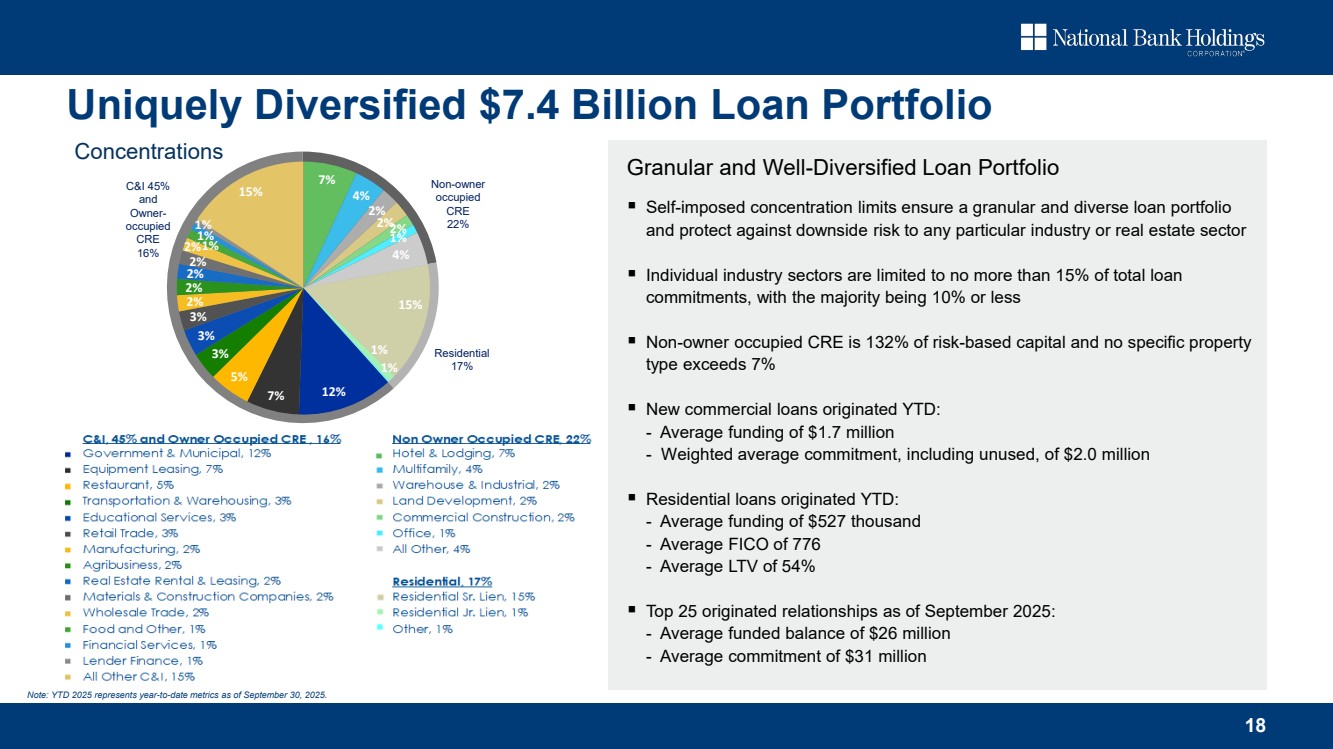
| 18 Concentrations 3% 4% Residential 17% Non-owner occupied CRE 22% C&I 45% and Owner-occupied CRE 16% 7% 4% 2% 2%2% 1% 4% 15% 1% 1% 7% 12% 5% 3% 3% 3% 2% 2% 2% 2% 2%1% 1% 1% 15% Uniquely Diversified $7.4 Billion Loan Portfolio Note: YTD 2025 represents year-to-date metrics as of September 30, 2025. Self-imposed concentration limits ensure a granular and diverse loan portfolio and protect against downside risk to any particular industry or real estate sector Individual industry sectors are limited to no more than 15% of total loan commitments, with the majority being 10% or less Non-owner occupied CRE is 132% of risk-based capital and no specific property type exceeds 7% New commercial loans originated YTD: - Average funding of $1.7 million - Weighted average commitment, including unused, of $2.0 million Residential loans originated YTD: - Average funding of $527 thousand - Average FICO of 776 - Average LTV of 54% Top 25 originated relationships as of September 2025: - Average funded balance of $26 million - Average commitment of $31 million Granular and Well-Diversified Loan Portfolio |
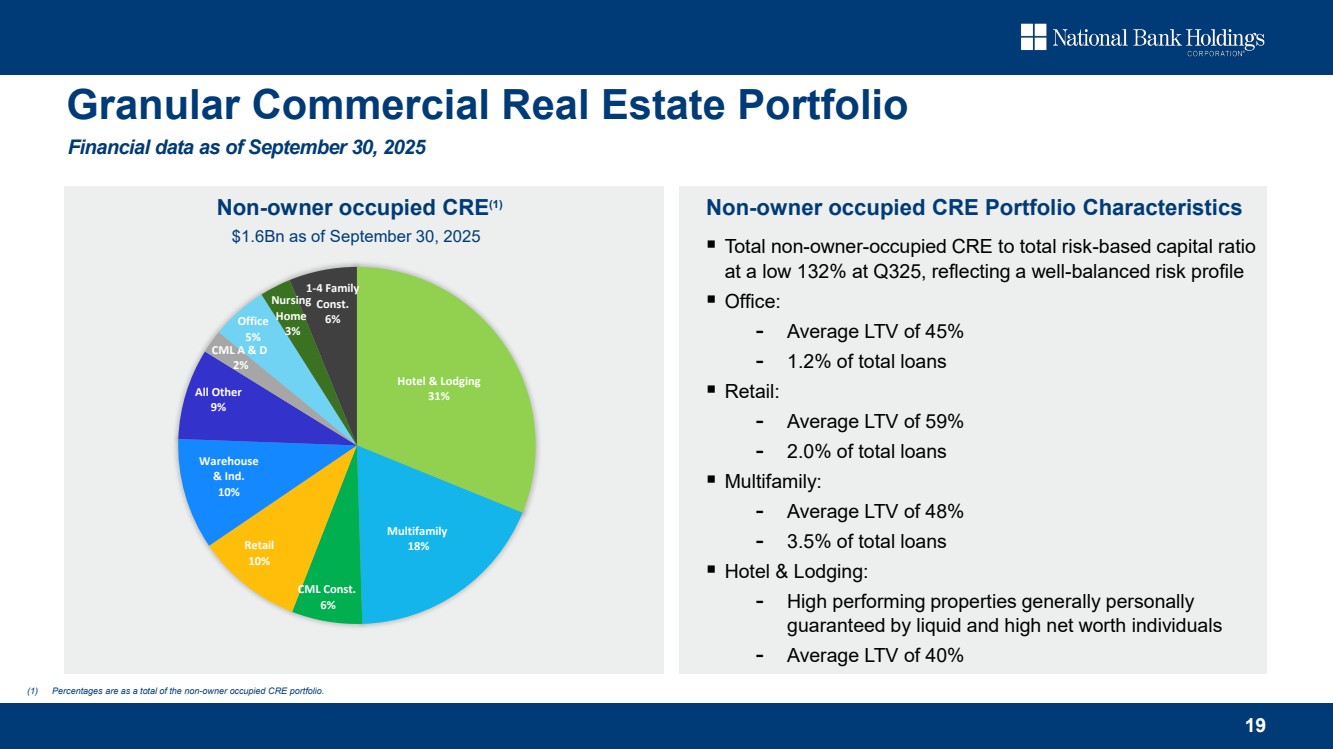
| 19 Hotel & Lodging 31% Multifamily 18% CML Const. 6% Retail 10% Warehouse & Ind. 10% All Other 9% CML A & D 2% Office 5% Nursing Home 3% 1-4 Family Const. 6% Total non-owner-occupied CRE to total risk-based capital ratio at a low 132% at Q325, reflecting a well-balanced risk profile Office: - Average LTV of 45% - 1.2% of total loans Retail: - Average LTV of 59% - 2.0% of total loans Multifamily: - Average LTV of 48% - 3.5% of total loans Hotel & Lodging: - High performing properties generally personally guaranteed by liquid and high net worth individuals - Average LTV of 40% Non-owner occupied CRE(1) Non-owner occupied CRE Portfolio Characteristics Granular Commercial Real Estate Portfolio (1) Percentages are as a total of the non-owner occupied CRE portfolio. Financial data as of September 30, 2025 $1.6Bn as of September 30, 2025 |
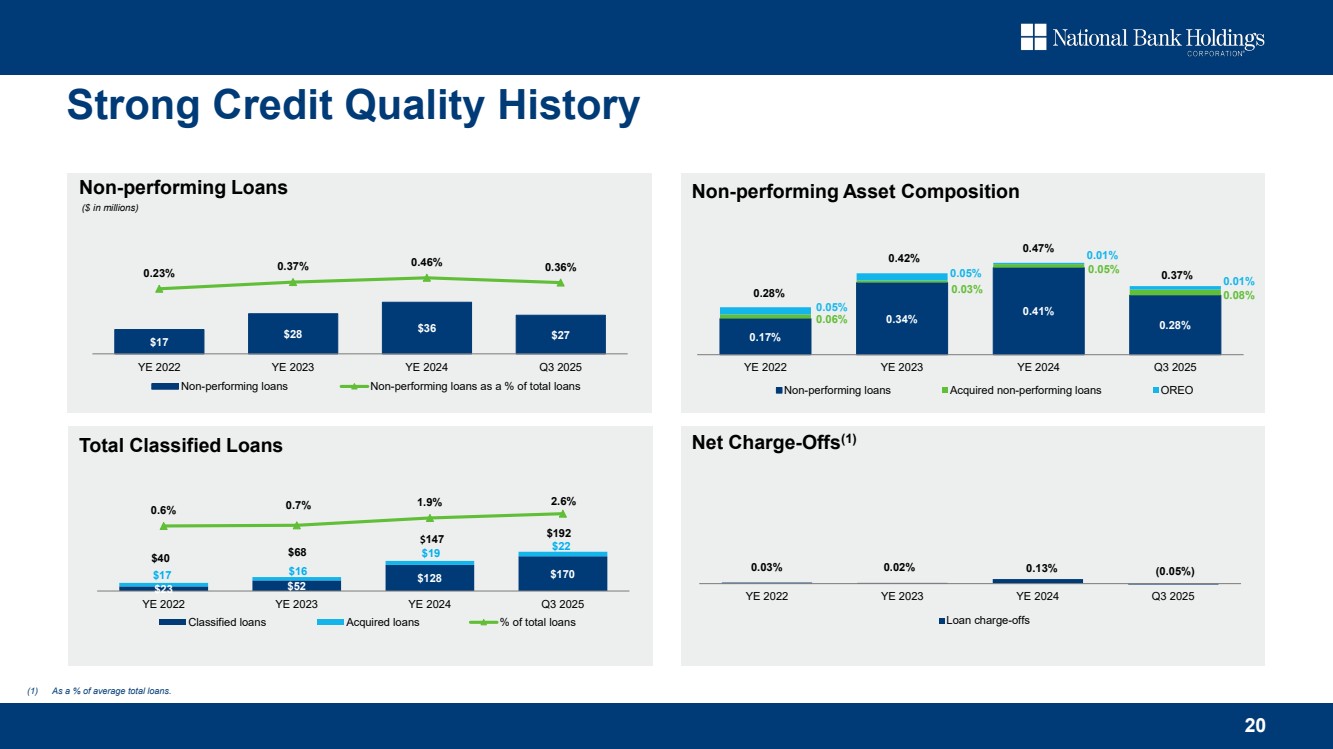
| 20 Strong Credit Quality History 0.03% 0.02% 0.13% YE 2022 YE 2023 YE 2024 Q3 2025 Loan charge-offs 0.17% 0.34% 0.41% 0.28% 0.06% 0.03% 0.05% 0.08% 0.05% 0.05% 0.01% 0.01% YE 2022 YE 2023 YE 2024 Q3 2025 Non-performing loans Acquired non-performing loans OREO 0.37% Non-performing Loans Non-performing Asset Composition Net Charge-Offs(1) Total Classified Loans 0.28% $17 $28 $36 $27 0.23% 0.37% 0.46% 0.36% YE 2022 YE 2023 YE 2024 Q3 2025 Non-performing loans Non-performing loans as a % of total loans 0.42% 0.47% $23 $52 $128 $17 $170 $16 $19 $22 0.6% 0.7% 1.9% 2.6% YE 2022 YE 2023 YE 2024 Q3 2025 Classified loans Acquired loans % of total loans $147 $192 $40 $68 ($ in millions) (0.05%) (1) As a % of average total loans. |
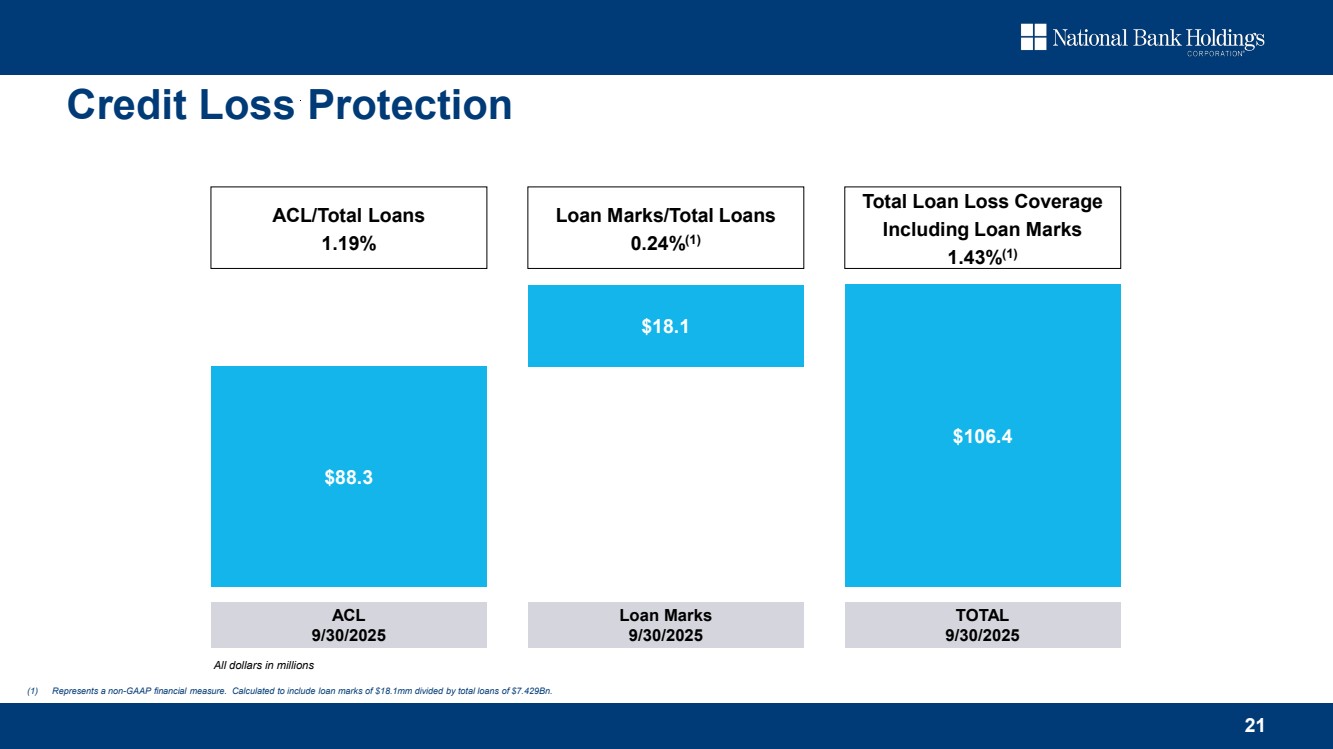
| 21 $88.3 Total Loan Loss Coverage Including Loan Marks 1.43%(1) ACL/Total Loans 1.19% Loan Marks/Total Loans 0.24%(1) $18.1 $106.4 All dollars in millions ACL 9/30/2025 Loan Marks 9/30/2025 TOTAL 9/30/2025 Credit Loss Protection (1) Represents a non-GAAP financial measure. Calculated to include loan marks of $18.1mm divided by total loans of $7.429Bn. |
| Balance Sheet |

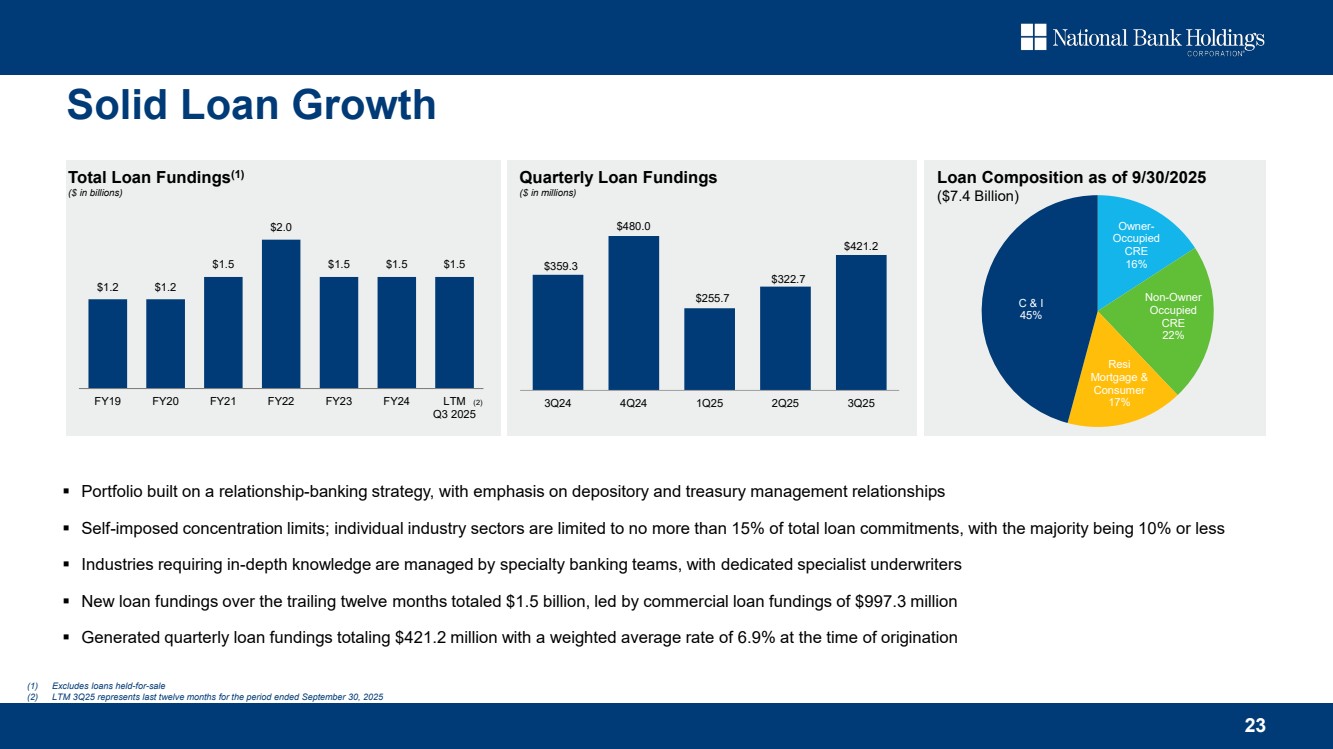
| 23 Solid Loan Growth Portfolio built on a relationship-banking strategy, with emphasis on depository and treasury management relationships Self-imposed concentration limits; individual industry sectors are limited to no more than 15% of total loan commitments, with the majority being 10% or less Industries requiring in-depth knowledge are managed by specialty banking teams, with dedicated specialist underwriters New loan fundings over the trailing twelve months totaled $1.5 billion, led by commercial loan fundings of $997.3 million Generated quarterly loan fundings totaling $421.2 million with a weighted average rate of 6.9% at the time of origination $1.2 $1.2 $1.5 $2.0 $1.5 $1.5 $1.5 FY19 FY20 FY21 FY22 FY23 FY24 LTM Q3 2025 (2) Owner-Occupied CRE 16% Non-Owner Occupied CRE 22% Resi Mortgage & Consumer 17% C & I 45% Loan Composition as of 9/30/2025 ($7.4 Billion) Quarterly Loan Fundings ($ in millions) Total Loan Fundings(1) ($ in billions) $359.3 $480.0 $255.7 $322.7 $421.2 3Q24 4Q24 1Q25 2Q25 3Q25 (1) Excludes loans held-for-sale (2) LTM 3Q25 represents last twelve months for the period ended September 30, 2025 |
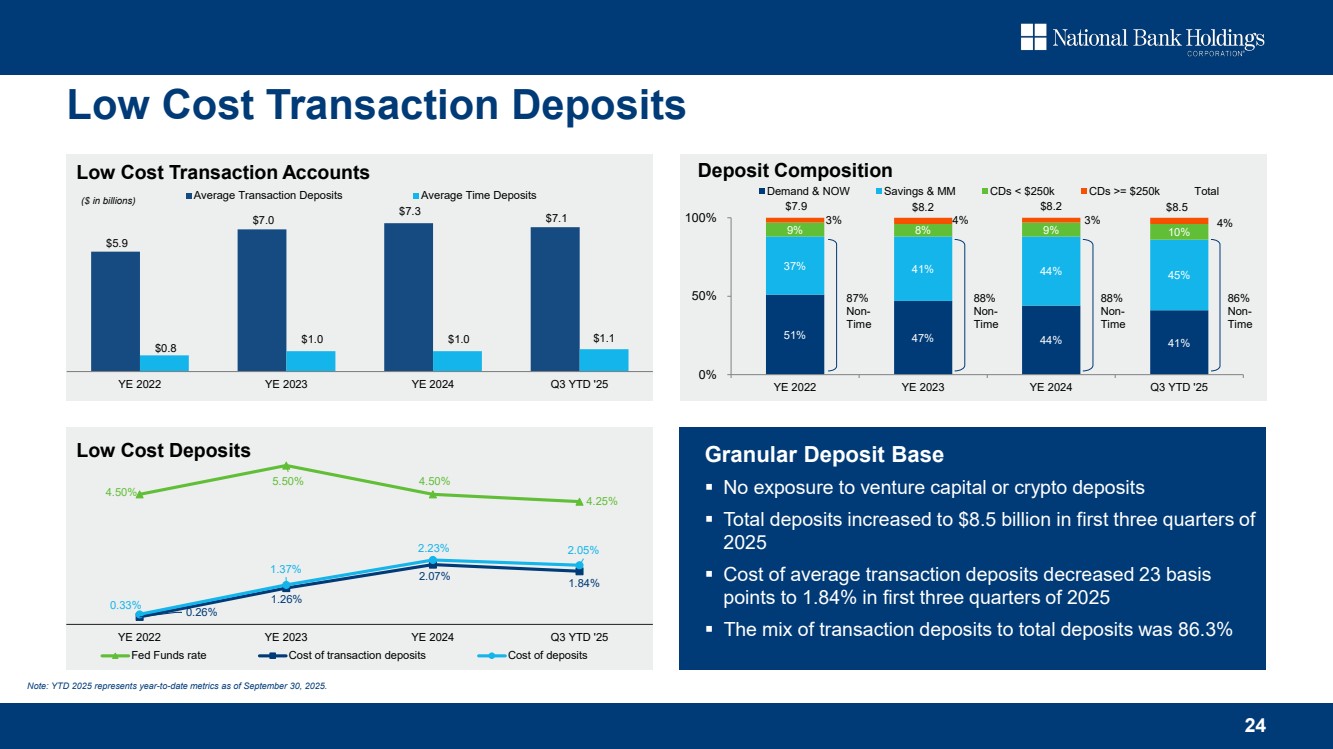
| Granular Deposit Base No exposure to venture capital or crypto deposits Total deposits increased to $8.5 billion during 2025 Cost of average transaction deposits decreased 23 basis points to 1.84% during 2025 The mix of transaction deposits to total deposits was 86.3% 24 Low Cost Transaction Deposits Granular Deposit Base No exposure to venture capital or crypto deposits Total deposits increased to $8.5 billion in first three quarters of 2025 Cost of average transaction deposits decreased 23 basis points to 1.84% in first three quarters of 2025 The mix of transaction deposits to total deposits was 86.3% Low Cost Deposits $5.9 $7.0 $7.3 $7.1 $0.8 $1.0 $1.0 $1.1 YE 2022 YE 2023 YE 2024 Q3 YTD '25 Average Transaction Deposits Average Time Deposits 51% 47% 44% 41% 37% 41% 44% 45% 9% 8% 9% 10% 3% 4% 3% 4% $7.9 $8.2 $8.2 $8.5 0% 50% 100% YE 2022 YE 2023 YE 2024 Q3 YTD '25 Demand & NOW Savings & MM CDs < $250k CDs >= $250k Total 87% Non-Time 88% Non-Time 88% Non-Time 86% Non-Time 4.50% 5.50% 4.50% 4.25% 0.26% 1.26% 2.07% 1.84% 0.33% 1.37% 2.23% 2.05% YE 2022 YE 2023 YE 2024 Q3 YTD '25 Fed Funds rate Cost of transaction deposits Cost of deposits Low Cost Transaction Accounts Deposit Composition ($ in billions) Note: YTD 2025 represents year-to-date metrics as of September 30, 2025. |
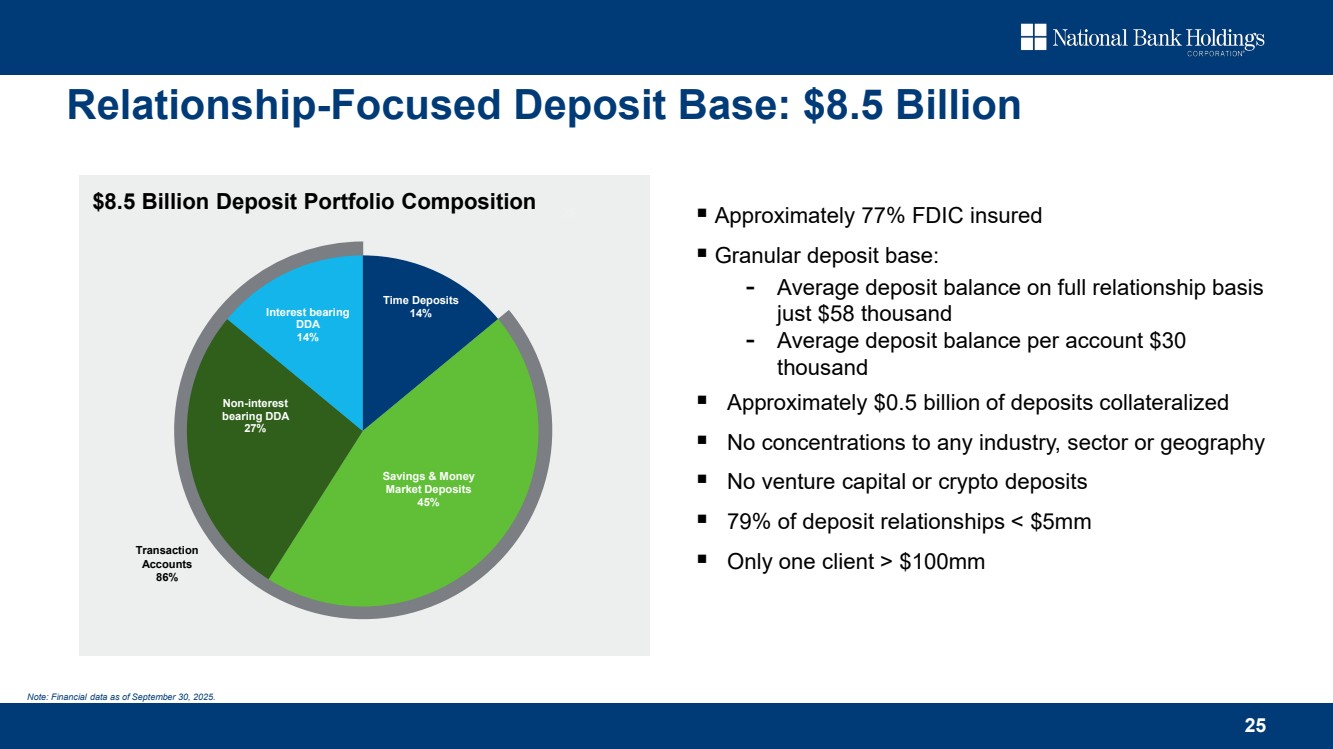
| 25 Approximately 77% FDIC insured Granular deposit base: - Average deposit balance on full relationship basis just $58 thousand - Average deposit balance per account $30 thousand Approximately $0.5 billion of deposits collateralized No concentrations to any industry, sector or geography No venture capital or crypto deposits 79% of deposit relationships < $5mm Only one client > $100mm 3% $8.5 Billion Deposit Portfolio Composition 4% Time Deposits 14% Savings & Money Market Deposits 45% Non-interest bearing DDA 27% Interest bearing DDA 14% Transaction Accounts 86% Relationship-Focused Deposit Base: $8.5 Billion Note: Financial data as of September 30, 2025. |
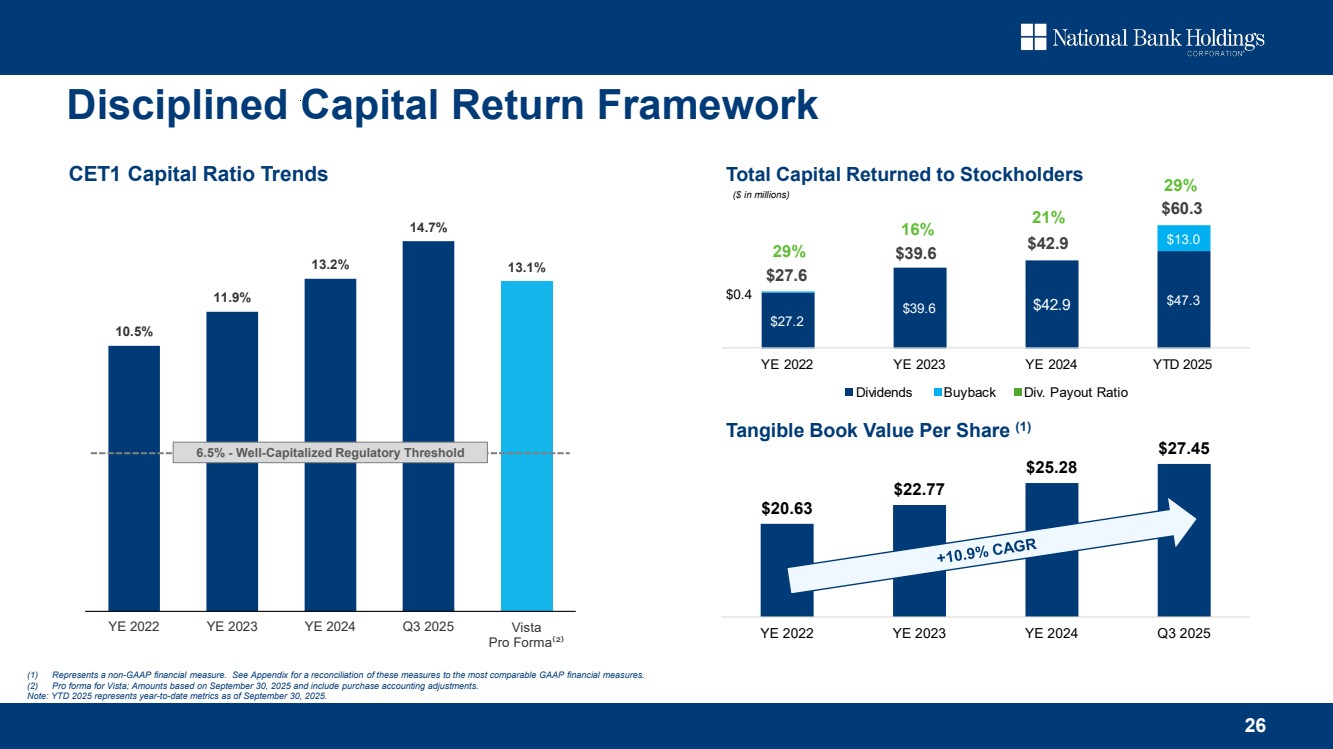
| $27.2 $39.6 $42.9 $47.3 $0.4 $13.0 YE 2022 YE 2023 YE 2024 YTD 2025 Dividends Buyback Div. Payout Ratio 26 $60.3 Disciplined Capital Return Framework $27.6 CET1 Capital Ratio Trends Total Capital Returned to Stockholders Tangible Book Value Per Share (1) $20.63 $22.77 $25.28 $27.45 YE 2022 YE 2023 YE 2024 Q3 2025 (1) Represents a non-GAAP financial measure. See Appendix for a reconciliation of these measures to the most comparable GAAP financial measures. (2) Pro forma for Vista; Amounts based on September 30, 2025 and include purchase accounting adjustments. Note: YTD 2025 represents year-to-date metrics as of September 30, 2025. ($ in millions) 29% 16% 21% 29% 10.5% 11.9% 13.2% 14.7% 13.1% YE 2022 YE 2023 YE 2024 Q3 2025 Vista Pro Forma⁽²⁾ 6.5% - Well-Capitalized Regulatory Threshold $42.9 $39.6 |
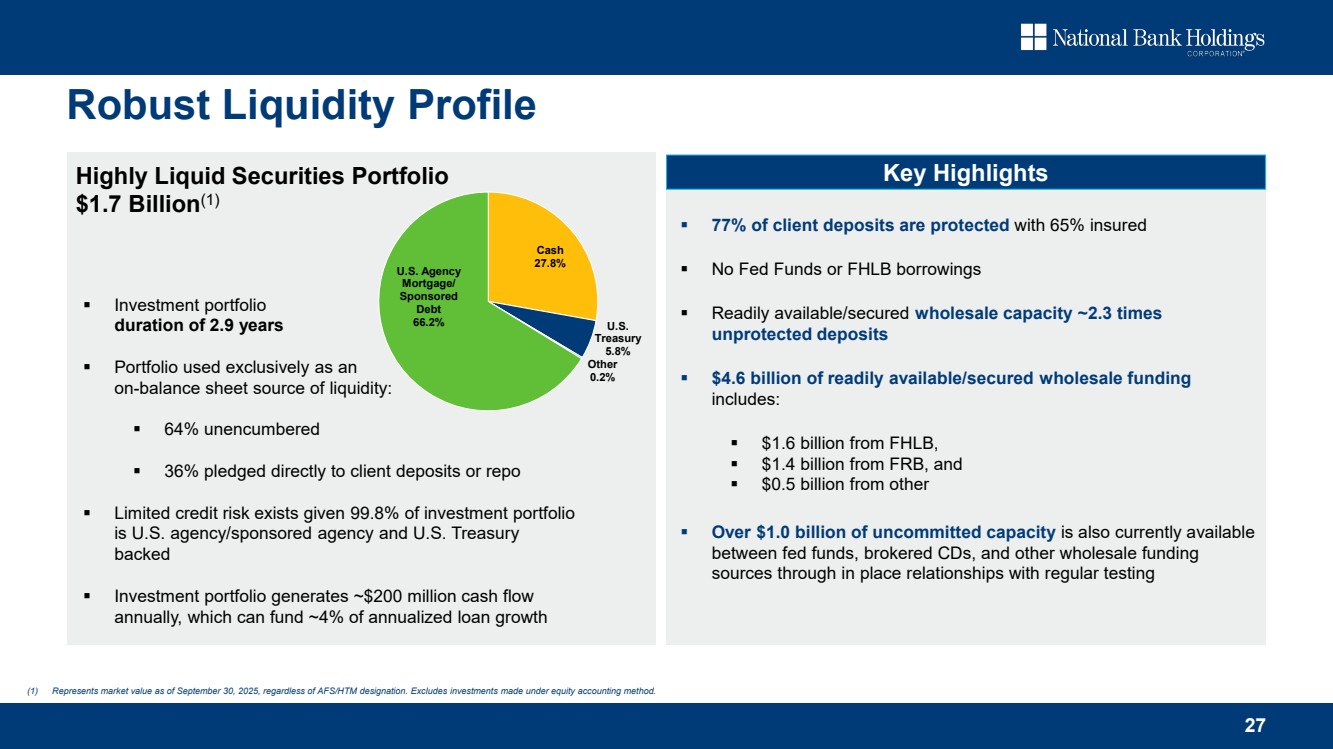
| Cash 27.8% U.S. Treasury 5.8% Other 0.2% U.S. Agency Mortgage/ Sponsored Debt 66.2% 27 Highly Liquid Securities Portfolio $1.7 Billion(1) Investment portfolio duration of 2.9 years Portfolio used exclusively as an on-balance sheet source of liquidity: 64% unencumbered 36% pledged directly to client deposits or repo Limited credit risk exists given 99.8% of investment portfolio is U.S. agency/sponsored agency and U.S. Treasury backed Investment portfolio generates ~$200 million cash flow annually, which can fund ~4% of annualized loan growth Robust Liquidity Profile (1) Represents market value as of September 30, 2025, regardless of AFS/HTM designation. Excludes investments made under equity accounting method. 77% of client deposits are protected with 65% insured No Fed Funds or FHLB borrowings Readily available/secured wholesale capacity ~2.3 times unprotected deposits $4.6 billion of readily available/secured wholesale funding includes: $1.6 billion from FHLB, $1.4 billion from FRB, and $0.5 billion from other Over $1.0 billion of uncommitted capacity is also currently available between fed funds, brokered CDs, and other wholesale funding sources through in place relationships with regular testing Key Highlights |
| Appendix |

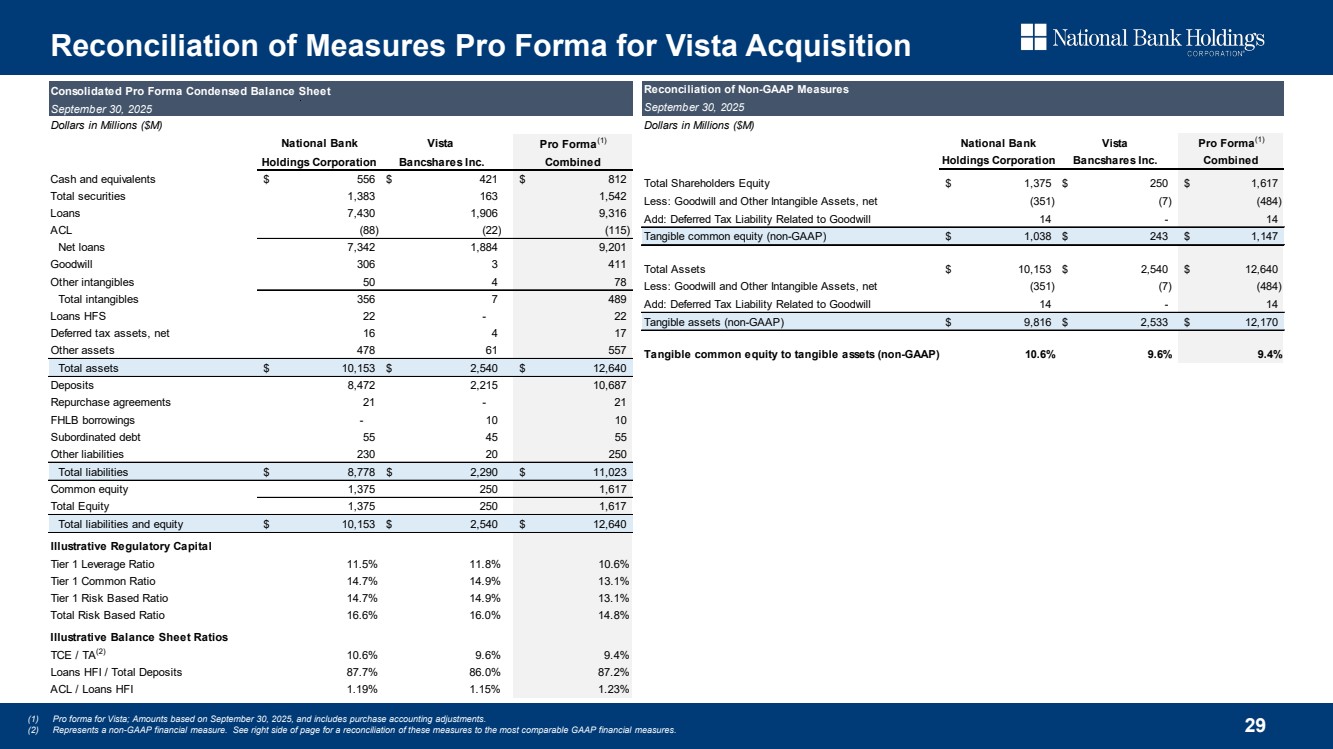
| 29 Reconciliation of Measures Pro Forma for Vista Acquisition (1) Pro forma for Vista; Amounts based on September 30, 2025, and includes purchase accounting adjustments. (2) Represents a non-GAAP financial measure. See right side of page for a reconciliation of these measures to the most comparable GAAP financial measures. Dollars in Millions ($M) National Bank Vista Pro Forma(1) Holdings Corporation Bancshares Inc. Combined Cash and equivalents $ 556 $ 421 $ 812 Total securities 1,383 163 1,542 Loans 7,430 1,906 9,316 ACL (88) (22) (115) Net loans 7,342 1,884 9,201 Goodwill 306 3 411 Other intangibles 50 4 78 Total intangibles 356 7 489 Loans HFS 22 - 22 Deferred tax assets, net 16 4 17 Other assets 478 61 557 Total assets $ 10,153 $ 2,540 $ 12,640 Deposits 8,472 2,215 10,687 Repurchase agreements 21 - 21 FHLB borrowings - 10 10 Subordinated debt 55 45 55 Other liabilities 230 20 250 Total liabilities $ 8,778 $ 2,290 $ 11,023 Common equity 1,375 250 1,617 Total Equity 1,375 250 1,617 Total liabilities and equity $ 10,153 $ 2,540 $ 12,640 Illustrative Regulatory Capital Tier 1 Leverage Ratio 11.5% 11.8% 10.6% Tier 1 Common Ratio 14.7% 14.9% 13.1% Tier 1 Risk Based Ratio 14.7% 14.9% 13.1% Total Risk Based Ratio 16.6% 16.0% 14.8% Illustrative Balance Sheet Ratios TCE / TA(2) 10.6% 9.6% 9.4% Loans HFI / Total Deposits 87.7% 86.0% 87.2% ACL / Loans HFI 1.19% 1.15% 1.23% Consolidated Pro Forma Condensed Balance Sheet September 30, 2025 Dollars in Millions ($M) National Bank Vista Pro Forma(1) Holdings Corporation Bancshares Inc. Combined Total Shareholders Equity $ 1,375 $ 250 $ 1,617 Less: Goodwill and Other Intangible Assets, net (351) (7) (484) Add: Deferred Tax Liability Related to Goodwill 14 - 14 Tangible common equity (non-GAAP) $ 1,038 $ 243 $ 1,147 Total Assets $ 10,153 $ 2,540 $ 12,640 Less: Goodwill and Other Intangible Assets, net (351) (7) (484) Add: Deferred Tax Liability Related to Goodwill 14 - 14 Tangible assets (non-GAAP) $ 9,816 $ 2,533 $ 12,170 Tangible common equity to tangible assets (non-GAAP) 10.6% 9.6% 9.4% Reconciliation of Non-GAAP Measures September 30, 2025 |
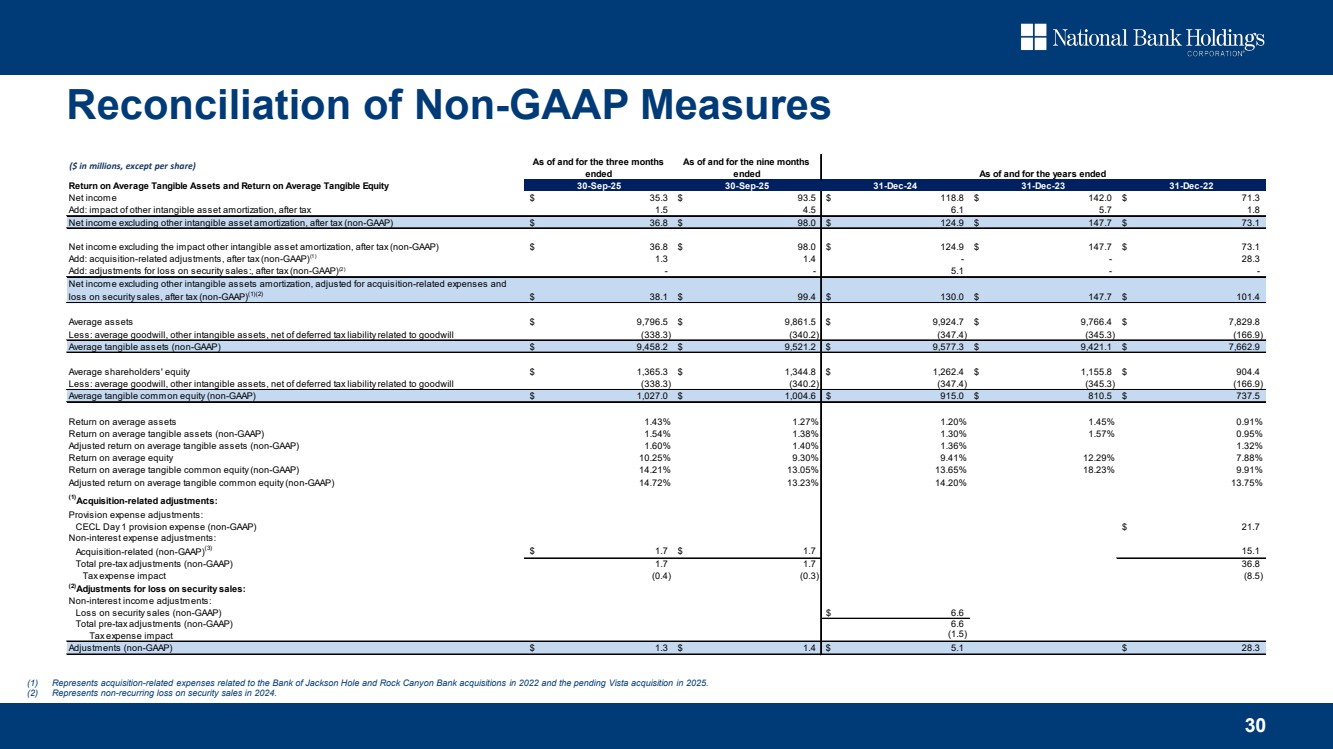
| 30 (1) Represents acquisition-related expenses related to the Bank of Jackson Hole and Rock Canyon Bank acquisitions in 2022 and the pending Vista acquisition in 2025. (2) Represents non-recurring loss on security sales in 2024. Reconciliation of Non-GAAP Measures As of and for the three months ended As of and for the nine months ended Return on Average Tangible Assets and Return on Average Tangible Equity 30-Sep-25 30-Sep-25 31-Dec-24 31-Dec-23 31-Dec-22 Net income $ 35.3 $ 93.5 $ 118.8 $ 142.0 $ 71.3 Add: impact of other intangible asset amortization, after tax 1.5 4.5 6.1 5.7 1.8 Net income excluding other intangible asset amortization, after tax (non-GAAP) $ 36.8 $ 98.0 $ 124.9 $ 147.7 $ 73.1 Net income excluding the impact other intangible asset amortization, after tax (non-GAAP) $ 36.8 $ 98.0 $ 124.9 $ 147.7 $ 73.1 Add: acquisition-related adjustments, after tax (non-GAAP)(1) 1.3 1.4 - - 28.3 Add: adjustments for loss on security sales:, after tax (non-GAAP)(2) - - 5.1 - - Net income excluding other intangible assets amortization, adjusted for acquisition-related expenses and loss on security sales, after tax (non-GAAP)(1)(2) $ 38.1 $ 99.4 $ 130.0 $ 147.7 $ 101.4 Average assets $ 9,796.5 $ 9,861.5 $ 9,924.7 $ 9,766.4 $ 7,829.8 Less: average goodwill, other intangible assets, net of deferred tax liability related to goodwill (338.3) (340.2) (347.4) (345.3) (166.9) Average tangible assets (non-GAAP) $ 9,458.2 $ 9,521.2 $ 9,577.3 $ 9,421.1 $ 7,662.9 Average shareholders' equity $ 1,365.3 $ 1,344.8 $ 1,262.4 $ 1,155.8 $ 904.4 Less: average goodwill, other intangible assets, net of deferred tax liability related to goodwill (338.3) (340.2) (347.4) (345.3) (166.9) Average tangible common equity (non-GAAP) $ 1,027.0 $ 1,004.6 $ 915.0 $ 810.5 $ 737.5 Return on average assets 1.43% 1.27% 1.20% 1.45% 0.91% Return on average tangible assets (non-GAAP) 1.54% 1.38% 1.30% 1.57% 0.95% Adjusted return on average tangible assets (non-GAAP) 1.60% 1.40% 1.36% 1.32% Return on average equity 10.25% 9.30% 9.41% 12.29% 7.88% Return on average tangible common equity (non-GAAP) 14.21% 13.05% 13.65% 18.23% 9.91% Adjusted return on average tangible common equity (non-GAAP) 14.72% 13.23% 14.20% 13.75% (1)Acquisition-related adjustments: Provision expense adjustments: CECL Day 1 provision expense (non-GAAP) $ 21.7 Non-interest expense adjustments: Acquisition-related (non-GAAP)(3) $ 1.7 $ 1.7 15.1 Total pre-tax adjustments (non-GAAP) 1.7 1.7 36.8 Tax expense impact (0.4) (0.3) (8.5) (2)Adjustments for loss on security sales: Non-interest income adjustments: Loss on security sales (non-GAAP) $ 6.6 Total pre-tax adjustments (non-GAAP) 6.6 Tax expense impact (1.5) Adjustments (non-GAAP) $ 1.3 $ 1.4 $ 5.1 $ 28.3 As of and for the years ended ($ in millions, except per share) |
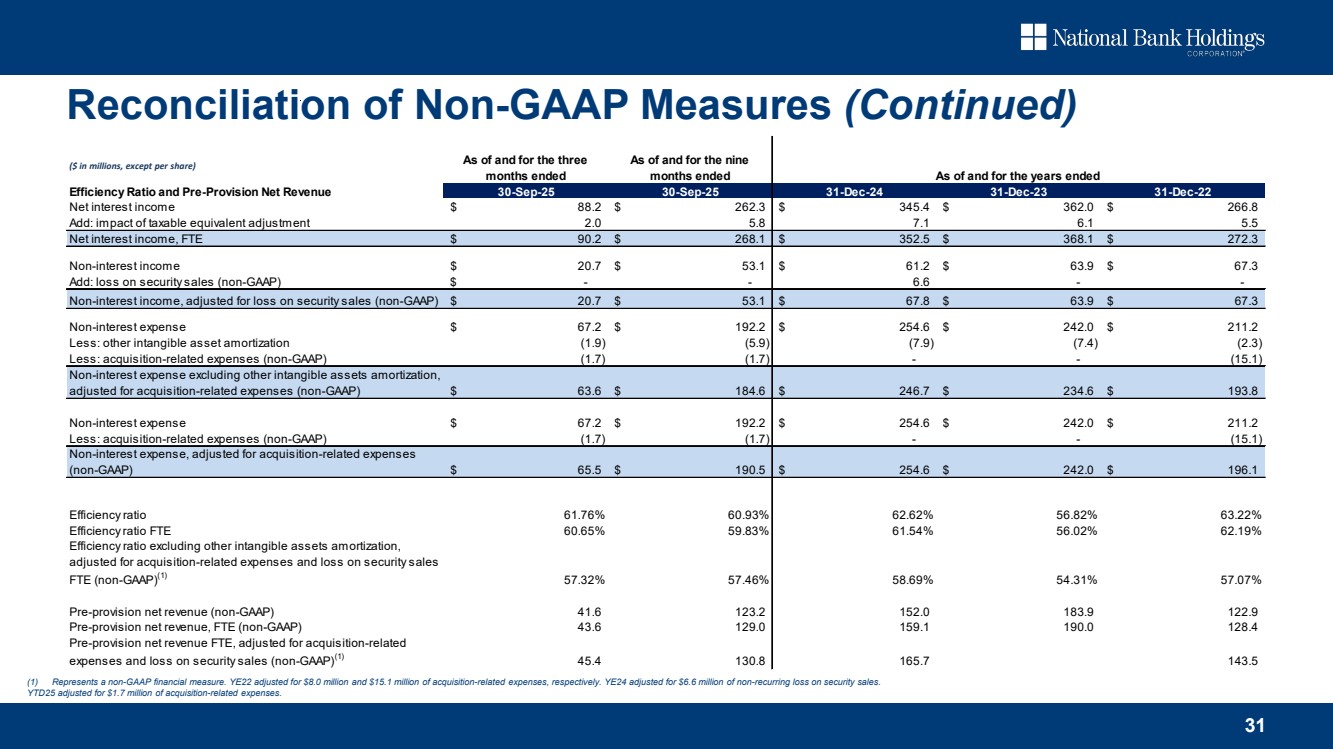
| 31 Reconciliation of Non-GAAP Measures (Continued) As of and for the three months ended As of and for the nine months ended Efficiency Ratio and Pre-Provision Net Revenue 30-Sep-25 30-Sep-25 31-Dec-24 31-Dec-23 31-Dec-22 Net interest income $ 88.2 $ 262.3 $ 345.4 $ 362.0 $ 266.8 Add: impact of taxable equivalent adjustment 2.0 5.8 7.1 6.1 5.5 Net interest income, FTE $ 90.2 $ 268.1 $ 352.5 $ 368.1 $ 272.3 Non-interest income $ 20.7 $ 53.1 $ 61.2 $ 63.9 $ 67.3 Add: loss on security sales (non-GAAP) $ - - 6.6 - - Non-interest income, adjusted for loss on security sales (non-GAAP) $ 20.7 $ 53.1 $ 67.8 $ 63.9 $ 67.3 Non-interest expense $ 67.2 $ 192.2 $ 254.6 $ 242.0 $ 211.2 Less: other intangible asset amortization (1.9) (5.9) (7.9) (7.4) (2.3) Less: acquisition-related expenses (non-GAAP) (1.7) (1.7) - - (15.1) Non-interest expense excluding other intangible assets amortization, adjusted for acquisition-related expenses (non-GAAP) $ 63.6 $ 184.6 $ 246.7 $ 234.6 $ 193.8 Non-interest expense $ 67.2 $ 192.2 $ 254.6 $ 242.0 $ 211.2 Less: acquisition-related expenses (non-GAAP) (1.7) (1.7) - - (15.1) Non-interest expense, adjusted for acquisition-related expenses (non-GAAP) $ 65.5 $ 190.5 $ 254.6 $ 242.0 $ 196.1 Efficiency ratio 61.76% 60.93% 62.62% 56.82% 63.22% Efficiency ratio FTE 60.65% 59.83% 61.54% 56.02% 62.19% Efficiency ratio excluding other intangible assets amortization, adjusted for acquisition-related expenses and loss on security sales FTE (non-GAAP)(1) 57.32% 57.46% 58.69% 54.31% 57.07% Pre-provision net revenue (non-GAAP) 41.6 123.2 152.0 183.9 122.9 Pre-provision net revenue, FTE (non-GAAP) 43.6 129.0 159.1 190.0 128.4 Pre-provision net revenue FTE, adjusted for acquisition-related expenses and loss on security sales (non-GAAP)(1) 45.4 130.8 165.7 143.5 As of and for the years ended ($ in millions, except per share) (1) Represents a non-GAAP financial measure. YE22 adjusted for $8.0 million and $15.1 million of acquisition-related expenses, respectively. YE24 adjusted for $6.6 million of non-recurring loss on security sales. YTD25 adjusted for $1.7 million of acquisition-related expenses. |
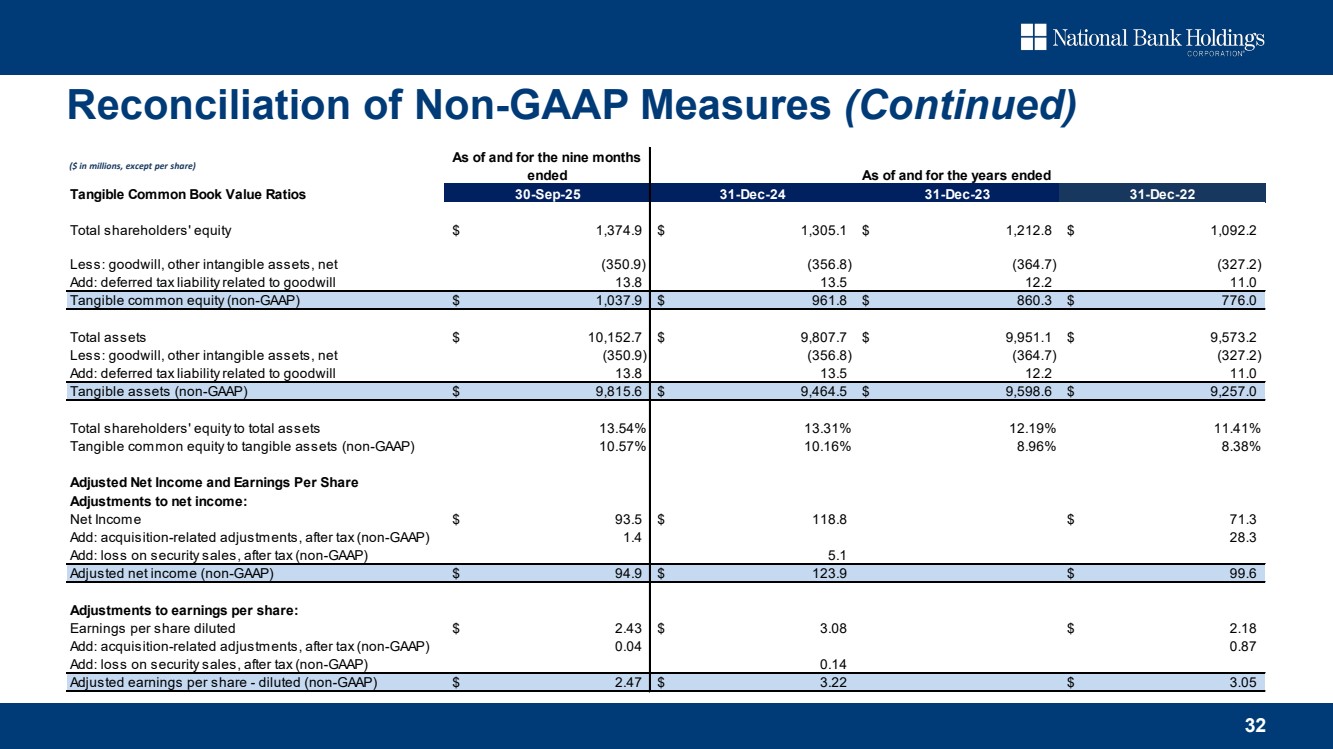
| 32 Reconciliation of Non-GAAP Measures (Continued) ($ in millions, except per share) As of and for the nine months ended Tangible Common Book Value Ratios 30-Sep-25 31-Dec-24 31-Dec-23 31-Dec-22 Total shareholders' equity $ 1,374.9 $ 1,305.1 $ 1,212.8 $ 1,092.2 Less: goodwill, other intangible assets, net (350.9) (356.8) (364.7) (327.2) Add: deferred tax liability related to goodwill 13.8 13.5 12.2 11.0 Tangible common equity (non-GAAP) $ 1,037.9 $ 961.8 $ 860.3 $ 776.0 Total assets $ 10,152.7 $ 9,807.7 $ 9,951.1 $ 9,573.2 Less: goodwill, other intangible assets, net (350.9) (356.8) (364.7) (327.2) Add: deferred tax liability related to goodwill 13.8 13.5 12.2 11.0 Tangible assets (non-GAAP) $ 9,815.6 $ 9,464.5 $ 9,598.6 $ 9,257.0 Total shareholders' equity to total assets 13.54% 13.31% 12.19% 11.41% Tangible common equity to tangible assets (non-GAAP) 10.57% 10.16% 8.96% 8.38% Adjusted Net Income and Earnings Per Share Adjustments to net income: Net Income $ 93.5 $ 118.8 $ 71.3 Add: acquisition-related adjustments, after tax (non-GAAP) 1.4 28.3 Add: loss on security sales, after tax (non-GAAP) 5.1 Adjusted net income (non-GAAP) $ 94.9 $ 123.9 $ 99.6 Adjustments to earnings per share: Earnings per share diluted $ 2.43 $ 3.08 $ 2.18 Add: acquisition-related adjustments, after tax (non-GAAP) 0.04 0.87 Add: loss on security sales, after tax (non-GAAP) 0.14 Adjusted earnings per share - diluted (non-GAAP) $ 2.47 $ 3.22 $ 3.05 As of and for the years ended |
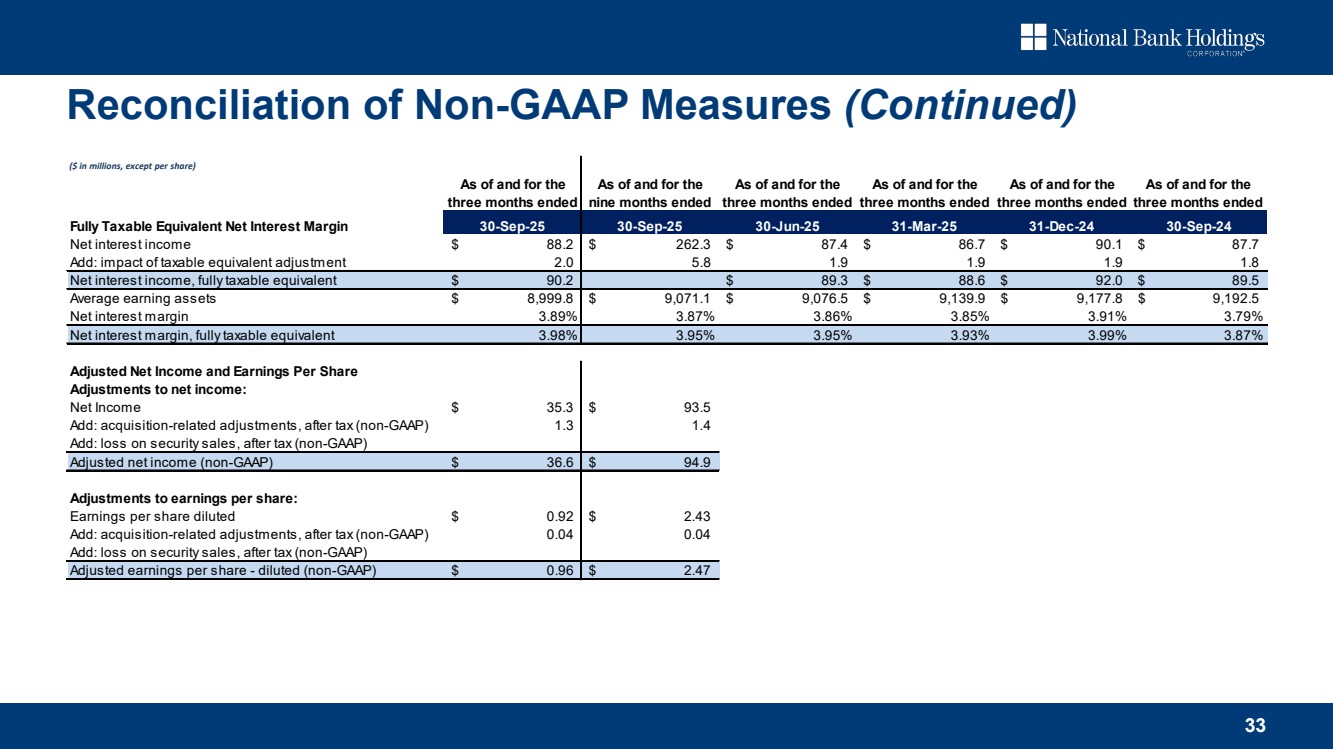
| 33 As of and for the three months ended As of and for the nine months ended As of and for the three months ended As of and for the three months ended As of and for the three months ended As of and for the three months ended Fully Taxable Equivalent Net Interest Margin 30-Sep-25 30-Sep-25 30-Jun-25 31-Mar-25 31-Dec-24 30-Sep-24 Net interest income $ 88.2 $ 262.3 $ 87.4 $ 86.7 $ 90.1 $ 87.7 Add: impact of taxable equivalent adjustment 2.0 5.8 1.9 1.9 1.9 1.8 Net interest income, fully taxable equivalent $ 90.2 $ 89.3 $ 88.6 $ 92.0 $ 89.5 Average earning assets $ 8,999.8 $ 9,071.1 $ 9,076.5 $ 9,139.9 $ 9,177.8 $ 9,192.5 Net interest margin 3.89% 3.87% 3.86% 3.85% 3.91% 3.79% Net interest margin, fully taxable equivalent 3.98% 3.95% 3.95% 3.93% 3.99% 3.87% Adjusted Net Income and Earnings Per Share Adjustments to net income: Net Income $ 35.3 $ 93.5 Add: acquisition-related adjustments, after tax (non-GAAP) 1.3 1.4 Add: loss on security sales, after tax (non-GAAP) Adjusted net income (non-GAAP) $ 36.6 $ 94.9 Adjustments to earnings per share: Earnings per share diluted $ 0.92 $ 2.43 Add: acquisition-related adjustments, after tax (non-GAAP) 0.04 0.04 Add: loss on security sales, after tax (non-GAAP) Adjusted earnings per share - diluted (non-GAAP) $ 0.96 $ 2.47 Reconciliation of Non-GAAP Measures (Continued) ($ in millions, except per share) |
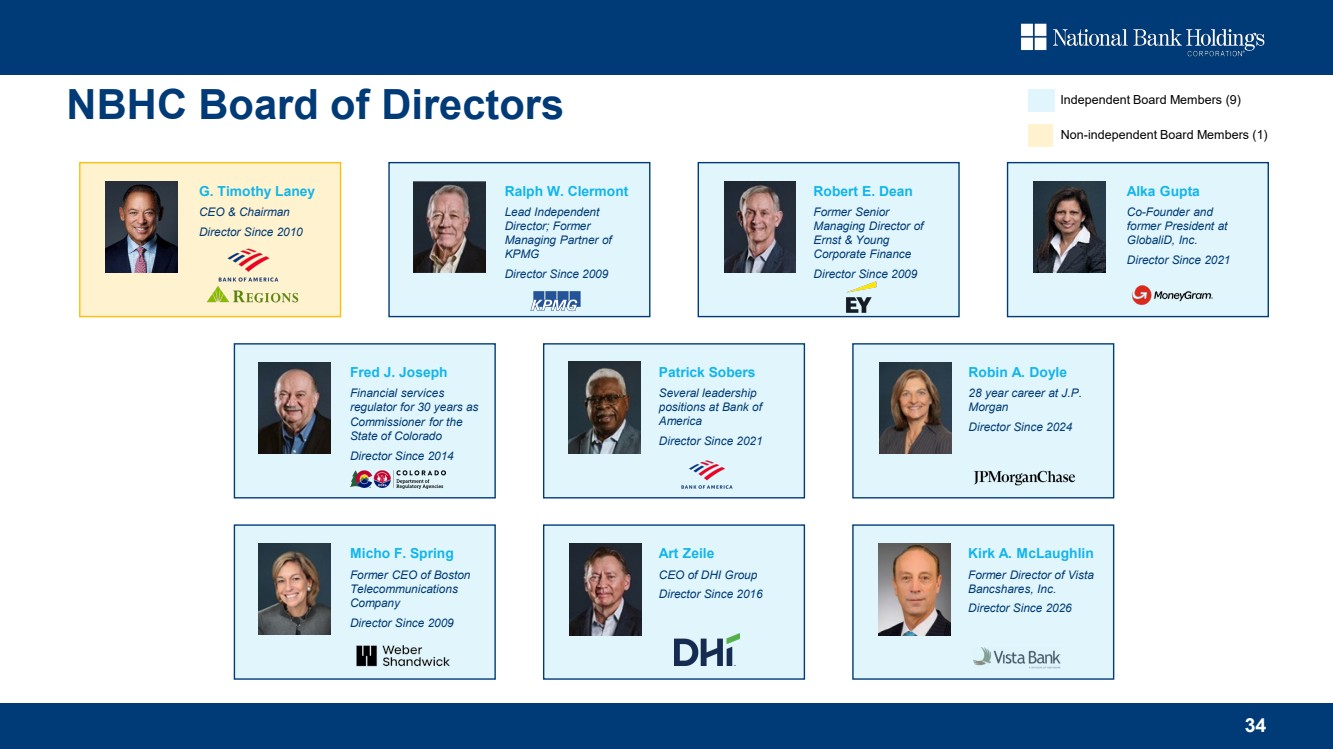
| 34 Independent Board Members (9) Non-independent Board Members (1) G. Timothy Laney CEO & Chairman Director Since 2010 NBHC Board of Directors Ralph W. Clermont Lead Independent Director; Former Managing Partner of KPMG Director Since 2009 Robert E. Dean Former Senior Managing Director of Ernst & Young Corporate Finance Director Since 2009 Kirk A. McLaughlin Former Director of Vista Bancshares, Inc. Director Since 2026 Art Zeile CEO of DHI Group Director Since 2016 Fred J. Joseph Financial services regulator for 30 years as Commissioner for the State of Colorado Director Since 2014 Micho F. Spring Former CEO of Boston Telecommunications Company Director Since 2009 Alka Gupta Co-Founder and former President at GlobaliD, Inc. Director Since 2021 Robin A. Doyle 28 year career at J.P. Morgan Director Since 2024 Patrick Sobers Several leadership positions at Bank of America Director Since 2021 |
| Thank you. |