.2 J.P. Morgan Healthcare Conference 2026 th January 12 , 2026 © Copyright Adaptive Biotechnologies 2026.
Legal Disclaimers This presentation has been prepared by Adaptive Biotechnologies Corporation (“we,” “us,” “our,” “Adaptive” or the “Company”) and is made for informational purposes only. The information set forth herein does not purport to be complete or to contain all relevant information. Statements contained herein are made as of the date of this presentation unless stated otherwise. This presentation shall not constitute an offer to sell or the solicitation of an offer to buy securities, nor shall there be any sale of these securities in any jurisdiction in which such offer, solicitation or sale would be unlawful prior to registration or qualification under the securities laws of any such jurisdiction. This presentation contains preliminary financial results for the fourth quarter and full year ended December 31, 2025. We have not completed preparation of our financial statements for these periods. The revenue, cash, test volumes, and other results presented herein are preliminary and unaudited and are thus inherently uncertain and subject to change as Adaptive Biotechnologies Corporation completes its customary year-end close, prepares its financial statements and completes the audit thereof. This presentation does not disclose estimated expenses, although we expect fourth quarter and full year 2025 net loss to decrease compared to comparable periods in 2024. The final results for these periods may differ materially from the estimates herein. These estimates are the responsibility of management. Our independent registered public accounting firm has not audited, reviewed or performed any procedures with respect to these preliminary results. This presentation contains “forward-looking statements” within the meaning of Section 27A of the Securities Act of 1933, as amended, and Section 21E of the Securities Exchange Act of 1934, as amended. These statements are intended to be covered by the “safe harbor” created by those sections. Forward-looking statements are neither historical facts nor assurances of future performance. Instead, they are based on our current beliefs, expectations and assumptions regarding the future of our business, future plans and strategies, our development plans, our preclinical and clinical results and other future conditions. In some cases, you can identify forward-looking statements by the following words: “may,” “will,” “could,” “would,” “should,” “expect,” “intend,” “plan,” “anticipate,” “believe,” “estimate,” “predict,” “project,” “potential,” “continue,” “ongoing” or the negative of these terms or other comparable terminology, although not all forward-looking statements contain these words. All statements, other than statements of historical facts, contained in this presentation are forward looking statements, including statements regarding the ability to map adaptive immune responses to target disease states, the ability to leverage any such findings to advance solutions to diagnose, treat and prevent diseases; regarding our future financial or business performance, conditions, plans, prospects, trends or strategies and other financial and business matters; our current and prospective products and product candidates; FDA clearance or authorization of any products; planned non-IDE clinical studies, clinical trials and preclinical activities, research and development costs, current and prospective collaborations; the estimated size of the market for our products and product candidates; the timing and success of our development and commercialization of current products and product candidates, and the other risks and uncertainties described in our filings with the Securities and Exchange Commission including the Risk Factors and Management’s Discussion and Analysis of Financial Condition and Results of Operations sections of our most recently filed Quarterly Report on Form 10-Q and our Annual Report on Form 10-K, including our most recent Annual Report on Form 10-K filed on March 3, 2025. Although we believe the expectations reflected in such forward-looking statements are reasonable, we can give no assurance that such expectations will prove to be correct. Risks and uncertainties could cause actual results to differ materially from those expressed in our forward-looking statements. Accordingly, readers are cautioned not to place undue reliance on these forward-looking statements. Except as required by applicable law, we do not plan to publicly update or revise any forward-looking statements contained herein. In addition, non-GAAP financial measures such as Adjusted EBITDA are referenced in this presentation. Adjusted EBITDA is a non-GAAP financial measure that we define as net loss attributable to Adaptive Biotechnologies Corporation adjusted for interest and other income, net, interest expense, income tax (expense) benefit, depreciation and amortization expense, impairment costs for long-lived assets, restructuring expense and share-based compensation expense. 2
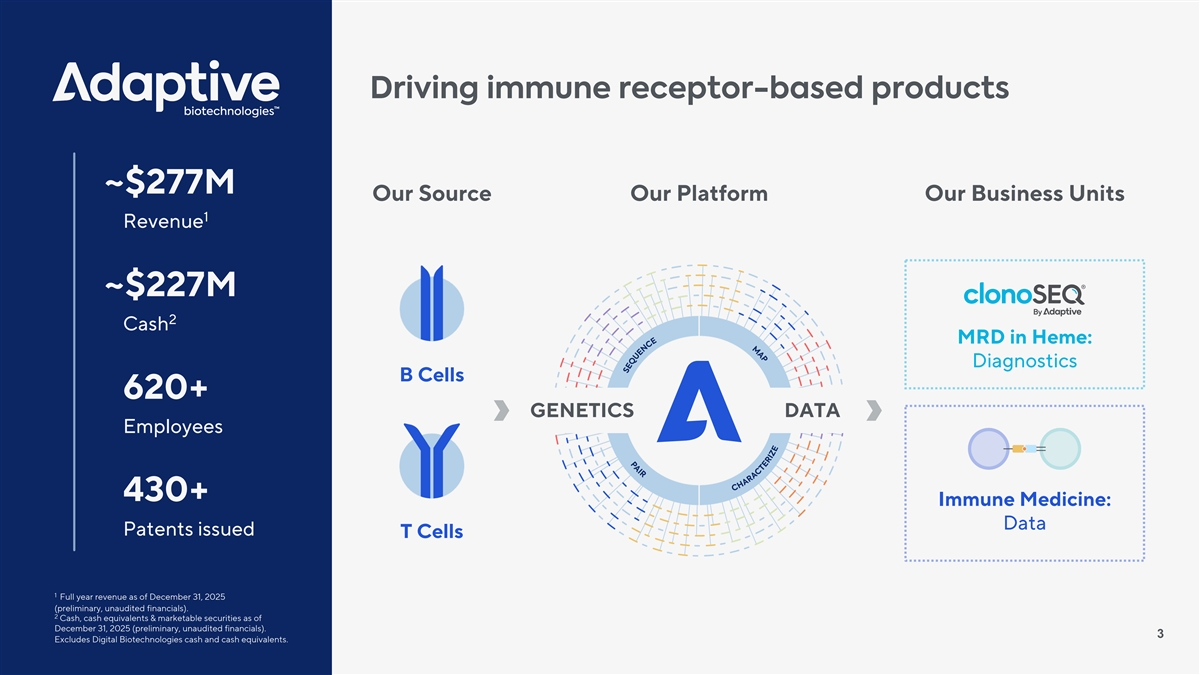
Driving immune receptor-based products ~$277M Our Source Our Platform Our Business Units 1 Revenue ~$227M 2 Cash MRD in Heme: Diagnostics B Cells 620+ GENETICS DATA Employees 430+ Immune Medicine: Data Patents issued T Cells 1 Full year revenue as of December 31, 2025 (preliminary, unaudited financials). 2 Cash, cash equivalents & marketable securities as of December 31, 2025 (preliminary, unaudited financials). 3 Excludes Digital Biotechnologies cash and cash equivalents.

MRD A commercial stage diagnostics business
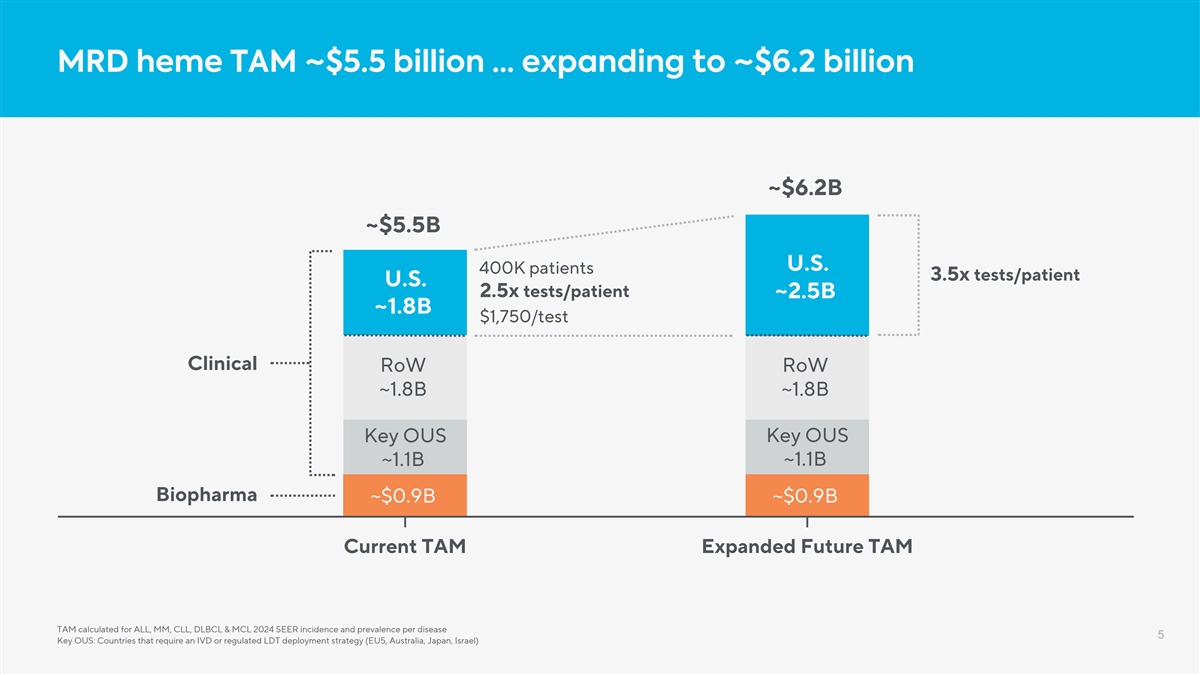
MRD heme TAM ~$5.5 billion … expanding to ~$6.2 billion ~$6.2B ~$5.5B U.S. 400K patients 3.5x tests/patient U.S. 2.5x tests/patient ~2.5B ~1.8B $1,750/test Clinical RoW RoW ~1.8B ~1.8B Key OUS Key OUS ~1.1B ~1.1B Biopharma ~$0.9B ~$0.9B Current TAM Expanded Future TAM TAM calculated for ALL, MM, CLL, DLBCL & MCL 2024 SEER incidence and prevalence per disease 5 Key OUS: Countries that require an IVD or regulated LDT deployment strategy (EU5, Australia, Japan, Israel)
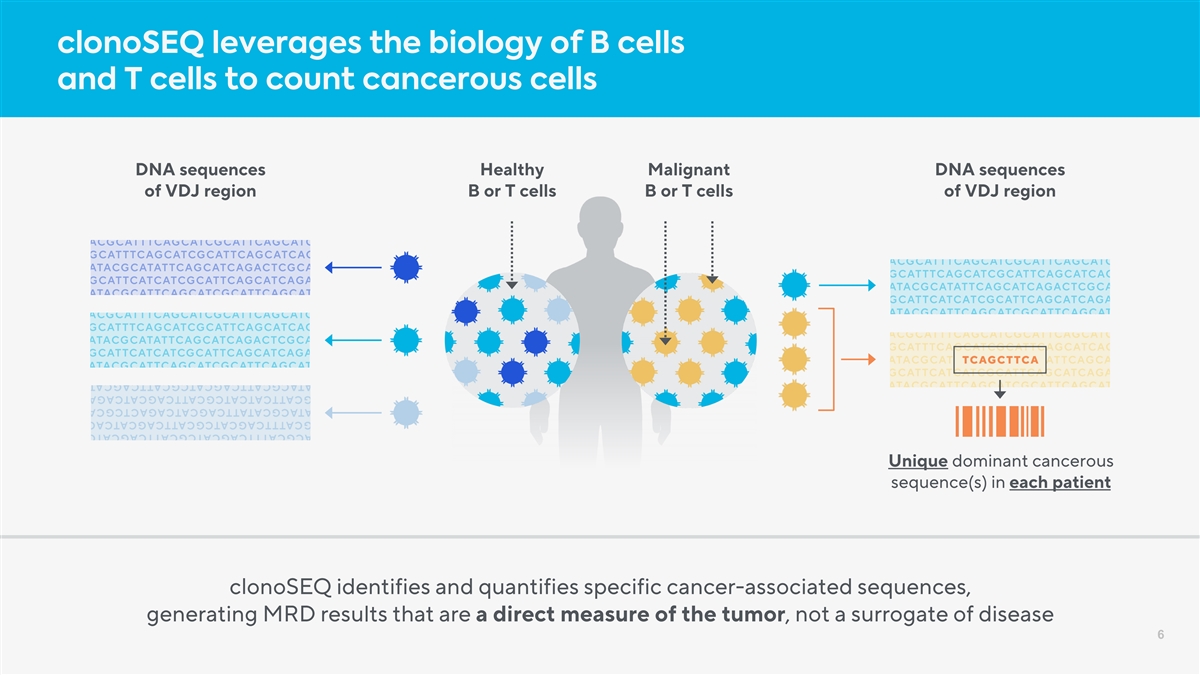
clonoSEQ leverages the biology of B cells and T cells to count cancerous cells DNA sequences Healthy Malignant DNA sequences of VDJ region B or T cells B or T cells of VDJ region Unique dominant cancerous sequence(s) in each patient clonoSEQ identifies and quantifies specific cancer-associated sequences, generating MRD results that are a direct measure of the tumor, not a surrogate of disease 6
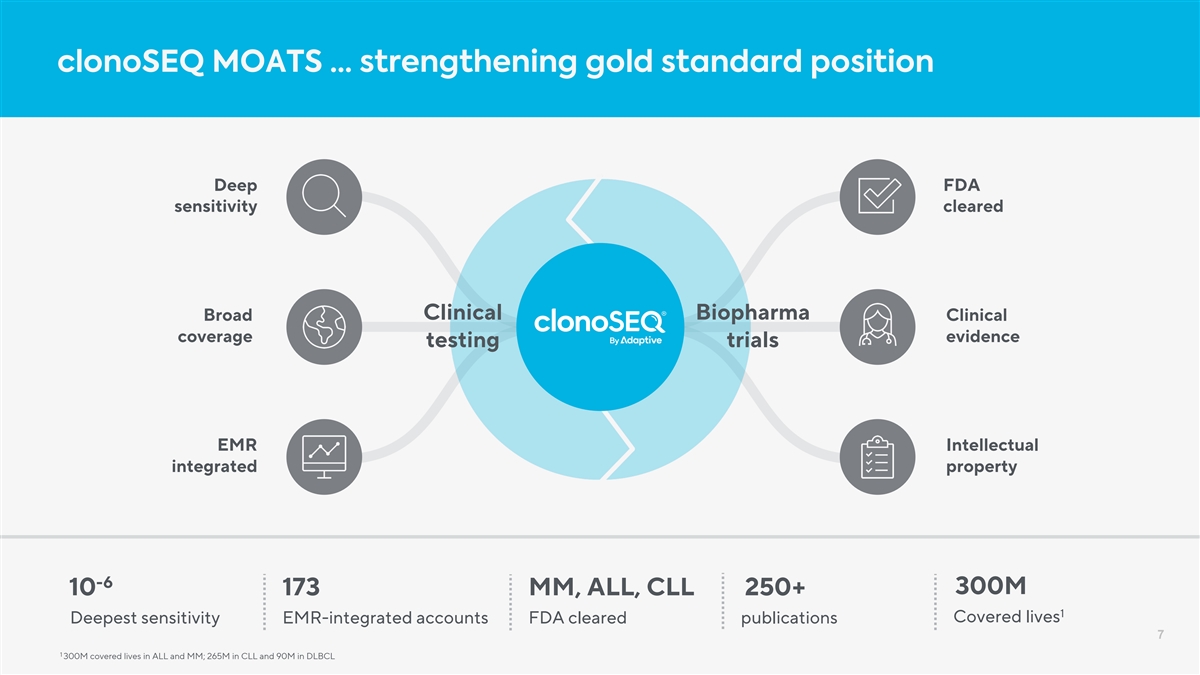
clonoSEQ MOATS … strengthening gold standard position Deep FDA sensitivity cleared Clinical Biopharma Broad Clinical coverage evidence testing trials EMR Intellectual integrated property -6 300M 10 173 MM, ALL, CLL 250+ 1 Covered lives Deepest sensitivity EMR-integrated accounts FDA cleared publications 7 1 300M covered lives in ALL and MM; 265M in CLL and 90M in DLBCL
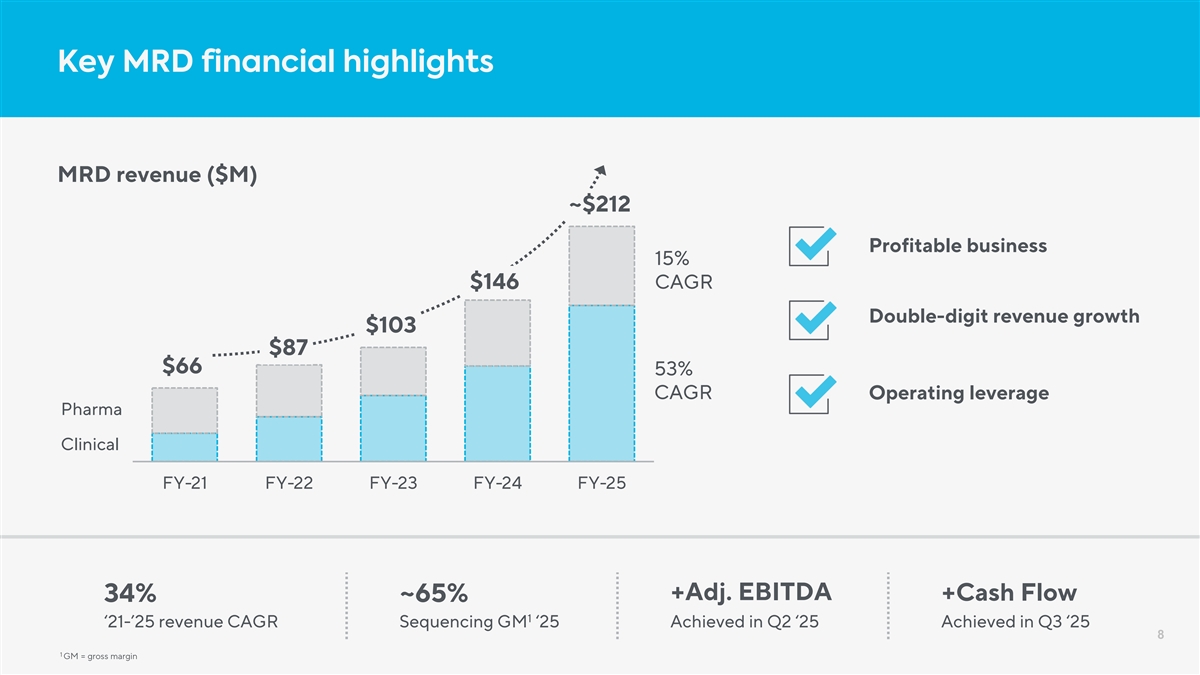
Key MRD financial highlights MRD revenue ($M) ~$212 Profitable business 15% $146 CAGR Double-digit revenue growth $103 $87 $66 53% CAGR Operating leverage Pharma Clinical FY-21 FY-22 FY-23 FY-24 FY-25 +Adj. EBITDA +Cash Flow 34% ~65% 1 ‘21-’25 revenue CAGR Sequencing GM ‘25 Achieved in Q2 ‘25 Achieved in Q3 ‘25 8 1 GM = gross margin
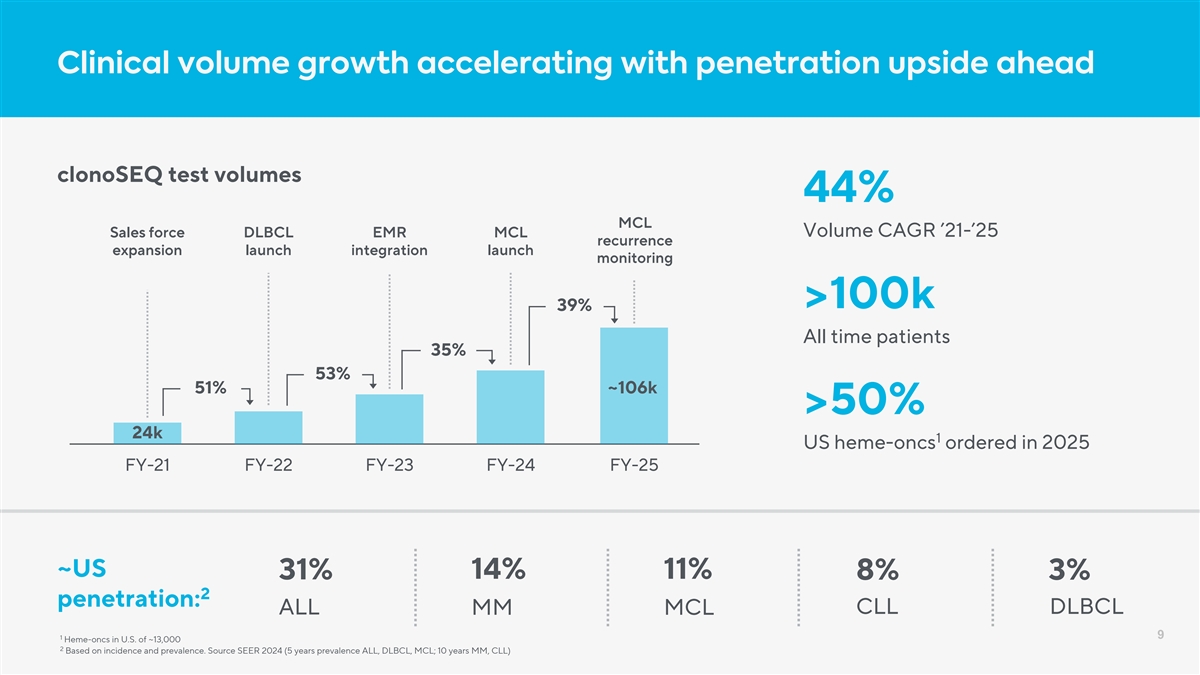
Clinical volume growth accelerating with penetration upside ahead clonoSEQ test volumes 44% MCL Sales force DLBCL EMR MCL Volume CAGR ’21-’25 recurrence expansion launch integration launch monitoring >100k 39% All time patients 35% 53% 51% ~106k >50% 24k 1 US heme-oncs ordered in 2025 FY-21 FY-22 FY-23 FY-24 FY-25 ~US 14% 11% 31% 8% 3% 2 penetration: CLL DLBCL ALL MM MCL 9 1 Heme-oncs in U.S. of ~13,000 2 Based on incidence and prevalence. Source SEER 2024 (5 years prevalence ALL, DLBCL, MCL; 10 years MM, CLL)
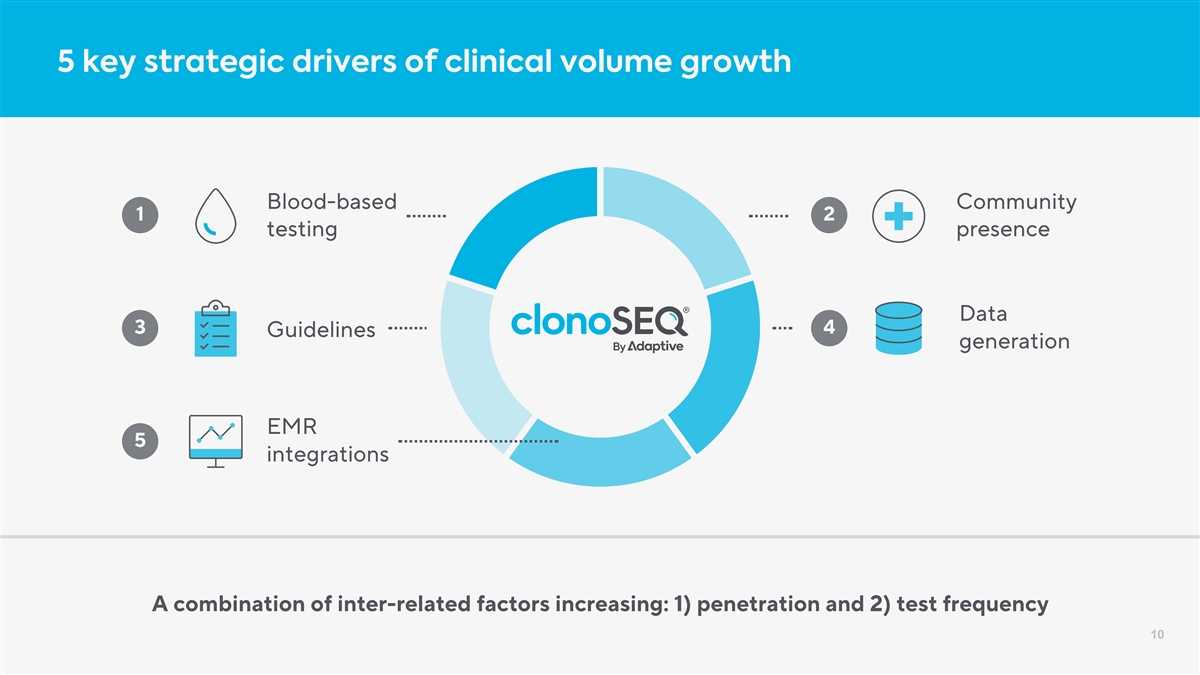
5 key strategic drivers of clinical volume growth Blood-based Community 1 2 testing presence Data 3 4 Guidelines generation EMR 5 integrations A combination of inter-related factors increasing: 1) penetration and 2) test frequency 10
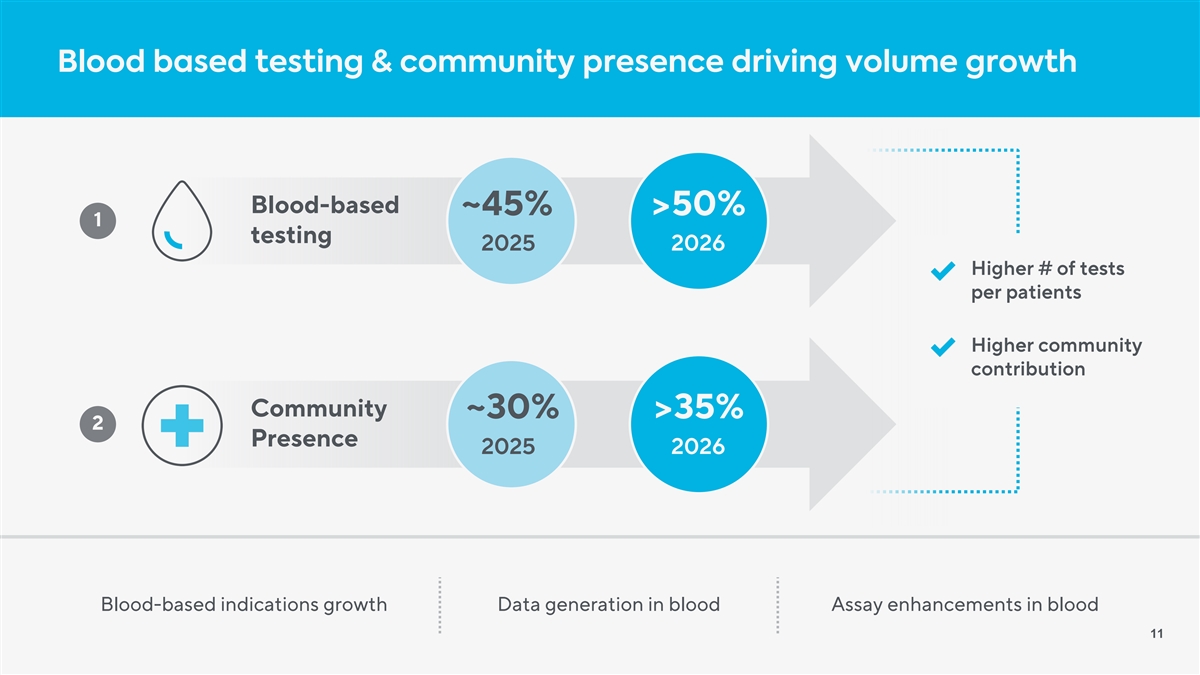
Blood based testing & community presence driving volume growth Blood-based ~45% >50% 1 testing 2025 2026 Higher # of tests per patients Higher community contribution Community ~30% >35% 2 Presence 2025 2026 Blood-based indications growth Data generation in blood Assay enhancements in blood 11
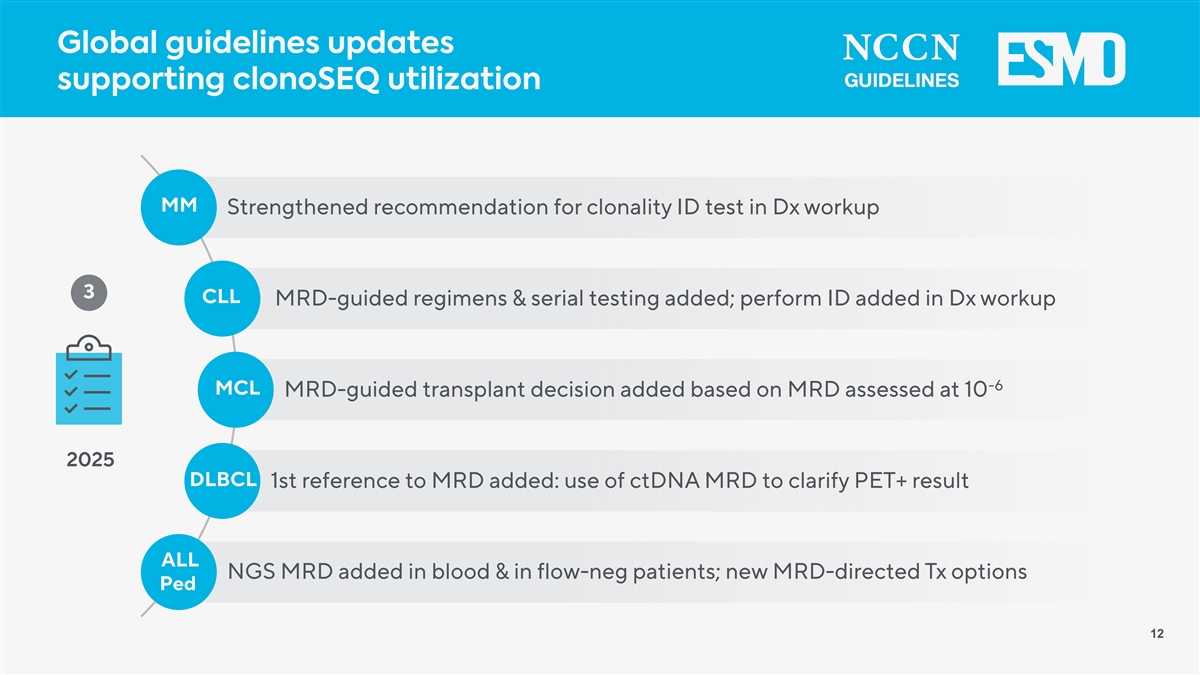
Global guidelines updates supporting clonoSEQ utilization MM Strengthened recommendation for clonality ID test in Dx workup 3 CLL MRD-guided regimens & serial testing added; perform ID added in Dx workup -6 MCL MRD-guided transplant decision added based on MRD assessed at 10 2025 DLBCL 1st reference to MRD added: use of ctDNA MRD to clarify PET+ result ALL NGS MRD added in blood & in flow-neg patients; new MRD-directed Tx options Ped 12
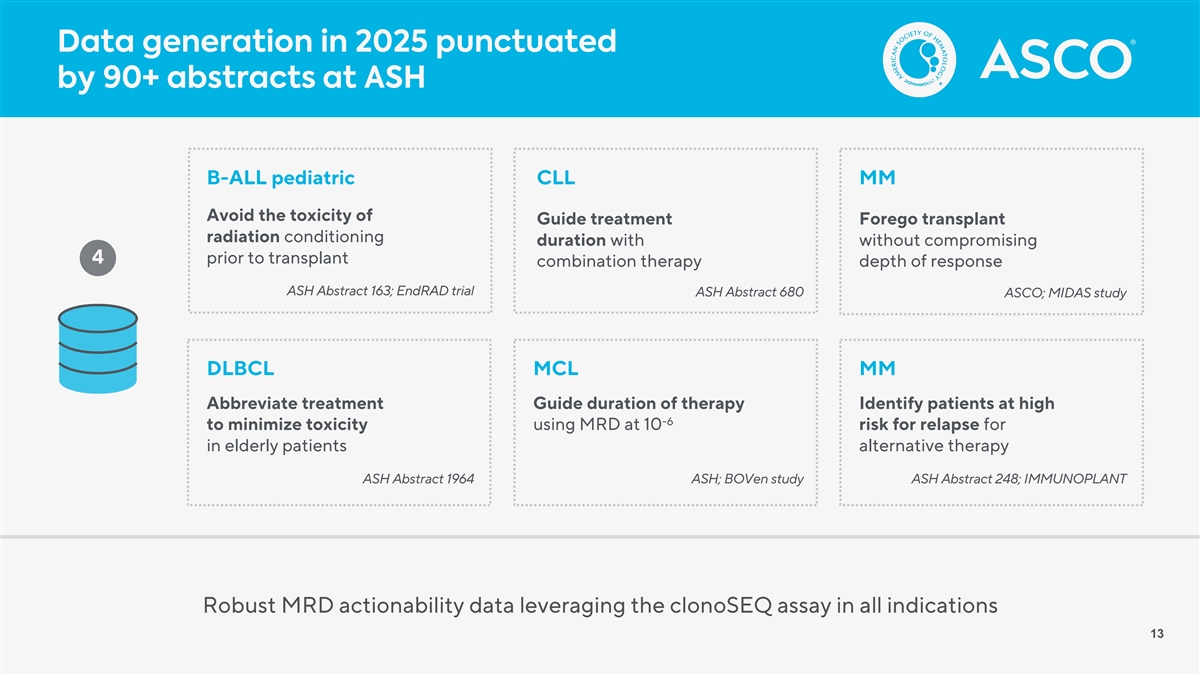
Data generation in 2025 punctuated by 90+ abstracts at ASH B-ALL pediatric CLL MM Avoid the toxicity of Guide treatment Forego transplant radiation conditioning duration with without compromising 4 prior to transplant combination therapy depth of response ASH Abstract 163; EndRAD trial ASH Abstract 680 ASCO; MIDAS study DLBCL MCL MM Abbreviate treatment Guide duration of therapy Identify patients at high -6 to minimize toxicity using MRD at 10 risk for relapse for in elderly patients alternative therapy ASH Abstract 1964 ASH; BOVen study ASH Abstract 248; IMMUNOPLANT Robust MRD actionability data leveraging the clonoSEQ assay in all indications 13
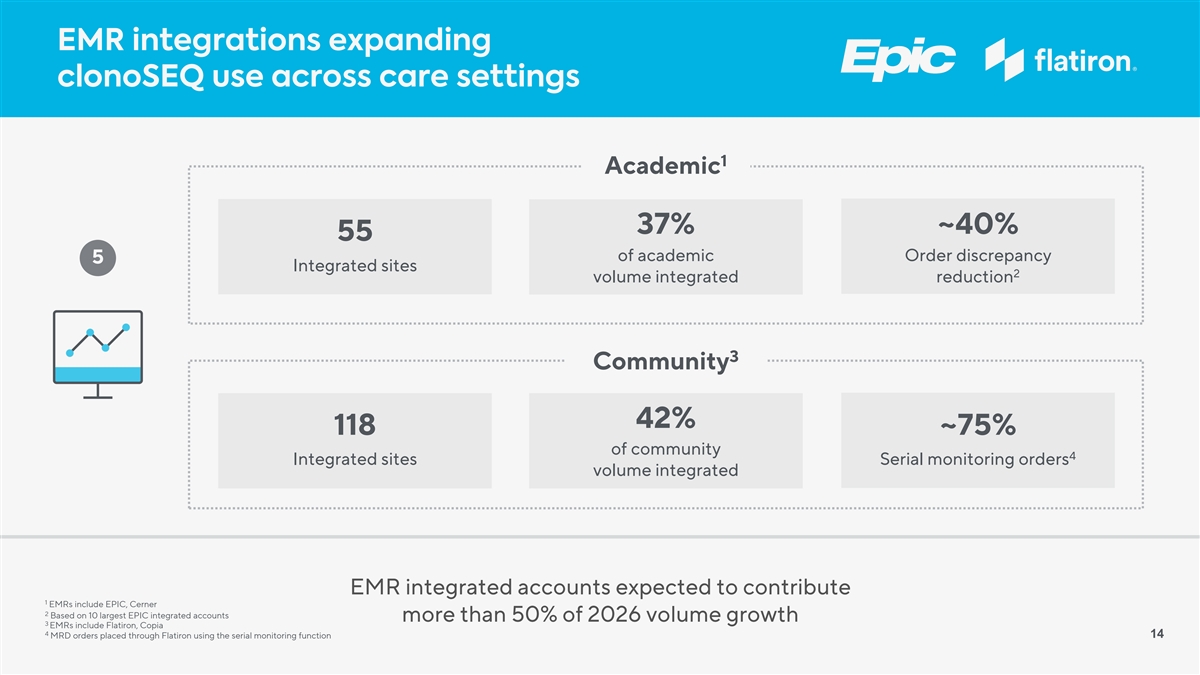
EMR integrations expanding clonoSEQ use across care settings 1 Academic 37% ~40% 55 of academic Order discrepancy 5 Integrated sites 2 volume integrated reduction 3 Community 42% 118 ~75% of community 4 Integrated sites Serial monitoring orders volume integrated EMR integrated accounts expected to contribute 1 EMRs include EPIC, Cerner 2 Based on 10 largest EPIC integrated accounts more than 50% of 2026 volume growth 3 EMRs include Flatiron, Copia 4 MRD orders placed through Flatiron using the serial monitoring function 14
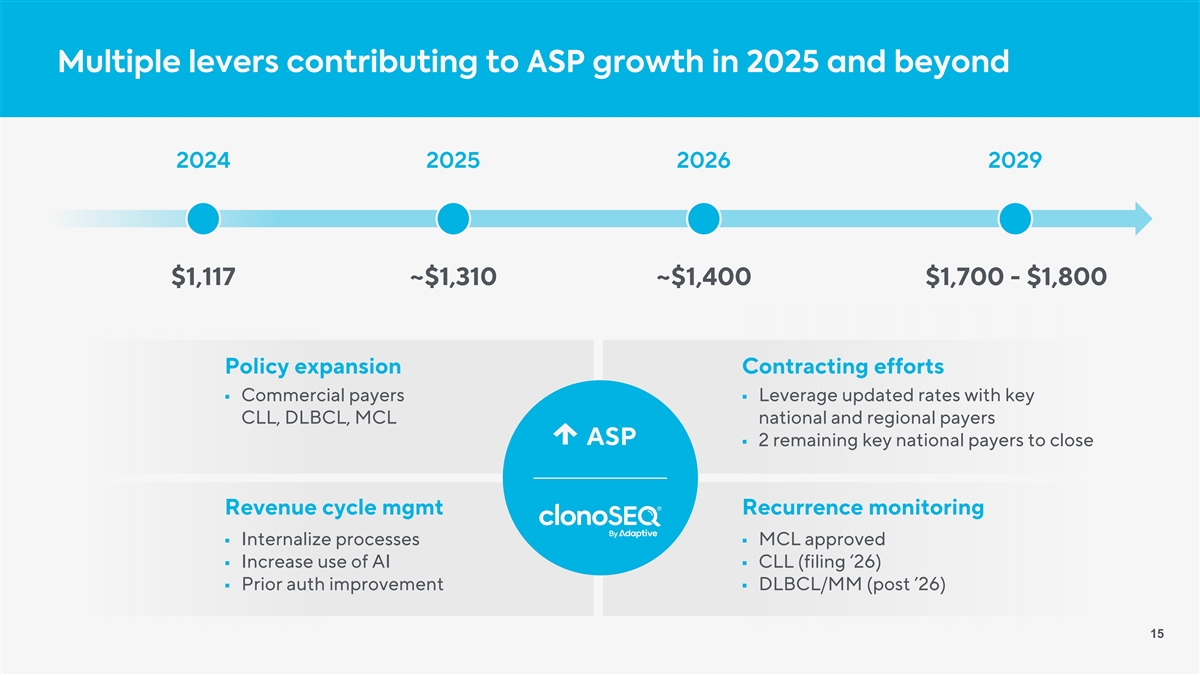
Multiple levers contributing to ASP growth in 2025 and beyond 2024 2025 2026 2029 $1,117 ~$1,310 ~$1,400 $1,700 - $1,800 Policy expansion Contracting efforts § Commercial payers § Leverage updated rates with key CLL, DLBCL, MCL national and regional payers ASP § 2 remaining key national payers to close Revenue cycle mgmt Recurrence monitoring § Internalize processes § MCL approved § Increase use of AI § CLL (filing ‘26) § Prior auth improvement § DLBCL/MM (post ’26) 15
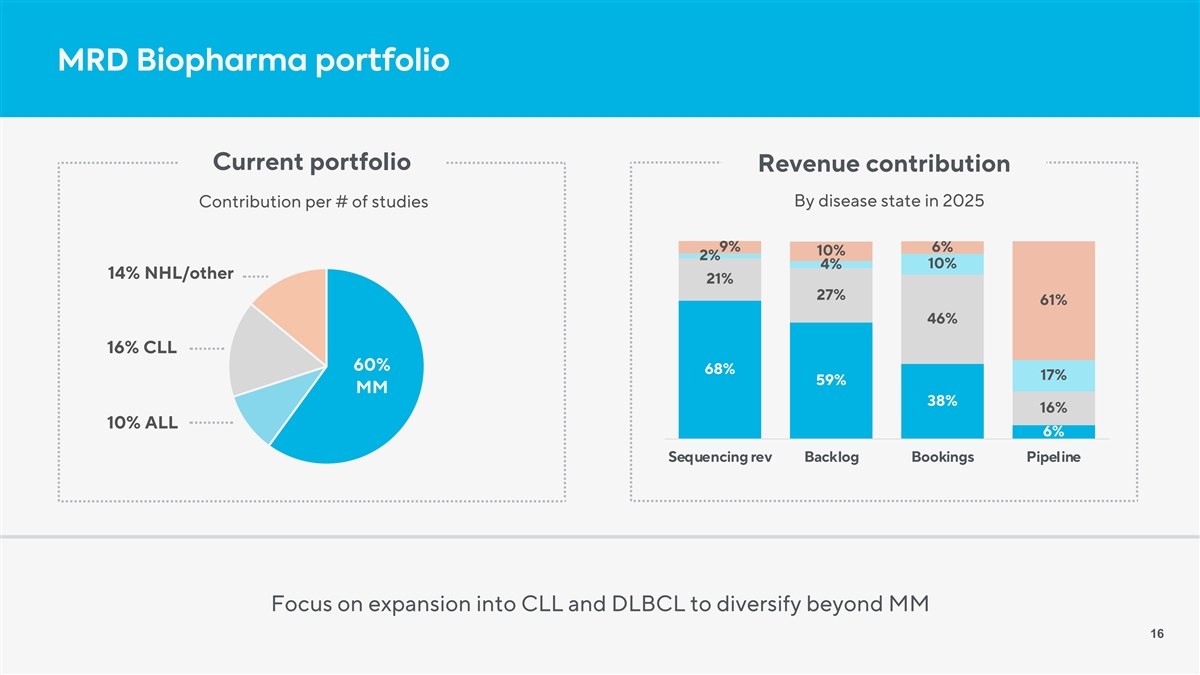
MRD Biopharma portfolio Current portfolio Revenue contribution By disease state in 2025 Contribution per # of studies 9% 6% 10% 2% 4% 10% 14% NHL/other 21% 27% 61% 46% 16% CLL 60% 68% 17% 59% MM 38% 16% 10% ALL 6% Sequencing rev Backlog Bookings Pipeline Focus on expansion into CLL and DLBCL to diversify beyond MM 16
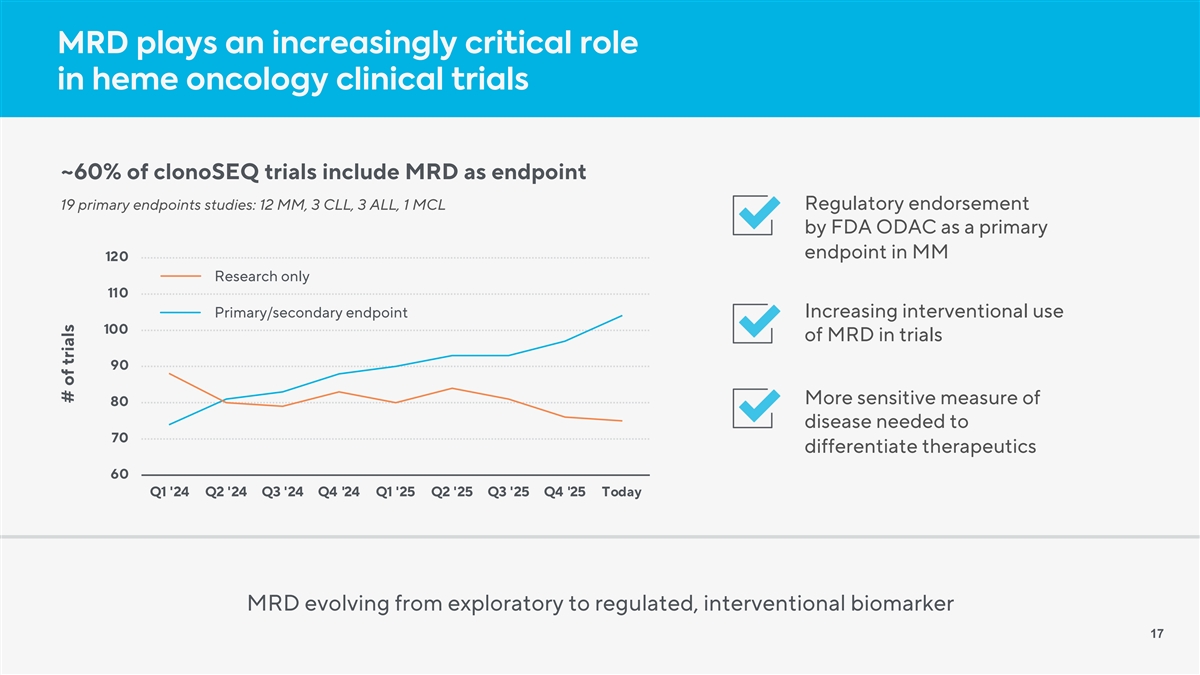
MRD plays an increasingly critical role in heme oncology clinical trials ~60% of clonoSEQ trials include MRD as endpoint 19 primary endpoints studies: 12 MM, 3 CLL, 3 ALL, 1 MCL Regulatory endorsement by FDA ODAC as a primary endpoint in MM 120 Research only 110 Primary/secondary endpoint Increasing interventional use 100 of MRD in trials 90 More sensitive measure of 80 disease needed to 70 differentiate therapeutics 60 Q1 '24 Q2 '24 Q3 '24 Q4 '24 Q1 '25 Q2 '25 Q3 '25 Q4 '25 Today MRD evolving from exploratory to regulated, interventional biomarker 17 # of trials
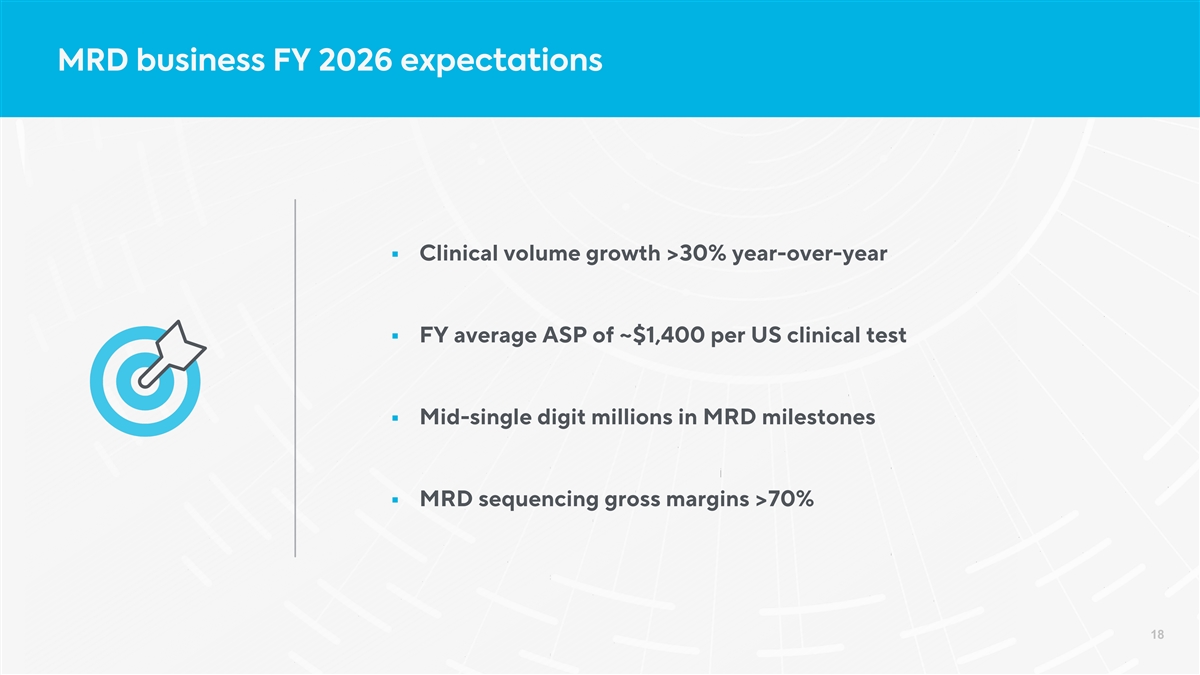
MRD business FY 2026 expectations § Clinical volume growth >30% year-over-year § FY average ASP of ~$1,400 per US clinical test § Mid-single digit millions in MRD milestones § MRD sequencing gross margins >70% 18
Immune Medicine (IM) An immune-based data discovery business
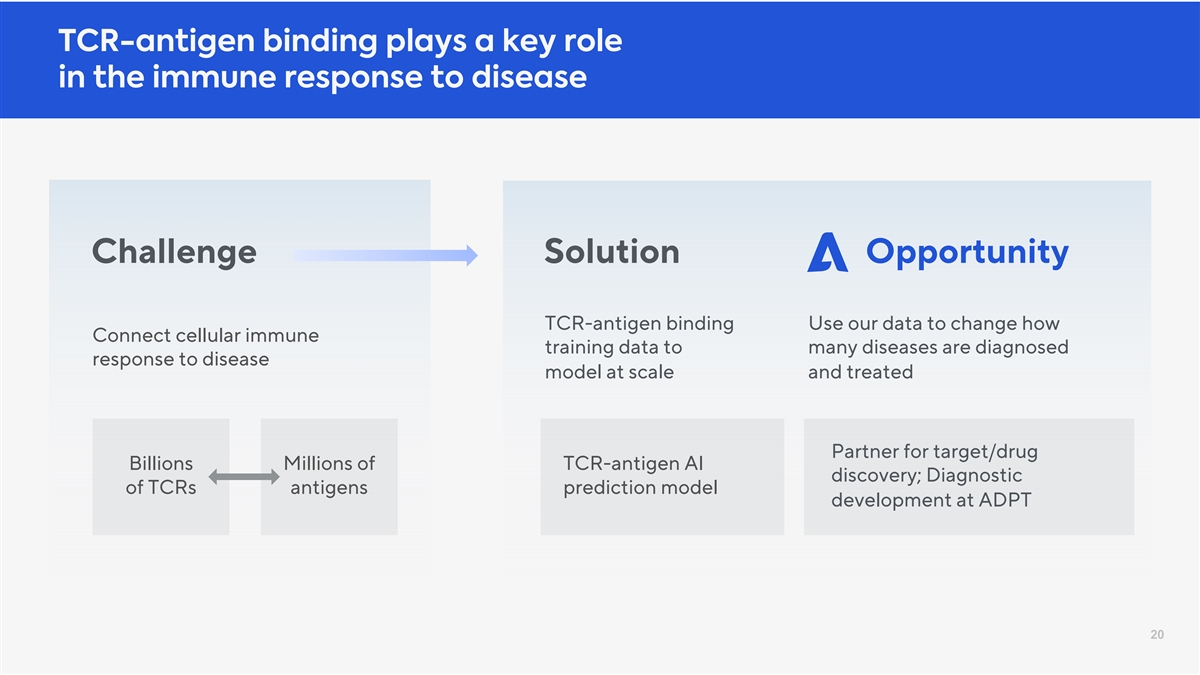
TCR-antigen binding plays a key role in the immune response to disease Challenge Solution Opportunity TCR-antigen binding Use our data to change how Connect cellular immune training data to many diseases are diagnosed response to disease model at scale and treated Partner for target/drug Billions Millions of TCR-antigen AI discovery; Diagnostic of TCRs antigens prediction model development at ADPT 20
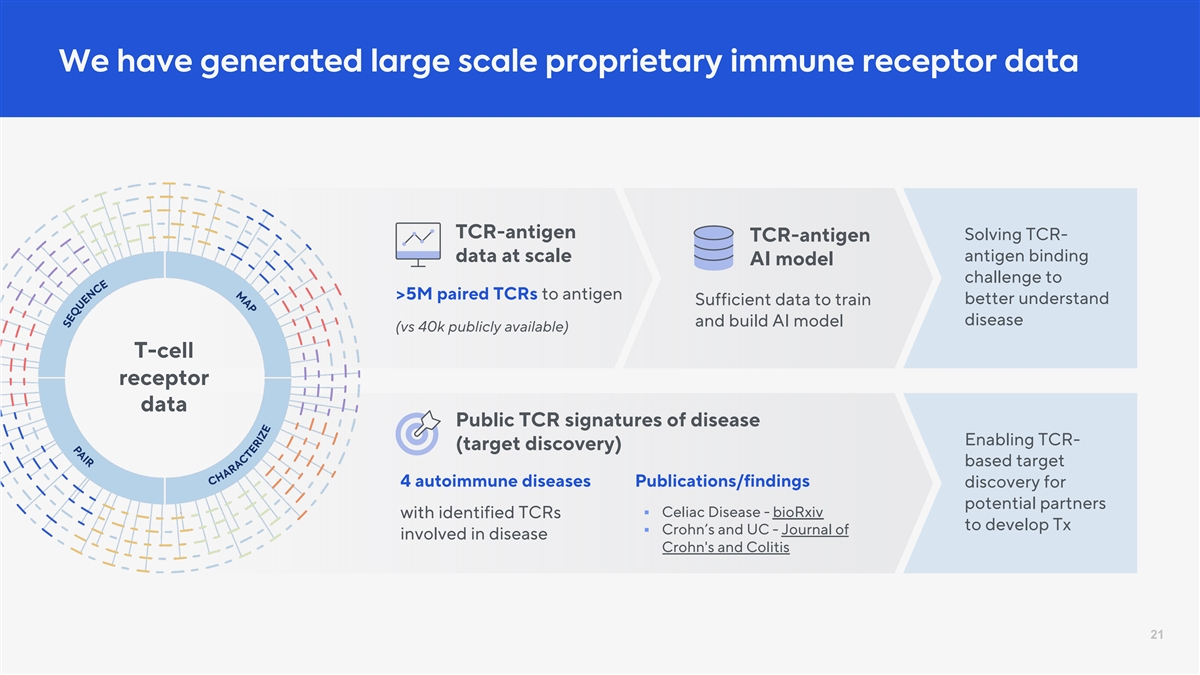
We have generated large scale proprietary immune receptor data TCR-antigen Solving TCR- TCR-antigen antigen binding data at scale AI model challenge to >5M paired TCRs to antigen better understand Sufficient data to train disease and build AI model (vs 40k publicly available) T-cell receptor data Public TCR signatures of disease Enabling TCR- (target discovery) based target 4 autoimmune diseases Publications/findings discovery for potential partners § Celiac Disease - bioRxiv with identified TCRs to develop Tx § Crohn’s and UC - Journal of involved in disease Crohn's and Colitis 21
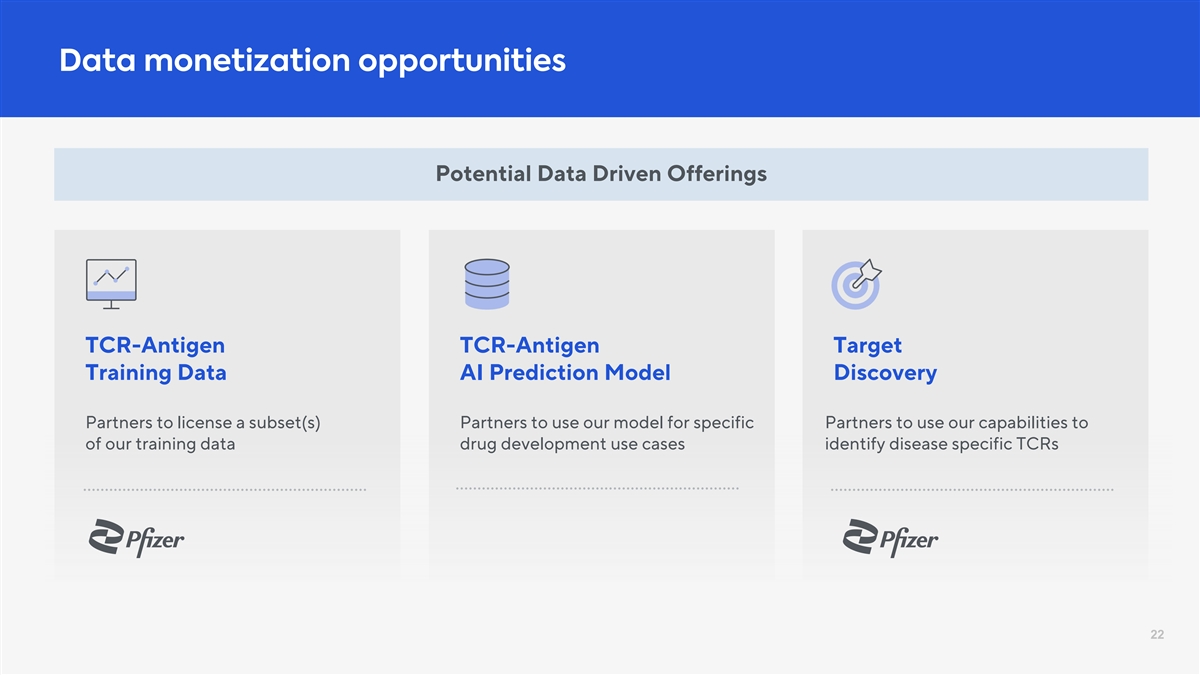
Data monetization opportunities Potential Data Driven Offerings TCR-Antigen TCR-Antigen Target Training Data AI Prediction Model Discovery Partners to license a subset(s) Partners to use our model for specific Partners to use our capabilities to of our training data drug development use cases identify disease specific TCRs 22
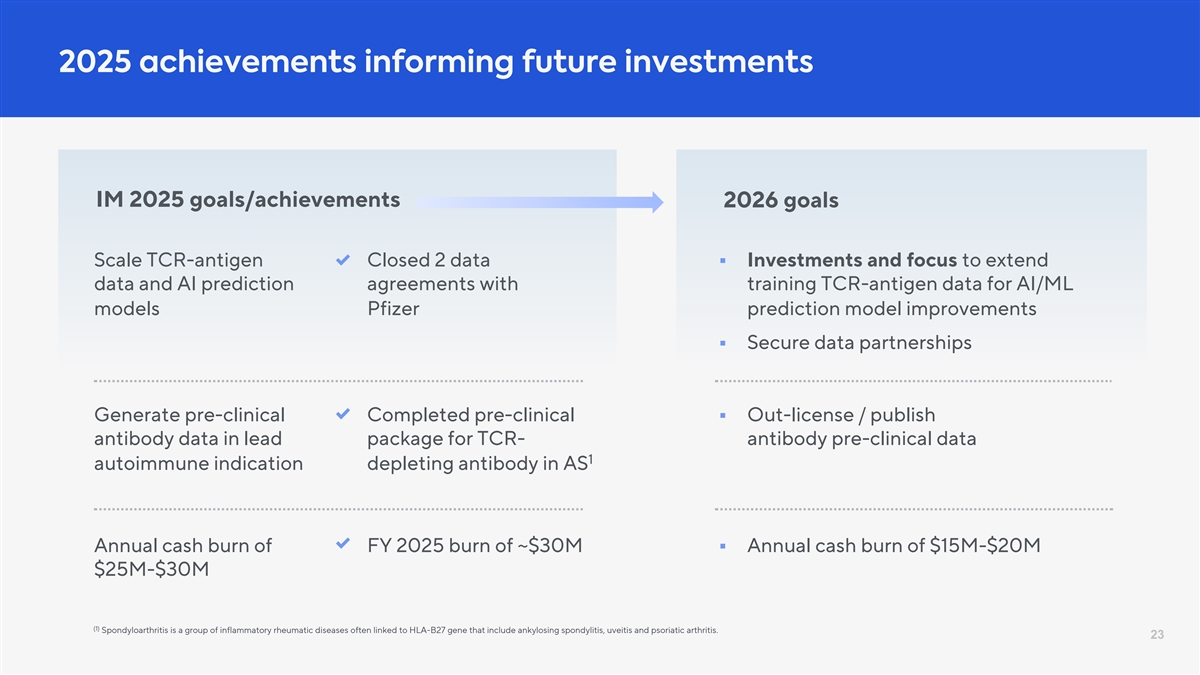
2025 achievements informing future investments IM 2025 goals/achievements 2026 goals Scale TCR-antigen Closed 2 data § Investments and focus to extend data and AI prediction agreements with training TCR-antigen data for AI/ML models Pfizer prediction model improvements § Secure data partnerships Generate pre-clinical Completed pre-clinical § Out-license / publish antibody data in lead package for TCR- antibody pre-clinical data 1 autoimmune indication depleting antibody in AS Annual cash burn of FY 2025 burn of ~$30M § Annual cash burn of $15M-$20M $25M-$30M (1) Spondyloarthritis is a group of inflammatory rheumatic diseases often linked to HLA-B27 gene that include ankylosing spondylitis, uveitis and psoriatic arthritis. 23
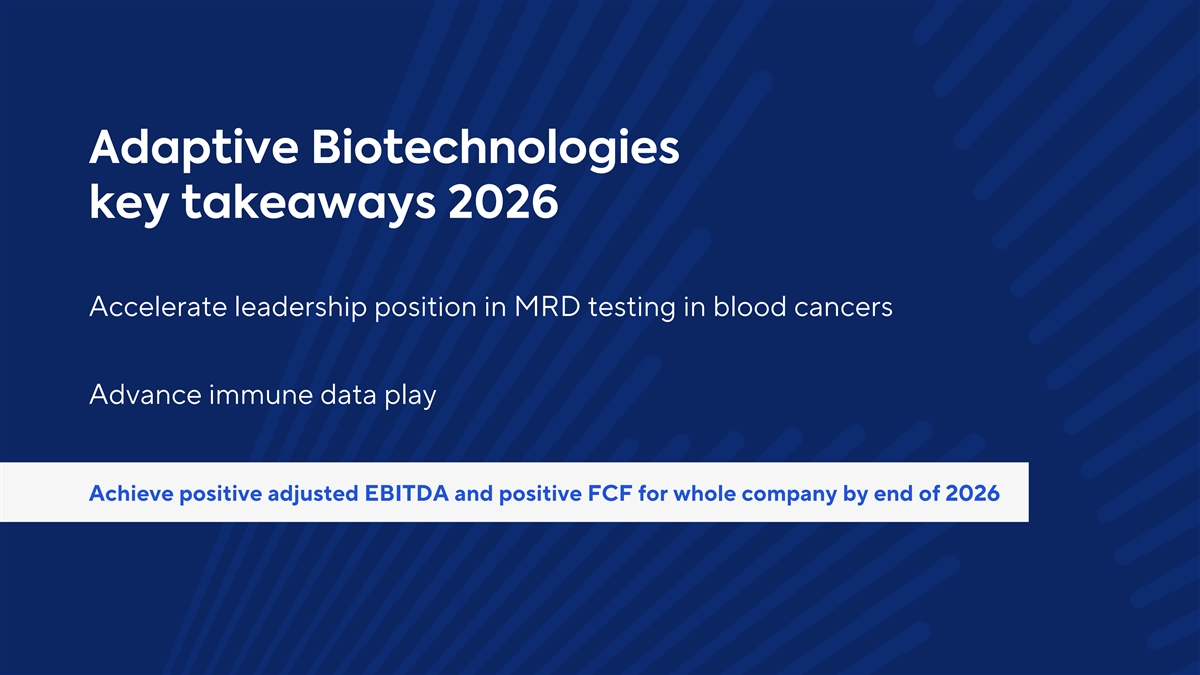
Adaptive Biotechnologies key takeaways 2026 Accelerate leadership position in MRD testing in blood cancers Advance immune data play Achieve positive adjusted EBITDA and positive FCF for whole company by end of 2026