

Ryerson Quarterly Release Presentation Q3 2025 .2
Important Information About Ryerson Holding Corporation These materials do not constitute an offer or solicitation to purchase or sell securities of Ryerson Holding Corporation (“Ryerson” or “the Company”) or its subsidiaries and no investment decision should be made based upon the information provided herein. Ryerson strongly urges you to review its filings with the Securities and Exchange Commission, which can be found at https://ir.ryerson.com/financials/sec-filings/default.aspx. This site also provides additional information about Ryerson. Safe Harbor Provision Certain statements made in this release and other written or oral statements made by or on behalf of the Company constitute “forward-looking statements” within the meaning of the federal securities laws, including statements regarding our future performance, as well as management's expectations, beliefs, intentions, plans, estimates, objectives, or projections relating to the future. Such statements can be identified by the use of forward-looking terminology such as “objectives,” “goals,” “preliminary,” “range,” “believes,” “expects,” “may,” “estimates,” “will,” “should,” “plans,” or “anticipates” or the negative thereof or other variations thereon or comparable terminology, or by discussions of strategy. The Company cautions that any such forward-looking statements are not guarantees of future performance and may involve significant risks and uncertainties, and that actual results may vary materially from those in the forward-looking statements as a result of various factors. Among the factors that significantly impact our business are: the cyclicality of our business; the highly competitive, volatile, and fragmented metals industry in which we operate; the impact of geopolitical events; fluctuating metal prices; our indebtedness and the covenants in instruments governing such indebtedness; the integration of acquired operations; regulatory and other operational risks associated with our operations located inside and outside of the United States; the influence of a single investor group over our policies and procedures; work stoppages; obligations under certain employee retirement benefit plans; currency fluctuations; and consolidation in the metals industry. Forward-looking statements should, therefore, be considered in light of various factors, including those set forth above and those set forth under “Risk Factors” in our most recent annual report on Form 10-K for the year ended December 31, 2024, and in our other filings with the Securities and Exchange Commission. Moreover, we caution against placing undue reliance on these statements, which speak only as of the date they were made. The Company does not undertake any obligation to publicly update or revise any forward-looking statements to reflect future events or circumstances, new information or otherwise. Non-GAAP Measures Certain measures contained in these slides or the related presentation are not measures calculated in accordance with generally accepted accounting principles (“GAAP”). They should not be considered a replacement for GAAP results. Non-GAAP financial measures appearing in these slides are identified in the footnotes. A reconciliation of these non-GAAP measures to the most directly comparable GAAP financial measures is included in the Appendix.
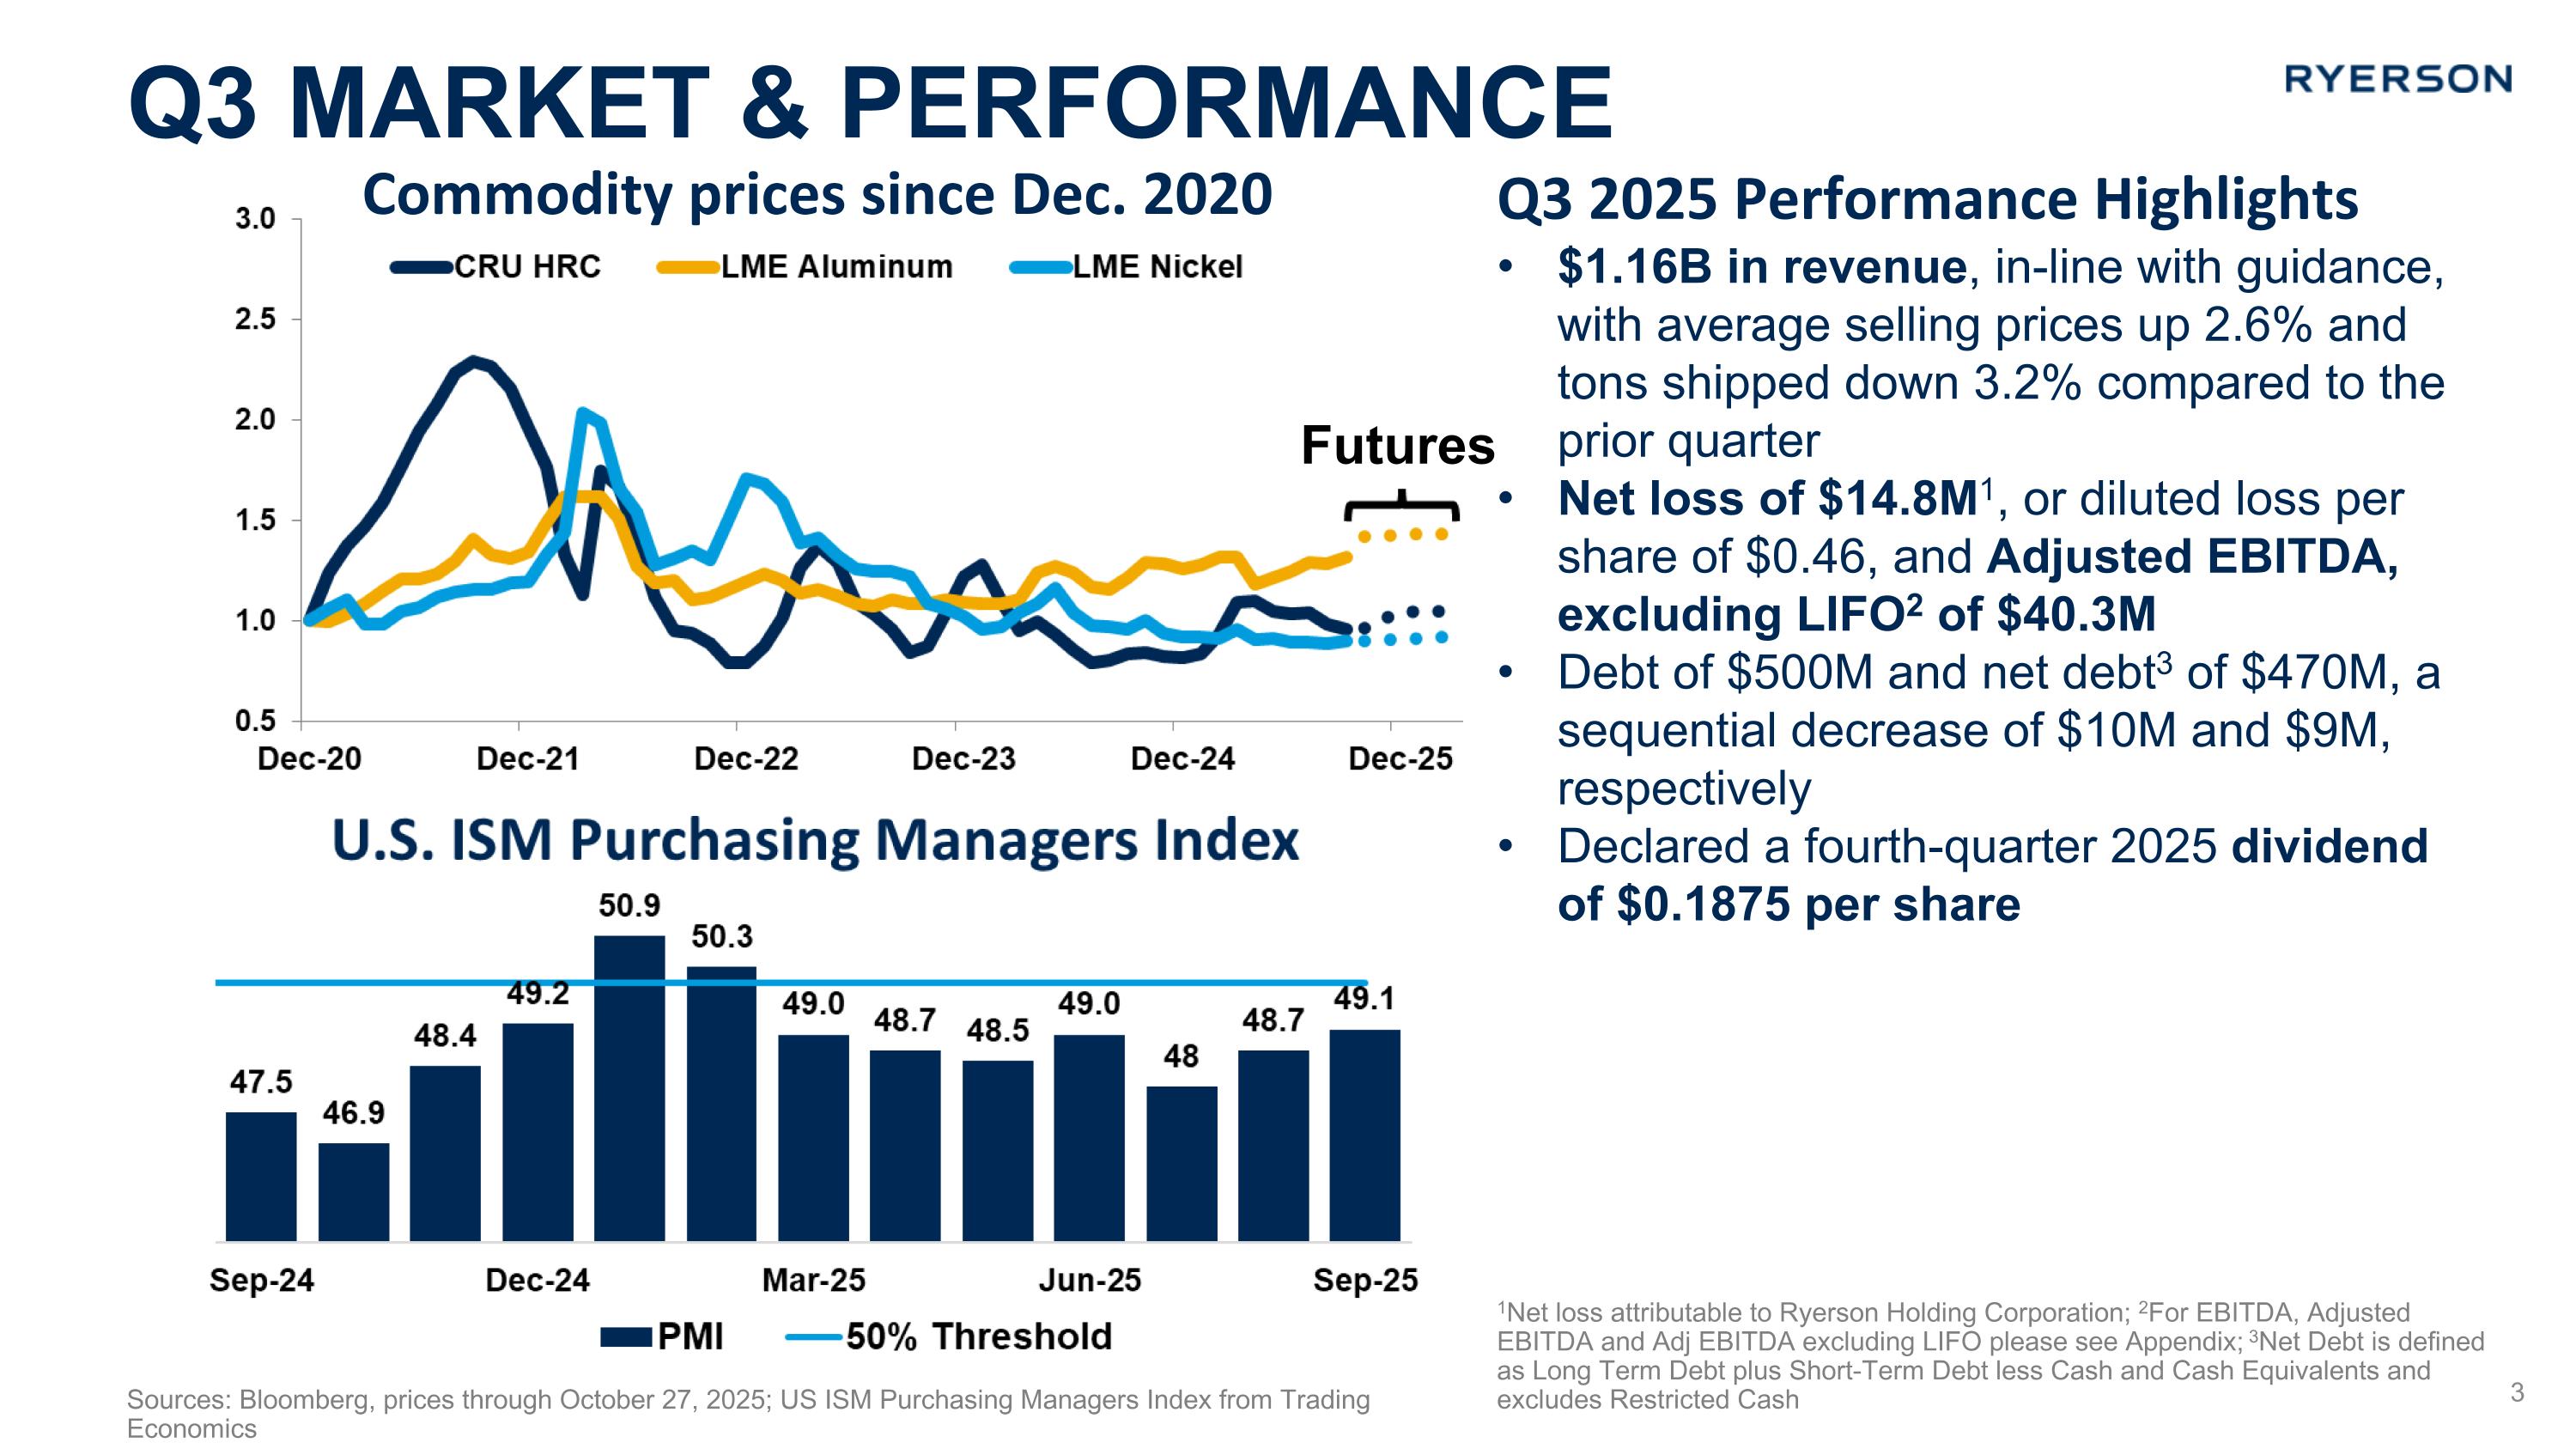
Commodity prices since Dec. 2020 Sources: Bloomberg, prices through October 27, 2025; US ISM Purchasing Managers Index from Trading Economics Q3 market & performance Futures Q3 2025 Performance Highlights $1.16B in revenue, in-line with guidance, with average selling prices up 2.6% and tons shipped down 3.2% compared to the prior quarter Net loss of $14.8M1, or diluted loss per share of $0.46, and Adjusted EBITDA, excluding LIFO2 of $40.3M Debt of $500M and net debt3 of $470M, a sequential decrease of $10M and $9M, respectively Declared a fourth-quarter 2025 dividend of $0.1875 per share 1Net loss attributable to Ryerson Holding Corporation; 2For EBITDA, Adjusted EBITDA and Adj EBITDA excluding LIFO please see Appendix; 3Net Debt is defined as Long Term Debt plus Short-Term Debt less Cash and Cash Equivalents and excludes Restricted Cash
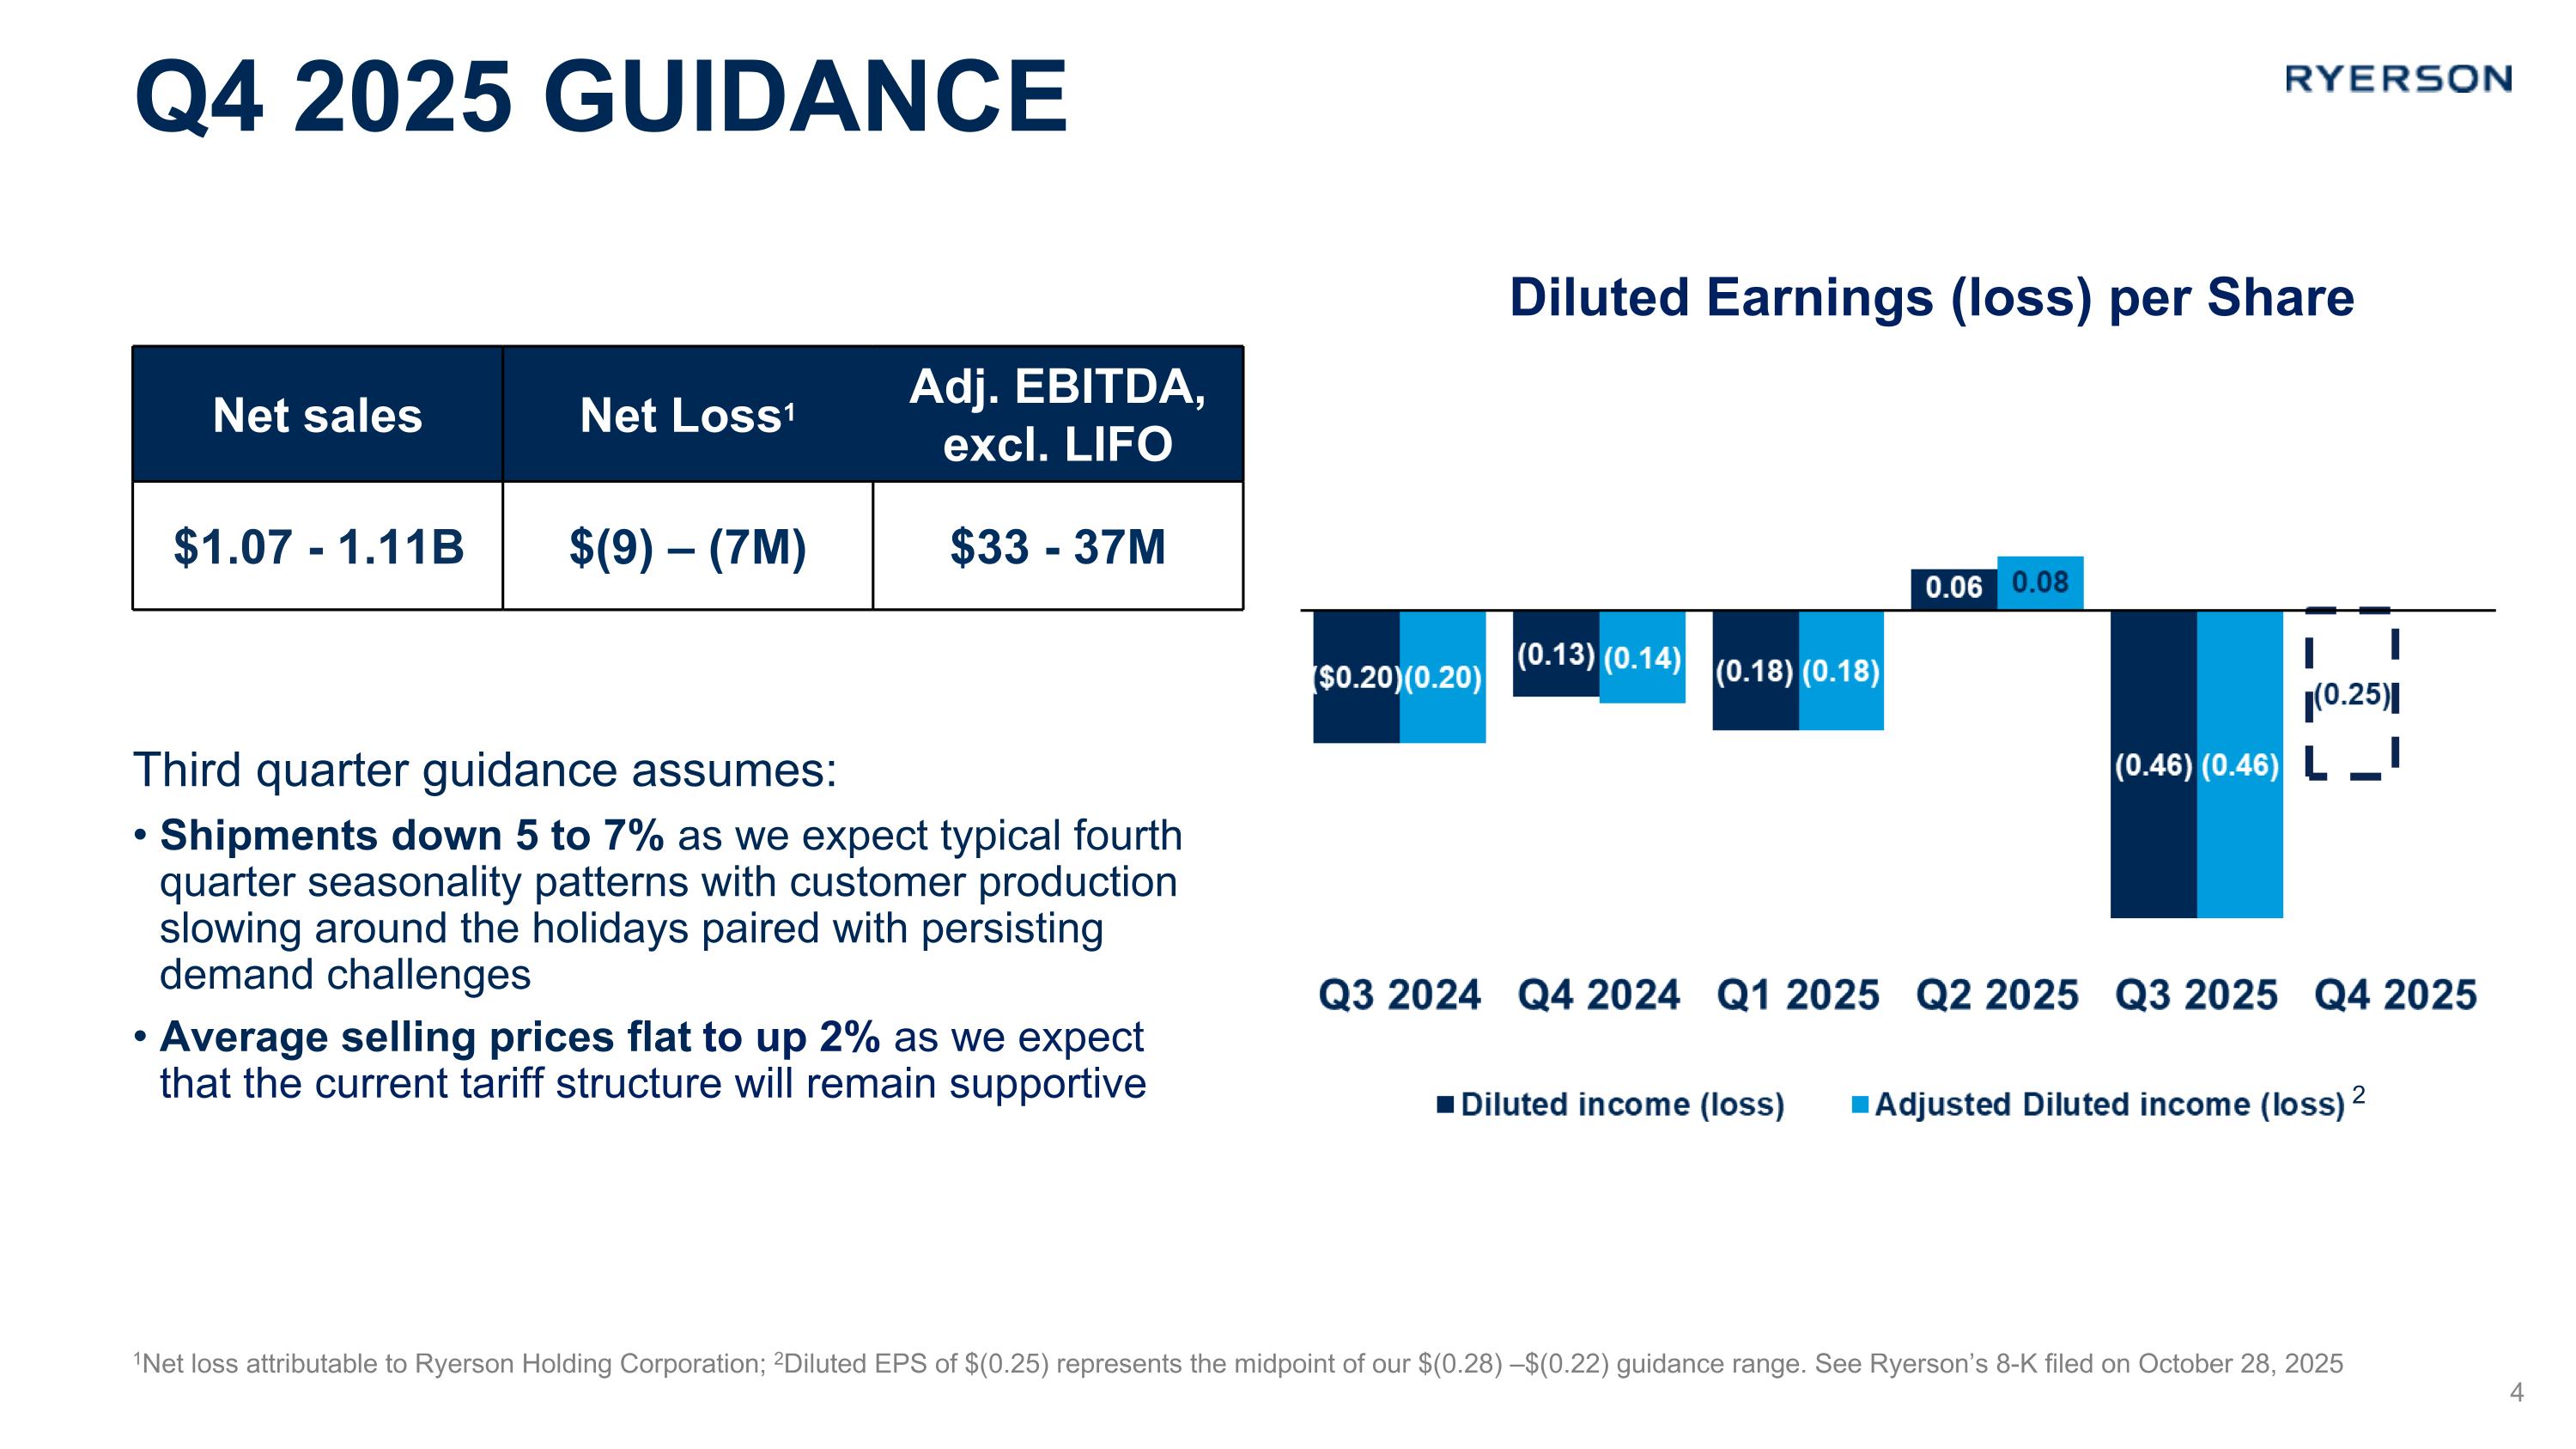
1Net loss attributable to Ryerson Holding Corporation; 2Diluted EPS of $(0.25) represents the midpoint of our $(0.28) –$(0.22) guidance range. See Ryerson’s 8-K filed on October 28, 2025 Net sales Net Loss1 Adj. EBITDA, excl. LIFO $1.07 - 1.11B $(9) – (7M) $33 - 37M Third quarter guidance assumes: Shipments down 5 to 7% as we expect typical fourth quarter seasonality patterns with customer production slowing around the holidays paired with persisting demand challenges Average selling prices flat to up 2% as we expect that the current tariff structure will remain supportive Diluted Earnings (loss) per Share Q4 2025 Guidance 2
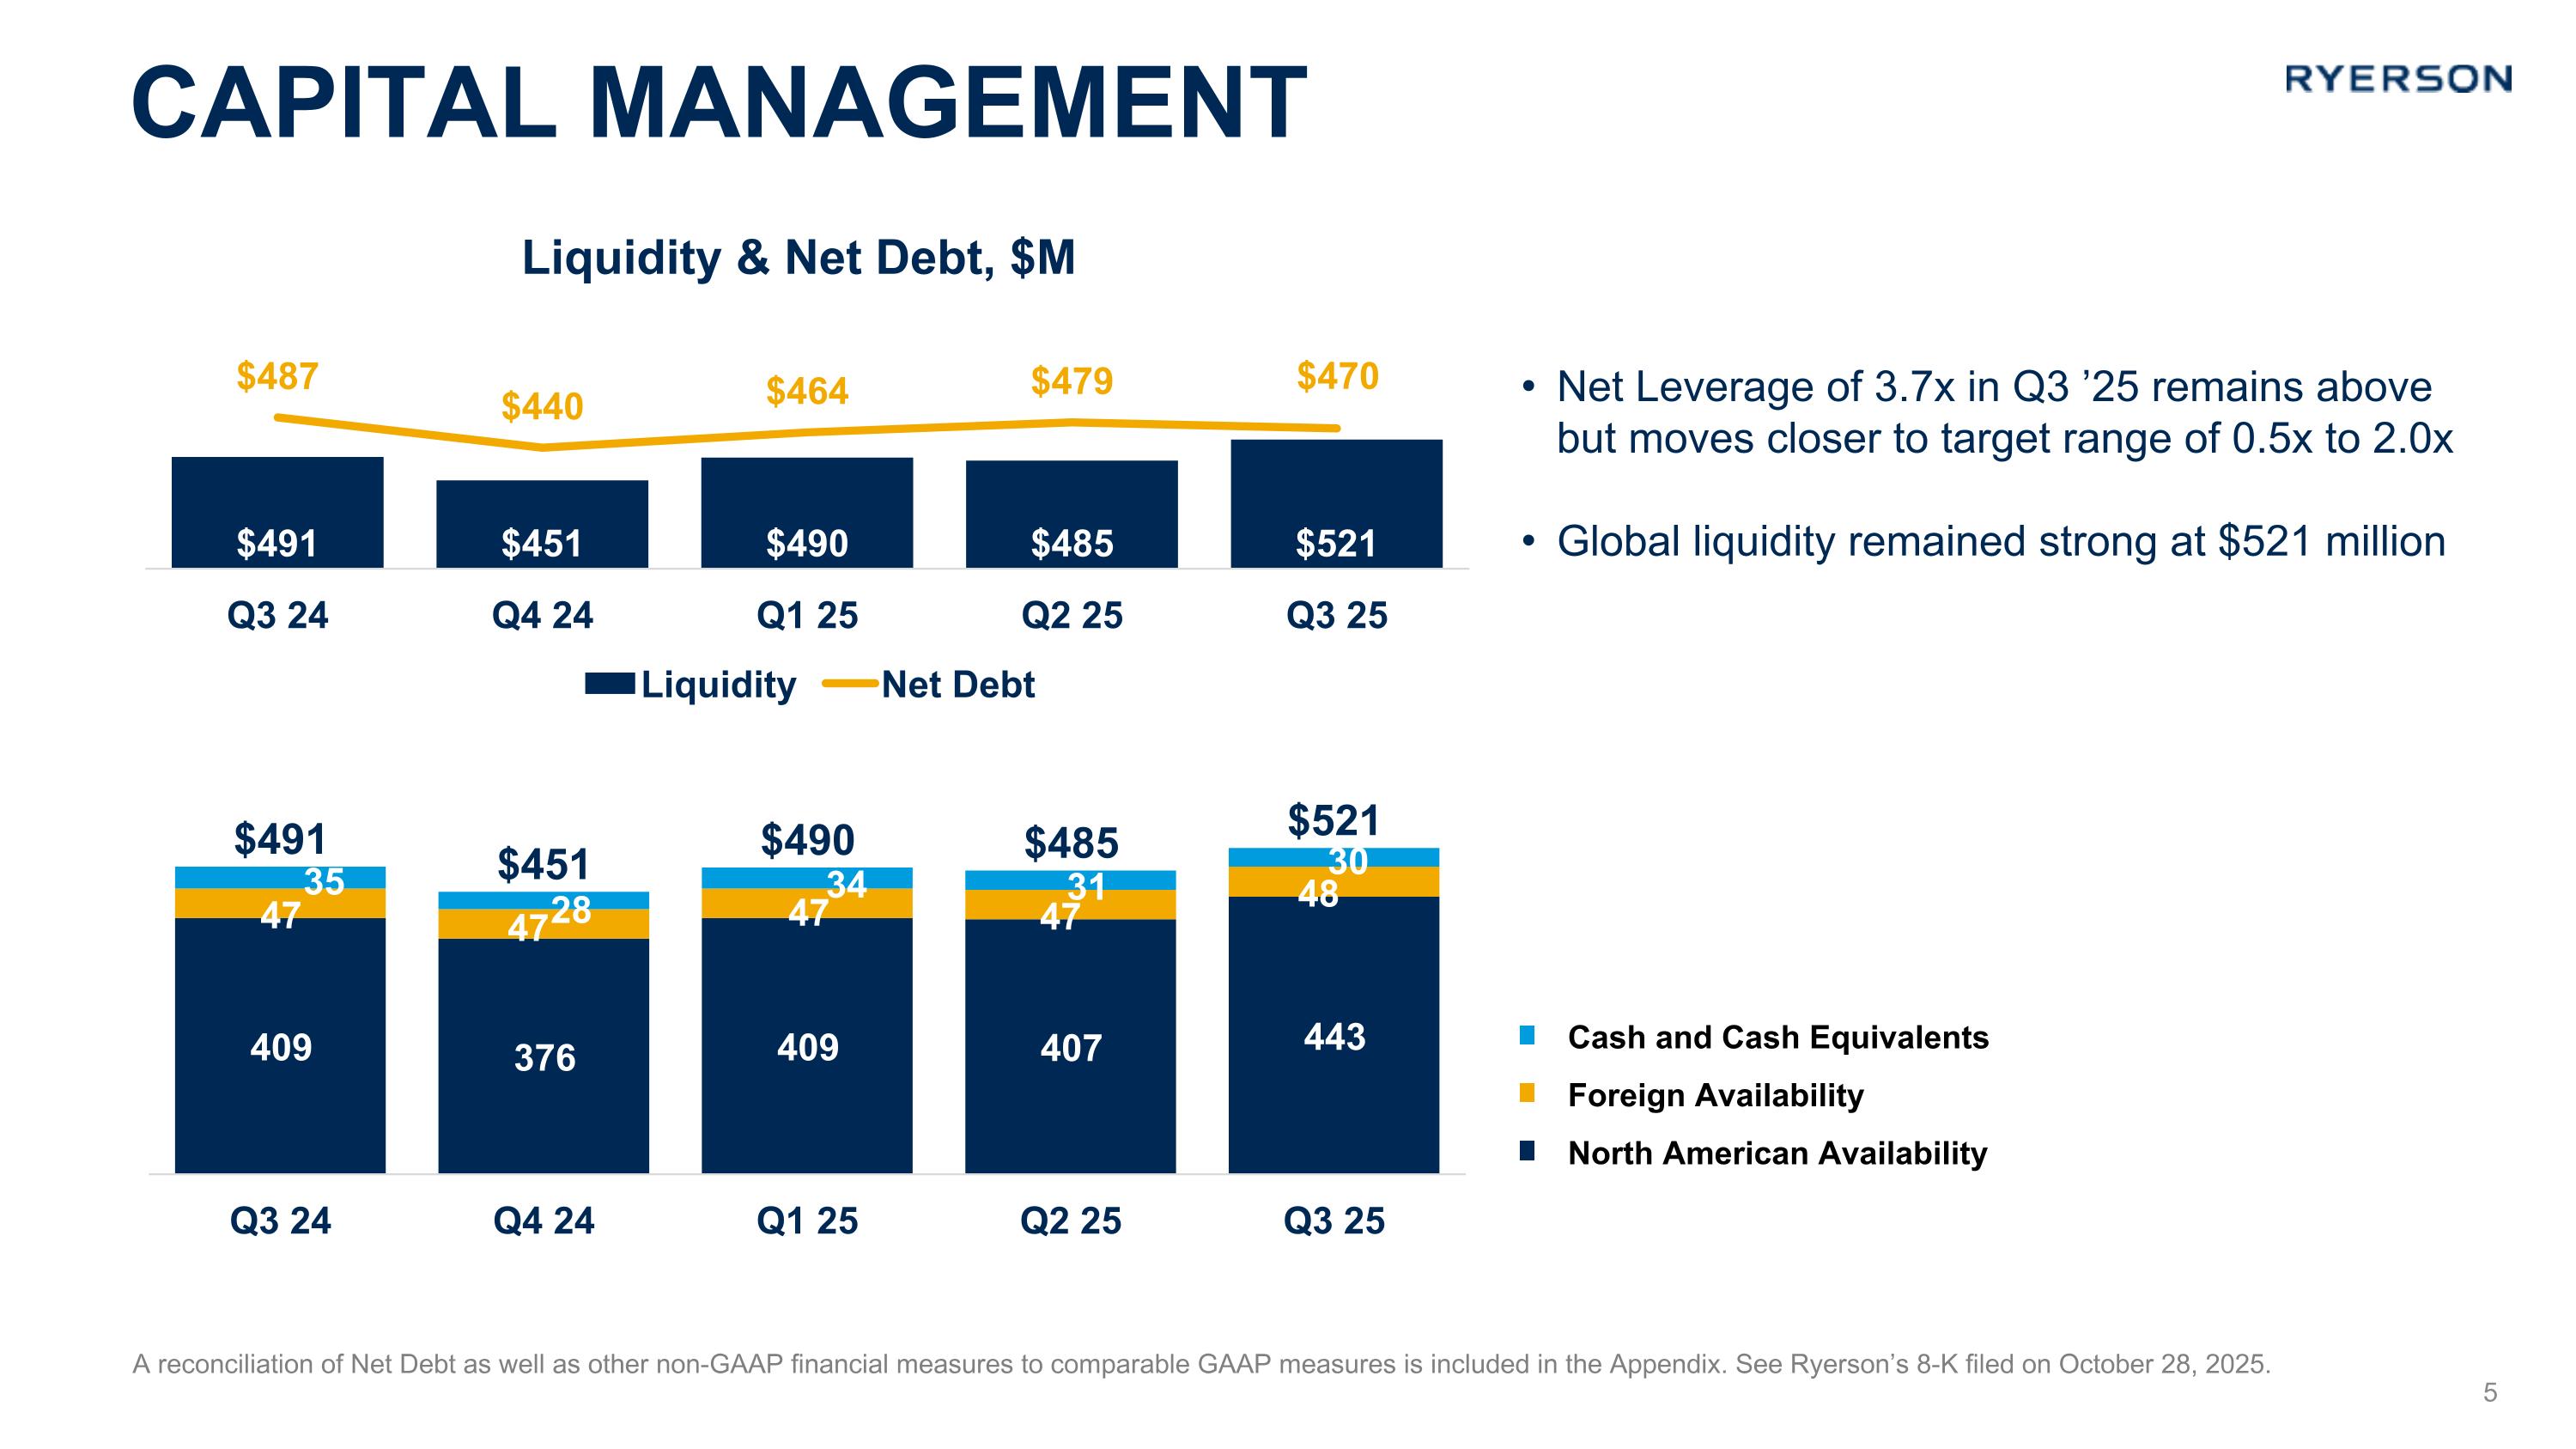
A reconciliation of Net Debt as well as other non-GAAP financial measures to comparable GAAP measures is included in the Appendix. See Ryerson’s 8-K filed on October 28, 2025. Net Leverage of 3.7x in Q3 ’25 remains above but moves closer to target range of 0.5x to 2.0x Global liquidity remained strong at $521 million Capital Management Liquidity & Net Debt, $M Cash and Cash Equivalents Foreign Availability North American Availability 5
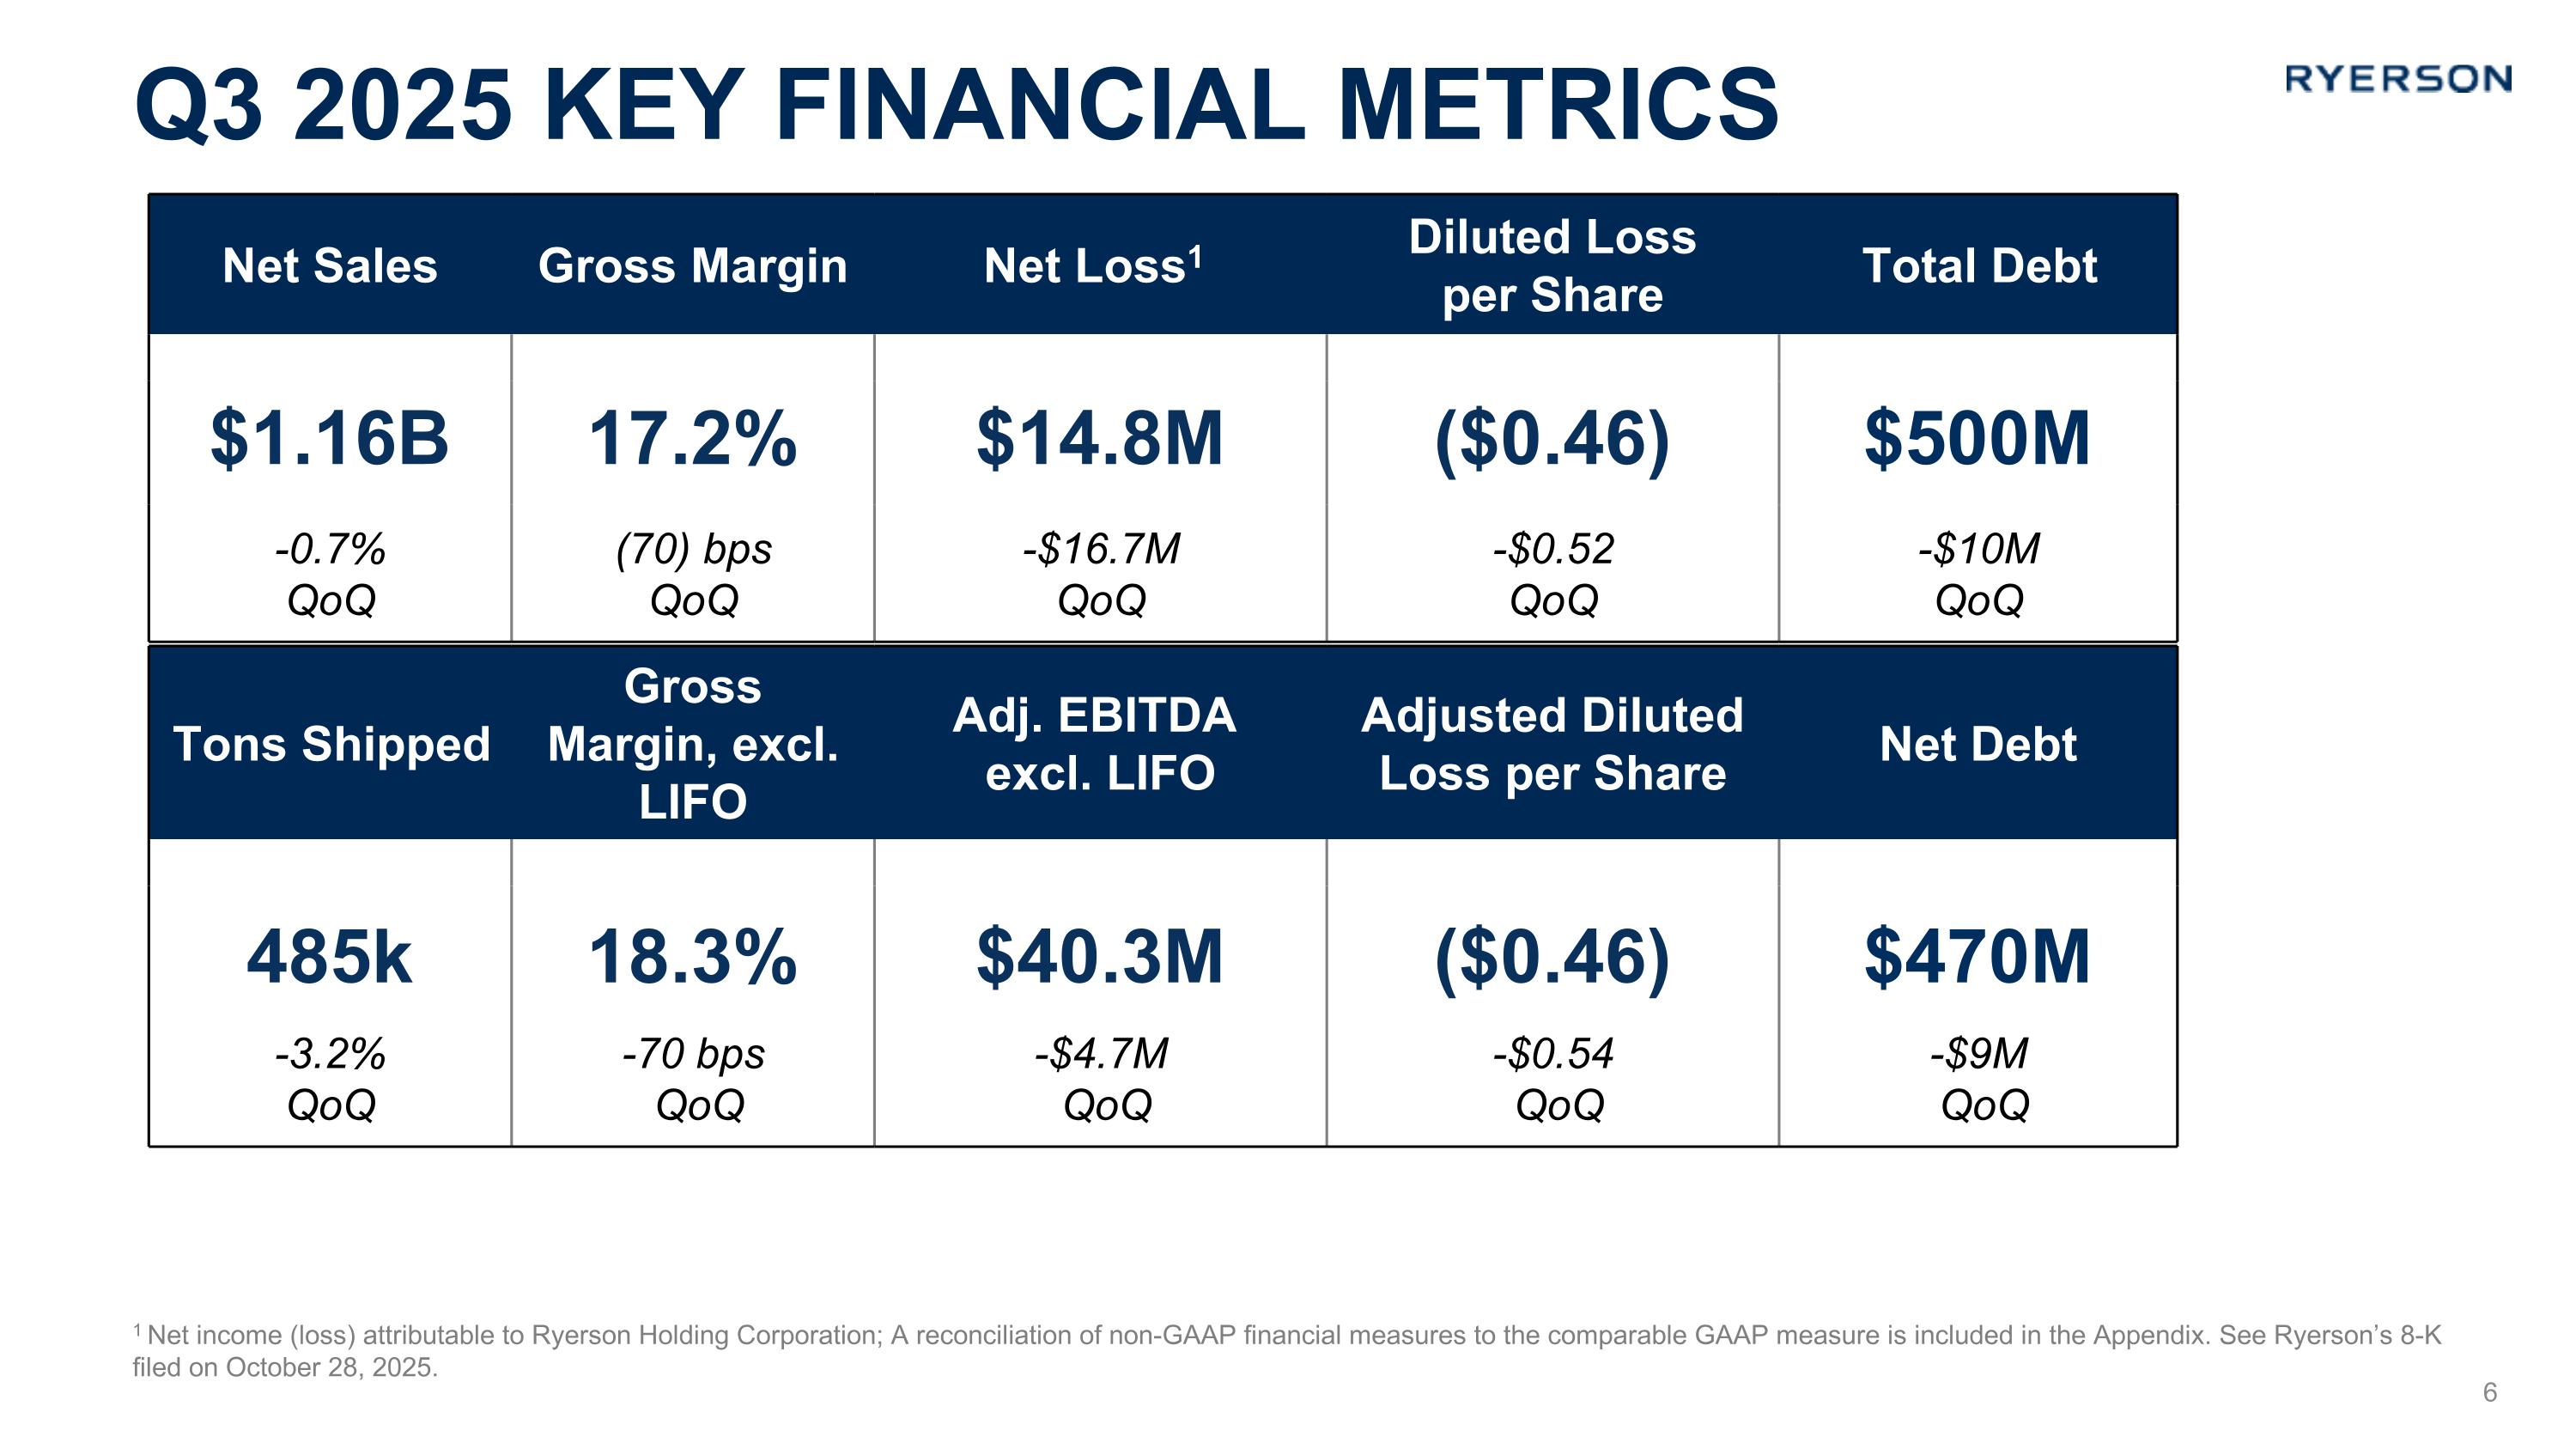
Q3 2025 key financial metrics 1 Net income (loss) attributable to Ryerson Holding Corporation; A reconciliation of non-GAAP financial measures to the comparable GAAP measure is included in the Appendix. See Ryerson’s 8-K filed on October 28, 2025. Net Sales Gross Margin Net Loss1 Diluted Loss per Share Total Debt $1.16B 17.2% $14.8M ($0.46) $500M -0.7% QoQ (70) bps QoQ -$16.7M QoQ -$0.52 QoQ -$10M QoQ 6 Tons Shipped Gross Margin, excl. LIFO Adj. EBITDA excl. LIFO Adjusted Diluted Loss per Share Net Debt 485k 18.3% $40.3M ($0.46) $470M -3.2% QoQ -70 bps QoQ -$4.7M QoQ -$0.54 QoQ -$9M QoQ
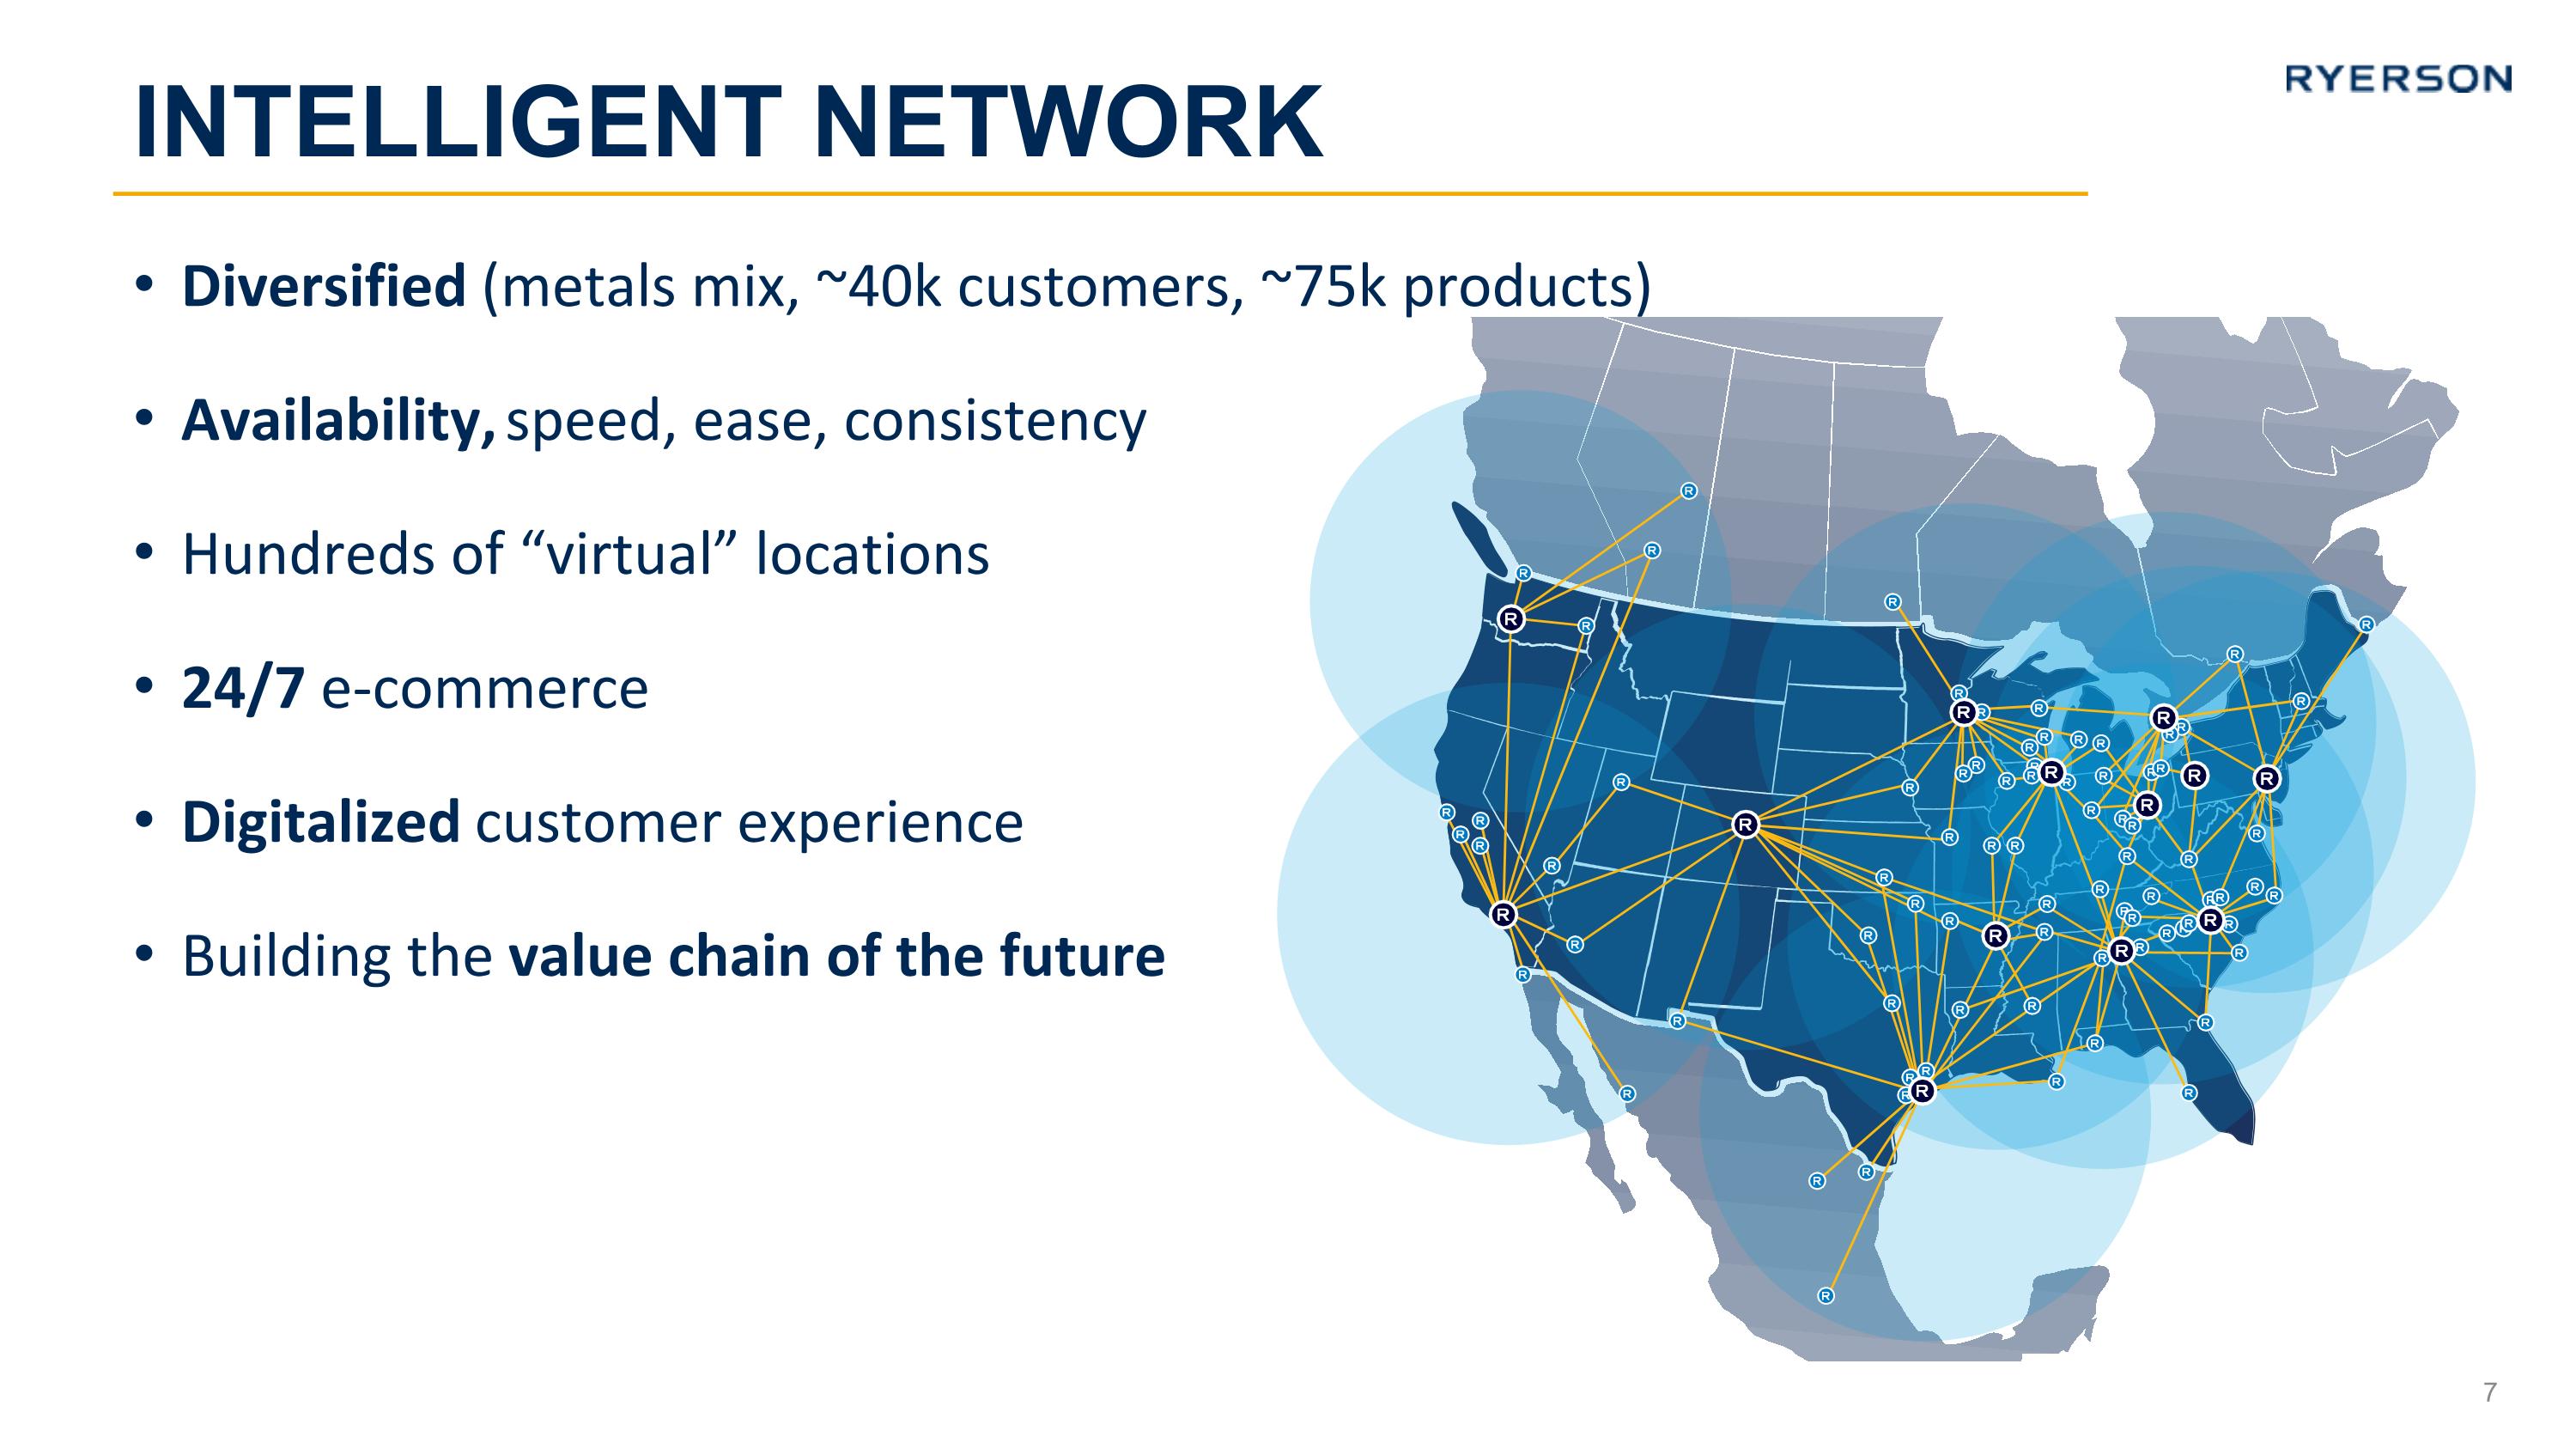
Diversified (metals mix, ~40k customers, ~75k products) Availability, speed, ease, consistency Hundreds of “virtual” locations 24/7 e-commerce Digitalized customer experience Building the value chain of the future Intelligent Network
Appendix
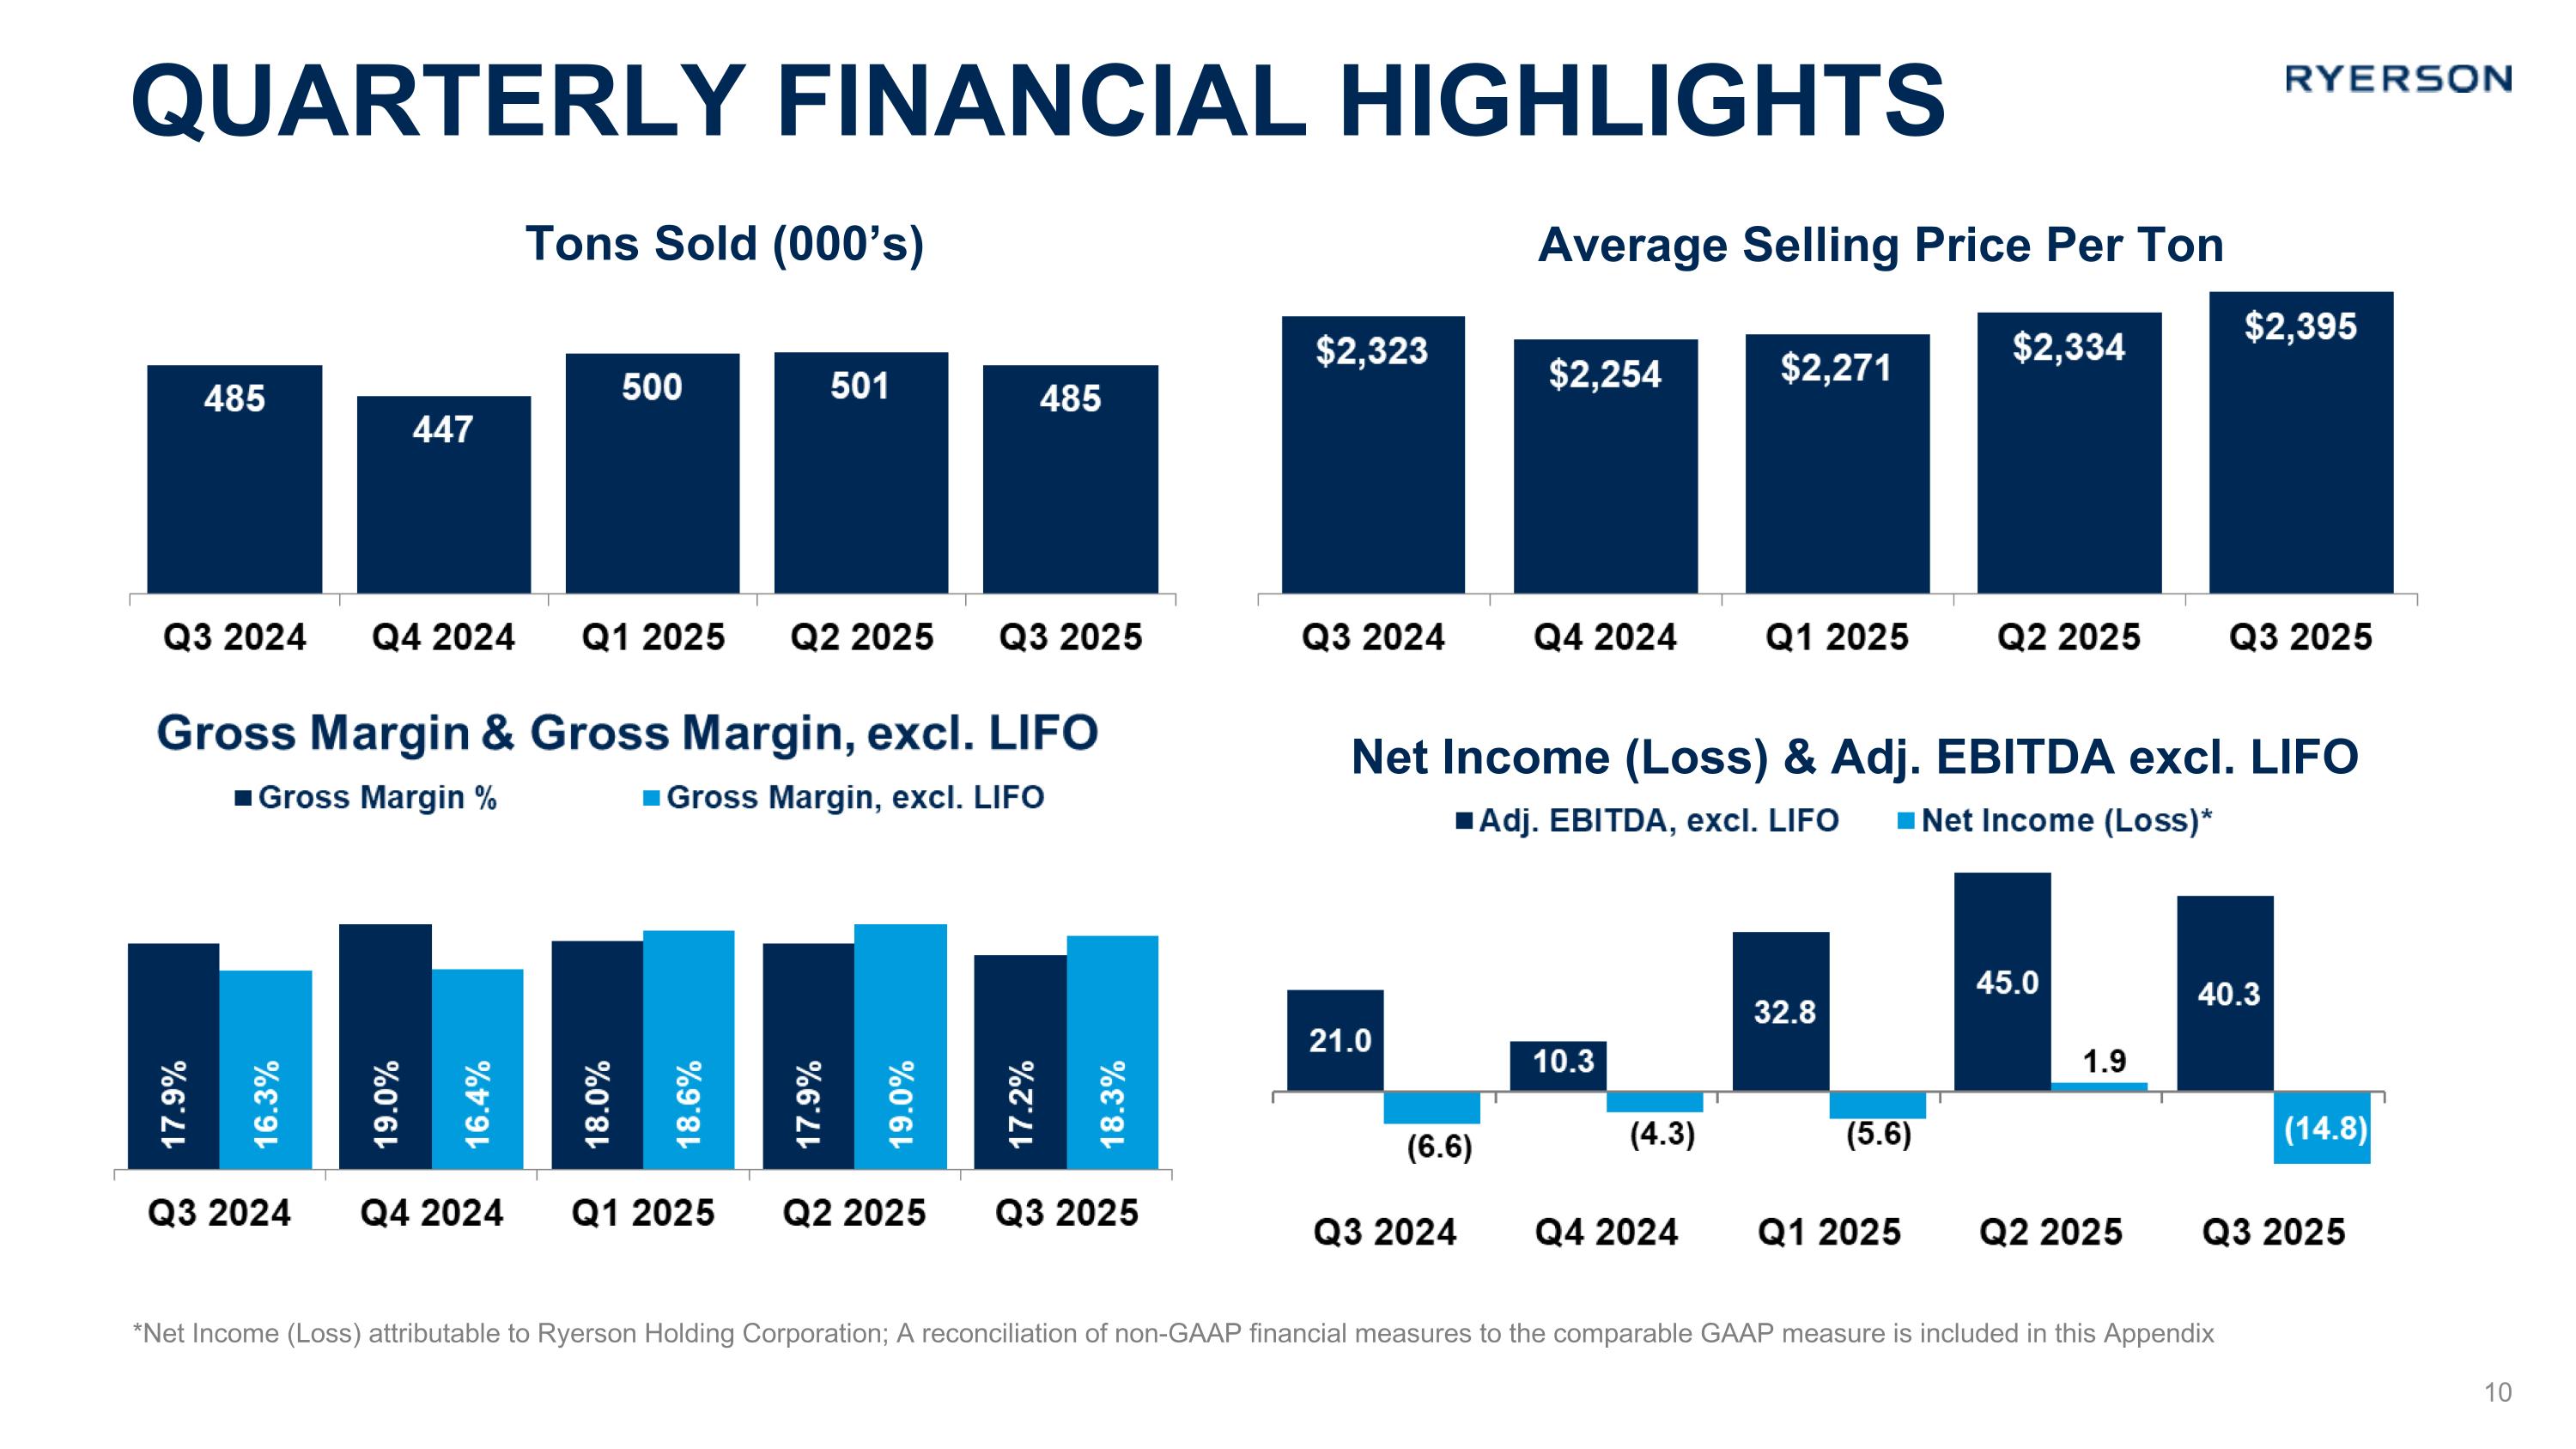
Quarterly financial highlights *Net Income (Loss) attributable to Ryerson Holding Corporation; A reconciliation of non-GAAP financial measures to the comparable GAAP measure is included in this Appendix Average Selling Price Per Ton Tons Sold (000’s) Net Income (Loss) & Adj. EBITDA excl. LIFO
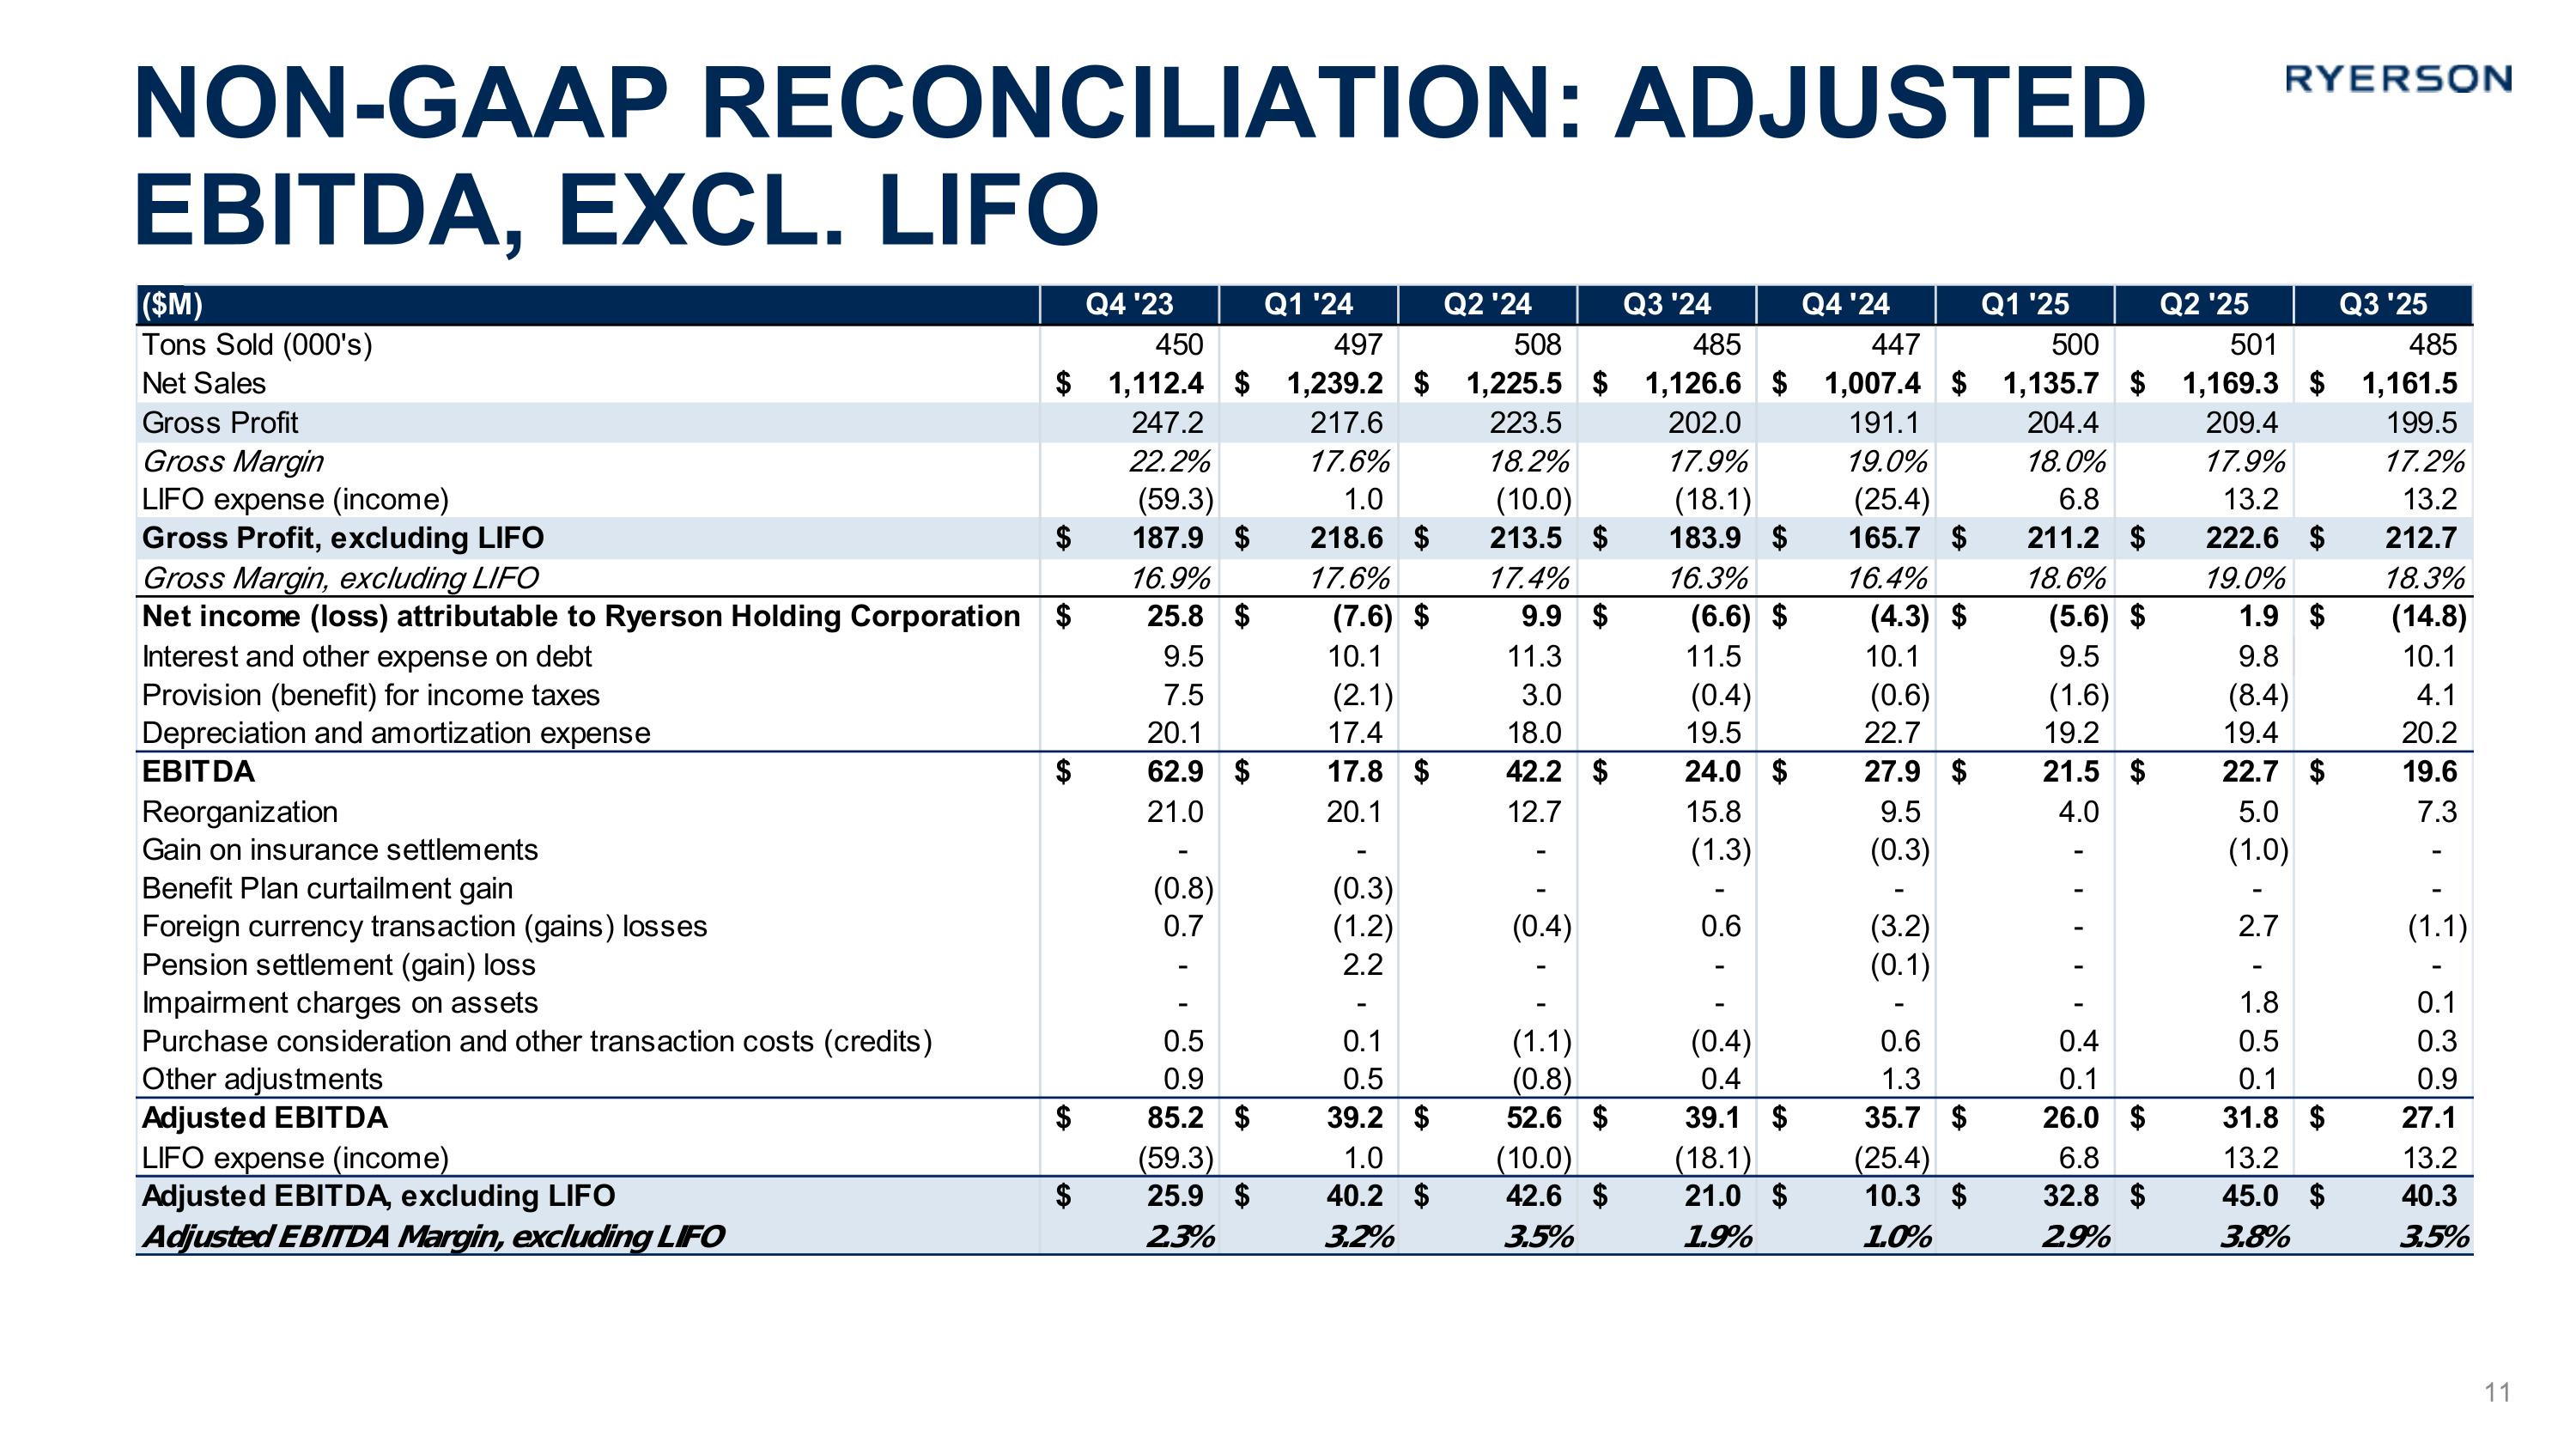
Non-GAAP Reconciliation: Adjusted EBITDA, excl. LIFO 11
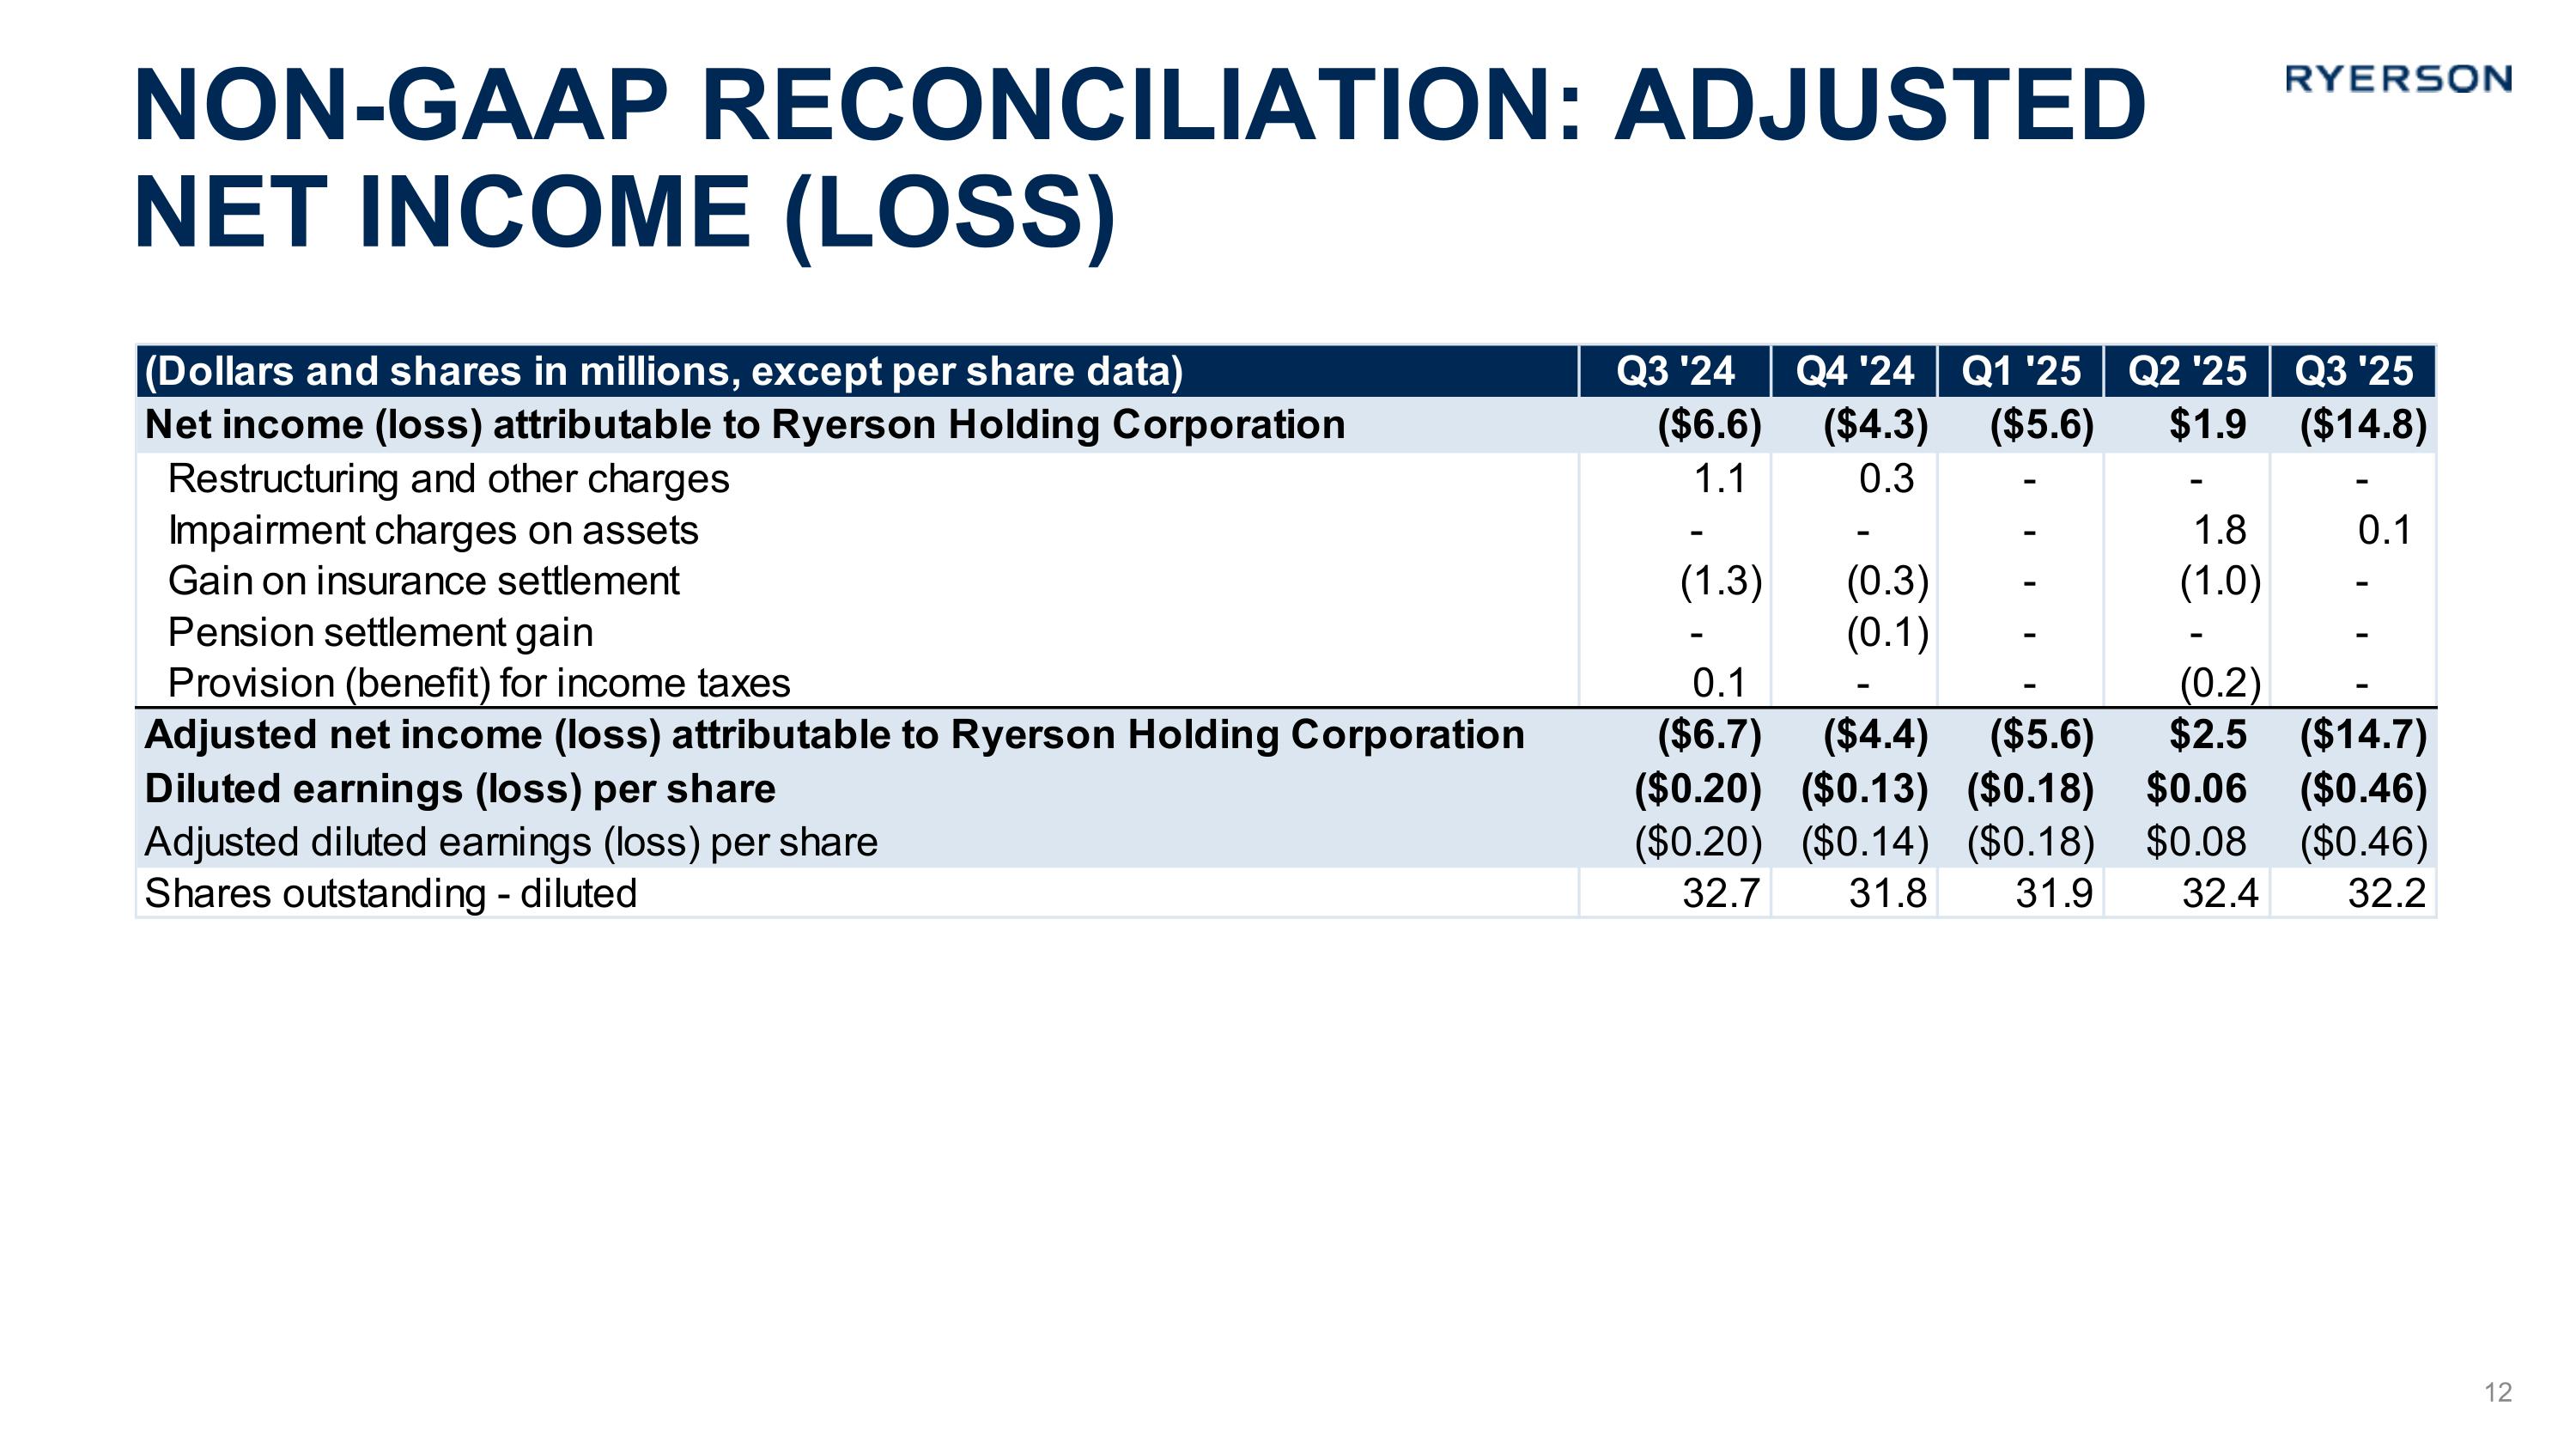
Non-GAAP Reconciliation: Adjusted Net Income (loss) 12
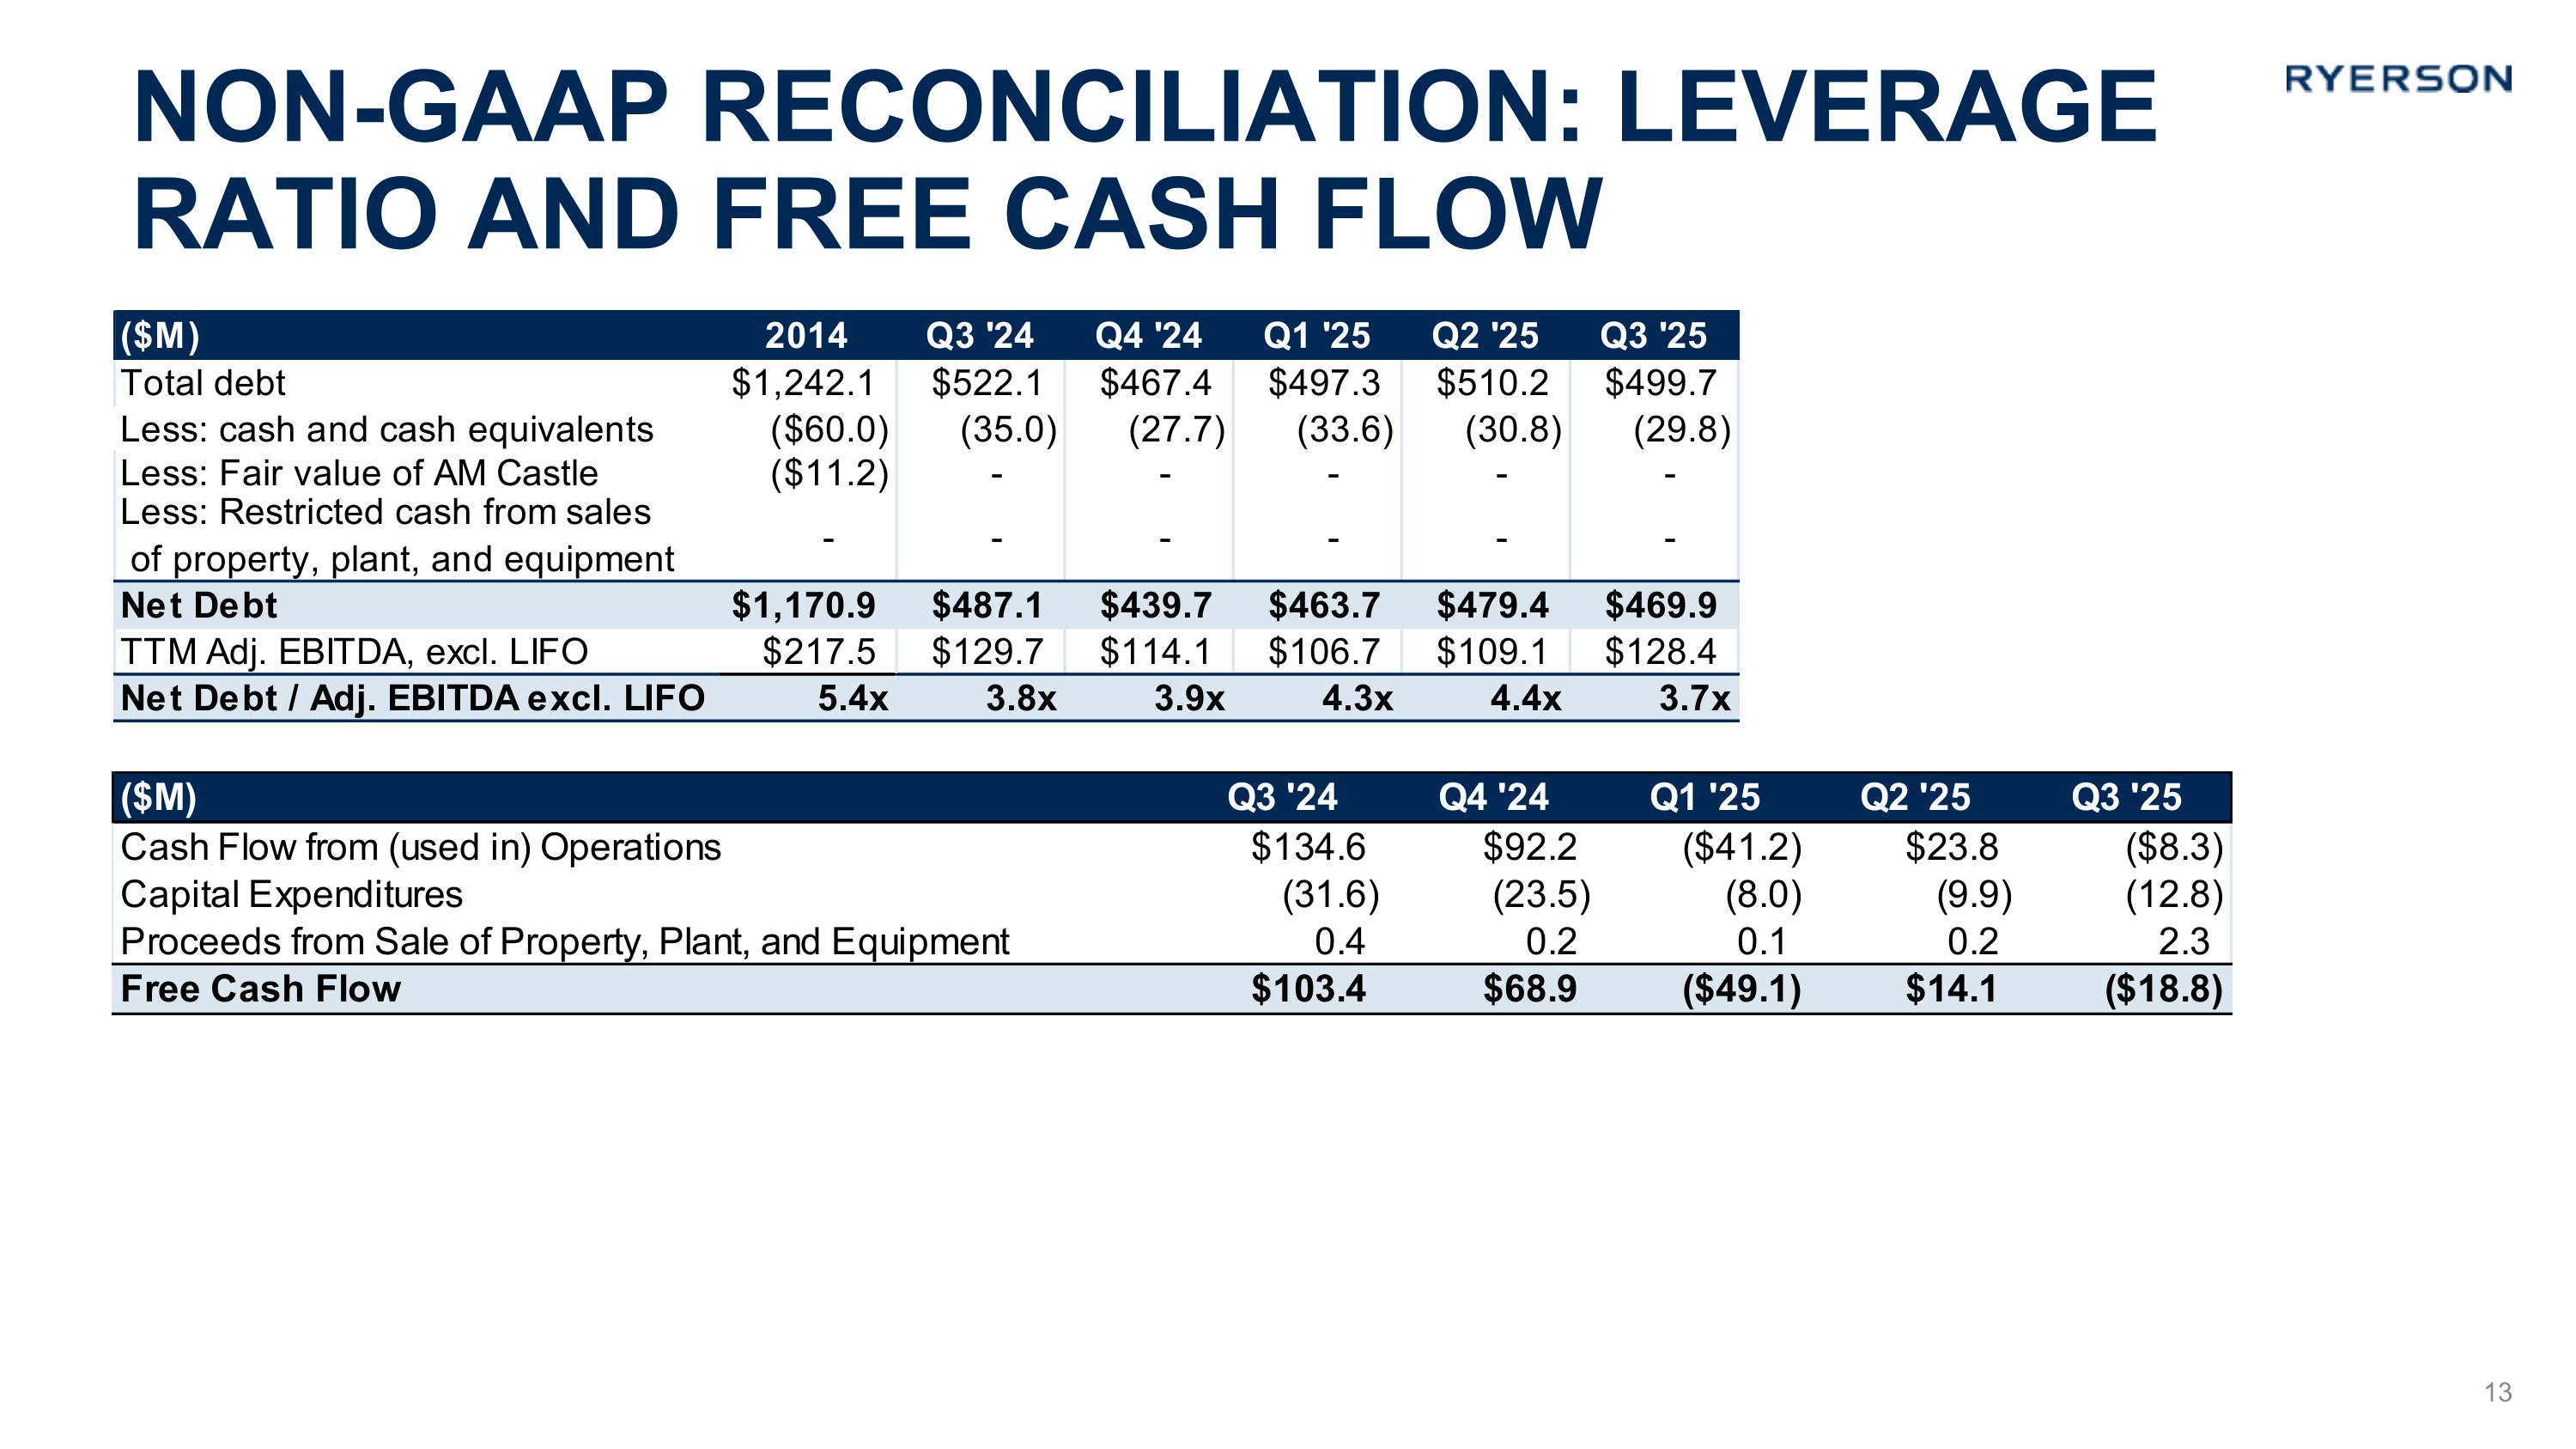
Non-GAAP Reconciliation: leverage ratio and Free cash flow 13
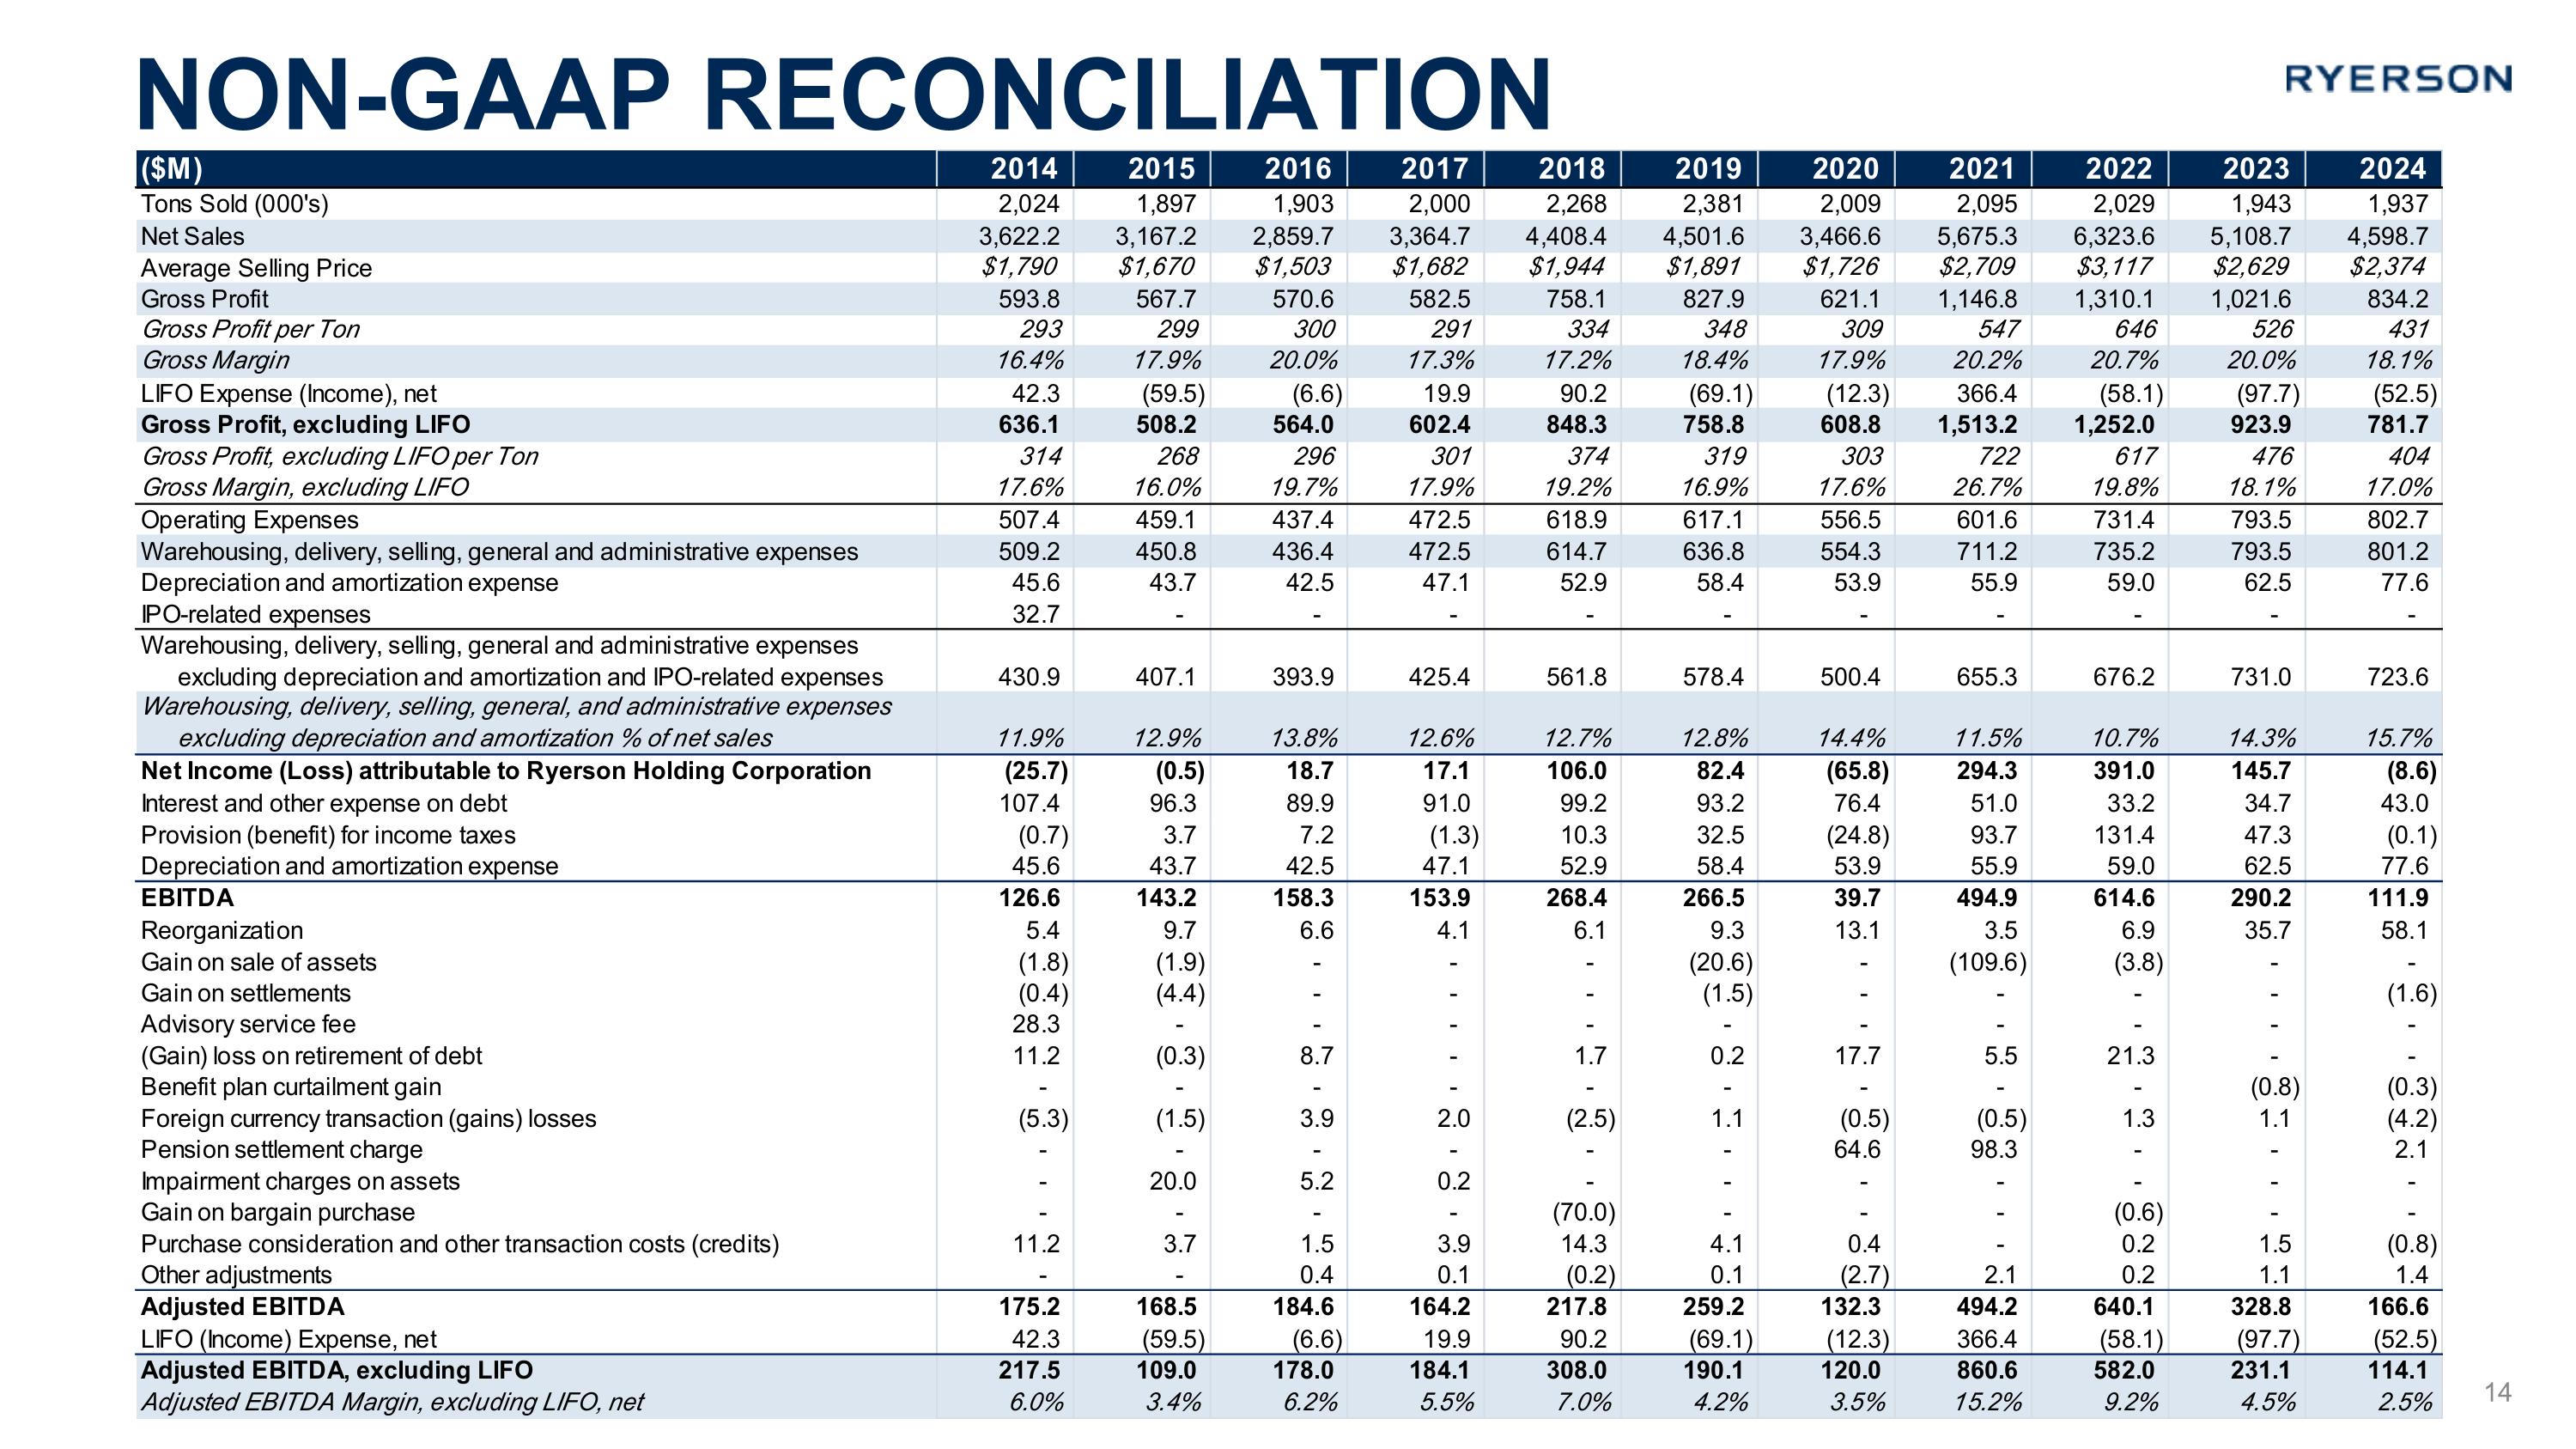
Non-GAAP Reconciliation 14
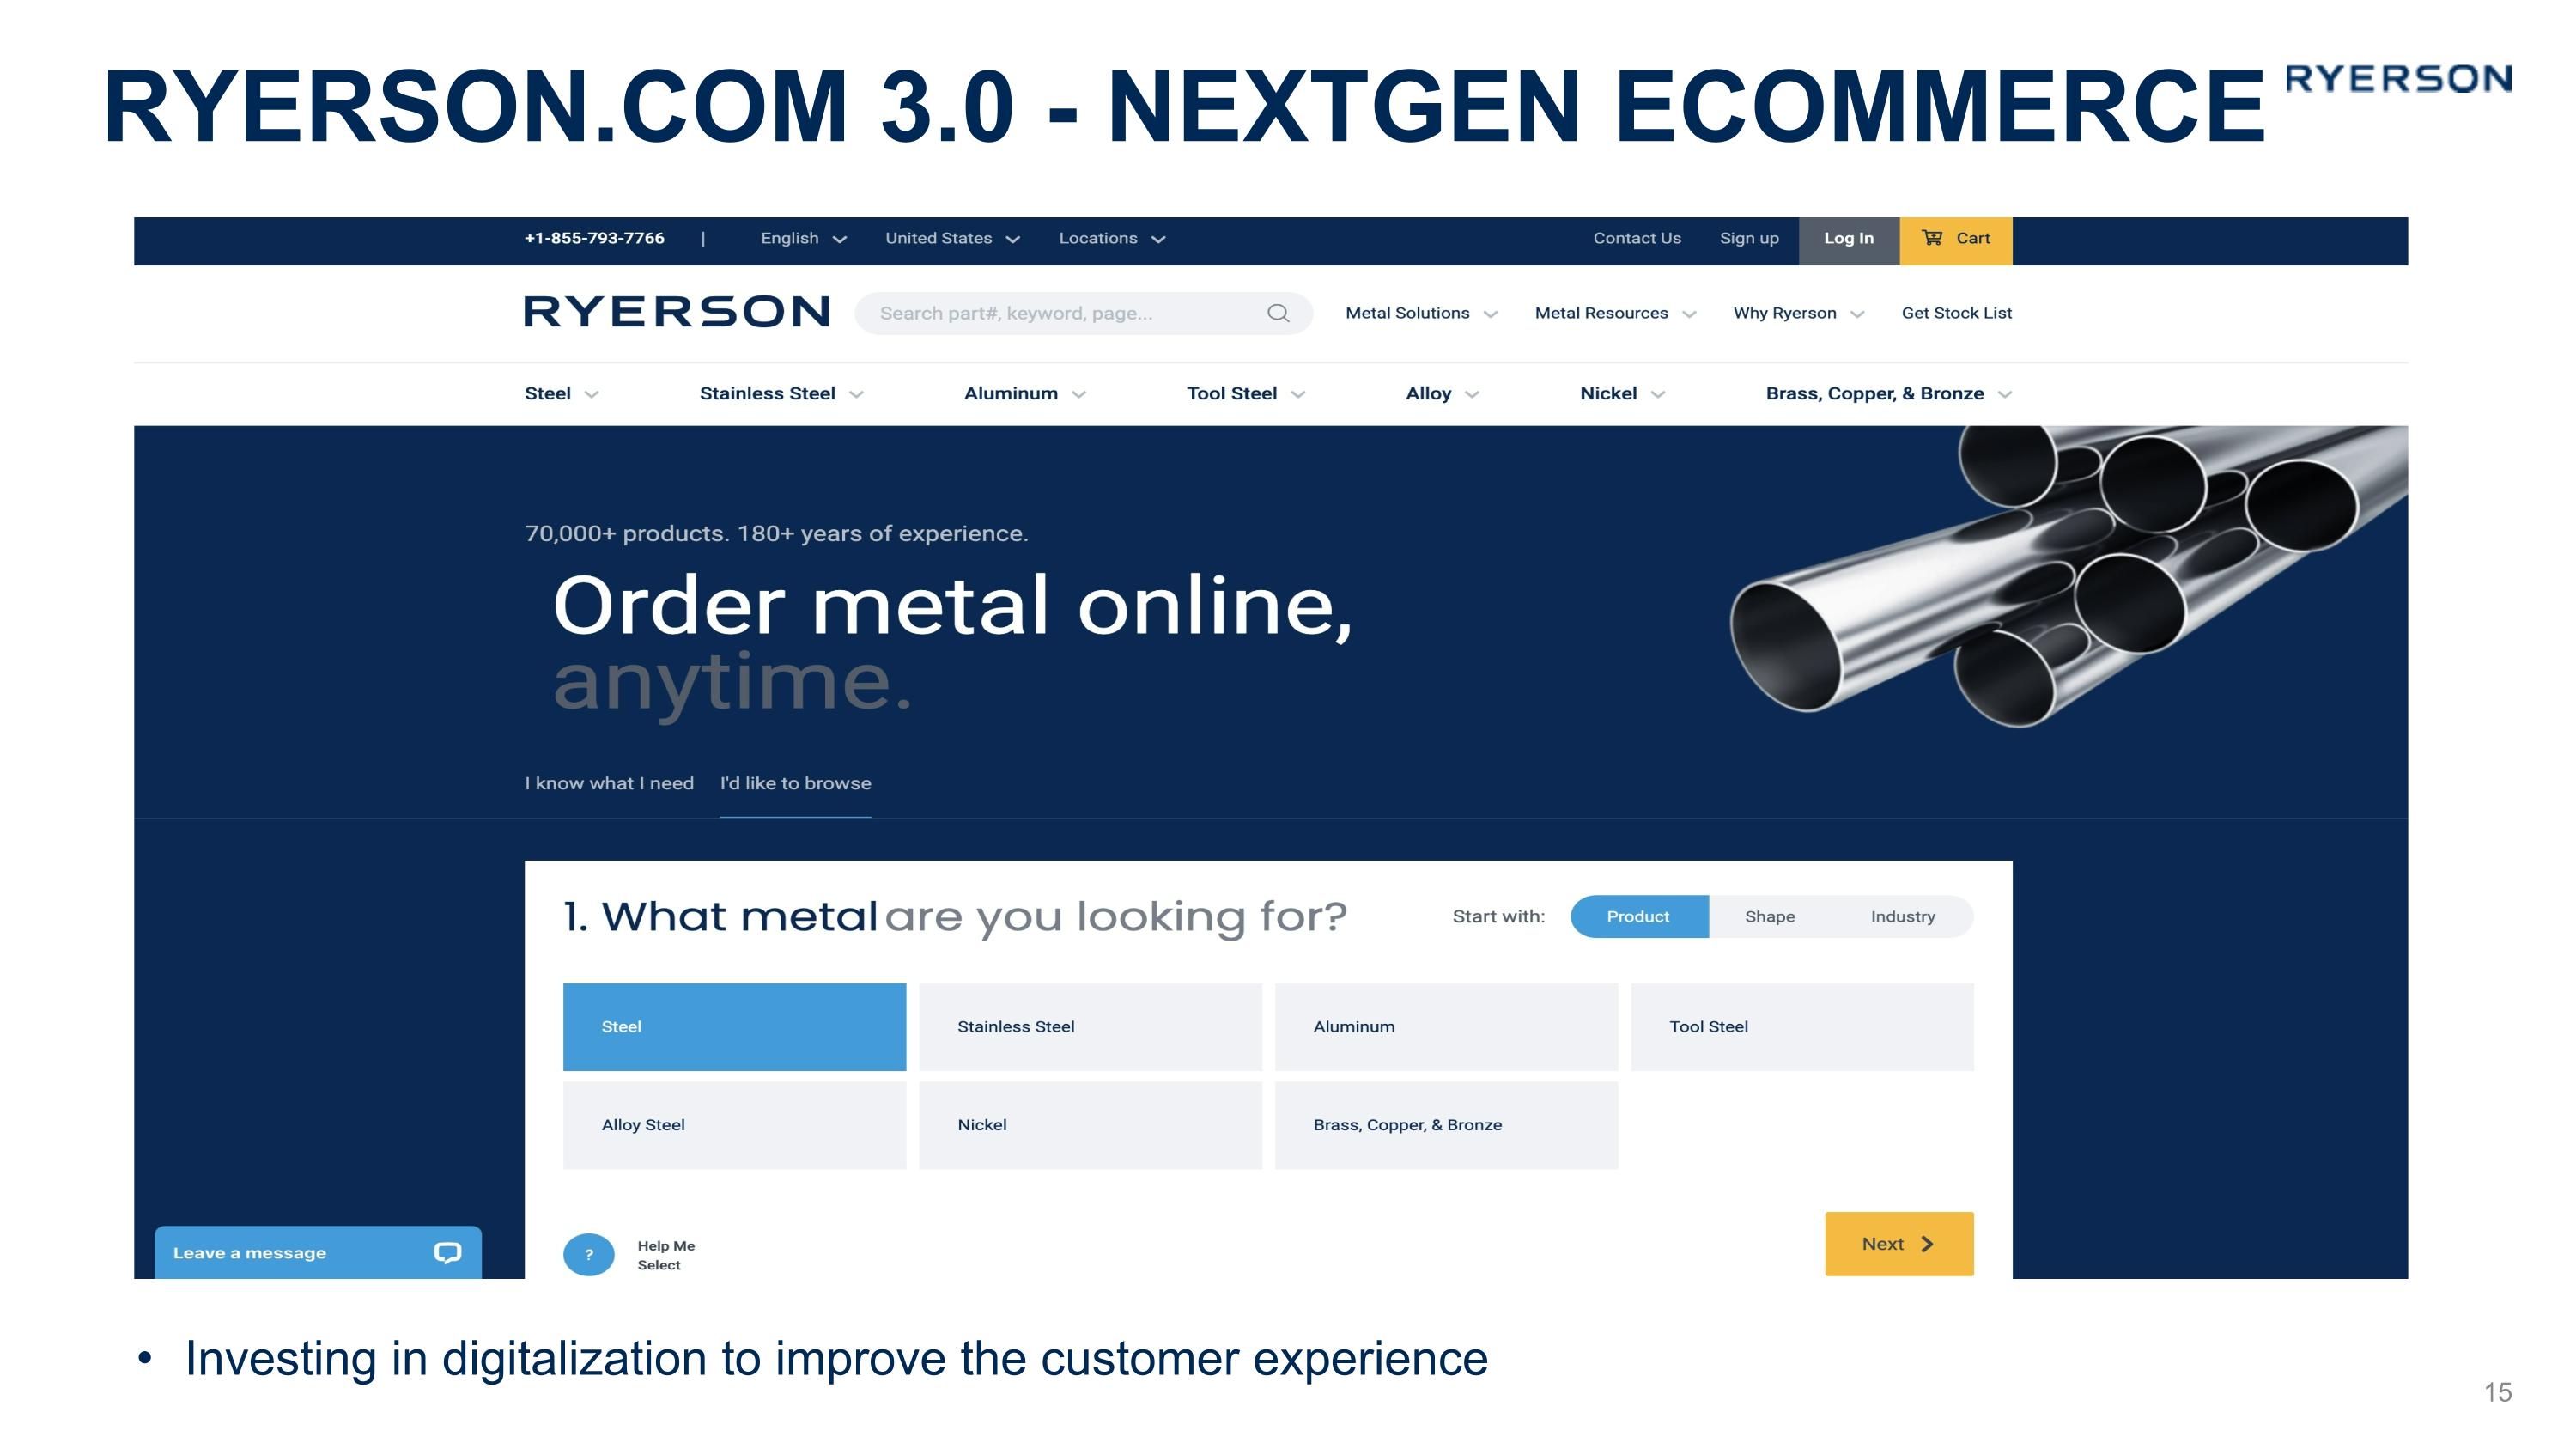
Ryerson.com 3.0 - NextGen ECommerce Investing in digitalization to improve the customer experience 15
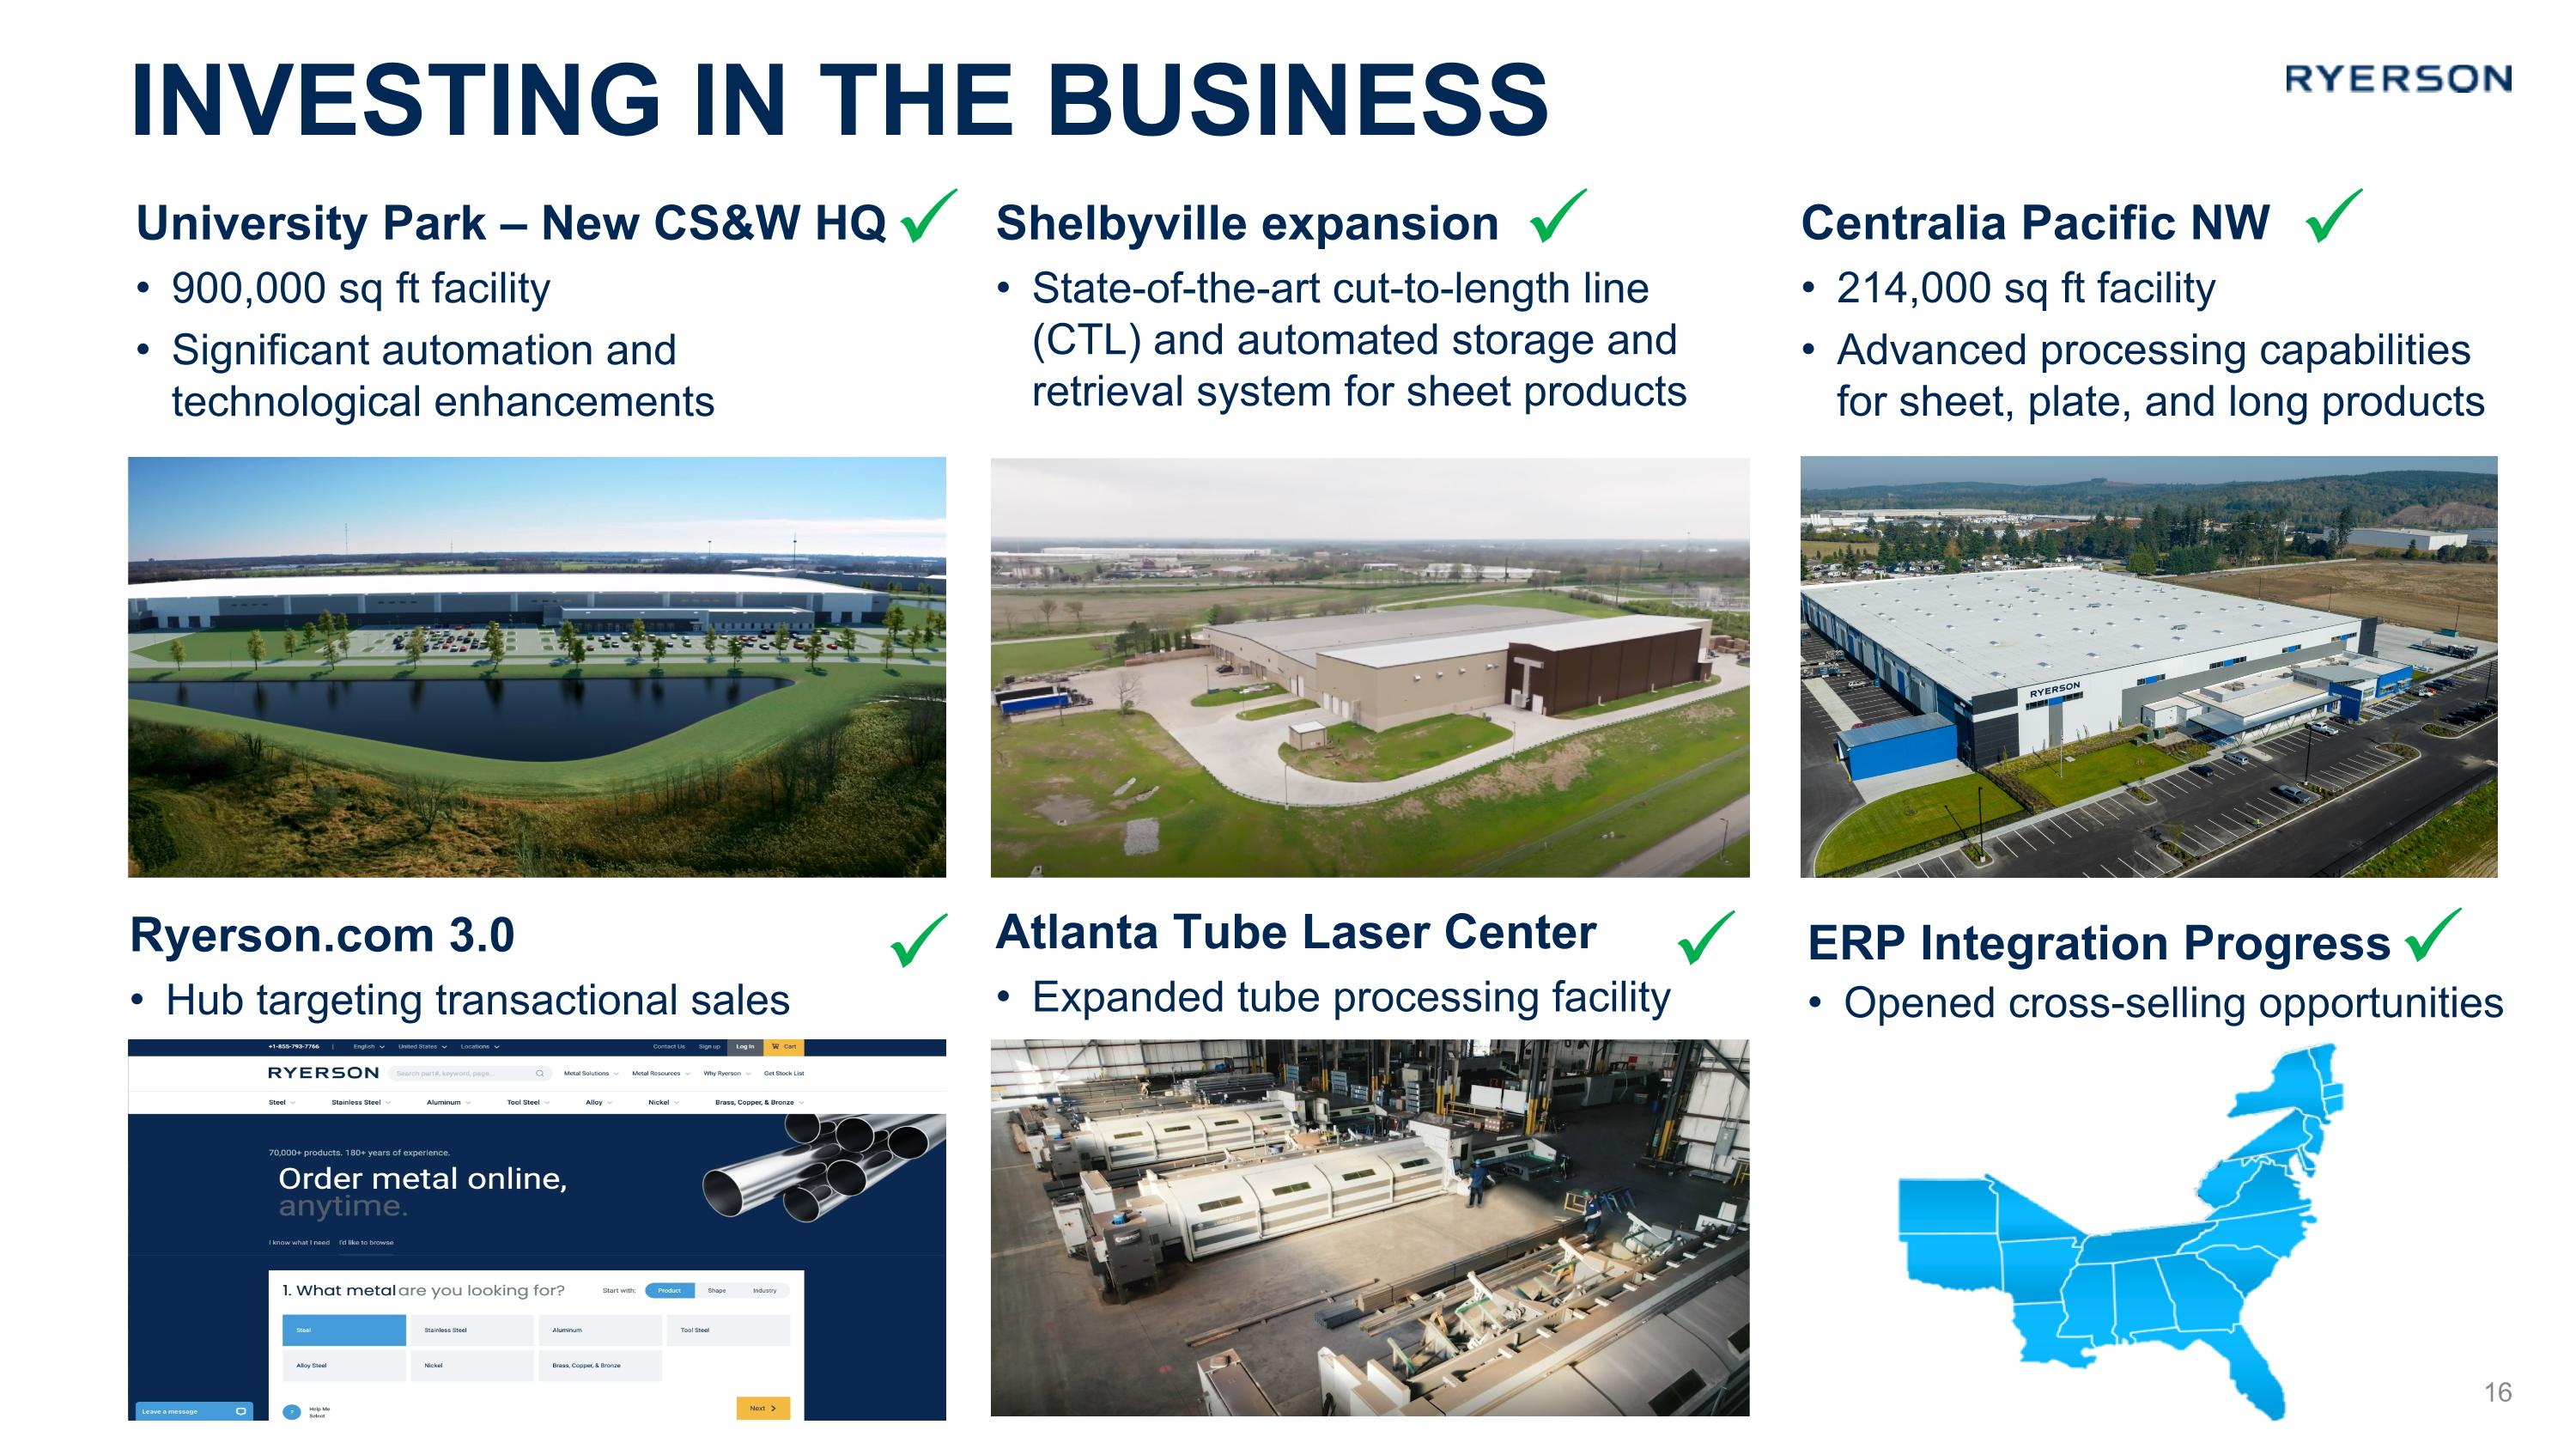
University Park – New CS&W HQ 900,000 sq ft facility Significant automation and technological enhancements Investing IN the Business West Shelbyville expansion State-of-the-art cut-to-length line (CTL) and automated storage and retrieval system for sheet products Centralia Pacific NW 214,000 sq ft facility Advanced processing capabilities for sheet, plate, and long products Ryerson.com 3.0 Hub targeting transactional sales Atlanta Tube Laser Center Expanded tube processing facility ERP Integration Progress Opened cross-selling opportunities 16
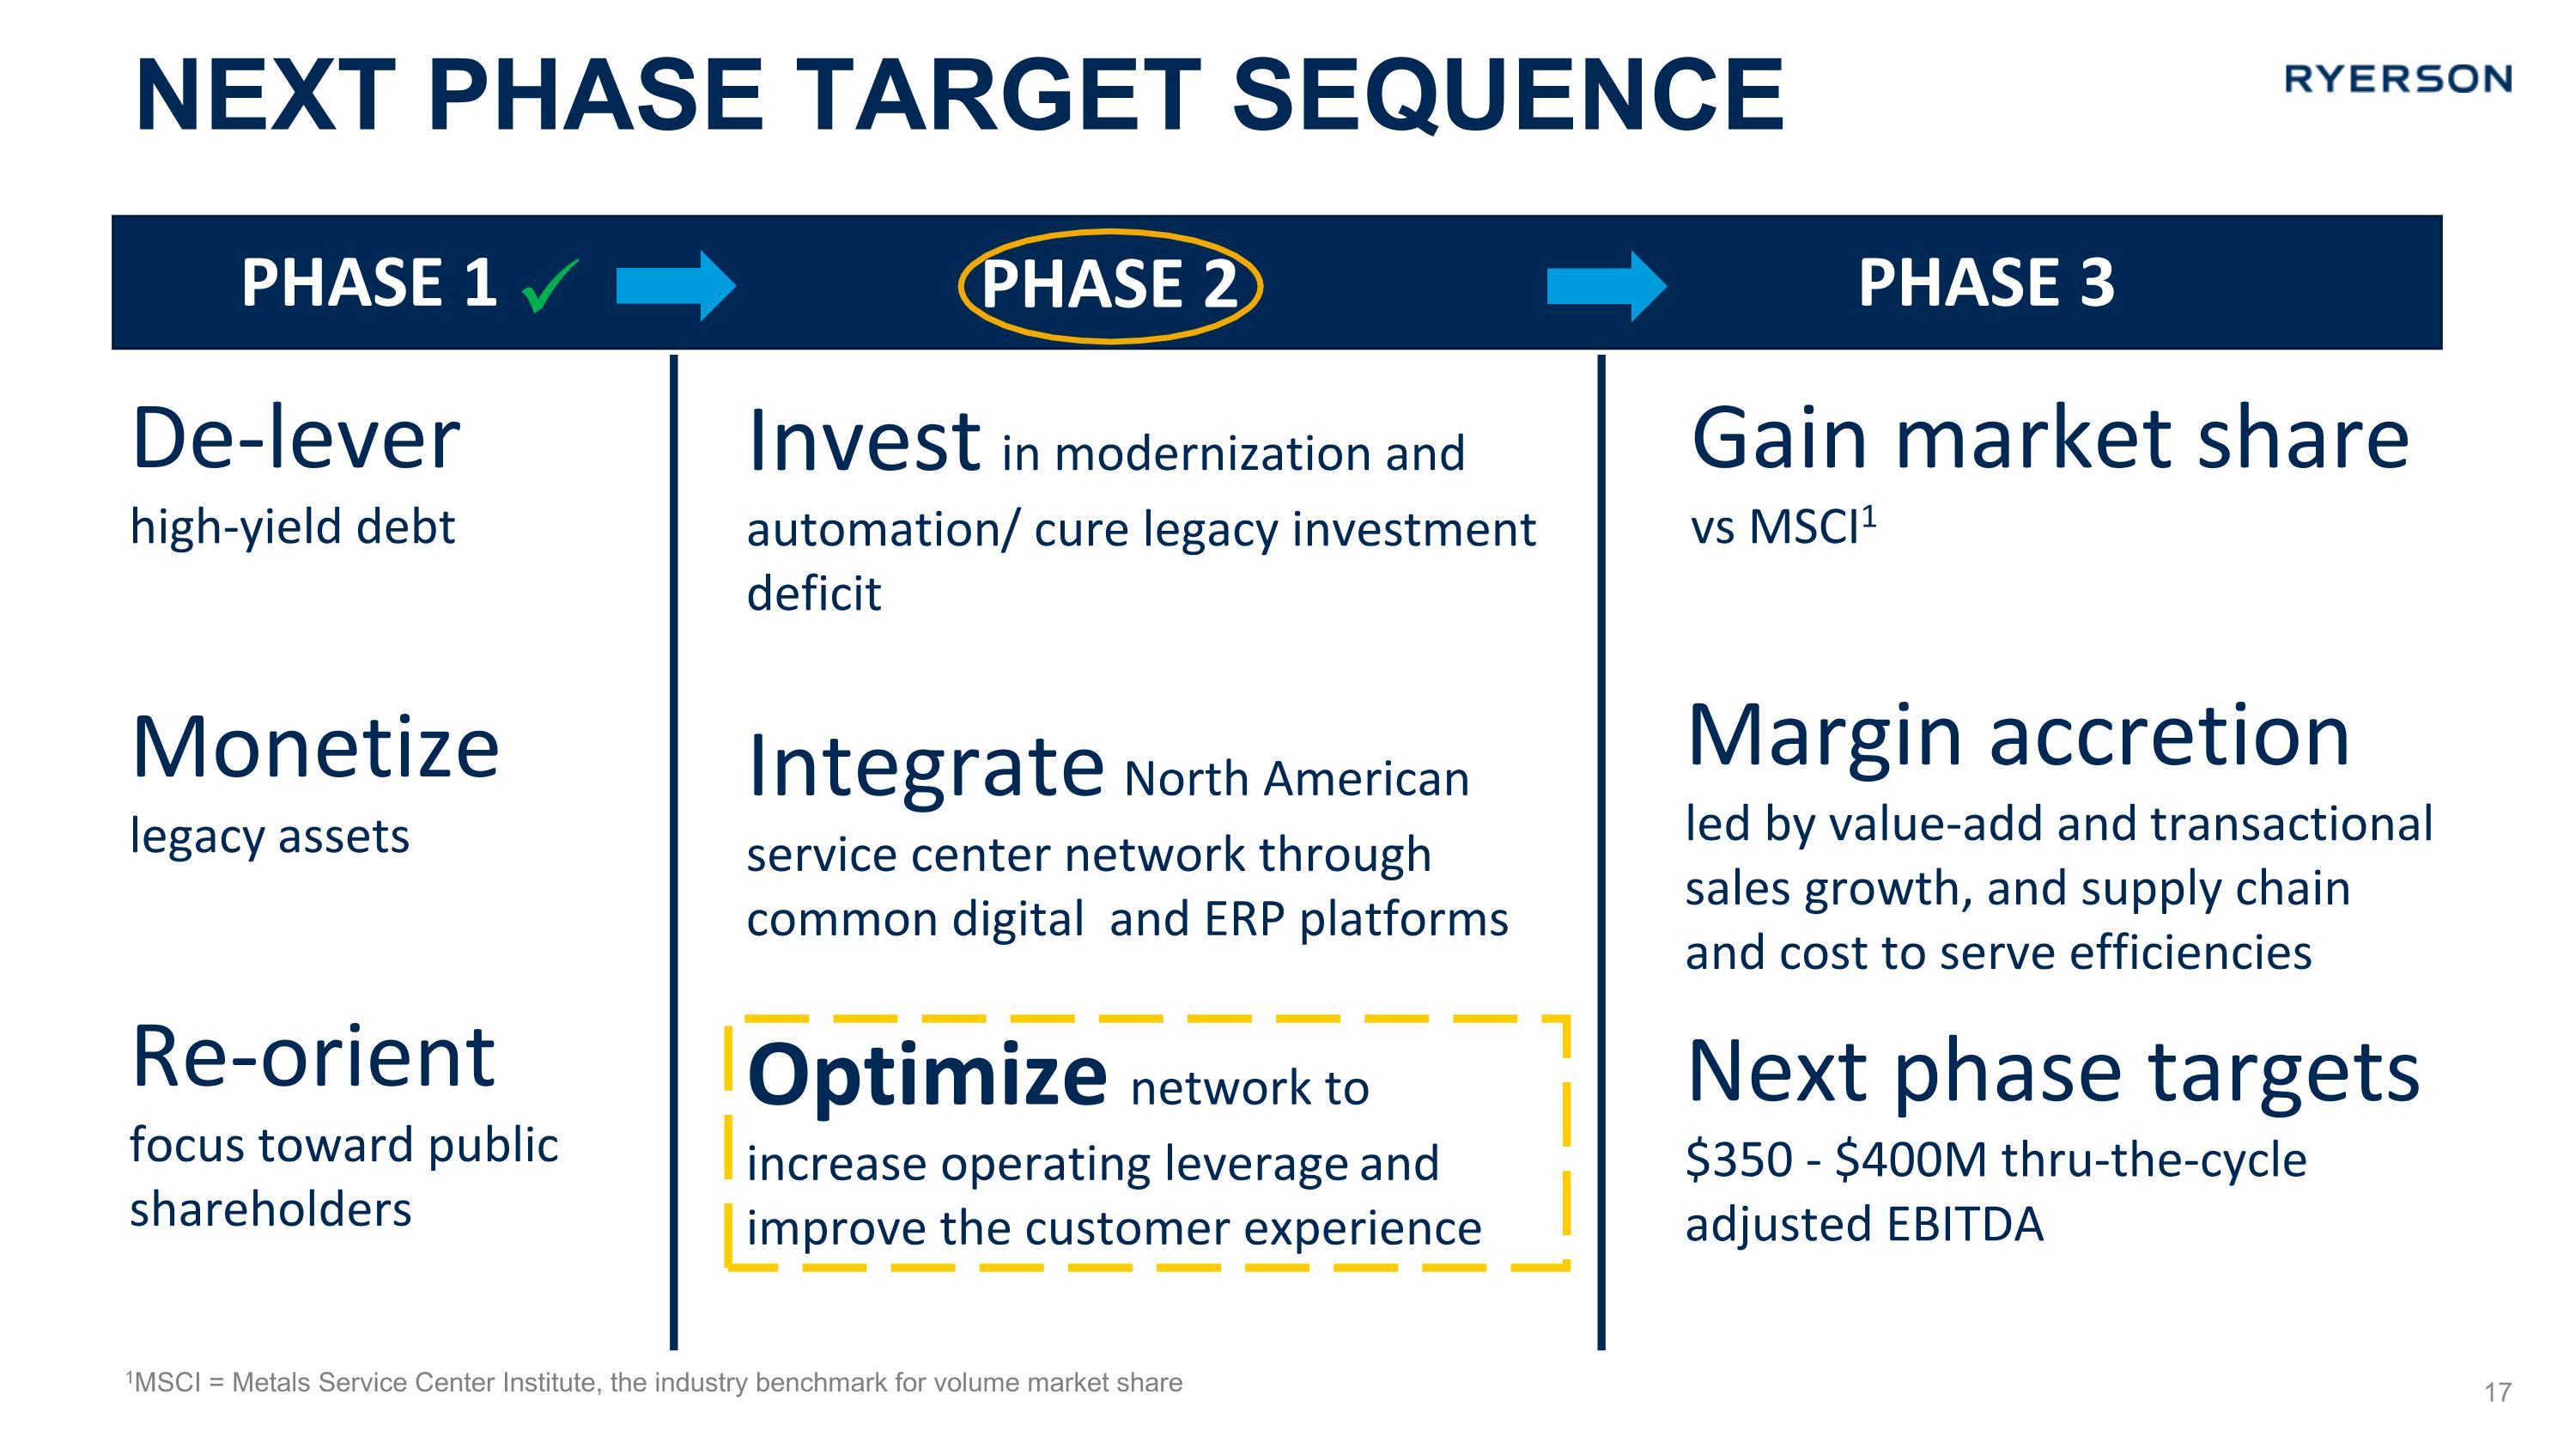
Next Phase Target sequence PHASE 1 PHASE 2 PHASE 3 Invest in modernization and automation/ cure legacy investment deficit Integrate North American service center network through common digital and ERP platforms Optimize network to increase operating leverage and improve the customer experience De-lever high-yield debt Monetize legacy assets Re-orient focus toward public shareholders Gain market share vs MSCI1 Margin accretion led by value-add and transactional sales growth, and supply chain and cost to serve efficiencies Next phase targets $350 - $400M thru-the-cycle adjusted EBITDA 1MSCI = Metals Service Center Institute, the industry benchmark for volume market share 17
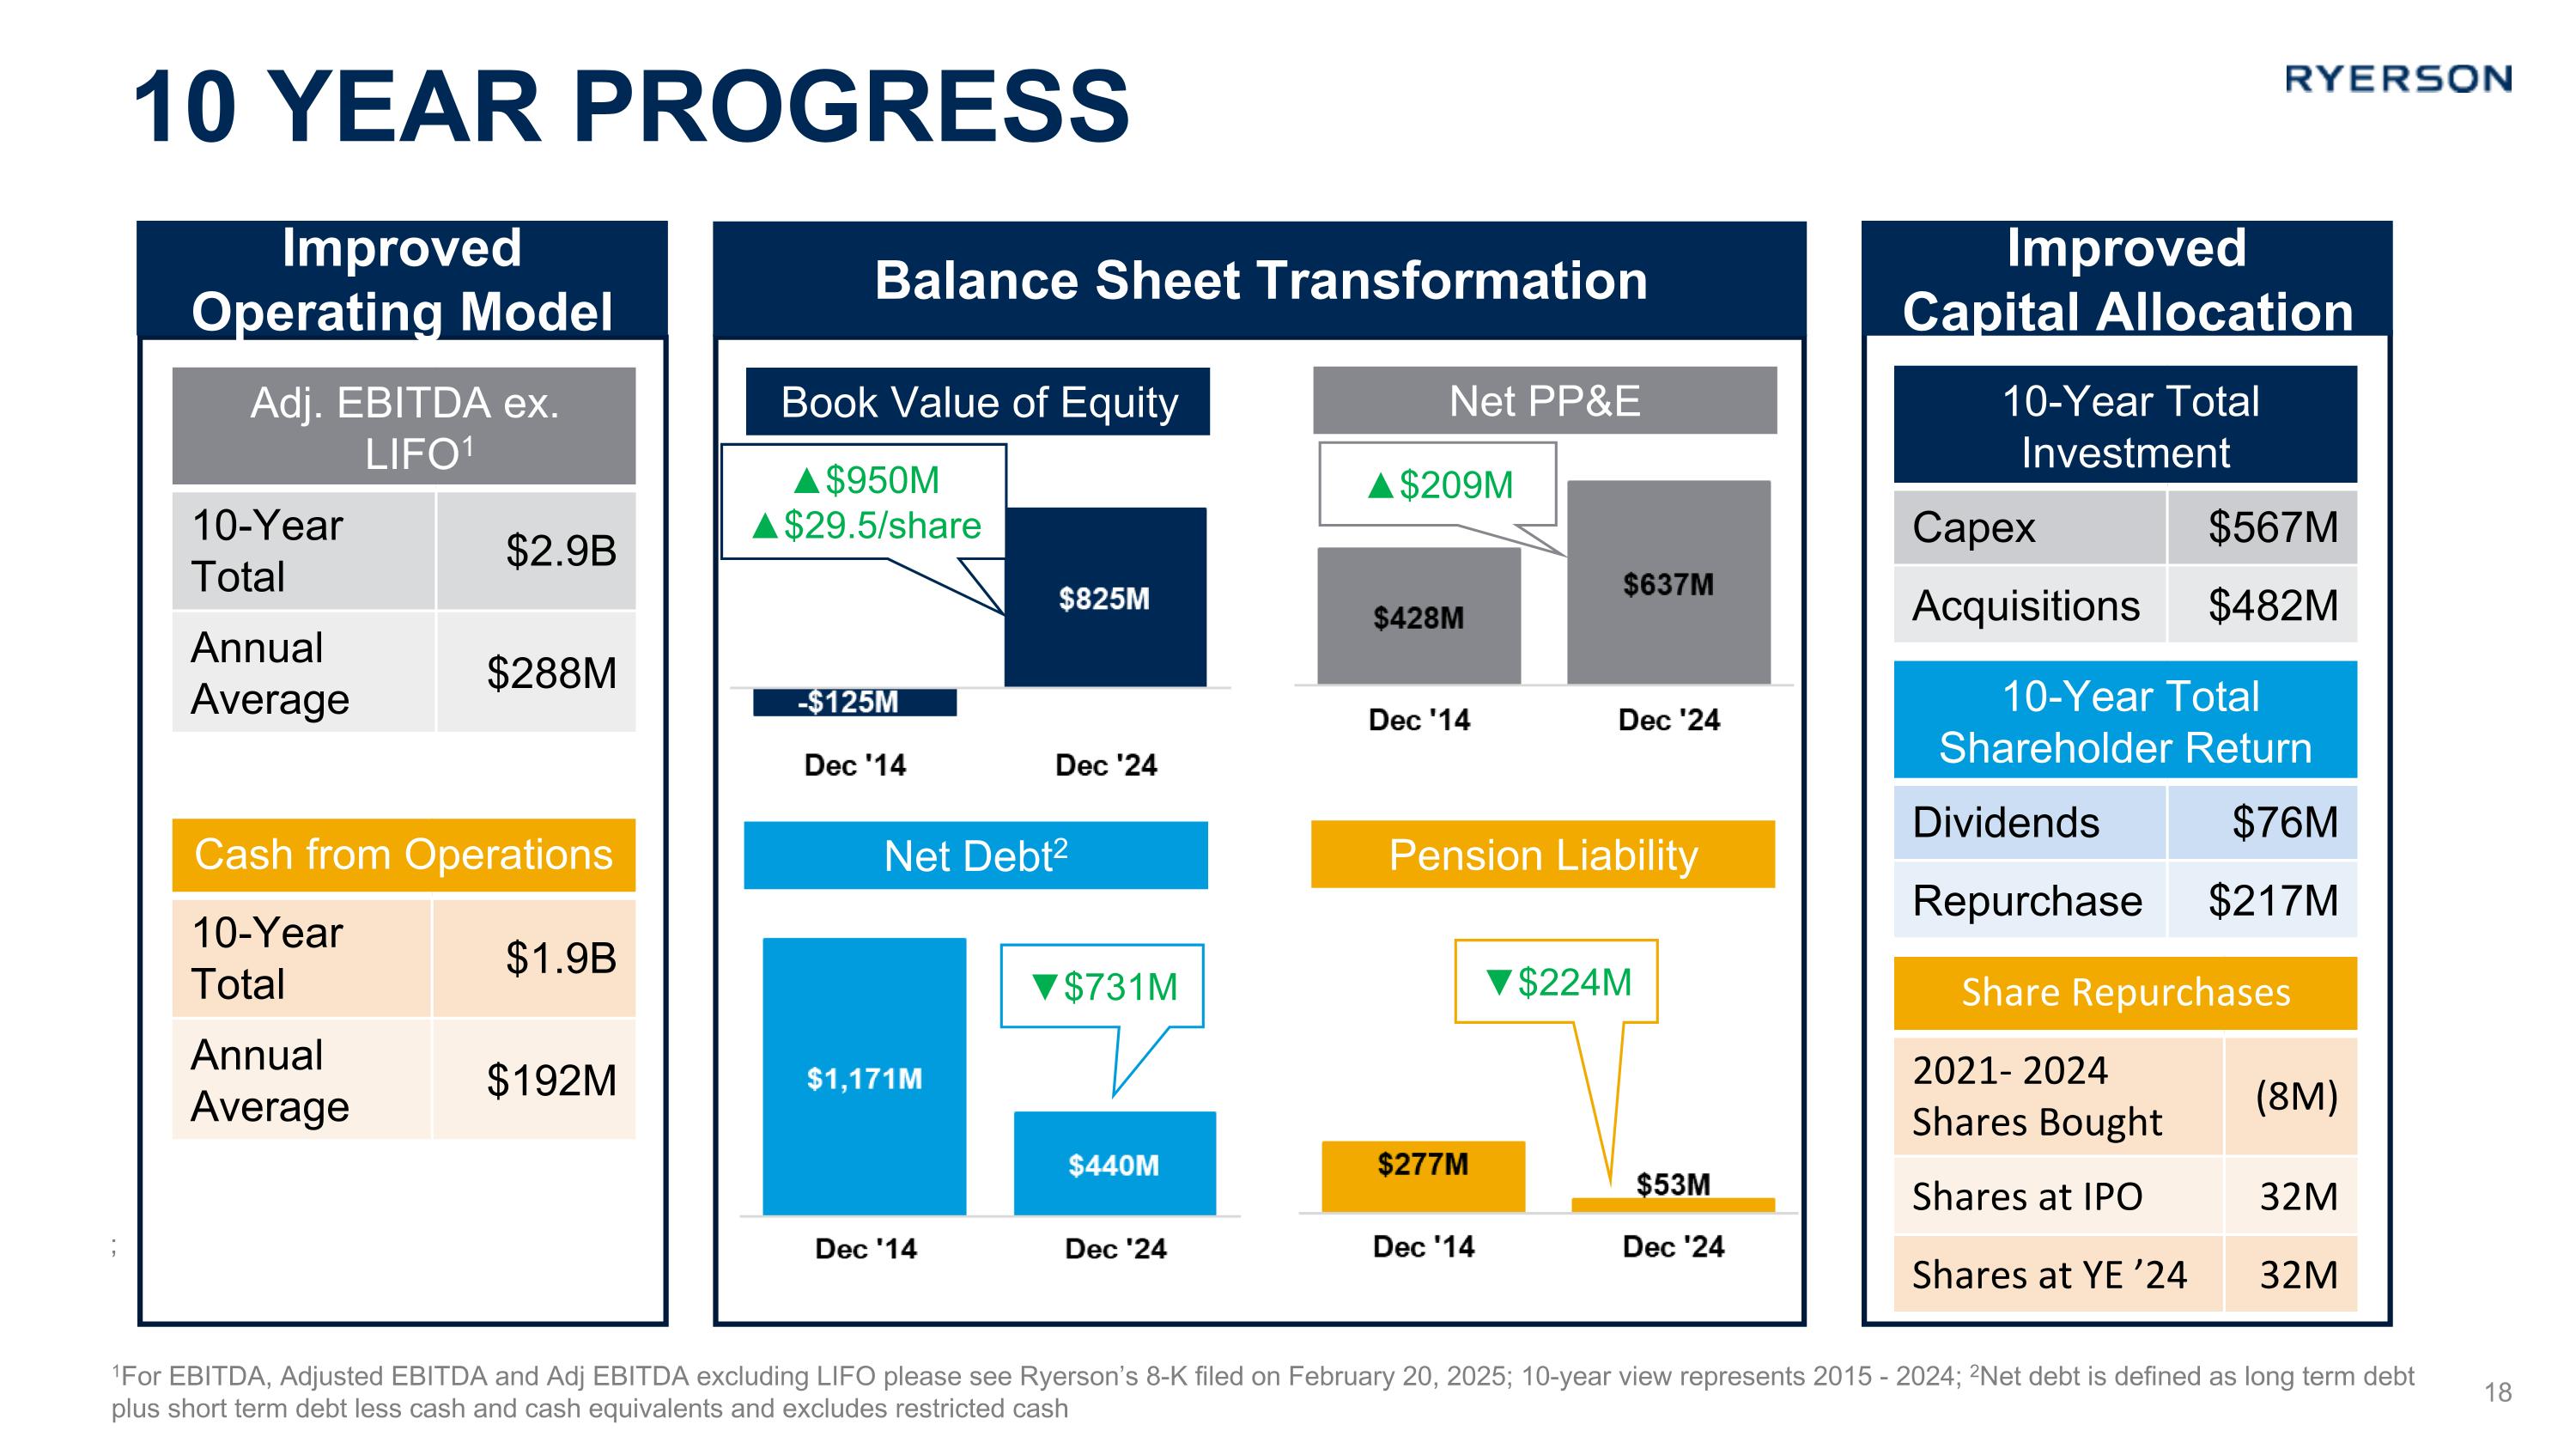
10 Year progress Net PP&E Book Value of Equity Pension Liability Net Debt2 Improved Operating Model Balance Sheet Transformation Improved Capital Allocation 1For EBITDA, Adjusted EBITDA and Adj EBITDA excluding LIFO please see Ryerson’s 8-K filed on February 20, 2025; 10-year view represents 2015 - 2024; 2Net debt is defined as long term debt plus short term debt less cash and cash equivalents and excludes restricted cash Adj. EBITDA ex. LIFO1 10-Year Total $2.9B Annual Average $288M Cash from Operations 10-Year Total $1.9B Annual Average $192M 10-Year Total Investment Capex $567M Acquisitions $482M 10-Year Total Shareholder Return Dividends $76M Repurchase $217M Share Repurchases 2021- 2024 Shares Bought (8M) Shares at IPO 32M Shares at YE ’24 32M ; ▼$731M ▼$224M ▲$209M ▲$950M ▲$29.5/share