Ryerson Holding Corporation Earnings Presentation Second Quarter 2026 .2
Important Information About Ryerson Holding Corporation These materials do not constitute an offer or solicitation to purchase or sell securities of Ryerson Holding Corporation (“Ryerson” or “the Company”) or its subsidiaries and no investment decision should be made based upon the information provided herein. Ryerson strongly urges you to review its filings with the Securities and Exchange Commission, which can be found at https://ir.ryerson.com/financials/sec-filings/default.aspx. This site also provides additional information about Ryerson. Safe Harbor Provision Certain statements made in this release and other written or oral statements made by or on behalf of the Company constitute “forward-looking statements” within the meaning of the federal securities laws, including statements regarding our future performance, as well as management's expectations, beliefs, intentions, plans, estimates, objectives, or projections relating to the future. Such statements can be identified by the use of forward-looking terminology such as “objectives,” “goals,” “preliminary,” “range,” “believes,” “expects,” “may,” “estimates,” “will,” “should,” “plans,” or “anticipates” or the negative thereof or other variations thereon or comparable terminology, or by discussions of strategy. The Company cautions that any such forward-looking statements are not guarantees of future performance and may involve significant risks and uncertainties, and that actual results may vary materially from those in the forward-looking statements as a result of various factors. Among the factors that significantly impact our business are: the cyclicality of our business; the highly competitive, volatile, and fragmented metals industry in which we operate; the impact of geopolitical events; fluctuating metal prices; our indebtedness and the covenants in instruments governing such indebtedness; the integration of acquired operations; regulatory and other operational risks associated with our operations located inside and outside of the United States; the influence of a single investor group over our policies and procedures; work stoppages; obligations under certain employee retirement benefit plans; currency fluctuations; and consolidation in the metals industry. Forward-looking statements should, therefore, be considered in light of various factors, including those set forth above and those set forth under “Risk Factors” in our most recent annual report on Form 10-K for the year ended December 31, 2025, and in our other filings with the Securities and Exchange Commission. Moreover, we caution against placing undue reliance on these statements, which speak only as of the date they were made. The Company does not undertake any obligation to publicly update or revise any forward-looking statements to reflect future events or circumstances, new information or otherwise. Non-GAAP Measures Certain measures contained in these slides or the related presentation are not measures calculated in accordance with generally accepted accounting principles (“GAAP”). They should not be considered a replacement for GAAP results. Non-GAAP financial measures appearing in these slides are identified in the footnotes. A reconciliation of these non-GAAP measures to the most directly comparable GAAP financial measures is included in the Appendix.
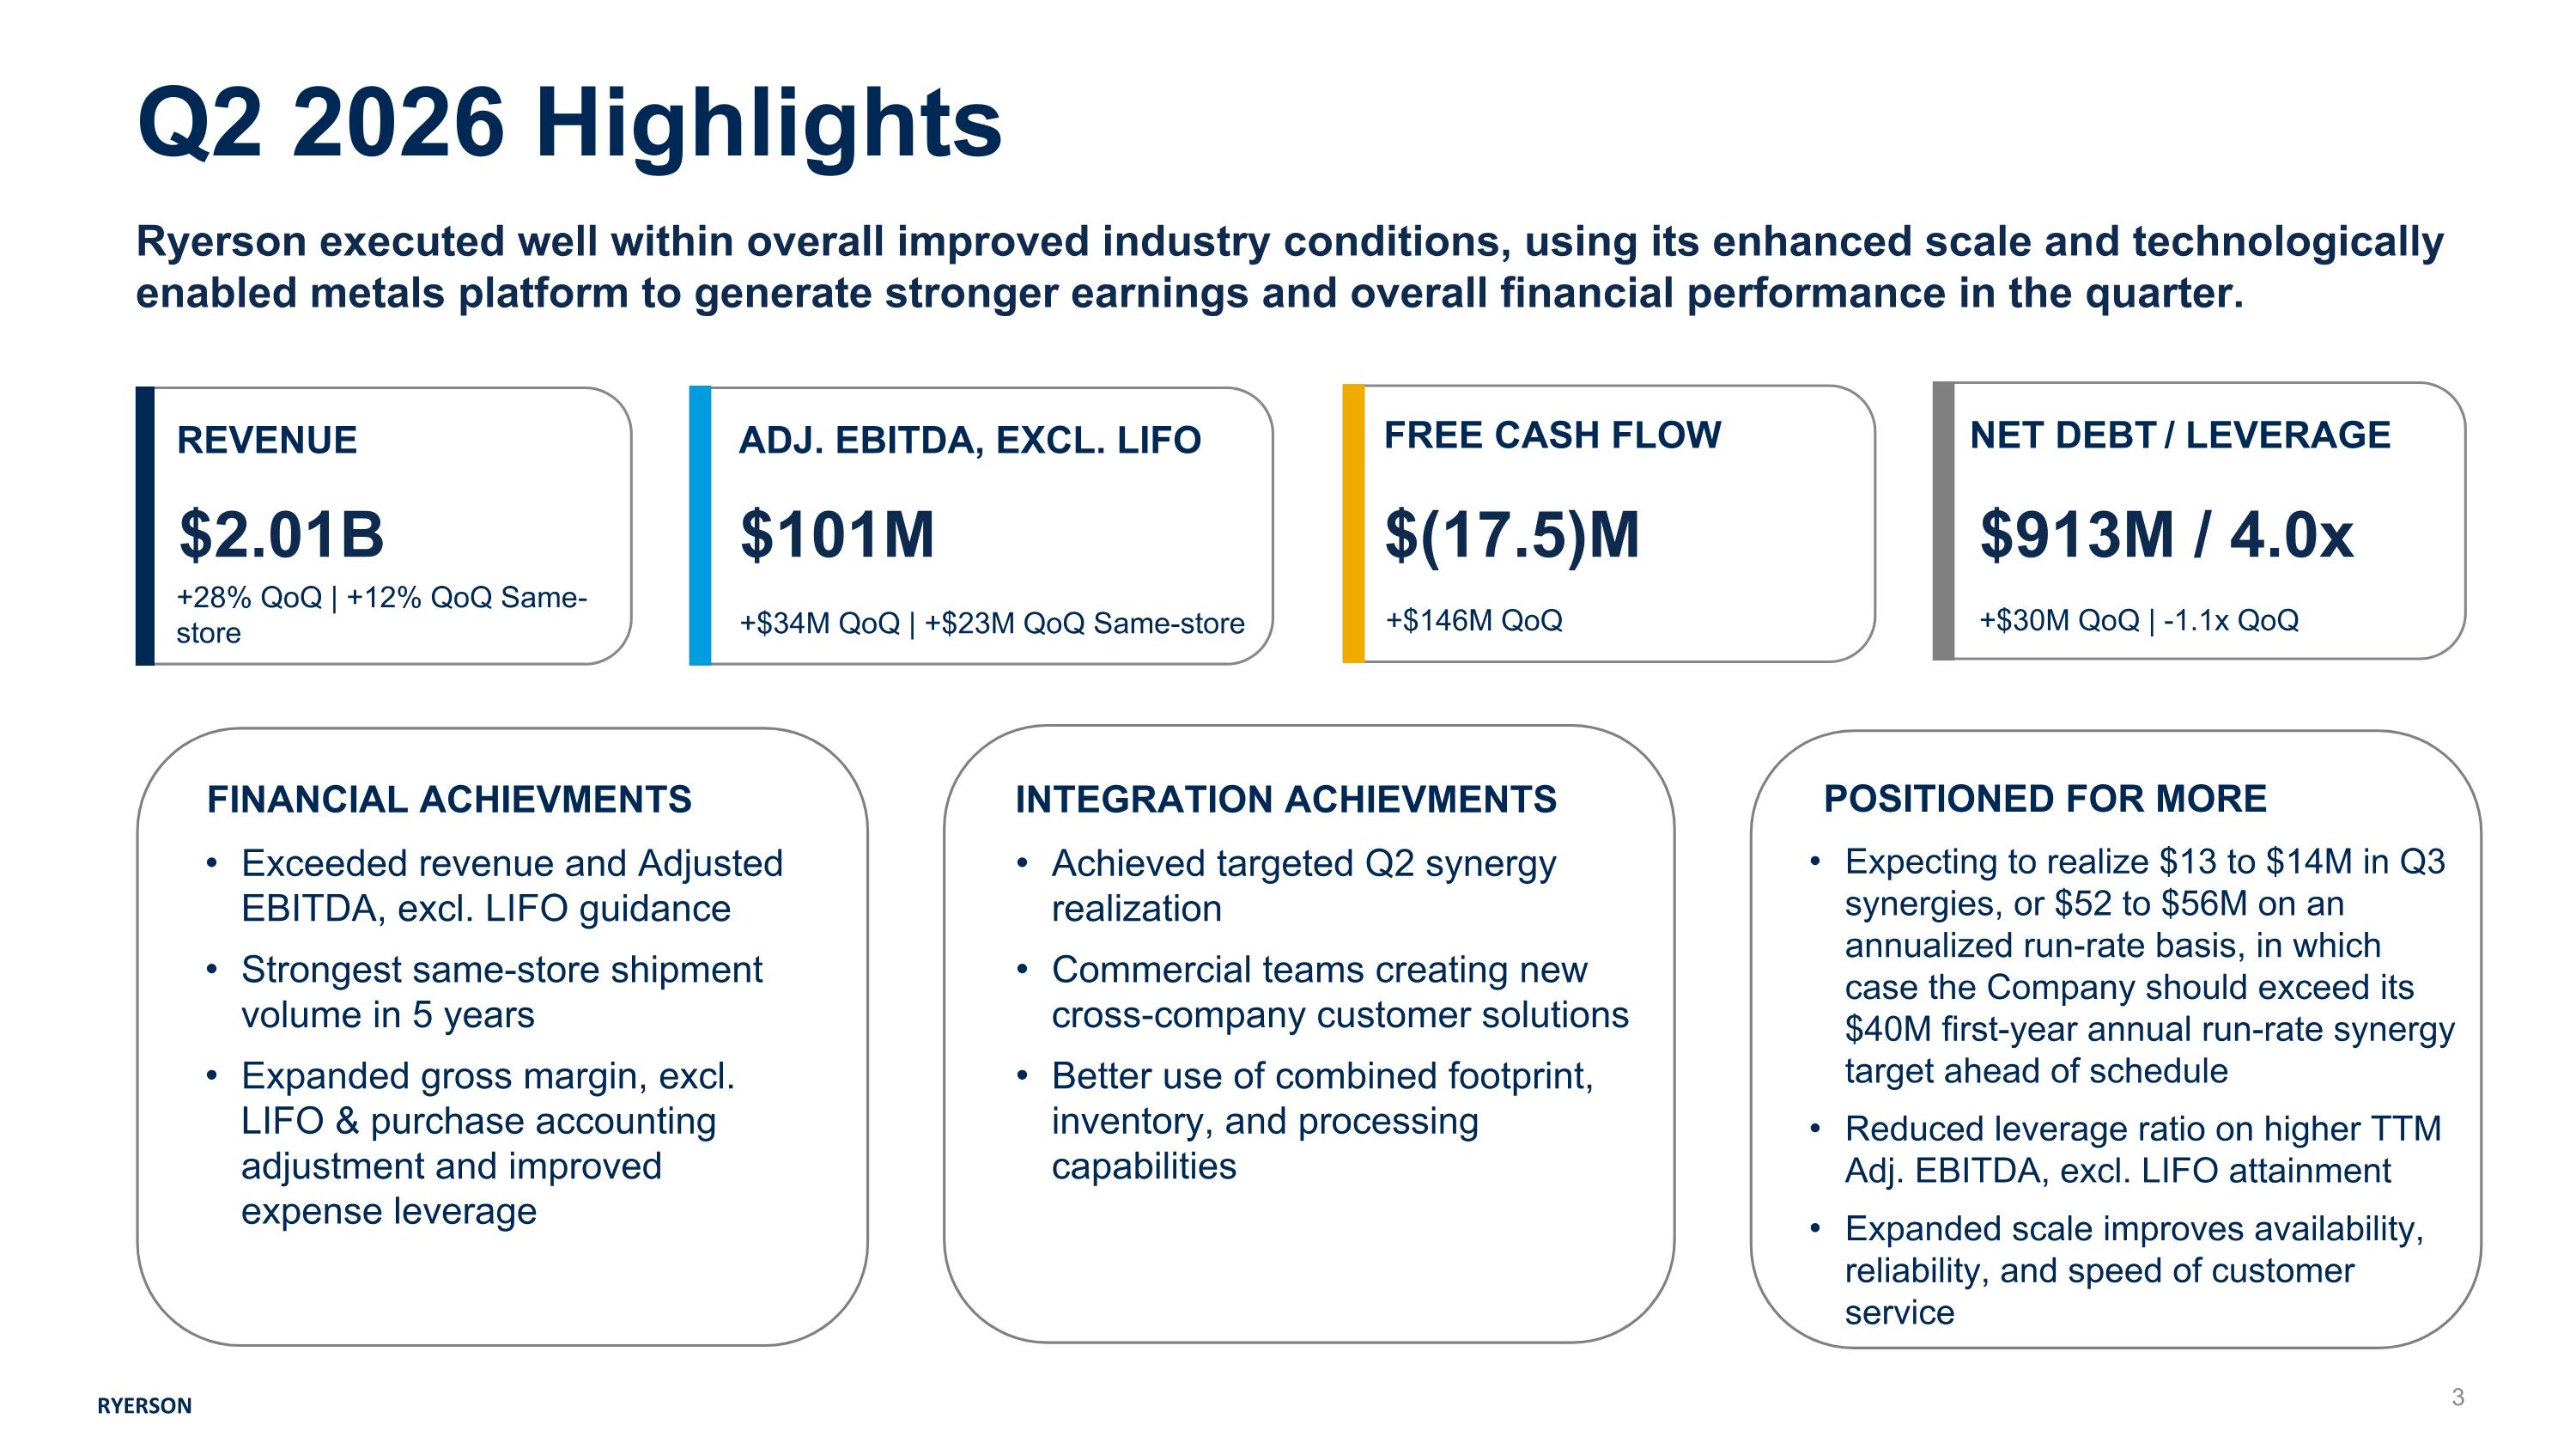
RYERSON REVENUE $2.01B +28% QoQ | +12% QoQ Same-store ADJ. EBITDA, EXCL. LIFO $101M +$34M QoQ | +$23M QoQ Same-store FREE CASH FLOW $(17.5)M +$146M QoQ NET DEBT / LEVERAGE $913M / 4.0x +$30M QoQ | -1.1x QoQ FINANCIAL ACHIEVMENTS Exceeded revenue and Adjusted EBITDA, excl. LIFO guidance Strongest same-store shipment volume in 5 years Expanded gross margin, excl. LIFO & purchase accounting adjustment and improved expense leverage INTEGRATION ACHIEVMENTS Achieved targeted Q2 synergy realization Commercial teams creating new cross-company customer solutions Better use of combined footprint, inventory, and processing capabilities POSITIONED FOR MORE Expecting to realize $13 to $14M in Q3 synergies, or $52 to $56M on an annualized run-rate basis, in which case the Company should exceed its $40M first-year annual run-rate synergy target ahead of schedule Reduced leverage ratio on higher TTM Adj. EBITDA, excl. LIFO attainment Expanded scale improves availability, reliability, and speed of customer service Ryerson executed well within overall improved industry conditions, using its enhanced scale and technologically enabled metals platform to generate stronger earnings and overall financial performance in the quarter. Q2 2026 Highlights
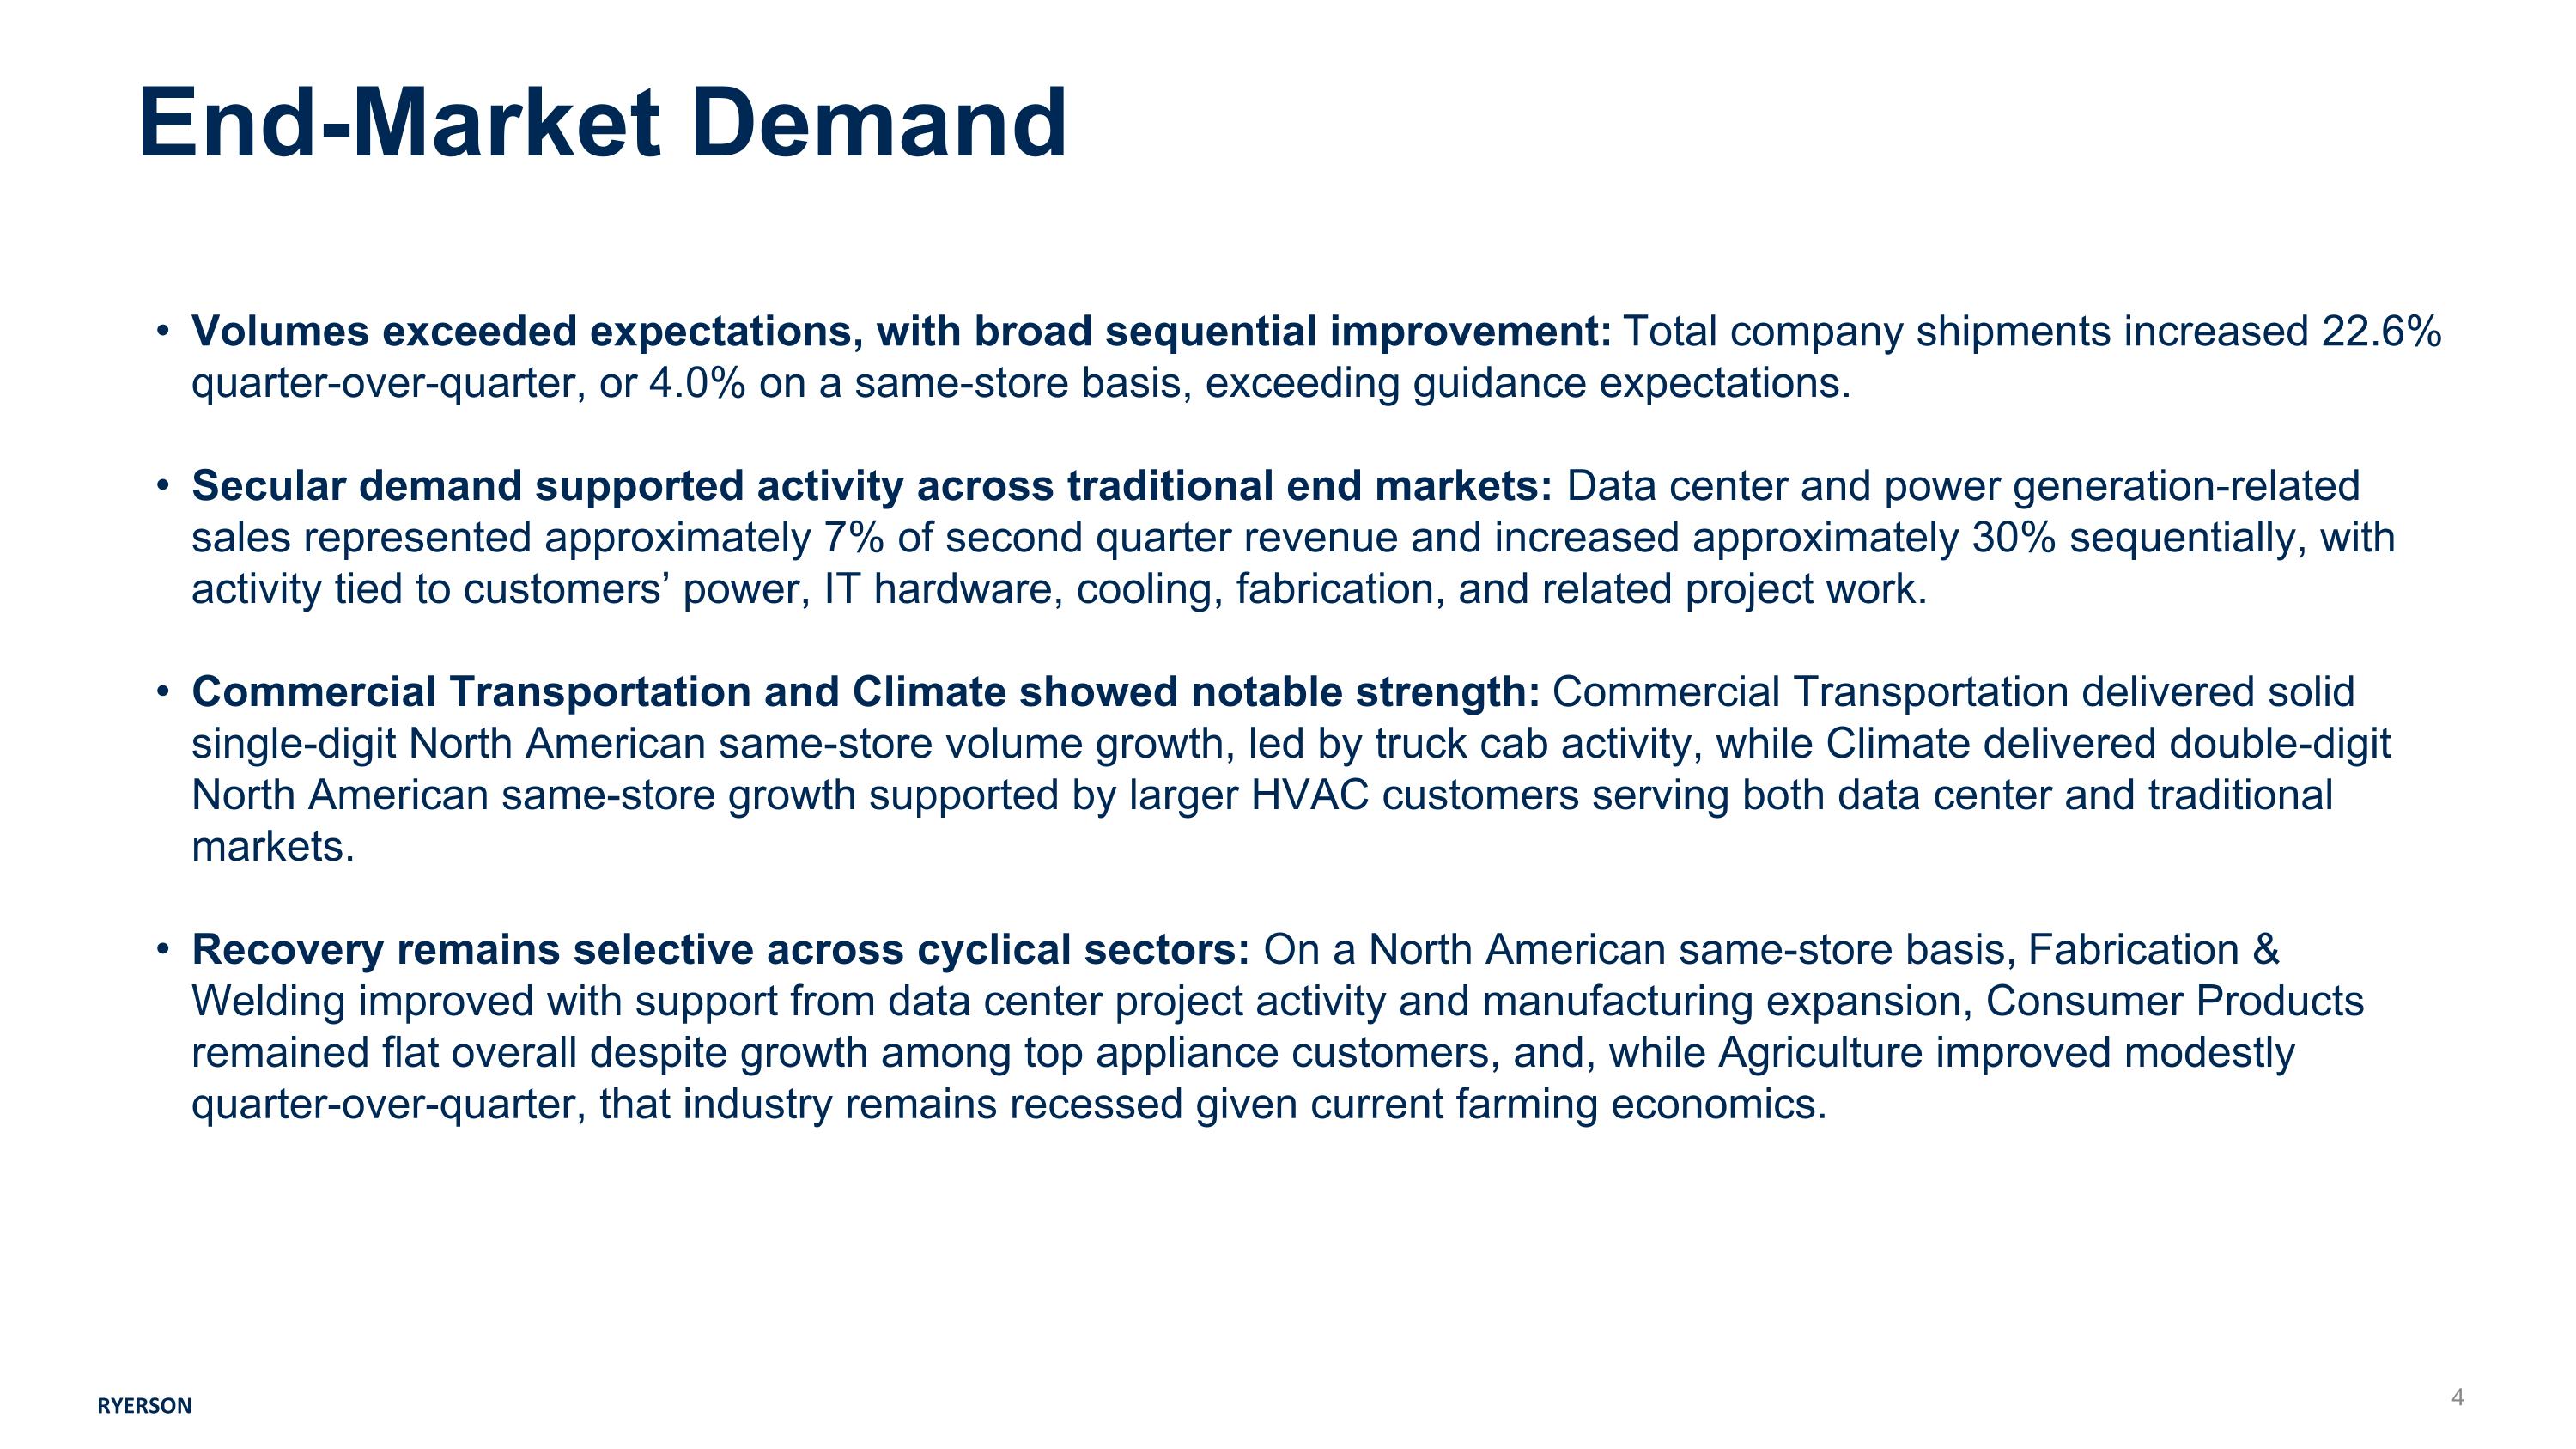
End-Market Demand RYERSON Volumes exceeded expectations, with broad sequential improvement: Total company shipments increased 22.6% quarter-over-quarter, or 4.0% on a same-store basis, exceeding guidance expectations. Secular demand supported activity across traditional end markets: Data center and power generation-related sales represented approximately 7% of second quarter revenue and increased approximately 30% sequentially, with activity tied to customers’ power, IT hardware, cooling, fabrication, and related project work. Commercial Transportation and Climate showed notable strength: Commercial Transportation delivered solid single-digit North American same-store volume growth, led by truck cab activity, while Climate delivered double-digit North American same-store growth supported by larger HVAC customers serving both data center and traditional markets. Recovery remains selective across cyclical sectors: On a North American same-store basis, Fabrication & Welding improved with support from data center project activity and manufacturing expansion, Consumer Products remained flat overall despite growth among top appliance customers, and, while Agriculture improved modestly quarter-over-quarter, that industry remains recessed given current farming economics.
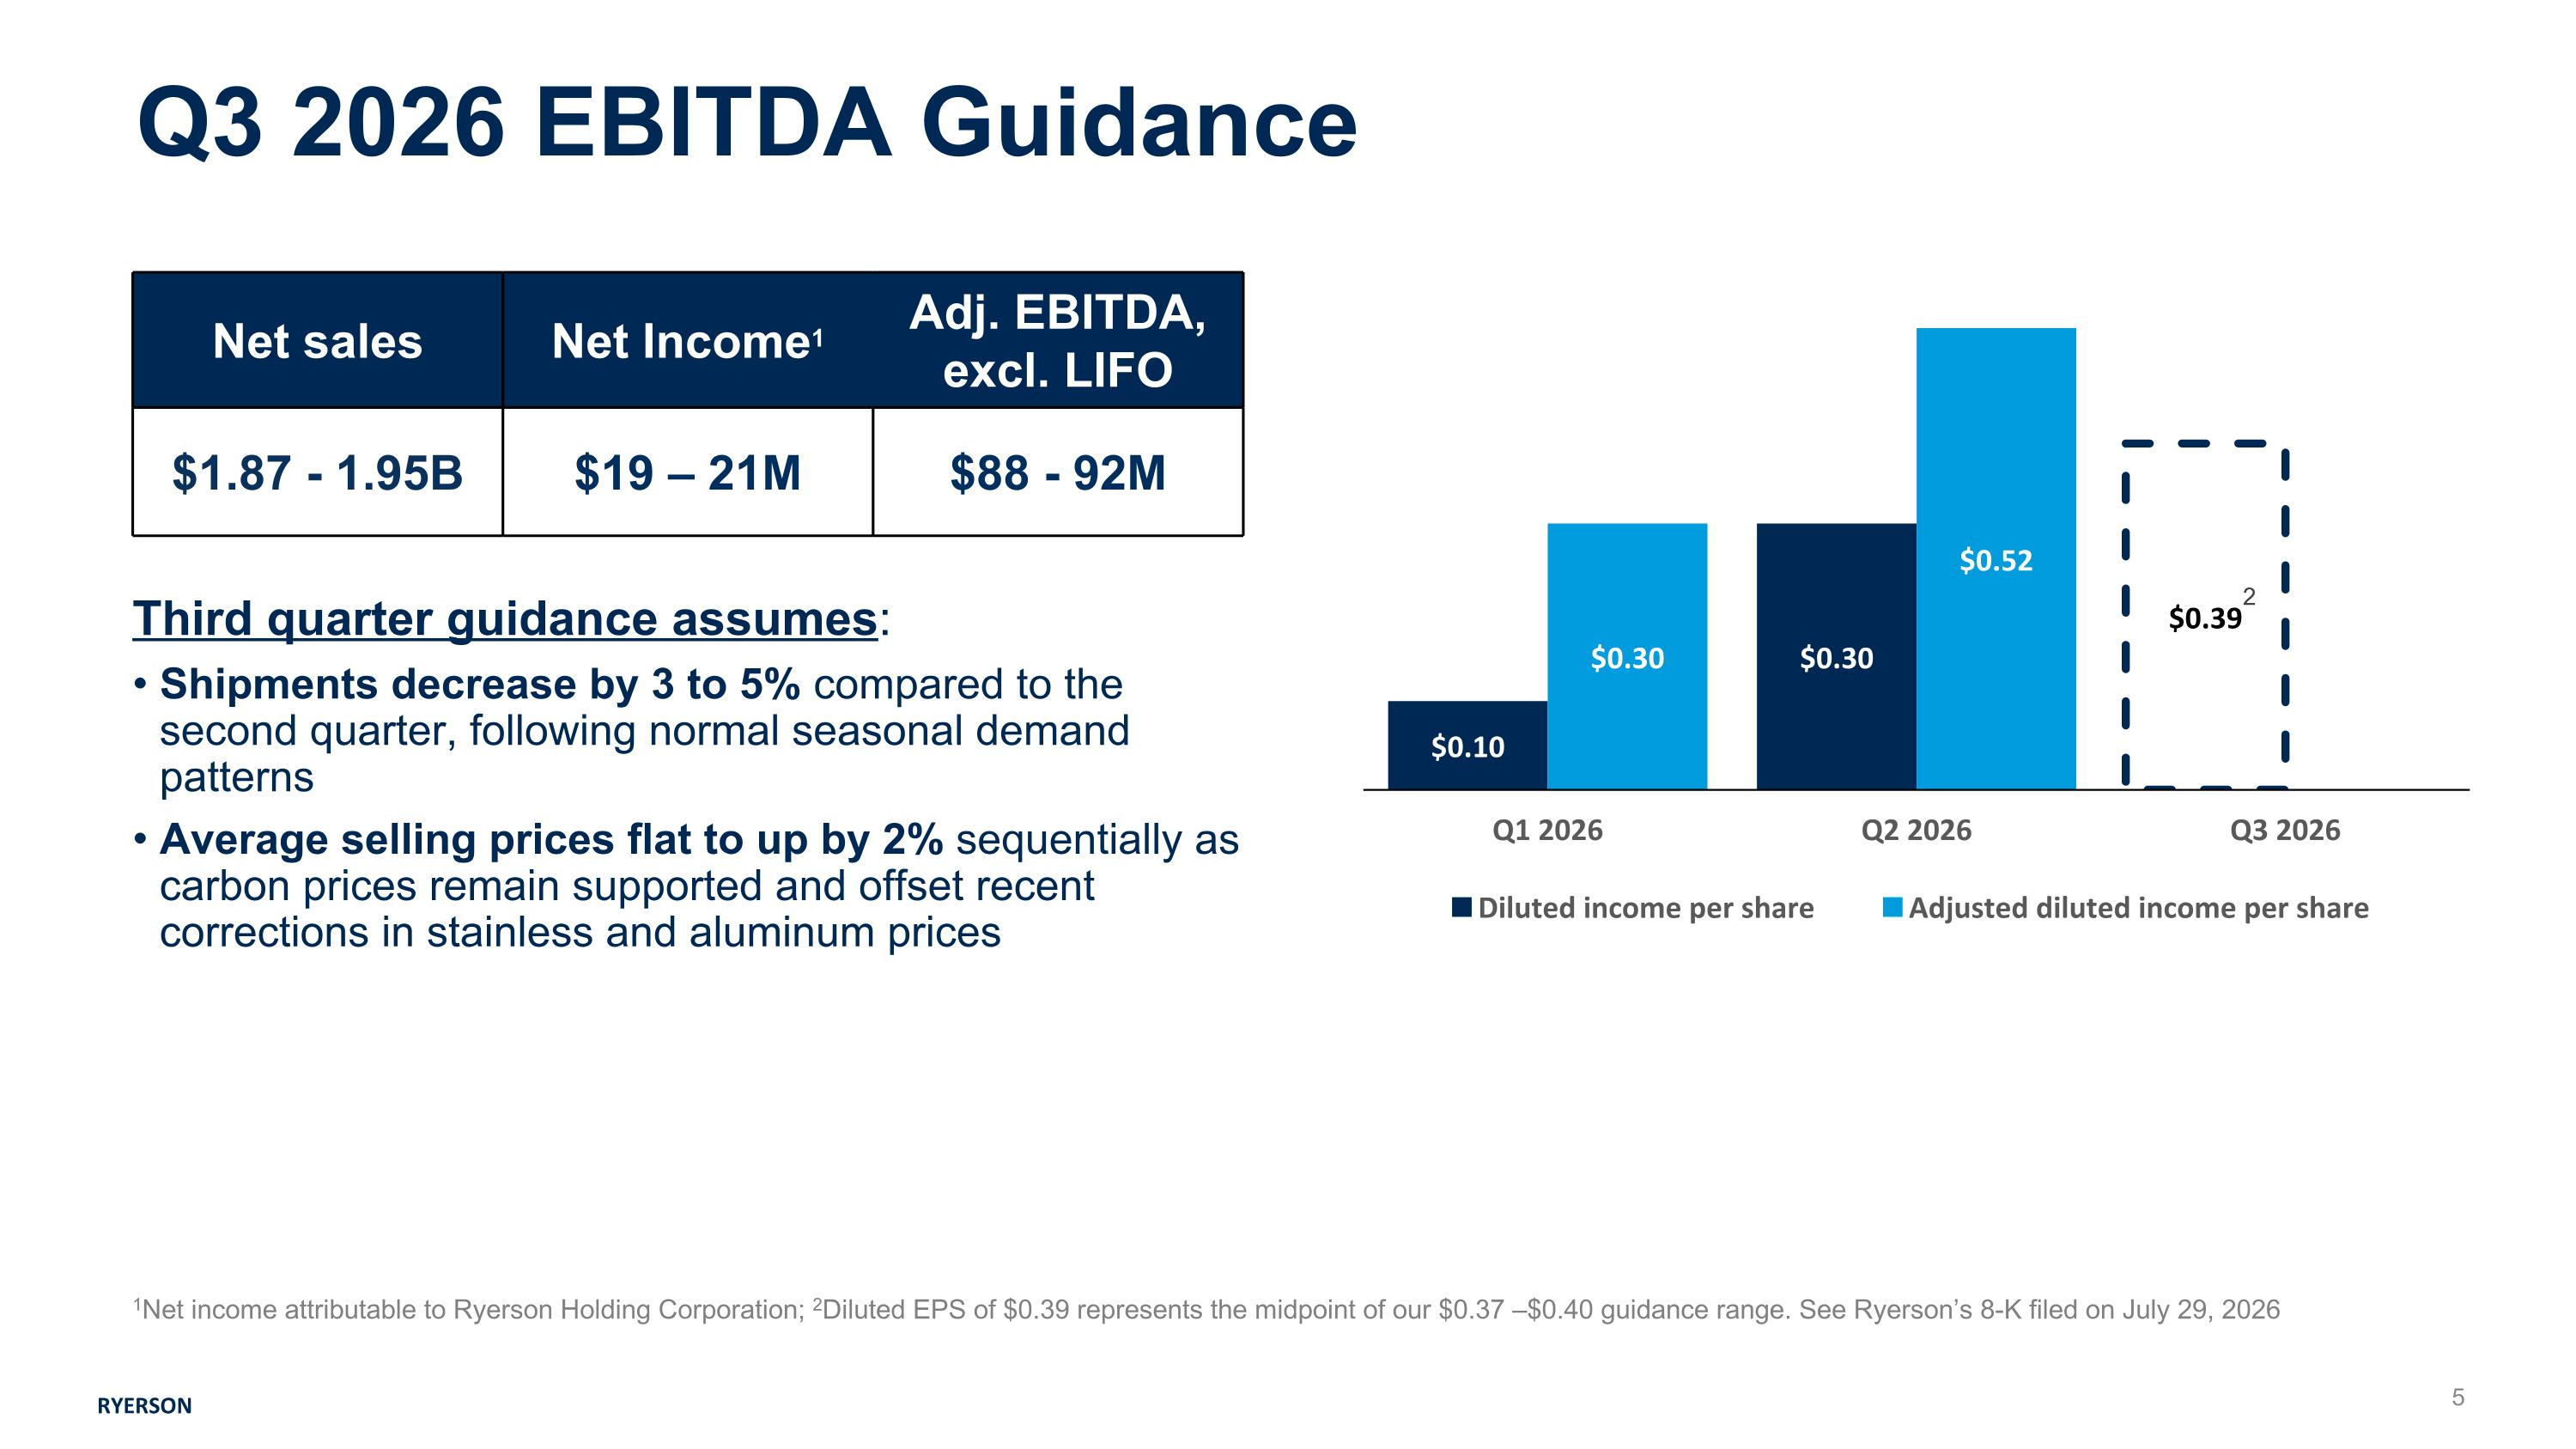
RYERSON 1Net income attributable to Ryerson Holding Corporation; 2Diluted EPS of $0.39 represents the midpoint of our $0.37 –$0.40 guidance range. See Ryerson’s 8-K filed on July 29, 2026 Net sales Net Income1 Adj. EBITDA, excl. LIFO $1.87 - 1.95B $19 – 21M $88 - 92M Third quarter guidance assumes: Shipments decrease by 3 to 5% compared to the second quarter, following normal seasonal demand patterns Average selling prices flat to up by 2% sequentially as carbon prices remain supported and offset recent corrections in stainless and aluminum prices Q3 2026 EBITDA Guidance 2
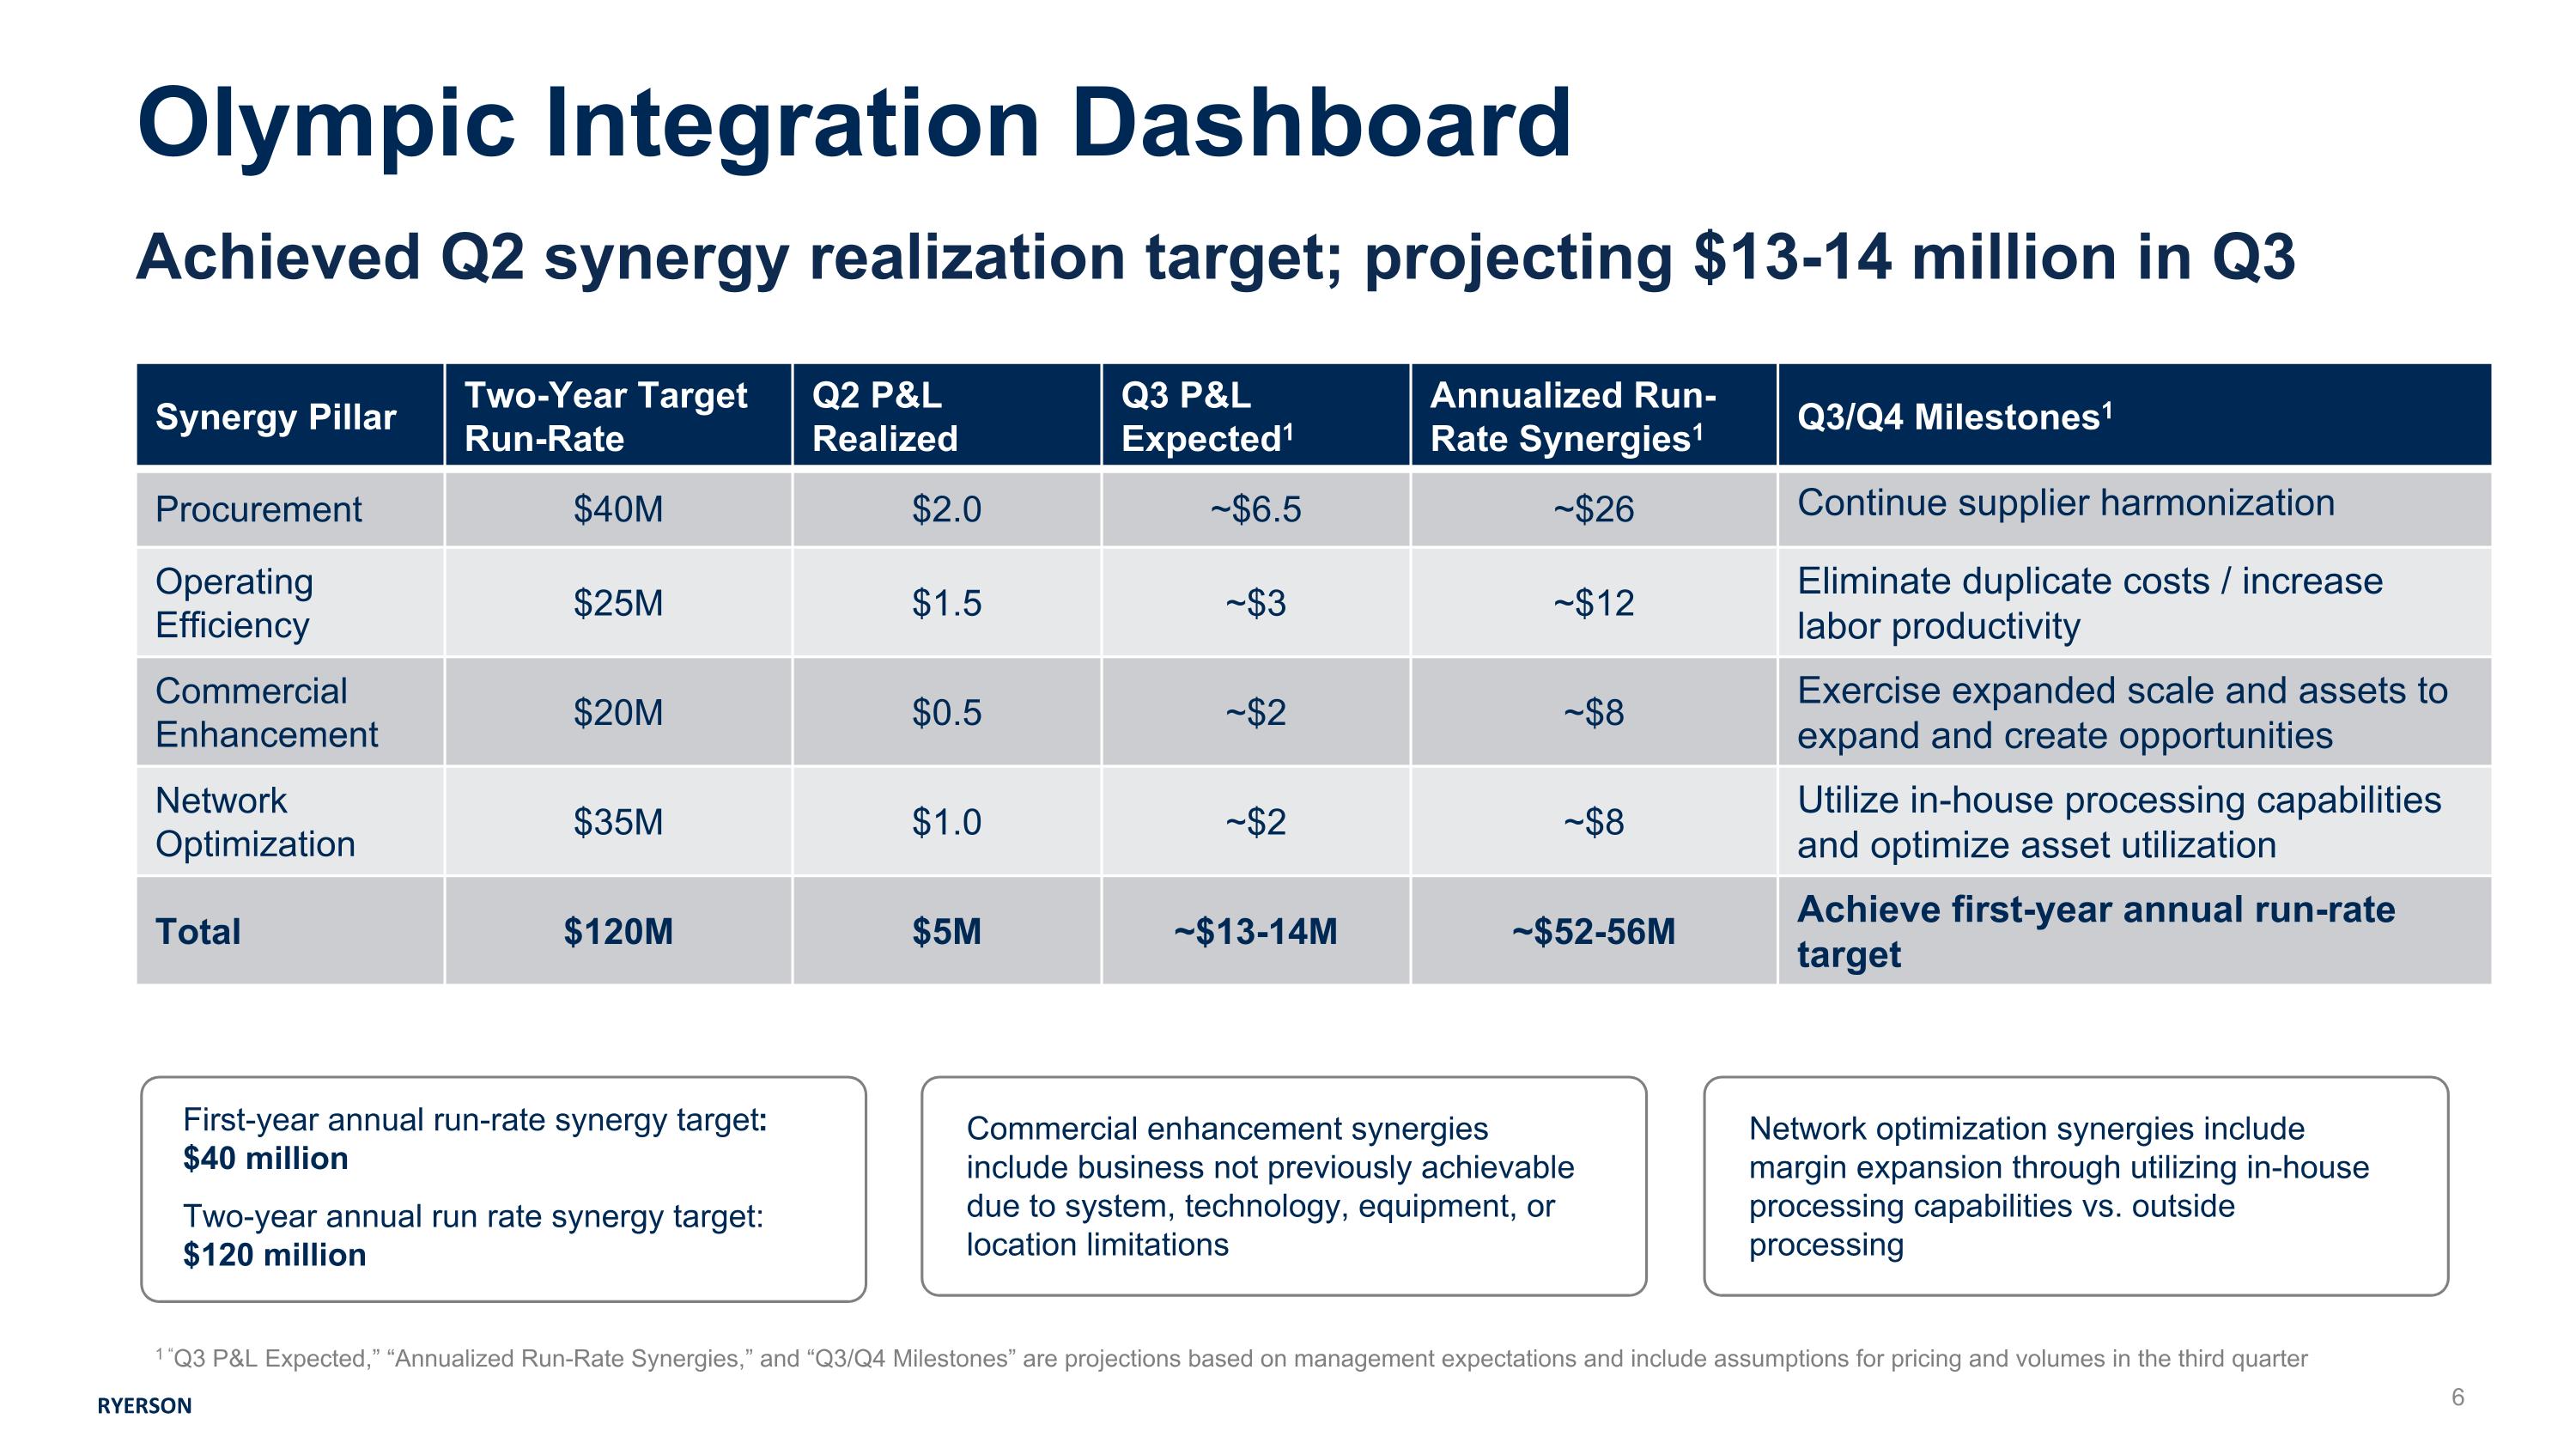
Olympic Integration Dashboard RYERSON Achieved Q2 synergy realization target; projecting $13-14 million in Q3 Synergy Pillar Two-Year Target Run-Rate Q2 P&L Realized Q3 P&L Expected1 Annualized Run-Rate Synergies1 Q3/Q4 Milestones1 Procurement $40M $2.0 ~$6.5 ~$26 Continue supplier harmonization Operating Efficiency $25M $1.5 ~$3 ~$12 Eliminate duplicate costs / increase labor productivity Commercial Enhancement $20M $0.5 ~$2 ~$8 Exercise expanded scale and assets to expand and create opportunities Network Optimization $35M $1.0 ~$2 ~$8 Utilize in-house processing capabilities and optimize asset utilization Total $120M $5M ~$13-14M ~$52-56M Achieve first-year annual run-rate target First-year annual run-rate synergy target: $40 million Two-year annual run rate synergy target: $120 million Commercial enhancement synergies include business not previously achievable due to system, technology, equipment, or location limitations Network optimization synergies include margin expansion through utilizing in-house processing capabilities vs. outside processing 1 “Q3 P&L Expected,” “Annualized Run-Rate Synergies,” and “Q3/Q4 Milestones” are projections based on management expectations and include assumptions for pricing and volumes in the third quarter
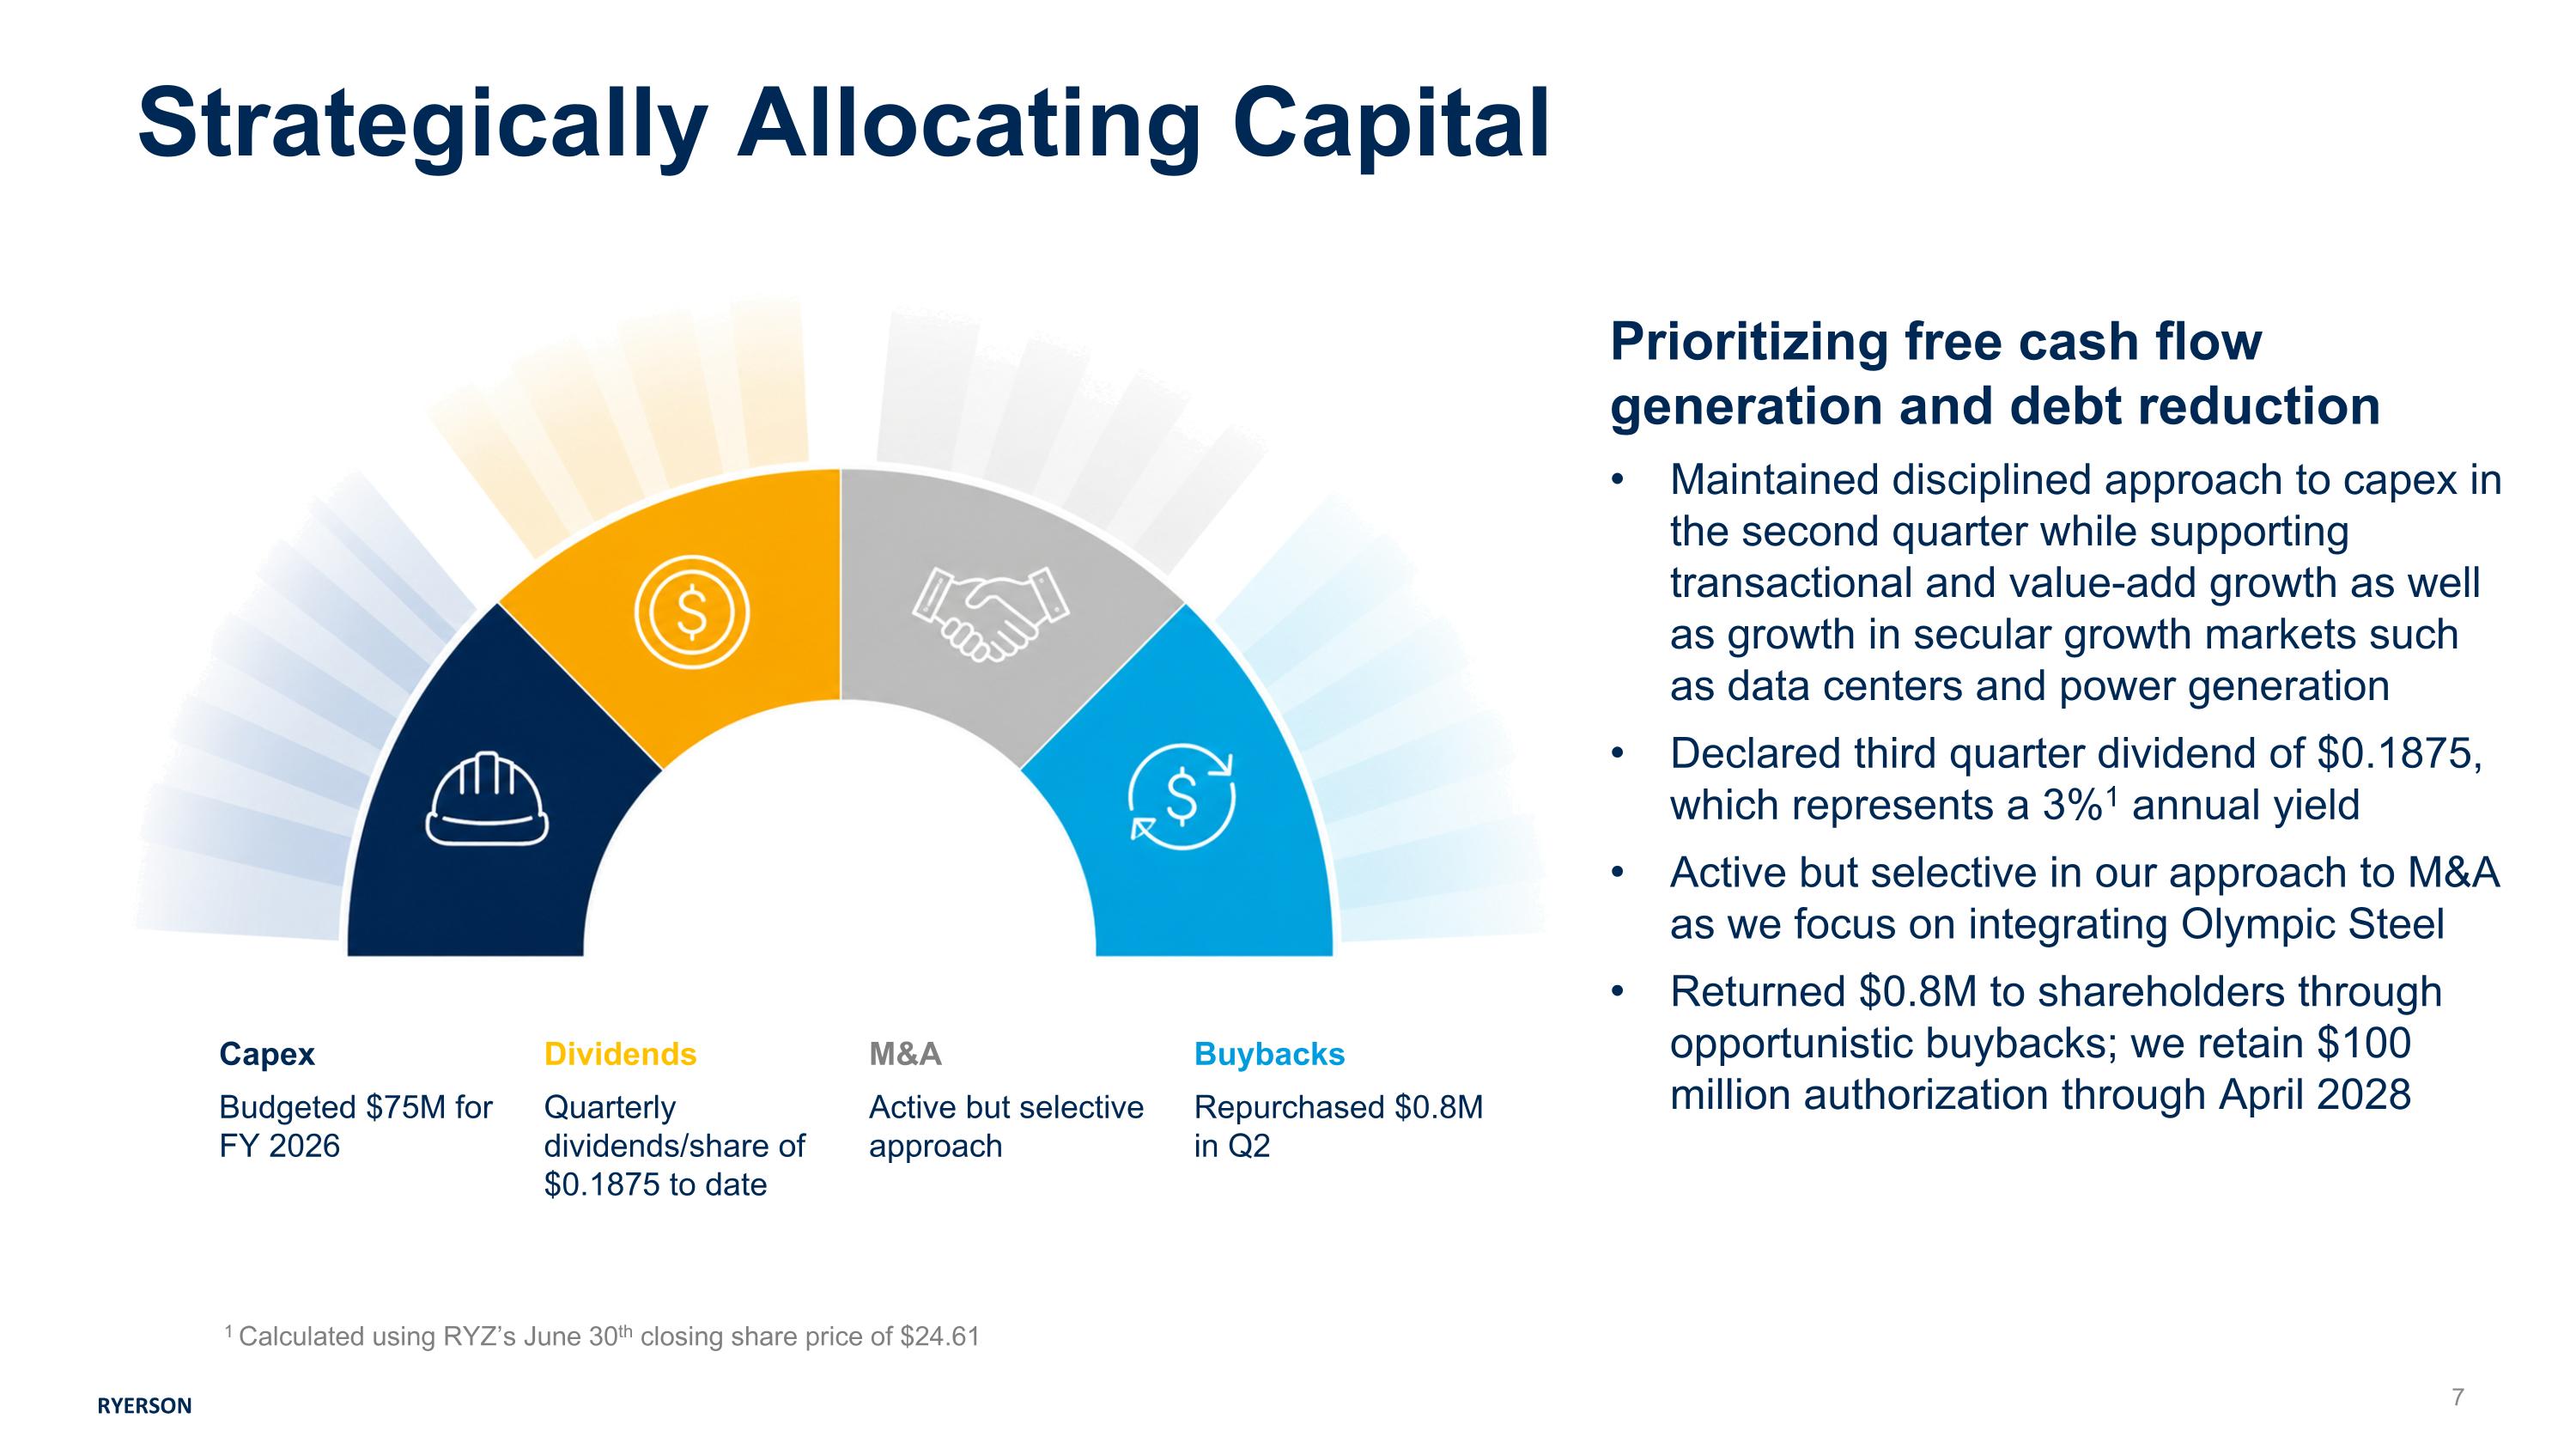
RYERSON Capex Dividends M&A Buybacks Budgeted $75M for FY 2026 Quarterly dividends/share of $0.1875 to date Active but selective approach Repurchased $0.8M in Q2 Prioritizing free cash flow generation and debt reduction Maintained disciplined approach to capex in the second quarter while supporting transactional and value-add growth as well as growth in secular growth markets such as data centers and power generation Declared third quarter dividend of $0.1875, which represents a 3%1 annual yield Active but selective in our approach to M&A as we focus on integrating Olympic Steel Returned $0.8M to shareholders through opportunistic buybacks; we retain $100 million authorization through April 2028 1 Calculated using RYZ’s June 30th closing share price of $24.61 Strategically Allocating Capital
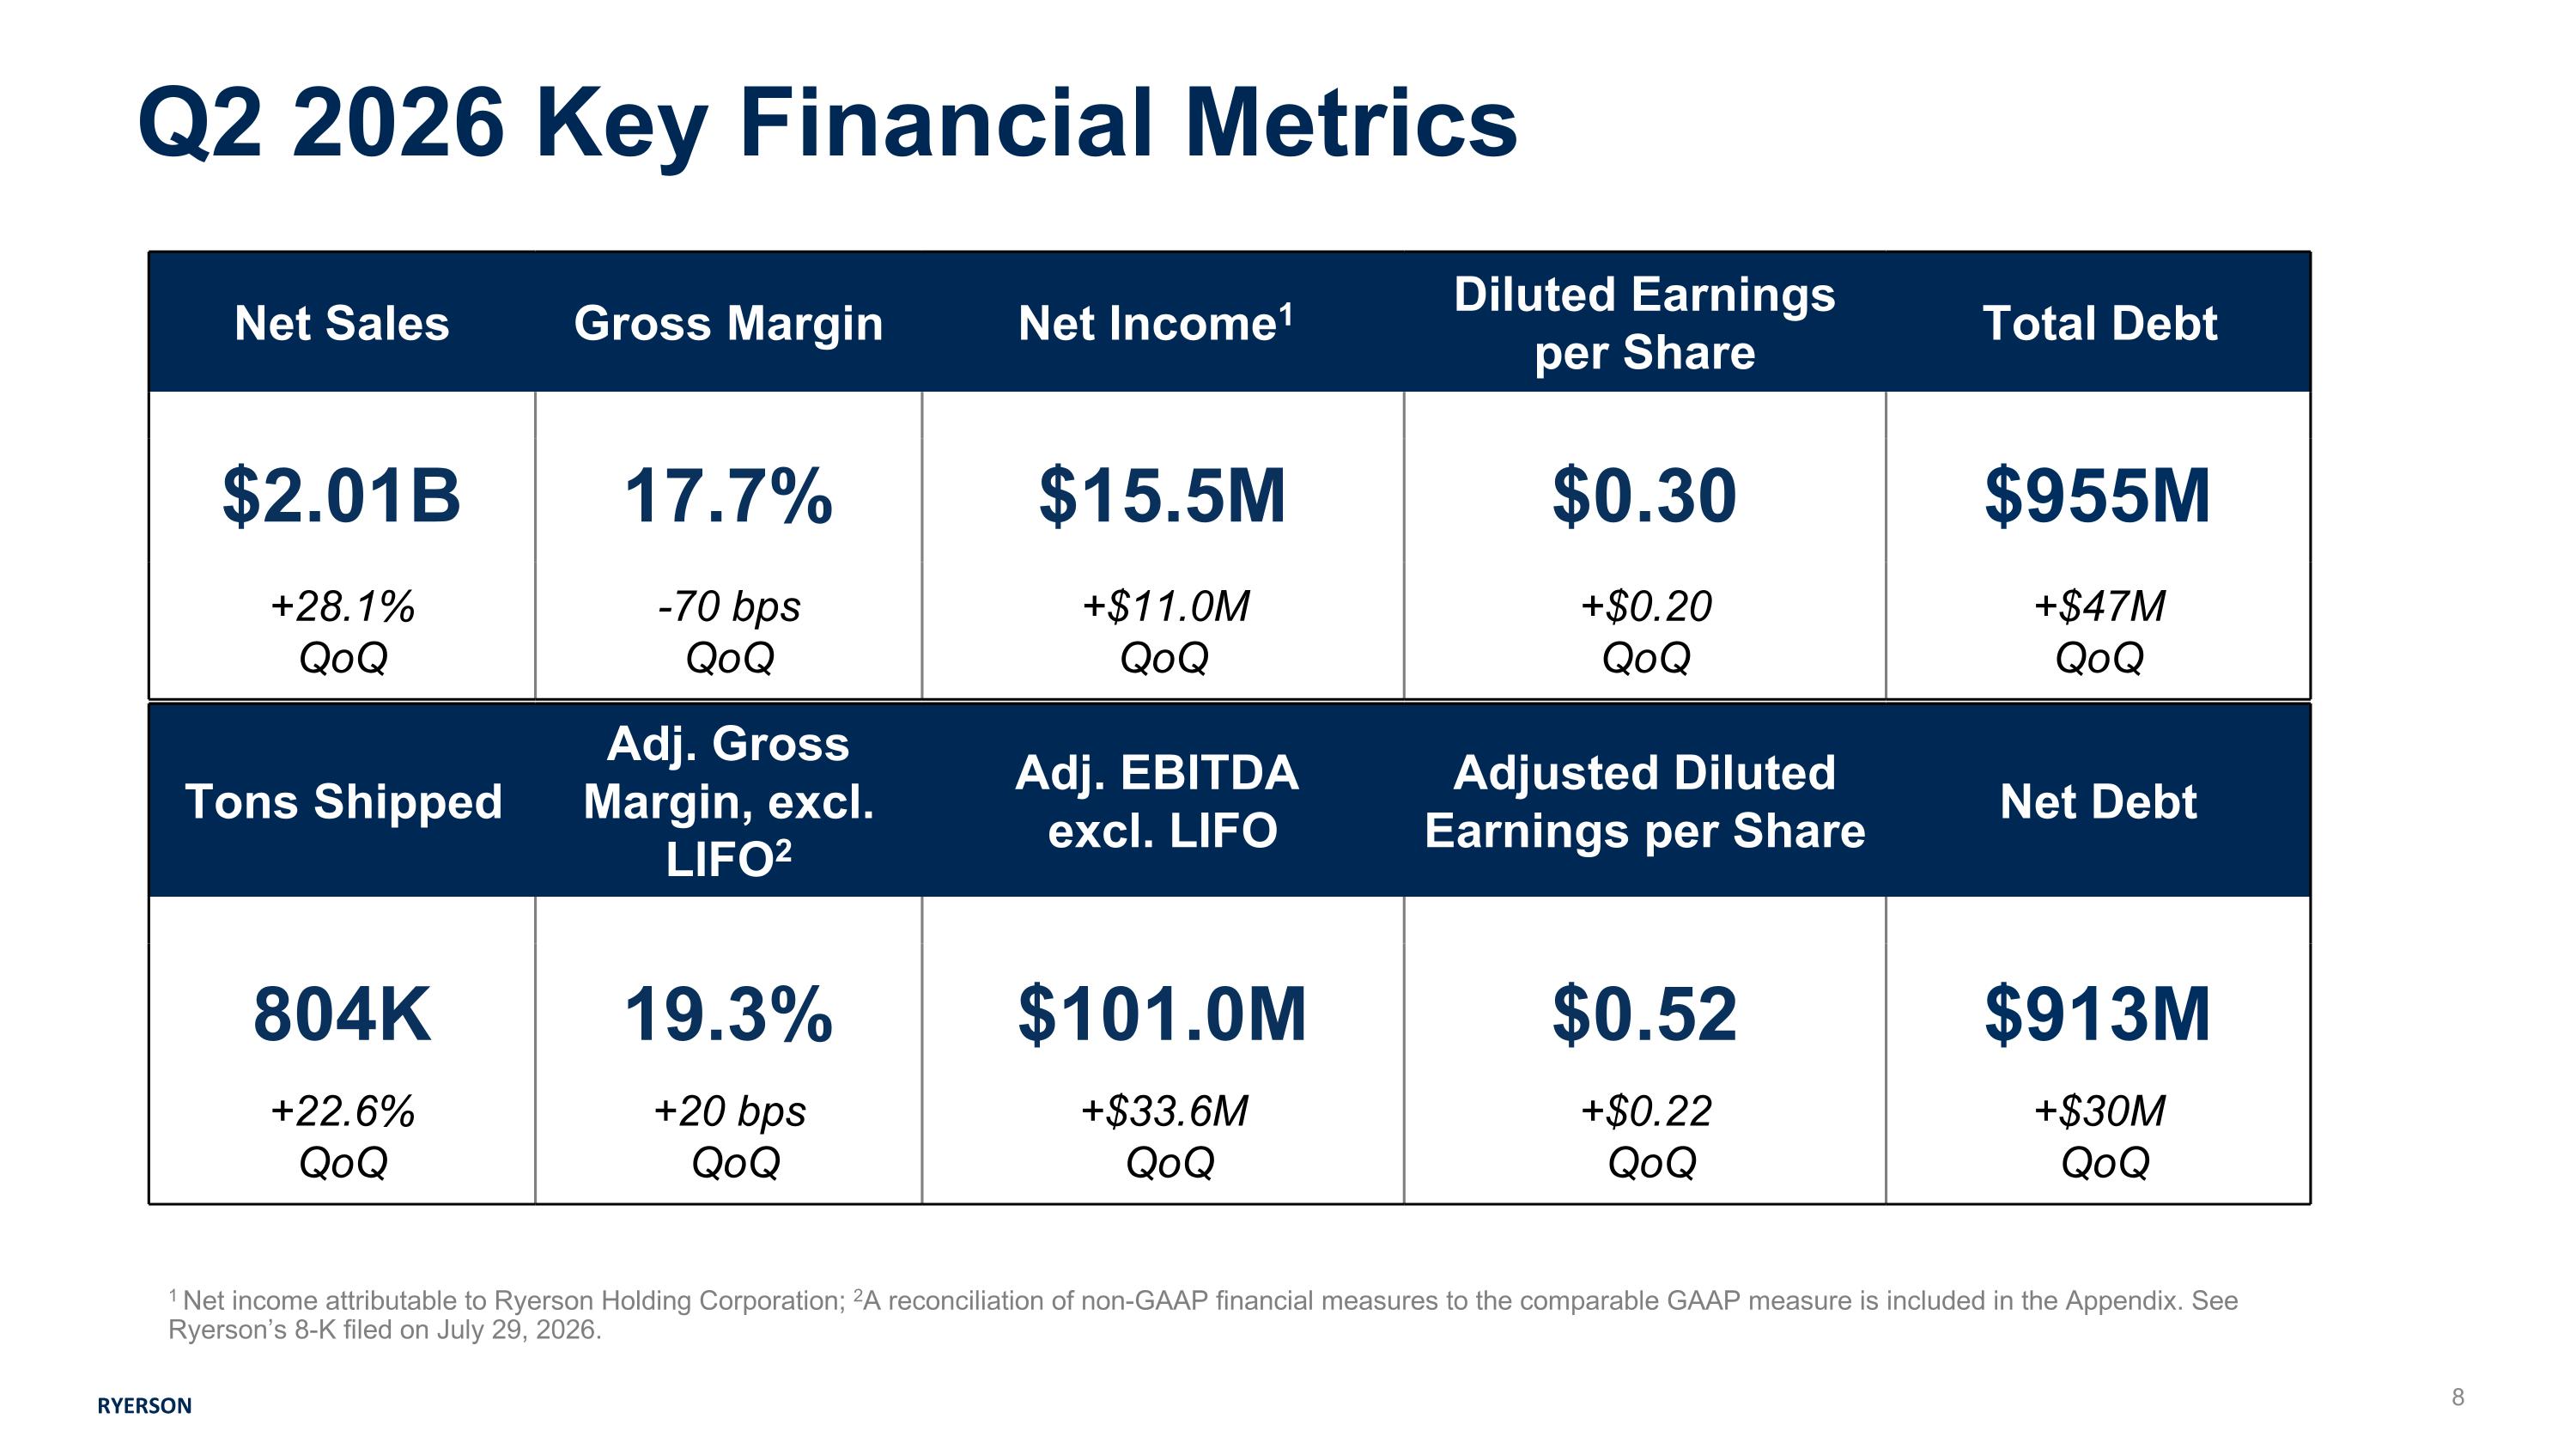
RYERSON 1 Net income attributable to Ryerson Holding Corporation; 2A reconciliation of non-GAAP financial measures to the comparable GAAP measure is included in the Appendix. See Ryerson’s 8-K filed on July 29, 2026. Net Sales Gross Margin Net Income1 Diluted Earnings per Share Total Debt $2.01B 17.7% $15.5M $0.30 $955M +28.1% QoQ -70 bps QoQ +$11.0M QoQ +$0.20 QoQ +$47M QoQ Tons Shipped Adj. Gross Margin, excl. LIFO2 Adj. EBITDA excl. LIFO Adjusted Diluted Earnings per Share Net Debt 804K 19.3% $101.0M $0.52 $913M +22.6% QoQ +20 bps QoQ +$33.6M QoQ +$0.22 QoQ +$30M QoQ Q2 2026 Key Financial Metrics
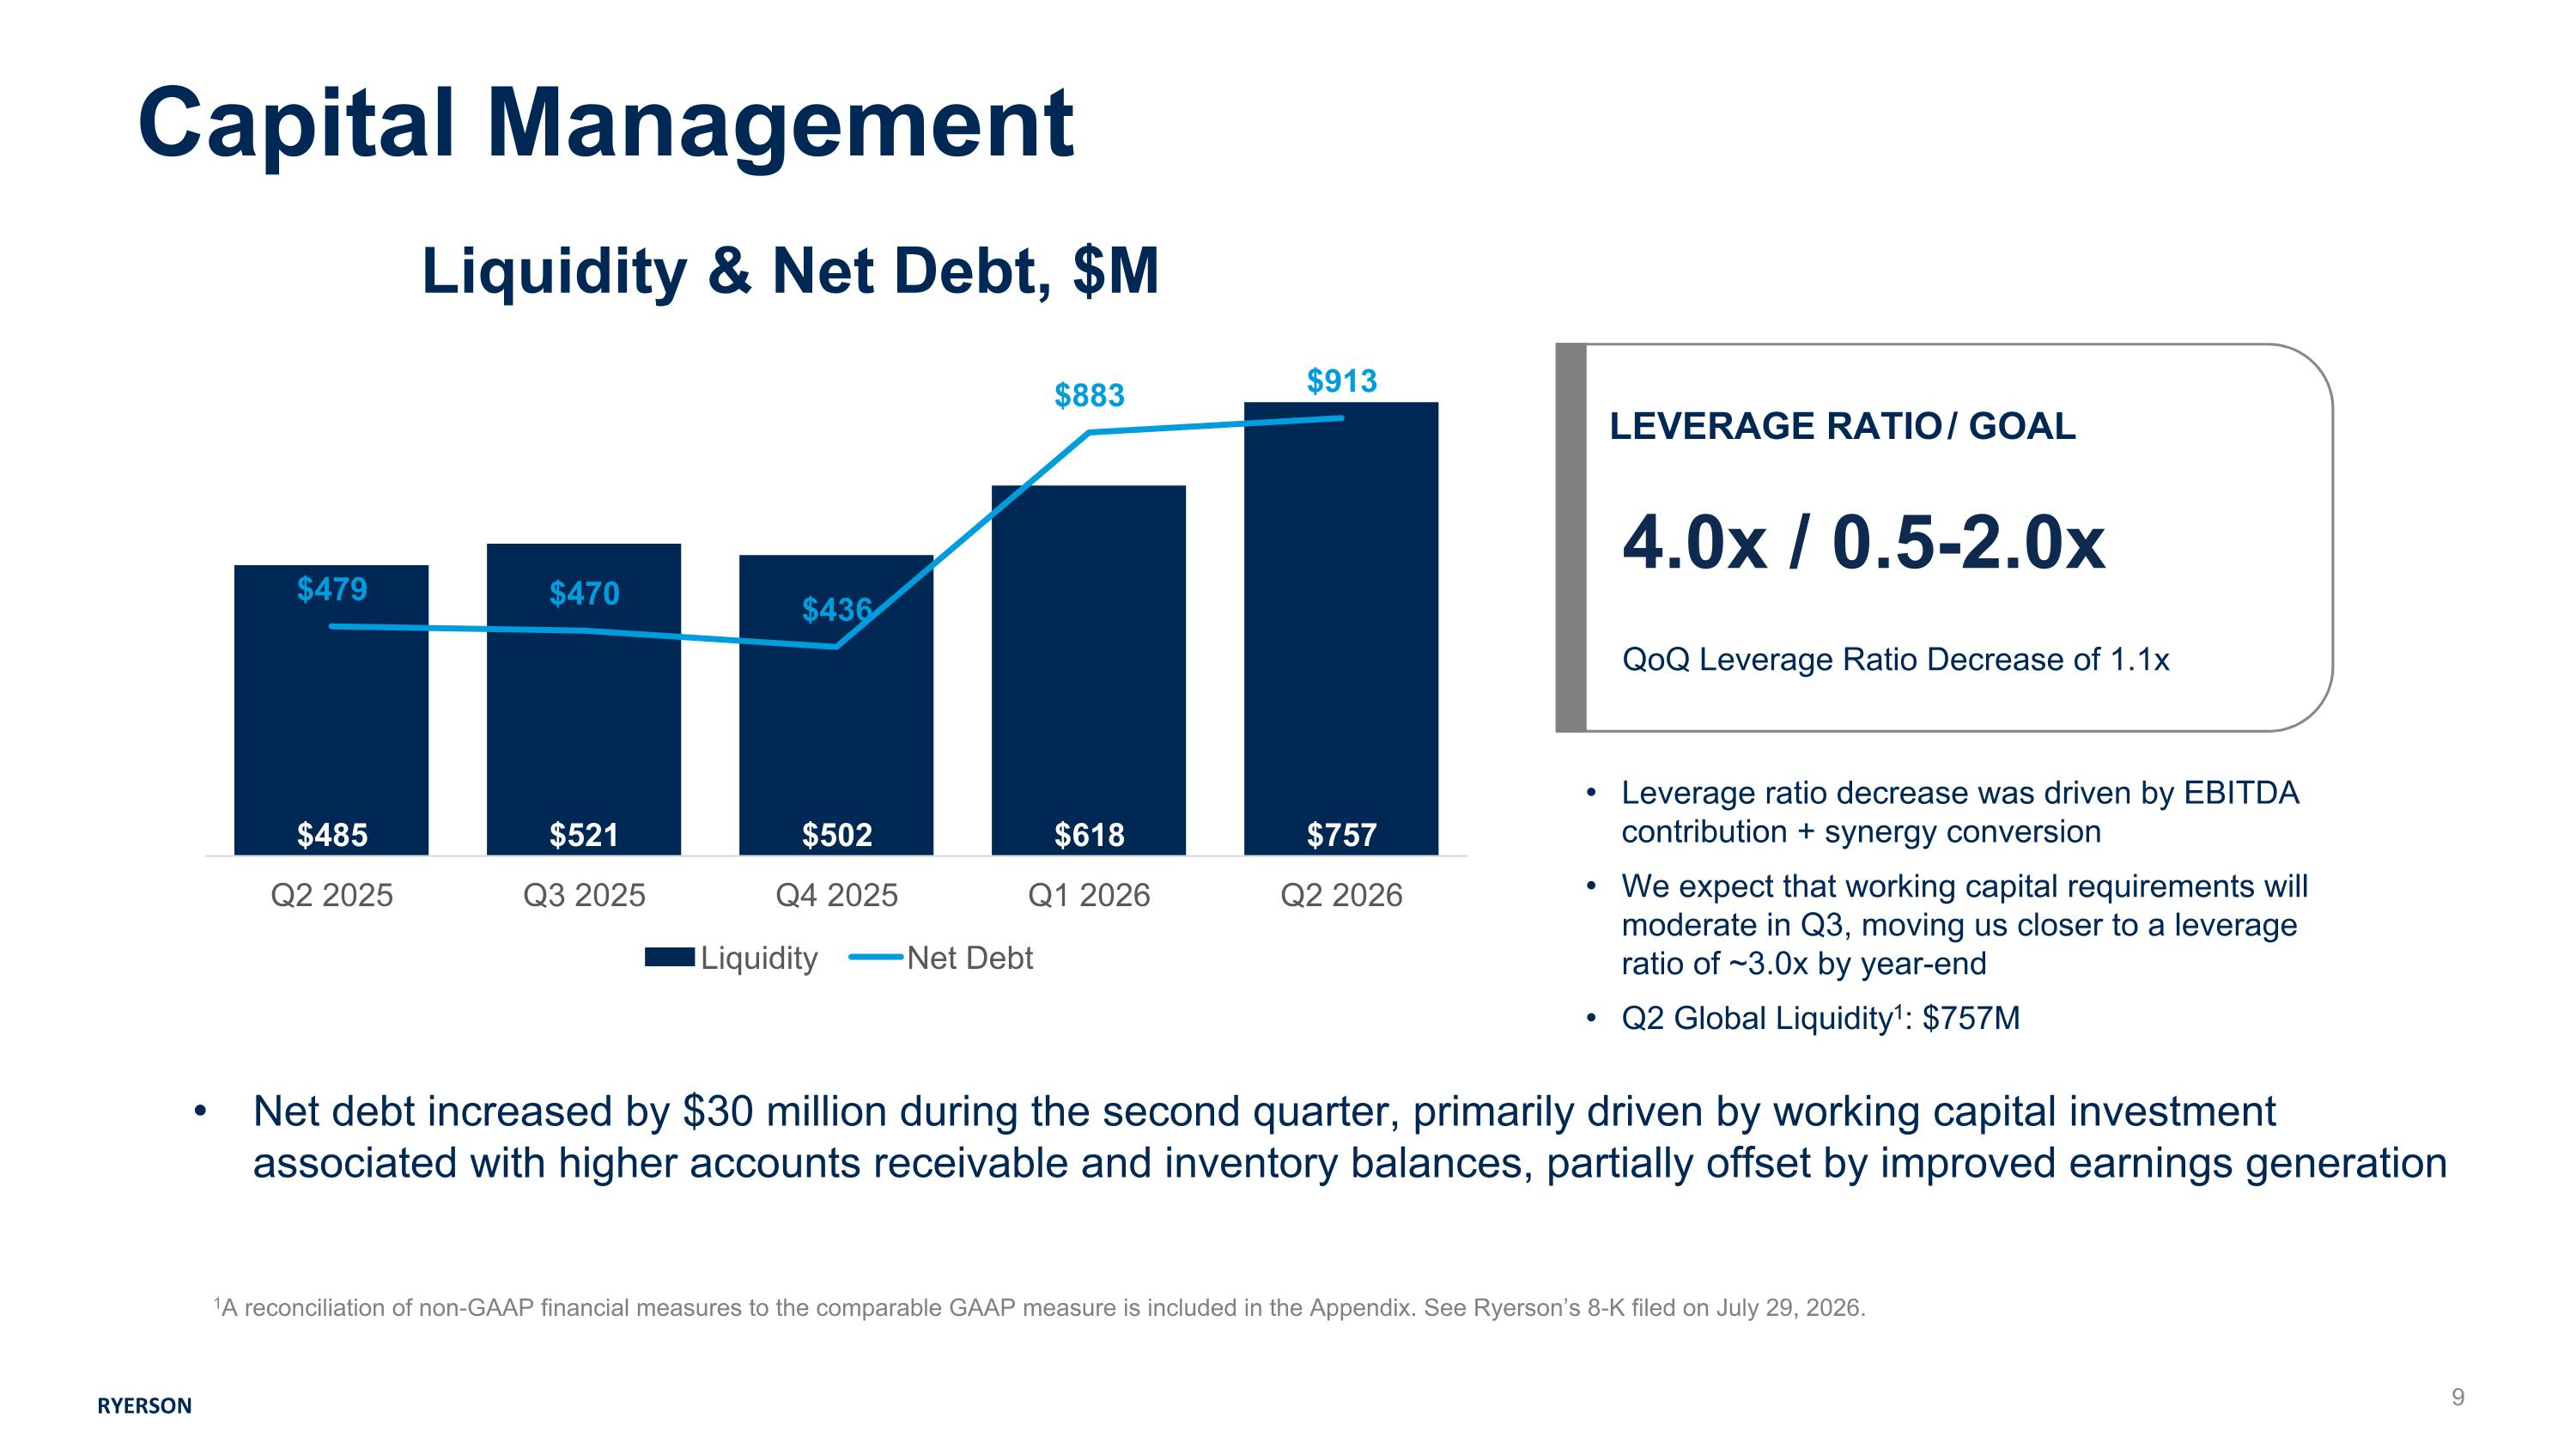
Capital Management RYERSON Leverage ratio decrease was driven by EBITDA contribution + synergy conversion We expect that working capital requirements will moderate in Q3, moving us closer to a leverage ratio of ~3.0x by year-end Q2 Global Liquidity1: $757M LEVERAGE RATIO / GOAL 4.0x / 0.5-2.0x QoQ Leverage Ratio Decrease of 1.1x 1A reconciliation of non-GAAP financial measures to the comparable GAAP measure is included in the Appendix. See Ryerson’s 8-K filed on July 29, 2026. Net debt increased by $30 million during the second quarter, primarily driven by working capital investment associated with higher accounts receivable and inventory balances, partially offset by improved earnings generation Liquidity & Net Debt, $M

RYERSON

Appendix
FORWARD-LOOKING STATEMENTS This communication contains certain “forward-looking statements” within the meaning of federal securities laws. Forward-looking statements may be identified by words such as “anticipates,” “believes,” “could,” “continue,” “estimate,” “expects,” “intends,” “will,” “should,” “may,” “plan,” “predict,” “project,” “would” and similar expressions. Forward-looking statements are not statements of historical fact and reflect Ryerson’s current views about future events. Such forward-looking statements include, without limitation, statements about the benefits of the merger involving Ryerson and Olympic Steel, including future financial and operating results, Ryerson’s plans, objectives, expectations, and intentions, and other statements that are not historical facts. No assurances can be given that the forward-looking statements contained in this communication will occur as projected, and actual results may differ materially from those projected. Forward-looking statements are based on current expectations, estimates, and assumptions that involve a number of risks and uncertainties that could cause actual results to differ materially from those projected. These risks and uncertainties include, without limitation, the risk that the businesses will not be integrated successfully or will be more costly or difficult than expected; the risk that the cost savings and any other synergies from the proposed transaction may not be fully realized or may take longer to realize than expected, or that the transaction may be less accretive than expected; the risk that the merger will not provide shareholders with increased earnings potential; the risk that the credit ratings of the combined company or its subsidiaries may be different from what the companies expect; the diversion of management time from ongoing business operations and opportunities as a result of the transaction; the risk of adverse reactions or changes to business or employee relationships resulting from the merger; adverse economic conditions; highly cyclical fluctuations resulting from, among others, seasonality, market uncertainty, and costs of goods sold; the Company’s ability to remain competitive and maintain market share in the highly competitive and fragmented metals distribution industry; managing the costs of purchased metals relative to the price at which each company sells its products during periods of rapid price escalation or deflation; customer, supplier, and competitor consolidation, bankruptcy, or insolvency; the impairment of goodwill that could result from, among other things, volatility in the markets in which each company operates; the impact of geopolitical events; future funding for postretirement employee benefits may require substantial payments from current cash flow; the regulatory and other operational risks associated with our operations located outside of the United States; currency rate fluctuations; the adequacy of the Company’s efforts to mitigate cyber security risks and threats; reduced production schedules, layoffs, or work stoppages by each company’s own, its suppliers’, or customers’ personnel; any underfunding of certain employee retirement benefit plans and the actual costs exceeding current estimates; prolonged disruption of the Company’s processing centers; failure to manage potential conflicts of interest between or among customers or suppliers of each company; unanticipated changes to, or any inability to hire and retain key personnel at either company; currency exchange rate fluctuations; the incurrence of substantial costs of liabilities to comply with, or as a result of, violations of environmental laws; the risk of product liability claims; the Company’s indebtedness or covenants in the instruments governing such indebtedness; the influence of a single investor group over the company’s policies and procedures; and other risks inherent in Ryerson’s business and other factors described in Ryerson’s filings with the Securities and Exchange Commission (the “SEC”). Additional information concerning these and other factors that may impact such forward-looking statements can be found in filings and potential filings by Ryerson. If any of these risks materialize or assumptions prove incorrect, actual results could differ materially from the results implied by these forward-looking statements. Forward-looking statements are based on the estimates and opinions of management as of the date of this communication; subsequent events and developments may cause their assessments to change. Ryerson does not undertake any obligation to publicly update any forward-looking statement, whether as a result of new information, future events or otherwise, except as required by law and they specifically disclaim any obligation to do so. Readers are cautioned not to place undue reliance on these forward-looking statements that speak only as of the date hereof.
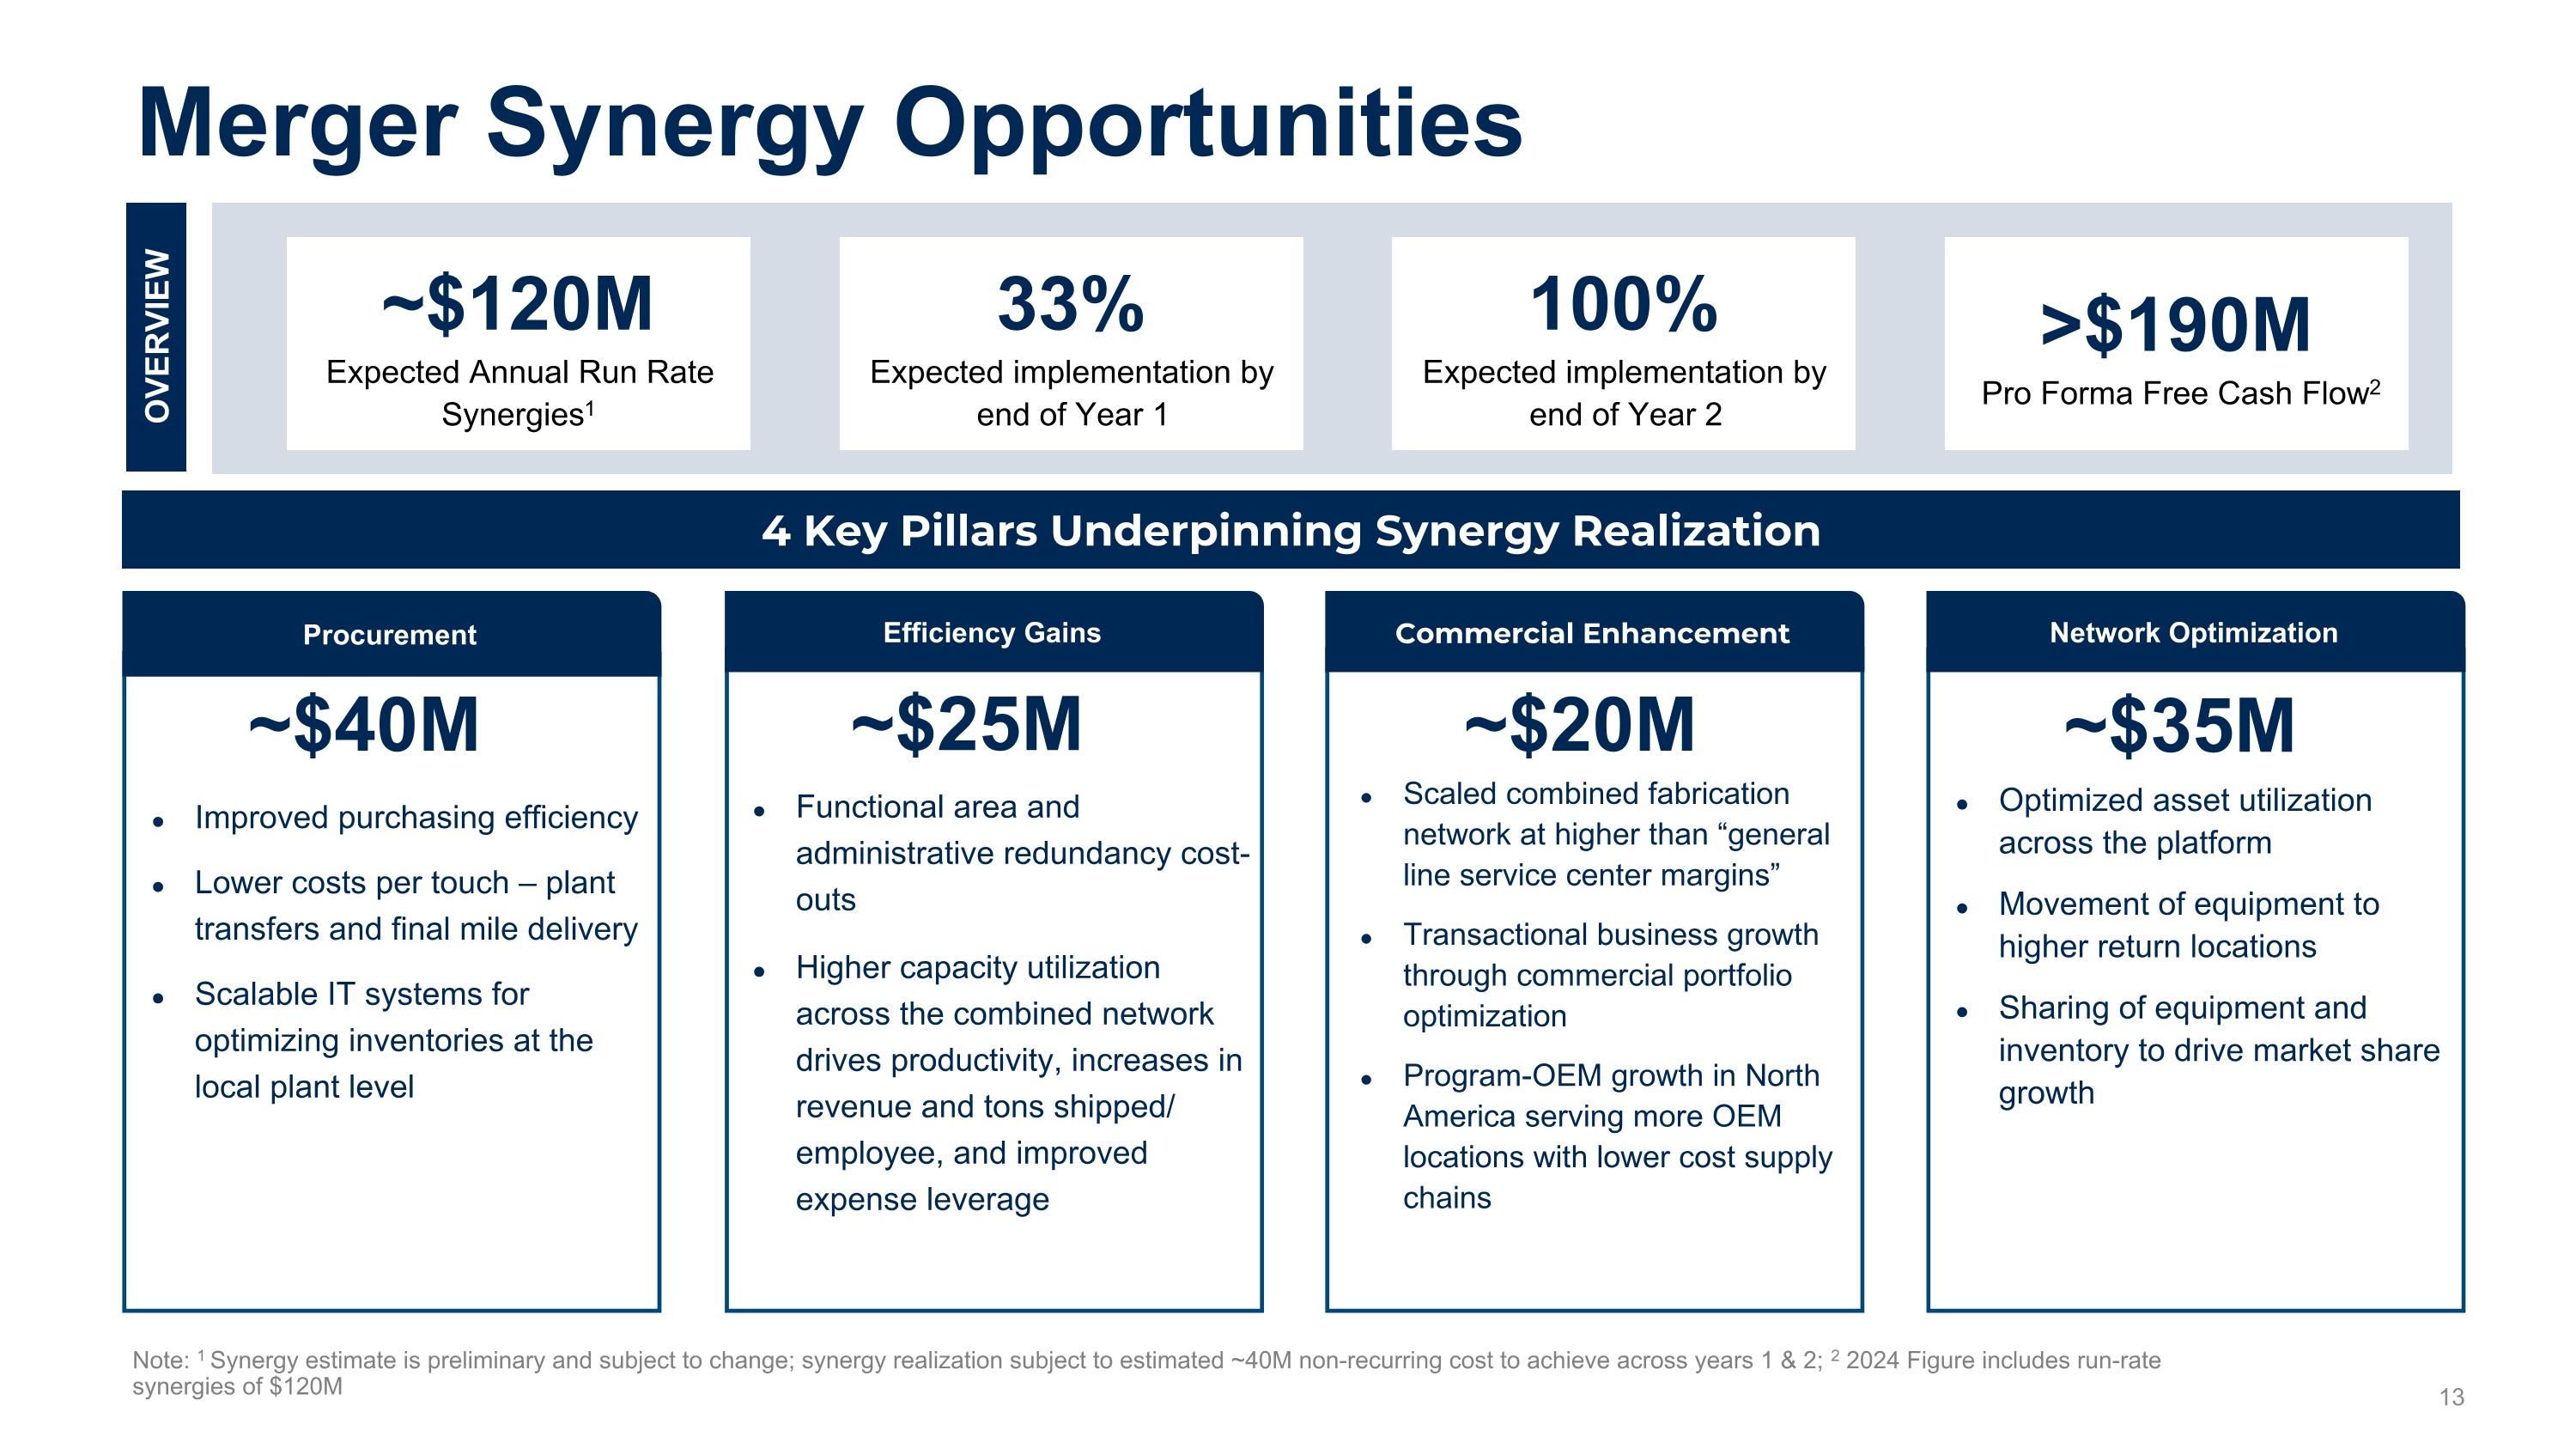
Note: 1 Synergy estimate is preliminary and subject to change; synergy realization subject to estimated ~40M non-recurring cost to achieve across years 1 & 2; 2 2024 Figure includes run-rate synergies of $120M 4 Key Pillars Underpinning Synergy Realization OVERVIEW ~$120M Expected Annual Run Rate Synergies1 33% Expected implementation by end of Year 1 100% Expected implementation by end of Year 2 >$190M Pro Forma Free Cash Flow2 Procurement Improved purchasing efficiency Lower costs per touch – plant transfers and final mile delivery Scalable IT systems for optimizing inventories at the local plant level Efficiency Gains Functional area and administrative redundancy cost-outs Higher capacity utilization across the combined network drives productivity, increases in revenue and tons shipped/ employee, and improved expense leverage Network Optimization Optimized asset utilization across the platform Movement of equipment to higher return locations Sharing of equipment and inventory to drive market share growth Commercial Enhancement Scaled combined fabrication network at higher than “general line service center margins” Transactional business growth through commercial portfolio optimization Program-OEM growth in North America serving more OEM locations with lower cost supply chains ~$40M ~$20M ~$35M ~$25M Merger Synergy Opportunities
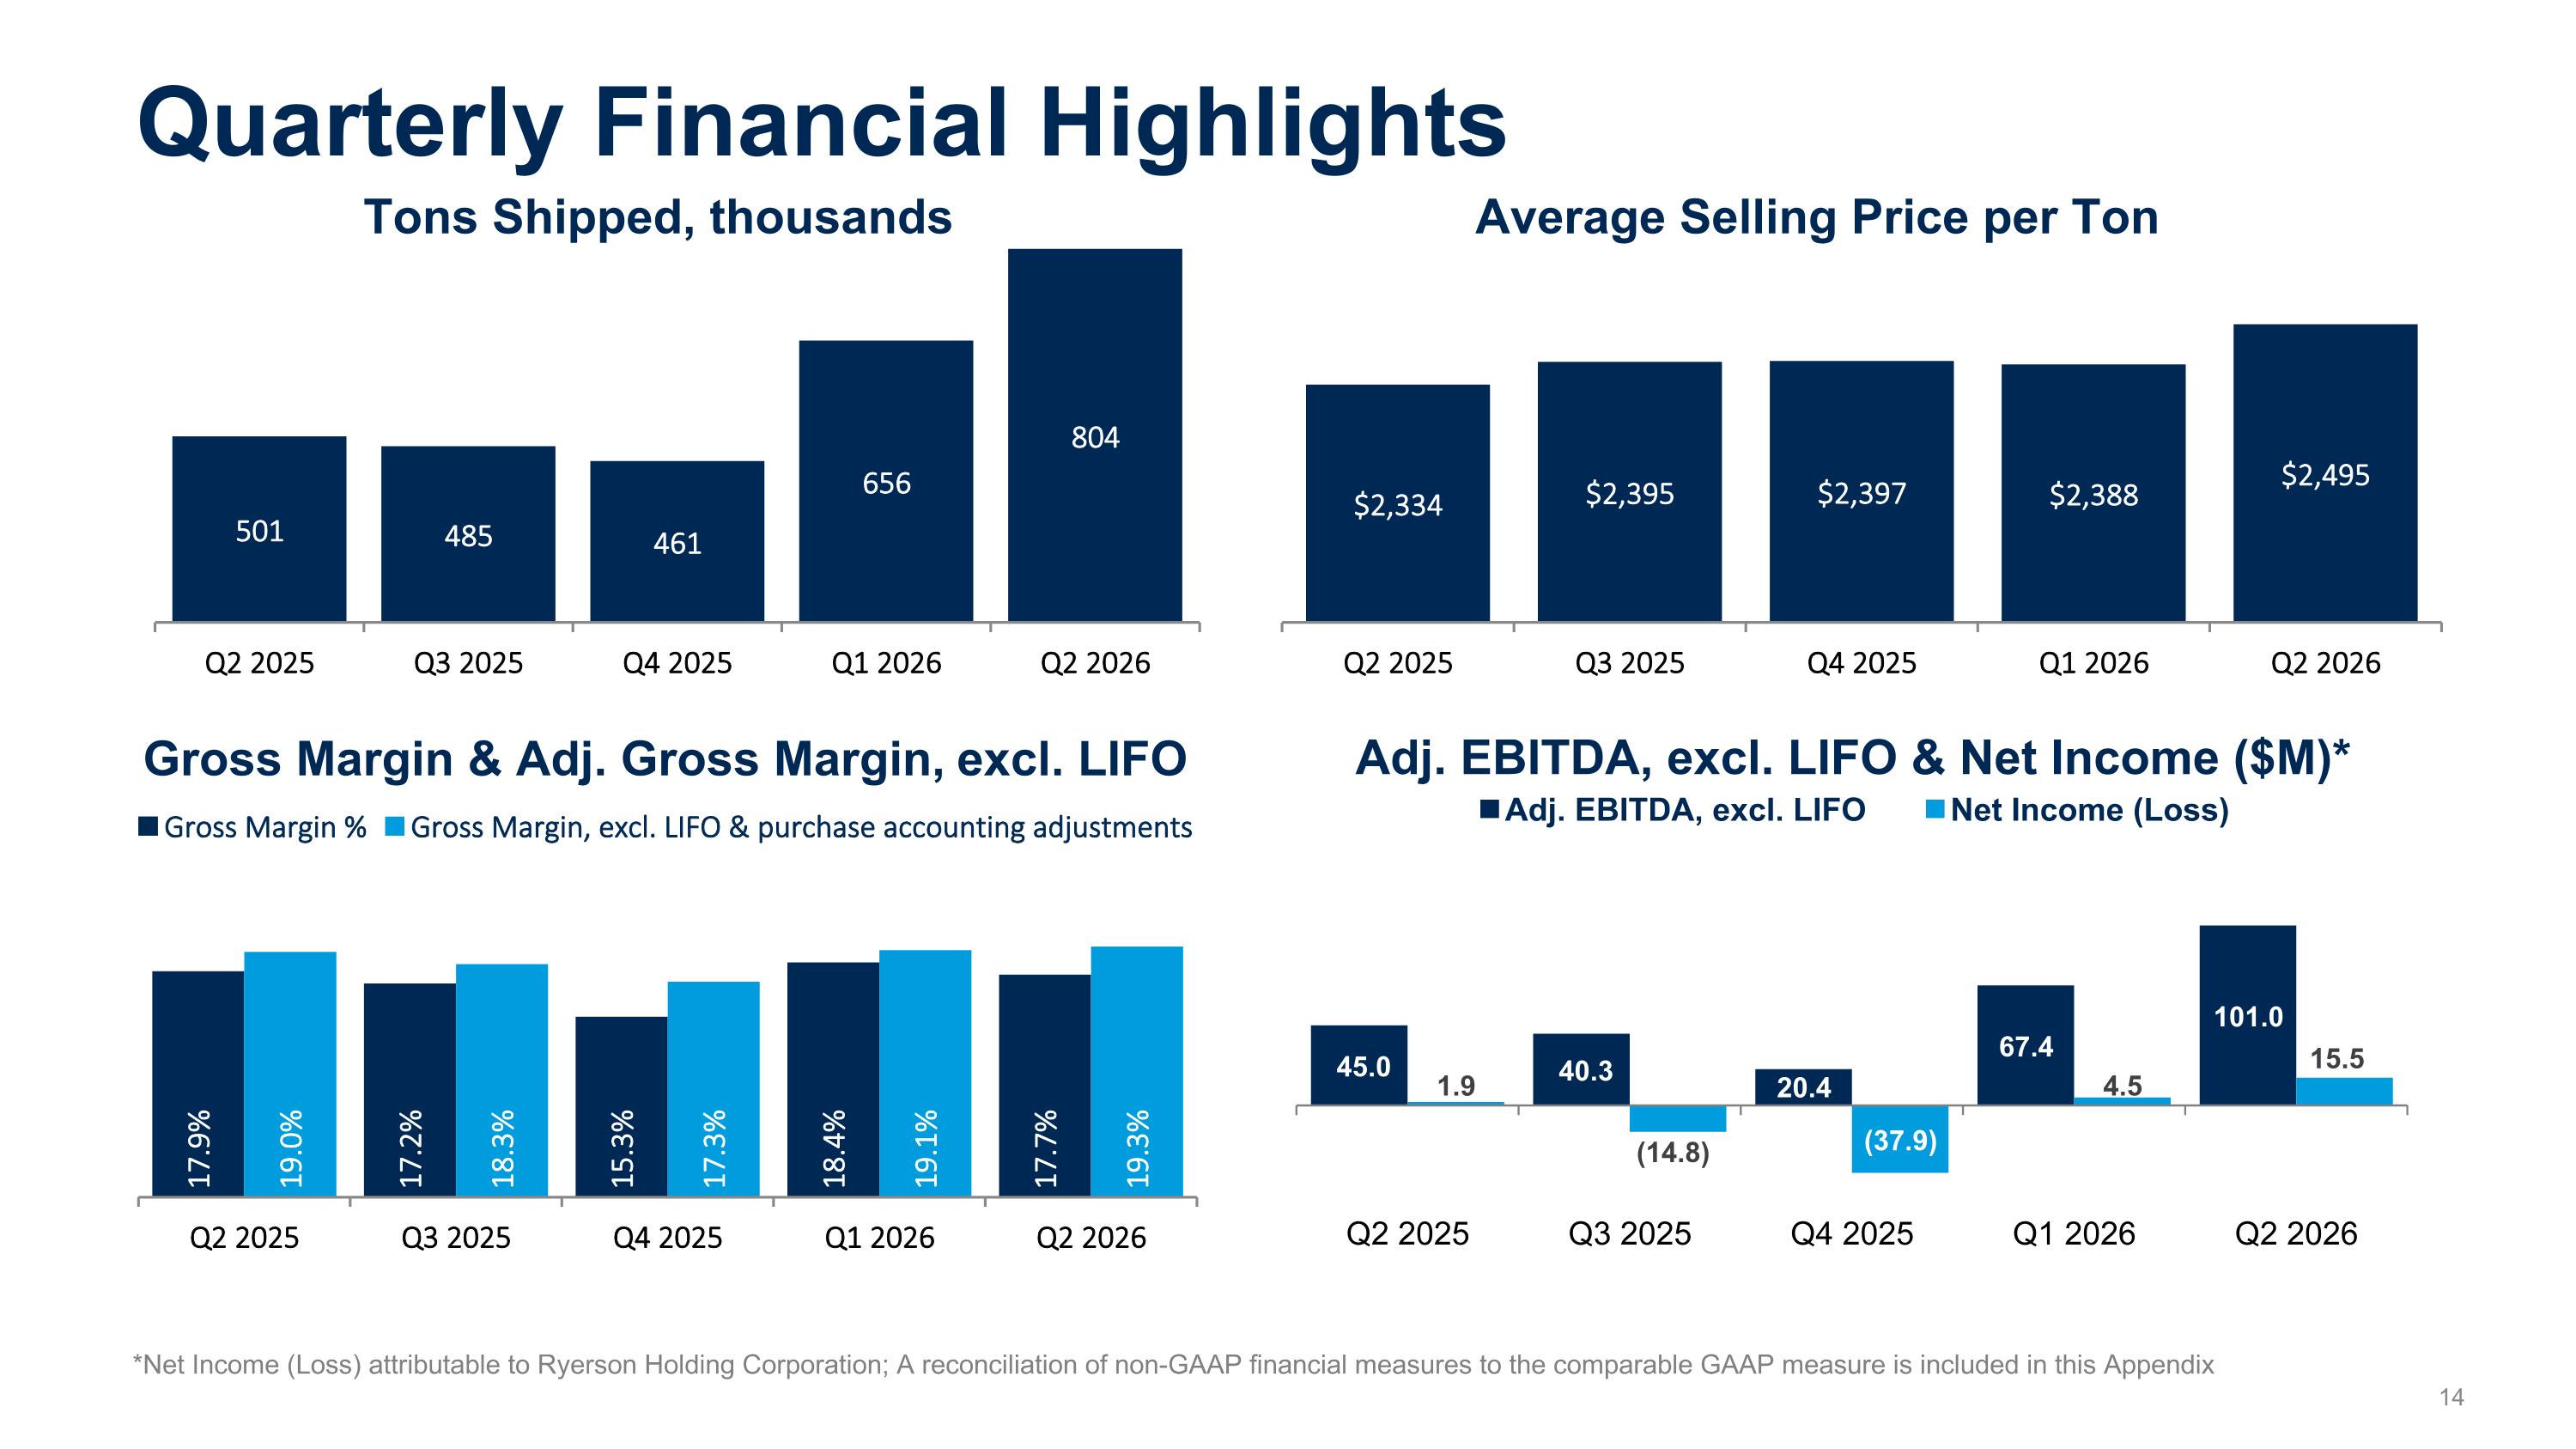
*Net Income (Loss) attributable to Ryerson Holding Corporation; A reconciliation of non-GAAP financial measures to the comparable GAAP measure is included in this Appendix Gross Margin & Adj. Gross Margin, excl. LIFO Tons Shipped, thousands Average Selling Price per Ton Adj. EBITDA, excl. LIFO & Net Income ($M)* Quarterly Financial Highlights
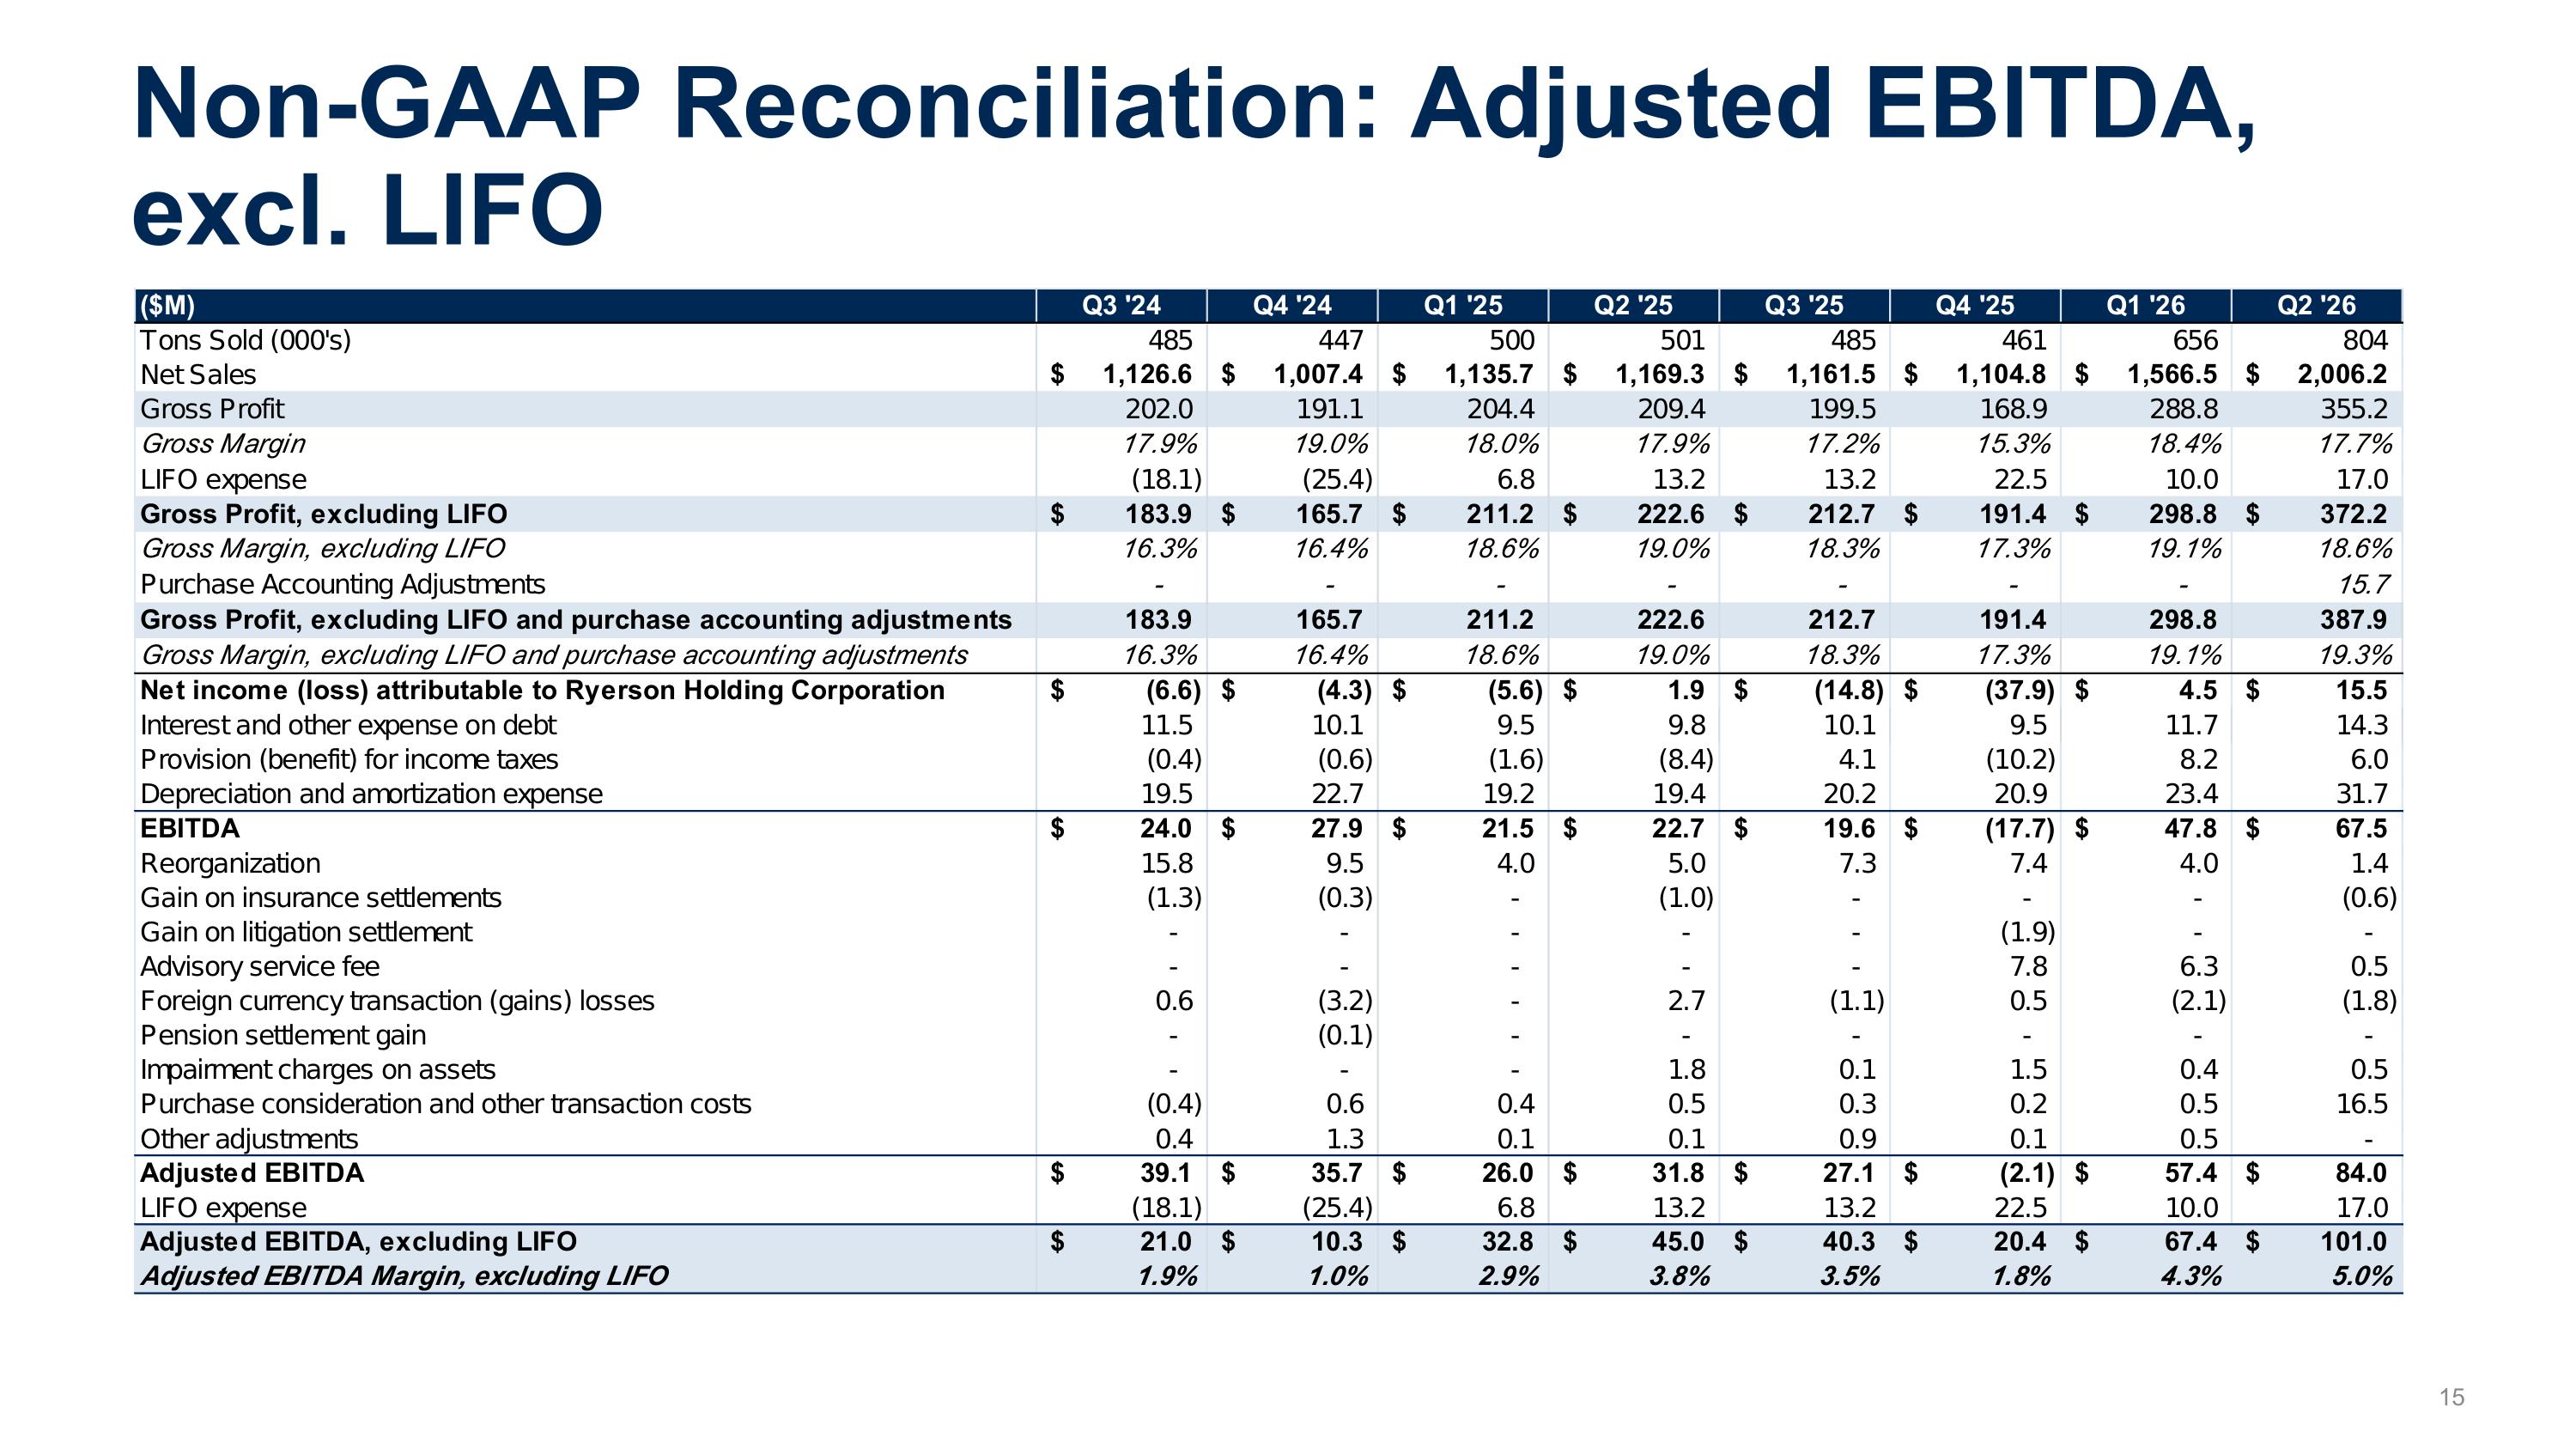
Non-GAAP Reconciliation: Adjusted EBITDA, excl. LIFO
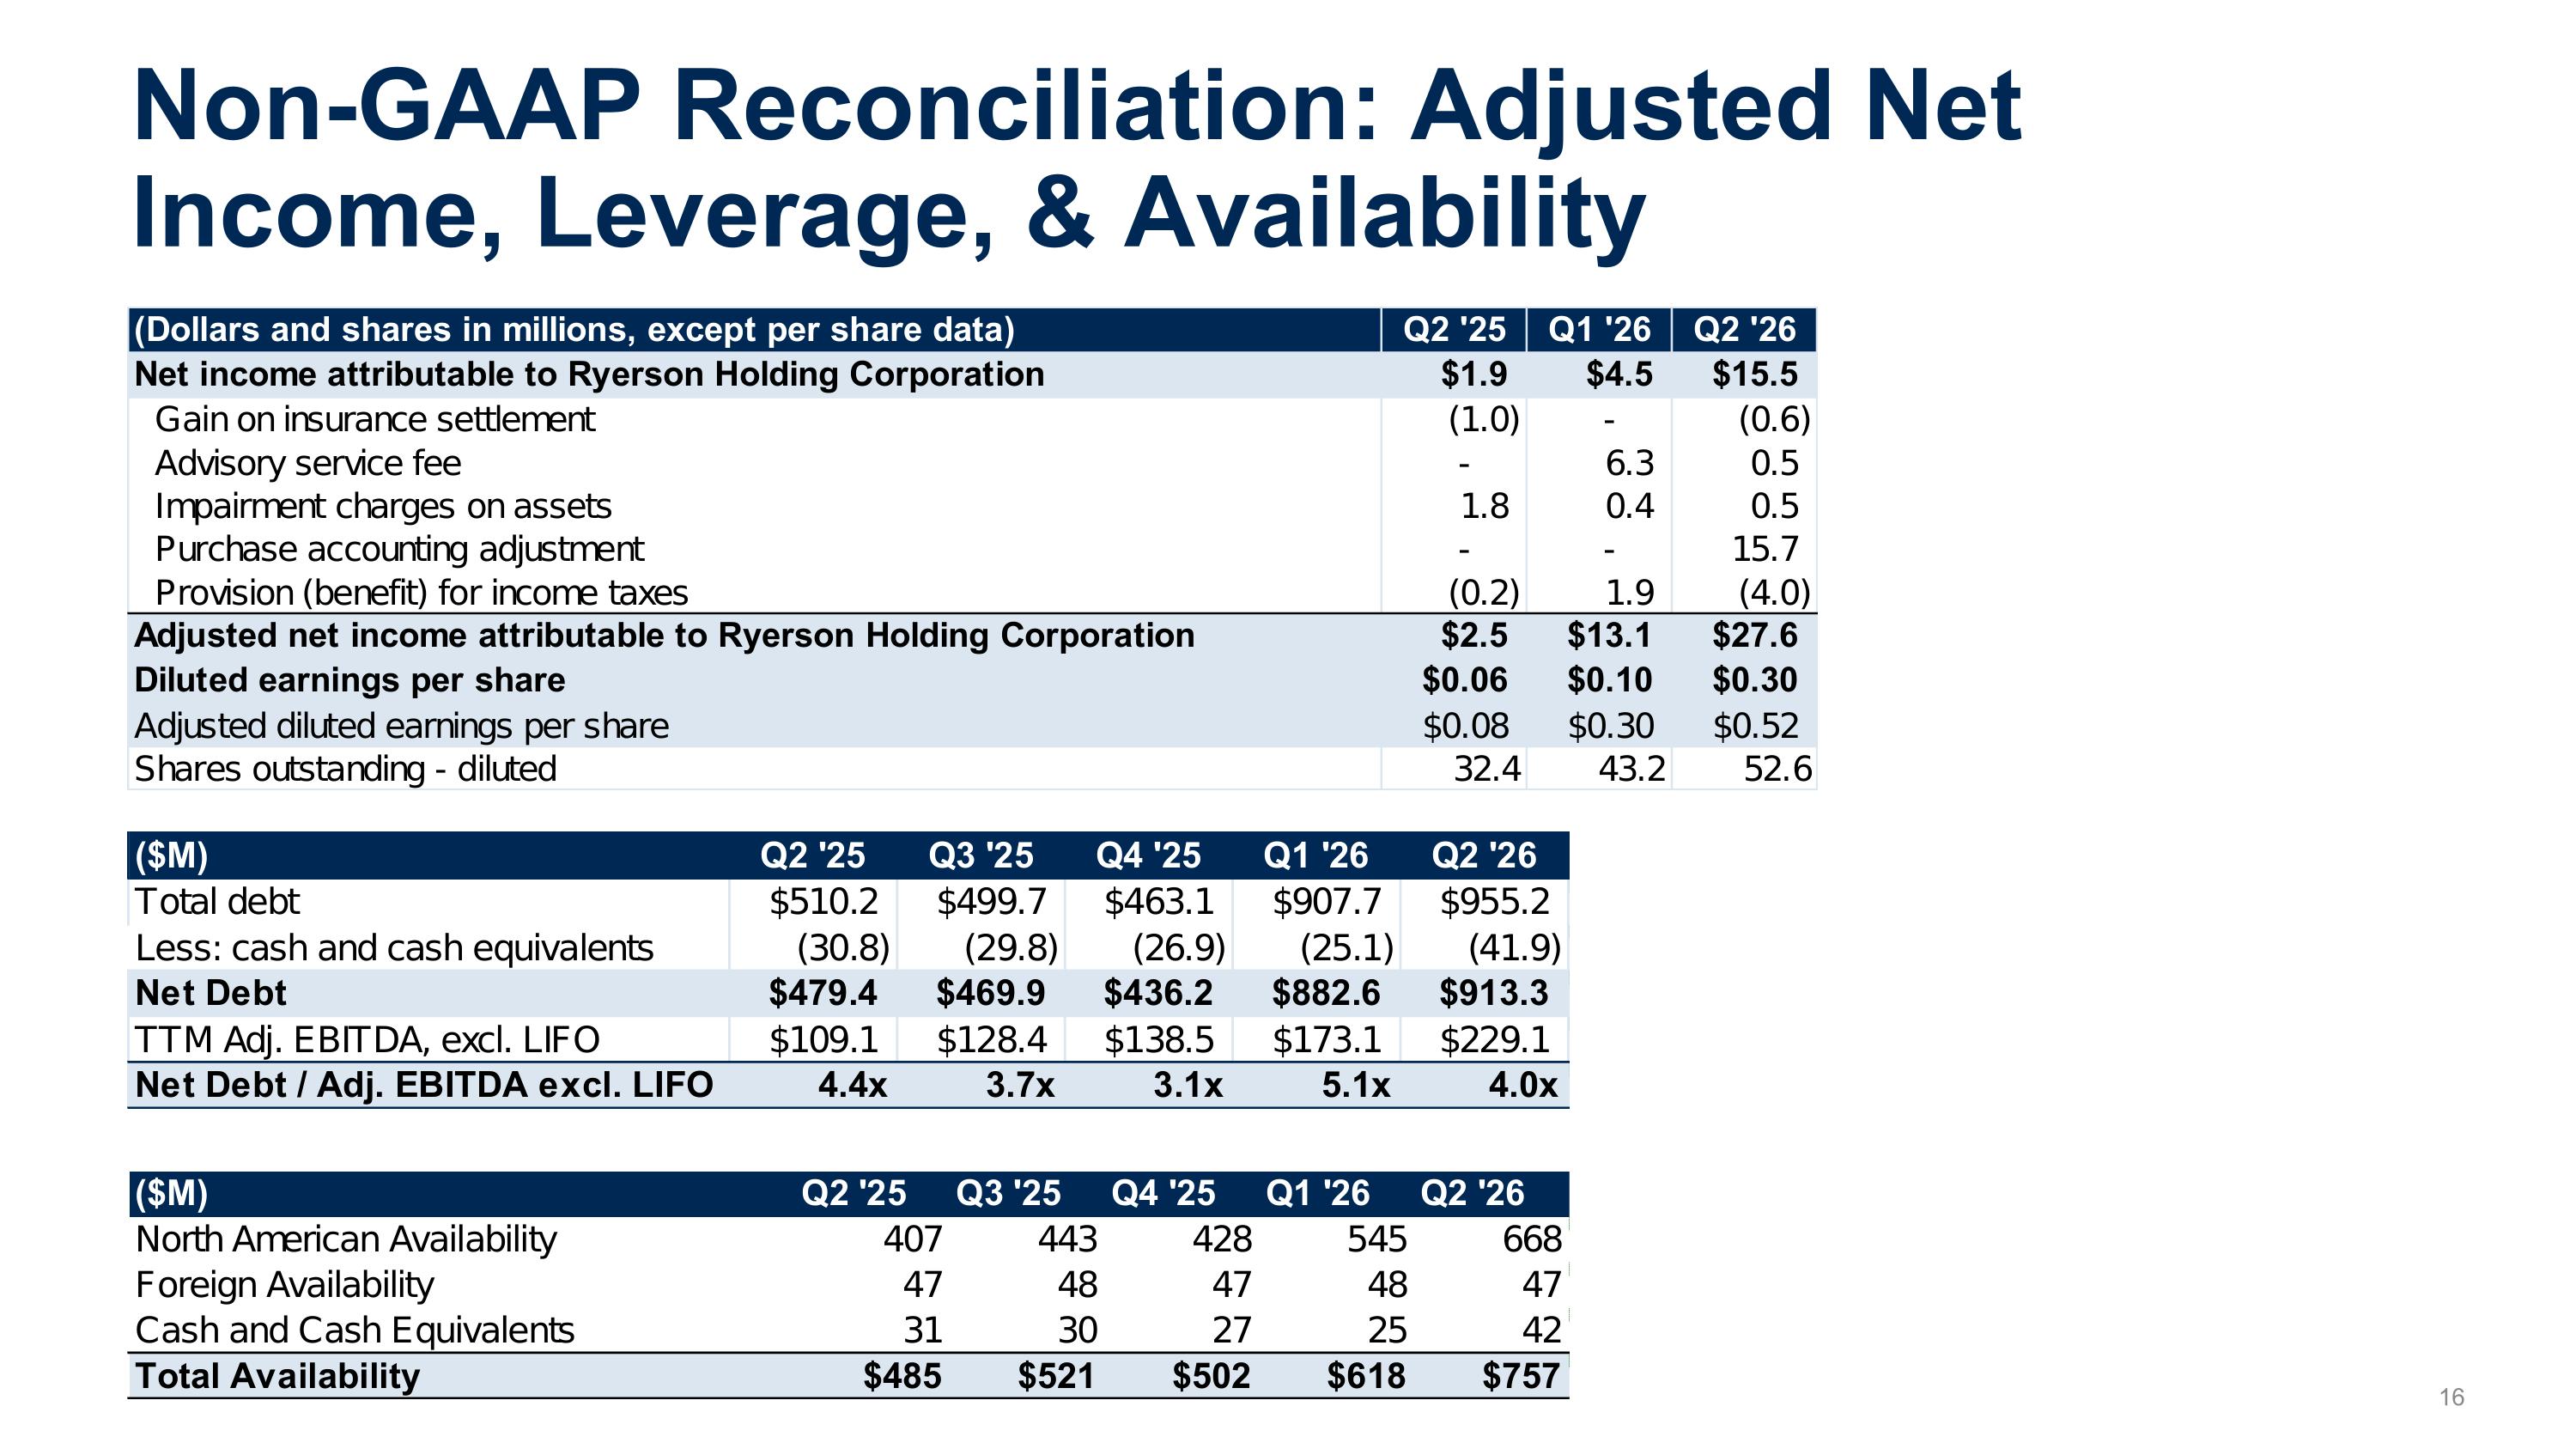
Non-GAAP Reconciliation: Adjusted Net Income, Leverage, & Availability