Exhibit (c)(2)
CONFIDENTIAL DRAFT INVESTMENT BANKING DIVISION Project Cake Financial Analysis Overview Goldman Sachs & Co. LLC June 18, 2018 Goldman Sachs does not provide accounting, tax, or legal advice. Notwithstanding anything in this document to the contrary, and except as required to enable compliance with applicable securities law, you (and each of your employees, representatives, and other agents) may disclose to any and all persons the US federal income and state tax treatment and tax structure of the transaction and all materials of any kind (including tax opinions and other tax analyses) that are provided to you relating to such tax treatment and tax structure, without Goldman Sachs imposing any limitation of any kind.
Disclaimer CONFIDENTIAL DRAFT INVESTMENT BANKING DIVISION These materials have been prepared and are provided by Goldman Sachs on a confidential basis solely for the information and assistance of the Special Committee of the Board of Directors (the “Special Committee”) and senior management of Freeway (the “Company”) in connection with their consideration of the matters referred to herein. These materials and Goldman Sachs’ presentation relating to these materials (the “Confidential Information”) may not be disclosed to any third party or circulated or referred to publicly or used for or relied upon for any other purpose without the prior written consent of Goldman Sachs. The Confidential Information was not prepared with a view to public disclosure or to conform to any disclosure standards under any state, federal or international securities laws or other laws, rules or regulations, and Goldman Sachs does not take any responsibility for the use of the Confidential Information by persons other than those set forth above. Notwithstanding anything in this Confidential Information to the contrary, the Company may disclose to any person the US federal income and state income tax treatment and tax structure of any transaction described herein and all materials of any kind (including tax opinions and other tax analyses) that are provided to the Company relating to such tax treatment and tax structure, without Goldman Sachs imposing any limitation of any kind. The Confidential Information has been prepared by the Investment Banking Division of Goldman Sachs and is not a product of its research department. Goldman Sachs and its affiliates are engaged in advisory, underwriting and financing, principal investing, sales and trading, research, investment management and other financial and non-financial activities and services for various persons and entities. Goldman Sachs and its affiliates and employees, and funds or other entities they manage or in which they invest or have other economic interests or with which they co-invest, may at any time purchase, sell, hold or vote long or short positions and investments in securities, derivatives, loans, commodities, currencies, credit default swaps and other financial instruments of the Company, any other party to any transaction and any of their respective affiliates or any currency or commodity that may be involved in any transaction. Goldman Sachs’ investment banking division maintains regular, ordinary course client service dialogues with clients and potential clients to review events, opportunities, and conditions in particular sectors and industries and, in that connection, Goldman Sachs may make reference to the Company, but Goldman Sachs will not disclose any confidential information received from the Company. The Confidential Information has been prepared based on historical financial information, forecasts and other information obtained by Goldman Sachs from publicly available sources, the management of the Company or other sources (approved for our use by the Company in the case of information from management and non-public information). In preparing the Confidential Information, Goldman Sachs has relied upon and assumed, without assuming any responsibility for independent verification, the accuracy and completeness of all of the financial, legal, regulatory, tax, accounting and other information provided to, discussed with or reviewed by us, and Goldman Sachs does not assume any liability for any such information. Goldman Sachs does not provide accounting, tax, legal or regulatory advice. Goldman Sachs has not made an independent evaluation or appraisal of the assets and liabilities (including any contingent, derivative or other off-balance sheet assets and liabilities) of the Company or any other party to any transaction or any of their respective affiliates and has no obligation to evaluate the solvency of the Company or any other party to any transaction under any state or federal laws relating to bankruptcy, insolvency or similar matters. The analyses contained in the Confidential Information do not purport to be appraisals nor do they necessarily reflect the prices at which businesses or securities actually may be sold or purchased. Goldman Sachs’ role in any due diligence review is limited solely to performing such a review as it shall deem necessary to support its own advice and analysis and shall not be on behalf of the Company. Analyses based upon forecasts of future results are not necessarily indicative of actual future results, which may be significantly more or less favorable than suggested by these analyses, and Goldman Sachs does not assume responsibility if future results are materially different from those forecast. The Confidential Information does not address the underlying business decision of the Company to engage in any transaction, or the relative merits of any transaction or strategic alternative referred to herein as compared to any other transaction or alternative that may be available to the Company. The Confidential Information is necessarily based on economic, monetary, market and other conditions as in effect on, and the information made available to Goldman Sachs as of, the date of such Confidential Information and Goldman Sachs assumes no responsibility for updating or revising the Confidential Information based on circumstances, developments or events occurring after such date. The Confidential Information does not constitute any opinion, nor does the Confidential Information constitute a recommendation to the Special Committee, any security holder of the Company or any other person as to how to vote or act with respect to any transaction or any other matter. The Confidential Information, including this disclaimer, is subject to, and governed by, any written agreement between the Company, the Board and/or any committee thereof, on the one hand, and Goldman Sachs, on the other hand. 2
Table of Contents CONFIDENTIAL DRAFT INVESTMENT BANKING DIVISION I. Transaction Overview II. Market Perspective III. Financial Plan IV. Financial Analysis Appendix A: Additional Materials

CONFIDENTIAL DRAFT INVESTMENT BANKING DIVISION I. Transaction Overview
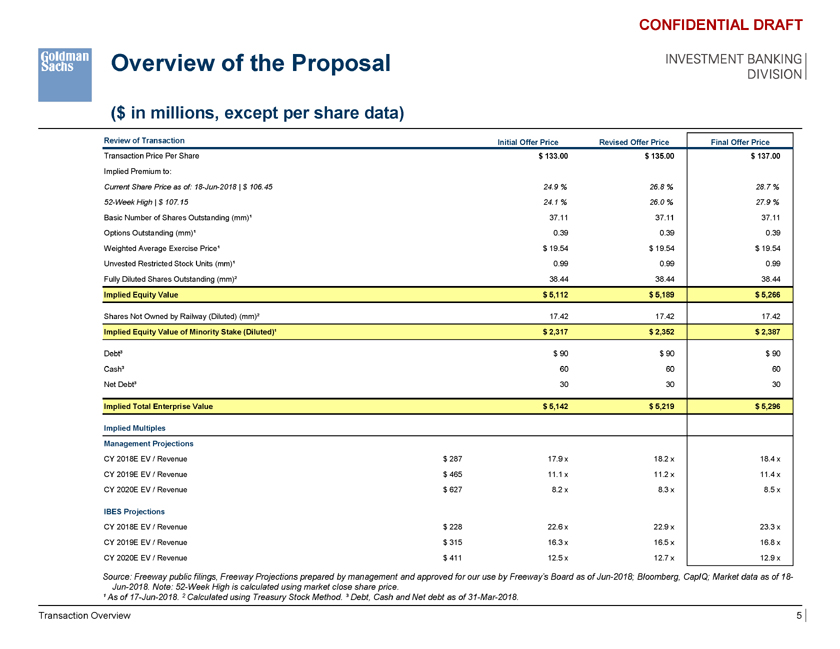
Overview of the Proposal INVESTMENT BANKING DIVISION ($ in millions, except per share data) CONFIDENTIAL DRAFT Review of Transaction Initial Offer Price Revised Offer Price Final Offer Price Transaction Price Per Share $ 133.00 $ 135.00 $ 137.00 Implied Premium to: Current Share Price as of: 18-Jun-2018 | $ 106.45 24.9 % 26.8 % 28.7 % 52-Week High | $ 107.15 24.1 % 26.0 % 27.9 % Basic Number of Shares Outstanding (mm)¹ 37.11 37.11 37.11 Options Outstanding (mm)¹ 0.39 0.39 0.39 Weighted Average Exercise Price¹ $ 19.54 $ 19.54 $ 19.54 Unvested Restricted Stock Units (mm)¹ 0.99 0.99 0.99 Fully Diluted Shares Outstanding (mm)² 38.44 38.44 38.44 Implied Equity Value $ 5,112 $ 5,189 $ 5,266 Shares Not Owned by Railway (Diluted) (mm)² 17.42 17.42 17.42 Implied Equity Value of Minority Stake (Diluted)¹ $ 2,317 $ 2,352 $ 2,387 Debt³ $ 90 $ 90 $ 90 Cash³ 60 60 60 Net Debt³ 30 30 30 Implied Total Enterprise Value $ 5,142 $ 5,219 $ 5,296 Implied Multiples Management Projections CY 2018E EV / Revenue $ 287 17.9 x 18.2 x 18.4 x CY 2019E EV / Revenue $ 465 11.1 x 11.2 x 11.4 x CY 2020E EV / Revenue $ 627 8.2 x 8.3 x 8.5 x IBES Projections CY 2018E EV / Revenue $ 228 22.6 x 22.9 x 23.3 x CY 2019E EV / Revenue $ 315 16.3 x 16.5 x 16.8 x CY 2020E EV / Revenue $ 411 12.5 x 12.7 x 12.9 x Source: Freeway public filings, Freeway Projections prepared by management and approved for our use by Freeway’s Board as of Jun-2018; Bloomberg, CapIQ; Market data as of 18-Jun-2018. Note: 52-Week High is calculated using market close share price. ¹ As of 17-Jun-2018. 2 Calculated using Treasury Stock Method. ³ Debt, Cash and Net debt as of 31-Mar-2018. Transaction Overview 5
CONFIDENTIAL DRAFT INVESTMENT BANKING DIVISION II. Market Perspective
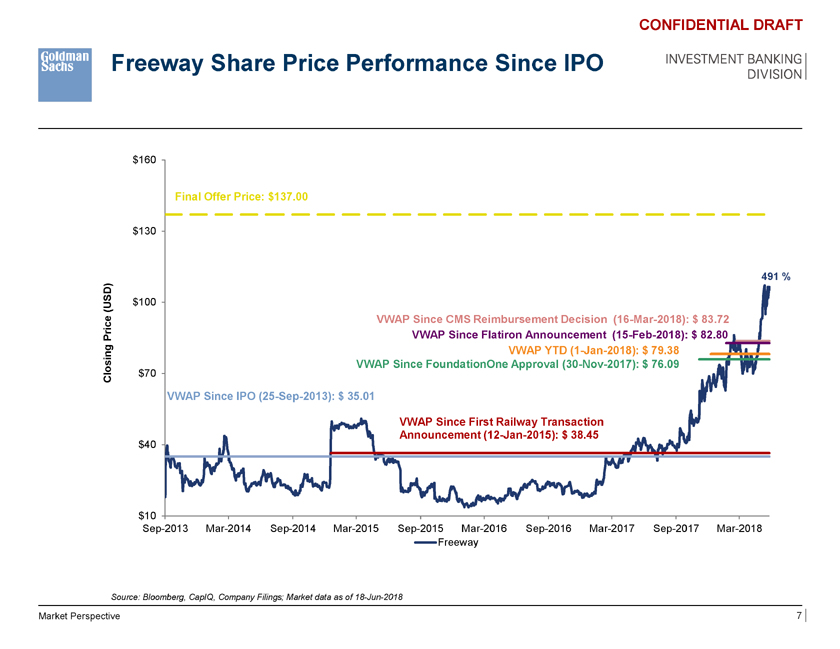
Freeway Share Price Performance Since IPO CONFIDENTIAL DRAFT INVESTMENT BANKING DIVISION $160 Final Offer Price: $137.00 $130 491 % D) (US $100 e VWAP Since CMS Reimbursement Decision (16-Mar-2018): $ 83.72 r ic P VWAP Since Flatiron Announcement (15-Feb-2018): $ 82.80 VWAP YTD (1-Jan-2018): $ 79.38 Closing $70 VWAP Since FoundationOne Approval (30-Nov-2017): $ 76.09 VWAP Since IPO (25-Sep-2013): $ 35.01 VWAP Since First Railway Transaction $40 Announcement (12-Jan-2015): $ 38.45 $10 Sep-2013 Mar-2014 Sep-2014 Mar-2015 Sep-2015 Mar-2016 Sep-2016 Mar-2017 Sep-2017 Mar-2018 Freeway Source: Bloomberg, CapIQ, Company Filings; Market data as of 18-Jun-2018 Market Perspective 7
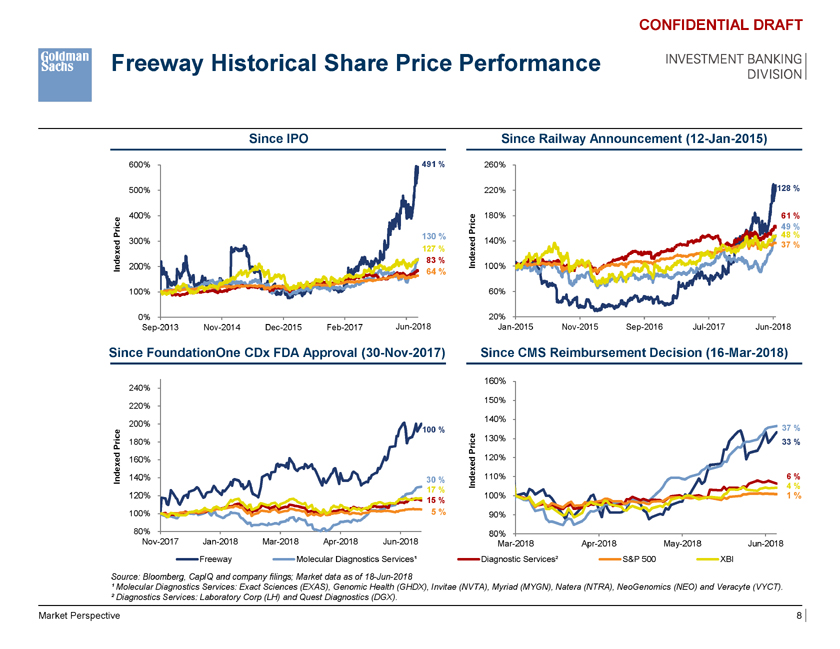
Freeway Historical Share Price Performance INVESTMENT BANKING DIVISION CONFIDENTIAL DRAFT Since IPO Since Railway Announcement (12-Jan-2015) 600% 491 % 260% 500% 220% 128 % 400% e 180% 61 % Pric 49 % Price 130 % 48 % ed 300% 140% 37 % 127 % 83 % Indexed ndex 200% 100% I 64 % 100% 60% 0% 20% Sep-2013 Nov-2014 Dec-2015 Feb-2017 Mar-20 Jun-2018 Jan-2015 Nov-2015 Sep-2016 Jul-2017 Jun-2018 Since FoundationOne CDx FDA Approval (30-Nov-2017) Since CMS Reimbursement Decision (16-Mar-2018) 160% 240% 150% 220% 140% 200% 100 % 37 % rice 180% 130% 33 % P Price d 120% 160% Indexe 140% 30 % Indexed 110% 6 % 4 % 17 % 120% 100% 1 % 15 % 100% 5 % 90% 80% 80% Nov-2017 Jan-2018 Mar-2018 Apr-2018 Jun-2018 Mar-2018 Apr-2018 May-2018 Jun-2018 Freeway Molecular Diagnostics Services¹ Diagnostic Services² S&P 500 XBI Source: Bloomberg, CapIQ and company filings; Market data as of 18-Jun-2018 ¹ Molecular Diagnostics Services: Exact Sciences (EXAS), Genomic Health (GHDX), Invitae (NVTA), Myriad (MYGN), Natera (NTRA), NeoGenomics (NEO) and Veracyte (VYCT). ² Diagnostics Services: Laboratory Corp (LH) and Quest Diagnostics (DGX). Market Perspective 8
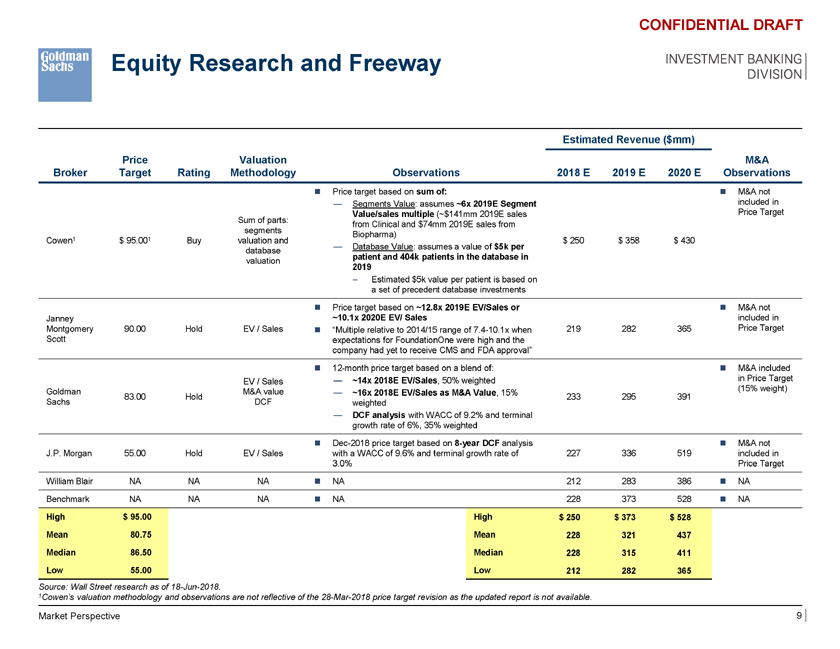
Equity Research and Freeway CONFIDENTIAL DRAFT INVESTMENT BANKING DIVISION Estimated Revenue ($mm) Price Valuation M&A Broker Target Rating Methodology Observations 2018 E 2019 E 2020 E Observations ï® Price target based on sum of: ï® M&A not — Segments Value: assumes ~6x 2019E Segment included in Value/sales multiple (~$141mm 2019E sales Price Target Sum of parts: from Clinical and $74mm 2019E sales from segments Biopharma) Cowen1 $ 95.001 Buy valuation and $ 250 $ 358 $ 430 — Database Value: assumes a value of $5k per database patient and 404k patients in the database in valuation 2019 – Estimated $5k value per patient is based on a set of precedent database investments ï® Price target based on ~12.8x 2019E EV/Sales or ï® M&A not Janney ~10.1x 2020E EV/ Sales included in Montgomery 90.00 Hold EV / Sales ï® “Multiple relative to 2014/15 range of 7.4-10.1x when 219 282 365 Price Target Scott expectations for FoundationOne were high and the company had yet to receive CMS and FDA approval” ï® 12-month price target based on a blend of: ï® M&A included EV / Sales — ~14x 2018E EV/Sales, 50% weighted in Price Target Goldman M&A value (15% weight) — ~16x 2018E EV/Sales as M&A Value, 15% 83.00 Hold 233 295 391 Sachs DCF weighted — DCF analysis with WACC of 9.2% and terminal growth rate of 6%, 35% weighted ï® Dec-2018 price target based on 8-year DCF analysis ï® M&A not J.P. Morgan 55.00 Hold EV / Sales with a WACC of 9.6% and terminal growth rate of 227 336 519 included in 3.0% Price Target William Blair NA NA NA ï® NA 212 283 386 ï® NA Benchmark NA NA NA ï® NA 228 373 528 ï® NA High $ 95.00 High $ 250 $ 373 $ 528 Mean 80.75 Mean 228 321 437 Median 86.50 Median 228 315 411 Low 55.00 Low 212 282 365 Source: Wall Street research as of 18-Jun-2018. 1Cowen’s valuation methodology and observations are not reflective of the 28-Mar-2018 price target revision as the updated report is not available. Market Perspective 9
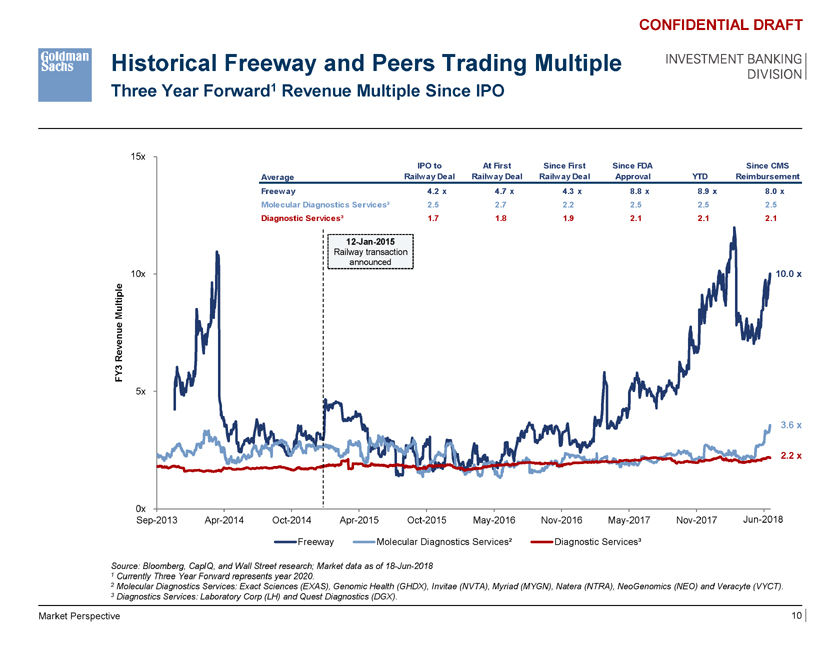
Historical Freeway and Peers Trading Multiple Three Year Forward1 Revenue Multiple Since IPO CONFIDENTIAL DRAFT INVESTMENT BANKING DIVISION 15x IPO to At First Since First Since FDA Since CMS Average Railway Deal Railway Deal Railway Deal Approval YTD Reimbursement Freeway 4.2 x 4.7 x 4.3 x 8.8 x 8.9 x 8.0 x Molecular Diagnostics Services² 2.5 2.7 2.2 2.5 2.5 2.5 Diagnostic Services³ 1.7 1.8 1.9 2.1 2.1 2.1 12-Jan-2015 Railway transaction announced 10x 10.0 x p le M ulti e en u Re v Y3 F 5x 3.6 x 2.2 x 0x Sep-2013 Apr-2014 Oct-2014 Apr-2015 Oct-2015 May-2016 Nov-2016 May-2017 Nov-2017 Jun-2018 - Freeway Molecular Diagnostics Services² Diagnostic Services³ Source: Bloomberg, CapIQ, and Wall Street research; Market data as of 18-Jun-2018 1 Currently Three Year Forward represents year 2020. 2 Molecular Diagnostics Services: Exact Sciences (EXAS), Genomic Health (GHDX), Invitae (NVTA), Myriad (MYGN), Natera (NTRA), NeoGenomics (NEO) and Veracyte (VYCT). 3 Diagnostics Services: Laboratory Corp (LH) and Quest Diagnostics (DGX). Market Perspective 10
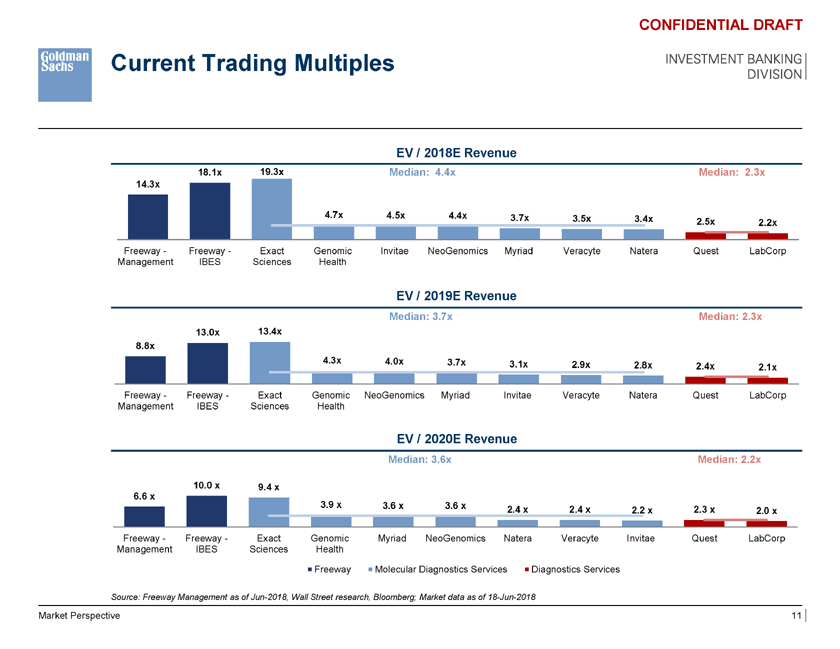
Current Trading Multiples CONFIDENTIAL DRAFT INVESTMENT BANKING DIVISION EV / 2018E Revenue 18.1x 19.3x Median: 4.4x Median: 2.3x 14.3x 4.7x 4.5x 4.4x 3.7x 3.5x 3.4x 2.5x 2.2x Freeway—Freeway—Exact Genomic Invitae NeoGenomics Myriad Veracyte Natera Quest LabCorp Management IBES Sciences Health EV / 2019E Revenue Median: 3.7x Median: 2.3x 13.0x 13.4x 8.8x 4.3x 4.0x 3.7x 3.1x 2.9x 2.8x 2.4x 2.1x Freeway—Freeway—Exact Genomic NeoGenomics Myriad Invitae Veracyte Natera Quest LabCorp Management IBES Sciences Health EV / 2020E Revenue Median: 3.6x Median: 2.2x 10.0 x 9.4 x 6.6 x 3.9 x 3.6 x 3.6 x 2.4 x 2.4 x 2.3 x 2.2 x 2.0 x Freeway—Freeway—Exact Genomic Myriad NeoGenomics Natera Veracyte Invitae Quest LabCorp Management IBES Sciences Health Median: 54.3x Median: 12.2x 148.0x Freeway Molecular Diagnostics Services Diagnostics Services Source: Freeway Management as of Jun-2018, 54.3x Wall Street research, Bloomberg; Market data as of 18-Jun-2018 41.8x NM NM NM NM NM 12.3x 12.1x Market Perspective 11
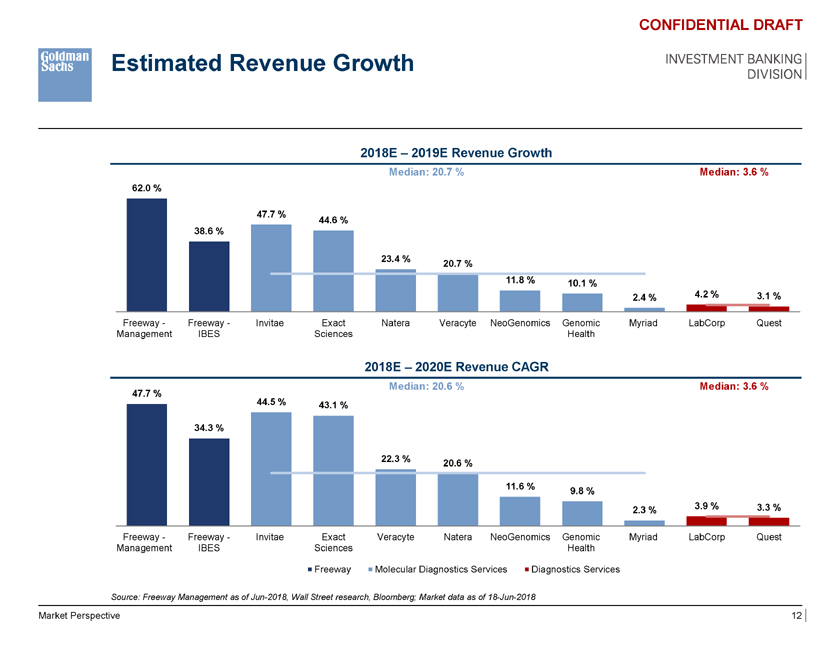
Estimated Revenue Growth CONFIDENTIAL DRAFT INVESTMENT BANKING DIVISION 2018E – 2019E Revenue Growth Median: 20.7 % Median: 3.6 % 62.0 % 47.7 % 44.6 % 38.6 % 23.4 % 20.7 % 11.8 % 10.1 % 2.4 % 4.2 % 3.1 % Freeway—Freeway—Invitae Exact Natera Veracyte NeoGenomics Genomic Myriad LabCorp Quest Management IBES Sciences Health 2018E – 2020E Revenue CAGR Median: 20.6 % Median: 3.6 % 47.7 % 44.5 % 43.1 % 34.3 % 22.3 % 20.6 % 11.6 % 9.8 % 3.9 % 3.3 % 2.3 % Freeway—Freeway—Invitae Exact Median:Veracyte 54.3x Natera NeoGenomics Genomic Myriad Median: LabCorp 12.2x Quest Management IBES Sciences Health 148.0x Freeway Molecular Diagnostics Services Diagnostics Services Source: Freeway Management as of Jun-2018, 54.3x Wall Street research, Bloomberg; Market data as of 18-Jun-2018 41.8x NM NM NM NM NM 12.3x 12.1x Market Perspective 12
CONFIDENTIAL DRAFT INVESTMENT BANKING DIVISION III. Financial Plan
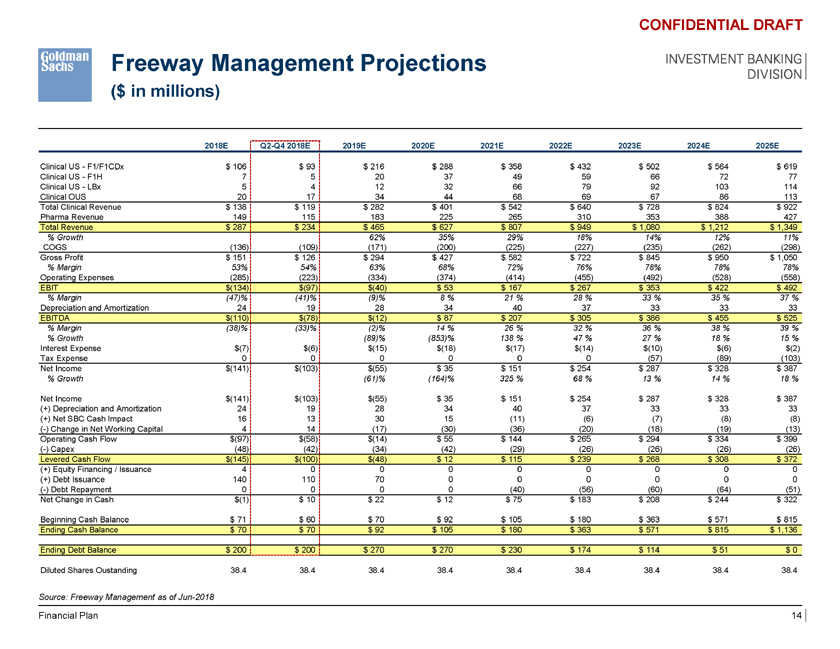
Freeway Management Projections ($ in millions) CONFIDENTIAL DRAFT INVESTMENT BANKING DIVISION 2018E Q2-Q4 2018E 2019E 2020E 2021E 2022E 2023E 2024E 2025E Clinical US—F1/F1CDx $ 106 $ 93 $ 216 $ 288 $ 358 $ 432 $ 502 $ 564 $ 619 Clinical US—F1H 7 5 20 37 49 59 66 72 77 Clinical US—LBx 5 4 12 32 66 79 92 103 114 Clinical OUS 20 17 34 44 68 69 67 86 113 Total Clinical Revenue $ 138 $ 119 $ 282 $ 401 $ 542 $ 640 $ 728 $ 824 $ 922 Pharma Revenue 149 115 183 225 265 310 353 388 427 Total Revenue $ 287 $ 234 $ 465 $ 627 $ 807 $ 949 $ 1,080 $ 1,212 $ 1,349 % Growth 62% 35% 29% 18% 14% 12% 11% COGS (136) (109) (171) (200) (225) (227) (235) (262) (298) Gross Profit $ 151 $ 126 $ 294 $ 427 $ 582 $ 722 $ 845 $ 950 $ 1,050 % Margin 53% 54% 63% 68% 72% 76% 78% 78% 78% Operating Expenses (285) (223) (334) (374) (414) (455) (492) (528) (558) EBIT $(134) $(97) $(40) $ 53 $ 167 $ 267 $ 353 $ 422 $ 492 % Margin (47)% (41)% (9)% 8 % 21 % 28 % 33 % 35 % 37 % Depreciation and Amortization 24 19 28 34 40 37 33 33 33 EBITDA $(110) $(78) $(12) $ 87 $ 207 $ 305 $ 386 $ 455 $ 525 % Margin (38)% (33)% (2)% 14 % 26 % 32 % 36 % 38 % 39 % % Growth (89)% (853)% 138 % 47 % 27 % 18 % 15 % Interest Expense $(7) $(6) $(15) $(18) $(17) $(14) $(10) $(6) $(2) Tax Expense 0 0 0 0 0 0 (57) (89) (103) Net Income $(141) $(103) $(55) $ 35 $ 151 $ 254 $ 287 $ 328 $ 387 % Growth (61)% (164)% 325 % 68 % 13 % 14 % 18 % Net Income $(141) $(103) $(55) $ 35 $ 151 $ 254 $ 287 $ 328 $ 387 (+) Depreciation and Amortization 24 19 28 34 40 37 33 33 33 (+) Net SBC Cash Impact 16 13 30 15 (11) (6) (7) (8) (8) (-) Change in Net Working Capital 4 14 (17) (30) (36) (20) (18) (19) (13) Operating Cash Flow $(97) $(58) $(14) $ 55 $ 144 $ 265 $ 294 $ 334 $ 399 (-) Capex (48) (42) (34) (42) (29) (26) (26) (26) (26) Levered Cash Flow $(145) $(100) $(48) $ 12 $ 115 $ 239 $ 268 $ 308 $ 372 (+) Equity Financing / Issuance 4 0 0 0 0 0 0 0 0 (+) Debt Issuance 140 110 70 0 0 0 0 0 0 (-) Debt Repayment 0 0 0 0 (40) (56) (60) (64) (51) Net Change in Cash $(1) $ 10 $ 22 $ 12 $ 75 $ 183 $ 208 $ 244 $ 322 Beginning Cash Balance $ 71 $ 60 $ 70 $ 92 $ 105 $ 180 $ 363 $ 571 $ 815 Ending Cash Balance $ 70 $ 70 $ 92 $ 105 $ 180 $ 363 $ 571 $ 815 $ 1,136 Ending Debt Balance $ 200 $ 200 $ 270 $ 270 $ 230 $ 174 $ 114 $ 51 $ 0 Diluted Shares Oustanding 38.4 38.4 38.4 38.4 38.4 38.4 38.4 38.4 38.4 Source: Freeway Management as of Jun-2018 Financial Plan 14
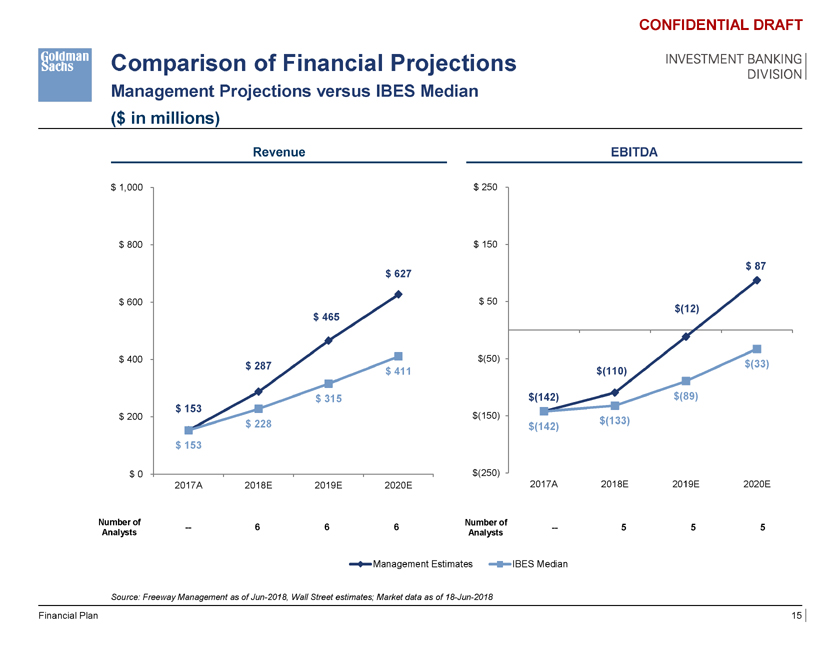
Comparison of Financial Projections Management Projections versus IBES Median ($ in millions) CONFIDENTIAL DRAFT INVESTMENT BANKING DIVISION Revenue EBITDA $ 1,000 $ 250 $ 800 $ 1,000 $ 150 $ 87 $ 627 $ 807 $ 600 $ 800 $ 50 $(12) $ 465 $ 627 $ 400 $ 600 $(50) $(33) $ 287 $ 631 $ 411 $ 465 $(110) $ 315 $(142) $(89) $ 153 $ 400 $ 200 $(150) $ 228 $ 4 $(133) $(142) $ 287 $ 153 $ 315 $ 200 $ 153 $(250) $ 0 $ 228 2017A 2018E 2019E 2020E 2017A 2018E 2019E 2020E $ 153 Number of Number of — 6 $ 0 6 6 — 5 5 5 Analysts Analysts 2017A 2018E 2019E 2020E 2021E Management Estimates IBES Median Source: Freeway Management as of Jun-2018, Wall Street estimates; Market data as of 18-Jun-2018 Financial Plan 15

CONFIDENTIAL DRAFT INVESTMENT BANKING DIVISION IV. Financial Analysis
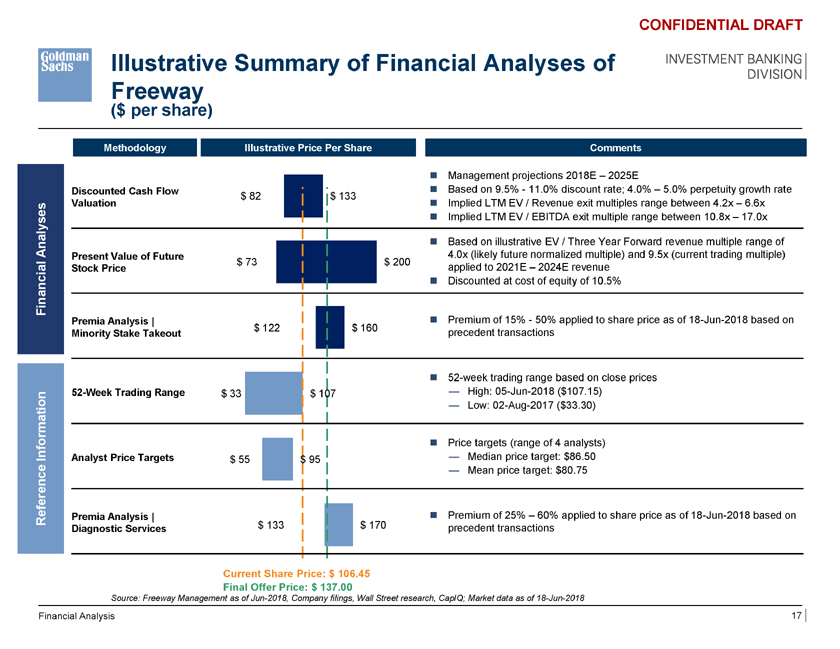
Illustrative Summary of Financial Analyses of Freeway ($ per share) CONFIDENTIAL DRAFT INVESTMENT BANKING DIVISION Methodology Illustrative Price Per Share Comments ï® Management projections 2018E – 2025E Discounted Cash Flow ï® Based on 9.5%—11.0% discount rate; 4.0% – 5.0% perpetuity growth rate $ 82 $ 133 Valuation ï® Implied LTM EV / Revenue exit multiples range between 4.2x – 6.6x ï® Implied LTM EV / EBITDA exit multiple range between 10.8x – 17.0x Analysesï® Based on illustrative EV / Three Year Forward revenue multiple range of Present Value of Future 4.0x (likely future normalized multiple) and 9.5x (current trading multiple) $ 73 $ 200 Stock Price applied to 2021E – 2024E revenue Financialï® Discounted at cost of equity of 10.5% Premia Analysis | ï® Premium of 15%—50% applied to share price as of 18-Jun-2018 based on $ 122 $ 160 Minority Stake Takeout precedent transactions ï® 52-week trading range based on close prices 52-Week Trading Range $ 33 $ 107 — High: 05-Jun-2018 ($107.15) — Low: 02-Aug-2017 ($33.30) ï® Price targets (range of 4 analysts) Information Analyst Price Targets $ 55 $ 95 — Median price target: $86.50 — Mean price target: $80.75 Reference Premia Analysis | ï® Premium of 25% – 60% applied to share price as of 18-Jun-2018 based on Diagnostic Services $ 133 $ 170 precedent transactions Current Share Price: $ 106.45 Final Offer Price: $ 137.00 Source: Freeway Management as of Jun-2018, Company filings, Wall Street research, CapIQ; Market data as of 18-Jun-2018 Financial Analysis 17
INVESTMENT BANKING DIVISION A. Supporting Information and Analysis
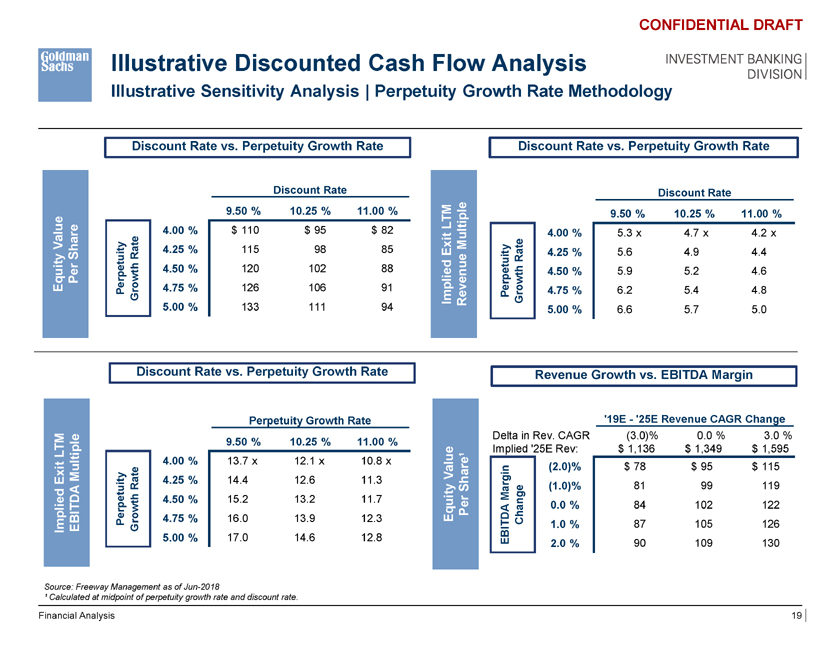
Illustrative Discounted Cash Flow Analysis Illustrative Sensitivity Analysis | Perpetuity Growth Rate Methodology CONFIDENTIAL DRAFT INVESTMENT BANKING DIVISION Discount Rate vs. Perpetuity Growth Rate Discount Rate vs. Perpetuity Growth Rate Discount Rate Discount Rate $ 102 9.50 % 10.25 % 11.00 % 5.2 x 9.50 % 10.25 % 11.00 % LTM 4.00 % $ 110 $ 95 $ 82 4.00 % 5.3 x 4.7 x 4.2 x Value y Multiple Rate 4.25 % 115 98 85 Exit it y 4.25 % 5.6 4.9 4.4 Share Rate etuit h 4.50 % 120 102 88 etu h 4.50 % 5.9 5.2 4.6 Per p wt wt Equity Per o 4.75 % 126 106 91 erp o 4.75 % 6.2 5.4 4.8 Gr Implied Revenue P G r 5.00 % 133 111 94 5.00 % 6.6 5.7 5.0 Discount Rate vs. Perpetuity Growth Rate Revenue Growth vs. EBITDA Margin Perpetuity Growth Rate ‘19E—‘25E Revenue CAGR Change Delta in Rev. CAGR (3.0)% 0.0 % 3.0 % 13.2 x 9.50 % 10.25 % 11.00 % LTM Implied ‘25E Rev: $ 1,136 $ 1,349 $ 1,595 4.00 % 13.7 x 12.1 x 10.8 x (2.0)% $ 78 $ 95 $ 115 Multiple Value Exit 4.25 % 14.4 12.6 11.3 Rate Share¹ (1.0)% 81 99 119 4.50 % 15.2 13.2 11.7 Margin owth Equity Per DA 0.0 % 84 102 122 Perpetuity r 4.75 % 16.0 13.9 12.3 Change Implied EBITDA G BIT 1.0 % 87 105 126 5.00 % 17.0 14.6 12.8 E 2.0 % 90 109 130 Source: Freeway Management as of Jun-2018 ¹ Calculated at midpoint of perpetuity growth rate and discount rate. Financial Analysis 19
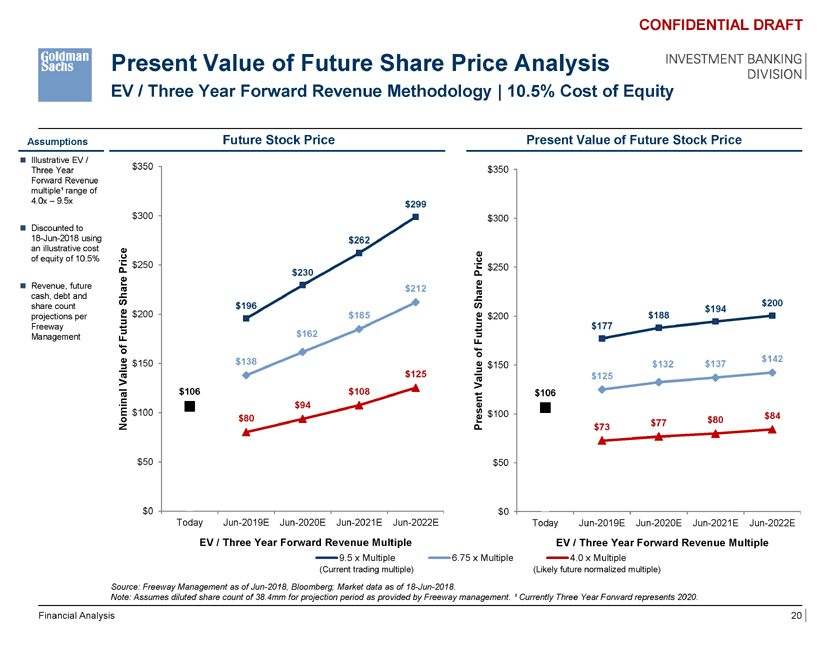
Present Value of Future Share Price Analysis EV / Three Year Forward Revenue Methodology | 10.5% Cost of Equity CONFIDENTIAL DRAFT INVESTMENT BANKING DIVISION Assumptions Future Stock Price Present Value of Future Stock Price ï® Illustrative EV / Three Year $350 $350 Forward Revenue multiple¹ range of 4.0x – 9.5x $299 $300 $300 ï® Discounted to 18-Jun-2018 using $262 an illustrative cost of equity of 10.5% rice $250 $250 P $230 Price e ï® Revenue, future ar $212 cash, debt and h S hare $200 share count e $200 $196 S $194 projections per tur $185 e $200 $188 Freeway $162 tur $177 Management Fu Fu of f o $142 $150 $138 $150 $132 $137 alue $125 alue $125 V V al $106 $108 $106 $94 $100 $100 $84 $80 $80 Nomin Present $73 $77 $50 $50 $0 $0 Today Jun-2019E Jun-2020E Jun-2021E Jun-2022E Today Jun-2019E Jun-2020E Jun-2021E Jun-2022E EV / Three Year Forward Revenue Multiple EV / Three Year Forward Revenue Multiple 9.5 x Multiple 6.75 x Multiple 4.0 x Multiple (Current trading multiple) (Likely future normalized multiple) Source: Freeway Management as of Jun-2018, Bloomberg; Market data as of 18-Jun-2018. Note: Assumes diluted share count of 38.4mm for projection period as provided by Freeway management. ¹ Currently Three Year Forward represents 2020. Financial Analysis 20
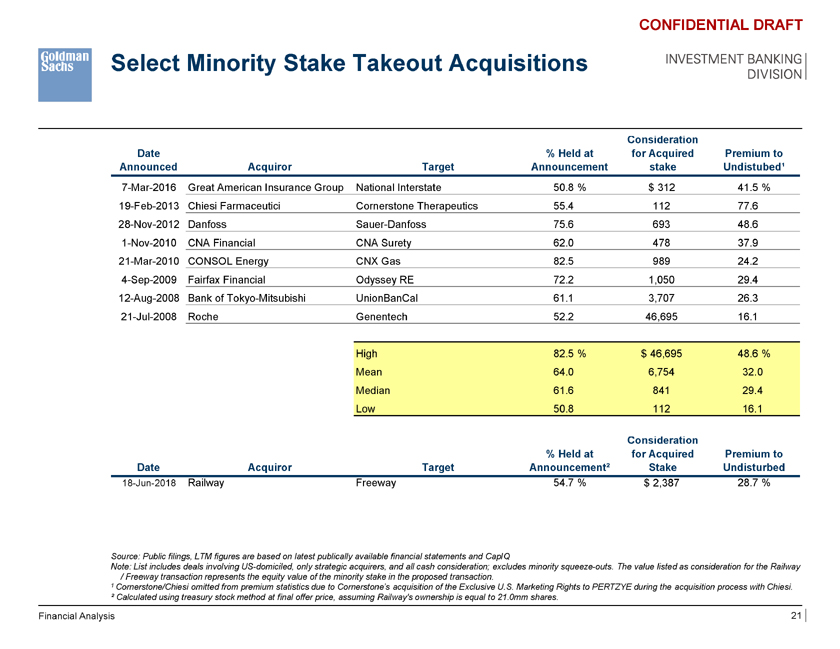
Select Minority Stake Takeout Acquisitions CONFIDENTIAL DRAFT INVESTMENT BANKING DIVISION sideration Date % Held at for Acquired Premium to Announced Acquiror Target Announcement stake Undistubed¹ 7-Mar-2016 Great American Insurance Group National Interstate 50.8 % $ 312 41.5 % 19-Feb-2013 Chiesi Farmaceutici Cornerstone Therapeutics 55.4 112 77.6 28-Nov-2012 Danfoss Sauer-Danfoss 75.6 693 48.6 1-Nov-2010 CNA Financial CNA Surety 62.0 478 37.9 21-Mar-2010 CONSOL Energy CNX Gas 82.5 989 24.2 4-Sep-2009 Fairfax Financial Odyssey RE 72.2 1,050 29.4 12-Aug-2008 Bank of Tokyo-Mitsubishi UnionBanCal 61.1 3,707 26.3 21-Jul-2008 Roche Genentech 52.2 46,695 16.1 High 82.5 % $ 46,695 48.6 % Mean 64.0 6,754 32.0 Median 61.6 841 29.4 Low 50.8 112 16.1 Consideration % Held at for Acquired Premium to Date Acquiror Target Announcement² Stake Undisturbed 18-Jun-2018 Railway Freeway 54.7 % $ 2,387 28.7 % Source: Public filings, LTM figures are based on latest publically available financial statements and CapIQ Note: List includes deals involving US-domiciled, only strategic acquirers, and all cash consideration; excludes minority squeeze-outs. The value listed as consideration for the Railway / Freeway transaction represents the equity value of the minority stake in the proposed transaction. 1 Cornerstone/Chiesi omitted from premium statistics due to Cornerstone’s acquisition of the Exclusive U.S. Marketing Rights to PERTZYE during the acquisition process with Chiesi. ² Calculated using treasury stock method at final offer price, assuming Railway’s ownership is equal to 21.0mm shares. Financial Analysis 21
CONFIDENTIAL DRAFT INVESTMENT BANKING DIVISION Appendix A: Additional Materials
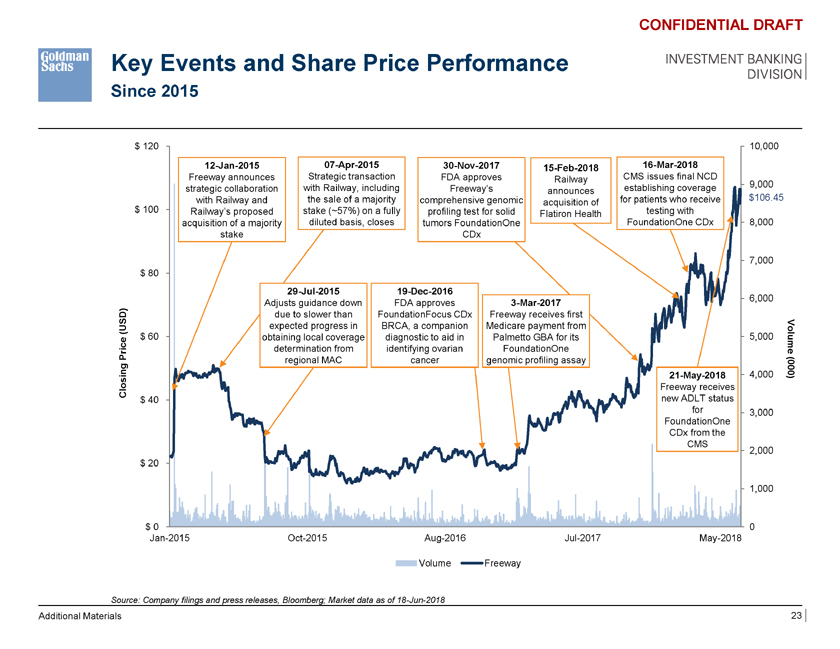
Key Events and Share Price Performance Since 2015 CONFIDENTIAL DRAFT INVESTMENT BANKING DIVISION $ 120 10,000 12-Jan-2015 07-Apr-2015 30-Nov-2017 15-Feb-2018 16-Mar-2018 Freeway announces Strategic transaction FDA approves Railway CMS issues final NCD 9,000 strategic collaboration with Railway, including Freeway’s announces establishing coverage with Railway and the sale of a majority comprehensive genomic for patients who receive $106.45 acquisition of $ 100 Railway’s proposed stake (~57%) on a fully profiling test for solid testing with diluted basis, closes Flatiron Health FoundationOne CDx 8,000 acquisition of a majority tumors FoundationOne stake CDx 7,000 $ 80 29-Jul-2015 19-Dec-2016 6,000 Adjusts guidance down FDA approves 3-Mar-2017 due to slower than FoundationFocus CDx Freeway receives first (USD) expected progress in BRCA, a companion Medicare payment from $ 60 obtaining local coverage diagnostic to aid in Palmetto GBA for its 5,000 Volum determination from identifying ovarian FoundationOne e Price regional MAC cancer genomic profiling assay ing 21-May-2018 4,000 0(00 ) Clos Freeway receives $ 40 new ADLT status for 3,000 FoundationOne CDx from the CMS 2,000 $ 20 1,000 $ 0 0 Jan-2015 Oct-2015 Aug-2016 Jul-2017 May-2018 Volume Freeway Source: Company filings and press releases, Bloomberg; Market data as of 18-Jun-2018 Additional Materials 23
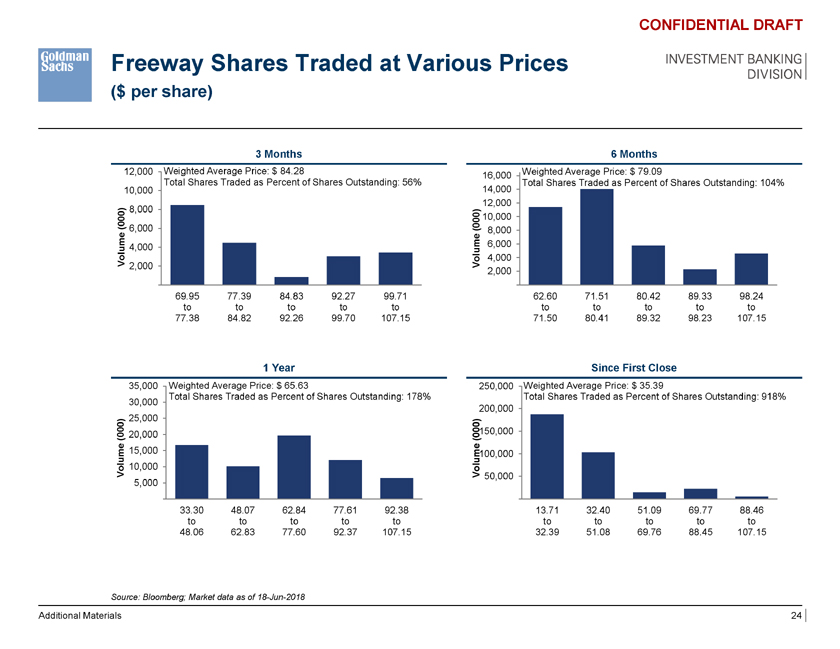
Freeway Shares Traded at Various Prices ($ per share) CONFIDENTIAL DRAFT INVESTMENT BANKING DIVISION 3 Months 6 Months 12,000 Weighted Average Price: $ 84.28 Weighted Average Price: $ 79.09 16,000 Total Shares Traded as Percent of Shares Outstanding: 56% Total Shares Traded as Percent of Shares Outstanding: 104% 10,000 14,000 12,000 (000) 8,000 00 ) 10,000 6,000(0 8,000 e 4,000 ume 6,000 Volum 2,000 Vol 4,000 2,000 69.95 77.39 84.83 92.27 99.71 62.60 71.51 80.42 89.33 98.24 to to to to to to to to to to 77.38 84.82 92.26 99.70 107.15 71.50 80.41 89.32 98.23 107.15 1 Year Since First Close 35,000 Weighted Average Price: $ 65.63 250,000 Weighted Average Price: $ 35.39 Total Shares Traded as Percent of Shares Outstanding: 178% Total Shares Traded as Percent of Shares Outstanding: 918% 30,000 200,000 25,000 ) (000) 20,000 (000150,000 e 15,000 ume100,000 Volum 10,000 Vol 50,000 5,000 33.30 48.07 62.84 77.61 92.38 13.71 32.40 51.09 69.77 88.46 to to to to to to to to to to 48.06 62.83 77.60 92.37 107.15 32.39 51.08 69.76 88.45 107.15 Source: Bloomberg; Market data as of 18-Jun-2018 Additional Materials 24
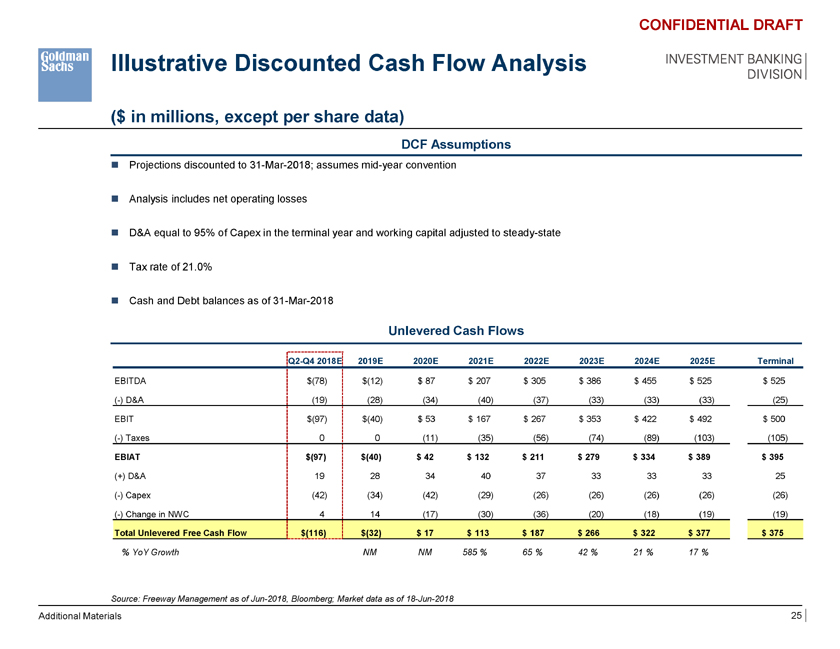
Illustrative Discounted Cash Flow Analysis ($ in millions, except per share data) CONFIDENTIAL DRAFT INVESTMENT BANKING DIVISION DCF Assumptions ï® Projections discounted to 31-Mar-2018; assumes mid-year convention ï® Analysis includes net operating losses ï® D&A equal to 95% of Capex in the terminal year and working capital adjusted to steady-state ï® Tax rate of 21.0% ï® Cash and Debt balances as of 31-Mar-2018 Unlevered Cash Flows Q2-Q4 2018E 2019E 2020E 2021E 2022E 2023E 2024E 2025E Terminal EBITDA $(78) $(12) $ 87 $ 207 $ 305 $ 386 $ 455 $ 525 $ 525 (-) D&A (19) (28) (34) (40) (37) (33) (33) (33) (25) EBIT $(97) $(40) $ 53 $ 167 $ 267 $ 353 $ 422 $ 492 $ 500 (-) Taxes 0 0 (11) (35) (56) (74) (89) (103) (105) EBIAT $(97) $(40) $ 42 $ 132 $ 211 $ 279 $ 334 $ 389 $ 395 (+) D&A 19 28 34 40 37 33 33 33 25 (-) Capex (42) (34) (42) (29) (26) (26) (26) (26) (26) (-) Change in NWC 4 14 (17) (30) (36) (20) (18) (19) (19) Total Unlevered Free Cash Flow $(116) $(32) $ 17 $ 113 $ 187 $ 266 $ 322 $ 377 $ 375 % YoY Growth NM NM 585 % 65 % 42 % 21 % 17 % Source: Freeway Management as of Jun-2018, Bloomberg; Market data as of 18-Jun-2018 Additional Materials 25
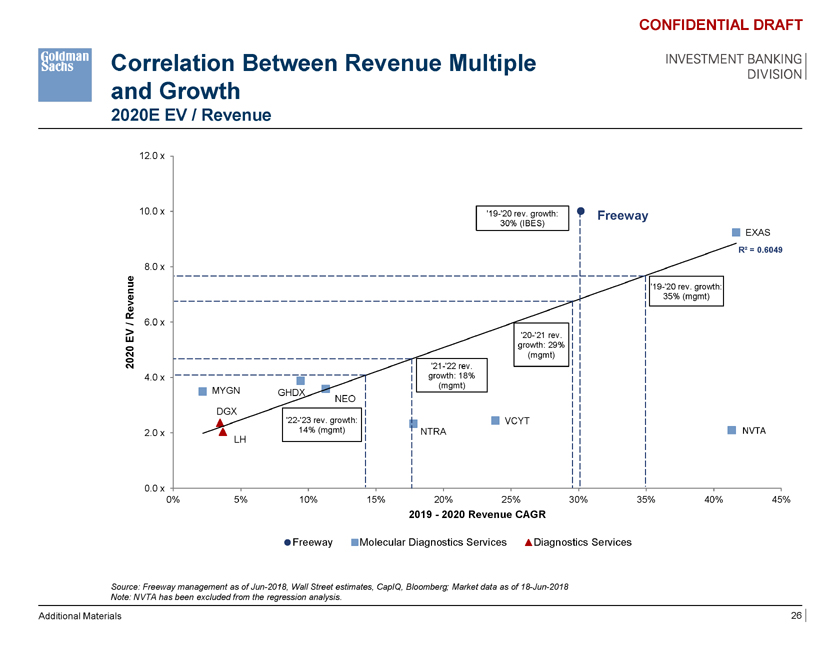
Correlation Between Revenue Multiple and Growth 2020E EV / Revenue CONFIDENTIAL DRAFT INVESTMENT BANKING DIVISION 12.0 x 10.0 x ‘19-‘20 rev. growth: Freeway 30% (IBES) EXAS R² = 0.6049 8.0 x e ‘19-‘20 rev. growth: Revenu 35% (mgmt) / 6.0 x V ‘20-‘21 rev. E growth: 29% 20 (mgmt) 20 ‘21-‘22 rev. 4.0 x growth: 18% (mgmt) MYGN GHDX NEO DGX ‘22-‘23 rev. growth: VCYT 2.0 x 14% (mgmt) NTRA NVTA LH 0.0 x 0% 5% 10% 15% 20% 25% 30% 35% 40% 45% 2019—2020 Revenue CAGR Freeway Molecular Diagnostics Services Diagnostics Services Source: Freeway management as of Jun-2018, Wall Street estimates, CapIQ, Bloomberg; Market data as of 18-Jun-2018 Note: NVTA has been excluded from the regression analysis. Additional Materials 26
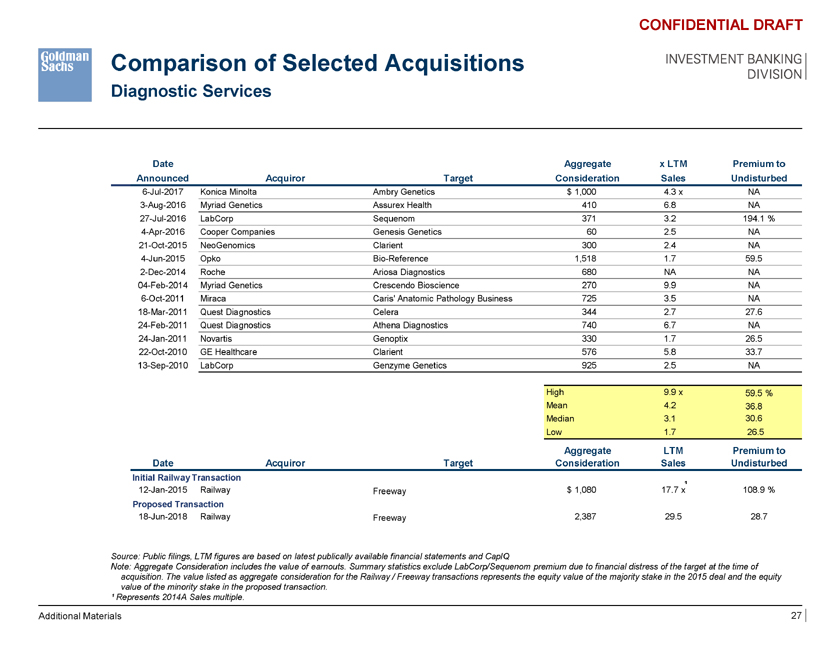
Comparison of Selected Acquisitions Diagnostic Services CONFIDENTIAL DRAFT INVESTMENT BANKING DIVISION Date Aggregate x LTM Premium to Announced Acquiror Target Consideration Sales Undisturbed 6-Jul-2017 Konica Minolta Ambry Genetics $ 1,000 4.3 x NA 3-Aug-2016 Myriad Genetics Assurex Health 410 6.8 NA 27-Jul-2016 LabCorp Sequenom 371 3.2 194.1 % 4-Apr-2016 Cooper Companies Genesis Genetics 60 2.5 NA 21-Oct-2015 NeoGenomics Clarient 300 2.4 NA 4-Jun-2015 Opko Bio-Reference 1,518 1.7 59.5 2-Dec-2014 Roche Ariosa Diagnostics 680 NA NA 04-Feb-2014 Myriad Genetics Crescendo Bioscience 270 9.9 NA 6-Oct-2011 Miraca Caris’ Anatomic Pathology Business 725 3.5 NA 18-Mar-2011 Quest Diagnostics Celera 344 2.7 27.6 24-Feb-2011 Quest Diagnostics Athena Diagnostics 740 6.7 NA 24-Jan-2011 Novartis Genoptix 330 1.7 26.5 22-Oct-2010 GE Healthcare Clarient 576 5.8 33.7 13-Sep-2010 LabCorp Genzyme Genetics 925 2.5 NA High 9.9 x 59.5 % Mean 4.2 36.8 Median 3.1 30.6 Low 1.7 26.5 Aggregate LTM Premium to Date Acquiror Target Consideration Sales Undisturbed Initial Railway Transaction ¹ 12-Jan-2015 Railway Freeway $ 1,080 17.7 x 108.9 % Proposed Transaction 18-Jun-2018 Railway Freeway 2,387 29.5 28.7 Source: Public filings, LTM figures are based on latest publically available financial statements and CapIQ Note: Aggregate Consideration includes the value of earnouts. Summary statistics exclude LabCorp/Sequenom premium due to financial distress of the target at the time of acquisition. The value listed as aggregate consideration for the Railway / Freeway transactions represents the equity value of the majority stake in the 2015 deal and the equity value of the minority stake in the proposed transaction. ¹ Represents 2014A Sales multiple. Additional Materials 27
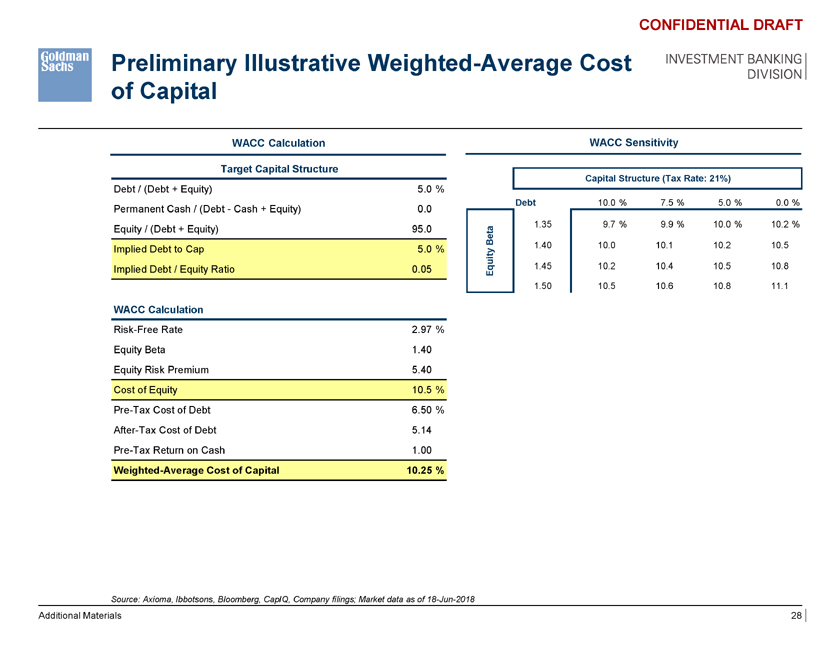
Preliminary Illustrative Weighted-Average Cost of Capital CONFIDENTIAL DRAFT INVESTMENT BANKING DIVISION WACC Calculation WACC Sensitivity Target Capital Structure Capital Structure (Tax Rate: 21%) Debt / (Debt + Equity) 5.0 % Debt 10.0 % 7.5 % 5.0 % 0.0 % Permanent Cash / (Debt—Cash + Equity) 0.0 1.35 9.7 % 9.9 % 10.0 % 10.2 % Equity / (Debt + Equity) 95.0 a t Be 1.40 10.0 10.1 10.2 10.5 Implied Debt to Cap 5.0 % ity Implied Debt / Equity Ratio 0.05 qu 1.45 10.2 10.4 10.5 10.8 E 1.50 10.5 10.6 10.8 11.1 WACC Calculation Risk-Free Rate 2.97 % Equity Beta 1.40 Equity Risk Premium 5.40 Cost of Equity 10.5 % Pre-Tax Cost of Debt 6.50 % After-Tax Cost of Debt 5.14 Pre-Tax Return on Cash 1.00 Weighted-Average Cost of Capital 10.25 % Source: Axioma, Ibbotsons, Bloomberg, CapIQ, Company filings; Market data as of 18-Jun-2018 Additional Materials 28
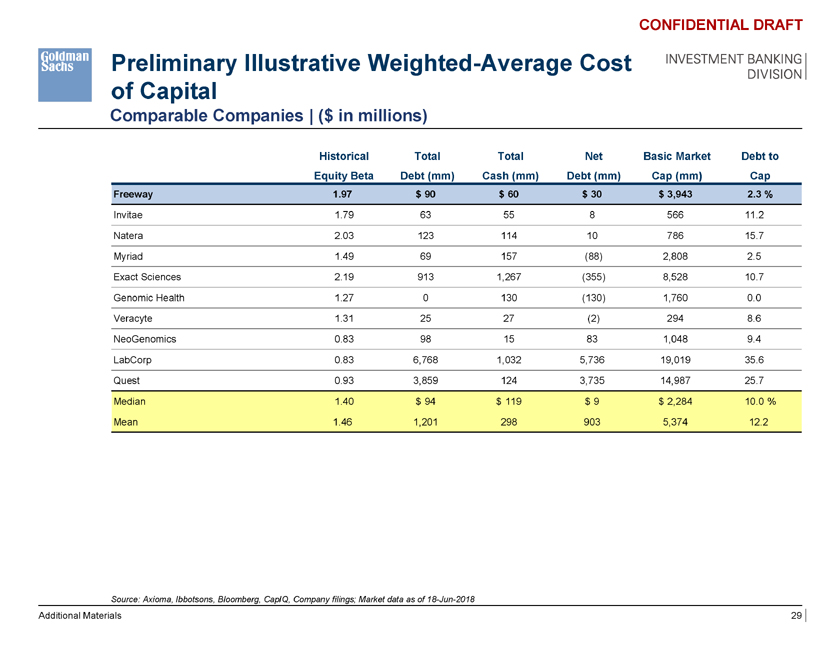
Preliminary Illustrative Weighted-Average Cost of Capital Comparable Companies | ($ in millions) CONFIDENTIAL DRAFT INVESTMENT BANKING DIVISION Historical Total Total Net Basic Market Debt to Equity Beta Debt (mm) Cash (mm) Debt (mm) Cap (mm) Cap Freeway 1.97 $ 90 $ 60 $ 30 $ 3,943 2.3 % Invitae 1.79 63 55 8 566 11.2 Natera 2.03 123 114 10 786 15.7 Myriad 1.49 69 157 (88) 2,808 2.5 Exact Sciences 2.19 913 1,267 (355) 8,528 10.7 Genomic Health 1.27 0 130 (130) 1,760 0.0 Veracyte 1.31 25 27 (2) 294 8.6 NeoGenomics 0.83 98 15 83 1,048 9.4 LabCorp 0.83 6,768 1,032 5,736 19,019 35.6 Quest 0.93 3,859 124 3,735 14,987 25.7 Median 1.40 $ 94 $ 119 $ 9 $ 2,284 10.0 % Mean 1.46 1,201 298 903 5,374 12.2 Source: Axioma, Ibbotsons, Bloomberg, CapIQ, Company filings; Market data as of 18-Jun-2018 Additional Materials 29