UNITED STATES
SECURITIES AND EXCHANGE COMMISSION
Washington, D.C. 20549
FORM N-CSR
CERTIFIED SHAREHOLDER REPORT OF REGISTERED MANAGEMENT INVESTMENT COMPANIES
Investment Company Act file number 811-22441
John Hancock Diversified Income Fund (formerly John Hancock Hedged Equity & Income Fund)
(Exact name of registrant as specified in charter)
200 BERKELEY STREET, BOSTON, MA 02116 (Address of principal executive offices) (Zip code)
SALVATORE SCHIAVONE
TREASURER
200 BERKELEY STREET
BOSTON, MA 02116
(Name and address of agent for service)
Registrant's telephone number, including area code: (617) 543-9634
Date of fiscal year end: December 31
Date of reporting period: June 30, 2025
ITEM 1. REPORT TO STOCKHOLDERS.
| SEMIANNUAL REPORT | JOHN HANCOCK DIVERSIFIED INCOME FUND | 1 |
| 2 | JOHN HANCOCK DIVERSIFIED INCOME FUND | SEMIANNUAL REPORT |
| TOP 10 HOLDINGS AS OF 6/30/2025 (% of net assets) | |
| JPMorgan Chase & Co. | 1.1 |
| Iberdrola SA | 1.1 |
| Exxon Mobil Corp. | 0.9 |
| IBM Corp. | 0.9 |
| Cisco Systems, Inc. | 0.8 |
| Philip Morris International, Inc. | 0.8 |
| Terna - Rete Elettrica Nazionale | 0.7 |
| Stockland | 0.7 |
| Texas Instruments, Inc. | 0.7 |
| National Grid PLC | 0.6 |
| TOTAL | 8.3 |
| Cash and short-term investments are not included. | |
| SEMIANNUAL REPORT | JOHN HANCOCK DIVERSIFIED INCOME FUND | 3 |
| COUNTRY COMPOSITION AS OF 6/30/2025 (% of net assets) | |
| United States | 54.4 |
| China | 4.2 |
| United Kingdom | 4.2 |
| France | 3.4 |
| Spain | 3.2 |
| Japan | 3.1 |
| Cayman Islands | 2.9 |
| Taiwan | 2.8 |
| Netherlands | 2.4 |
| Germany | 2.2 |
| Other countries | 17.2 |
| TOTAL | 100.0 |
| 4 | JOHN HANCOCK DIVERSIFIED INCOME FUND | SEMIANNUAL REPORT |
| Shares | Value | ||||
| Common stocks 58.0% | $83,152,240 | ||||
| (Cost $82,026,639) | |||||
| Communication services 4.3% | 6,127,875 | ||||
| Diversified telecommunication services 2.8% | |||||
| AT&T, Inc. | 5,768 | 166,926 | |||
| Chunghwa Telecom Company, Ltd., ADR | 15,087 | 703,205 | |||
| Hellenic Telecommunications Organization SA | 35,035 | 666,193 | |||
| Koninklijke KPN NV | 139,100 | 678,556 | |||
| Singapore Telecommunications, Ltd. | 213,957 | 645,035 | |||
| Swisscom AG | 201 | 142,728 | |||
| Telenor ASA | 8,128 | 126,571 | |||
| Verizon Communications, Inc. | 21,069 | 911,656 | |||
| Media 0.8% | |||||
| Focus Media Information Technology Company, Ltd., Class A | 653,332 | 665,938 | |||
| Omnicom Group, Inc. | 4,073 | 293,012 | |||
| The Interpublic Group of Companies, Inc. | 5,861 | 143,477 | |||
| Wireless telecommunication services 0.7% | |||||
| Taiwan Mobile Company, Ltd. | 169,912 | 668,613 | |||
| Vodacom Group, Ltd. | 40,778 | 315,965 | |||
| Consumer discretionary 2.5% | 3,604,595 | ||||
| Automobiles 0.7% | |||||
| BYD Company, Ltd., H Shares | 3,660 | 56,986 | |||
| Ford Motor Company | 7,818 | 84,825 | |||
| Honda Motor Company, Ltd. | 29,855 | 287,887 | |||
| Mercedes-Benz Group AG | 2,087 | 121,589 | |||
| Toyota Motor Corp. | 26,011 | 447,987 | |||
| Distributors 0.2% | |||||
| Genuine Parts Company | 2,391 | 290,052 | |||
| Hotels, restaurants and leisure 0.7% | |||||
| Evolution AB (A) | 712 | 56,549 | |||
| McDonald’s Corp. | 1,235 | 360,830 | |||
| OPAP SA | 23,422 | 531,111 | |||
| Household durables 0.4% | |||||
| Garmin, Ltd. | 539 | 112,500 | |||
| Sekisui House, Ltd. | 23,882 | 525,627 | |||
| Leisure products 0.2% | |||||
| Sankyo Company, Ltd. | 16,273 | 301,193 | |||
| Specialty retail 0.3% | |||||
| Pop Mart International Group, Ltd. (A) | 2,786 | 94,917 | |||
| The Home Depot, Inc. | 907 | 332,542 | |||
| SEE NOTES TO FINANCIAL STATEMENTS | SEMIANNUAL REPORT | JOHN HANCOCK DIVERSIFIED INCOME FUND | 5 |
| Shares | Value | ||||
| Consumer staples 5.4% | $7,714,481 | ||||
| Beverages 0.6% | |||||
| PepsiCo, Inc. | 2,966 | 391,631 | |||
| The Coca-Cola Company | 6,875 | 486,406 | |||
| Food products 2.7% | |||||
| Conagra Brands, Inc. | 16,100 | 329,567 | |||
| General Mills, Inc. | 6,662 | 345,158 | |||
| Indofood Sukses Makmur Tbk PT | 1,407,248 | 704,651 | |||
| Inner Mongolia Yili Industrial Group Company, Ltd., Class A | 155,928 | 607,078 | |||
| JDE Peet’s NV | 24,064 | 687,378 | |||
| Nestle SA | 1,633 | 162,363 | |||
| The Campbell’s Company | 12,052 | 369,394 | |||
| The J.M. Smucker Company | 574 | 56,367 | |||
| The Kraft Heinz Company | 20,029 | 517,149 | |||
| Household products 0.4% | |||||
| Kimberly-Clark Corp. | 457 | 58,916 | |||
| The Procter & Gamble Company | 3,124 | 497,716 | |||
| Personal care products 0.1% | |||||
| Unilever PLC | 3,124 | 190,646 | |||
| Tobacco 1.6% | |||||
| Altria Group, Inc. | 13,134 | 770,046 | |||
| British American Tobacco PLC | 7,740 | 368,008 | |||
| Philip Morris International, Inc. | 6,435 | 1,172,007 | |||
| Energy 3.1% | 4,499,164 | ||||
| Energy equipment and services 0.2% | |||||
| Baker Hughes Company | 6,338 | 242,999 | |||
| Oil, gas and consumable fuels 2.9% | |||||
| Aker BP ASA | 2,742 | 70,070 | |||
| Chevron Corp. | 5,712 | 817,901 | |||
| Coal India, Ltd. | 54,227 | 247,940 | |||
| Coterra Energy, Inc. | 2,501 | 63,475 | |||
| Eni SpA | 10,139 | 163,787 | |||
| EOG Resources, Inc. | 1,585 | 189,582 | |||
| Exxon Mobil Corp. | 11,460 | 1,235,388 | |||
| ONEOK, Inc. | 7,879 | 643,163 | |||
| ORLEN SA | 19,937 | 454,394 | |||
| TotalEnergies SE | 6,061 | 370,465 | |||
| Financials 14.6% | 20,931,387 | ||||
| Banks 6.6% | |||||
| ANZ Group Holdings, Ltd. | 3,366 | 64,549 | |||
| Banco Bilbao Vizcaya Argentaria SA | 12,586 | 193,803 | |||
| Bank Mandiri Persero Tbk PT | 207,666 | 62,380 | |||
| 6 | JOHN HANCOCK DIVERSIFIED INCOME FUND | SEMIANNUAL REPORT | SEE NOTES TO FINANCIAL STATEMENTS |
| Shares | Value | ||||
| Financials (continued) | |||||
| Banks (continued) | |||||
| Bank of Baroda | 236,344 | $685,018 | |||
| CaixaBank SA | 12,911 | 111,871 | |||
| China Merchants Bank Company, Ltd., Class A | 107,517 | 689,821 | |||
| E.Sun Financial Holding Company, Ltd. | 607,533 | 682,912 | |||
| Huntington Bancshares, Inc. | 7,596 | 127,309 | |||
| JPMorgan Chase & Co. | 5,366 | 1,555,649 | |||
| KeyCorp | 13,860 | 241,441 | |||
| Lloyds Banking Group PLC | 639,899 | 672,864 | |||
| M&T Bank Corp. | 2,183 | 423,480 | |||
| Mizuho Financial Group, Inc. | 7,302 | 202,703 | |||
| Powszechna Kasa Oszczednosci Bank Polski SA | 3,901 | 81,511 | |||
| Regions Financial Corp. | 2,981 | 70,113 | |||
| Sberbank of Russia PJSC, ADR (B)(C) | 3,353 | 0 | |||
| Shanghai Pudong Development Bank Company, Ltd., Class A | 345,000 | 668,632 | |||
| Standard Bank Group, Ltd. | 10,577 | 135,805 | |||
| The Shanghai Commercial & Savings Bank, Ltd. | 419,988 | 666,733 | |||
| The Toronto-Dominion Bank | 9,085 | 668,224 | |||
| Truist Financial Corp. | 15,543 | 668,194 | |||
| U.S. Bancorp | 14,365 | 650,016 | |||
| VTB Bank PJSC, GDR (B)(C) | 55,420 | 0 | |||
| Wells Fargo & Company | 893 | 71,547 | |||
| Capital markets 2.6% | |||||
| Ares Management Corp., Class A | 2,500 | 433,000 | |||
| BlackRock, Inc. | 449 | 471,113 | |||
| CME Group, Inc. | 2,218 | 611,325 | |||
| Deutsche Bank AG | 24,139 | 715,611 | |||
| Franklin Resources, Inc. | 31,020 | 739,827 | |||
| T. Rowe Price Group, Inc. | 7,111 | 686,212 | |||
| The Blackstone Group, Inc. | 827 | 123,703 | |||
| Financial services 0.4% | |||||
| Apollo Global Management, Inc. | 456 | 64,693 | |||
| FirstRand, Ltd. | 99,317 | 424,564 | |||
| Insurance 4.8% | |||||
| Admiral Group PLC | 8,569 | 384,804 | |||
| Allianz SE | 2,160 | 876,600 | |||
| AXA SA | 15,918 | 781,654 | |||
| CNA Financial Corp. | 9,304 | 432,915 | |||
| Generali | 7,467 | 265,612 | |||
| Gjensidige Forsikring ASA | 6,860 | 173,901 | |||
| Legal & General Group PLC | 97,639 | 341,632 | |||
| MS&AD Insurance Group Holdings, Inc. | 10,796 | 241,351 | |||
| Muenchener Rueckversicherungs-Gesellschaft AG | 607 | 394,146 | |||
| SEE NOTES TO FINANCIAL STATEMENTS | SEMIANNUAL REPORT | JOHN HANCOCK DIVERSIFIED INCOME FUND | 7 |
| Shares | Value | ||||
| Financials (continued) | |||||
| Insurance (continued) | |||||
| New China Life Insurance Company, Ltd., H Shares | 128,212 | $702,057 | |||
| Phoenix Group Holdings PLC | 30,413 | 275,150 | |||
| Prudential Financial, Inc. | 1,129 | 121,300 | |||
| Sanlam, Ltd. | 70,922 | 355,294 | |||
| Suncorp Group, Ltd. | 6,065 | 86,436 | |||
| Swiss Life Holding AG | 193 | 195,386 | |||
| Swiss Re AG | 1,255 | 217,099 | |||
| Tokio Marine Holdings, Inc. | 10,106 | 428,303 | |||
| Tryg A/S | 8,545 | 220,898 | |||
| Zurich Insurance Group AG | 613 | 428,930 | |||
| Mortgage real estate investment trusts 0.2% | |||||
| Annaly Capital Management, Inc. | 18,241 | 343,296 | |||
| Health care 3.7% | 5,362,925 | ||||
| Biotechnology 0.8% | |||||
| AbbVie, Inc. | 3,786 | 702,757 | |||
| Amgen, Inc. | 549 | 153,286 | |||
| Gilead Sciences, Inc. | 2,393 | 265,312 | |||
| Health care equipment and supplies 0.1% | |||||
| Medtronic PLC | 1,121 | 97,718 | |||
| Health care providers and services 0.2% | |||||
| CVS Health Corp. | 5,418 | 373,734 | |||
| Pharmaceuticals 2.6% | |||||
| Bristol-Myers Squibb Company | 10,670 | 493,914 | |||
| Johnson & Johnson | 5,145 | 785,899 | |||
| Merck & Company, Inc. | 8,399 | 664,865 | |||
| Novo Nordisk A/S, Class B | 3,364 | 233,105 | |||
| Pfizer, Inc. | 36,625 | 887,790 | |||
| Roche Holding AG | 1,793 | 585,270 | |||
| Sanofi SA | 1,232 | 119,275 | |||
| Industrials 4.7% | 6,729,470 | ||||
| Aerospace and defense 0.2% | |||||
| BAE Systems PLC | 2,734 | 70,955 | |||
| Lockheed Martin Corp. | 373 | 172,751 | |||
| Air freight and logistics 0.2% | |||||
| United Parcel Service, Inc., Class B | 3,210 | 324,017 | |||
| Construction and engineering 1.2% | |||||
| ACS Actividades de Construccion y Servicios SA | 9,653 | 670,957 | |||
| Bouygues SA | 13,715 | 620,257 | |||
| Vinci SA | 2,562 | 377,819 | |||
| 8 | JOHN HANCOCK DIVERSIFIED INCOME FUND | SEMIANNUAL REPORT | SEE NOTES TO FINANCIAL STATEMENTS |
| Shares | Value | ||||
| Industrials (continued) | |||||
| Electrical equipment 0.1% | |||||
| Emerson Electric Company | 617 | $82,265 | |||
| Industrial conglomerates 0.7% | |||||
| Metlen Energy & Metals SA | 12,881 | 698,282 | |||
| Siemens AG | 1,119 | 287,424 | |||
| Machinery 1.0% | |||||
| Kone OYJ, B Shares | 7,988 | 526,255 | |||
| PACCAR, Inc. | 7,558 | 718,463 | |||
| Stanley Black & Decker, Inc. | 2,149 | 145,595 | |||
| Professional services 0.2% | |||||
| Paychex, Inc. | 2,179 | 316,957 | |||
| Trading companies and distributors 0.1% | |||||
| Sumitomo Corp. | 8,094 | 208,880 | |||
| Transportation infrastructure 1.0% | |||||
| Atlas Arteria, Ltd. | 45,379 | 152,086 | |||
| Getlink SE | 34,966 | 674,984 | |||
| Grupo Aeroportuario del Pacifico SAB de CV, B Shares | 29,771 | 681,523 | |||
| Information technology 8.7% | 12,532,145 | ||||
| Communications equipment 0.9% | |||||
| Accton Technology Corp. | 3,565 | 89,103 | |||
| BYD Electronic International Company, Ltd. | 16,886 | 68,730 | |||
| Cisco Systems, Inc. | 17,434 | 1,209,571 | |||
| Electronic equipment, instruments and components 0.9% | |||||
| AAC Technologies Holdings, Inc. | 19,406 | 100,966 | |||
| Amano Corp. | 9,477 | 294,482 | |||
| Delta Electronics, Inc. | 11,558 | 163,557 | |||
| E Ink Holdings, Inc. | 13,582 | 102,800 | |||
| Elite Material Company, Ltd. | 4,512 | 136,437 | |||
| Kyocera Corp. | 7,520 | 90,318 | |||
| Lotes Company, Ltd. | 1,622 | 75,104 | |||
| Murata Manufacturing Company, Ltd. | 5,708 | 84,368 | |||
| Shimadzu Corp. | 2,265 | 55,998 | |||
| Sunny Optical Technology Group Company, Ltd. | 13,886 | 123,328 | |||
| IT services 1.4% | |||||
| Accenture PLC, Class A | 204 | 60,974 | |||
| IBM Corp. | 4,110 | 1,211,546 | |||
| Infosys, Ltd. | 10,731 | 200,684 | |||
| Obic Company, Ltd. | 2,284 | 88,813 | |||
| Otsuka Corp. | 14,763 | 300,743 | |||
| SCSK Corp. | 5,287 | 159,285 | |||
| Semiconductors and semiconductor equipment 2.2% | |||||
| Analog Devices, Inc. | 816 | 194,224 | |||
| SEE NOTES TO FINANCIAL STATEMENTS | SEMIANNUAL REPORT | JOHN HANCOCK DIVERSIFIED INCOME FUND | 9 |
| Shares | Value | ||||
| Information technology (continued) | |||||
| Semiconductors and semiconductor equipment (continued) | |||||
| Broadcom, Inc. | 543 | $149,678 | |||
| Marvell Technology, Inc. | 1,898 | 146,905 | |||
| Microchip Technology, Inc. | 3,093 | 217,654 | |||
| NVIDIA Corp. | 2,333 | 368,591 | |||
| Qualcomm, Inc. | 5,660 | 901,412 | |||
| Texas Instruments, Inc. | 4,588 | 952,561 | |||
| Tokyo Electron, Ltd. | 1,130 | 216,406 | |||
| Software 1.5% | |||||
| Gen Digital, Inc. | 9,551 | 280,799 | |||
| Microsoft Corp. | 1,100 | 547,151 | |||
| Oracle Corp. | 441 | 96,416 | |||
| SAP SE | 456 | 139,436 | |||
| Shanghai Baosight Software Company, Ltd., Class B | 375,841 | 509,421 | |||
| The Sage Group PLC | 26,839 | 460,901 | |||
| Trend Micro, Inc. | 1,048 | 72,486 | |||
| Technology hardware, storage and peripherals 1.8% | |||||
| Apple, Inc. | 1,422 | 291,752 | |||
| Asia Vital Components Company, Ltd. | 7,557 | 193,024 | |||
| Canon, Inc. | 14,120 | 409,532 | |||
| Gigabyte Technology Company, Ltd. | 8,640 | 83,957 | |||
| HP, Inc. | 26,105 | 638,528 | |||
| King Slide Works Company, Ltd. | 1,718 | 119,595 | |||
| Lenovo Group, Ltd. | 56,220 | 67,925 | |||
| Quanta Computer, Inc. | 15,125 | 142,271 | |||
| Seagate Technology Holdings PLC | 3,801 | 548,598 | |||
| Wiwynn Corp. | 1,913 | 166,115 | |||
| Materials 2.3% | 3,270,057 | ||||
| Chemicals 0.7% | |||||
| BASF SE | 1,766 | 87,345 | |||
| Dow, Inc. | 17,747 | 469,941 | |||
| LyondellBasell Industries NV, Class A | 8,378 | 484,751 | |||
| Containers and packaging 0.1% | |||||
| International Paper Company | 1,423 | 66,639 | |||
| Smurfit WestRock PLC | 3,255 | 140,785 | |||
| Metals and mining 1.3% | |||||
| BHP Group, Ltd. | 3,116 | 74,963 | |||
| Grupo Mexico SAB de CV, Series B | 57,971 | 349,874 | |||
| Norsk Hydro ASA | 28,501 | 163,208 | |||
| Northern Star Resources, Ltd. | 8,338 | 102,992 | |||
| Rio Tinto PLC | 9,292 | 540,832 | |||
| Rio Tinto, Ltd. | 2,741 | 194,036 | |||
| 10 | JOHN HANCOCK DIVERSIFIED INCOME FUND | SEMIANNUAL REPORT | SEE NOTES TO FINANCIAL STATEMENTS |
| Shares | Value | ||||
| Materials (continued) | |||||
| Metals and mining (continued) | |||||
| Shandong Gold Mining Company, Ltd., H Shares (A) | 40,090 | $140,661 | |||
| Zhaojin Mining Industry Company, Ltd., H Shares | 34,121 | 89,690 | |||
| Zijin Mining Group Company, Ltd., H Shares | 60,533 | 155,679 | |||
| Paper and forest products 0.2% | |||||
| UPM-Kymmene OYJ | 7,641 | 208,661 | |||
| Real estate 2.9% | 4,088,924 | ||||
| Diversified REITs 0.9% | |||||
| Stockland | 285,695 | 1,009,680 | |||
| WP Carey, Inc. | 4,099 | 255,696 | |||
| Health care REITs 0.5% | |||||
| Alexandria Real Estate Equities, Inc. | 6,562 | 476,598 | |||
| Healthpeak Properties, Inc. | 14,758 | 258,413 | |||
| Office REITs 0.3% | |||||
| BXP, Inc. | 6,764 | 456,367 | |||
| Real estate management and development 0.5% | |||||
| China Resources Mixc Lifestyle Services, Ltd. (A) | 135,744 | 659,504 | |||
| Retail REITs 0.2% | |||||
| Simon Property Group, Inc. | 1,490 | 239,532 | |||
| Specialized REITs 0.5% | |||||
| Digital Realty Trust, Inc. | 634 | 110,525 | |||
| Extra Space Storage, Inc. | 535 | 78,880 | |||
| Gaming and Leisure Properties, Inc. | 11,648 | 543,729 | |||
| Utilities 5.8% | 8,291,217 | ||||
| Electric utilities 4.2% | |||||
| CEZ AS | 12,238 | 718,734 | |||
| Duke Energy Corp. | 2,619 | 309,042 | |||
| Edison International | 1,953 | 100,775 | |||
| Endesa SA | 21,831 | 691,711 | |||
| Eversource Energy | 2,527 | 160,768 | |||
| Iberdrola SA | 79,773 | 1,534,676 | |||
| Public Power Corp. SA | 41,351 | 675,780 | |||
| Redeia Corp. SA | 32,216 | 689,350 | |||
| Terna - Rete Elettrica Nazionale | 107,176 | 1,101,873 | |||
| Gas utilities 0.3% | |||||
| APA Group | 47,907 | 257,585 | |||
| Snam SpA | 22,505 | 136,238 | |||
| Independent power and renewable electricity producers 0.6% | |||||
| Ratch Group PCL | 330,619 | 246,025 | |||
| Shenergy Company, Ltd., Class A (C) | 529,008 | 635,169 | |||
| SEE NOTES TO FINANCIAL STATEMENTS | SEMIANNUAL REPORT | JOHN HANCOCK DIVERSIFIED INCOME FUND | 11 |
| Shares | Value | ||||
| Utilities (continued) | |||||
| Multi-utilities 0.7% | |||||
| Dominion Energy, Inc. | 1,761 | $99,532 | |||
| National Grid PLC | 63,627 | 933,959 | |||
| Preferred securities 0.8% | $1,166,146 | ||||
| (Cost $1,116,680) | |||||
| Consumer discretionary 0.3% | 471,968 | ||||
| Automobiles 0.3% | |||||
| Bayerische Motoren Werke AG | 1,327 | 110,202 | |||
| Hyundai Motor Company | 1,936 | 221,080 | |||
| Hyundai Motor Company, 2nd Preferred Shares | 1,198 | 140,686 | |||
| Financials 0.1% | 123,581 | ||||
| Insurance 0.1% | |||||
| Samsung Fire & Marine Insurance Company, Ltd. | 515 | 123,581 | |||
| Information technology 0.4% | 570,597 | ||||
| Technology hardware, storage and peripherals 0.4% | |||||
| Samsung Electronics Company, Ltd. | 15,554 | 570,597 | |||
| Rate (%) | Maturity date | Par value^ | Value | ||
| U.S. Government and Agency obligations 0.2% | $318,665 | ||||
| (Cost $315,236) | |||||
| U.S. Government 0.2% | 318,665 | ||||
| U.S. Treasury Note | 2.750 | 07-31-27 | 325,000 | 318,665 | |
| Foreign government obligations 0.7% | $1,090,810 | ||||
| (Cost $1,048,281) | |||||
| Angola 0.1% | 180,956 | ||||
| Republic of Angola Bond | 8.000 | 11-26-29 | 200,000 | 180,956 | |
| Argentina 0.1% | 64,145 | ||||
| Republic of Argentina Bond | 5.000 | 01-09-38 | 90,000 | 64,145 | |
| Brazil 0.1% | 197,912 | ||||
| Federative Republic of Brazil Note | 6.125 | 03-15-34 | 200,000 | 197,912 | |
| Colombia 0.1% | 172,741 | ||||
| Republic of Colombia Note | 3.000 | 01-30-30 | 200,000 | 172,741 | |
| Romania 0.2% | 218,480 | ||||
| Republic of Romania Bond (A) | 5.875 | 07-11-32 | EUR | 185,000 | 218,480 |
| 12 | JOHN HANCOCK DIVERSIFIED INCOME FUND | SEMIANNUAL REPORT | SEE NOTES TO FINANCIAL STATEMENTS |
| Rate (%) | Maturity date | Par value^ | Value | ||
| South Africa 0.1% | $195,641 | ||||
| Republic of South Africa Bond | 5.875 | 04-20-32 | 200,000 | 195,641 | |
| Sri Lanka 0.0% | 60,935 | ||||
| Republic of Sri Lanka Bond (3.600% to 11-15-27, then 3.850% to 11-15-32, then 9.500% thereafter) (A) | 3.600 | 05-15-36 | 75,000 | 60,935 | |
| Corporate bonds 16.7% | $23,892,201 | ||||
| (Cost $22,801,708) | |||||
| Communication services 2.5% | 3,549,158 | ||||
| Diversified telecommunication services 0.8% | |||||
| Eolo SpA | 4.875 | 10-21-28 | EUR | 100,000 | 110,544 |
| Fibercop SpA | 6.375 | 11-15-33 | 200,000 | 194,218 | |
| Iliad Holding SASU | 5.375 | 04-15-30 | EUR | 275,000 | 332,850 |
| Iliad Holding SASU | 6.875 | 04-15-31 | EUR | 100,000 | 125,614 |
| Kaixo Bondco Telecom SA | 5.125 | 09-30-29 | EUR | 200,000 | 238,897 |
| Level 3 Financing, Inc. (A) | 3.750 | 07-15-29 | 65,000 | 54,681 | |
| Level 3 Financing, Inc. (A) | 3.875 | 10-15-30 | 60,000 | 52,050 | |
| Telecom Italia Capital SA | 7.200 | 07-18-36 | 60,000 | 63,866 | |
| Entertainment 0.2% | |||||
| Cinemark USA, Inc. (A) | 5.250 | 07-15-28 | 40,000 | 39,810 | |
| Cinemark USA, Inc. (A) | 7.000 | 08-01-32 | 50,000 | 51,908 | |
| Univision Communications, Inc. (A) | 8.500 | 07-31-31 | 100,000 | 100,111 | |
| WarnerMedia Holdings, Inc. | 5.141 | 03-15-52 | 14,000 | 8,762 | |
| Media 0.9% | |||||
| CCO Holdings LLC (A) | 4.500 | 08-15-30 | 65,000 | 61,970 | |
| CCO Holdings LLC (A) | 4.750 | 02-01-32 | 395,000 | 374,668 | |
| CCO Holdings LLC (A) | 5.000 | 02-01-28 | 50,000 | 49,539 | |
| Clear Channel Outdoor Holdings, Inc. (A) | 7.500 | 06-01-29 | 25,000 | 23,122 | |
| Clear Channel Outdoor Holdings, Inc. (A) | 7.875 | 04-01-30 | 150,000 | 154,837 | |
| CSC Holdings LLC (A) | 11.750 | 01-31-29 | 200,000 | 190,231 | |
| Paramount Global | 6.875 | 04-30-36 | 100,000 | 102,406 | |
| Scripps Escrow II, Inc. (A) | 3.875 | 01-15-29 | 65,000 | 56,584 | |
| Scripps Escrow, Inc. (A) | 5.875 | 07-15-27 | 50,000 | 44,499 | |
| United Group BV | 6.750 | 02-15-31 | EUR | 150,000 | 180,981 |
| VZ Vendor Financing II BV | 2.875 | 01-15-29 | EUR | 100,000 | 106,983 |
| Wireless telecommunication services 0.6% | |||||
| Altice France SA | 4.125 | 01-15-29 | EUR | 200,000 | 197,978 |
| Matterhorn Telecom SA | 4.500 | 01-30-30 | EUR | 125,000 | 150,289 |
| Odido Group Holding BV | 5.500 | 01-15-30 | EUR | 100,000 | 117,761 |
| Odido Holding BV | 3.750 | 01-15-29 | EUR | 150,000 | 174,849 |
| Sunrise FinCo I BV (A) | 4.875 | 07-15-31 | 200,000 | 189,150 | |
| SEE NOTES TO FINANCIAL STATEMENTS | SEMIANNUAL REPORT | JOHN HANCOCK DIVERSIFIED INCOME FUND | 13 |
| Rate (%) | Maturity date | Par value^ | Value | ||
| Consumer discretionary 2.1% | $3,041,264 | ||||
| Automobile components 0.3% | |||||
| Adient Global Holdings, Ltd. (A) | 7.500 | 02-15-33 | 20,000 | 20,452 | |
| Forvia SE | 5.125 | 06-15-29 | EUR | 150,000 | 178,195 |
| Forvia SE | 5.500 | 06-15-31 | EUR | 200,000 | 232,566 |
| Broadline retail 0.2% | |||||
| B&M European Value Retail SA | 6.500 | 11-27-31 | GBP | 175,000 | 241,896 |
| Diversified consumer services 0.3% | |||||
| AA Bond Company, Ltd. | 7.375 | 07-31-29 | GBP | 100,000 | 144,165 |
| PeopleCert Wisdom Issuer PLC | 5.750 | 09-15-26 | EUR | 100,000 | 117,825 |
| Service Corp. International | 3.375 | 08-15-30 | 200,000 | 183,825 | |
| Hotels, restaurants and leisure 0.8% | |||||
| Bertrand Franchise Finance SAS | 6.500 | 07-18-30 | EUR | 125,000 | 149,149 |
| Caesars Entertainment, Inc. (A) | 4.625 | 10-15-29 | 100,000 | 95,454 | |
| Caesars Entertainment, Inc. (A) | 6.000 | 10-15-32 | 125,000 | 122,589 | |
| Cirsa Finance International Sarl | 6.500 | 03-15-29 | EUR | 100,000 | 122,951 |
| CPUK Finance, Ltd. | 7.875 | 08-28-29 | GBP | 100,000 | 142,539 |
| Essendi SA | 5.500 | 11-15-31 | EUR | 100,000 | 119,862 |
| NCL Corp., Ltd. (A) | 6.250 | 03-01-30 | 50,000 | 50,427 | |
| New Red Finance, Inc. (A) | 4.375 | 01-15-28 | 100,000 | 98,065 | |
| Punch Finance PLC (A) | 7.875 | 12-30-30 | GBP | 115,000 | 160,648 |
| Viking Cruises, Ltd. (A) | 9.125 | 07-15-31 | 75,000 | 80,775 | |
| Yum! Brands, Inc. (A) | 4.750 | 01-15-30 | 50,000 | 49,529 | |
| Household durables 0.1% | |||||
| Ashton Woods USA LLC (A) | 4.625 | 08-01-29 | 125,000 | 119,375 | |
| M/I Homes, Inc. | 3.950 | 02-15-30 | 55,000 | 51,446 | |
| Taylor Morrison Communities, Inc. (A) | 5.750 | 01-15-28 | 50,000 | 50,750 | |
| Specialty retail 0.4% | |||||
| Asbury Automotive Group, Inc. (A) | 4.625 | 11-15-29 | 100,000 | 96,549 | |
| Asbury Automotive Group, Inc. (A) | 5.000 | 02-15-32 | 100,000 | 95,147 | |
| Goldstory SAS | 6.750 | 02-01-30 | EUR | 150,000 | 183,427 |
| Specialty Building Products Holdings LLC (A) | 7.750 | 10-15-29 | 75,000 | 73,706 | |
| Velocity Vehicle Group LLC (A) | 8.000 | 06-01-29 | 60,000 | 59,952 | |
| Consumer staples 0.5% | 717,145 | ||||
| Consumer staples distribution and retail 0.2% | |||||
| ELO SACA | 3.250 | 07-23-27 | EUR | 100,000 | 113,445 |
| Lion/Polaris Lux 4 SA (3 month EURIBOR + 3.625%) (D) | 5.564 | 07-01-29 | EUR | 100,000 | 118,325 |
| Performance Food Group, Inc. (A) | 4.250 | 08-01-29 | 100,000 | 96,425 | |
| Food products 0.3% | |||||
| B&G Foods, Inc. (A) | 8.000 | 09-15-28 | 15,000 | 14,442 | |
| Barry Callebaut Services NV | 4.250 | 08-19-31 | EUR | 200,000 | 237,005 |
| 14 | JOHN HANCOCK DIVERSIFIED INCOME FUND | SEMIANNUAL REPORT | SEE NOTES TO FINANCIAL STATEMENTS |
| Rate (%) | Maturity date | Par value^ | Value | ||
| Consumer staples (continued) | |||||
| Food products (continued) | |||||
| Darling Global Finance BV (A) | 4.500 | 07-15-32 | EUR | 115,000 | $137,503 |
| Energy 1.7% | 2,479,160 | ||||
| Energy equipment and services 0.4% | |||||
| Diamond Foreign Asset Company (A) | 8.500 | 10-01-30 | 125,000 | 130,155 | |
| Enerflex, Ltd. (A) | 9.000 | 10-15-27 | 60,000 | 61,870 | |
| Noble Finance II LLC (A) | 8.000 | 04-15-30 | 100,000 | 101,822 | |
| Transocean, Inc. (A) | 8.750 | 02-15-30 | 240,000 | 246,803 | |
| Oil, gas and consumable fuels 1.3% | |||||
| Buckeye Partners LP | 5.850 | 11-15-43 | 115,000 | 101,356 | |
| Buckeye Partners LP (A) | 6.750 | 02-01-30 | 25,000 | 25,951 | |
| Buckeye Partners LP (A) | 6.875 | 07-01-29 | 100,000 | 103,602 | |
| DT Midstream, Inc. (A) | 4.375 | 06-15-31 | 150,000 | 143,638 | |
| Ecopetrol SA | 7.750 | 02-01-32 | 125,000 | 122,844 | |
| Ecopetrol SA | 8.375 | 01-19-36 | 50,000 | 48,243 | |
| Matador Resources Company (A) | 6.500 | 04-15-32 | 100,000 | 100,052 | |
| Permian Resources Operating LLC (A) | 6.250 | 02-01-33 | 25,000 | 25,232 | |
| Permian Resources Operating LLC (A) | 7.000 | 01-15-32 | 75,000 | 77,751 | |
| Petroleos Mexicanos | 4.750 | 02-26-29 | EUR | 100,000 | 112,482 |
| Petroleos Mexicanos | 5.500 | 06-27-44 | 150,000 | 100,953 | |
| Petroleos Mexicanos | 6.625 | 06-15-35 | 135,000 | 113,775 | |
| Petroleos Mexicanos | 6.750 | 09-21-47 | 125,000 | 90,536 | |
| Petroleos Mexicanos | 6.840 | 01-23-30 | 160,000 | 154,575 | |
| Petroleos Mexicanos | 7.690 | 01-23-50 | 50,000 | 39,329 | |
| Rockies Express Pipeline LLC (A) | 6.750 | 03-15-33 | 120,000 | 125,240 | |
| SM Energy Company (A) | 7.000 | 08-01-32 | 115,000 | 113,320 | |
| Sunoco LP | 4.500 | 04-30-30 | 50,000 | 48,075 | |
| Sunoco LP (A) | 6.250 | 07-01-33 | 75,000 | 76,252 | |
| Talos Production, Inc. (A) | 9.000 | 02-01-29 | 25,000 | 25,597 | |
| Talos Production, Inc. (A) | 9.375 | 02-01-31 | 100,000 | 102,096 | |
| Vital Energy, Inc. (A) | 7.750 | 07-31-29 | 75,000 | 66,235 | |
| Vital Energy, Inc. (A) | 7.875 | 04-15-32 | 25,000 | 21,376 | |
| Financials 1.7% | 2,449,742 | ||||
| Banks 0.3% | |||||
| Banca Monte dei Paschi di Siena SpA | 7.708 | 01-18-28 | EUR | 100,000 | 128,860 |
| Banco de Credito Social Cooperativo SA (5.250% to 11-27-26, then 5 Year Euro Swap Rate + 5.419%) | 5.250 | 11-27-31 | EUR | 100,000 | 119,470 |
| NatWest Group PLC (2.105% to 11-28-26, then 5 Year United Kingdom Gilt Rate + 1.750%) | 2.105 | 11-28-31 | GBP | 100,000 | 132,457 |
| Capital markets 0.1% | |||||
| Hightower Holding LLC (A) | 9.125 | 01-31-30 | 150,000 | 159,081 | |
| SEE NOTES TO FINANCIAL STATEMENTS | SEMIANNUAL REPORT | JOHN HANCOCK DIVERSIFIED INCOME FUND | 15 |
| Rate (%) | Maturity date | Par value^ | Value | ||
| Financials (continued) | |||||
| Consumer finance 0.3% | |||||
| Boost Newco Borrower LLC | 8.500 | 01-15-31 | GBP | 100,000 | $147,095 |
| Credit Acceptance Corp. (A) | 6.625 | 03-15-30 | 50,000 | 50,617 | |
| Credit Acceptance Corp. (A) | 9.250 | 12-15-28 | 100,000 | 105,864 | |
| OneMain Finance Corp. | 5.375 | 11-15-29 | 75,000 | 73,773 | |
| Financial services 0.6% | |||||
| Freedom Mortgage Corp. (A) | 12.000 | 10-01-28 | 65,000 | 69,903 | |
| Freedom Mortgage Holdings LLC (A) | 8.375 | 04-01-32 | 65,000 | 65,701 | |
| Freedom Mortgage Holdings LLC (A) | 9.250 | 02-01-29 | 65,000 | 67,514 | |
| Nationstar Mortgage Holdings, Inc. (A) | 6.500 | 08-01-29 | 99,000 | 101,124 | |
| PennyMac Financial Services, Inc. (A) | 4.250 | 02-15-29 | 75,000 | 72,117 | |
| PennyMac Financial Services, Inc. (A) | 5.750 | 09-15-31 | 70,000 | 68,642 | |
| PennyMac Financial Services, Inc. (A) | 6.875 | 05-15-32 | 10,000 | 10,225 | |
| PennyMac Financial Services, Inc. (A) | 6.875 | 02-15-33 | 70,000 | 71,750 | |
| PennyMac Financial Services, Inc. (A) | 7.125 | 11-15-30 | 25,000 | 25,910 | |
| Planet Financial Group LLC (A) | 10.500 | 12-15-29 | 60,000 | 60,057 | |
| Planet Financial Group LLC (A) | 10.500 | 12-15-29 | 30,000 | 30,000 | |
| Rocket Companies, Inc. (A) | 6.125 | 08-01-30 | 80,000 | 81,522 | |
| Rocket Companies, Inc. (A) | 6.375 | 08-01-33 | 55,000 | 56,276 | |
| United Wholesale Mortgage LLC (A) | 5.500 | 04-15-29 | 140,000 | 135,892 | |
| Insurance 0.4% | |||||
| Acrisure LLC (A) | 4.250 | 02-15-29 | 100,000 | 95,972 | |
| Acrisure LLC (A) | 6.750 | 07-01-32 | 55,000 | 55,780 | |
| Admiral Group PLC | 8.500 | 01-06-34 | GBP | 100,000 | 156,301 |
| Alliant Holdings Intermediate LLC (A) | 4.250 | 10-15-27 | 84,000 | 82,454 | |
| Ardonagh Finco, Ltd. (A) | 6.875 | 02-15-31 | EUR | 100,000 | 120,817 |
| HUB International, Ltd. (A) | 7.250 | 06-15-30 | 50,000 | 52,252 | |
| HUB International, Ltd. (A) | 7.375 | 01-31-32 | 50,000 | 52,316 | |
| Health care 1.4% | 2,004,052 | ||||
| Biotechnology 0.4% | |||||
| Grifols SA | 3.875 | 10-15-28 | EUR | 100,000 | 112,609 |
| Grifols SA | 7.125 | 05-01-30 | EUR | 250,000 | 306,571 |
| Star Parent, Inc. (A) | 9.000 | 10-01-30 | 150,000 | 157,773 | |
| Health care equipment and supplies 0.1% | |||||
| Medline Borrower LP (A) | 3.875 | 04-01-29 | 175,000 | 167,867 | |
| Health care providers and services 0.4% | |||||
| AthenaHealth Group, Inc. (A) | 6.500 | 02-15-30 | 225,000 | 221,460 | |
| Community Health Systems, Inc. (A) | 5.250 | 05-15-30 | 85,000 | 75,374 | |
| Tenet Healthcare Corp. | 4.625 | 06-15-28 | 150,000 | 148,119 | |
| Tenet Healthcare Corp. | 6.125 | 06-15-30 | 50,000 | 50,869 | |
| Life sciences tools and services 0.2% | |||||
| Avantor Funding, Inc. (A) | 3.875 | 11-01-29 | 50,000 | 47,340 | |
| 16 | JOHN HANCOCK DIVERSIFIED INCOME FUND | SEMIANNUAL REPORT | SEE NOTES TO FINANCIAL STATEMENTS |
| Rate (%) | Maturity date | Par value^ | Value | ||
| Health care (continued) | |||||
| Life sciences tools and services (continued) | |||||
| Avantor Funding, Inc. (A) | 4.625 | 07-15-28 | 100,000 | $98,196 | |
| IQVIA, Inc. (A) | 6.250 | 06-01-32 | 165,000 | 169,326 | |
| Pharmaceuticals 0.3% | |||||
| Bausch Health Companies, Inc. (A) | 4.875 | 06-01-28 | 100,000 | 84,355 | |
| Rossini Sarl | 6.750 | 12-31-29 | EUR | 100,000 | 124,299 |
| Teva Pharmaceutical Finance Netherlands II BV | 4.375 | 05-09-30 | EUR | 200,000 | 239,894 |
| Industrials 2.5% | 3,537,330 | ||||
| Aerospace and defense 0.1% | |||||
| Spirit AeroSystems, Inc. (A) | 9.375 | 11-30-29 | 50,000 | 53,051 | |
| TransDigm, Inc. | 4.875 | 05-01-29 | 85,000 | 83,519 | |
| TransDigm, Inc. (A) | 7.125 | 12-01-31 | 50,000 | 52,386 | |
| Building products 0.2% | |||||
| Builders FirstSource, Inc. (A) | 4.250 | 02-01-32 | 95,000 | 88,014 | |
| Builders FirstSource, Inc. (A) | 5.000 | 03-01-30 | 95,000 | 93,254 | |
| CP Atlas Buyer, Inc. (A) | 7.000 | 12-01-28 | 60,000 | 55,533 | |
| LBM Acquisition LLC (A) | 6.250 | 01-15-29 | 60,000 | 52,050 | |
| Commercial services and supplies 1.2% | |||||
| Allied Universal Holdco LLC | 4.875 | 06-01-28 | GBP | 200,000 | 263,142 |
| Allied Universal Holdco LLC (A) | 7.875 | 02-15-31 | 50,000 | 52,235 | |
| Arena Luxembourg Finance Sarl | 1.875 | 02-01-28 | EUR | 100,000 | 112,604 |
| Arena Luxembourg Finance Sarl (3 month EURIBOR + 2.500%) (A)(D) | 4.823 | 05-01-30 | EUR | 140,000 | 166,150 |
| Belron UK Finance PLC (A) | 5.750 | 10-15-29 | 200,000 | 201,669 | |
| Boels Topholding BV | 5.750 | 05-15-30 | EUR | 200,000 | 244,224 |
| Cimpress PLC (A) | 7.375 | 09-15-32 | 150,000 | 143,175 | |
| Garda World Security Corp. (A) | 8.250 | 08-01-32 | 65,000 | 66,703 | |
| Garda World Security Corp. (A) | 8.375 | 11-15-32 | 100,000 | 102,721 | |
| Q-Park Holding I BV | 5.125 | 02-15-30 | EUR | 100,000 | 121,389 |
| Reworld Holding Corp. (A) | 4.875 | 12-01-29 | 55,000 | 52,324 | |
| Reworld Holding Corp. | 5.000 | 09-01-30 | 80,000 | 75,611 | |
| Verisure Holding AB | 5.500 | 05-15-30 | EUR | 150,000 | 183,429 |
| Electrical equipment 0.2% | |||||
| EMRLD Borrower LP | 6.375 | 12-15-30 | EUR | 100,000 | 123,813 |
| TK Elevator Holdco GmbH | 6.625 | 07-15-28 | EUR | 90,000 | 106,281 |
| Ground transportation 0.1% | |||||
| Rumo Luxembourg Sarl | 4.200 | 01-18-32 | 200,000 | 179,250 | |
| Machinery 0.1% | |||||
| IMA Industria Macchine Automatiche SpA | 3.750 | 01-15-28 | EUR | 100,000 | 116,870 |
| Professional services 0.2% | |||||
| Amentum Holdings, Inc. (A) | 7.250 | 08-01-32 | 130,000 | 133,790 | |
| SEE NOTES TO FINANCIAL STATEMENTS | SEMIANNUAL REPORT | JOHN HANCOCK DIVERSIFIED INCOME FUND | 17 |
| Rate (%) | Maturity date | Par value^ | Value | ||
| Industrials (continued) | |||||
| Professional services (continued) | |||||
| House of HR Group BV | 9.000 | 11-03-29 | EUR | 100,000 | $116,366 |
| Trading companies and distributors 0.1% | |||||
| United Rentals North America, Inc. | 5.250 | 01-15-30 | 75,000 | 75,199 | |
| United Rentals North America, Inc. (A) | 6.125 | 03-15-34 | 50,000 | 51,501 | |
| Transportation infrastructure 0.3% | |||||
| Heathrow Finance PLC | 3.875 | 03-01-27 | GBP | 100,000 | 133,179 |
| Heathrow Finance PLC | 6.625 | 03-01-31 | GBP | 100,000 | 136,521 |
| Imola Merger Corp. (A) | 4.750 | 05-15-29 | 105,000 | 101,377 | |
| Information technology 1.1% | 1,540,307 | ||||
| Communications equipment 0.1% | |||||
| EchoStar Corp. (0.000% Cash and 6.750% PIK) | 6.750 | 11-30-30 | 147,784 | 134,872 | |
| EchoStar Corp. | 10.750 | 11-30-29 | 30,000 | 30,900 | |
| Electronic equipment, instruments and components 0.1% | |||||
| Insight Enterprises, Inc. (A) | 6.625 | 05-15-32 | 100,000 | 103,014 | |
| IT services 0.1% | |||||
| Fortress Intermediate 3, Inc. (A) | 7.500 | 06-01-31 | 145,000 | 151,904 | |
| Go Daddy Operating Company LLC (A) | 3.500 | 03-01-29 | 55,000 | 51,972 | |
| Software 0.8% | |||||
| Gen Digital, Inc. (A) | 6.750 | 09-30-27 | 75,000 | 76,328 | |
| Great Canadian Gaming Corp. (A) | 8.750 | 11-15-29 | 55,000 | 53,835 | |
| McAfee Corp. (A) | 7.375 | 02-15-30 | 320,000 | 302,203 | |
| Open Text Holdings, Inc. (A) | 4.125 | 02-15-30 | 225,000 | 212,651 | |
| Rocket Software, Inc. (A) | 6.500 | 02-15-29 | 150,000 | 145,543 | |
| TeamSystem SpA (3 month EURIBOR + 3.500%) (D) | 5.779 | 07-31-31 | EUR | 125,000 | 147,388 |
| UKG, Inc. (A) | 6.875 | 02-01-31 | 125,000 | 129,697 | |
| Materials 1.7% | 2,453,007 | ||||
| Chemicals 0.6% | |||||
| Avient Corp. (A) | 6.250 | 11-01-31 | 65,000 | 65,608 | |
| Mativ Holdings, Inc. (A) | 8.000 | 10-01-29 | 75,000 | 67,956 | |
| NOVA Chemicals Corp. (A) | 8.500 | 11-15-28 | 50,000 | 52,807 | |
| OCP SA | 6.750 | 05-02-34 | 200,000 | 207,158 | |
| Olympus Water US Holding Corp. | 9.625 | 11-15-28 | EUR | 200,000 | 247,370 |
| SNF Group SACA (A) | 4.500 | 03-15-32 | EUR | 100,000 | 121,009 |
| Windsor Holdings III LLC (A) | 8.500 | 06-15-30 | 135,000 | 144,670 | |
| Containers and packaging 0.7% | |||||
| Ardagh Metal Packaging Finance USA LLC | 3.000 | 09-01-29 | EUR | 100,000 | 105,604 |
| Ardagh Packaging Finance PLC | 2.125 | 08-15-26 | EUR | 100,000 | 112,322 |
| 18 | JOHN HANCOCK DIVERSIFIED INCOME FUND | SEMIANNUAL REPORT | SEE NOTES TO FINANCIAL STATEMENTS |
| Rate (%) | Maturity date | Par value^ | Value | ||
| Materials (continued) | |||||
| Containers and packaging (continued) | |||||
| Clydesdale Acquisition Holdings, Inc. (A) | 6.625 | 04-15-29 | 25,000 | $25,362 | |
| Clydesdale Acquisition Holdings, Inc. (A) | 6.875 | 01-15-30 | 40,000 | 40,891 | |
| Crown European Holdings SACA | 4.500 | 01-15-30 | EUR | 150,000 | 182,847 |
| LABL, Inc. (A) | 8.625 | 10-01-31 | 105,000 | 89,814 | |
| Mauser Packaging Solutions Holding Company (A) | 7.875 | 04-15-27 | 75,000 | 76,229 | |
| Mauser Packaging Solutions Holding Company (A) | 9.250 | 04-15-27 | 25,000 | 24,825 | |
| Owens-Brockway Glass Container, Inc. (A) | 7.375 | 06-01-32 | 135,000 | 137,542 | |
| Trivium Packaging Finance BV (A) | 6.625 | 07-15-30 | EUR | 100,000 | 121,816 |
| Metals and mining 0.4% | |||||
| Constellium SE | 5.375 | 08-15-32 | EUR | 100,000 | 119,293 |
| FMG Resources Proprietary, Ltd. (A) | 5.875 | 04-15-30 | 245,000 | 248,066 | |
| Novelis Corp. (A) | 4.750 | 01-30-30 | 55,000 | 52,700 | |
| WE Soda Investments Holding PLC | 9.375 | 02-14-31 | 200,000 | 209,118 | |
| Real estate 1.1% | 1,566,476 | ||||
| Hotel and resort REITs 0.2% | |||||
| Pebblebrook Hotel LP (A) | 6.375 | 10-15-29 | 120,000 | 120,645 | |
| Service Properties Trust | 4.375 | 02-15-30 | 100,000 | 84,090 | |
| Service Properties Trust | 4.950 | 10-01-29 | 50,000 | 43,630 | |
| Office REITs 0.4% | |||||
| Brandywine Operating Partnership LP | 4.550 | 10-01-29 | 125,000 | 117,733 | |
| Brandywine Operating Partnership LP | 8.300 | 03-15-28 | 50,000 | 53,609 | |
| Brandywine Operating Partnership LP | 8.875 | 04-12-29 | 75,000 | 81,200 | |
| Hudson Pacific Properties LP | 3.250 | 01-15-30 | 25,000 | 20,440 | |
| Hudson Pacific Properties LP | 4.650 | 04-01-29 | 220,000 | 197,662 | |
| Hudson Pacific Properties LP | 5.950 | 02-15-28 | 50,000 | 48,735 | |
| Piedmont Operating Partnership LP | 6.875 | 07-15-29 | 150,000 | 157,992 | |
| Real estate management and development 0.4% | |||||
| Canary Wharf Group Investment Holdings PLC | 3.375 | 04-23-28 | GBP | 100,000 | 124,291 |
| Heimstaden Bostad AB | 1.125 | 01-21-26 | EUR | 100,000 | 116,444 |
| Peach Property Finance GmbH | 4.375 | 11-15-25 | EUR | 160,000 | 182,818 |
| Samhallsbyggnadsbolaget I Norden Holding AB | 2.375 | 08-04-26 | EUR | 100,000 | 112,487 |
| Specialized REITs 0.1% | |||||
| GLP Pte, Ltd. (4.500% to 5-17-26, then 5 Year CMT + 3.735% to 5-17-31, then 5 Year CMT + 3.985% to 5-17-46, then 5 Year CMT + 4.735%) (E) | 4.500 | 05-17-26 | 200,000 | 104,700 | |
| SEE NOTES TO FINANCIAL STATEMENTS | SEMIANNUAL REPORT | JOHN HANCOCK DIVERSIFIED INCOME FUND | 19 |
| Rate (%) | Maturity date | Par value^ | Value | ||
| Utilities 0.4% | $554,560 | ||||
| Electric utilities 0.1% | |||||
| Energo-Pro AS (A) | 8.000 | 05-27-30 | EUR | 100,000 | 121,555 |
| Independent power and renewable electricity producers 0.2% | |||||
| Clearway Energy Operating LLC (A) | 3.750 | 02-15-31 | 200,000 | 183,644 | |
| Clearway Energy Operating LLC (A) | 4.750 | 03-15-28 | 50,000 | 49,404 | |
| Water utilities 0.1% | |||||
| Aegea Finance Sarl (A) | 6.750 | 05-20-29 | 200,000 | 199,957 | |
| Convertible bonds 0.3% | $455,304 | ||||
| (Cost $457,653) | |||||
| Consumer discretionary 0.1% | 98,336 | ||||
| Hotels, restaurants and leisure 0.1% | |||||
| NCL Corp., Ltd. | 2.500 | 02-15-27 | 50,000 | 49,925 | |
| Household durables 0.0% | |||||
| Meritage Homes Corp. | 1.750 | 05-15-28 | 50,000 | 48,411 | |
| Health care 0.1% | 212,408 | ||||
| Life sciences tools and services 0.1% | |||||
| Qiagen NV | 2.500 | 09-10-31 | 200,000 | 212,408 | |
| Information technology 0.0% | 46,210 | ||||
| Semiconductors and semiconductor equipment 0.0% | |||||
| ON Semiconductor Corp. | 0.500 | 03-01-29 | 50,000 | 46,210 | |
| Real estate 0.1% | 98,350 | ||||
| Industrial REITs 0.1% | |||||
| Rexford Industrial Realty LP (A) | 4.125 | 03-15-29 | 50,000 | 48,850 | |
| Rexford Industrial Realty LP (A) | 4.375 | 03-15-27 | 50,000 | 49,500 | |
| Term loans (F) 0.4% | $532,730 | ||||
| (Cost $514,874) | |||||
| Consumer discretionary 0.2% | 293,515 | ||||
| Household durables 0.1% | |||||
| CP Atlas Buyer, Inc., 2021 Term Loan B (1 month CME Term SOFR + 3.750%) | 8.177 | 11-23-27 | 199,393 | 198,479 | |
| Specialty retail 0.1% | |||||
| Specialty Building Products Holdings LLC, 2021 Term Loan B (1 month CME Term SOFR + 3.750%) | 8.177 | 10-15-28 | 99,743 | 95,036 | |
| Industrials 0.2% | 239,215 | ||||
| Building products 0.1% | |||||
| LBM Acquisition LLC, 2024 Incremental Term Loan B (1 month CME Term SOFR + 3.750%) | 8.162 | 06-06-31 | 99,497 | 92,657 | |
| 20 | JOHN HANCOCK DIVERSIFIED INCOME FUND | SEMIANNUAL REPORT | SEE NOTES TO FINANCIAL STATEMENTS |
| Rate (%) | Maturity date | Par value^ | Value | ||
| Industrials (continued) | |||||
| Electrical equipment 0.1% | |||||
| TK Elevator Midco GmbH, 2025 EUR Term Loan B1 (3 month EURIBOR + 3.250%) | 5.848 | 04-30-30 | EUR | 125,000 | $146,558 |
| Collateralized mortgage obligations 9.8% | $14,005,125 | ||||
| (Cost $14,096,412) | |||||
| Commercial and residential 6.1% | 8,670,536 | ||||
| ARZ Trust | |||||
| Series 2024-BILT, Class F (A) | 8.268 | 06-11-29 | 200,000 | 207,711 | |
| Barclays Mortgage Trust | |||||
| Series 2022-RPL1, Class B (4.250% to 2-25-26, then 7.250% to 2-25-27, then 8.250% thereafter) (A) | 4.250 | 02-25-28 | 570,000 | 553,301 | |
| BX Trust | |||||
| Series 2021-ARIA, Class G (1 month CME Term SOFR + 3.257%) (A)(D) | 7.569 | 10-15-36 | 665,000 | 659,615 | |
| Series 2025-GW, Class E (1 month CME Term SOFR + 3.650%) (A)(D) | 7.950 | 07-15-42 | 230,000 | 230,431 | |
| Commercial Mortgage Trust (Cantor Fitzgerald/Deutsche Bank AG) | |||||
| Series 2014-CR19, Class D (A)(G) | 4.661 | 08-10-47 | 374,784 | 359,793 | |
| Series 2015-LC19, Class D (A) | 2.867 | 02-10-48 | 150,000 | 135,759 | |
| Commercial Mortgage Trust (Deutsche Bank AG) | |||||
| Series 2024-CBM, Class D (A)(G) | 8.190 | 12-10-41 | 540,000 | 557,219 | |
| CSMC Trust | |||||
| Series 2020-NQM1, Class B1 (A)(G) | 4.462 | 05-25-65 | 445,000 | 410,200 | |
| Extended Stay America Trust | |||||
| Series 2021-ESH, Class F (1 month CME Term SOFR + 3.814%) (A)(D) | 8.126 | 07-15-38 | 407,421 | 407,421 | |
| JPMBB Commercial Mortgage Securities Trust | |||||
| Series 2014-C22, Class C (G) | 4.658 | 09-15-47 | 565,000 | 519,755 | |
| Series 2014-C23, Class D (A)(G) | 4.200 | 09-15-47 | 166,320 | 141,914 | |
| Series 2015-C28, Class D (A)(G) | 3.879 | 10-15-48 | 285,000 | 254,984 | |
| NYC Commercial Mortgage Trust | |||||
| Series 2025-3BP, Class E (1 month CME Term SOFR + 3.540%) (A)(D) | 7.851 | 02-15-42 | 310,000 | 305,778 | |
| PRET Trust | |||||
| Series 2025-RPL3, Class M1 (4.150% to 5-1-29, then 5.150% thereafter) (A) | 4.150 | 04-25-65 | 550,000 | 487,193 | |
| PRPM LLC | |||||
| Series 2024-7, Class A2 (8.835% to 11-25-27, then 11.835% to 11-25-28, then 12.835% thereafter) (A) | 8.835 | 11-25-29 | 500,000 | 502,722 | |
| SEE NOTES TO FINANCIAL STATEMENTS | SEMIANNUAL REPORT | JOHN HANCOCK DIVERSIFIED INCOME FUND | 21 |
| Rate (%) | Maturity date | Par value^ | Value | ||
| Commercial and residential (continued) | |||||
| Series 2024-8, Class A2 (8.836% to 12-25-27, then 11.836% to 12-25-28, then 12.836% thereafter) (A) | 8.836 | 12-25-29 | 400,000 | $399,699 | |
| RCO X Mortgage LLC | |||||
| Series 2025-1, Class A2 (8.353% to 1-25-28, then 12.353% to 1-25-29, then 13.353% thereafter) (A) | 8.353 | 01-25-30 | 400,000 | 402,705 | |
| RFR Trust | |||||
| Series 2025-SGRM, Class E (A)(G) | 7.513 | 03-11-41 | 215,000 | 217,733 | |
| ROCK Trust | |||||
| Series 2024-CNTR, Class E (A) | 8.819 | 11-13-41 | 500,000 | 526,039 | |
| TEXAS Commercial Mortgage Trust | |||||
| Series 2025-TWR, Class D (1 month CME Term SOFR + 3.091%) (A)(D) | 7.402 | 04-15-42 | 255,000 | 255,318 | |
| WBRK Mortgage Trust | |||||
| Series 2025-WBRK, Class E (A)(G) | 6.278 | 03-05-35 | 335,000 | 307,936 | |
| Wells Fargo Commercial Mortgage Trust | |||||
| Series 2015-C30, Class D (A)(G) | 4.644 | 09-15-58 | 532,500 | 515,810 | |
| Worldwide Plaza Trust | |||||
| Series 2017-WWP, Class A (A) | 3.526 | 11-10-36 | 300,000 | 211,500 | |
| X-Caliber Funding LLC | |||||
| Series 2025-VFN1, Class A (1 month CME Term SOFR + 2.808%) (A)(B)(D) | 7.130 | 07-01-27 | 100,000 | 100,000 | |
| U.S. Government Agency 3.7% | 5,334,589 | ||||
| Federal Home Loan Mortgage Corp. | |||||
| Series 2020-HQA2, Class B2 (30 day Average SOFR + 7.714%) (A)(D) | 12.020 | 03-25-50 | 600,000 | 726,557 | |
| Series 2021-MN3, Class B1 (30 day Average SOFR + 6.850%) (A)(D) | 11.155 | 11-25-51 | 500,000 | 529,375 | |
| Series 2023-MN6, Class B1 (30 day Average SOFR + 9.250%) (A)(D) | 13.555 | 05-25-43 | 500,000 | 566,228 | |
| Series 2024-MN8, Class M2 (30 day Average SOFR + 4.250%) (A)(D) | 8.555 | 05-25-44 | 400,000 | 417,526 | |
| Series K759, Class X3 IO | 5.435 | 02-25-57 | 1,875,891 | 521,002 | |
| Federal National Mortgage Association | |||||
| Series 2021-R01, Class 1B2 (30 day Average SOFR + 6.000%) (A)(D) | 10.305 | 10-25-41 | 490,000 | 511,519 | |
| Series 2021-R02, Class 2B2 (30 day Average SOFR + 6.200%) (A)(D) | 10.505 | 11-25-41 | 500,000 | 524,553 | |
| Series 2022-R04, Class 1B2 (30 day Average SOFR + 9.500%) (A)(D) | 13.805 | 03-25-42 | 370,000 | 411,940 | |
| 22 | JOHN HANCOCK DIVERSIFIED INCOME FUND | SEMIANNUAL REPORT | SEE NOTES TO FINANCIAL STATEMENTS |
| Rate (%) | Maturity date | Par value^ | Value | ||
| U.S. Government Agency (continued) | |||||
| Series 2022-R05, Class 2B2 (30 day Average SOFR + 7.000%) (A)(D) | 11.305 | 04-25-42 | 500,000 | $540,865 | |
| Series 2022-R07, Class 1B2 (30 day Average SOFR + 12.000%) (A)(D) | 16.306 | 06-25-42 | 500,000 | 585,024 | |
| Asset-backed securities 6.1% | $8,836,790 | ||||
| (Cost $8,870,165) | |||||
| Asset-backed securities 6.1% | 8,836,790 | ||||
| Affirm Asset Securitization Trust | |||||
| Series 2024-B, Class E (A) | 7.350 | 09-15-29 | 850,000 | 848,848 | |
| AGL CLO 16, Ltd. | |||||
| Series 2021-16A, Class ER (3 month CME Term SOFR + 4.650%) (A)(D) | 8.919 | 01-20-35 | 495,000 | 470,911 | |
| Avis Budget Rental Car Funding AESOP LLC | |||||
| Series 2023-3A, Class D (A) | 7.320 | 02-20-28 | 100,000 | 100,855 | |
| Series 2023-4A, Class D (A) | 7.310 | 06-20-29 | 130,000 | 130,791 | |
| Series 2023-5A, Class D (A) | 7.350 | 04-20-28 | 100,000 | 100,974 | |
| Bain Capital Credit CLO, Ltd. | |||||
| Series 2020-2A, Class ER (3 month CME Term SOFR + 6.872%) (A)(D) | 11.141 | 07-19-34 | 500,000 | 493,320 | |
| Carlyle Global Market Strategies CLO, Ltd. | |||||
| Series 2016-1A, Class DR3 (3 month CME Term SOFR + 6.250%) (A)(D) | 10.519 | 04-20-34 | 570,000 | 557,718 | |
| CIFC Funding, Ltd. | |||||
| Series 2013-4A, Class ER2 (3 month CME Term SOFR + 4.300%) (A)(D) | 8.583 | 04-27-31 | 495,000 | 490,065 | |
| ECAF I, Ltd. | |||||
| Series 2015-1A, Class A2 (A) | 4.947 | 06-15-40 | 509,789 | 456,286 | |
| Hertz Vehicle Financing III LLC | |||||
| Series 2023-3A, Class D (A) | 9.430 | 02-25-28 | 500,000 | 511,705 | |
| Series 2025-1A, Class D (A) | 7.980 | 09-25-29 | 250,000 | 249,255 | |
| Magnetite XlV, Ltd. | |||||
| Series 2025-45A, Class SUB (A)(G) | — | 04-15-38 | 250,000 | 223,440 | |
| Neuberger Berman Loan Advisers CLO 59, Ltd. | |||||
| Series 2024-59A, Class E (3 month CME Term SOFR + 4.800%) (A)(D) | 9.097 | 01-23-39 | 500,000 | 499,212 | |
| Palmer Square CLO, Ltd. | |||||
| Series 2021-4A, Class ER (3 month CME Term SOFR + 5.750%) (A)(D) | 10.046 | 07-15-38 | 550,000 | 550,000 | |
| SEE NOTES TO FINANCIAL STATEMENTS | SEMIANNUAL REPORT | JOHN HANCOCK DIVERSIFIED INCOME FUND | 23 |
| Rate (%) | Maturity date | Par value^ | Value | ||
| Asset-backed securities (continued) | |||||
| PRET LLC | |||||
| Series 2024-NPL6, Class A2 (8.716% to 10-25-28, then 12.716% thereafter) (A) | 8.716 | 10-25-54 | 260,000 | $258,089 | |
| Series 2025-NPL2, Class A2 (8.232% to 2-25-29, then 12.232% thereafter) (A) | 8.232 | 03-25-55 | 290,000 | 287,651 | |
| Series 2025-NPL6, Class A2 (8.715% to 6-25-29, then 12.715% thereafter) (A) | 8.715 | 06-25-55 | 105,000 | 105,010 | |
| RCO IX Mortgage LLC | |||||
| Series 2025-2, Class A2 (9.127% to 4-25-28, then 12.127% to 4-25-29, then 13.127% thereafter) (A) | 9.127 | 04-25-30 | 205,000 | 206,537 | |
| Santander Bank Auto Credit-Linked Notes | |||||
| Series 2024-A, Class F (A) | 10.171 | 06-15-32 | 682,032 | 692,974 | |
| Sunnova Helios IV Issuer LLC | |||||
| Series 2020-AA, Class A (A) | 2.980 | 06-20-47 | 223,583 | 194,267 | |
| Tricon Residential Trust | |||||
| Series 2025-SFR1, Class E (1 month CME Term SOFR + 2.500%) (A)(D) | 6.812 | 03-17-42 | 140,000 | 139,426 | |
| VOLT CV LLC | |||||
| Series 2021-CF2, Class A2 (5.316% to 11-25-25, then 9.316% thereafter) (A) | 5.316 | 11-27-51 | 517,997 | 510,109 | |
| VOLT CVI LLC | |||||
| Series 2021-NP12, Class A2 (5.438% to 12-25-25, then 9.438% thereafter) (A) | 5.438 | 12-26-51 | 516,078 | 508,972 | |
| Voya CLO, Ltd. | |||||
| Series 2018-3A, Class D (3 month CME Term SOFR + 3.262%) (A)(D) | 7.518 | 10-15-31 | 250,000 | 250,375 | |
| Par value^ | Value | ||||
| Escrow certificates 0.0% | $0 | ||||
| (Cost $194) | |||||
| Texas Competitive Electric Holdings Company LLC (B)(C) | 500,000 | 0 | |||
| 24 | JOHN HANCOCK DIVERSIFIED INCOME FUND | SEMIANNUAL REPORT | SEE NOTES TO FINANCIAL STATEMENTS |
| Par value^ | Value | ||||
| Short-term investments 5.8% | $8,300,000 | ||||
| (Cost $8,300,000) | |||||
| Repurchase agreement 5.8% | 8,300,000 | ||||
| Goldman Sachs Tri-Party Repurchase Agreement dated 6-30-25 at 4.400% to be repurchased at $8,301,014 on 7-1-25, collateralized by $241,150 Federal Home Loan Mortgage Corp., 2.000% due 2-1-36 (valued at $221,879) and $8,195,933 Federal National Mortgage Association, 5.500% due 12-1-52 (valued at $8,244,122) | 8,300,000 | 8,300,000 |
| Total investments (Cost $139,547,842) 98.8% | $141,750,011 | ||||
| Other assets and liabilities, net 1.2% | 1,652,547 | ||||
| Total net assets 100.0% | $143,402,558 | ||||
| The percentage shown for each investment category is the total value of the category as a percentage of the net assets of the fund unless otherwise indicated. | |
| ^All par values are denominated in U.S. dollars unless otherwise indicated. | |
| Currency Abbreviations | |
| EUR | Euro |
| GBP | Pound Sterling |
| Security Abbreviations and Legend | |
| ADR | American Depositary Receipt |
| CME | CME Group Published Rates |
| CMT | Constant Maturity Treasury |
| EURIBOR | Euro Interbank Offered Rate |
| GDR | Global Depositary Receipt |
| IO | Interest-Only Security - (Interest Tranche of Stripped Mortgage Pool). Rate shown is the annualized yield at the end of the period. |
| PIK | Pay-in-Kind Security - Represents a payment-in-kind which may pay interest in additional par and/or cash. Rates shown are the current rate and most recent payment rate. |
| SOFR | Secured Overnight Financing Rate |
| (A) | This security is exempt from registration under Rule 144A of the Securities Act of 1933, as amended. Such securities may be resold, normally to qualified institutional buyers, in transactions exempt from registration. Rule 144A securities amounted to $34,893,551 or 24.3% of the fund’s net assets as of 6-30-25. |
| (B) | Security is valued using significant unobservable inputs and is classified as Level 3 in the fair value hierarchy. Refer to Note 2 to the financial statements. |
| (C) | Non-income producing security. |
| (D) | Variable rate obligation. The coupon rate shown represents the rate at period end. |
| (E) | Perpetual bonds have no stated maturity date. Date shown as maturity date is next call date. |
| (F) | Term loans are variable rate obligations. The rate shown represents the rate at period end. |
| (G) | Variable or floating rate security, the interest rate of which adjusts periodically based on a weighted average of interest rates and prepayments on the underlying pool of assets. The interest rate shown is the current rate as of period end. |
| SEE NOTES TO FINANCIAL STATEMENTS | SEMIANNUAL REPORT | JOHN HANCOCK DIVERSIFIED INCOME FUND | 25 |
| Open contracts | Number of contracts | Position | Expiration date | Notional basis^ | Notional value^ | Unrealized appreciation (depreciation) |
| 2-Year U.S. Treasury Note Futures | 21 | Long | Sep 2025 | $4,352,261 | $4,368,492 | $16,231 |
| 5-Year U.S. Treasury Note Futures | 2 | Long | Sep 2025 | 217,799 | 218,000 | 201 |
| S&P 500 E-Mini Index Futures | 17 | Long | Sep 2025 | 5,127,726 | 5,315,688 | 187,962 |
| S&P Mid 400 E-Mini Index Futures | 7 | Long | Sep 2025 | 2,121,751 | 2,187,850 | 66,099 |
| U.S. Treasury Long Bond Futures | 1 | Long | Sep 2025 | 111,455 | 115,469 | 4,014 |
| Euro SCHATZ Futures | 7 | Short | Sep 2025 | (885,535) | (884,346) | 1,189 |
| German Euro BOBL Futures | 5 | Short | Sep 2025 | (695,492) | (693,106) | 2,386 |
| U.K. Long Gilt Bond Futures | 3 | Short | Sep 2025 | (378,052) | (383,093) | (5,041) |
| Ultra 10-Year U.S. Treasury Note Futures | 2 | Short | Sep 2025 | (224,434) | (228,531) | (4,097) |
| $268,944 |
| Contract to buy | Contract to sell | Counterparty (OTC) | Contractual settlement date | Unrealized appreciation | Unrealized depreciation | ||
| CHF | 1,290,000 | USD | 1,598,534 | MSI | 9/17/2025 | $42,959 | — |
| USD | 3,227,861 | CHF | 2,615,000 | GSI | 9/17/2025 | — | $(99,661) |
| USD | 8,088,426 | EUR | 7,003,300 | DB | 7/31/2025 | — | (176,926) |
| USD | 158,027 | EUR | 137,000 | SSB | 7/31/2025 | — | (3,661) |
| USD | 9,235,113 | EUR | 8,032,000 | DB | 9/17/2025 | — | (274,309) |
| USD | 1,742,763 | GBP | 1,298,400 | GSI | 7/31/2025 | — | (39,714) |
| USD | 26,040 | GBP | 19,000 | SSB | 7/31/2025 | — | (43) |
| USD | 1,768,742 | JPY | 253,000,000 | MSI | 9/17/2025 | — | (3,332) |
| $42,959 | $(597,646) | ||||||
| Credit default swaps - Buyer | ||||||||||
| Counterparty (OTC)/ Centrally cleared | Reference obligation | Notional amount | Currency | USD notional amount | Pay fixed rate | Fixed payment frequency | Maturity date | Unamortized upfront payment paid (received) | Unrealized appreciation (depreciation) | Value |
| Centrally cleared | HSBC Holdings PLC | 191,000 | EUR | $206,528 | 1.000% | Quarterly | Jun 2030 | $(477) | $(722) | $(1,199) |
| Centrally cleared | Volkswagen AG | 97,000 | EUR | 105,012 | 1.000% | Quarterly | Jun 2030 | 761 | 336 | 1,097 |
| $311,540 | $284 | $(386) | $(102) | |||||||
| Derivatives Currency Abbreviations | |
| CHF | Swiss Franc |
| EUR | Euro |
| GBP | Pound Sterling |
| 26 | JOHN HANCOCK DIVERSIFIED INCOME FUND | SEMIANNUAL REPORT | SEE NOTES TO FINANCIAL STATEMENTS |
| JPY | Japanese Yen |
| USD | U.S. Dollar |
| Derivatives Abbreviations | |
| DB | Deutsche Bank AG |
| GSI | Goldman Sachs International |
| MSI | Morgan Stanley & Co. International PLC |
| OTC | Over-the-counter |
| SSB | State Street Bank and Trust Company |
| SEE NOTES TO FINANCIAL STATEMENTS | SEMIANNUAL REPORT | JOHN HANCOCK DIVERSIFIED INCOME FUND | 27 |
| Assets | |
| Unaffiliated investments, at value (Cost $139,547,842) | $141,750,011 |
| Receivable for centrally cleared swaps | 7,503 |
| Unrealized appreciation on forward foreign currency contracts | 42,959 |
| Receivable for futures variation margin | 19,116 |
| Cash | 13,894 |
| Foreign currency, at value (Cost $412,625) | 414,086 |
| Collateral held at broker for futures contracts | 614,506 |
| Collateral segregated at custodian for OTC derivative contracts | 241,000 |
| Dividends and interest receivable | 1,274,258 |
| Receivable for investments sold | 667,691 |
| Other assets | 15,836 |
| Total assets | 145,060,860 |
| Liabilities | |
| Unrealized depreciation on forward foreign currency contracts | 597,646 |
| Payable for investments purchased | 980,310 |
| Payable to affiliates | |
| Accounting and legal services fees | 4,261 |
| Trustees’ fees | 463 |
| Other liabilities and accrued expenses | 75,622 |
| Total liabilities | 1,658,302 |
| Net assets | $143,402,558 |
| Net assets consist of | |
| Paid-in capital | $156,248,711 |
| Total distributable earnings (loss) | (12,846,153) |
| Net assets | $143,402,558 |
| Net asset value per share | |
| Based on 12,093,752 shares of beneficial interest outstanding - unlimited number of shares authorized with $0.01 par value | $11.86 |
| 28 | JOHN HANCOCK Diversified Income Fund | SEMIANNUAL REPORT | SEE NOTES TO FINANCIAL STATEMENTS |
| Investment income | |
| Dividends | $4,057,610 |
| Interest | 1,278,808 |
| Less foreign taxes withheld | (376,316) |
| Total investment income | 4,960,102 |
| Expenses | |
| Investment management fees | 668,997 |
| Accounting and legal services fees | 13,631 |
| Transfer agent fees | 8,108 |
| Trustees’ fees | 28,007 |
| Custodian fees | 30,019 |
| Printing and postage | 20,946 |
| Professional fees | 94,025 |
| Stock exchange listing fees | 11,769 |
| Other | 9,744 |
| Total expenses | 885,246 |
| Less expense reductions | (5,859) |
| Net expenses | 879,387 |
| Net investment income | 4,080,715 |
| Realized and unrealized gain (loss) | |
| Net realized gain (loss) on | |
| Unaffiliated investments and foreign currency transactions | 1,536,667 |
| Futures contracts | (1,527,430) |
| Forward foreign currency contracts | (1,127,820) |
| Swap contracts | 1,154 |
| (1,117,429) | |
| Change in net unrealized appreciation (depreciation) of | |
| Unaffiliated investments and translation of assets and liabilities in foreign currencies | 6,854,314 |
| Futures contracts | 154,960 |
| Forward foreign currency contracts | (1,253,499) |
| Swap contracts | (386) |
| 5,755,389 | |
| Net realized and unrealized gain | 4,637,960 |
| Increase in net assets from operations | $8,718,675 |
| SEE NOTES TO FINANCIAL STATEMENTS | SEMIANNUAL REPORT | JOHN HANCOCK Diversified Income Fund | 29 |
| Six months ended 6-30-25 (unaudited) | Year ended 12-31-24 | |
| Increase (decrease) in net assets | ||
| From operations | ||
| Net investment income | $4,080,715 | $6,339,952 |
| Net realized gain (loss) | (1,117,429) | 10,638,212 |
| Change in net unrealized appreciation (depreciation) | 5,755,389 | (4,689,141) |
| Increase in net assets resulting from operations | 8,718,675 | 12,289,023 |
| Distributions to shareholders | ||
| From earnings | (6,046,876)1 | (9,376,069) |
| From tax return of capital | — | (2,737,801) |
| Total distributions | (6,046,876) | (12,113,870) |
| Fund share transactions | ||
| Repurchased | — | (580,292) |
| Total increase (decrease) | 2,671,799 | (405,139) |
| Net assets | ||
| Beginning of period | 140,730,759 | 141,135,898 |
| End of period | $143,402,558 | $140,730,759 |
| Share activity | ||
| Shares outstanding | ||
| Beginning of period | 12,093,752 | 12,151,242 |
| Shares repurchased | — | (57,490) |
| End of period | 12,093,752 | 12,093,752 |
| 1 | A portion of the distributions may be deemed a tax return of capital at the fiscal year end. |
| 30 | JOHN HANCOCK Diversified Income Fund | SEMIANNUAL REPORT | SEE NOTES TO FINANCIAL STATEMENTS |
| Period ended | 6-30-251 | 12-31-24 | 12-31-23 | 12-31-22 | 12-31-21 | 12-31-20 |
| Per share operating performance | ||||||
| Net asset value, beginning of period | $11.64 | $11.61 | $11.73 | $13.04 | $12.76 | $14.85 |
| Net investment income2 | 0.34 | 0.52 | 0.51 | 0.56 | 0.53 | 0.39 |
| Net realized and unrealized gain (loss) on investments | 0.38 | 0.50 | 0.44 | (0.71) | 0.91 | (1.15) |
| Total from investment operations | 0.72 | 1.02 | 0.95 | (0.15) | 1.44 | (0.76) |
| Less distributions | ||||||
| From net investment income | (0.50)3 | (0.77) | (0.54) | (0.76) | (0.62) | (0.42) |
| From tax return of capital | — | (0.23) | (0.54) | (0.40) | (0.54) | (0.91) |
| Total distributions | (0.50) | (1.00) | (1.08) | (1.16) | (1.16) | (1.33) |
| Anti-dilutive impact of repurchase plan | — | 0.014 | 0.014 | — | — | — |
| Net asset value, end of period | $11.86 | $11.64 | $11.61 | $11.73 | $13.04 | $12.76 |
| Per share market value, end of period | $10.58 | $10.21 | $10.05 | $11.50 | $13.00 | $11.44 |
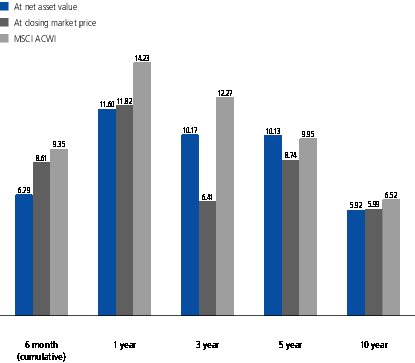
| Total return at net asset value (%)5,6 | 6.797 | 10.14 | 9.53 | (0.96) | 11.69 | (2.99) |
| Total return at market value (%)5 | 8.617 | 11.61 | (3.21) | (2.68) | 24.20 | (13.37) |
| Ratios and supplemental data | ||||||
| Net assets, end of period (in millions) | $143 | $141 | $141 | $144 | $159 | $156 |
| Ratios (as a percentage of average net assets): | ||||||
| Expenses before reductions | 1.268 | 1.21 | 1.23 | 1.17 | 1.17 | 1.18 |
| Expenses including reductions | 1.258 | 1.20 | 1.23 | 1.16 | 1.16 | 1.18 |
| Net investment income | 5.798 | 4.39 | 4.46 | 4.52 | 3.98 | 3.14 |
| Portfolio turnover (%) | 1169 | 197 | 124 | 163 | 120 | 117 |
| 1 | Six months ended 6-30-25. Unaudited. |
| 2 | Based on average daily shares outstanding. |
| 3 | A portion of the distributions may be deemed a tax return of capital at the fiscal year end. |
| 4 | The repurchase plan was completed at an average repurchase price of $10.09 for 57,490 and $9.51 for 87,303 shares for the periods ended 12-31-24 and 12-31-23, respectively. |
| 5 | Total return based on net asset value reflects changes in the fund’s net asset value during each period. Total return based on market value reflects changes in market value. Each figure assumes that distributions from income, capital gains and tax return of capital, if any, were reinvested. |
| 6 | Total returns would have been lower had certain expenses not been reduced during the applicable periods. |
| 7 | Not annualized. |
| 8 | Annualized. |
| 9 | Change in portfolio turnover rate resulted from repositioning of the portfolio during the period in accordance with investment policy changes approved by the Board of Trustees. |
| SEE NOTES TO FINANCIAL STATEMENTS | SEMIANNUAL REPORT | JOHN HANCOCK Diversified Income Fund | 31 |
| 32 | JOHN HANCOCK Diversified Income Fund | SEMIANNUAL REPORT |
| Total value at 6-30-25 | Level 1 quoted price | Level 2 significant observable inputs | Level 3 significant unobservable inputs | |
| Investments in securities: | ||||
| Assets | ||||
| Common stocks | ||||
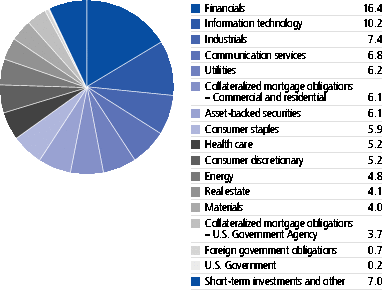
| Communication services | $6,127,875 | $2,218,276 | $3,909,599 | — |
| Consumer discretionary | 3,604,595 | 1,180,749 | 2,423,846 | — |
| Consumer staples | 7,714,481 | 4,994,357 | 2,720,124 | — |
| Energy | 4,499,164 | 3,192,508 | 1,306,656 | — |
| Financials | 20,931,387 | 8,503,357 | 12,428,030 | — |
| Health care | 5,362,925 | 4,425,275 | 937,650 | — |
| Industrials | 6,729,470 | 2,441,571 | 4,287,899 | — |
| Information technology | 12,532,145 | 7,816,360 | 4,715,785 | — |
| Materials | 3,270,057 | 1,371,205 | 1,898,852 | — |
| Real estate | 4,088,924 | 2,419,740 | 1,669,184 | — |
| Utilities | 8,291,217 | 670,117 | 7,621,100 | — |
| SEMIANNUAL REPORT | JOHN HANCOCK Diversified Income Fund | 33 |
| Total value at 6-30-25 | Level 1 quoted price | Level 2 significant observable inputs | Level 3 significant unobservable inputs | |
| Preferred securities | $1,166,146 | — | $1,166,146 | — |
| U.S. Government and Agency obligations | 318,665 | — | 318,665 | — |
| Foreign government obligations | 1,090,810 | — | 1,090,810 | — |
| Corporate bonds | 23,892,201 | — | 23,892,201 | — |
| Convertible bonds | 455,304 | — | 455,304 | — |
| Term loans | 532,730 | — | 532,730 | — |
| Collateralized mortgage obligations | 14,005,125 | — | 13,905,125 | $100,000 |
| Asset-backed securities | 8,836,790 | — | 8,836,790 | — |
| Escrow certificates | — | — | — | — |
| Short-term investments | 8,300,000 | — | 8,300,000 | — |
| Total investments in securities | $141,750,011 | $39,233,515 | $102,416,496 | $100,000 |
| Derivatives: | ||||
| Assets | ||||
| Futures | $278,082 | $278,082 | — | — |
| Forward foreign currency contracts | 42,959 | — | $42,959 | — |
| Swap contracts | 1,097 | — | 1,097 | — |
| Liabilities | ||||
| Futures | (9,138) | (9,138) | — | — |
| Forward foreign currency contracts | (597,646) | — | (597,646) | — |
| Swap contracts | (1,199) | — | (1,199) | — |
| Level 3 includes securities valued at $0. Refer to Fund’s investments. | ||||
| 34 | JOHN HANCOCK Diversified Income Fund | SEMIANNUAL REPORT |
| SEMIANNUAL REPORT | JOHN HANCOCK Diversified Income Fund | 35 |
| 36 | JOHN HANCOCK Diversified Income Fund | SEMIANNUAL REPORT |
| SEMIANNUAL REPORT | JOHN HANCOCK Diversified Income Fund | 37 |
| 38 | JOHN HANCOCK Diversified Income Fund | SEMIANNUAL REPORT |
| Risk | Statement of assets and liabilities location | Financial instruments location | Assets derivatives fair value | Liabilities derivatives fair value |
| Interest rate | Receivable/payable for futures variation margin1 | Futures | $24,021 | $(9,138) |
| Equity | Receivable/payable for futures variation margin1 | Futures | 254,061 | — |
| Currency | Unrealized appreciation (depreciation) on forward foreign currency contracts | Forward foreign currency contracts | 42,959 | (597,646) |
| Credit | Swap contracts, at value2 | Credit default swaps | 1,097 | (1,199) |
| $322,138 | $(607,983) |
| 1 | Reflects cumulative appreciation/depreciation on open futures as disclosed in the Derivatives section of the Fund’s investments. Only the period end variation margin receivable/payable is separately reported on the Statement of assets and liabilities. |
| 2 | Reflects cumulative value of swap contracts. Receivable/payable for centrally cleared swaps, which includes value and margin, are shown separately on the Statement of assets and liabilities. |
| SEMIANNUAL REPORT | JOHN HANCOCK Diversified Income Fund | 39 |
| Statement of operations location - Net realized gain (loss) on: | ||||
| Risk | Futures contracts | Forward foreign currency contracts | Swap contracts | Total |
| Interest rate | $(5,287) | — | — | $(5,287) |
| Currency | — | $(1,127,820) | — | (1,127,820) |
| Credit | — | — | $1,154 | 1,154 |
| Equity | (1,522,143) | — | — | (1,522,143) |
| Total | $(1,527,430) | $(1,127,820) | $1,154 | $(2,654,096) |
| Statement of operations location - Change in net unrealized appreciation (depreciation) of: | ||||
| Risk | Futures contracts | Forward foreign currency contracts | Swap contracts | Total |
| Interest rate | $14,883 | — | — | $14,883 |
| Currency | — | $(1,253,499) | — | (1,253,499) |
| Credit | — | — | $(386) | (386) |
| Equity | 140,077 | — | — | 140,077 |
| Total | $154,960 | $(1,253,499) | $(386) | $(1,098,925) |
| 40 | JOHN HANCOCK Diversified Income Fund | SEMIANNUAL REPORT |
| SEMIANNUAL REPORT | JOHN HANCOCK Diversified Income Fund | 41 |
| 42 | JOHN HANCOCK DIVERSIFIED INCOME FUND | SEMIANNUAL REPORT |
| SEMIANNUAL REPORT | JOHN HANCOCK DIVERSIFIED INCOME FUND | 43 |
| 44 | JOHN HANCOCK DIVERSIFIED INCOME FUND | SEMIANNUAL REPORT |
| Payment Date | Income Distributions1 |
| March 31, 2025 | $0.2500 |
| June 30, 2025 | 0.2500 |
| Total | $0.5000 |
| 1A portion of the distributions may be deemed a tax return of capital at the fiscal year end. |
| SEMIANNUAL REPORT | JOHN HANCOCK DIVERSIFIED INCOME FUND | 45 |
| Total votes for the nominee | Total votes withheld from the nominee | |
| Independent Trustees | ||
| William K. Bacic | 9,574,456.530 | 626,468.000 |
| Dean C. Garfield | 9,565,988.530 | 634,936.000 |
| Deborah C. Jackson | 9,566,382.530 | 634,542.000 |
| Thomas R. Wright | 9,574,556.530 | 626,368.000 |
| Non-Independent Trustee(s) | ||
| Andrew G. Arnott | 9,565,880.530 | 635,044.000 |
| 46 | JOHN HANCOCK DIVERSIFIED INCOME FUND | SEMIANNUAL REPORT |
| SEMIANNUAL REPORT | JOHN HANCOCK DIVERSIFIED INCOME FUND | 47 |
| (a) | the skills and competency with which the Advisor has in the past managed the fund’s affairs and its subadvisory relationship, the Advisor’s oversight and monitoring of the Subadvisor’s investment performance and compliance programs, such as the Subadvisor’s compliance with fund policies and objectives, review of brokerage matters, including with respect to trade allocation and best execution and the Advisor’s timeliness in responding to performance issues; |
| (b) | the background, qualifications and skills of the Advisor’s personnel; |
| (c) | the Advisor’s compliance policies and procedures and its responsiveness to regulatory changes and fund industry developments; |
| 48 | JOHN HANCOCK DIVERSIFIED INCOME FUND | SEMIANNUAL REPORT |
| (d) | the Advisor’s administrative capabilities, including its ability to supervise the other service providers for the fund, as well as the Advisor’s oversight of any securities lending activity, its monitoring of class action litigation and collection of class action settlements on behalf of the fund, and bringing loss recovery actions on behalf of the fund; |
| (e) | the financial condition of the Advisor and whether it has the financial wherewithal to provide a high level and quality of services to the fund; |
| (f) | the Advisor’s initiatives intended to improve various aspects of the fund’s operations and investor experience with the fund; and |
| (g) | the Advisor’s reputation and experience in serving as an investment advisor to the fund and the benefit to shareholders of investing in funds that are part of a family of funds offering a variety of investments. |
| (a) | reviewed information prepared by management regarding the fund’s performance; |
| (b) | considered the comparative performance of an applicable benchmark index; |
| (c) | considered the performance of comparable funds, if any, as included in the report prepared by an independent third-party provider of fund data; |
| (d) | took into account the Advisor’s analysis of the fund’s performance; and |
| (e) | considered the fund’s share performance and premium/discount information. |
| SEMIANNUAL REPORT | JOHN HANCOCK DIVERSIFIED INCOME FUND | 49 |
| (a) | reviewed financial information of the Advisor; |
| (b) | reviewed and considered information presented by the Advisor regarding the net profitability to the Advisor and its affiliates with respect to the fund; |
| (c) | received and reviewed profitability information with respect to the John Hancock Fund Complex as a whole and with respect to the fund; |
| (d) | received information with respect to the Advisor’s allocation methodologies used in preparing the profitability data and considered that the advisor hired an independent third-party consultant to provide an analysis of the Advisor’s allocation methodologies; |
| (e) | considered that the Advisor also provides administrative services to the fund on a cost basis pursuant to an administrative services agreement; |
| (f) | noted that the Advisor also derives reputational and other indirect benefits from providing advisory services to the fund; |
| (g) | noted that the subadvisory fees for the fund are paid by the Advisor and is negotiated at arm’s length; |
| (h) | considered the Advisor’s ongoing costs and expenditures necessary to improve services, meet new regulatory and compliance requirements, and adapt to other challenges impacting the fund industry; and |
| (i) | considered that the Advisor should be entitled to earn a reasonable level of profits in exchange for the level of services it provides to the fund and the risks that it assumes as Advisor, including entrepreneurial, operational, reputational, litigation and regulatory risk. |
| 50 | JOHN HANCOCK DIVERSIFIED INCOME FUND | SEMIANNUAL REPORT |
| (1) | information relating to the Subadvisor’s business, including current subadvisory services to the fund (and other funds in the John Hancock Fund Complex); |
| (2) | the historical and current performance of the fund and comparative performance information relating to an applicable benchmark index and comparable funds; |
| (3) | the subadvisory fee for the fund, and to the extent available, comparable fee information prepared by an independent third party provider of fund data; and |
| (4) | information relating to the nature and scope of any material relationships and their significance to the fund’s Advisor and Subadvisor. |
| SEMIANNUAL REPORT | JOHN HANCOCK DIVERSIFIED INCOME FUND | 51 |
| (1) | the Subadvisor has extensive experience and demonstrated skills as a manager; |
| (2) | the performance of the fund is being monitored and reasonably addressed, where appropriate; and |
| (3) | the subadvisory fees are reasonable in relation to the level and quality of services being provided under the Subadvisory Agreement. |
| 52 | JOHN HANCOCK DIVERSIFIED INCOME FUND | SEMIANNUAL REPORT |
| SEMIANNUAL REPORT | JOHN HANCOCK DIVERSIFIED INCOME FUND | 53 |
| You can also contact us: | ||
| 800-852-0218 | Regular mail: | Express mail: |
| jhinvestments.com | Computershare P.O. Box 43006 Providence, RI 02940-3078 | Computershare 150 Royall St., Suite 101 Canton, MA 02021 |
| 54 | JOHN HANCOCK DIVERSIFIED INCOME FUND | SEMIANNUAL REPORT |
| MF4618610 | P15SA 6/25 |
ITEM 2. CODE OF ETHICS.
Item is not applicable at this time.
ITEM 3. AUDIT COMMITTEE FINANCIAL EXPERT.
Item is not applicable at this time.
ITEM 4. PRINCIPAL ACCOUNTANT FEES AND SERVICES.
Item is not applicable at this time.
ITEM 5. AUDIT COMMITTEE OF LISTED REGISTRANTS.
Item is not applicable at this time.
ITEM 6. SCHEDULE OF INVESTMENTS.
(a)Refer to information included in Item 1.
(b)Not applicable.
ITEM 7. FINANCIAL STATEMENTS AND FINANCIAL HIGHLIGHTS FOR OPEN-END MANAGEMENT INVESTMENT COMPANIES. Not applicable.
ITEM 8. CHANGES IN AND DISAGREEMENTS WITH ACCOUNTANTS FOR OPEN-END MANAGEMENT INVESTMENT COMPANIES.
Not applicable.
ITEM 9. PROXY DISCLOSURE FOR OPEN-END MANAGEMENT INVESTMENT COMPANIES.
Not applicable.
ITEM 10. REMUNERATION PAID TO DIRECTORS, OFFICERS, AND OTHERS OF OPEN-END MANAGEMENT INVESTMENT COMPANIES.
Not applicable.
ITEM 11. STATEMENT REGARDING BASIS FOR APPROVAL OF INVESTMENT ADVISORY CONTRACT. Information included in Item 1, if applicable.
ITEM 12. DISCLOSURE OF PROXY VOTING POLICIES AND PROCEDURES FOR CLOSED-END MANAGEMENT INVESTMENT COMPANIES.
Item is not applicable at this time.
ITEM 13. PORTFOLIO MANAGERS OF CLOSED-END MANAGEMENT INVESTMENT COMPANIES.
(a)Item is not applicable at this time
(b)Item is not applicable at this time
ITEM 14. PURCHASES OF EQUITY SECURITIES BY CLOSED-END MANAGEMENT INVESTMENT COMPANY AND AFFILIATED PURCHASERS.
(a)Not applicable.
(b)REGISTRANT PURCHASES OF EQUITY SECURITIES
|
|
Total |
|
|
|
|
|
number of |
|
Total number of shares |
Maximum number of shares that |
|
|
shares |
|
purchased as part of publicly |
may yet be purchased under the |
|
Period |
purchased |
Average price per share |
announced plans* |
plans* |
|
Jan-25 |
- |
- |
- |
1,209,375 |
|
Feb-25 |
- |
- |
- |
1,209,375 |
|
Mar-25 |
- |
- |
- |
1,209,375 |
|
Apr-25 |
- |
- |
- |
1,209,375 |
|
May-25 |
- |
- |
- |
1,209,375 |
|
Jun-25 |
- |
- |
- |
1,209,375 |
|
Total |
- |
- |
- |
|
*In December 2011, the Board of Trustees approved a share repurchase plan, which was subsequently reviewed by the Board of Trustees each year in December. Under the current share repurchase plan, the Fund may purchase in the open market up to 10% of its outstanding common shares as of December 31, 2024. The current plan is in effect between January 1, 2025 and December 31, 2025.
ITEM 15. SUBMISSION OF MATTERS TO A VOTE OF SECURITY HOLDERS.
No material changes.
ITEM 16. CONTROLS AND PROCEDURES.
(a)Based upon their evaluation of the registrant's disclosure controls and procedures as conducted within 90 days of the filing date of this Form N-CSR, the registrant's principal executive officer and principal financial officer have concluded that those disclosure controls and procedures provide reasonable assurance that the material information required to be disclosed by the registrant on this report is recorded, processed, summarized and reported within the time periods specified in the Securities and Exchange Commission's rules and forms.
(b)There were no changes in the registrant's internal control over financial reporting that occurred during the period covered by this report that have materially affected, or are reasonably likely to materially affect, the registrant's internal control over financial reporting.
ITEM 17. DISCLOSURE OF SECURITIES LENDING ACTIVITIES FOR CLOSED-END MANAGEMENT INVESTMENT COMPANIES.
Not applicable.
ITEM 18. RECOVERY OF ERRONEOUSLY AWARDED COMPENSATION.
Not applicable.
ITEM 19. EXHIBITS.
(a)(1) Not applicable.
(a)(2) Not applicable.
SIGNATURES
Pursuant to the requirements of the Securities Exchange Act of 1934 and the Investment Company Act of 1940, the registrant has duly caused this report to be signed on its behalf by the undersigned, thereunto duly authorized.
John Hancock Diversified Income Fund (formerly John Hancock Hedged Equity & Income Fund)
By:
/s/ Kristie M. Feinberg
Kristie M. Feinberg
President,
Principal Executive Officer
Date: August 12, 2025
Pursuant to the requirements of the Securities Exchange Act of 1934 and the Investment Company Act of 1940, this report has been signed below by the following persons on behalf of the registrant and in the capacities and on the dates indicated.
By:
/s/ Kristie M. Feinberg
Kristie M. Feinberg
President,
Principal Executive Officer
Date: August 12, 2025
By:
/s/ Fernando A. Silva
Fernando A. Silva
Chief Financial Officer,
Principal Financial Officer
Date: August 12, 2025