Please wait

Graphic

Walker & Dunlop Reports Second Quarter 2026 Financial Results

BETHESDA, MD – AUGUST 6, 2026Walker & Dunlop, Inc. (NYSE: WD) (the “Company”, “Walker & Dunlop” or “W&D”) reported second quarter 2026 financial results.

KEY FINANCIAL METRICS

Total transaction volume of $14.4 billion, up 3% from Q2’25
Total revenues of $306.7 million, down 4% from Q2’25
Net income of $3.0 million and diluted earnings per share of $0.09, both down 91% from Q2’25
Adjusted core EPS(1) of $1.19, up 3% from Q2’25
Servicing portfolio of $145.8 billion as of June 30, 2026, up 6% from June 30, 2025
Year-to-date GSE market share is 14.7%, compared to 11.2% in 2025

“Walker & Dunlop continues to demonstrate the strength and resilience of our commercial real estate capital markets platform by gaining market share with the GSEs, expanding our capital markets capabilities, and generating durable, recurring cash flows from our servicing and asset management businesses,” said Willy Walker, Chairman and CEO.

“While our Q2 financial results reflect the impact of the legacy repurchases and associated credit marks, we are nearing the conclusion of these reviews which have strengthened our underwriting processes along with our partnerships with Fannie Mae and Freddie Mac. The GSE’s have a tremendous amount of lending capacity for the remainder of 2026, and after expanding W&D’s market share by 3.5% in the first half of 2026 to 15%, we see plenty of opportunity going forward.”

Walker continued, “Our focus now firmly turns to the Journey to ’30, our five-year strategic growth plan to become the best commercial real estate capital markets company in the world by expanding the services we offer, the depth of our client relationships, and generating long-term value for our shareholders.”

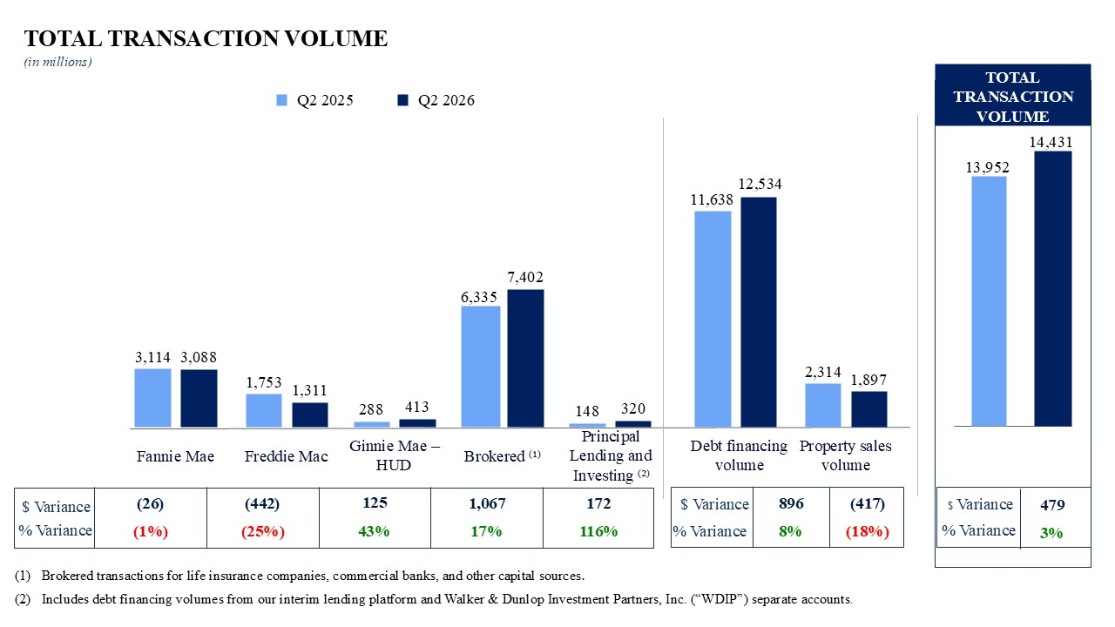
The Capital Markets team generated $14.4 billion of total transaction volume, up 3% from a year ago. Debt financing volume increased 8%, led by 43% growth in HUD originations and 17% growth in brokered lending, reflecting the continued expansion of capital relationships beyond the Agencies. The servicing portfolio grew 6%, to $145.8 billion, providing durable recurring revenue and cash flow while deepening the client relationships that create future financing and advisory opportunities.

Year-to-date, debt financing volume increased 44% to $24.3 billion within a complex macroeconomic and interest rate environment, reinforcing our confidence in the long-term earnings power of Walker & Dunlop’s platform as improving market activity continues to create opportunities across the business.

Results this quarter include $23.2 million of operating and credit-related expenses associated with legacy indemnified and repurchased loans. A large of portion of these charges is concentrated in loans associated with a small number of fraudulent sponsors we previously identified. These charges do not reflect new or increasing repurchase exposure in our overall portfolio. We are actively executing our disposition strategy for the repurchased loan portfolio, reducing that exposure by $39.4 million since quarter end to $153.8 million, and we have $41.7 million of credit-related reserves against that remaining portfolio.


1


Graphic

Second quarter 2026 Earnings Release

(1)Adjusted core EPS is a non-GAAP financial measure the Company presents to help investors better understand our operating performance. For a reconciliation of Adjusted core EPS to diluted EPS, refer to the sections of this press release below titled “Non-GAAP Financial Measures” and “Adjusted Core EPS Reconciliation.”

Graphic

Total transaction volume increased 3%, to $14.4 billion, as transaction activity remained healthy across the commercial real estate market.
Although GSE debt financing volumes decreased 10% year over year, our market share with the GSEs increased year over year.
Growth in brokered lending reflects strong lender participation across numerous third-party capital sources during the quarter, demonstrating the availability of capital at this time in the cycle, and the breadth of our financing capabilities across executions and property types.
Property sales volume remained active despite continued market volatility, as investment decisions across the multifamily sector continued to be influenced by operating fundamentals, interest rate expectations and transaction timing.

FINANCIAL RESULTS - CAPITAL MARKETS ("CM")

Three months ended June 30,

(in millions, unless otherwise noted)

  ​ ​ ​

2026

  ​ ​ ​

2025

  ​ ​ ​

% Change


Total revenues

$

169

$

173

(2)

%

Total expenses

131

127

3

Walker & Dunlop net income (loss)

$

30

$

33

(10)

%

Key revenue metrics:

Origination fee rate (1)

0.74

%

0.82

%

Agency MSR rate (2)

0.99

1.03

2


Graphic

Second quarter 2026 Earnings Release


The table above excludes income tax expense (benefit) and income or loss from noncontrolling interests and temporary equity holders.

(1)Loan origination and debt brokerage fees, net (“Origination fees”) as a percentage of debt financing volume. Excludes the income and debt financing volume from Principal Lending and Investing.
(2)Fair value of expected net cash flows from servicing, net of guaranty obligation (“MSR income”) as a percentage of Agency debt financing volume.

Revenues declined 2% primarily due to a greater mix of brokered transactions relative to GSE lending and a corresponding reduction to MSR income.
Brokered activity increased 17% supporting the overall performance of the segment, while reflecting the scale of our capital relationships beyond the GSEs – an important driver of our long-term growth strategy. Although GSE lending volumes declined this quarter, this was driven by transaction timing, as our overall market share has increased 350 basis points year-to-date to 14.7%. Other highlights for the segment include:
Net warehouse interest (expense) income improved to income in the current quarter, reflecting the normalization of the yield curve for the first time since the Great Tightening began.
Improvement in other revenues was driven by investment banking, appraisal and valuation services, and application fees.

MANAGED PORTFOLIO

(dollars in millions, unless otherwise noted)

Q2 2026

Q1 2026

Q4 2025

Q3 2025

Q2 2025

Fannie Mae

$

74,141

$

73,499

$

72,708

$

71,006

$

70,043

Freddie Mac

45,516

44,836

42,595

40,473

39,433

Ginnie Mae - HUD

11,890

11,647

11,563

11,298

11,008

Brokered

14,234

16,385

17,111

16,554

16,865

Principal Lending and Investing

18

18

-

-

-

Total Servicing Portfolio

$

145,799

$

146,385

$

143,977

$

139,331

$

137,349

Assets under management

18,675

18,531

18,631

18,522

18,623

Total Managed Portfolio

$

164,474

$

164,916

$

162,608

$

157,853

$

155,972

Weighted-average servicing fee rate at period end (basis points)

23.4

23.4

23.6

24.0

24.1

Weighted-average remaining servicing portfolio term at period end (years)

7.1

7.1

7.2

7.4

7.4

Continued origination activity over the past year expanded the servicing portfolio to $145.8 billion, further strengthening the recurring revenue and cash flow that supports our long term earnings growth. The portfolio also creates future opportunities to refinance, recapitalize and deepen client relationships as loans mature over time.
Agency production over the past 12 months was the main driver for the addition of more than $8 billion of net loans to the servicing portfolio. Approximately $14.9 billion of Agency loans are scheduled to mature over the next two years, providing a meaningful pipeline of client engagement opportunities to support future transaction activity. The decline in brokered servicing was primarily driven by a large partner consolidating their servicing relationships. Although we bid on the opportunity, we were not selected. We will continue to source and originate deals on behalf of that lender.
Mortgage servicing rights (“MSRs”) continue to deliver significant long-term value. As of June 30, 2026, MSRs associated with our servicing portfolio are reported at an amortized cost of $793.4 million, while the fair value is estimated at $1.4 billion, reflecting the inherent value of the long-term contractual nature of these assets and the recurring servicing and ancillary revenues they generate.
Assets under management totaled $18.7 billion as of June 30, 2026, and consisted of $16.0 billion of low-income housing tax credit (“LIHTC”) funds managed by our affordable housing investment management team, $1.8 billion of debt funds, and $0.9 billion of equity funds managed by our registered investment advisor, WDIP.

FINANCIAL RESULTS - SERVICING & ASSET MANAGEMENT ("SAM")

Three months ended June 30,

(in millions)

  ​ ​ ​

2026

  ​ ​ ​

2025

  ​ ​ ​

% Change


Total revenues

$

134

$

141

(5)

%

Total expenses

124

98

27

Walker & Dunlop net income (loss)

$

8

$

38

(77)

%

3


Graphic

Second quarter 2026 Earnings Release


The table above excludes income tax expense (benefit) and income or loss from noncontrolling interests and temporary equity holders.

The Servicing & Asset Management segment continues to benefit from the stable recurring earnings and cash flow from the servicing portfolio.
Revenue declined year over year, primarily due to the timing of earnings recognized from joint venture investments in our affordable business, while the recurring servicing fees of the managed portfolio continued to steadily grow. The underlying fundamentals of the servicing platform remain strong, and continued execution from our Capital Markets business in the coming quarters should drive additional servicing portfolio expansion as we move through the year.
Segment results continue to be influenced by our portfolio of indemnified and repurchased loans. That portfolio increased year over year, leading to higher operating costs and credit-related losses.

KEY CREDIT TRENDS

(in millions, unless otherwise noted)

Q2 2026

Q1 2026

Q4 2025

Q3 2025

Q2 2025

Defaulted loans (1)

$

199

$

167

$

159

$

139

$

109

Key credit metrics (as a % of the at-risk portfolio (1)):

Defaulted loans

0.28

%

0.24

%

0.23

%

0.21

%

0.17

%

Allowance for risk-sharing

0.07

0.06

0.05

0.05

0.05

Key credit metrics (as a % of maximum exposure (1)):

Allowance for risk-sharing

0.34

%

0.27

%

0.27

%

0.25

%

0.25

%


(1)Please refer to the appendix for details on “Key Credit Metrics.”
The at-risk servicing portfolio continues to demonstrate strong underlying credit performance with low levels of delinquency. Growth in the at-risk portfolio reflects continued Fannie Mae loan production over the past year, while our credit exposure remains concentrated on loans backed by multifamily assets.
Based on the latest property level financial information available, our at-risk portfolio is operating at a weighted average debt service coverage ratio two times, and the average underwritten loan-to-value is approximately 61%. Less than 5% of our loans are below a 1.0 times debt service coverage ratio, and were underwritten above a 75% loan-to-value.

FINANCIAL RESULTS - CORPORATE

Three months ended June 30,

(in millions)

  ​ ​ ​

2026

  ​ ​ ​

2025

  ​ ​ ​

% Change


Total revenues

$

4

$

6

(25)

%

Total expenses

49

48

2

Walker & Dunlop net income (loss)

$

(35)

$

(37)

(4)

%


The table above excludes income tax expense (benefit).

The Corporate segment is structured to support continued scaling of our business. Corporate results this quarter reflect our disciplined expense management as the segment continues to support revenue growth in our Capital Markets and Servicing & Asset Management businesses.

4


Graphic

Second quarter 2026 Earnings Release

INDEMNIFIED AND REPURCHASED LOANS

Three Months Ended June 30,

Six Months Ended June 30,

(in millions)

2026

2025

2026

2025

Initial loan repurchase costs

$

$

$

1

$

Indemnified and repurchased loan operating costs

5

1

7

1

Expected principal losses on loan repurchase ("loan repurchase losses")

2

9

Indemnified and repurchased loan expenses

$

7

$

1

$

17

$

1

Provision (benefit) for loan losses (1)

$

11

$

1

$

13

$

1

Provision (benefit) for risk-sharing obligations (2)

6

6

Other operating expenses (3)

2

Other interest income (4)

(1)

(2)

Total net expense impact of indemnified and repurchased loans

$

23

$

2

$

36

$

2


(1)Included as a component of Provision (benefit) for credit losses in the Condensed Consolidated Statements of Income.
(2)Included as a component of Provision (benefit) for credit losses in the Condensed Consolidated Statements of Income. Reflects the impact on the provision for risk-sharing obligations for our agreement with Fannie Mae to increase our loss sharing on $15.9 million of defaulted loans in lieu of repurchasing them.
(3)Impairment charges related to an Other real estate owned (OREO) asset that was previously repurchased and included as a component of Other operating expenses in the Condensed Consolidated Statements of Income.
(4)Included as a component of Placement fees and other interest income in the Condensed Consolidated Statements of Income.

Total repurchased loans declined to $193.3 million as of June 30, 2026, down from $221.6 million as of December 31, 2025. Since the end of the second quarter, we exited $39.4 million of loans at prices that approximated our estimates, reducing our remaining repurchase exposure to $153.8 million, against which we have $41.7 million of reserves.
Of the $23.2 million of operating and credit-related charges this quarter, $18.0 million were credit-related. The credit-related charges were concentrated in loans associated with a small number of fraudulent sponsors we previously identified and were largely driven by the default of a previously repurchased portfolio of loans, and an agreement to increase our loss-sharing with Fannie Mae on a $15.9 million defaulted portfolio of loans in lieu of repurchasing them.
Last year, we began a fraud investigation in coordination with Freddie Mac that identified a small group of fraudulent sponsors. 95% of the credit-related losses we have taken against our repurchased loans are associated with those sponsors. During the second quarter, we concluded that investigation with Freddie Mac, and we do not expect any further repurchases associated with the investigation.
We are actively executing our disposition strategy to reduce our repurchase exposure. We expect to fully exit the remaining assets in this portfolio by early next year, and any future credit-related losses will be driven by the difference between the ultimate selling prices relative to our current estimates.

CAPITAL SOURCES AND USES

On August 5, 2026, the Company’s Board of Directors declared a dividend of $0.68 per share for the third quarter of 2026. The dividend will be paid on September 3, 2026, to all holders of record of the Company’s restricted and unrestricted common stock as of August 20, 2026.

On February 13, 2026, our Board of Directors authorized the repurchase of up to $75.0 million of the Company’s outstanding common stock over a 12-month period starting from February 26, 2026 (the “2026 Stock Repurchase Program”). During the first quarter of 2026, the Company repurchased 283 thousand shares under the 2026 Stock Repurchase Program at a weighted-average price of $47.13 per share and immediately retired the shares, reducing stockholders’ equity by $13.3 million. The Company did not repurchase any shares during the second quarter of 2026. As of June 30, 2026, the Company had $61.7 million of authorized share repurchase capacity remaining under the 2026 Stock Repurchase Program.

Any repurchases made pursuant to the 2026 Stock Repurchase Program will be made in the open market or in privately negotiated transactions, from time to time, as permitted by federal securities laws and other legal requirements. The timing, manner, price and amount of any repurchases will be determined by the Company in its discretion and will be subject to economic and market conditions, stock price, applicable legal requirements and other factors. The repurchase program may be suspended or discontinued at any time.

5


Graphic

Second quarter 2026 Earnings Release

CONFERENCE CALL INFORMATION

Listeners can access the Company’s quarterly conference call for more information regarding our financial results via the dial-in number and webcast link below. Presentation materials related to the conference call will be posted to the Investor Relations section of the Company’s website prior to the call. An audio replay will also be available on the Investor Relations section of the Company’s website, along with the presentation materials.

Earnings Call:

Thursday, August 6, 2026, at 8:30 a.m. EDT

Phone:

(800) 330-6710 from within the United States; (312) 471-1353 from outside the United States

Confirmation Code:

3173235

Webcast Link:

https://event.webcasts.com/starthere.jsp?ei=1752016&tp_key=91f9b11ccb

ABOUT WALKER & DUNLOP

Walker & Dunlop (NYSE: WD) is one of the largest commercial real estate finance and advisory services firms in the United States and internationally. Our ideas and capital create communities where people live, work, shop, and play. Our innovative people, breadth of our brand, and our technological capabilities make us one of the most insightful and client-focused firms in the commercial real estate industry.

NON-GAAP FINANCIAL MEASURES

To supplement our financial statements presented in accordance with United States generally accepted accounting principles (“GAAP”), the Company uses adjusted EBITDA, adjusted core net income, and adjusted core EPS, which are non-GAAP financial measures. The presentation of these non-GAAP financial measures is not intended to be considered in isolation or as a substitute for, or superior to, the financial information prepared and presented in accordance with GAAP. When analyzing our operating performance, readers should use adjusted EBITDA, adjusted core net income, and adjusted core EPS in addition to, and not as an alternative for, net income and diluted EPS.

Adjusted core net income and adjusted core EPS represent net income adjusted for amortization and depreciation, provision (benefit) for credit losses, net write-offs based on the final resolution of the defaulted loans or collateral, the fair value of expected net cash flows from servicing, net of guaranty obligation, the income statement impact from periodic revaluation and accretion associated with contingent consideration liabilities related to acquired companies, goodwill impairment, loan repurchase losses and other adjustments. Adjusted EBITDA represents net income before income taxes, interest expense on our corporate debt, and amortization and depreciation, adjusted for provision (benefit) for credit losses, net write-offs based on the final resolution of the defaulted loans or collateral, loan repurchase losses, stock-based compensation, the fair value of expected net cash flows from servicing, net of guaranty obligation, the write-off of the unamortized balance of deferred issuance costs associated with the repayment of a portion of our corporate debt, goodwill impairment, and contingent consideration liability fair value adjustments when the fair value adjustment is a triggering event for a goodwill impairment assessment. Furthermore, adjusted EBITDA is not intended to be a measure of free cash flow for our management’s discretionary use, as it does not reflect certain cash requirements such as tax and debt service payments. The amounts shown for adjusted EBITDA may also differ from the amounts calculated under similarly titled definitions in our debt instruments, which are further adjusted to reflect certain other cash and non-cash charges that are used to determine compliance with financial covenants. Because not all companies use identical calculations, our presentation of adjusted EBITDA, adjusted core net income and adjusted core EPS may not be comparable to similarly titled measures of other companies.

We use adjusted EBITDA, adjusted core net income, and adjusted core EPS to evaluate the operating performance of our business, for comparison with forecasts and strategic plans and for benchmarking performance externally against competitors. We believe that these non-GAAP measures, when read in conjunction with the Company’s GAAP financial information, provide useful information to investors by offering:

the ability to make more meaningful period-to-period comparisons of the Company’s on-going operating results;
the ability to better identify trends in the Company’s underlying business and perform related trend analyses; and
a better understanding of how management plans and measures the Company’s underlying business.

6


Graphic

Second quarter 2026 Earnings Release

We believe that these non-GAAP financial measures have limitations in that they do not reflect all of the amounts associated with the Company’s results of operations as determined in accordance with GAAP and that these non-GAAP financial measures should only be used to evaluate the Company’s results of operations in conjunction with the Company’s GAAP financial information. For more information on adjusted EBITDA, adjusted core net income, and adjusted core EPS, refer to the section of this press release below titled “Adjusted Financial Measure Reconciliation to GAAP.”

FORWARD-LOOKING STATEMENTS

Some of the statements contained in this press release may constitute forward-looking statements within the meaning of the federal securities laws. Forward-looking statements relate to expectations, projections, plans and strategies, anticipated events or trends and similar expressions concerning matters that are not historical facts. In some cases, you can identify forward-looking statements by the use of forward-looking terminology such as “may,” “will,” “should,” “expects,” “intends,” “plans,” “anticipates,” “believes,” “estimates,” “predicts,” or “potential” or the negative of these words and phrases or similar words or phrases that are predictions of or indicate future events or trends and which do not relate solely to historical matters. You can also identify forward-looking statements by discussions of strategy, plans, or intentions. The forward-looking statements contained in this press release reflect our current views about future events and are subject to numerous known and unknown risks, uncertainties, assumptions and changes in circumstances that may cause actual results to differ significantly from those expressed or contemplated in any forward-looking statement.

While forward-looking statements reflect our good faith projections, assumptions and expectations, they are not guarantees of future results. Furthermore, we disclaim any obligation to publicly update or revise any forward-looking statement to reflect changes in underlying assumptions or factors, new information, data or methods, future events or other changes, except as required by applicable law. Factors that could cause our results to differ materially include, but are not limited to: (1) general economic conditions and multifamily and commercial real estate market conditions, (2) changes in interest rates, (3) regulatory and/or legislative changes to Freddie Mac, Fannie Mae or HUD, (4) our ability to retain and attract loan originators and other professionals, (5) success of our various investments funded with corporate capital, (6) changes in federal government fiscal and monetary policies, including any constraints or cuts in federal funds allocated to HUD for loan originations, and (7) our obligations to repurchase or indemnify the GSEs for loans we originate under their programs, including additional charges or losses related to loans we have already repurchased or indemnified and new repurchase requests we may receive from the GSEs related to the previously identified instances of borrower fraud, additional instances of borrower fraud, or other reasons.

For a further discussion of these and other factors that could cause future results to differ materially from those expressed or contemplated in any forward-looking statements, see the section titled “Risk Factors” in our most recent Annual Report on Form 10-K and any updates or supplements in subsequent Quarterly Reports on Form 10-Q and our other filings with the SEC. Such filings are available publicly on our Investor Relations web page at www.walkerdunlop.com.

CONTACT US

Headquarters:

7272 Wisconsin Avenue, Suite 1300

Bethesda, Maryland 20814

Phone 301.215.5500

info@walkeranddunlop.com

Investors:

Amy Hopkins

SVP, Investor Relations

Phone 443.873.5536

investorrelations@walkeranddunlop.com

Media:

Carol McNerney

Chief Marketing Officer

Phone 301.215.5515

info@walkeranddunlop.com

7


Graphic

Second quarter 2026 Earnings Release

Graphic

Walker & Dunlop, Inc. and Subsidiaries

Condensed Consolidated Balance Sheets

Unaudited

June 30, 

  ​ ​ ​

March 31,

  ​ ​ ​

December 31,

  ​ ​ ​

September 30,

  ​ ​ ​

June 30, 

(in thousands)

2026

2026

2025

2025

2025

Assets

Cash and cash equivalents

$

160,858

$

192,527

$

299,315

$

274,828

$

233,712

Restricted cash


25,782


34,419


22,772


44,462


41,090

Pledged securities, at fair value


234,525


228,646


224,954


221,730


218,435

Loans held for sale, at fair value


1,382,958


2,546,860


1,436,350


2,197,739


1,177,837

Mortgage servicing rights


793,351


795,754


808,145


805,975


817,814

Goodwill

868,710

868,710

868,710

868,710

868,710

Other intangible assets


134,369


138,123


141,877


145,631


149,385

Receivables, net


476,851


424,393


419,358


374,316


360,646

Committed investments in tax credit equity

170,671

265,368

241,401

257,564

194,479

Other assets


645,529


670,660


596,596


606,320


612,932

Total assets

$

4,893,604

$

6,165,460

$

5,059,478

$

5,797,275

$

4,675,040

Liabilities

Warehouse notes payable

$

1,384,282

$

2,535,227

$

1,420,272

$

2,175,157

$

1,157,234

Corporate notes payable


820,948


825,816


829,218


829,909


828,657

Allowance for risk-sharing obligations


49,081


38,673


37,546


34,140


33,191

Commitments to fund investments in tax credit equity

174,093

256,121

219,949

223,788

168,863

Other liabilities

744,448

775,837

806,631

756,815

725,297

Total liabilities

$

3,172,852

$

4,431,674

$

3,313,616

$

4,019,809

$

2,913,242

Temporary Equity

Profit interests of a wholly owned subsidiary subject to possible redemption

$

909

$

752

$

(1,036)

$

$

Stockholders' Equity

Common stock

$

333

$

332

$

334

$

333

$

333

Additional paid-in capital


462,194


454,215


450,434


444,127


438,129

Accumulated other comprehensive income (loss)

612

1,203

1,876

1,833

2,764

Retained earnings


1,243,903


1,264,446


1,282,390


1,319,274


1,308,792

Total stockholders’ equity

$

1,707,042

$

1,720,196

$

1,735,034

$

1,765,567

$

1,750,018

Noncontrolling interests


12,801


12,838


11,864


11,899


11,780

Total permanent equity

$

1,719,843

$

1,733,034

$

1,746,898

$

1,777,466

$

1,761,798

Commitments and contingencies


Total liabilities, temporary equity, and permanent equity

$

4,893,604

$

6,165,460

$

5,059,478

$

5,797,275

$

4,675,040

8


Graphic

Second quarter 2026 Earnings Release

Graphic

Walker & Dunlop, Inc. and Subsidiaries

Condensed Consolidated Statements of Income and Comprehensive Income

Unaudited

Quarterly Trends

Six months ended

June 30, 

(in thousands, except per share amounts)

Q2 2026

Q1 2026

Q4 2025

Q3 2025

Q2 2025

2026

2025

Revenues

Origination fees

$

92,893

$

88,532

$

103,614

$

97,845

$

94,309

$

181,425

$

140,690

MSR income

47,817

46,773

50,060

48,657

53,153

94,590

80,964

Servicing fees


86,700


85,437


86,339


85,189


83,693


172,137


165,914

Property sales broker fees

12,787

13,179

28,488

26,546

14,964

25,966

28,485

Investment management fees

6,907

10,226

11,192

6,178

7,577

17,133

17,259

Net warehouse interest income (expense)


369


25


(909)


(2,035)


(1,760)


394


(2,546)

Placement fees and other interest income


32,440


32,704


37,085


46,302


35,986


65,144


69,197

Other revenues


26,777


24,455


24,155


28,993


31,318


51,232


56,644

Total revenues

$

306,690

$

301,331

$

340,024

$

337,675

$

319,240

$

608,021

$

556,607

Expenses

Personnel

$

162,909

$

152,829

$

187,113

$

177,418

$

161,888

$

315,738

$

283,278

Amortization and depreciation


60,699


62,964


62,084


60,041


58,936


123,663


116,557

Provision (benefit) for credit losses


20,966


4,118


3,105


949


1,820


25,084


5,532

Interest expense on corporate debt


15,260


14,902


15,983


16,451


16,767


30,162


32,281

Indemnified and repurchased loan expenses

6,884

10,061

35,784

3,526

683

16,945

1,540

Other operating expenses


37,898


30,507


54,512


33,353


32,772


68,405


65,801

Total expenses

$

304,616

$

275,381

$

358,581

$

291,738

$

272,866

$

579,997

$

504,989

Income (loss) before taxes

$

2,074

$

25,950

$

(18,557)

$

45,937

$

46,374

$

28,024

$

51,618

Income tax expense (benefit)


(764)


8,022


(5,447)


12,516


12,425


7,258


14,944

Net income (loss) before noncontrolling interests and temporary equity holders

$

2,838

$

17,928

$

(13,110)

$

33,421

$

33,949

$

20,766

$

36,674

Less: net income (loss) from noncontrolling interests


12


974


(36)


(31)


(3)


986


(32)

Less: net income (loss) attributable to temporary equity holders

(180)

1,083

837

903

Walker & Dunlop net income (loss)

$

3,006

$

15,871

$

(13,911)

$

33,452

$

33,952

$

18,877

$

36,706

Other comprehensive income (loss), net of tax

(591)

(673)

43

(931)

1,469

(1,264)

2,178

Walker & Dunlop comprehensive income (loss)

$

2,415

$

15,198

$

(13,868)

$

32,521

$

35,421

$

17,613

$

38,884

Effective Tax Rate

(37)%

31%

29%

27%

27%

26%

29%

Basic earnings (loss) per share

$

0.09

$

0.46

$

(0.41)

$

0.98

$

1.00

$

0.55

$

1.08

Diluted earnings (loss) per share

0.09

0.46

(0.41)

0.98

0.99

0.55

1.07

Cash dividends paid per common share

0.68

0.68

0.67

0.67

0.67

1.36

1.34

Basic weighted-average shares outstanding


33,263


33,394


33,388


33,376


33,358


33,328


33,311

Diluted weighted-average shares outstanding


33,275


33,411


33,410


33,397


33,371


33,343


33,333

9


Graphic

Second quarter 2026 Earnings Release

Graphic

SUPPLEMENTAL OPERATING DATA

Unaudited

Quarterly Trends

Six months ended

June 30, 

(in thousands, except per share data and unless otherwise noted)

Q2 2026

Q1 2026

Q4 2025

Q3 2025

Q2 2025

2026

2025

Transaction Volume:

Components of Debt Financing Volume

Fannie Mae

$

3,087,806

$

1,553,899

$

2,785,231

$

2,141,092

$

3,114,308

$

4,641,705

$

4,626,102

Freddie Mac


1,310,879


3,124,128


2,023,592


3,664,380


1,752,597


4,435,007


2,560,844

Ginnie Mae - HUD


413,839


481,384


153,748


325,169


288,449


895,223


436,607

Brokered (1)


7,402,029


6,503,051


8,675,937


4,512,729


6,335,071


13,905,080


8,888,014

Principal Lending and Investing (2)


319,650


87,900


167,700


199,250


147,800


407,550


323,300

Total Debt Financing Volume

$

12,534,203

$

11,750,362

$

13,806,208

$

10,842,620

$

11,638,225

$

24,284,565

$

16,834,867

Property Sales Volume


1,897,246


1,910,300


4,524,142


4,672,875


2,313,585


3,807,546


4,152,875

Total Transaction Volume

$

14,431,449

$

13,660,662

$

18,330,350

$

15,515,495

$

13,951,810

$

28,092,111

$

20,987,742

Key Performance Metrics:

Operating margin

1

%

9

%

(5)

%

14

%

15

%

5

%

9

%

Return on equity

1

4

(3)

8

8

2

4

Walker & Dunlop net income (loss)

$

3,006

$

15,871

$

(13,911)

$

33,452

$

33,952

$

18,877

$

36,706

Adjusted EBITDA (3)

62,129

73,782

38,755

82,084

76,811

135,911

141,777

Diluted earnings (loss) per share

0.09

0.46

(0.41)

0.98

0.99

0.55

1.07

Adjusted core EPS (4)

1.19

1.02

0.28

1.22

1.15

2.19

2.00

Key Expense Metrics (as a percentage of total revenues):

Personnel expense

53

%

51

%

55

%

53

%

51

%

52

%

51

%

Other operating expenses

12

10

16

10

10

11

12

Key Revenue Metrics (as a percentage of debt financing volume):

Origination fee rate (5)

0.74

%

0.76

%

0.75

%

0.90

%

0.82

%

0.75

%

0.84

%

Agency MSR rate (6)

0.99

0.91

1.01

0.79

1.03

0.95

1.06

Other Data:

Market capitalization at period end

$

1,877,955

$

1,522,458

$

2,048,798

$

2,847,907

$

2,395,939

Closing share price at period end

$

54.70

$

44.38

$

60.15

$

83.62

$

70.48

Average headcount

1,479

1,471

1,464

1,438

1,400

Components of Servicing Portfolio (end of period):

Fannie Mae

$

74,141,705

$

73,498,820

$

72,708,372

$

71,006,342

$

70,042,909

Freddie Mac


45,515,813


44,836,263


42,595,441


40,473,401


39,433,013

Ginnie Mae - HUD


11,890,066


11,646,914


11,563,020


11,298,108


11,008,314

Brokered (7)


14,233,764


16,385,040


17,111,320


16,553,827


16,864,888

Principal Lending and Investing (8)


17,500


17,500


Total Servicing Portfolio

$

145,798,848

$

146,384,537

$

143,978,153

$

139,331,678

$

137,349,124

Assets under management (9)

18,674,671

18,530,780

18,631,100

18,521,907

18,623,451

Total Managed Portfolio

$

164,473,519

$

164,915,317

$

162,609,253

$

157,853,585

$

155,972,575


Key Servicing Portfolio Metrics (end of period):

Custodial escrow account deposits (in billions)

$

3.1

$

2.5

$

3.1

$

2.8

$

2.7

Weighted-average servicing fee rate (basis points)

23.4

23.4

23.6

24.0

24.1

Weighted-average remaining servicing portfolio term (years)

7.1

7.1

7.2

7.4

7.4


(1)Brokered transactions for life insurance companies, commercial banks, and other capital sources.
(2)Includes debt financing volumes from our interim lending platform and WDIP separate accounts.
(3)This is a non-GAAP financial measure. For more information on adjusted EBITDA, refer to the section above titled “Non-GAAP Financial Measures.”
(4)This is a non-GAAP financial measure. For more information on adjusted core EPS, refer to the section above titled “Non-GAAP Financial Measures.”
(5)Origination fees as a percentage of debt financing volume. Excludes the income and debt financing volume from Principal Lending and Investing.
(6)MSR income as a percentage of Agency debt financing volume.
(7)Brokered loans serviced primarily for life insurance companies.
(8)Consists of interim loans not managed for our interim loan joint venture.
(9)Walker & Dunlop Affordable Equity assets under management, commercial real estate loans and funds managed by WDIP, and interim loans serviced for our interim loan joint venture.

10


Graphic

Second quarter 2026 Earnings Release

Graphic

KEY CREDIT METRICS

Unaudited

June 30, 

  ​ ​ ​

March 31,

  ​ ​ ​

December 31,

  ​ ​ ​

September 30,

  ​ ​ ​

June 30, 

  ​ ​ ​

(dollars in thousands)

2026

2026

2025

2025

2025

Risk-sharing servicing portfolio:

Fannie Mae Full Risk

$

67,515,995

$

65,886,235

$

65,087,136

$

63,382,256

$

61,486,070

Fannie Mae Modified Risk


6,625,710


7,612,585


7,621,236


7,624,086


8,556,839

Freddie Mac Modified Risk


15,000


15,000


15,000


10,000


10,000

Total risk-sharing servicing portfolio

$

74,156,705

$

73,513,820

$

72,723,372

$

71,016,342

$

70,052,909

Non-risk-sharing servicing portfolio:

Freddie Mac No Risk

$

45,500,813

$

44,821,263

$

42,580,441

$

40,463,401

$

39,423,013

GNMA - HUD No Risk


11,890,066


11,646,914


11,563,020


11,298,108


11,008,314

Brokered


14,233,764


16,385,040


17,111,320


16,553,827


16,864,888

Total non-risk-sharing servicing portfolio

$

71,624,643

$

72,853,217

$

71,254,781

$

68,315,336

$

67,296,215

Total loans serviced for others

$

145,781,348

$

146,367,037

$

143,978,153

$

139,331,678

$

137,349,124

Loans held for investment (full risk)

$

160,391

$

56,203

$

36,926

$

36,926

$

36,926

Interim Loan Joint Venture Managed Loans (1)

17,099

17,099

32,965

76,215

76,215

At-risk servicing portfolio (2)

$

70,499,346

$

69,444,656

$

68,649,960

$

66,946,180

$

65,378,944

Maximum exposure to at-risk portfolio (3)


14,433,243


14,221,298


14,052,667


13,704,585


13,382,410

Defaulted loans (4)

198,638

167,456

158,821

139,020

108,530

Defaulted loans as a percentage of the at-risk portfolio


0.28

%


0.24

%


0.23

%


0.21

%


0.17

%

Allowance for risk-sharing as a percentage of the at-risk portfolio

0.07

0.06

0.05

0.05

0.05

Allowance for risk-sharing as a percentage of maximum exposure

0.34

0.27

0.27

0.25

0.25


(1)This balance consisted entirely of Interim Program JV managed loans. We indirectly share in a portion of the risk of loss associated with Interim Program JV managed loans through our 15% equity ownership in the Interim Program JV. We have no exposure to risk of loss for the loans serviced directly for the Interim Program JV partner. The balance of this line is included as a component of assets under management in the Supplemental Operating Data table above.
(2)At-risk servicing portfolio is defined as the balance of Fannie Mae Delegated Underwriting and Servicing (“DUS”) loans subject to the risk-sharing formula described below, as well as a small number of Freddie Mac loans on which we share in the risk of loss. Use of the at-risk portfolio provides for comparability of the full risk-sharing and modified risk-sharing loans because the provision and allowance for risk-sharing obligations are based on the at-risk balances of the associated loans. Accordingly, we have presented the key statistics as a percentage of the at-risk portfolio.

For example, a $15 million loan with 50% risk-sharing has the same potential risk exposure as a $7.5 million loan with full DUS risk sharing. Accordingly, if the $15 million loan with 50% risk-sharing were to default, we would view the overall loss as a percentage of the at-risk balance, or $7.5 million, to ensure comparability between all risk-sharing obligations. To date, substantially all of the risk-sharing obligations that we have settled have been from full risk-sharing loans.

(3)Represents the maximum loss we would incur under our risk-sharing obligations if all of the loans we service, for which we retain some risk of loss, were to default and all of the collateral underlying these loans was determined to be without value at the time of settlement. The maximum exposure is not representative of the actual loss we would incur.
(4)Defaulted loans represent loans in our Fannie Mae at-risk portfolio or Freddie Mac SBL pre-securitized portfolio that are probable of foreclosure or that have foreclosed and for which we have recorded a collateral-based reserve (i.e. loans where we have assessed a probable loss). Other loans that are delinquent but not foreclosed or that are not probable of foreclosure are not included here. Additionally, loans that have foreclosed or are probable of foreclosure but are not expected to result in a loss to us are not included here.

11


Graphic

Second quarter 2026 Earnings Release

Graphic

ADJUSTED FINANCIAL MEASURE RECONCILIATION TO GAAP

Unaudited

Quarterly Trends

Six months ended

June 30, 

(in thousands)

Q2 2026

Q1 2026

Q4 2025

Q3 2025

Q2 2025

2026

2025

Reconciliation of Walker & Dunlop Net Income to Adjusted EBITDA

Walker & Dunlop Net Income (Loss)

$

3,006

$

15,871

$

(13,911)

$

33,452

$

33,952

$

18,877

$

36,706

Income tax expense (benefit)


(764)


8,022


(5,447)


12,516


12,425


7,258


14,944

Interest expense on corporate debt


15,260


14,902


15,983


16,451


16,767


30,162


32,281

Amortization and depreciation


60,699


62,964


62,084


60,041


58,936


123,663


116,557

Provision (benefit) for credit losses

20,966

4,118

3,105

949

1,820

25,084

5,532

Loan repurchase losses (1)

1,664

6,950

20,092

8,614

Net write-offs

(491)

(491)

Stock-based compensation expense

9,115

8,219

6,909

7,332

6,064

17,334

12,506

Write-off of unamortized issuance costs from corporate debt paydown (2)

4,215

MSR income

(47,817)

(46,773)

(50,060)

(48,657)

(53,153)

(94,590)

(80,964)

Adjusted EBITDA

$

62,129

$

73,782

$

38,755

$

82,084

$

76,811

$

135,911

$

141,777


(1)Presented as a component of Indemnified and repurchased loan expenses on the Condensed Consolidated Statements of Income.
(2)Presented as a component of Other operating expenses on the Condensed Consolidated Statements of Income.

12


Graphic

Second quarter 2026 Earnings Release

Graphic

CONDENSED SEGMENTS STATEMENTS OF INCOME

Unaudited

Segment Results (dollars in thousands, except per share data and ratios)

For the three months ended June 30, 2026

Revenues

CM

SAM

Corporate

Consolidated

Loan origination and debt brokerage fees, net

$

90,647

$

2,246

$

$

92,893

Fair value of expected net cash flows from servicing, net of guaranty obligation

47,817

47,817

Servicing fees

86,700

86,700

Property sales broker fees

12,787

12,787

Investment management fees

6,907

6,907

Net warehouse interest income (expense)

140

229

369

Placement fees and other interest income

30,065

2,375

32,440

Other revenues

17,395

7,447

1,935

26,777

Total revenues

$

168,786

$

133,594

$

4,310

$

306,690

Expenses

Personnel

$

116,058

$

21,741

$

25,110

$

162,909

Amortization and depreciation

1,146

57,181

2,372

60,699

Provision (benefit) for credit losses


20,966


20,966

Interest expense on corporate debt (1)


4,025

9,893

1,342


15,260

Indemnified and repurchased loan expenses

6,884

6,884

Other operating expenses


10,530

7,640

19,728


37,898

Total expenses

$

131,759

$

124,305

$

48,552

$

304,616

Income (loss) before taxes

$

37,027

$

9,289

$

(44,242)

$

2,074

Income tax expense (benefit) (2)


7,486

780

(9,030)


(764)

Net income (loss) before noncontrolling interests and temporary equity holders

$

29,541

$

8,509

$

(35,212)

$

2,838

Less: net income (loss) from noncontrolling interests

$

12

$

12

Less: net income (loss) attributable to temporary equity holders

(180)

(180)

Walker & Dunlop net income (loss)

$

29,721

$

8,497

$

(35,212)

$

3,006

Diluted EPS

$

0.89

$

0.25

$

(1.05)

$

0.09

Operating margin

22

%

7

%

(1,026)

%

1

%

Segment Results (dollars in thousands, except per share data and ratios)

For the three months ended June 30, 2025

Revenues

CM

SAM

Corporate

Consolidated

Loan origination and debt brokerage fees, net

$

93,764

$

545

$

$

94,309

Fair value of expected net cash flows from servicing, net of guaranty obligation

53,153

53,153

Servicing fees

83,693

83,693

Property sales broker fees

14,964

14,964

Investment management fees

7,577

7,577

Net warehouse interest income (expense)

(1,760)

(1,760)

Placement fees and other interest income

32,651

3,335

35,986

Other revenues

12,670

16,269

2,379

31,318

Total revenues

$

172,791

$

140,735

$

5,714

$

319,240

Expenses

Personnel

$

116,441

$

22,743

$

22,704

$

161,888

Amortization and depreciation

1,146

55,882

1,908

58,936

Provision (benefit) for credit losses


1,820


1,820

Interest expense on corporate debt (1)


4,468

10,810

1,489


16,767

Indemnified and repurchased loan expenses

683

683

Other operating expenses


5,309

5,831

21,632


32,772

Total expenses

$

127,364

$

97,769

$

47,733

$

272,866

Income (loss) before taxes

$

45,427

$

42,966

$

(42,019)

$

46,374

Income tax expense (benefit) (2)


12,285

5,428

(5,288)


12,425

Net income (loss) before noncontrolling interests

$

33,142

$

37,538

$

(36,731)

$

33,949

Less: net income (loss) from noncontrolling interests


(3)


(3)

Walker & Dunlop net income (loss)

$

33,142

$

37,541

$

(36,731)

$

33,952

Diluted EPS

$

0.97

$

1.10

$

(1.08)

$

0.99

Operating margin

26

%

31

%

(735)

%

15

%


(1)Interest expense on corporate debt is allocated to each segment based on proportional usage. Expense decreased due to lower average interest rates.
(2)Income tax expense is allocated to each segment based on income before taxes, except for significant one-time tax items. Tax expense decreased to a benefit due to lower income before taxes and a lower estimated annual effective tax rate driven by higher low income housing tax credits.

13


Graphic

Second quarter 2026 Earnings Release

Graphic

ADJUSTED CORE EPS RECONCILIATION

Unaudited

Quarterly Trends

Six months ended

June 30, 

(in thousands)

Q2 2026

Q1 2026

Q4 2025

Q3 2025

Q2 2025

2026

2025

Reconciliation of Walker & Dunlop Net Income (Loss) to Adjusted Core Net Income

Walker & Dunlop Net Income (Loss)

$

3,006

$

15,871

$

(13,911)

$

33,452

$

33,952

$

18,877

$

36,706

Provision (benefit) for credit losses


20,966


4,118


3,105


949


1,820


25,084


5,532

Loan repurchase losses (1)

1,664

6,950

20,092

8,614

Net write-offs

(491)

(491)

Amortization and depreciation


60,699


62,964


62,084


60,041


58,936


123,663


116,557

MSR income

(47,817)

(46,773)

(50,060)

(48,657)

(53,153)

(94,590)

(80,964)

Contingent consideration accretion and fair value adjustments

434

(299)

(8,226)

18

41

135

81

Write-off of unamortized issuance costs from corporate debt paydown (2)

4,215

Income tax expense adjustment (3)

719

(6,908)

(3,662)

(3,856)

(2,429)

(6,189)

(13,784)

Adjusted Core Net Income

$

39,671

$

35,432

$

9,422

$

41,947

$

39,167

$

75,103

$

68,343

Reconciliation of Diluted EPS to Adjusted core EPS

Walker & Dunlop Net Income (Loss)

$

3,006

$

15,871

$

(13,911)

$

33,452

$

33,952

$

18,877

$

36,706

Diluted weighted-average shares outstanding

33,275

33,411

33,410

33,397

33,371

33,343

33,333

Diluted earnings (loss) per share

$

0.09

$

0.46

$

(0.41)

$

0.98

$

0.99

$

0.55

$

1.07

Adjusted Core Net Income

$

39,671

$

35,432

$

9,422

$

41,947

$

39,167

$

75,103

$

68,343

Diluted weighted-average shares outstanding

33,275

33,411

33,410

33,397

33,371

33,343

33,333

Adjusted core EPS

$

1.19

$

1.02

$

0.28

$

1.22

$

1.15

$

2.19

$

2.00


(1)
Presented as a component of Indemnified and repurchased loan expenses on the Condensed Consolidated Statements of Income.
(2)
Presented as a component of Other operating expenses on the Condensed Consolidated Statements of Income.
(3)
Income tax impact of the above adjustments to adjusted core net income. Uses (i) quarterly effective tax rate as disclosed in the Condensed Consolidated Statements of Income in this press release or (ii) estimated annual effective rate.

14