October 19, 2026 2026 Third Quarter Earnings Results NASDAQ: RBB .2
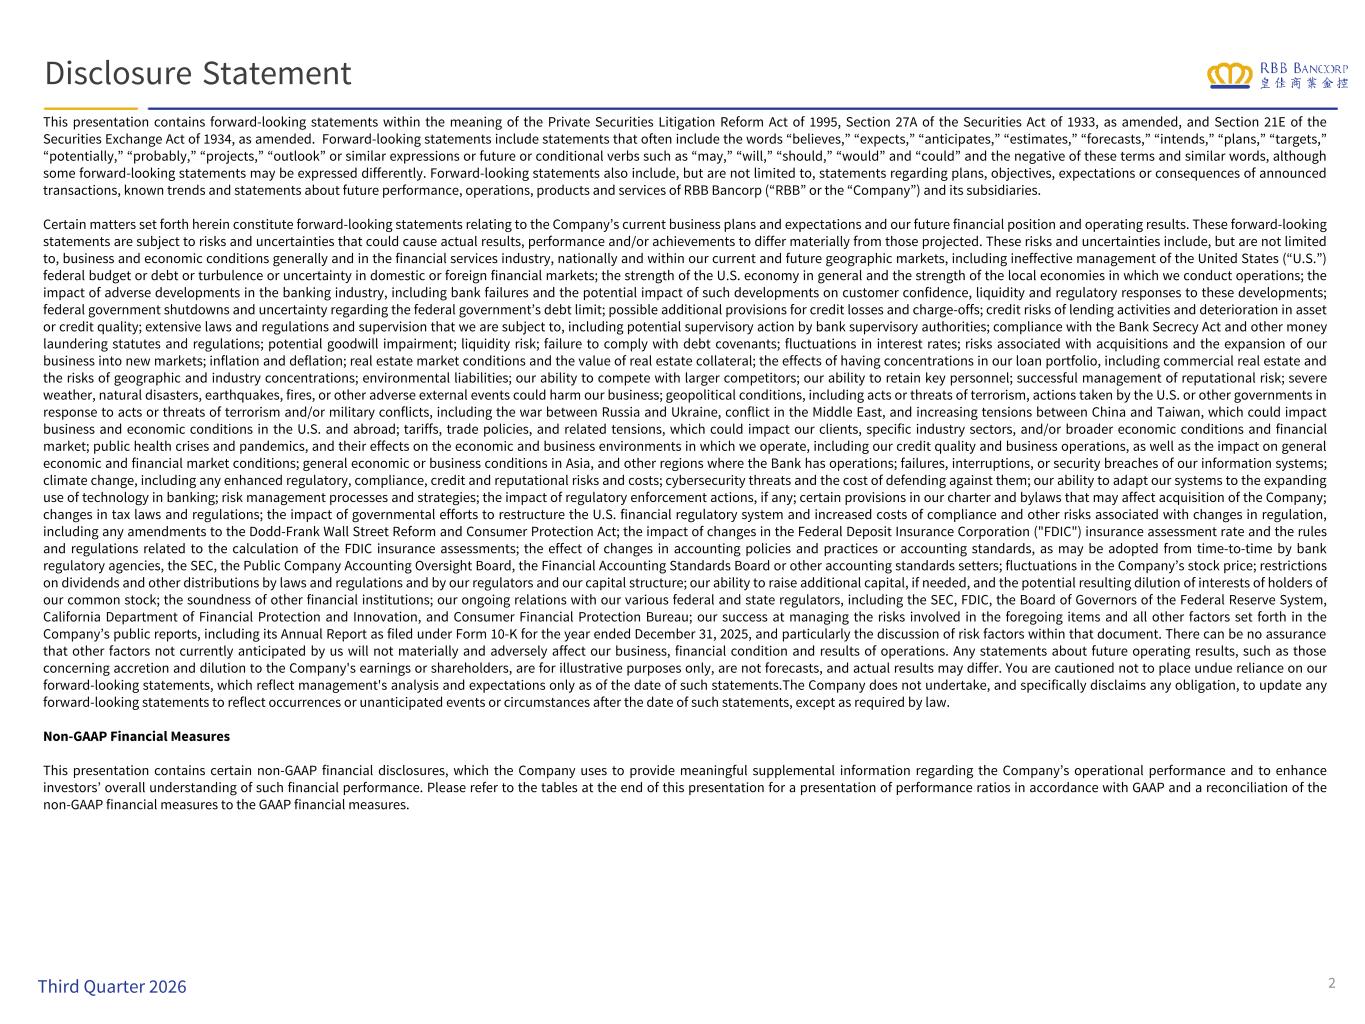
This presentation contains forward-looking statements within the meaning of the Private Securities Litigation Reform Act of 1995, Section 27A of the Securities Act of 1933, as amended, and Section 21E of the Securities Exchange Act of 1934, as amended. Forward-looking statements include statements that often include the words “believes,” “expects,” “anticipates,” “estimates,” “forecasts,” “intends,” “plans,” “targets,” “potentially,” “probably,” “projects,” “outlook” or similar expressions or future or conditional verbs such as “may,” “will,” “should,” “would” and “could” and the negative of these terms and similar words, although some forward-looking statements may be expressed differently. Forward-looking statements also include, but are not limited to, statements regarding plans, objectives, expectations or consequences of announced transactions, known trends and statements about future performance, operations, products and services of RBB Bancorp (“RBB” or the “Company”) and its subsidiaries. Certain matters set forth herein constitute forward-looking statements relating to the Company’s current business plans and expectations and our future financial position and operating results. These forward-looking statements are subject to risks and uncertainties that could cause actual results, performance and/or achievements to differ materially from those projected. These risks and uncertainties include, but are not limited to, business and economic conditions generally and in the financial services industry, nationally and within our current and future geographic markets, including ineffective management of the United States (“U.S.”) federal budget or debt or turbulence or uncertainty in domestic or foreign financial markets; the strength of the U.S. economy in general and the strength of the local economies in which we conduct operations; the impact of adverse developments in the banking industry, including bank failures and the potential impact of such developments on customer confidence, liquidity and regulatory responses to these developments; federal government shutdowns and uncertainty regarding the federal government’s debt limit; possible additional provisions for credit losses and charge-offs; credit risks of lending activities and deterioration in asset or credit quality; extensive laws and regulations and supervision that we are subject to, including potential supervisory action by bank supervisory authorities; compliance with the Bank Secrecy Act and other money laundering statutes and regulations; potential goodwill impairment; liquidity risk; failure to comply with debt covenants; fluctuations in interest rates; risks associated with acquisitions and the expansion of our business into new markets; inflation and deflation; real estate market conditions and the value of real estate collateral; the effects of having concentrations in our loan portfolio, including commercial real estate and the risks of geographic and industry concentrations; environmental liabilities; our ability to compete with larger competitors; our ability to retain key personnel; successful management of reputational risk; severe weather, natural disasters, earthquakes, fires, or other adverse external events could harm our business; geopolitical conditions, including acts or threats of terrorism, actions taken by the U.S. or other governments in response to acts or threats of terrorism and/or military conflicts, including the war between Russia and Ukraine, conflict in the Middle East, and increasing tensions between China and Taiwan, which could impact business and economic conditions in the U.S. and abroad; tariffs, trade policies, and related tensions, which could impact our clients, specific industry sectors, and/or broader economic conditions and financial market; public health crises and pandemics, and their effects on the economic and business environments in which we operate, including our credit quality and business operations, as well as the impact on general economic and financial market conditions; general economic or business conditions in Asia, and other regions where the Bank has operations; failures, interruptions, or security breaches of our information systems; climate change, including any enhanced regulatory, compliance, credit and reputational risks and costs; cybersecurity threats and the cost of defending against them; our ability to adapt our systems to the expanding use of technology in banking; risk management processes and strategies; the impact of regulatory enforcement actions, if any; certain provisions in our charter and bylaws that may affect acquisition of the Company; changes in tax laws and regulations; the impact of governmental efforts to restructure the U.S. financial regulatory system and increased costs of compliance and other risks associated with changes in regulation, including any amendments to the Dodd-Frank Wall Street Reform and Consumer Protection Act; the impact of changes in the Federal Deposit Insurance Corporation ("FDIC") insurance assessment rate and the rules and regulations related to the calculation of the FDIC insurance assessments; the effect of changes in accounting policies and practices or accounting standards, as may be adopted from time-to-time by bank regulatory agencies, the SEC, the Public Company Accounting Oversight Board, the Financial Accounting Standards Board or other accounting standards setters; fluctuations in the Company’s stock price; restrictions on dividends and other distributions by laws and regulations and by our regulators and our capital structure; our ability to raise additional capital, if needed, and the potential resulting dilution of interests of holders of our common stock; the soundness of other financial institutions; our ongoing relations with our various federal and state regulators, including the SEC, FDIC, the Board of Governors of the Federal Reserve System, California Department of Financial Protection and Innovation, and Consumer Financial Protection Bureau; our success at managing the risks involved in the foregoing items and all other factors set forth in the Company’s public reports, including its Annual Report as filed under Form 10-K for the year ended December 31, 2025, and particularly the discussion of risk factors within that document. There can be no assurance that other factors not currently anticipated by us will not materially and adversely affect our business, financial condition and results of operations. Any statements about future operating results, such as those concerning accretion and dilution to the Company's earnings or shareholders, are for illustrative purposes only, are not forecasts, and actual results may differ. You are cautioned not to place undue reliance on our forward-looking statements, which reflect management's analysis and expectations only as of the date of such statements.The Company does not undertake, and specifically disclaims any obligation, to update any forward-looking statements to reflect occurrences or unanticipated events or circumstances after the date of such statements, except as required by law. Non-GAAP Financial Measures This presentation contains certain non-GAAP financial disclosures, which the Company uses to provide meaningful supplemental information regarding the Company’s operational performance and to enhance investors’ overall understanding of such financial performance. Please refer to the tables at the end of this presentation for a presentation of performance ratios in accordance with GAAP and a reconciliation of the non-GAAP financial measures to the GAAP financial measures. 2Third Quarter 2026 Disclosure Statement
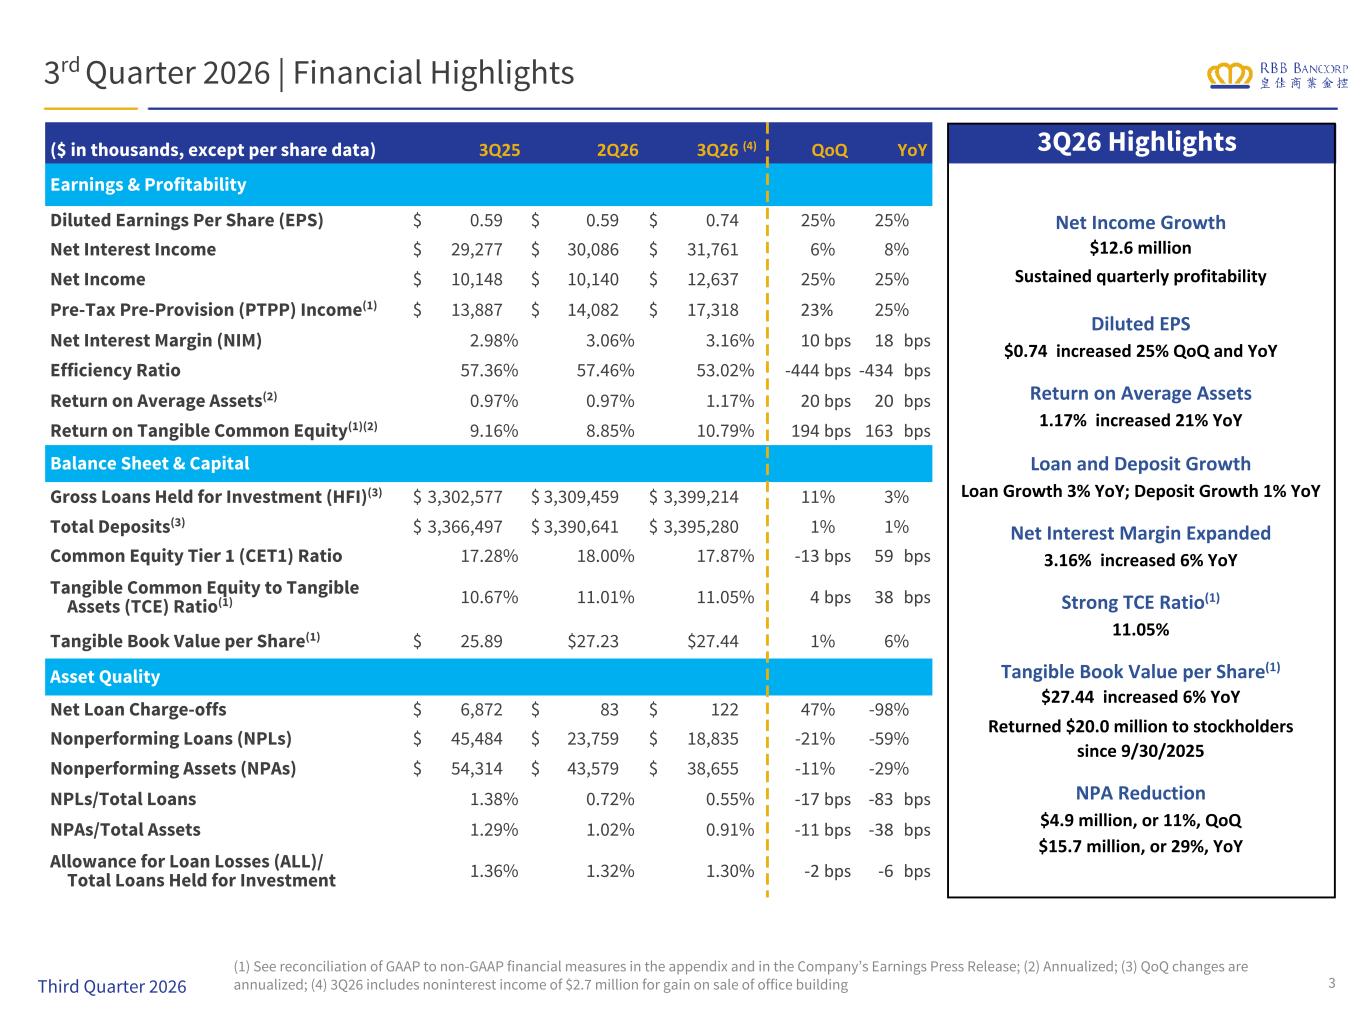
($ in thousands, except per share data) 3Q25 2Q26 3Q26 (4) QoQ YoY Earnings & Profitability Diluted Earnings Per Share (EPS) $ 0.59 $ 0.59 $ 0.74 25% 25% Net Interest Income $ 29,277 $ 30,086 $ 31,761 6% 8% Net Income $ 10,148 $ 10,140 $ 12,637 25% 25% Pre-Tax Pre-Provision (PTPP) Income(1) $ 13,887 $ 14,082 $ 17,318 23% 25% Net Interest Margin (NIM) 2.98% 3.06% 3.16% 10 bps 18 bps Efficiency Ratio 57.36% 57.46% 53.02% -444 bps -434 bps Return on Average Assets(2) 0.97% 0.97% 1.17% 20 bps 20 bps Return on Tangible Common Equity(1)(2) 9.16% 8.85% 10.79% 194 bps 163 bps Balance Sheet & Capital Gross Loans Held for Investment (HFI)(3) $ 3,302,577 $ 3,309,459 $ 3,399,214 11% 3% Total Deposits(3) $ 3,366,497 $ 3,390,641 $ 3,395,280 1% 1% Common Equity Tier 1 (CET1) Ratio 17.28% 18.00% 17.87% -13 bps 59 bps Tangible Common Equity to Tangible Assets (TCE) Ratio(1) 10.67% 11.01% 11.05% 4 bps 38 bps Tangible Book Value per Share(1) $ 25.89 $27.23 $27.44 1% 6% Asset Quality Net Loan Charge-offs $ 6,872 $ 83 $ 122 47% -98% Nonperforming Loans (NPLs) $ 45,484 $ 23,759 $ 18,835 -21% -59% Nonperforming Assets (NPAs) $ 54,314 $ 43,579 $ 38,655 -11% -29% NPLs/Total Loans 1.38% 0.72% 0.55% -17 bps -83 bps NPAs/Total Assets 1.29% 1.02% 0.91% -11 bps -38 bps Allowance for Loan Losses (ALL)/ Total Loans Held for Investment 1.36% 1.32% 1.30% -2 bps -6 bps 3rd Quarter 2026 | Financial Highlights 3Q26 Highlights 3 (1) See reconciliation of GAAP to non-GAAP financial measures in the appendix and in the Company’s Earnings Press Release; (2) Annualized; (3) QoQ changes are annualized; (4) 3Q26 includes noninterest income of $2.7 million for gain on sale of office buildingThird Quarter 2026 Net Income Growth $12.6 million Sustained quarterly profitability Diluted EPS $0.74 increased 25% QoQ and YoY Return on Average Assets 1.17% increased 21% YoY Loan and Deposit Growth Loan Growth 3% YoY; Deposit Growth 1% YoY Net Interest Margin Expanded 3.16% increased 6% YoY Strong TCE Ratio(1) 11.05% Tangible Book Value per Share(1) $27.44 increased 6% YoY Returned $20.0 million to stockholders since 9/30/2025 NPA Reduction $4.9 million, or 11%, QoQ $15.7 million, or 29%, YoY
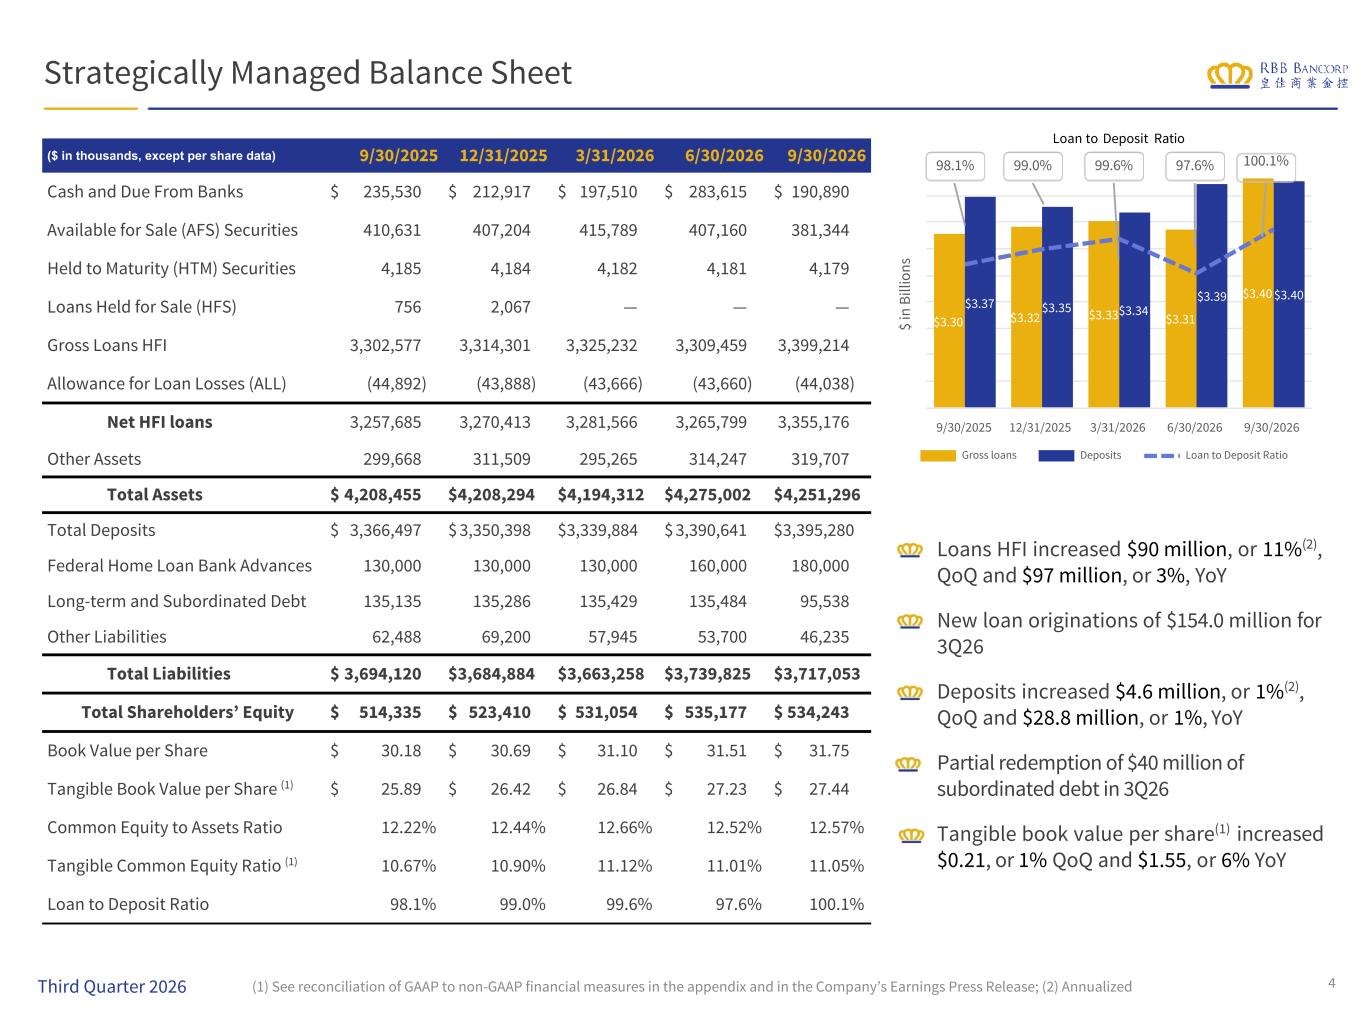
Strategically Managed Balance Sheet Loans HFI increased $90 million, or 11%(2), QoQ and $97 million, or 3%, YoY New loan originations of $154.0 million for 3Q26 Deposits increased $4.6 million, or 1%(2), QoQ and $28.8 million, or 1%, YoY Partial redemption of $40 million of subordinated debt in 3Q26 Tangible book value per share(1) increased $0.21, or 1% QoQ and $1.55, or 6% YoY ($ in thousands, except per share data) 9/30/2025 12/31/2025 3/31/2026 6/30/2026 9/30/2026 Cash and Due From Banks $ 235,530 $ 212,917 $ 197,510 $ 283,615 $ 190,890 Available for Sale (AFS) Securities 410,631 407,204 415,789 407,160 381,344 Held to Maturity (HTM) Securities 4,185 4,184 4,182 4,181 4,179 Loans Held for Sale (HFS) 756 2,067 — — — Gross Loans HFI 3,302,577 3,314,301 3,325,232 3,309,459 3,399,214 Allowance for Loan Losses (ALL) (44,892) (43,888) (43,666) (43,660) (44,038) Net HFI loans 3,257,685 3,270,413 3,281,566 3,265,799 3,355,176 Other Assets 299,668 311,509 295,265 314,247 319,707 Total Assets $ 4,208,455 $ 4,208,294 $ 4,194,312 $ 4,275,002 $ 4,251,296 Total Deposits $ 3,366,497 $ 3,350,398 $ 3,339,884 $ 3,390,641 $ 3,395,280 Federal Home Loan Bank Advances 130,000 130,000 130,000 160,000 180,000 Long-term and Subordinated Debt 135,135 135,286 135,429 135,484 95,538 Other Liabilities 62,488 69,200 57,945 53,700 46,235 Total Liabilities $ 3,694,120 $ 3,684,884 $ 3,663,258 $ 3,739,825 $ 3,717,053 Total Shareholders’ Equity $ 514,335 $ 523,410 $ 531,054 $ 535,177 $ 534,243 Book Value per Share $ 30.18 $ 30.69 $ 31.10 $ 31.51 $ 31.75 Tangible Book Value per Share (1) $ 25.89 $ 26.42 $ 26.84 $ 27.23 $ 27.44 Common Equity to Assets Ratio 12.22% 12.44% 12.66% 12.52% 12.57% Tangible Common Equity Ratio (1) 10.67% 10.90% 11.12% 11.01% 11.05% Loan to Deposit Ratio 98.1% 99.0% 99.6% 97.6% 100.1% Loan to Deposit Ratio 4(1) See reconciliation of GAAP to non-GAAP financial measures in the appendix and in the Company’s Earnings Press Release; (2) Annualized $ in B ill io ns $3.30 $3.32 $3.33 $3.31 $3.40 $3.37 $3.35 $3.34 $3.39 $3.40 Gross loans Deposits Loan to Deposit Ratio 9/30/2025 12/31/2025 3/31/2026 6/30/2026 9/30/2026 98.1% 99.0% 99.6% 97.6% 100.1% Third Quarter 2026
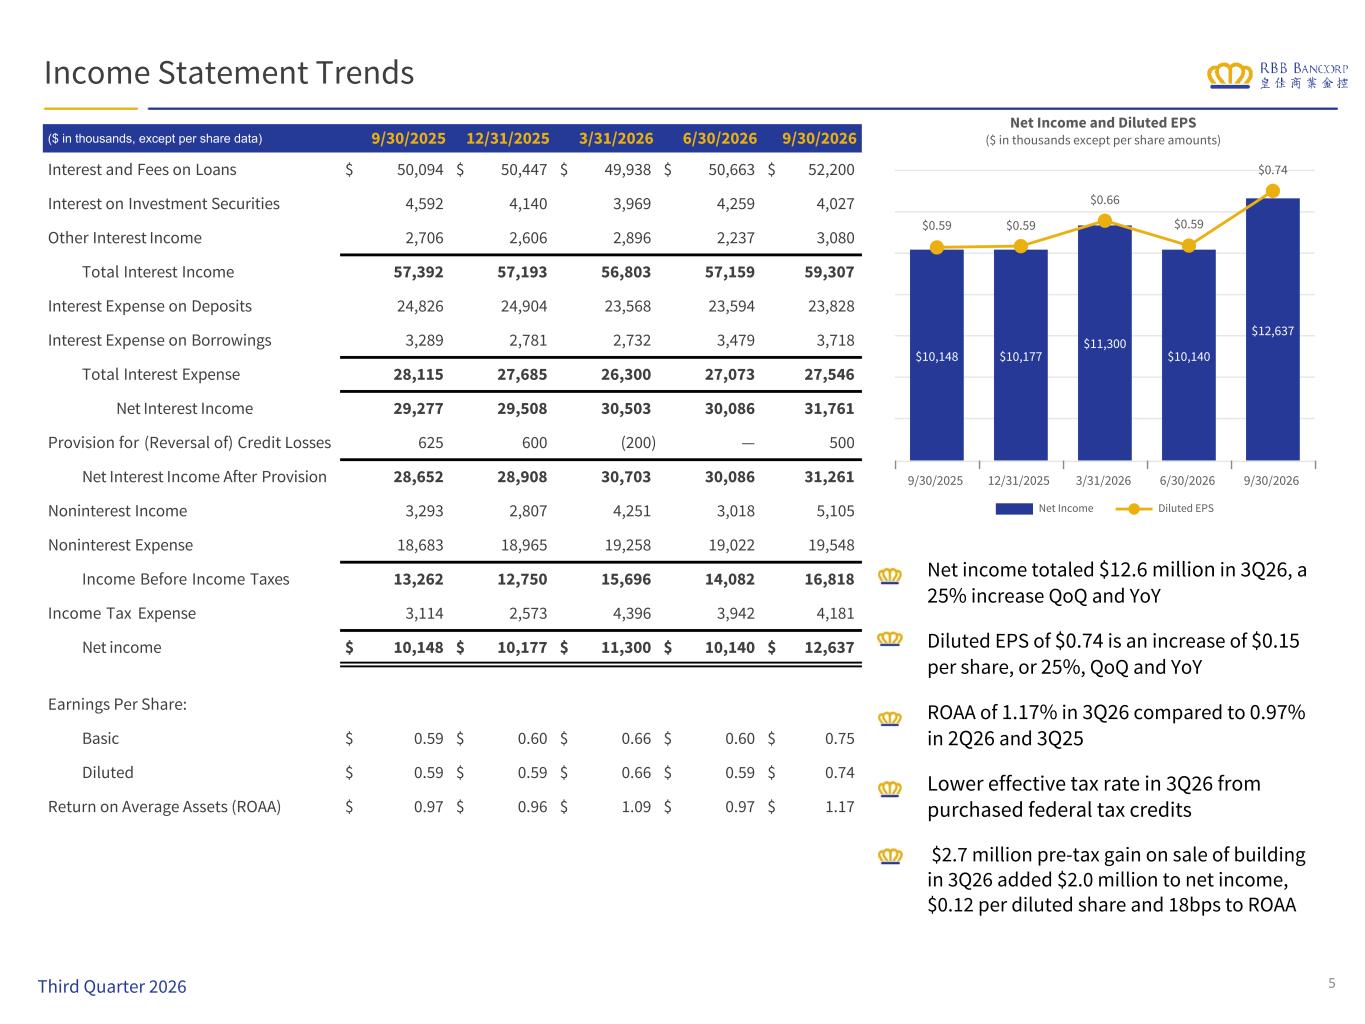
Income Statement Trends ($ in thousands, except per share data) 9/30/2025 12/31/2025 3/31/2026 6/30/2026 9/30/2026 Interest and Fees on Loans $ 50,094 $ 50,447 $ 49,938 $ 50,663 $ 52,200 Interest on Investment Securities 4,592 4,140 3,969 4,259 4,027 Other Interest Income 2,706 2,606 2,896 2,237 3,080 Total Interest Income 57,392 57,193 56,803 57,159 59,307 Interest Expense on Deposits 24,826 24,904 23,568 23,594 23,828 Interest Expense on Borrowings 3,289 2,781 2,732 3,479 3,718 Total Interest Expense 28,115 27,685 26,300 27,073 27,546 Net Interest Income 29,277 29,508 30,503 30,086 31,761 Provision for (Reversal of) Credit Losses 625 600 (200) — 500 Net Interest Income After Provision 28,652 28,908 30,703 30,086 31,261 Noninterest Income 3,293 2,807 4,251 3,018 5,105 Noninterest Expense 18,683 18,965 19,258 19,022 19,548 Income Before Income Taxes 13,262 12,750 15,696 14,082 16,818 Income Tax Expense 3,114 2,573 4,396 3,942 4,181 Net income $ 10,148 $ 10,177 $ 11,300 $ 10,140 $ 12,637 Earnings Per Share: Basic $ 0.59 $ 0.60 $ 0.66 $ 0.60 $ 0.75 Diluted $ 0.59 $ 0.59 $ 0.66 $ 0.59 $ 0.74 Return on Average Assets (ROAA) $ 0.97 $ 0.96 $ 1.09 $ 0.97 $ 1.17 Net income totaled $12.6 million in 3Q26, a 25% increase QoQ and YoY Diluted EPS of $0.74 is an increase of $0.15 per share, or 25%, QoQ and YoY ROAA of 1.17% in 3Q26 compared to 0.97% in 2Q26 and 3Q25 Lower effective tax rate in 3Q26 from purchased federal tax credits $2.7 million pre-tax gain on sale of building in 3Q26 added $2.0 million to net income, $0.12 per diluted share and 18bps to ROAA 5 Net Income and Diluted EPS ($ in thousands except per share amounts) $10,148 $10,177 $11,300 $10,140 $12,637 $0.59 $0.59 $0.66 $0.59 $0.74 Net Income Diluted EPS 9/30/2025 12/31/2025 3/31/2026 6/30/2026 9/30/2026 Third Quarter 2026
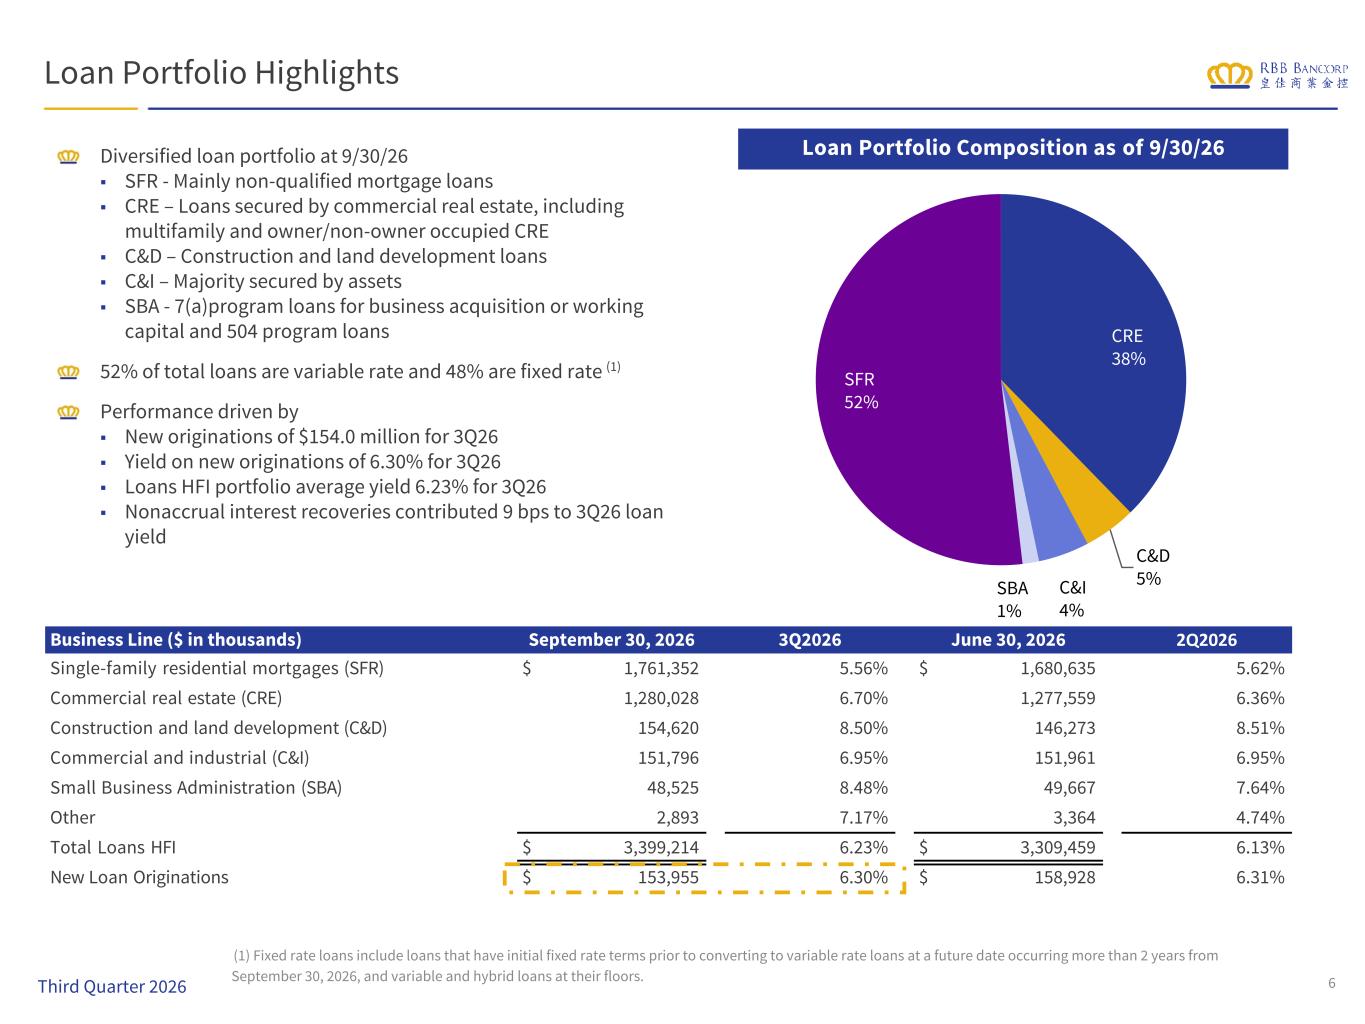
CRE 38% C&D 5%C&I 4% SBA 1% SFR 52% Business Line ($ in thousands) September 30, 2026 3Q2026 June 30, 2026 2Q2026 Single-family residential mortgages (SFR) $ 1,761,352 5.56% $ 1,680,635 5.62% Commercial real estate (CRE) 1,280,028 6.70% 1,277,559 6.36% Construction and land development (C&D) 154,620 8.50% 146,273 8.51% Commercial and industrial (C&I) 151,796 6.95% 151,961 6.95% Small Business Administration (SBA) 48,525 8.48% 49,667 7.64% Other 2,893 7.17% 3,364 4.74% Total Loans HFI $ 3,399,214 6.23% $ 3,309,459 6.13% New Loan Originations $ 153,955 6.30% $ 158,928 6.31% Loan Portfolio Highlights Diversified loan portfolio at 9/30/26 ■ SFR - Mainly non-qualified mortgage loans ■ CRE – Loans secured by commercial real estate, including multifamily and owner/non-owner occupied CRE ■ C&D – Construction and land development loans ■ C&I – Majority secured by assets ■ SBA - 7(a)program loans for business acquisition or working capital and 504 program loans 52% of total loans are variable rate and 48% are fixed rate (1) Performance driven by ■ New originations of $154.0 million for 3Q26 ■ Yield on new originations of 6.30% for 3Q26 ■ Loans HFI portfolio average yield 6.23% for 3Q26 ■ Nonaccrual interest recoveries contributed 9 bps to 3Q26 loan yield Loan Portfolio Composition as of 9/30/26 6 (1) Fixed rate loans include loans that have initial fixed rate terms prior to converting to variable rate loans at a future date occurring more than 2 years from September 30, 2026, and variable and hybrid loans at their floors. Third Quarter 2026
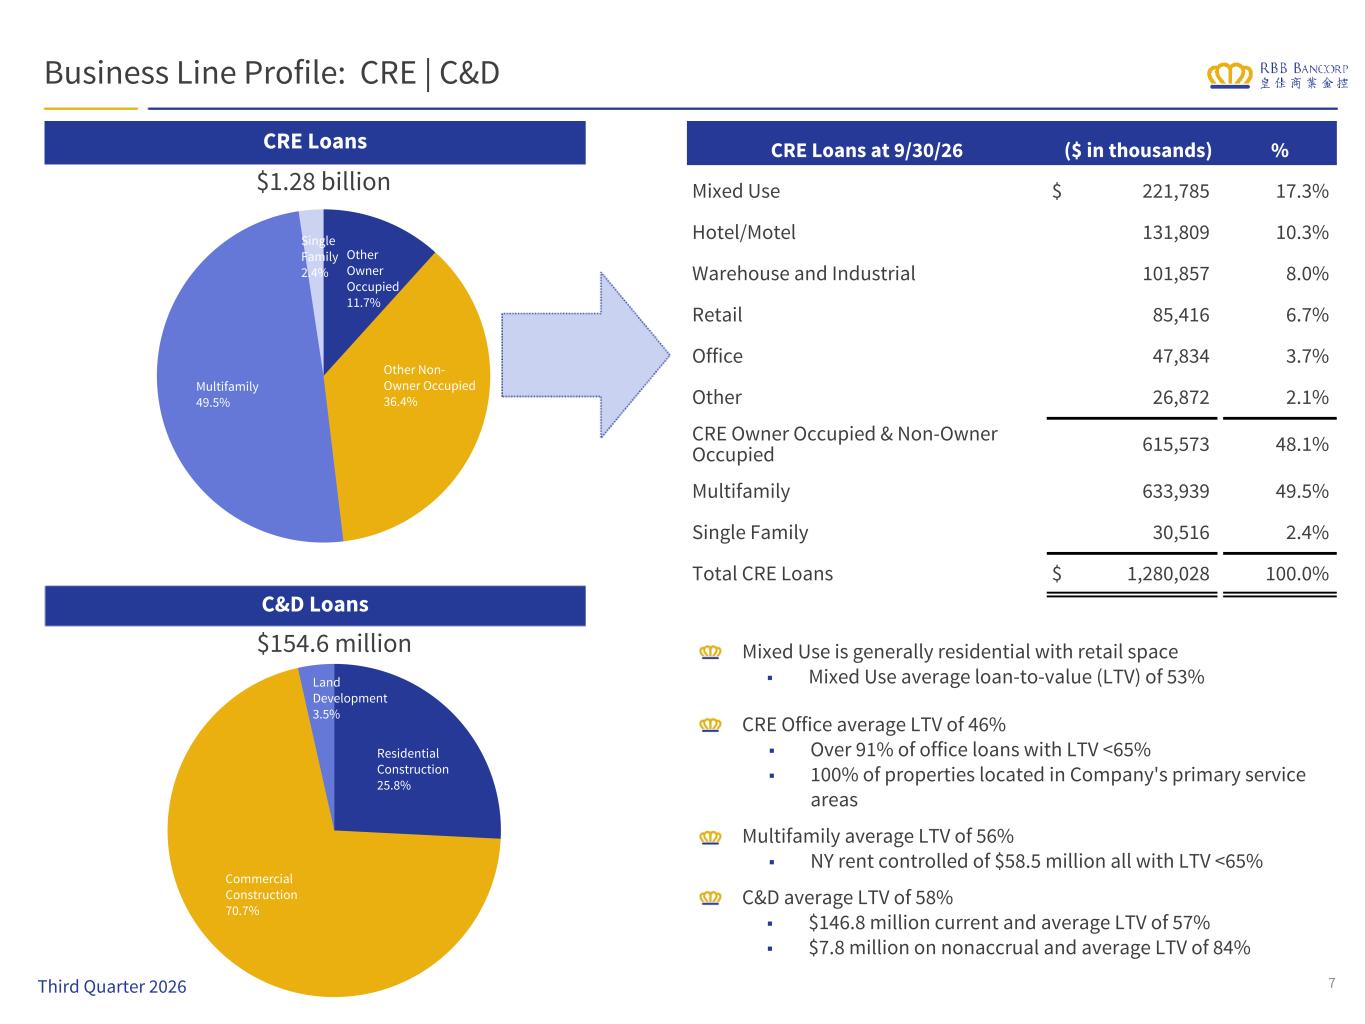
Residential Construction 25.8% Commercial Construction 70.7% Land Development 3.5% Other Owner Occupied 11.7% Other Non- Owner Occupied 36.4% Multifamily 49.5% Single Family 2.4% Business Line Profile: CRE | C&D CRE Loans C&D Loans $1.28 billion $154.6 million Mixed Use is generally residential with retail space ■ Mixed Use average loan-to-value (LTV) of 53% CRE Office average LTV of 46% ■ Over 91% of office loans with LTV <65% ■ 100% of properties located in Company's primary service areas Multifamily average LTV of 56% ■ NY rent controlled of $58.5 million all with LTV <65% C&D average LTV of 58% ■ $146.8 million current and average LTV of 57% ■ $7.8 million on nonaccrual and average LTV of 84% CRE Loans at 9/30/26 ($ in thousands) % Mixed Use $ 221,785 17.3% Hotel/Motel 131,809 10.3% Warehouse and Industrial 101,857 8.0% Retail 85,416 6.7% Office 47,834 3.7% Other 26,872 2.1% CRE Owner Occupied & Non-Owner Occupied 615,573 48.1% Multifamily 633,939 49.5% Single Family 30,516 2.4% Total CRE Loans $ 1,280,028 100.0% 7Third Quarter 2026
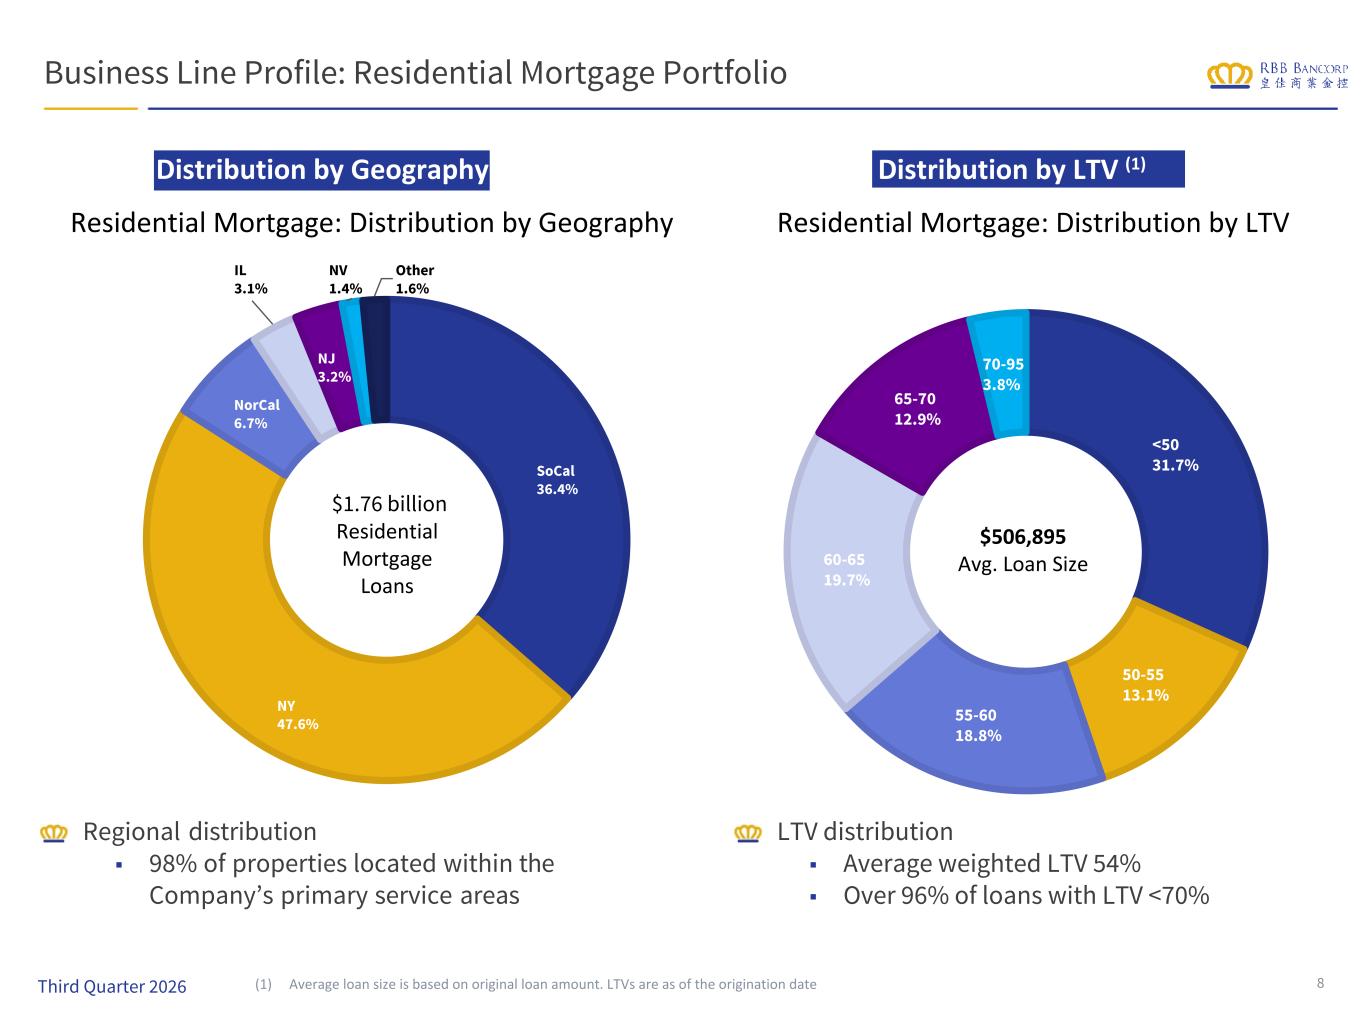
Distribution by LTV (1) Business Line Profile: Residential Mortgage Portfolio Distribution by Geography Regional distribution ■ 98% of properties located within the Company’s primary service areas LTV distribution ■ Average weighted LTV 54% ■ Over 96% of loans with LTV <70% (1) Average loan size is based on original loan amount. LTVs are as of the origination date 8 SoCal 36.4% NY 47.6% NorCal 6.7% IL 3.1% NJ 3.2% NV 1.4% Other 1.6% <50 31.7% 50-55 13.1% 55-60 18.8% 60-65 19.7% 65-70 12.9% 70-95 3.8% $1.76 billion Residential Mortgage Loans $506,895 Avg. Loan Size Third Quarter 2026 Residential Mortgage: Distribution by Geography Residential Mortgage: Distribution by LTV
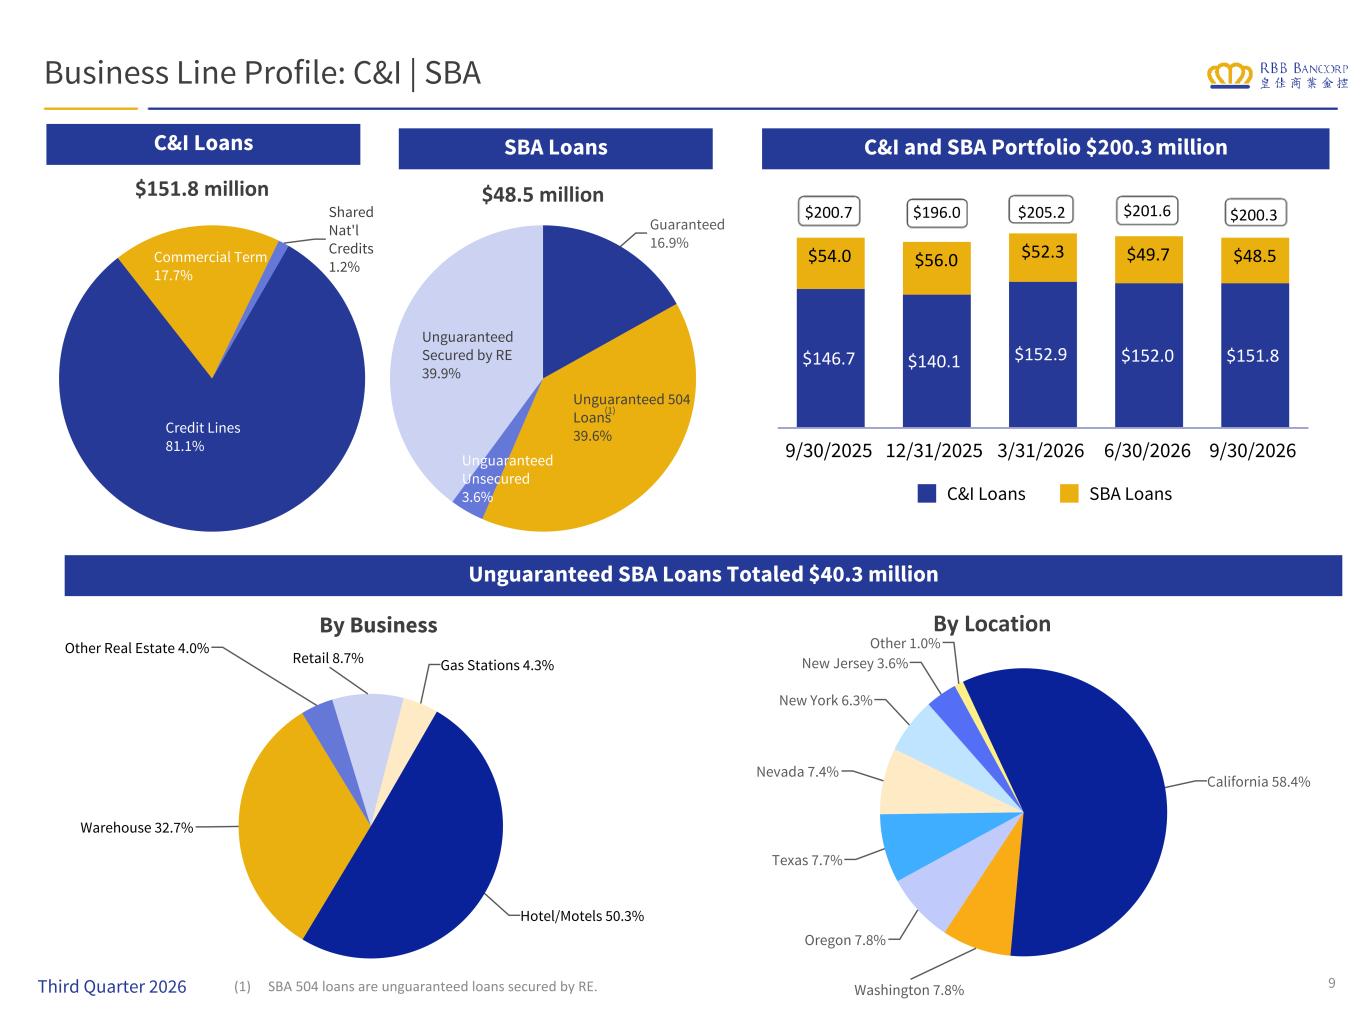
Guaranteed 16.9% Unguaranteed 504 Loans 39.6% Unguaranteed Unsecured 3.6% Unguaranteed Secured by RE 39.9% Credit Lines 81.1% Commercial Term 17.7% Shared Nat'l Credits 1.2% $146.7 $140.1 $152.9 $152.0 $151.8 $54.0 $56.0 $52.3 $49.7 $48.5 C&I Loans SBA Loans 9/30/2025 12/31/2025 3/31/2026 6/30/2026 9/30/2026 Business Line Profile: C&I | SBA $151.8 million $48.5 million C&I and SBA Portfolio $200.3 million By LocationBy Business Unguaranteed SBA Loans Totaled $40.3 million C&I Loans SBA Loans (1) SBA 504 loans are unguaranteed loans secured by RE. 9 California 66.8% (1) Third Quarter 2026 $200.7 $196.0 $205.2 $201.6 $200.3 California 58.4% Washington 7.8% Oregon 7.8% Texas 7.7% Nevada 7.4% New York 6.3% New Jersey 3.6% Other 1.0% Hotel/Motels 50.3% Warehouse 32.7% Other Real Estate 4.0% Retail 8.7% Gas Stations 4.3%
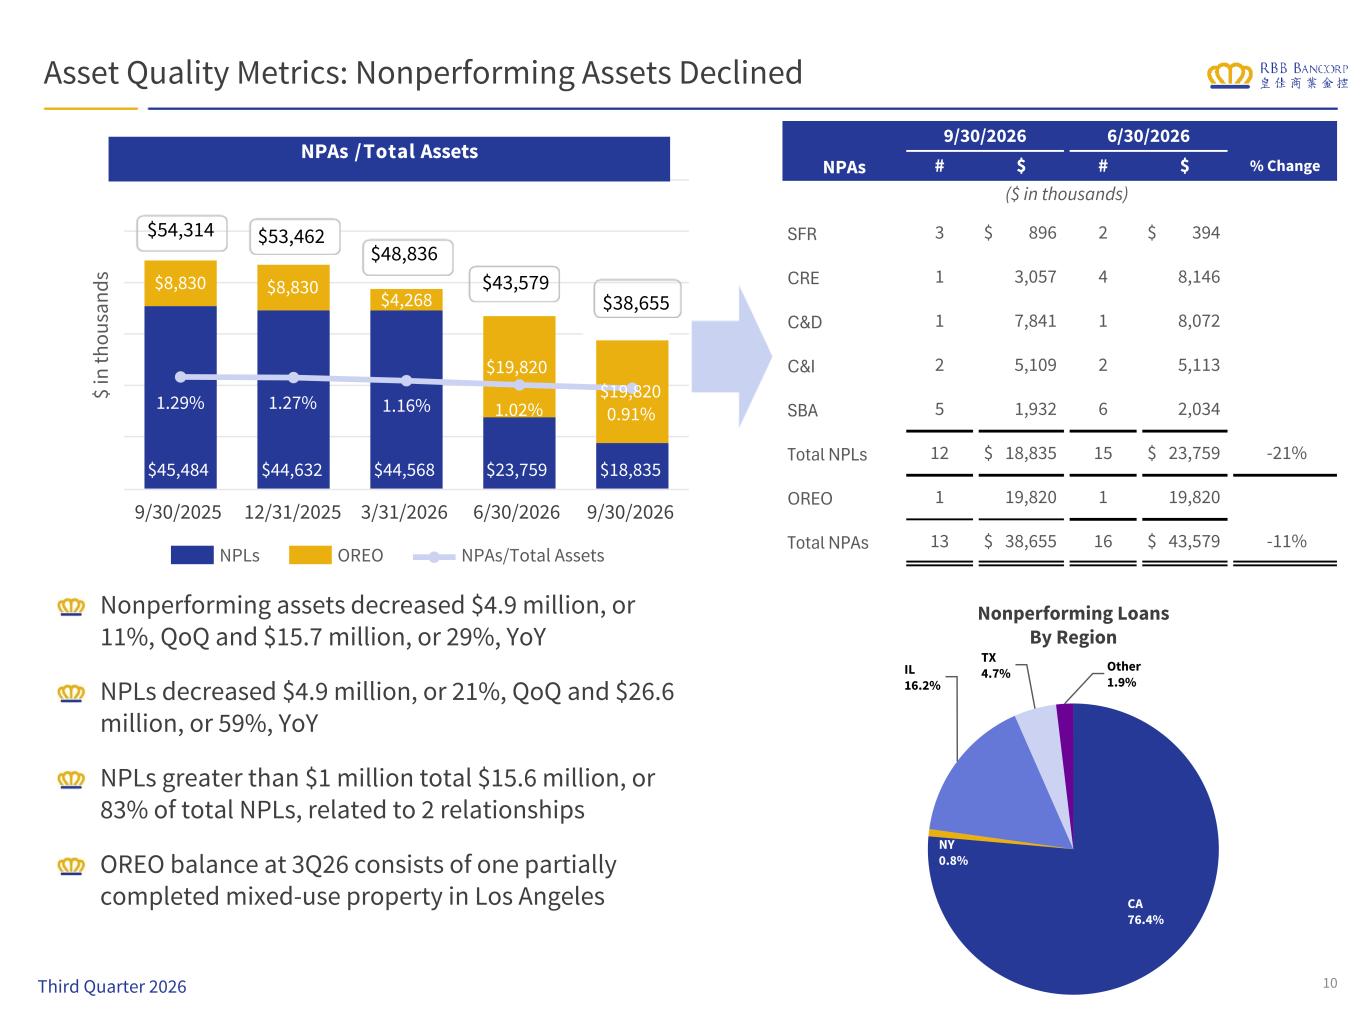
$ in th ou sa nd s $45,484 $44,632 $44,568 $23,759 $18,835 $8,830 $8,830 $4,268 $19,820 $19,8201.29% 1.27% 1.16% 1.02% 0.91% NPLs OREO NPAs/Total Assets 9/30/2025 12/31/2025 3/31/2026 6/30/2026 9/30/2026 $54,314 $48,836 $43,579 $38,655 NPAs / Total Assets Asset Quality Metrics: Nonperforming Assets Declined Nonperforming assets decreased $4.9 million, or 11%, QoQ and $15.7 million, or 29%, YoY NPLs decreased $4.9 million, or 21%, QoQ and $26.6 million, or 59%, YoY NPLs greater than $1 million total $15.6 million, or 83% of total NPLs, related to 2 relationships OREO balance at 3Q26 consists of one partially completed mixed-use property in Los Angeles 10 Nonperforming Loans By Region $53,462 NPAs 9/30/2026 6/30/2026 # $ # $ % Change ($ in thousands) SFR 3 $ 896 2 $ 394 CRE 1 3,057 4 8,146 C&D 1 7,841 1 8,072 C&I 2 5,109 2 5,113 SBA 5 1,932 6 2,034 Total NPLs 12 $ 18,835 15 $ 23,759 -21% OREO 1 19,820 1 19,820 Total NPAs 13 $ 38,655 16 $ 43,579 -11% CA 76.4% NY 0.8% IL 16.2% TX 4.7% Other 1.9% Third Quarter 2026
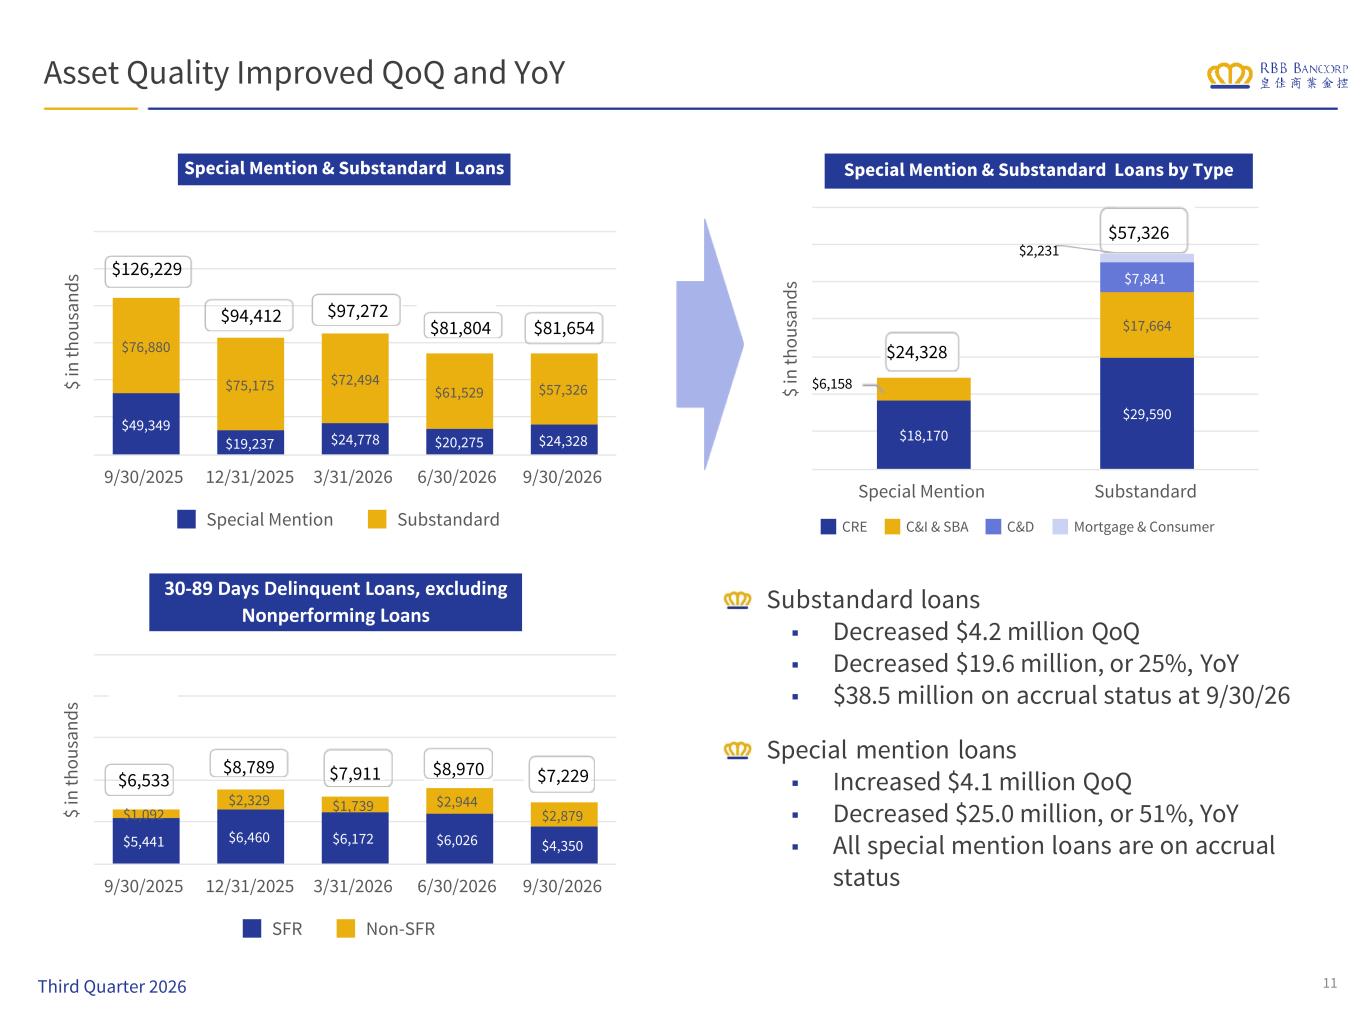
$ in th ou sa nd s $18,170 $29,590 $17,664 $7,841 CRE C&I & SBA C&D Mortgage & Consumer Special Mention Substandard $ in th ou sa nd s $5,441 $6,460 $6,172 $6,026 $4,350 $1,092 $2,329 $1,739 $2,944 $2,879 SFR Non-SFR 9/30/2025 12/31/2025 3/31/2026 6/30/2026 9/30/2026 $ in th ou sa nd s $49,349 $19,237 $24,778 $20,275 $24,328 $76,880 $75,175 $72,494 $61,529 $57,326 Special Mention Substandard 9/30/2025 12/31/2025 3/31/2026 6/30/2026 9/30/2026 $6,158 $2,231 $24,328 Special Mention & Substandard Loans by Type $8,789 $7,911 $8,970 $7,229 30-89 Days Delinquent Loans, excluding Nonperforming Loans $94,412 $97,272 $81,804 Special Mention & Substandard Loans Asset Quality Improved QoQ and YoY Substandard loans ■ Decreased $4.2 million QoQ ■ Decreased $19.6 million, or 25%, YoY ■ $38.5 million on accrual status at 9/30/26 Special mention loans ■ Increased $4.1 million QoQ ■ Decreased $25.0 million, or 51%, YoY ■ All special mention loans are on accrual status 11 $126,229 $57,326 Third Quarter 2026 $81,654 $6,533
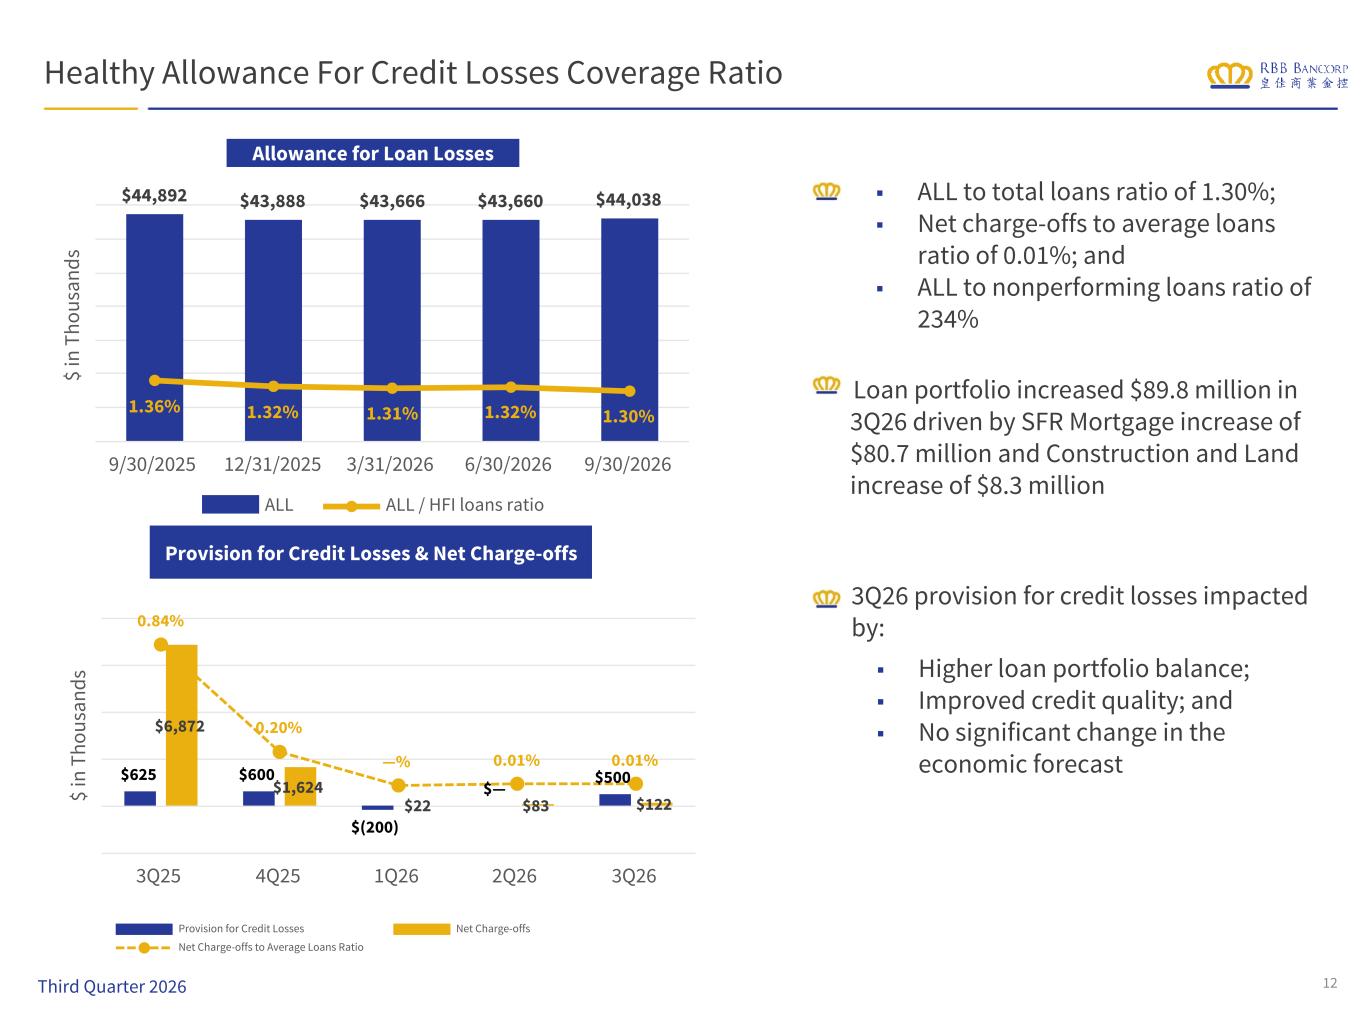
Provision for Credit Losses & Net Charge-offs Healthy Allowance For Credit Losses Coverage Ratio Loan portfolio increased $89.8 million in 3Q26 driven by SFR Mortgage increase of $80.7 million and Construction and Land increase of $8.3 million Allowance for Loan Losses (ALL) 12 $ in T ho us an ds $44,892 $43,888 $43,666 $43,660 $44,038 1.36% 1.32% 1.31% 1.32% 1.30% ALL ALL / HFI loans ratio 9/30/2025 12/31/2025 3/31/2026 6/30/2026 9/30/2026 $ in T ho us an ds $625 $600 $(200) $— $500 $6,872 $1,624 $22 $83 $122 0.84% 0.20% —% 0.01% 0.01% Provision for Credit Losses Net Charge-offs Net Charge-offs to Average Loans Ratio 3Q25 4Q25 1Q26 2Q26 3Q26 Third Quarter 2026 ■ Higher loan portfolio balance; ■ Improved credit quality; and ■ No significant change in the economic forecast 3Q26 provision for credit losses impacted by: ■ ALL to total loans ratio of 1.30%; ■ Net charge-offs to average loans ratio of 0.01%; and ■ ALL to nonperforming loans ratio of 234%
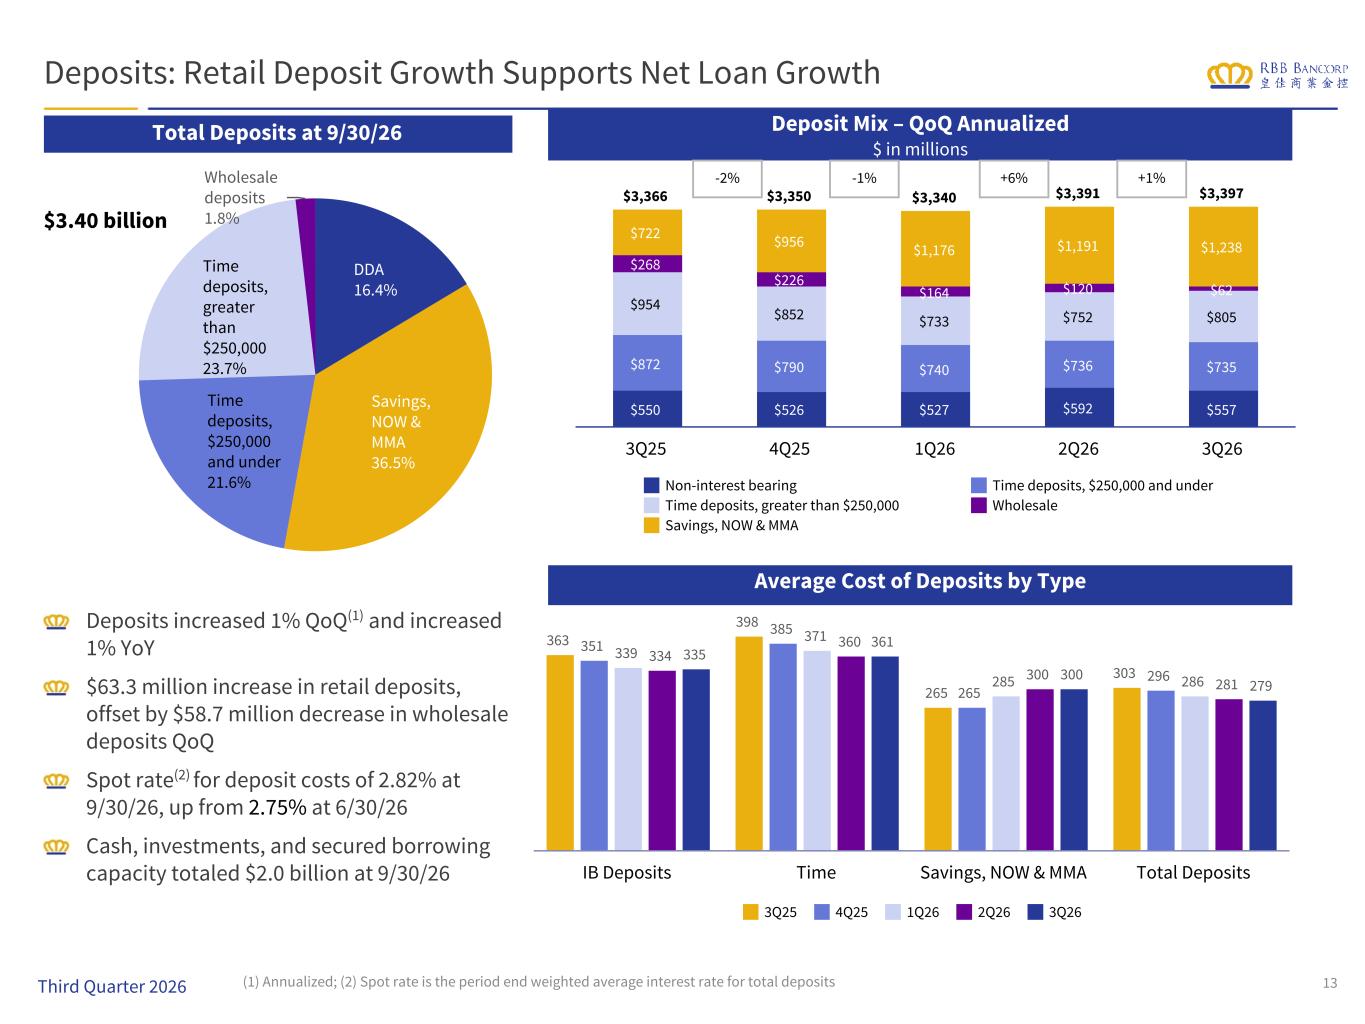
363 398 265 303 351 385 265 296 339 371 285 286 334 360 300 281 335 361 300 279 3Q25 4Q25 1Q26 2Q26 3Q26 IB Deposits Time Savings, NOW & MMA Total Deposits DDA 16.4% Savings, NOW & MMA 36.5% Time deposits, $250,000 and under 21.6% Time deposits, greater than $250,000 23.7% Wholesale deposits 1.8% Deposits: Retail Deposit Growth Supports Net Loan Growth Total Deposits at 9/30/26 $3.40 billion Deposit Mix – QoQ Annualized $ in millions Deposits increased 1% QoQ(1) and increased 1% YoY $63.3 million increase in retail deposits, offset by $58.7 million decrease in wholesale deposits QoQ Spot rate(2) for deposit costs of 2.82% at 9/30/26, up from 2.75% at 6/30/26 Cash, investments, and secured borrowing capacity totaled $2.0 billion at 9/30/26 (1) Annualized; (2) Spot rate is the period end weighted average interest rate for total deposits 13 $3,366 $3,350 $3,340 $3,391 $3,397 $550 $526 $527 $592 $557 $872 $790 $740 $736 $735 $954 $852 $733 $752 $805 $268 $226 $164 $120 $62 $722 $956 $1,176 $1,191 $1,238 Non-interest bearing Time deposits, $250,000 and under Time deposits, greater than $250,000 Wholesale Savings, NOW & MMA 3Q25 4Q25 1Q26 2Q26 3Q26 -2% -1% +6% +1% Third Quarter 2026 Average Cost of Deposits by Type
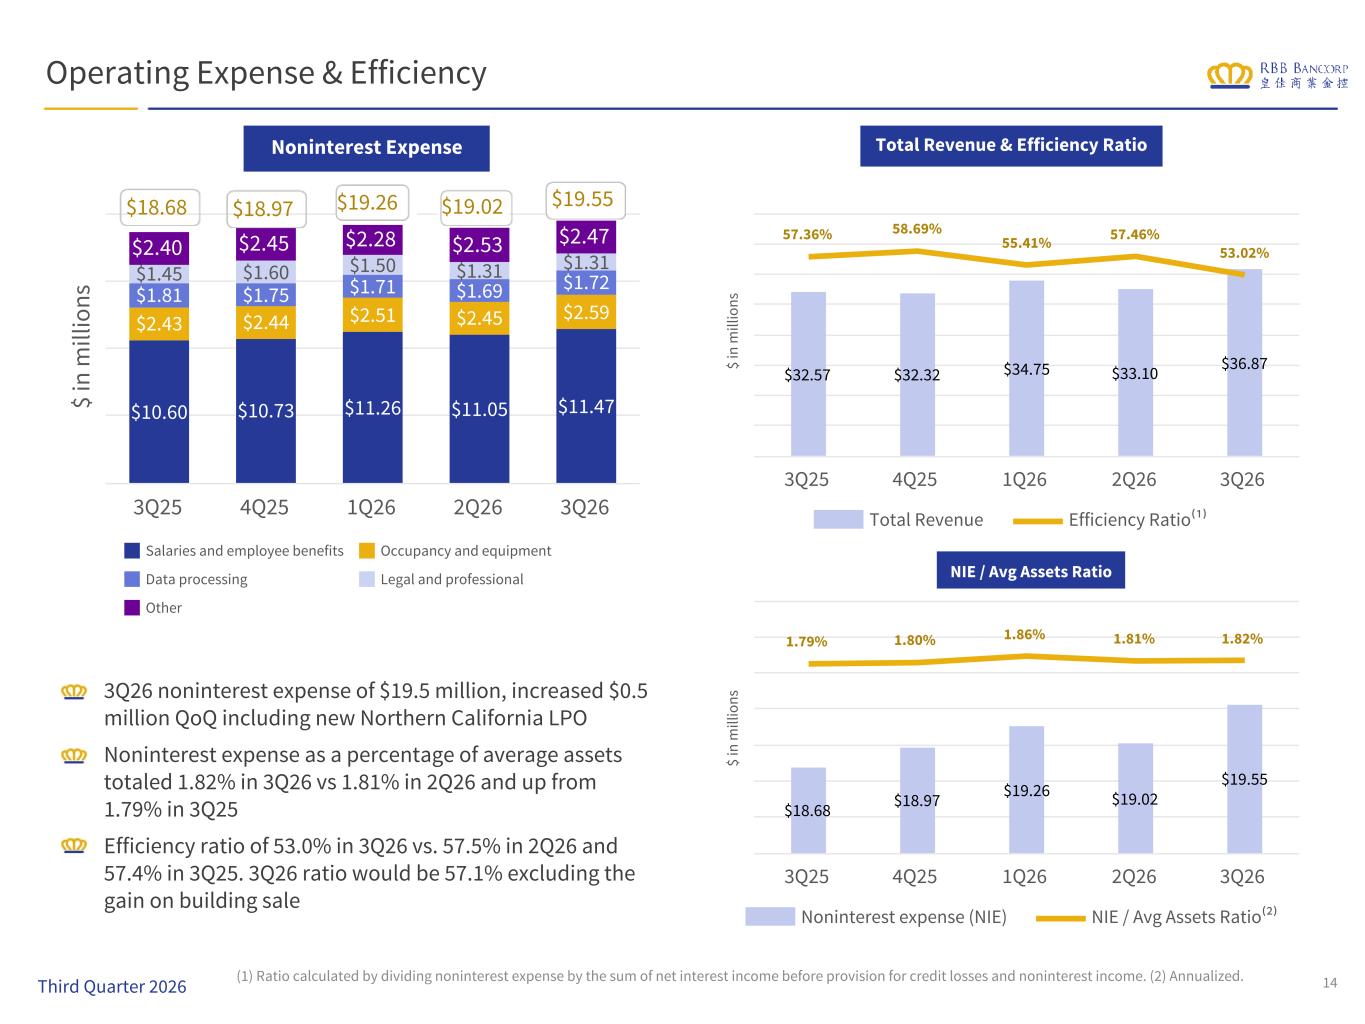
$ in m ill io ns $10.60 $10.73 $11.26 $11.05 $11.47 $2.43 $2.44 $2.51 $2.45 $2.59 $1.81 $1.75 $1.71 $1.69 $1.72$1.45 $1.60 $1.50 $1.31 $1.31 $2.40 $2.45 $2.28 $2.53 $2.47 Salaries and employee benefits Occupancy and equipment Data processing Legal and professional Other 3Q25 4Q25 1Q26 2Q26 3Q26 14 Operating Expense & Efficiency 3Q26 noninterest expense of $19.5 million, increased $0.5 million QoQ including new Northern California LPO Noninterest expense as a percentage of average assets totaled 1.82% in 3Q26 vs 1.81% in 2Q26 and up from 1.79% in 3Q25 Efficiency ratio of 53.0% in 3Q26 vs. 57.5% in 2Q26 and 57.4% in 3Q25. 3Q26 ratio would be 57.1% excluding the gain on building sale (1) Ratio calculated by dividing noninterest expense by the sum of net interest income before provision for credit losses and noninterest income. (2) Annualized. $18.68 $19.26 $19.02 $19.55 Noninterest Expense Total Revenue & Efficiency Ratio NIE / Avg Assets Ratio $18.97 $ in m ill io ns $32.57 $32.32 $34.75 $33.10 $36.87 57.36% 58.69% 55.41% 57.46% 53.02% Total Revenue Efficiency Ratio⁽¹⁾ 3Q25 4Q25 1Q26 2Q26 3Q26 $ in m ill io ns $18.68 $18.97 $19.26 $19.02 $19.55 1.79% 1.80% 1.86% 1.81% 1.82% Noninterest expense (NIE) NIE / Avg Assets Ratio⁽²⁾ 3Q25 4Q25 1Q26 2Q26 3Q26 Third Quarter 2026
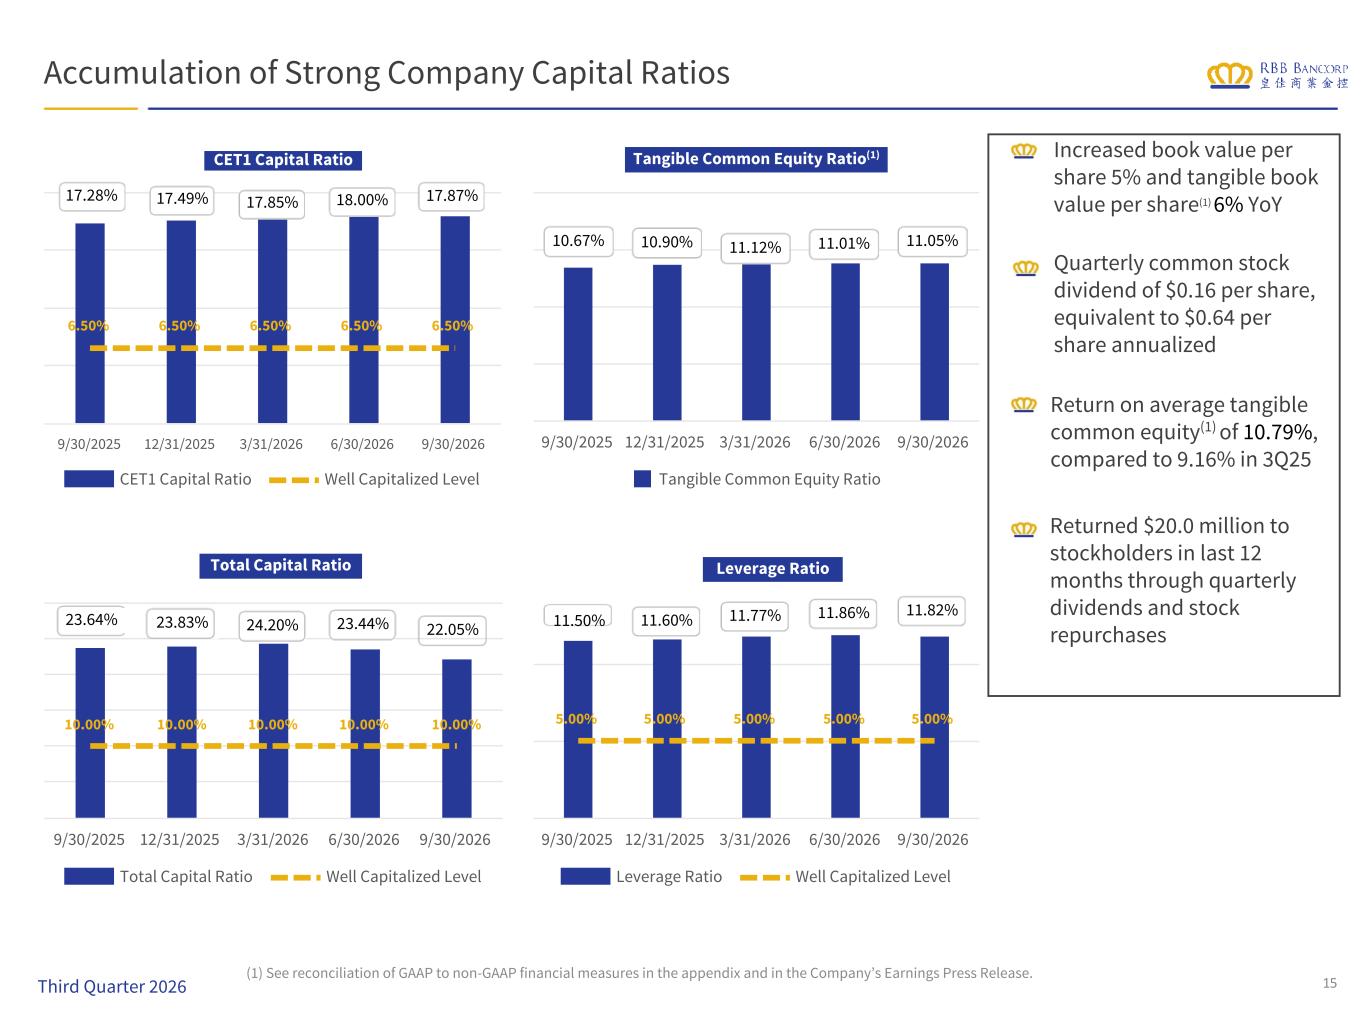
5.00% 5.00% 5.00% 5.00% 5.00% Leverage Ratio Well Capitalized Level 9/30/2025 12/31/2025 3/31/2026 6/30/2026 9/30/2026 10.00% 10.00% 10.00% 10.00% 10.00% Total Capital Ratio Well Capitalized Level 9/30/2025 12/31/2025 3/31/2026 6/30/2026 9/30/2026 Tangible Common Equity Ratio 9/30/2025 12/31/2025 3/31/2026 6/30/2026 9/30/2026 6.50% 6.50% 6.50% 6.50% 6.50% CET1 Capital Ratio Well Capitalized Level 9/30/2025 12/31/2025 3/31/2026 6/30/2026 9/30/2026 Accumulation of Strong Company Capital Ratios Increased book value per share 5% and tangible book value per share(1) 6% YoY Quarterly common stock dividend of $0.16 per share, equivalent to $0.64 per share annualized Return on average tangible common equity(1) of 10.79%, compared to 9.16% in 3Q25 Returned $20.0 million to stockholders in last 12 months through quarterly dividends and stock repurchases 17.28% 17.49% 17.85% 18.00% 17.87% CET1 Capital Ratio 23.64% 23.83% 24.20% 23.44% 22.05% Total Capital Ratio 10.67% 10.90% 11.12% 11.01% 11.05% Tangible Common Equity Ratio(1) 11.50% 11.60% 11.77% 11.86% 11.82% Leverage Ratio (1) See reconciliation of GAAP to non-GAAP financial measures in the appendix and in the Company’s Earnings Press Release. 15Third Quarter 2026
Appendix: Non-GAAP Reconciliations 16
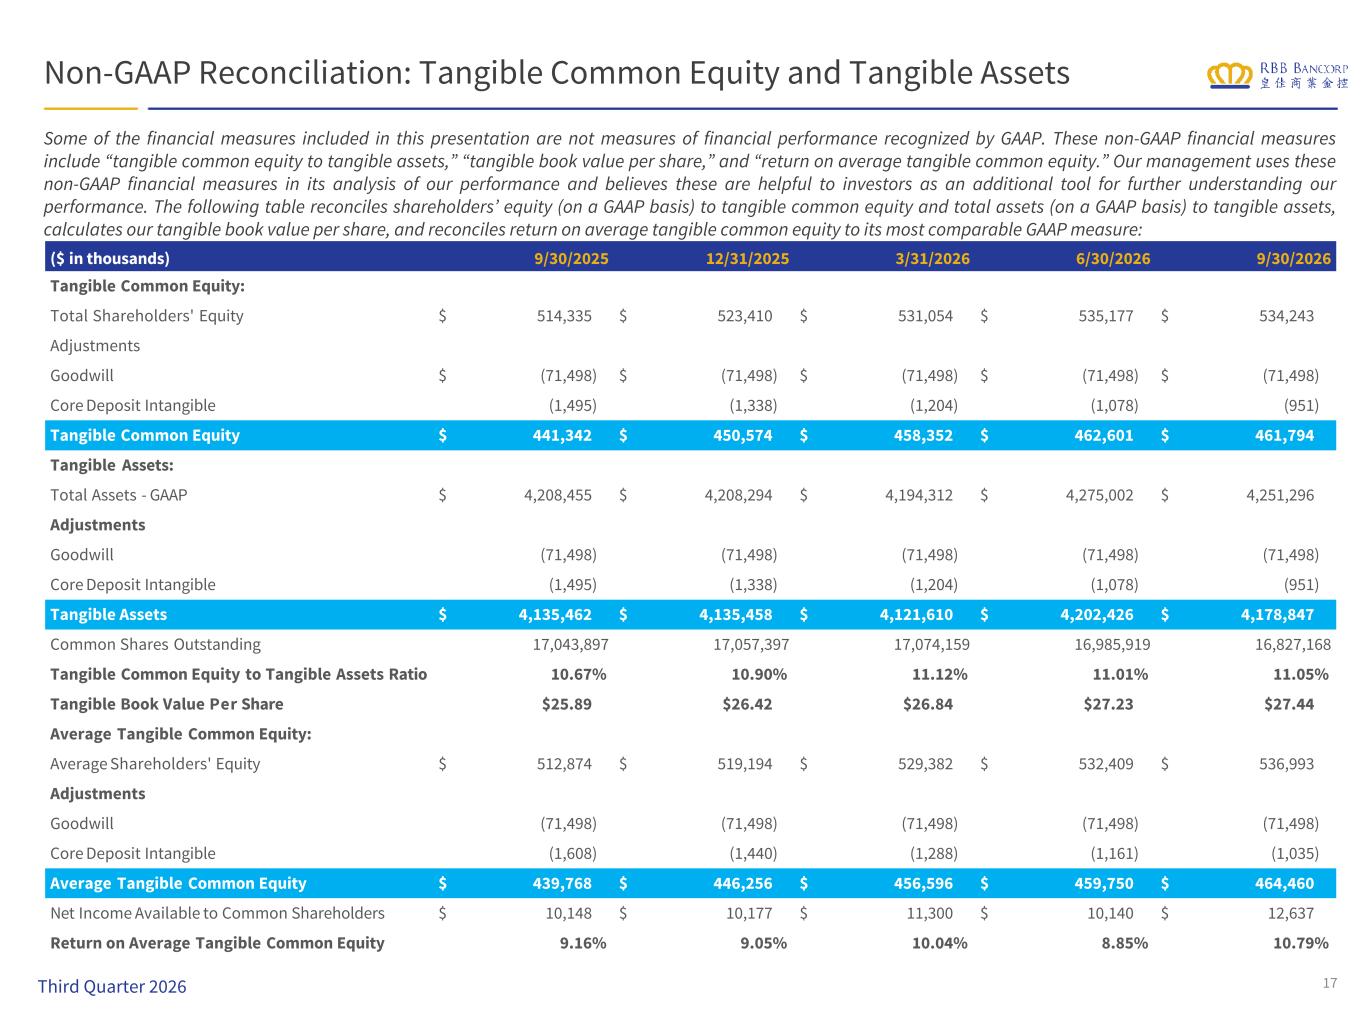
Non-GAAP Reconciliation: Tangible Common Equity and Tangible Assets Some of the financial measures included in this presentation are not measures of financial performance recognized by GAAP. These non-GAAP financial measures include “tangible common equity to tangible assets,” “tangible book value per share,” and “return on average tangible common equity.” Our management uses these non-GAAP financial measures in its analysis of our performance and believes these are helpful to investors as an additional tool for further understanding our performance. The following table reconciles shareholders’ equity (on a GAAP basis) to tangible common equity and total assets (on a GAAP basis) to tangible assets, calculates our tangible book value per share, and reconciles return on average tangible common equity to its most comparable GAAP measure: 17 ($ in thousands) 9/30/2025 12/31/2025 3/31/2026 6/30/2026 9/30/2026 Tangible Common Equity: Total Shareholders' Equity $ 514,335 $ 523,410 $ 531,054 $ 535,177 $ 534,243 Adjustments Goodwill $ (71,498) $ (71,498) $ (71,498) $ (71,498) $ (71,498) Core Deposit Intangible (1,495) (1,338) (1,204) (1,078) (951) Tangible Common Equity $ 441,342 $ 450,574 $ 458,352 $ 462,601 $ 461,794 Tangible Assets: Total Assets - GAAP $ 4,208,455 $ 4,208,294 $ 4,194,312 $ 4,275,002 $ 4,251,296 Adjustments Goodwill (71,498) (71,498) (71,498) (71,498) (71,498) Core Deposit Intangible (1,495) (1,338) (1,204) (1,078) (951) Tangible Assets $ 4,135,462 $ 4,135,458 $ 4,121,610 $ 4,202,426 $ 4,178,847 Common Shares Outstanding 17,043,897 17,057,397 17,074,159 16,985,919 16,827,168 Tangible Common Equity to Tangible Assets Ratio 10.67% 10.90% 11.12% 11.01% 11.05% Tangible Book Value Per Share $25.89 $26.42 $26.84 $27.23 $27.44 Average Tangible Common Equity: Average Shareholders' Equity $ 512,874 $ 519,194 $ 529,382 $ 532,409 $ 536,993 Adjustments Goodwill (71,498) (71,498) (71,498) (71,498) (71,498) Core Deposit Intangible (1,608) (1,440) (1,288) (1,161) (1,035) Average Tangible Common Equity $ 439,768 $ 446,256 $ 456,596 $ 459,750 $ 464,460 Net Income Available to Common Shareholders $ 10,148 $ 10,177 $ 11,300 $ 10,140 $ 12,637 Return on Average Tangible Common Equity 9.16% 9.05% 10.04% 8.85% 10.79% Third Quarter 2026
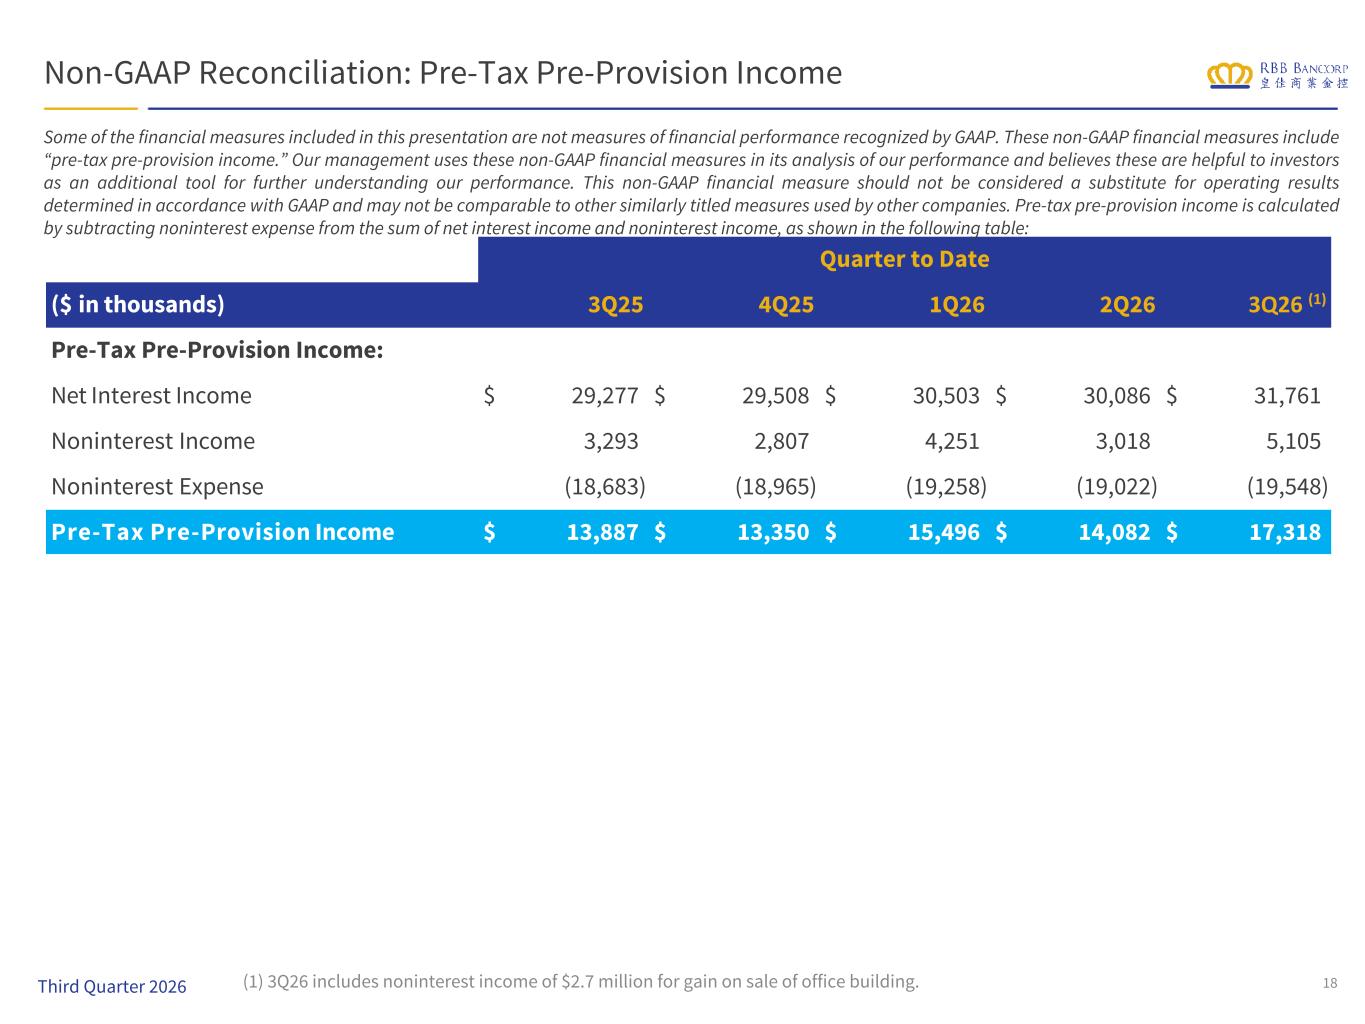
Non-GAAP Reconciliation: Pre-Tax Pre-Provision Income Quarter to Date ($ in thousands) 3Q25 4Q25 1Q26 2Q26 3Q26 (1) Pre-Tax Pre-Provision Income: Net Interest Income $ 29,277 $ 29,508 $ 30,503 $ 30,086 $ 31,761 Noninterest Income 3,293 2,807 4,251 3,018 5,105 Noninterest Expense (18,683) (18,965) (19,258) (19,022) (19,548) Pre-Tax Pre-Provision Income $ 13,887 $ 13,350 $ 15,496 $ 14,082 $ 17,318 18 Some of the financial measures included in this presentation are not measures of financial performance recognized by GAAP. These non-GAAP financial measures include “pre-tax pre-provision income.” Our management uses these non-GAAP financial measures in its analysis of our performance and believes these are helpful to investors as an additional tool for further understanding our performance. This non-GAAP financial measure should not be considered a substitute for operating results determined in accordance with GAAP and may not be comparable to other similarly titled measures used by other companies. Pre-tax pre-provision income is calculated by subtracting noninterest expense from the sum of net interest income and noninterest income, as shown in the following table: Third Quarter 2026 (1) 3Q26 includes noninterest income of $2.7 million for gain on sale of office building.