Executive Vice President and Chief Financial Officer
858-350-2607
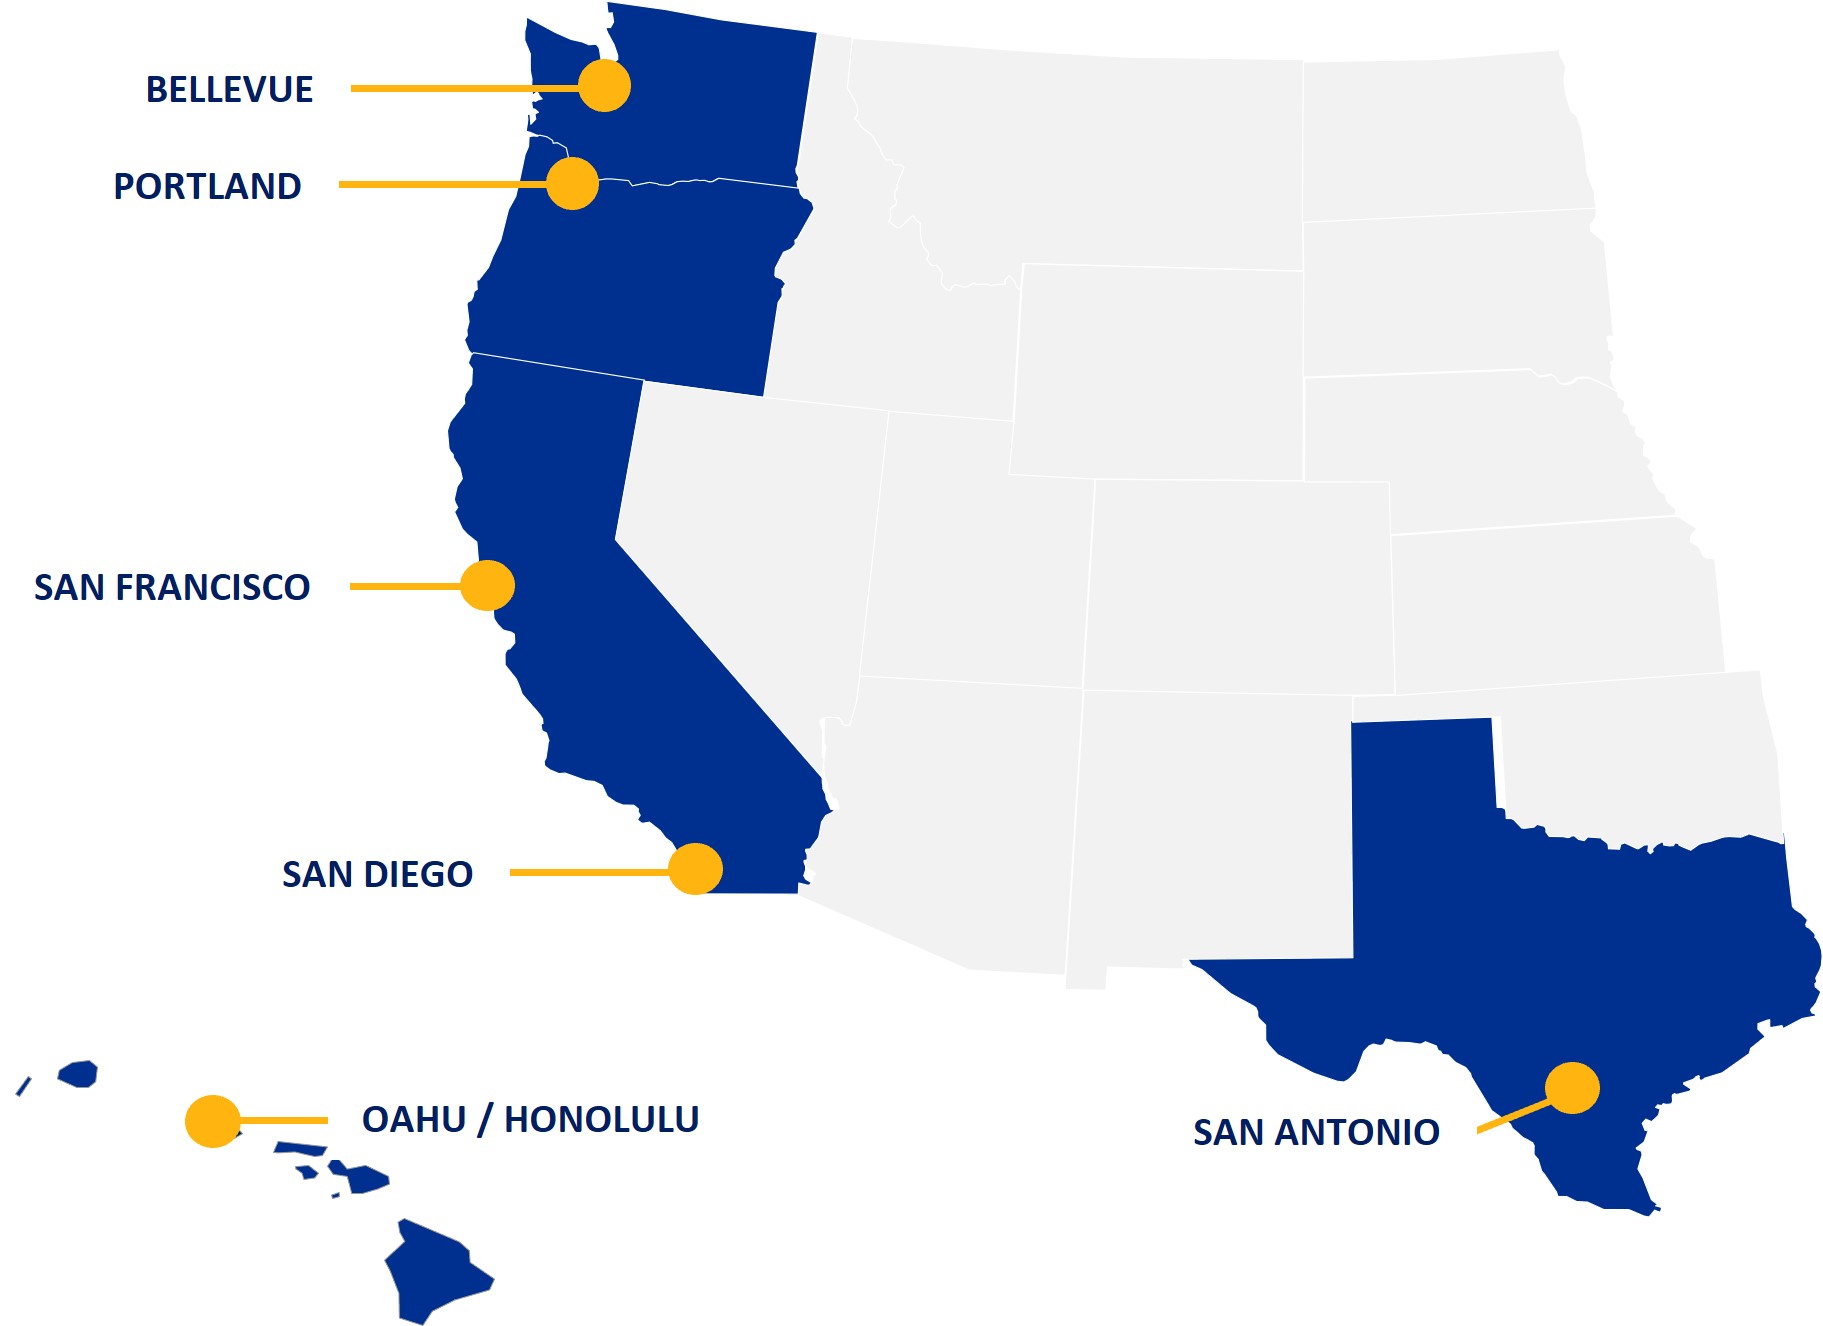
American Assets Trust, Inc.'s Portfolio is concentrated in high-barrier-to-entry markets
with favorable supply/demand characteristics
Office
Retail
Multifamily
Mixed-Use
Market
Square Feet
Square Feet
Units
Square Feet
Suites
San Diego
1,802,809
1,322,200
1,645
(1)
—
—
Bellevue
1,028,470
—
—
—
—
Portland
930,903
44,236
657
—
—
San Antonio
—
588,148
—
—
—
San Francisco
511,493
35,097
—
—
—
Oahu
—
430,288
—
93,925
369
Total
4,273,675
2,419,969
2,302
93,925
369
Square Feet
%
NOI % (2)
Note: Circled areas represent all markets in which American Assets Trust, Inc. currently owns and operates its real estate properties. Net rentable square footage may be adjusted from the prior periods to reflect re-measurement of leased space at the properties.
Office
4.3
million
64%
53%
Retail (3)
2.4
million
36%
24%
Data is as of March 31, 2026.
Totals
6.7
million
(1) Includes 120 RV spaces.
(2) Percentage of Net Operating Income (NOI) calculated for the three months ended March 31, 2026. NOI is a non-GAAP supplemental earnings measure which we consider meaningful in measuring our operating performance. Reconciliations of NOI to net income are included in the Glossary of Terms.
This Supplemental Information contains forward-looking statements within the meaning of the Private Securities Litigation Reform Act of 1995 (set forth in Section 27A of the Securities Act of 1933, as amended, or the Securities Act, and Section 21E of the Securities Exchange Act of 1934, as amended, or the Exchange Act). Forward-looking statements involve numerous risks and uncertainties and you should not rely on them as predictions of future events. Forward-looking statements depend on assumptions, data or methods which may be incorrect or imprecise and we may not be able to realize them. We do not guarantee that the transactions and events described will happen as described (or that they will happen at all). The following factors, among others, could cause actual results and future events to differ materially from those set forth or contemplated in the forward-looking statements: adverse economic or real estate developments in our markets; defaults on, early terminations of or non-renewal of leases by tenants, including significant tenants; decreased rental rates or increased vacancy rates; our failure to generate sufficient cash flows to service our outstanding indebtedness; fluctuations in interest rates and increased operating costs; our failure to obtain necessary outside financing; our inability to develop or redevelop our properties due to market conditions; investment returns from our developed properties may be less than anticipated; general economic conditions, including the impact of tariffs and other trade restrictions; the potential impact of a prolonged government shutdown; financial market fluctuations; risks that affect the general office, retail, multifamily and mixed-use environment; the competitive environment in which we operate; system failures or security incidents through cyberattacks; the impact of epidemics, pandemics, or other outbreaks of illness, disease or virus and the actions taken by government authorities and others related thereto, including the ability of our company, our properties and our tenants to operate; difficulties in identifying properties to acquire and completing acquisitions; our failure to successfully operate acquired properties and operations; risks related to joint venture arrangements; potential litigation; difficulties in completing dispositions; conflicts of interests with our officers or directors; lack or insufficient amounts of insurance; environmental uncertainties and risks related to adverse weather conditions and natural disasters; other factors affecting the real estate industry generally; limitations imposed on our business and our ability to satisfy complex rules in order for American Assets Trust, Inc. to continue to qualify as a REIT, for U.S. federal income tax purposes; and changes in governmental regulations or interpretations thereof, such as real estate and zoning laws and increases in real property tax rates and taxation of REITs.
While forward-looking statements reflect our good faith beliefs, they are not guarantees of future performance. We disclaim any obligation to publicly update or revise any forward-looking statement to reflect changes in underlying assumptions or factors, or new information, data or methods, future events or other changes. For a further discussion of these and other factors that could impact our future results, refer to our most recent Annual Report on Form 10-K and other risks described in documents subsequently filed by us from time to time with the Securities and Exchange Commission.
First Quarter 2026 Supplemental Information
Page 3
FINANCIAL HIGHLIGHTS
First Quarter 2026 Supplemental Information
Page 4
CONSOLIDATED BALANCE SHEETS
(Amounts in thousands, except shares and per share data)
March 31, 2026
December 31, 2025
ASSETS
(unaudited)
Real estate, at cost
Operating real estate
$
3,703,308
$
3,694,203
Construction in progress
75,226
68,937
Held for development
487
487
3,779,021
3,763,627
Accumulated depreciation
(1,167,625)
(1,144,259)
Net real estate
2,611,396
2,619,368
Cash and cash equivalents
118,340
129,362
Accounts receivable, net
6,728
7,407
Deferred rent receivable, net
84,333
84,642
Other assets, net
79,770
80,497
TOTAL ASSETS
$
2,900,567
$
2,921,276
LIABILITIES AND EQUITY
LIABILITIES:
Secured notes payable, net
$
74,872
$
74,849
Unsecured notes payable, net
1,613,295
1,612,761
Accounts payable and accrued expenses
68,901
71,094
Security deposits payable
10,503
10,063
Other liabilities and deferred credits, net
60,279
61,304
Total liabilities
1,827,850
1,830,071
Commitments and contingencies
EQUITY:
American Assets Trust, Inc. stockholders' equity
Common stock, $0.01 par value, 490,000,000 shares authorized, 61,390,936 and 61,390,936 shares issued and outstanding at March 31, 2026 and December 31, 2025, respectively
614
614
Additional paid in capital
1,481,552
1,479,870
Accumulated dividends in excess of net income
(346,589)
(331,086)
Accumulated other comprehensive income
998
1,419
Total American Assets Trust, Inc. stockholders' equity
1,136,575
1,150,817
Noncontrolling interests
(63,858)
(59,612)
Total equity
1,072,717
1,091,205
TOTAL LIABILITIES AND EQUITY
$
2,900,567
$
2,921,276
First Quarter 2026 Supplemental Information
Page 5
CONSOLIDATED STATEMENTS OF OPERATIONS
(Unaudited, amounts in thousands, except shares and per share data)
Three Months Ended
March 31,
2026
2025
REVENUE:
Rental income
$
104,422
$
102,951
Other property income
6,170
5,656
Total revenue
110,592
108,607
EXPENSES:
Rental expenses
31,720
30,300
Real estate taxes
11,946
11,005
General and administrative
8,783
9,312
Depreciation and amortization
32,311
30,494
Total operating expenses
84,760
81,111
Gain on sale of real estate
—
44,476
OPERATING INCOME
25,832
71,972
Interest expense, net
(19,707)
(18,780)
Other income, net
614
915
NET INCOME
6,739
54,107
Net income attributable to restricted shares
(236)
(203)
Net income attributable to unitholders in the Operating Partnership
(1,369)
(11,369)
NET INCOME ATTRIBUTABLE TO AMERICAN ASSETS TRUST, INC. STOCKHOLDERS
$
5,134
$
42,535
EARNINGS PER COMMON SHARE
Basic income from operations attributable to common stockholders per share
$
0.08
$
0.70
Weighted average shares of common stock outstanding - basic
60,697,679
60,537,300
Diluted income from continuing operations attributable to common stockholders per share
$
0.08
$
0.70
Weighted average shares of common stock outstanding - diluted
76,879,216
76,718,837
First Quarter 2026 Supplemental Information
Page 6
FUNDS FROM OPERATIONS, FFO AS ADJUSTED & FUNDS AVAILABLE FOR DISTRIBUTION
(Unaudited, amounts in thousands, except shares and per share data)
Three Months Ended
March 31,
2026
2025
Funds from Operations (FFO) (1)
Net income
$
6,739
$
54,107
Depreciation and amortization of real estate assets
32,311
30,494
Gain on sale of real estate
—
(44,476)
FFO, as defined by NAREIT
39,050
40,125
Less: Nonforfeitable dividends on restricted stock awards
(216)
(180)
FFO attributable to common stock and common units
$
38,834
$
39,945
FFO per diluted share/unit
$
0.51
$
0.52
Weighted average number of common shares and common units, diluted (2)
76,893,750
76,719,191
Funds Available for Distribution (FAD) (1)
$
23,858
$
29,305
Dividends
Dividends declared and paid
$
26,375
$
26,288
Dividends declared and paid per share/unit
$
0.340
$
0.340
FFO and FAD are non-GAAP supplemental earnings measures which we consider meaningful in measuring our operating performance.
First Quarter 2026 Supplemental Information
Page 7
FUNDS FROM OPERATIONS, FFO AS ADJUSTED & FUNDS AVAILABLE FOR DISTRIBUTION (CONTINUED)
(Unaudited, amounts in thousands, except shares and per share data)
Three Months Ended
March 31,
2026
2025
Funds Available for Distribution (FAD) (1)
FFO
$
39,050
$
40,125
Adjustments:
Tenant improvements, leasing commissions and capital expenditures
(16,743)
(12,872)
Net effect of straight-line rents (3)
(257)
355
Amortization of net above (below) market rents (4)
(417)
(550)
Net effect of other lease assets (5)
78
29
Amortization of debt issuance costs and debt fair value adjustment
681
728
Non-cash compensation expense
1,682
1,670
Nonforfeitable dividends on restricted stock awards
(216)
(180)
FAD
$
23,858
$
29,305
Summary of Capital Expenditures
Tenant improvements and leasing commissions
$
10,605
$
7,875
Capital expenditures
6,138
4,997
$
16,743
$
12,872
Notes:
(1) See Glossary of Terms.
(2) For the three months ended March 31, 2026 and 2025, the weighted average common shares and common units used to compute FFO per diluted share/unit included operating partnership common units and unvested restricted stock awards that are subject to time vesting. The shares/units used to compute FFO per diluted share/unit include additional shares/units which were excluded from the computation of diluted EPS, as they were anti-dilutive for the periods presented.
(3) Represents the straight-line rent income recognized during the period offset by cash received during the period and the provision for bad debts recorded for deferred rent receivable balances.
(4) Represents the adjustment related to the acquisition of buildings with above (below) market rents.
(5) Represents adjustments related to amortization of lease incentives paid to tenants, amortization of lease intangibles, and straight-line rent expense for our leases at the Annex at The Landmark at One Market.
FFO and FAD are non-GAAP supplemental earnings measures which we consider meaningful in measuring our operating performance.
First Quarter 2026 Supplemental Information
Page 8
SAME-STORE NET OPERATING INCOME (NOI)
(Unaudited, amounts in thousands)
Three Months Ended March 31, 2026 (1)
Office
Retail
Multifamily
Mixed-Use
Total
Real estate rental revenue
Same-store
$
51,516
$
23,326
$
16,920
$
16,695
$
108,457
Non-same store
841
18
1,276
—
2,135
Total
52,357
23,344
18,196
16,695
110,592
Real estate expenses
Same-store
15,854
6,980
7,373
11,478
41,685
Non-same store
1,165
21
795
—
1,981
Total
17,019
7,001
8,168
11,478
43,666
Net Operating Income (NOI)
Same-store
35,662
16,346
9,547
5,217
66,772
Non-same store
(324)
(3)
481
—
154
Total
$
35,338
$
16,343
$
10,028
$
5,217
$
66,926
Same-store NOI
$
35,662
$
16,346
$
9,547
$
5,217
$
66,772
Net effect of straight-line rents (2)
(172)
20
301
2
151
Amortization of net above (below) market rents (3)
(310)
(107)
—
—
(417)
Net effect of other lease assets (4)
55
11
—
—
66
Lease termination fees and tenant improvement reimbursements (5)
(200)
(1)
—
—
(201)
Same-store cash NOI (5)
$
35,035
$
16,269
$
9,848
$
5,219
$
66,371
Notes:
(1) Same-store and non-same store classifications are determined based on properties held on March 31, 2026 and 2025. See Glossary of Terms.
(2) Represents the straight-line rent income recognized during the period offset by cash received during the period and the provision for bad debts recorded for deferred rent receivable balances.
(3) Represents the adjustment related to the acquisition of buildings with above (below) market rents.
(4) Represents adjustments related to amortization of lease incentives paid to tenants, amortization of lease intangibles and straight-line rent expense for our leases at the Annex at The Landmark at One Market.
(5) Lease termination fees and tenant improvement reimbursements are excluded from same-store cash NOI to provide a more accurate measure of operating performance.
NOI and same-store cash NOI are non-GAAP supplemental earnings measures which we consider meaningful in measuring our operating performance. Reconciliations of NOI and same-store cash NOI to net income are included in the Glossary of Terms.
First Quarter 2026 Supplemental Information
Page 9
SAME-STORE CASH NOI COMPARISON
(Unaudited, amounts in thousands)
Three Months Ended
March 31,
2026
2025
Change
Cash Basis:
Office
$
35,035
$
35,074
(0.1)
%
Retail
16,269
16,383
(0.7)
Multifamily
9,848
9,562
3.0
Mixed-Use
5,219
5,363
(2.7)
Same-store Cash NOI (1)(2)
$
66,371
$
66,382
—
%
Notes:
(1) Lease termination fees and tenant improvement reimbursements are excluded from same-store cash NOI to provide a more accurate measure of operating performance.
(2) See Glossary of Terms.
Same-store cash NOI is a non-GAAP supplemental earnings measure which we consider meaningful in measuring our operating performance. A reconciliation of same-store cash NOI to net income is included in the Glossary of Terms.
First Quarter 2026 Supplemental Information
Page 10
CASH NOI BY REGION
(Unaudited, amounts in thousands)
Three Months Ended March 31, 2026
Office
Retail
Multifamily
Mixed-Use
Total
Cash Basis:
Southern California
$
14,379
$
8,947
$
8,872
$
—
$
32,198
Northern California
7,429
290
—
—
7,719
Hawaii
—
2,964
—
5,219
8,183
Oregon
4,478
151
1,457
—
6,086
Texas
—
3,915
—
—
3,915
Washington
7,985
—
—
—
7,985
Total Cash NOI
$
34,271
$
16,267
$
10,329
$
5,219
$
66,086
Cash NOI is a non-GAAP supplemental earnings measure which we consider meaningful in measuring our operating performance. A reconciliation of cash NOI to net income is included in the Glossary of Terms.
First Quarter 2026 Supplemental Information
Page 11
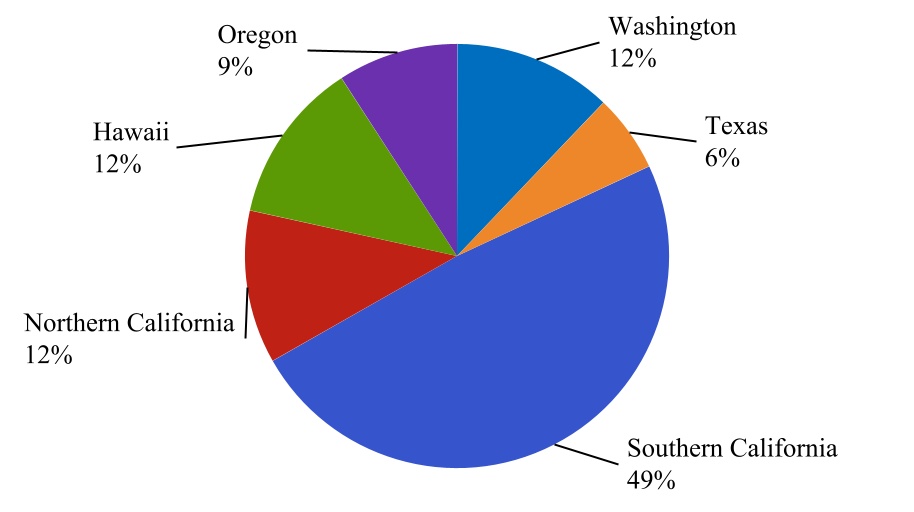
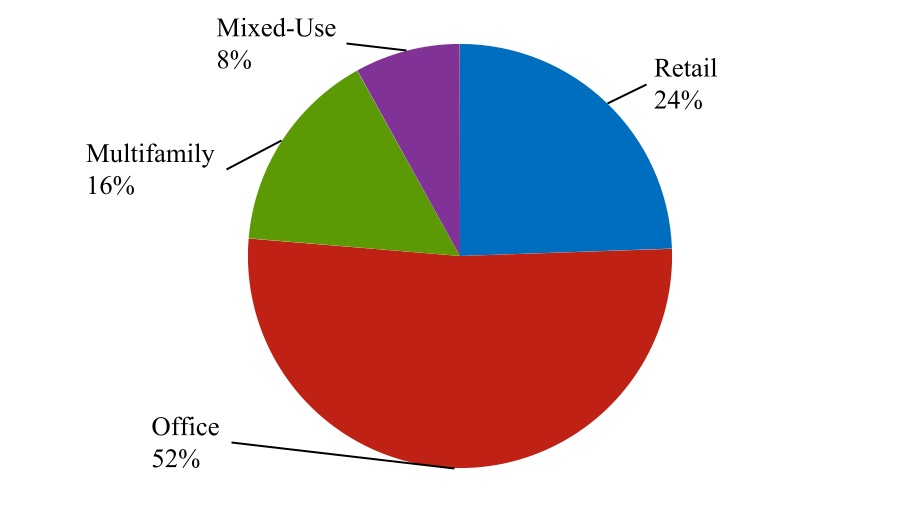
CASH NOI BREAKDOWN
Three Months Ended March 31, 2026
Cash NOI Breakdown
Portfolio Diversification by Geographic Region
Portfolio Diversification by Segment
Cash NOI is a non-GAAP supplemental earnings measure which we consider meaningful in measuring our operating performance. A reconciliation of cash NOI to net income is included in the Glossary of Terms.
First Quarter 2026 Supplemental Information
Page 12
PROPERTY REVENUE AND OPERATING EXPENSES
(Unaudited, amounts in thousands)
Three Months Ended March 31, 2026
Additional
Property
Property
Billed Expense
Operating
Rental
Cash
Property
Base Rent (1)
Income (2)
Reimbursements (3)
Expenses (4)
Adjustments (5)
NOI (6)
Office Portfolio
La Jolla Commons
$
10,049
$
414
$
2,321
$
(4,185)
$
(454)
$
8,145
Coastal Collection at Torrey Reserve (7)
6,240
67
376
(1,978)
(677)
4,028
Torrey Point (8)
1,544
94
28
(428)
(384)
854
Solana Crossing
2,160
22
146
(571)
(401)
1,356
The Landmark at One Market
10,699
87
570
(3,639)
—
7,717
One Beach Street
—
—
—
(288)
—
(288)
First & Main
2,234
272
428
(992)
(188)
1,754
Lloyd Portfolio (8)
3,976
482
272
(1,624)
(278)
2,828
City Center Bellevue
7,057
579
365
(1,835)
(128)
6,038
14Acres
961
66
260
(648)
(224)
415
Timber Ridge
1,392
60
486
(463)
(305)
1,170
Timber Springs
457
12
188
(265)
(30)
362
Subtotal Office Portfolio
$
46,769
$
2,155
$
5,440
$
(16,916)
$
(3,069)
$
34,379
Retail Portfolio
Carmel Country Plaza
$
1,060
$
20
$
227
$
(234)
$
(26)
$
1,047
Carmel Mountain Plaza
3,680
55
1,028
(1,009)
24
3,778
South Bay Marketplace
635
40
230
(235)
—
670
Gateway Marketplace
544
—
173
(259)
—
458
Lomas Santa Fe Plaza
1,655
17
302
(487)
(15)
1,472
Solana Beach Towne Centre
1,747
4
522
(711)
(40)
1,522
Geary Marketplace
317
38
95
(160)
—
290
The Shops at Kalakaua
305
27
50
(95)
—
287
Waikele Center
3,213
286
961
(1,783)
—
2,677
Alamo Quarry Market
4,055
136
1,629
(1,906)
1
3,915
Hassalo on Eighth - Retail
215
18
39
(121)
—
151
Subtotal Retail Portfolio
$
17,426
$
641
$
5,256
$
(7,000)
$
(56)
$
16,267
First Quarter 2026 Supplemental Information
Page 13
PROPERTY REVENUE AND OPERATING EXPENSES (CONTINUED)
(Unaudited, amounts in thousands)
Three Months Ended March 31, 2026
Additional
Property
Property
Billed Expense
Operating
Rental
Cash
Property
Base Rent (1)
Income (2)
Reimbursements (3)
Expenses (4)
Adjustments (5)
NOI (6)
Multifamily Portfolio
Loma Palisades
$
4,537
$
280
$
—
$
(1,824)
$
(9)
$
2,984
Imperial Beach Gardens
1,218
74
—
(518)
(15)
759
Mariner's Point
569
31
—
(251)
(16)
333
Santa Fe Park RV Resort
263
27
—
(251)
—
39
Pacific Ridge Apartments
6,533
280
—
(2,527)
(10)
4,276
Genesee Park (9)
1,263
13
—
(795)
—
481
Hassalo on Eighth - Multifamily
2,993
586
—
(2,001)
(121)
1,457
Subtotal Multifamily Portfolio
$
17,376
$
1,291
$
—
$
(8,167)
$
(171)
$
10,329
Mixed-Use Portfolio
Waikiki Beach Walk - Retail
$
2,430
$
1,301
$
952
$
(1,889)
$
(10)
$
2,784
Waikiki Beach Walk - Embassy Suites™
10,117
1,907
—
(9,589)
—
2,435
Subtotal Mixed-Use Portfolio
$
12,547
$
3,208
$
952
$
(11,478)
$
(10)
$
5,219
Subtotal Development Properties
$
—
$
13
$
—
$
(121)
$
—
$
(108)
Total
$
94,118
$
7,308
$
11,648
$
(43,682)
$
(3,306)
$
66,086
Cash NOI is a non-GAAP supplemental earnings measure which the company considers meaningful in measuring its operating performance. A reconciliation of total cash NOI to net income is included in the Glossary of Terms.
Notes:
(1) Base rent for our office and retail portfolios and the retail portion of our mixed-use portfolio represents base rent for the three months ended March 31, 2026 (before deferrals, abatements, and tenant improvement reimbursements) and excludes the impact of straight-line rent and above (below) market rent adjustments. Total abatements for our office portfolio and retail portfolio were approximately $3.1 million and $0.1 million, respectively, for the three months ended March 31, 2026. Total abatements for our mixed-use portfolio were minimal for the three months ended March 31, 2026. In the case of triple net or modified gross leases, annualized base rent does not include tenant reimbursements for real estate taxes, insurance, common area or other operating expenses. Multifamily portfolio base rent represents base rent (including parking, before abatements) less vacancy allowance and employee rent credits and includes additional rents (which include insufficient notice penalties, month-to-month charges and pet rent). There were $0.2 million of abatements for our multifamily portfolio for the three months ended March 31, 2026. For Waikiki Beach Walk - Embassy SuitesTM, base rent is equal to the actual room revenue for the three months ended March 31, 2026. Total tenant improvement reimbursements for our office portfolio, retail portfolio and the retail portion of our mixed-use portfolio were approximately $0.2 million in the aggregate for the three months ended March 31, 2026. A reconciliation of base rent to rental income is shown below:
Base Rent
$
94,118
Billed Expense Reimbursement
11,648
Percentage Rent
465
Straight-line rent components
257
Other Rental Income*
(2,066)
Rental Income
$
104,422
* Other rental income includes rent abatement, rent deferral, above market rent, below market rent, lease incentives, tenant improvement reimbursement, storage rent and other miscellaneous rental income.
First Quarter 2026 Supplemental Information
Page 14
PROPERTY REVENUE AND OPERATING EXPENSES (CONTINUED)
(2) Represents additional property-related income for the three months ended March 31, 2026, which includes (i) percentage rent, (ii) other rent (such as storage rent, license fees and association fees) and (iii) other property income (such as late fees, default fees, parking revenue, the reimbursement of general excise taxes, laundry income and food and beverage sales), and excludes lease termination fees.
(3) Represents billed tenant expense reimbursements for the three months ended March 31, 2026.
(4) Represents property operating expenses for the three months ended March 31, 2026. Property operating expenses includes all rental expenses, except non cash rent expense.
(5) Represents rental adjustments related to base rent (deferrals and abatements).
(6) See Glossary of Terms.
(7) Coastal Collection at Torrey Reserve was formerly known as Torrey Reserve Campus.
(8) Base rent shown includes amounts related to American Assets Trust, L.P.'s corporate leases at Torrey Point and Lloyd Portfolio. This intercompany rent is eliminated in the consolidated statement of operations. The base rent and abatement were both $0.4 million for the three months ended March 31, 2026.
(9) Genesee Park was acquired on February 28, 2025.
First Quarter 2026 Supplemental Information
Page 15
SEGMENT CAPITAL EXPENDITURES
(Unaudited, amounts in thousands)
Three Months Ended March 31, 2026
Segment
Tenant Improvements and Leasing Commissions
Capital Expenditures
Total Tenant Improvements, Leasing Commissions and Capital Expenditures
Redevelopment, Expansions and Repositioning (1)
New Development
Total Capital Expenditures
Office Portfolio
$
9,503
$
5,272
$
14,775
$
3,852
$
1,174
$
19,801
Retail Portfolio
926
70
996
—
—
996
Multifamily Portfolio
—
569
569
1,471
—
2,040
Mixed-Use Portfolio
176
227
403
—
—
403
Total
$
10,605
$
6,138
$
16,743
$
5,323
$
1,174
$
23,240
(1) Beginning with the three months ended June 30, 2025, this capital expenditures category includes spending related to repositioning initiatives at operating properties, as well as planned capital expenditures identified at the time of acquisition.
First Quarter 2026 Supplemental Information
Page 16
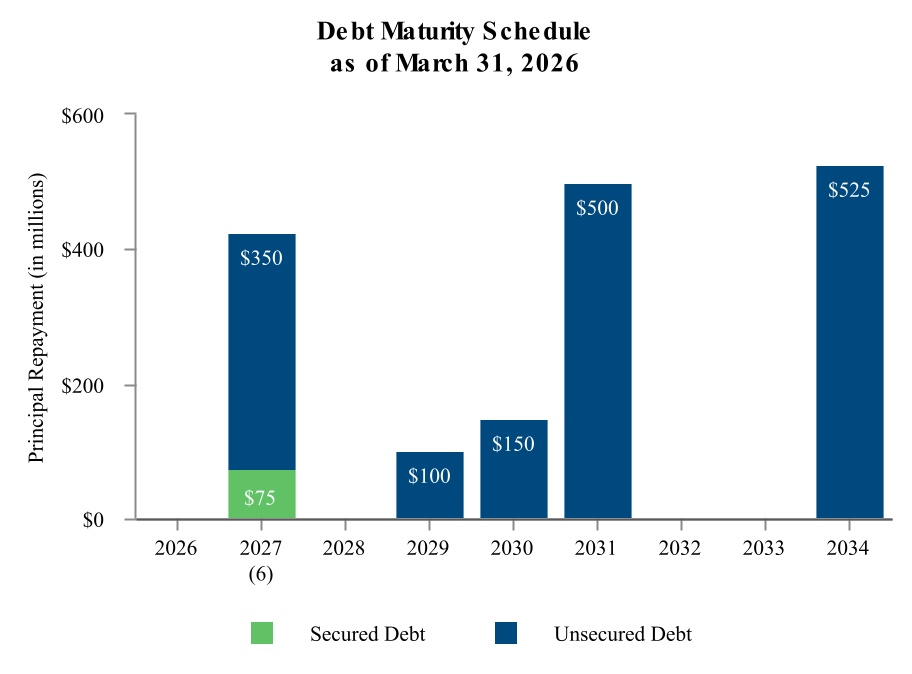
SUMMARY OF OUTSTANDING DEBT
(Unaudited, amounts in thousands)
Amount
Outstanding at
Annual Debt
Debt
March 31, 2026
Interest Rate
Service (1)
Maturity Date
City Center Bellevue
75,000
5.08
%
3,863
October 1, 2027
Secured Notes Payable / Weighted Average (2)
$
75,000
5.08
%
$
3,863
Term Loan A (3)
$
100,000
2.70
%
$
102,293
January 5, 2027
(4)
Series D Notes (5)
250,000
3.87
%
261,649
March 1, 2027
Series E Notes (6)
100,000
4.18
%
4,240
May 23, 2029
Series G Notes (7)
150,000
3.88
%
5,865
July 30, 2030
3.375% Senior Notes (8)
500,000
3.50
%
16,875
February 1, 2031
6.150% Senior Notes (9)
525,000
6.21
%
$
32,288
October 1, 2034
Unsecured Notes Payable / Weighted Average (10)
$
1,625,000
4.46
%
$
423,210
Unsecured Line of Credit (11)
$
—
Notes:
(1) Includes interest and principal payments due over the next twelve months.
(2) The Secured Notes Payable total does not include debt issuance costs, net of $0.1 million.
(3) Term Loan A accrues interest at a variable rate, which we fixed as part of an interest rate swap for an effective interest rate of 2.70% through January 5, 2027, subject to adjustments based on our consolidated leverage ratio.
(4) On April 1, 2026, the maturity date for Term Loan A was extended from January 5, 2027 to April 1, 2030, subject to one twelve-month extension option.
(5) $250 million of 4.29% Senior Guaranteed Notes, Series D, due March 1, 2027. Net of the settlement of the forward-starting interest rate swap, the effective interest rate for the Series D Notes is approximately 3.87% per annum, through maturity.
(6) $100 million of 4.24% Senior Guaranteed Notes, Series E, due May 23, 2029. Net of the settlement of the treasury lock contract, the effective interest rate for the Series E Notes is approximately 4.18%, through maturity.
(7) $150 million of 3.91% Senior Guaranteed Notes, Series G, due July 30, 2030. Net of the settlement of the treasury lock contract, the effective interest rate for the Series G Notes is approximately 3.88% through maturity.
(8) $500 million of 3.375% Senior Notes due February 1, 2031. Net of the debt issuance discount, the effective interest rate for the 3.375% Notes is approximately 3.502% through maturity.
(9) $525 million of 6.150% Senior Notes due October 1, 2034. Net of the debt issuance discount and settlement of the treasury lock contracts, the effective interest rate for the 6.150% Notes is approximately 6.209% through maturity.
(10) The Unsecured Notes Payable total does not include debt issuance costs and discounts, net of $11.7 million.
(11) The Unsecured Line of Credit (the "Revolver Loan") has a capacity of $400 million plus an accordion feature that may allow us to increase the availability thereunder up to an additional $400 million, subject to meeting specified requirements and obtaining additional commitments from lenders. The Revolver Loan matures on July 5, 2026. The Revolver Loan currently accrues interest at SOFR, plus the applicable SOFR adjustment and a spread which ranges from 1.05%-1.50%, based on our consolidated leverage ratio. The Revolver Loan total does not include debt issuance costs, net of $0.1 million. On April 1, 2026, the Revolver Loan capacity was increased to $500 million, with a maturity date of April 1, 2030, subject to two, six-month extension options.
First Quarter 2026 Supplemental Information
Page 17
MARKET CAPITALIZATION
(Unaudited, amounts in thousands, except per share data)
(1) Net debt is equal to total debt less cash on hand.
(2) See Glossary of Terms for discussion of EBITDA and Adjusted EBITDA.
(3) As used here, Adjusted EBITDA represents the actual for the three months ended March 31, 2026, annualized.
(4) Calculated as Adjusted EBITDA divided by interest on borrowed funds, including capitalized interest and excluding debt fair value adjustments and loan fee amortization.
(5) The debt covenant headings set forth in this table are utilized, and the covenants themselves are detailed, in the documents governing the 3.375% Senior Notes and the 6.150% Senior Notes.
(6) On April 1, 2026, the maturity date of Term Loan A was extended to April 1, 2030, subject to one twelve-month extension option.
Adjusted EBITDA is a non-GAAP supplemental earnings measure which we consider meaningful in measuring our operating performance. Reconciliations of Adjusted EBITDA to net income are in the Glossary of Terms.
First Quarter 2026 Supplemental Information
Page 18
SUMMARY OF DEVELOPMENT OPPORTUNITIES
Our portfolio has numerous potential opportunities to create future shareholder value. These opportunities could be subject to government approvals, lender consents, tenant consents, market conditions, availability of debt and/or equity financing, etc. Many of these opportunities are in their preliminary stages and may not ultimately come to fruition. This schedule will update as we modify various assumptions and markets conditions change. Square footages and units set forth below are estimates only and ultimately may differ materially from actual square footages and units.
Development/Redevelopment Pipeline
Property
Property Type
Location
Estimated Rentable Square Feet
Multifamily Units
Opportunity
Waikele Center
Retail
Honolulu, HI
120,000
N/A
Development of 120,000 square foot retail building (former KMart space)
Lomas Santa Fe Plaza
Retail
Solana Beach, CA
TBD
Development of multifamily units
Genesee Park
Multifamily
San Diego, CA
TBD
Development of multifamily units
Solana Beach Towne Centre
Retail
Solana Beach, CA
TBD
Development of multifamily units
Carmel Mountain Plaza
Retail
San Diego, CA
TBD
Development of multifamily units
Lloyd Portfolio - multiple phases (1)
Mixed Use
Portland, OR
Phase 2B - Oregon Square
385,000
N/A
Development of high density, transit oriented, mixed-use urban village
Notes:
(1) The Lloyd Portfolio was acquired in 2011, consisting of approximately 600,000 rentable square feet on more than 16 acres located in the Lloyd District of Portland, Oregon. The portion of the property that has been designated for additional development is expected to include a high density, transit oriented, mixed-use urban village, with the potential to be in excess of approximately three million square feet. The zoning for such development opportunity allows a 12:1 Floor Area Ratio with a 250 foot height limit and provides for retail, office and/or multifamily development. Additional development plans are in the early stages and will continue to progress as demand and economic conditions allow.
First Quarter 2026 Supplemental Information
Page 19
PORTFOLIO DATA
First Quarter 2026 Supplemental Information
Page 20
PROPERTY REPORT
As of March 31, 2026
Office and Retail Portfolios
Net
Annualized
Rentable
Base Rent per
Year Built/
Square
Percentage
Annualized
Leased
Retail
Property
Location
Most Recent Renovation
Feet (1)
Leased (2)
Base Rent (3)
Square Foot (4)
Anchor Tenant(s) (5)
Other Principal Retail Tenants (6)
Office Properties
La Jolla Commons I & II
San Diego, CA
2008
725,439
96.7%
$
48,292,889
$68.84
La Jolla Commons III
San Diego, CA
2025
206,231
49.2
3,557,590
35.06
Coastal Collection at Torrey Reserve (7)
San Diego, CA
1996/2022
552,276
86.8
24,851,903
51.84
Torrey Point
San Diego, CA
2017
94,854
99.6
6,219,751
65.84
Solana Crossing
Solana Beach, CA
1982/2022
224,009
76.1
8,763,054
51.41
The Landmark at One Market (8)
San Francisco, CA
1917/2000
422,426
98.3
42,795,807
103.06
One Beach Street
San Francisco, CA
1924/2024
89,067
35.4
—
—
First & Main
Portland, OR
2010
362,633
75.7
8,937,842
32.56
Lloyd Portfolio
Portland, OR
1940/2022
568,270
81.4
15,615,947
33.76
City Center Bellevue
Bellevue, WA
1987/2023
498,606
95.1
28,706,269
60.54
14Acres
Bellevue, WA
1985/2024
276,060
64.9
6,554,516
36.58
Timber Ridge
Bellevue, WA
1986
160,509
97.5
7,506,698
47.97
Timber Springs
Bellevue, WA
1983
93,295
75.2
2,747,148
39.16
Subtotal/Weighted Average Office Portfolio (9)
4,273,675
84.5%
$
204,549,414
$56.64
Retail Properties
Carmel Country Plaza
San Diego, CA
1991
78,098
98.0%
$
4,295,972
$56.13
Sharp Healthcare, San Diego County Credit Union
Carmel Mountain Plaza (10)
San Diego, CA
1994/2020
528,416
99.8
14,773,081
28.01
At Home Stores
Dick's Sporting Goods, Sprouts Farmers Market, Nordstrom Rack, Total Wine & More, Marshalls, Angelika Film Center
South Bay Marketplace (10)
San Diego, CA
1997/2018
132,877
97.8
2,538,753
19.54
Ross Dress for Less, Grocery Outlet, Old Navy
Gateway Marketplace (10)
San Diego, CA
1997/2016
127,861
98.9
2,569,168
20.32
Hobby Lobby
Smart & Final, Aldi
Lomas Santa Fe Plaza
Solana Beach, CA
1972/1997
208,297
97.9
6,763,059
33.16
Vons, Home Goods
Solana Beach Towne Centre
Solana Beach, CA
1973/2004
246,651
97.5
7,343,822
30.54
Dixieline Probuild, Marshalls, CVS Pharmacy
Geary Marketplace
Walnut Creek, CA
2012
35,097
98.3
1,267,747
36.75
Sprouts Farmers Market
The Shops at Kalakaua
Honolulu, HI
1971/2006
11,893
100.0
1,218,000
102.41
Hawaii Beachware & Fashion, Diesel U.S.A.
Waikele Center
Waipahu, HI
1993/2008
418,395
97.2
12,920,946
31.77
Lowe's, Safeway, Inspire Church
UFC Gym, Office Max, Old Navy
Alamo Quarry Market (10)
San Antonio, TX
1997/1999
588,148
98.9
16,476,582
28.33
Regal Cinemas
Whole Foods Market, Nordstrom Rack, Home Goods, Gold's Gym
Hassalo on Eighth - Retail
Portland, OR
2015
44,236
57.5
863,199
33.94
Providence Health & Services, Sola Salon
Subtotal/Weighted Average Retail Portfolio (9)
2,419,969
97.7%
$
71,030,329
$30.04
Total/Weighted Average Office and Retail Portfolio (9)
6,693,644
89.3%
$
275,579,743
$46.10
First Quarter 2026 Supplemental Information
Page 21
PROPERTY REPORT (CONTINUED)
As of March 31, 2026
Average Monthly
Year Built/
Percentage
Percentage
Annualized
Base Rent per
Property
Location
Most Recent Renovation
Units
Leased (2)
Occupied (2)
Base Rent (3)
Occupied Unit (4)
Loma Palisades
San Diego, CA
1958/2022
548
97.3%
95.6%
$
18,438,396
$
2,933
Imperial Beach Gardens
Imperial Beach, CA
1959/2023
160
96.9
95.6
4,981,524
$
2,714
Mariner's Point
Imperial Beach, CA
1986
88
95.5
92.1
2,317,632
$
2,383
Pacific Ridge Apartments
San Diego, CA
2013
533
98.3
95.7
26,008,200
$
4,249
Genesee Park
San Diego, CA
1985
192
99.5
98.4
5,018,676
$
2,214
Hassalo on Eighth - Multifamily (12)
Portland, OR
2015
657
92.7
92.1
12,109,044
$
1,668
Total/Weighted Average Multifamily Portfolio
2,178
96.2%
94.7%
$
68,873,472
$
2,783
Santa Fe Park RV Resort (11)
San Diego, CA
1971/2008
124
46.8
46.8
1,246,668
$
1,790
Total/Weighted Average Multifamily Portfolio (including Santa Fe Park RV Resort)
2,302
93.6%
92.1%
$
70,120,140
$
2,756
Mixed-Use Portfolio
Net Rentable
Annualized Base
Year Built/
Square
Percentage
Annualized
Rent per Leased
Retail
Retail Portion
Location
Most Recent Renovation
Feet (1)
Leased (2)
Base Rent (3)
Square Foot (4)
Anchor Tenant(s) (5)
Other Principal Retail Tenants (6)
Waikiki Beach Walk - Retail
Honolulu, HI
2006
93,925
96.2
%
$
9,975,837
$
110.41
Yardhouse, Roy's
Year Built/
Average
Average
Revenue per
Hotel Portion
Location
Most Recent Renovation
Units
Occupancy (13)
Daily Rate (13)
Available Room (13)
Waikiki Beach Walk - Embassy Suites™
Honolulu, HI
2008/2020
369
91.9
%
$
332
$
305
Notes:
(1) The net rentable square feet for each of our retail properties and the retail portion of our mixed-use property is the sum of (1) the square footages of existing leases, plus (2) for available space, the field-verified square footage. The net rentable square feet for each of our office properties is the sum of (1) the square footages of existing leases, plus (2) for available space, management’s estimate of net rentable square feet based, in part, on past leases. The net rentable square feet included in such office leases is generally determined consistently with the Building Owners and Managers Association, 2017 measurement guidelines. Net rentable square footage may be adjusted from the prior periods to reflect re-measurement of leased space at the properties.
(2) Percentage leased for each of our retail and office properties and the retail portion of the mixed-use property includes square footage under leases as of March 31, 2026, including leases which may not have commenced as of March 31, 2026. Percentage occupied for our multifamily properties includes total units rented and occupied as of March 31, 2026. Percentage leased for our multifamily properties includes units leased but not occupied as of March 31, 2026.
(3) Annualized base rent is calculated by multiplying base rental payments (defined as cash base rents (before abatements)) under commenced leases for the month ended March 31, 2026 by 12. In the case of triple net or modified gross leases, annualized base rent does not include tenant reimbursements for real estate taxes, insurance, common area or other operating expenses. The foregoing notwithstanding:
•The annualized base rent for La Jolla Commons I & II has been adjusted for this presentation to reflect that the contractual triple net leases were instead structured as modified gross leases, by adding the contractual annualized triple net base rent of $37,358,105 to our estimate of annual triple net operating expenses of $10,934,785 for an estimated annualized base rent on a modified gross lease basis of $48,292,890 for La Jolla Commons I & II.
•The annualized base rent for 14Acres has been adjusted for this presentation to reflect that the contractual triple net leases were instead structured as modified gross leases, by adding the contractual annualized triple net base rent of $4,487,018 to our estimate of annual triple net operating expenses of $2,067,498 for an estimated annualized base rent on a modified gross lease basis of $6,554,516 for 14Acres.
•The annualized base rent for Timber Ridge has been adjusted for this presentation to reflect that the contractual triple net leases were instead structured as modified gross leases, by adding the contractual annualized triple net base rent of $5,311,016 to our estimate of annual triple net operating expenses of $2,195,683 for an estimated annualized base rent on a modified gross lease basis of $7,506,699 for Timber Ridge.
•The annualized base rent for Timber Springs has been adjusted for this presentation to reflect that the contractual triple net leases were instead structured as modified gross leases, by adding the contractual annualized triple net base rent of $1,832,106 to our estimate of annual triple net operating expenses of $915,042 for an estimated annualized base rent on a modified gross lease basis of $2,747,148 for Timber Springs.
First Quarter 2026 Supplemental Information
Page 22
PROPERTY REPORT (CONTINUED)
(4) Annualized base rent per leased square foot for our retail and office properties and the retail portion of the mixed-use property is calculated by dividing annualized base rent, by square footage under lease as of March 31, 2026. Annualized base rent per occupied unit for our multifamily properties is calculated by dividing annualized base rent by units occupied as of March 31, 2026. The foregoing notwithstanding, the annualized base rent per leased square foot for La Jolla Commons, 14Acres, Timber Ridge and Timber Springs has been adjusted for this presentation to reflect that the contractual triple net leases were instead structured as modified gross leases. See footnote 3 for further explanation.
(5) Retail anchor tenants are defined as retail tenants leasing 50,000 square feet or more.
(6) Other principal retail tenants, excluding anchor tenants.
(7) Coastal Collection at Torrey Reserve was formerly known as Torrey Reserve Campus.
(8) This property contains 422,426 net rentable square feet consisting of The Landmark at One Market (378,206 net rentable square feet) as well as a separate long-term leasehold interest in approximately 44,220 net rentable square feet of space located in an adjacent six-story leasehold known as the Annex. We currently lease the Annex from an affiliate of the Paramount Group pursuant to a long-term master lease effective through June 30, 2031.
(9) Lease data for signed but not commenced leases as of March 31, 2026 is in the following table:
Leased Square Feet
Annualized Base
Pro Forma Annualized
Under Signed But
Annualized
Rent per
Base Rent per
Not Commenced Leases (a)
Base Rent (b)
Leased Square Foot (b)
Leased Square Foot (c)
Office Portfolio
244,202
$
13,983,472
$
57.26
$
60.54
Retail Portfolio
7,600
$
356,930
$
46.96
$
30.19
Total Retail and Office Portfolio
251,802
$
14,340,402
$
56.95
$
48.53
(a) Office portfolio leases signed but not commenced of 104,731, 40,466, 44,542, and 54,463 square feet are expected to commence during the second, third, and fourth quarters of 2026 and first quarter of 2027, respectively. Retail portfolio leases signed but not commenced of 7,600 square feet are expected to commence during the third quarter of 2026.
(b) Annualized base rent is calculated by multiplying base rental payments (defined as cash base rents (before abatements) for signed but not commenced leases as of March 31, 2026 by 12. In the case of triple net or modified gross leases, annualized base rent does not include tenant reimbursements for real estate taxes, insurance, common area or other operating expenses. Annualized base rent per leased square foot is calculated by dividing annualized base rent, by square footage for signed by not commenced leases.
(c) Pro forma annualized base rent is calculated by dividing annualized base rent for commenced leases and for signed but not commenced leases as of March 31, 2026, by square footage under lease as of March 31, 2026.
(10) Net rentable square feet at certain of our retail properties includes pad sites leased pursuant to the ground leases in the following table:
Property
Number of Ground Leases
Square Footage Leased Pursuant to Ground Leases
Aggregate Annualized Base Rent
Carmel Mountain Plaza
5
17,607
$
1,051,461
South Bay Marketplace
1
2,824
$
114,552
Alamo Quarry Market
4
31,994
$
723,455
Gateway Marketplace
1
18,903
$
226,800
(11) The Santa Fe Park RV Resort is subject to seasonal variation, with higher rates of occupancy occurring during the summer months. During the 12 months ended March 31, 2026, the highest average monthly occupancy rate for this property was 84.7%, occurring in August 2025. The number of units at the Santa Fe Park RV Resort includes 120 RV spaces and four apartments. The Santa Fe Park RV resort is excluded from the multifamily presentation above to accurately reflect true multifamily performance.
(12) Hassalo on Eighth - Multifamily includes three residential buildings: Velomor, Aster Tower, and Elwood.
(13) Average occupancy represents the percentage of available units that were sold during the three months ended March 31, 2026, and is calculated by dividing the number of units sold by the product of the total number of units and the total number of days in the period. Average daily rate represents the average rate paid for the units sold and is calculated by dividing the total room revenue (i.e., excluding food and beverage revenues or other hotel operations revenues such as telephone, parking and other guest services) for the three months ended March 31, 2026 by the number of units sold. Revenue per available room, or RevPAR, represents the total unit revenue per total available units for the three months ended March 31, 2026 and is calculated by multiplying average occupancy by the average daily rate. RevPAR does not include food and beverage revenues or other hotel operations revenues such as telephone, parking and other guest services.
First Quarter 2026 Supplemental Information
Page 23
OFFICE AND RETAIL LEASING SUMMARY
As of March 31, 2026
Office Leasing Summary
Lease Type
Number of Leases Signed
Net Rentable Square Feet Signed
Contractual Rent Per Sq. Ft. (2)
Cash Basis % Change Over Prior Rent
Straight-Line Basis % Change Over Prior Rent
Weighted Average Lease
Term (3)
Tenant Improvements & Incentives
Tenant Improvements & Incentives Per Sq. Ft.
Total Leases
29
236,670
$
60.08
—
—
5.1
$
8,476,047
$
35.81
New Non-Comparable
14
128,214
$
61.27
—
—
6.1
$
7,273,177
$
56.73
Total Comparable (1)
15
108,456
$
58.66
4.8
%
10.6
%
3.9
$
1,202,869
$
11.09
New Comparable
4
28,875
$
50.98
3.7
%
8.9
%
4.3
$
712,560
$
24.68
Renewal Comparable (4)
11
79,581
$
61.45
5.1
%
11.2
%
3.7
$
490,309
$
6.16
Retail Leasing Summary
Lease Type
Number of Leases Signed
Net Rentable Square Feet Signed
Contractual Rent Per Sq. Ft. (2)
Cash Basis % Change Over Prior Rent
Straight-Line Basis % Change Over Prior Rent
Weighted Average Lease
Term (3)
Tenant Improvements & Incentives
Tenant Improvements & Incentives Per Sq. Ft.
Total Leases
14
38,581
$
45.69
—
—
4.3
$
325,000
$
8.42
New Non-Comparable
1
988
$
45.00
—
—
5.0
$
50,000
$
50.61
Total Comparable (1)
13
37,593
$
45.70
(2.0)
%
1.3
%
4.2
$
275,000
$
7.32
New Comparable
1
10,000
$
38.40
(17.8)
%
(22.0)
%
5.0
$
225,000
$
22.50
Renewal Comparable (4)
12
27,593
$
48.35
3.8
%
13.0
%
4.0
$
50,000
$
1.81
Notes:
(1) Comparable leases represent those leases signed on spaces for which there was a previous lease in the past six-months.
(2) Contractual rent represents contractual minimum rent under the new lease for the first twelve months of the term.
(3) Weighted average is calculated on the basis of square footage.
(4) Includes renewals at fixed contractual rates specified in the lease.
First Quarter 2026 Supplemental Information
Page 24
MULTIFAMILY LEASING SUMMARY
As of March 31, 2026
Lease Summary - Loma Palisades
Number of Occupied Units (1)
Percentage occupied (1)
Annualized Base Rent (2)
Average Monthly Base Rent per Occupied Unit (3)
Quarter
1st Quarter 2026
524
95.6%
$18,438,396
$2,933
4th Quarter 2025
520
94.9%
$18,131,064
$2,905
3rd Quarter 2025
500
91.2%
$17,579,544
$2,931
2nd Quarter 2025
505
92.2%
$17,530,764
$2,891
Lease Summary - Imperial Beach Gardens
Number of Occupied Units (1)
Percentage occupied (1)
Annualized Base Rent (2)
Average Monthly Base Rent per Occupied Unit (3)
Quarter
1st Quarter 2026
153
95.6%
$4,981,524
$2,714
4th Quarter 2025
146
91.3%
$4,754,016
$2,712
3rd Quarter 2025
143
89.4%
$4,698,804
$2,737
2nd Quarter 2025
142
88.8%
$4,841,556
$2,840
Lease Summary - Mariner's Point
Number of Occupied Units (1)
Percentage occupied (1)
Annualized Base Rent (2)
Average Monthly Base Rent per Occupied Unit (3)
Quarter
1st Quarter 2026
81
92.1%
$2,317,632
$2,383
4th Quarter 2025
81
92.1%
$1,928,100
$1,982
3rd Quarter 2025
81
92.1%
$2,320,500
$2,386
2nd Quarter 2025
78
88.6%
$2,439,192
$2,607
Lease Summary - Santa Fe Park RV Resort
Number of Occupied Units (1)
Percentage occupied (1)
Annualized Base Rent (2)
Average Monthly Base Rent per Occupied Unit (3)
Quarter
1st Quarter 2026
58
46.8%
$1,246,668
$1,790
4th Quarter 2025
56
45.2%
$1,064,856
$1,583
3rd Quarter 2025
72
58.1%
$1,586,304
$1,835
2nd Quarter 2025
95
76.6%
$2,229,156
$1,956
Lease Summary - Pacific Ridge Apartments
Number of Occupied Units (1)
Percentage occupied (1)
Annualized Base Rent (2)
Average Monthly Base Rent per Occupied Unit (3)
Quarter
1st Quarter 2026
510
95.7%
$26,008,200
$4,249
4th Quarter 2025
523
98.1%
$24,977,172
$3,981
3rd Quarter 2025
491
92.1%
$24,734,688
$4,199
2nd Quarter 2025
443
83.1%
$22,982,460
$4,324
Lease Summary - Genesee Park
Number of Occupied Units (1)
Percentage occupied (1)
Annualized Base Rent (2)
Average Monthly Base Rent per Occupied Unit (3)
Quarter
1st Quarter 2026
189
98.4%
$5,018,676
$2,214
4th Quarter 2025
186
96.9%
$4,878,144
$2,185
3rd Quarter 2025
187
97.4%
$4,899,912
$2,183
2nd Quarter 2025
183
95.3%
$4,753,440
$2,165
First Quarter 2026 Supplemental Information
Page 25
MULTIFAMILY LEASING SUMMARY (CONTINUED)
As of March 31, 2026
Lease Summary - Hassalo on Eighth - Multifamily (4)
Number of Occupied Units (1)
Percentage occupied (1)
Annualized Base Rent (2)
Average Monthly Base Rent per Occupied Unit (3)
Quarter
1st Quarter 2026
605
92.1%
$12,109,044
$1,668
4th Quarter 2025
585
89.0%
$11,814,288
$1,684
3rd Quarter 2025
590
89.8%
$11,823,060
$1,670
2nd Quarter 2025
582
88.6%
$11,706,456
$1,676
Total Multifamily Lease Summary
Number of Occupied Units (1)
Percentage occupied (1)
Annualized Base Rent (2)
Average Monthly Base Rent per Occupied Unit (3)
Quarter
1st Quarter 2026
2,120
92.1%
$70,120,140
$2,756
4th Quarter 2025
2,097
91.1%
$67,547,640
$2,684
3rd Quarter 2025
2,064
89.7%
$67,642,812
$2,730
2nd Quarter 2025
2,028
88.1%
$66,483,024
$2,732
Notes:
(1) Number of occupied units and percentage occupancy for our multifamily properties includes total units rented and occupied as of each respective quarter end date.
(2) Annualized base rent is calculated by multiplying base rental payments (defined as cash base rents (before abatements)) as of each respective quarter end date.
(3) Annualized base rent per occupied unit is calculated by dividing annualized base rent, by units occupied as of each respective quarter end date.
(4) Hassalo on Eighth - Multifamily includes three residential buildings: Velomor, Aster Tower, and Elwood.
First Quarter 2026 Supplemental Information
Page 26
MIXED-USE LEASING SUMMARY
As of March 31, 2026
Lease Summary - Retail Portion
Number of Leased Square Feet
Percentage leased (1)
Annualized Base Rent (2)
Annualized Base Rent per Leased Square Foot (3)
Quarter
1st Quarter 2026
90,346
96.2%
$9,975,837
$110
4th Quarter 2025
90,346
96.2%
$9,628,291
$107
3rd Quarter 2025
89,204
95.0%
$9,882,053
$111
2nd Quarter 2025
89,204
95.0%
$9,807,163
$110
Lease Summary - Hotel Portion
Number of Leased Units
Average Occupancy (4)
Average Daily Rate (4)
Annualized Revenue per Available Room (4)
Quarter
1st Quarter 2026
339
91.9%
$332
$305
4th Quarter 2025
298
80.7%
$352
$284
3rd Quarter 2025
289
78.3%
$381
$298
2nd Quarter 2025
317
86.0%
$355
$305
Notes:
(1) Percentage leased for mixed-use property includes square footage under leases as of March 31, 2026, including leases which may not have commenced as of March 31, 2026.
(2) Annualized base rent is calculated by multiplying base rental payments (defined as cash base rents (before abatements)) for the month ended March 31, 2026 by 12. In the case of triple net or modified gross leases, annualized base rent does not include tenant reimbursements for real estate taxes, insurance, common area or other operating expenses.
(3) Annualized base rent per leased square foot is calculated by dividing annualized base rent, by square footage under lease as of March 31, 2026.
(4) Average occupancy represents the percentage of available units that were sold during the three months ended March 31, 2026, and is calculated by dividing the number of units sold by the product of the total number of units and the total number of days in the period. Average daily rate represents the average rate paid for the units sold and is calculated by dividing the total room revenue (i.e., excluding food and beverage revenues or other hotel operations revenues such as telephone, parking and other guest services) for each respective quarter period by the number of units sold. Revenue per available room, or RevPAR, represents the total unit revenue per total available units for each respective quarter period and is calculated by multiplying average occupancy by the average daily rate. RevPAR does not include food and beverage revenues or other hotel operations revenues such as telephone, parking and other guest services.
First Quarter 2026 Supplemental Information
Page 27
LEASE EXPIRATIONS
As of March 31, 2026
Assumes no exercise of lease options
Office
Retail
Mixed-Use (Retail Portion Only)
Total
% of
% of
Annualized
% of
% of
Annualized
% of
% of
Annualized
% of
Annualized
Expiring
Office
Total
Base Rent
Expiring
Retail
Total
Base Rent
Expiring
Mixed-Use
Total
Base Rent
Expiring
Total
Base Rent
Year
Sq. Ft.
Sq. Ft.
Sq. Ft.
Per Sq. Ft.(1)
Sq. Ft.
Sq. Ft.
Sq. Ft.
Per Sq. Ft.(1)
Sq. Ft.
Sq. Ft.
Sq. Ft.
Per Sq. Ft.(1)
Sq. Ft.
Sq. Ft.
Per Sq. Ft.(1)
Month to Month
80,464
1.9
%
1.2
%
$0.69
10,399
0.4
%
0.2
%
$32.05
2,512
2.7
%
—
%
$11.26
93,375
1.4
%
$4.47
2026
239,258
5.6
3.5
47.61
68,719
2.8
1.0
52.57
6,866
7.3
0.1
156.90
314,843
4.6
51.08
2027
380,672
8.9
5.6
53.31
320,029
13.2
4.7
33.08
5,786
6.2
0.1
132.45
706,487
10.4
44.79
2028
537,148
12.6
7.9
61.10
536,357
22.2
7.9
24.84
20,401
21.7
0.3
111.46
1,093,906
16.1
44.26
2029
904,865
21.2
13.3
67.55
327,883
13.5
4.8
32.31
13,199
14.1
0.2
146.70
1,245,947
18.4
59.11
2030
346,683
8.1
5.1
44.95
183,390
7.6
2.7
37.91
17,384
18.5
0.3
71.71
547,457
8.1
43.44
2031
299,992
7.0
4.4
58.19
246,309
10.2
3.6
33.31
17,134
18.2
0.3
122.94
563,435
8.3
49.28
2032
119,551
2.8
1.8
54.70
130,509
5.4
1.9
29.99
—
—
—
—
250,060
3.7
41.80
2033
111,470
2.6
1.6
56.35
159,643
6.6
2.4
24.70
—
—
—
—
271,113
4.0
37.71
2034
133,813
3.1
2.0
57.60
119,699
4.9
1.8
27.27
973
1.0
—
216.48
254,485
3.7
43.94
2035
88,446
2.1
1.3
44.65
112,833
4.7
1.7
26.35
—
—
—
—
201,279
3.0
34.39
Thereafter
124,440
2.9
1.8
42.13
140,995
5.8
2.1
23.63
5,630
6.0
0.1
58.61
271,065
4.0
32.85
Signed Leases Not Commenced
244,202
5.7
3.6
—
7,600
0.3
0.1
—
461
0.5
—
—
252,263
3.7
—
Available
662,671
15.5
9.8
—
55,604
2.3
0.8
—
3,579
3.8
0.1
—
721,854
10.6
—
Total (2)
4,273,675
100.0
%
63.0
%
$44.09
2,419,969
100.0
%
35.7
%
$29.35
93,925
100.0
%
1.4
%
$106.21
6,787,569
100.0
%
$39.69
Assumes all lease options are exercised
Office
Retail
Mixed-Use (Retail Portion Only)
Total
% of
% of
Annualized
% of
% of
Annualized
% of
% of
Annualized
% of
Annualized
Expiring
Office
Total
Base Rent
Expiring
Retail
Total
Base Rent
Expiring
Mixed-Use
Total
Base Rent
Expiring
Total
Base Rent
Year
Sq. Ft.
Sq. Ft.
Sq. Ft.
Per Sq. Ft.(1)
Sq. Ft.
Sq. Ft.
Sq. Ft.
Per Sq. Ft.(1)
Sq. Ft.
Sq. Ft.
Sq. Ft.
Per Sq. Ft.(1)
Sq. Ft.
Sq. Ft.
Per Sq. Ft.(1)
Month to Month
80,464
1.9
%
1.2
%
$0.69
10,399
0.4
%
0.2
%
$32.05
2,512
2.7
%
—
%
$11.26
93,375
1.4
%
$4.47
2026
124,343
2.9
1.8
49.05
28,993
1.2
0.4
61.53
3,825
4.1
0.1
142.54
157,161
2.3
53.63
2027
124,069
2.9
1.8
59.84
76,660
3.2
1.1
41.44
4,525
4.8
0.1
133.36
205,254
3.0
54.59
2028
104,978
2.5
1.5
48.81
127,879
5.3
1.9
28.13
13,487
14.4
0.2
84.06
246,344
3.6
40.00
2029
112,465
2.6
1.7
53.23
123,489
5.1
1.8
34.24
7,797
8.3
0.1
180.92
243,751
3.6
47.69
2030
224,407
5.3
3.3
36.30
134,082
5.5
2.0
35.22
3,646
3.9
0.1
52.93
362,135
5.3
36.07
2031
115,377
2.7
1.7
57.13
62,001
2.6
0.9
52.61
20,175
21.5
0.3
130.78
197,553
2.9
63.23
2032
300,777
7.0
4.4
53.95
163,275
6.7
2.4
32.02
911
1.0
—
98.88
464,963
6.9
46.34
2033
344,925
8.1
5.1
67.38
102,190
4.2
1.5
31.77
6,914
7.4
0.1
164.90
454,029
6.7
60.85
2034
137,228
3.2
2.0
50.93
224,771
9.3
3.3
30.27
5,402
5.8
0.1
97.32
367,401
5.4
38.97
2035
103,996
2.4
1.5
56.85
37,875
1.6
0.6
41.50
14,088
15.0
0.2
79.96
155,959
2.3
55.21
Thereafter
1,593,773
37.3
23.5
60.64
1,265,151
52.3
18.6
26.14
6,603
7.0
0.1
81.88
2,865,527
42.2
45.46
Signed Leases Not Commenced
244,202
5.7
3.6
—
7,600
0.3
0.1
—
461
0.5
—
—
252,263
3.7
—
Available
662,671
15.5
9.8
—
55,604
2.3
0.8
—
3,579
3.8
0.1
—
721,854
10.6
—
Total (2)
4,273,675
100.0
%
63.0
%
$44.09
2,419,969
100.0
%
35.7
%
$29.35
93,925
100.0
%
1.4
%
$106.21
6,787,569
100.0
%
$39.69
First Quarter 2026 Supplemental Information
Page 28
LEASE EXPIRATIONS (CONTINUED)
Notes:
(1) Annualized base rent per occupied square foot is calculated by dividing (i) annualized base rent for leases expiring during the applicable period, by (ii) square footage under such expiring leases. Annualized base rent is calculated by multiplying (i) base rental payments (defined as cash base rents (before abatements)) for the month ended March 31, 2026 for the leases expiring during the applicable period by (ii) 12 months.
(2) Individual items may not add up to total due to rounding.
First Quarter 2026 Supplemental Information
Page 29
PORTFOLIO LEASED STATISTICS
At March 31, 2026
At March 31, 2025
Type
Size
Leased (1)
Leased %
Size
Leased (1)
Leased %
Overall Portfolio(2) Statistics
Office Properties (square feet)
4,273,675
3,611,004
84.5
%
4,077,376
3,484,902
85.5
%
Retail Properties (square feet)
2,419,969
2,364,365
97.7
%
2,420,247
2,356,245
97.4
%
Multifamily Properties (units) (3)
2,178
2,062
94.7
%
2,178
1,991
91.4
%
Mixed-Use Properties (square feet)
93,925
90,346
96.2
%
93,925
83,911
89.3
%
Mixed-Use Properties (units) (4)
369
339
91.9
%
369
312
84.6
%
Same-Store(2) (5) Statistics
Office Properties (square feet)
4,067,444
3,509,621
86.3
%
4,077,376
3,484,902
85.5
%
Retail Properties (square feet)
2,419,969
2,364,365
97.7
%
2,420,247
2,356,245
97.4
%
Multifamily Properties (units) (3)
1,986
1,873
94.3
%
1,986
1,813
91.3
%
Mixed-Use Properties (square feet)
93,925
90,346
96.2
%
93,925
83,911
89.3
%
Mixed-Use Properties (units) (4)
369
339
91.9
%
369
312
84.6
%
Notes:
(1) Leased square feet includes square feet under lease as of each date, including leases which may not have commenced as of that date. Leased units for our multifamily properties include total units leased and occupied as of that date.
(2) See Glossary of Terms.
(3) Santa Fe Park RV Resort is excluded from the multifamily presentation above to reflect traditional multifamily performance as of each of the applicable dates.
(4) Represents average occupancy for the three months ended March 31, 2026 and 2025.
(5) Same-store portfolio excludes: (i) Del Monte Center (retail), which was sold on February 25, 2025, (ii) Genesee Park (multifamily), which was acquired on February 28, 2025, (iii) La Jolla Commons III (office), which was placed into service on April 1, 2025 and (iv) land held for development.
First Quarter 2026 Supplemental Information
Page 30
TOP TENANTS - OFFICE
As of March 31, 2026
Tenant
Property
Lease Expiration
Total Occupied Square Feet
Rentable Square Feet as a Percentage of Total Office
Rentable Square Feet as a Percentage of Total
Annualized Base Rent
Annualized Base Rent as a Percentage of Total Office
1
Google LLC
The Landmark at One Market
12/31/2029
253,198
5.9
%
3.7
%
$
28,213,097
13.8
%
2
LPL Holdings, Inc.
La Jolla Commons
4/30/2029
421,001
9.9
6.2
21,048,719
10.3
3
Autodesk, Inc. (1)
The Landmark at One Market
12/31/2028 6/30/2031
138,615
3.2
2.0
14,142,816
6.9
4
Smartsheet, Inc. (2)
City Center Bellevue
12/31/2026 4/30/2029 12/31/2032
123,041
2.9
1.8
7,421,805
3.6
5
Databricks, Inc. (3)
City Center Bellevue
11/30/2027 1/31/2028 3/31/2028 10/31/2028
87,685
2.1
1.3
5,515,520
2.7
6
Illumina, Inc.
La Jolla Commons
10/31/2027
73,176
1.7
1.1
5,110,316
2.5
7
Industrious (4)
City Center Bellevue La Jolla Commons
4/30/2033 3/31/2034 7/31/2035
75,749
1.8
1.1
4,015,281
2.0
8
State of Oregon: Department of Environmental Quality
Lloyd Portfolio
10/31/2031
87,787
2.1
1.3
3,207,179
1.6
9
Top technology tenant (5)
La Jolla Commons
8/31/2030
40,800
1.0
0.6
2,674,996
1.3
10
Genentech, Inc.
Lloyd Portfolio
10/31/2026
66,852
1.6
1.0
2,554,393
1.2
Top 10 Office Tenants Total
1,367,904
32.2
%
20.1
%
$
93,904,122
45.9
%
Notes:
(1) For Autodesk, Inc., 92,820 and 45,795 of leased square feet have a lease expiration of December 31, 2028 and June 30, 2031, respectively.
(2) For Smartsheet, Inc., 39,394, 49,372, and 34,275 of leased square feet have a lease expiration of December 31, 2026, April 30, 2029, and December 31, 2032, respectively.
(3) For Databricks, Inc., 17,623, 27,984, 37,500, and 4,578 of leased square feet have a lease expiration of November 30, 2027, January 31, 2028, March 31, 2028, and October 31, 2028, respectively.
(4) For Industrious, 18,090, 37,166, and 20,493 of leased square feet have a lease expiration of April 30, 2033 (City Center Bellevue), March 31, 2034 (City Center Bellevue), and July 31, 2035 (La Jolla Commons), respectively.
(5) Name withheld per tenant's request.
First Quarter 2026 Supplemental Information
Page 31
TOP TENANTS - RETAIL
As of March 31, 2026
Tenant
Property(ies)
Lease Expiration
Total Occupied Square Feet
Rentable Square Feet as a Percentage of Total Retail
Rentable Square Feet as a Percentage of Total
Annualized Base Rent
Annualized Base Rent as a Percentage of Total Retail
1
Lowe's
Waikele Center
5/31/2028
155,000
6.4
%
2.3
%
$
4,092,000
5.8
%
2
Sprouts Farmers Market (1)
Solana Beach Towne Centre Geary Marketplace Carmel Mountain Plaza
6/30/2029 9/30/2032 3/31/2035
71,431
3.0
1.1
2,248,554
3.2
3
Marshalls (2)
Carmel Mountain Plaza Solana Beach Towne Centre
1/31/2029 1/31/2035
68,055
2.8
1.0
1,901,151
2.7
4
Nordstrom Rack (3)
Carmel Mountain Plaza Alamo Quarry Market
9/30/2027 10/31/2027
69,047
2.9
1.0
1,804,269
2.5
5
Vons (4)
Lomas Santa Fe Plaza
12/31/2027
49,895
2.1
0.7
1,609,086
2.3
6
Old Navy (5)
Alamo Quarry Market Southbay Marketplace Waikele Center
9/30/2027 4/30/2028 7/31/2030
52,936
2.2
0.8
1,308,258
1.8
7
Sola Salons (6)
Solana Beach Towne Centre Hassalo on Eighth - Retail South Bay Marketplace Carmel Mountain Plaza Carmel Country Plaza
(1) For Sprouts Farmers Market, 14,986, 25,472, and 30,973 of leased square feet have a lease expiration of June 30, 2029 (Solana Beach Towne Centre), September 30, 2032 (Geary Marketplace), and March 31, 2035 (Carmel Mountain Plaza), respectively.
(2) For Marshalls, 28,760 and 39,295 of leased square feet have a lease expiration of January 31, 2029 (Carmel Mountain Plaza) and January 31, 2035 (Solana Beach Towne Centre).
(3) For Nordstrom Rack, 39,047 and 30,000 of leased square feet have a lease expiration of September 30, 2027 (Carmel Mountain Plaza) and October 31, 2027 (Alamo Quarry Market), respectively.
(4) For Vons, on April 9, 2026, we entered into an extension of 49,895 of leased square feet which have a lease expiration of December 31, 2047.
(5) For Old Navy, 15,021, 20,000 and 17,915 of leased square feet have a lease expiration of September 30, 2027 (Alamo Quarry Market), April 30, 2028 (South Bay Marketplace) and July 31, 2030 (Waikele Center), respectively.
(6) For Sola Salons, 6,300, 5,775, 7,500, 14,289, and 8,712 of leased square feet have a lease expiration of November 30, 2029 (Solana Beach Towne Centre), March 31, 2031 (Hassalo on Eighth - Retail), June 30, 2032 (South Bay Marketplace), August 31, 2034 (Carmel Mountain Plaza), and February 29, 2036 (Carmel Country Plaza), respectively.
(7) For HomeGoods, 30,000 and 25,837 of leased square feet have a lease expiration of February 28, 2030 (Lomas Sante Fe Plaza) and August 31, 2034 (Alamo Quarry Market), respectively.
First Quarter 2026 Supplemental Information
Page 32
APPENDIX
First Quarter 2026 Supplemental Information
Page 33
GLOSSARY OF TERMS
Earnings Before Interest, Taxes, Depreciation, and Amortization (EBITDA): EBITDA is a non-GAAP measure that means net income or loss plus depreciation and amortization, net interest expense, income taxes, gain or loss on sale of real estate and impairments of real estate, if any. EBITDA is presented because it approximates a key performance measure in our debt covenants, but it should not be considered an alternative measure of operating results or cash flow from operations as determined in accordance with GAAP. The reconciliation of net income to EBITDA for the three months ended March 31, 2026 and 2025 is as follows:
Three Months Ended
March 31,
2026
2025
Net income
$
6,739
$
54,107
Depreciation and amortization
32,311
30,494
Interest expense, net
19,707
18,780
Interest income
(715)
(1,332)
Income tax expense
101
417
Gain on sale of real estate
—
(44,476)
EBITDA
$
58,143
$
57,990
Adjusted EBITDA: Adjusted EBITDA is a non-GAAP measure that begins with EBITDA and includes adjustments for certain items that we believe are not representative of ongoing operating performance. Specifically, we include an early extinguishment of debt adjustment and pro forma adjustment to reflect a full period of NOI on the operating properties we acquire during the quarter, to assume all transactions occurred at the beginning of the quarter. We use Adjusted EBITDA as a supplemental performance measure because we believe these items create significant earnings volatility which in turn results in less comparability between reporting periods and less predictability regarding future earnings potential. However, Adjusted EBITDA should not be considered an alternative measure of operating results or cash flow from operations as determined by GAAP. The reconciliation of EBITDA to Adjusted EBITDA for the three months ended March 31, 2026 and 2025 is as follows:
Three Months Ended
March 31,
2026
2025
EBITDA
$
58,143
$
57,990
Pro forma adjustments
—
—
Adjusted EBITDA
$
58,143
$
57,990
Earnings Before Interest, Taxes, Depreciation, and Amortization for Real Estate (EBITDAre): EBITDAre is a supplemental non-GAAP measure of real estate companies' operating performances. The National Association of Real Estate Investment Trusts (NAREIT) defines EBITDAre as follows: net income or loss, computed in accordance with GAAP plus depreciation and amortization, net interest expense, income taxes, gain or loss on sale of real estate including gain or loss on change of control, impairments of real estate, and adjustments to reflect the entity's share of EBITDAre of unconsolidated affiliates, if any. EBITDAre is presented because it approximates a key performance measure in our debt covenants, but it should not be considered an alternative measure of operating results or cash flow from operations as determined in accordance with GAAP. The reconciliation of net income to EBITDAre for the three months ended March 31, 2026 and 2025 is as follows:
Three Months Ended
March 31,
2026
2025
Net income
$
6,739
$
54,107
Depreciation and amortization
32,311
30,494
Interest expense, net
19,707
18,780
Interest income
(715)
(1,332)
Income tax expense
101
417
Gain on sale of real estate
—
(44,476)
EBITDAre
$
58,143
$
57,990
First Quarter 2026 Supplemental Information
Page 34
GLOSSARY OF TERMS (CONTINUED)
Funds From Operations (FFO): FFO is a supplemental measure of real estate companies' operating performances. NAREIT defines FFO as follows: net income, computed in accordance with GAAP plus depreciation and amortization of real estate assets and excluding extraordinary items, gains and losses on sale of real estate and impairment losses. NAREIT developed FFO as a relative measure of performance and liquidity of an equity REIT in order to recognize that the value of income-producing real estate historically has not depreciated on the basis determined under GAAP. However, FFO does not represent cash flows from operating activities in accordance with GAAP (which, unlike FFO, generally reflects all cash effects of transactions and other events in the determination of net income); should not be considered an alternative to net income as an indication of our performance; and is not necessarily indicative of cash flow as a measure of liquidity or ability to pay dividends. We consider FFO a meaningful additional measure of operating performance primarily because it excludes the assumption that the value of real estate assets diminishes predictably over time, and because industry analysts have accepted it as a performance measure. Comparison of our presentation of FFO to similarly titled measures for other REITs may not necessarily be meaningful due to possible differences in the application of the NAREIT definition used by such REITs.
Funds Available for Distribution (FAD): FAD is a supplemental measure of our liquidity. We compute FAD by subtracting from FFO As Adjusted second generation tenant improvements and leasing commissions and capital expenditures, eliminating the net effect of straight-line rents, amortization of above (below) market rents for acquisition properties, the effects of other lease intangibles, adding noncash amortization of deferred financing costs and debt fair value adjustments, adding noncash compensation expense, and adding (subtracting) unrealized losses (gains) on marketable securities. Capital expenditures do not include capital expenditures incurred in connection with repositioning activities, as well as planned capital expenditures identified at the time of acquisition. FAD provides an additional perspective on our ability to fund cash needs and make distributions by adjusting FFO for the impact of certain cash and noncash items, as well as adjusting FFO for recurring capital expenditures and leasing costs. However, other REITs may use different methodologies for calculating FAD and, accordingly, our FAD may not be comparable to other REITs.
Net Operating Income (NOI): We define NOI as operating revenues (rental income, tenant reimbursements, lease termination fees, ground lease rental income and other property income) less property and related expenses (property expenses, ground lease expense, property marketing costs, real estate taxes and insurance). NOI excludes general and administrative expenses, interest expense, depreciation and amortization, acquisition-related expense, other nonproperty income and losses, gains and losses from property dispositions, extraordinary items, tenant improvements and leasing commissions. Other REITs may use different methodologies for calculating NOI, and accordingly, our NOI may not be comparable to other REITs. Since NOI excludes general and administrative expenses, interest expense, depreciation and amortization, acquisition-related expenses, other nonproperty income and losses, gains and losses from property dispositions, and extraordinary items, it provides a performance measure that, when compared year over year, reflects the revenues and expenses directly associated with owning and operating commercial real estate and the impact to operations from trends in occupancy rates, rental rates, and operating costs, providing a perspective on operations not immediately apparent from net income. However, NOI should not be viewed as an alternative measure of our financial performance since it does not reflect general and administrative expenses, interest expense, depreciation and amortization costs, other nonproperty income and losses, the level of capital expenditures and leasing costs necessary to maintain the operating performance of the properties, or trends in development and construction activities which are significant economic costs and activities that could materially impact our results from operations.
Three Months Ended
March 31,
Reconciliation of NOI to net income
2026
2025
Total NOI
$
66,926
$
67,302
General and administrative
(8,783)
(9,312)
Depreciation and amortization
(32,311)
(30,494)
Gain on sale of real estate
—
44,476
Operating Income
$
25,832
$
71,972
Interest expense, net
(19,707)
(18,780)
Other income, net
614
915
Net income
$
6,739
$
54,107
Net income attributable to restricted shares
(236)
(203)
Net income attributable to unitholders in the Operating Partnership
(1,369)
(11,369)
Net income attributable to American Assets Trust, Inc. stockholders
$
5,134
$
42,535
Overall Portfolio: Includes all operating properties owned by us as of March 31, 2026.
First Quarter 2026 Supplemental Information
Page 35
GLOSSARY OF TERMS (CONTINUED)
Cash NOI: We define cash NOI as operating revenues (rental income, tenant reimbursements (other than tenant improvement reimbursements), ground lease rental income and other property income) less property and related expenses (property expenses, ground lease expense, property marketing costs, real estate taxes and insurance), adjusted for non-cash revenue and operating expense items such as straight-line rent, amortization of lease intangibles, amortization of lease incentives and other adjustments. Cash NOI also excludes lease termination fees, tenant improvement reimbursements, general and administrative expenses, depreciation and amortization, interest expense, other non-property income and losses, acquisition-related expense, gains and losses from property dispositions, extraordinary items, tenant improvements, and leasing commissions. Other REITs may use different methodologies for calculating cash NOI, and accordingly, our cash NOI may not be comparable to the cash NOIs of other REITs. We believe cash NOI provides useful information to investors regarding the company's financial condition and results of operations because it reflects only those income and expense items that are incurred at the property level, and when compared across periods, can be used to determine trends in earnings of the company's properties as this measure is not affected by (1) the non-cash revenue and expense recognition items, (2) the cost of funds of the property owner, (3) the impact of depreciation and amortization expenses as well as gains or losses from the sale of operating real estate assets that are included in net income computed in accordance with GAAP or (4) general and administrative expenses and other gains and losses that are specific to the property owner. We believe the exclusion of these items from net (loss) income is useful because the resulting measure captures the actual revenue generated and actual expenses incurred in operating the company's properties as well as trends in occupancy rates, rental rates and operating costs. Cash NOI is a measure of the operating performance of the company's properties but does not measure the company's performance as a whole. Cash NOI is therefore not a substitute for net income as computed in accordance with GAAP. A Reconciliation of Total Cash NOI to Net Income is presented below:
Three Months Ended
March 31,
Reconciliation of Total Cash NOI to Net Income
2026
2025
Total Cash NOI
$
66,086
$
66,962
Lease termination fees and tenant improvement reimbursements
244
174
Non-cash revenue and other operating expenses (1)
596
166
General and administrative
(8,783)
(9,312)
Depreciation and amortization
(32,311)
(30,494)
Gain on sale of real estate
—
44,476
Operating income
$
25,832
$
71,972
Interest expense, net
(19,707)
(18,780)
Other income, net
614
915
Net income
$
6,739
$
54,107
(1) Represents adjustments related to the straight-line rent income recognized during the period offset by cash received during the period and the provision for bad debts recorded for deferred rent receivable balances; the amortization of above (below) market rents, the amortization of lease incentives paid to tenants, the amortization of other lease intangibles, and straight-line rent expense for our leases of the Annex at The Landmark at One Market.
First Quarter 2026 Supplemental Information
Page 36
GLOSSARY OF TERMS (CONTINUED)
Same-Store Portfolio and Non-Same Store Portfolio: Information provided on a same-store basis includes the results of properties that we owned and operated for the entirety of both periods being compared except for properties for which significant redevelopment or expansion occurred during either of the periods being compared, properties under development, properties classified as held for development and properties classified as discontinued operations. The following table shows the properties included in the same-store and non-same store portfolio for the comparative periods presented. A reconciliation of Same-Store Cash NOI to Net Income is presented below:
Three Months Ended (1)
March 31,
Reconciliation of Same-Store Cash NOI Comparison to Operating Income
2026
2025
Same-Store Cash NOI
$
66,371
$
66,382
Non-Same Store Cash NOI
(285)
580
Total Cash NOI
$
66,086
$
66,962
Lease termination fees and tenant improvement reimbursements (2)
244
174
Non-cash revenue and other operating expenses (3)
596
166
General and administrative
(8,783)
(9,312)
Depreciation and amortization
(32,311)
(30,494)
Gain on sale of real estate
—
44,476
Operating income
$
25,832
$
71,972
Interest expense, net
(19,707)
(18,780)
Other income, net
614
915
Net income
$
6,739
$
54,107
(1) For the three months ended March 31, 2026, the same-store portfolio excludes: (i) Del Monte Center (retail), which was sold on February 25, 2025; (ii) Genesee Park (multifamily), which was acquired on February 28, 2025, (iii) La Jolla Commons III (office), which was placed into service on April 1, 2025 and (iv) land held for development.
(2) Lease termination fees and tenant improvement reimbursements are excluded from same-store cash NOI to provide a more accurate measure of operating performance.
(3) Represents adjustments related to the straight-line rent income recognized during the period offset by cash received during the period and the provision for bad debts recorded for deferred rent receivable balances; the amortization of above (below) market rents, the amortization of lease incentives paid to tenants, the amortization of other lease intangibles and straight-line rent expense for our leases of the Annex at The Landmark at One Market.
First Quarter 2026 Supplemental Information
Page 37
GLOSSARY OF TERMS (CONTINUED)
Comparison of Three Months Ended
March 31, 2026 to 2025
Same-Store
Non Same-Store
Office Properties
La Jolla Commons (1)
X
X
Coastal Collection at Torrey Reserve (formerly Torrey Reserve Campus)
X
Torrey Point
X
Solana Crossing
X
The Landmark at One Market
X
One Beach Street (2)
X
First & Main
X
Lloyd Portfolio
X
City Center Bellevue
X
14Acres
X
Timber Ridge
X
Timber Springs
X
Retail Properties
Carmel Country Plaza
X
Carmel Mountain Plaza
X
South Bay Marketplace
X
Gateway Marketplace
X
Lomas Santa Fe Plaza
X
Solana Beach Towne Centre
X
Geary Marketplace
X
The Shops at Kalakaua
X
Waikele Center
X
Alamo Quarry Market
X
Hassalo on Eighth - Retail
X
Multifamily Properties
Loma Palisades
X
Imperial Beach Gardens
X
Mariner's Point
X
Santa Fe Park RV Resort
X
Pacific Ridge Apartments
X
Genesee Park
X
Hassalo on Eighth
X
Mixed-Use Properties
Waikiki Beach Walk - Retail
X
Waikiki Beach Walk - Embassy Suites™
X
Development Properties
Solana Crossing - Land
X
Lloyd Portfolio - Land (2)
X
(1) La Jolla Commons Tower III is considered non same-store, as it was placed into service on April 1, 2025.
First Quarter 2026 Supplemental Information
Page 38
GLOSSARY OF TERMS (CONTINUED)
(2) One Beach Street and Lloyd Portfolio - Land were previously included as redevelopment property. One Beach Street is considered same-store for the three months ended March 31, 2026 since it was placed into operations on August 1, 2024. Lloyd Portfolio - Land is not leased and has no active redevelopment activity; as such it is included within the non-same-store portfolio.
Tenant Improvements and Incentives: Represents not only the total dollars committed for the improvement (fit-out) of a space as it relates to a specific lease but may also include base building costs (i.e. expansion, escalators, new entrances, etc.) which are required to make the space leasable. Incentives include amounts paid to tenants as an inducement to sign a lease that do not represent building improvements.