 | ||||||||
| Q2 2021 SUPPLEMENTAL INFORMATION | ||||||||
| VEREIT Supplemental Information | |||||
| June 30, 2021 | |||||
| Section | Page |  | ||||||
| Company Overview | ||||||||
| Quarterly Financial Summary | ||||||||
| Financial and Operations Statistics and Ratios | ||||||||
| Key Balance Sheet Metrics and Capital Structure | ||||||||
| Balance Sheets | ||||||||
| Statements of Operations | ||||||||
| Funds From Operations (FFO) | ||||||||
| Adjusted Funds From Operations (AFFO) | ||||||||
| EBITDAre and Normalized EBITDA | ||||||||
| Net Operating Income |  | |||||||
| Same Store Contract Rental Revenue | ||||||||
| Debt and Preferred Equity Summary | ||||||||
| Credit Facility and Corporate Bond Covenants | ||||||||
| Acquisitions and Dispositions | ||||||||
| Diversification Statistics | ||||||||
| Top 10 Concentrations | ||||||||
| Tenants Comprising Over 1% of Annualized Rental Income | ||||||||
| Tenant Industry Diversification | ||||||||
| Property Geographic Diversification | ||||||||
| Lease Expirations |  | |||||||
| Lease Summary | ||||||||
| Property Type Diversification and Rent Coverage | ||||||||
| Unconsolidated Joint Venture Investment Summary | ||||||||
| Definitions | ||||||||
 | ||||||||
| Q2 2021 SUPPLEMENTAL INFORMATION | ||||||||
| About the Data | ||
| ||||||||
| Q2 2021 SUPPLEMENTAL INFORMATION | ||||||||
| Forward-Looking Statements | ||
| ||||||||
| Q2 2021 SUPPLEMENTAL INFORMATION | ||||||||
Company Overview (unaudited) | ||
| ||||||||
| Q2 2021 SUPPLEMENTAL INFORMATION | ||||||||
| Company Overview (cont.) | ||
| Senior Management | Board of Directors | |||||||
| Glenn J. Rufrano, Chief Executive Officer | Hugh R. Frater, Non-Executive Chairman | |||||||
| Michael J. Bartolotta, Executive Vice President and Chief Financial Officer | Priscilla Almodovar, Independent Director | |||||||
| Lauren Goldberg, Executive Vice President, General Counsel and Secretary | David B. Henry, Independent Director | |||||||
| Paul H. McDowell, Executive Vice President and Chief Operating Officer | Mary Hogan Preusse, Independent Director | |||||||
| Thomas W. Roberts, Executive Vice President and Chief Investment Officer | Richard J. Lieb, Independent Director | |||||||
| Gavin B. Brandon, Senior Vice President and Chief Accounting Officer | Eugene A. Pinover, Independent Director | |||||||
| Julie G. Richardson, Independent Director | ||||||||
| Susan E. Skerritt, Independent Director | ||||||||
| Glenn J. Rufrano, Chief Executive Officer and Director | ||||||||
| 2325 E. Camelback Road, 9th Floor | 19 West 44th Street, Suite 1401 | |||||||
| Phoenix, AZ 85016 | New York, NY 10036 | |||||||
| 800-606-3610 | 212-413-9100 | |||||||
| www.VEREIT.com | ||||||||
| ||||||||
| Q2 2021 SUPPLEMENTAL INFORMATION | ||||||||
Quarterly Financial Summary (unaudited, dollars in thousands, except share and per share amounts) | ||
| Three Months Ended | |||||||||||||||||||||||||||||
| Financial Results | June 30, 2021 | March 31, 2021 | December 31, 2020 | September 30, 2020 | June 30, 2020 | ||||||||||||||||||||||||
| Total revenues | $ | 291,267 | $ | 290,809 | $ | 287,909 | $ | 295,278 | $ | 278,997 | |||||||||||||||||||
| Net income (loss) | $ | 77,903 | $ | 120,723 | $ | (36,933) | $ | 98,917 | $ | 56,105 | |||||||||||||||||||
| Basic and diluted net income (loss) per share attributable to common stockholders and limited partners | $ | 0.31 | $ | 0.50 | $ | (0.20) | $ | 0.41 | $ | 0.20 | |||||||||||||||||||
| Normalized EBITDA | $ | 251,606 | $ | 251,171 | $ | 246,689 | $ | 252,933 | $ | 238,479 | |||||||||||||||||||
| FFO attributable to common stockholders and limited partners | $ | 175,652 | $ | 178,988 | $ | 69,313 | $ | 171,233 | $ | 155,943 | |||||||||||||||||||
FFO attributable to common stockholders and limited partners per diluted share | $ | 0.76 | $ | 0.78 | $ | 0.31 | $ | 0.79 | $ | 0.72 | |||||||||||||||||||
| AFFO attributable to common stockholders and limited partners | $ | 186,596 | $ | 183,047 | $ | 169,798 | $ | 166,547 | $ | 161,083 | |||||||||||||||||||
| AFFO attributable to common stockholders and limited partners per diluted share | $ | 0.81 | $ | 0.80 | $ | 0.76 | $ | 0.77 | $ | 0.75 | |||||||||||||||||||
| Dividends declared per common share | $ | 0.46 | $ | 0.46 | $ | 0.39 | $ | 0.39 | $ | 0.39 | |||||||||||||||||||
| Weighted-average shares outstanding - diluted | 229,991,566 | 229,429,867 | 222,511,425 | 217,027,675 | 215,910,613 | ||||||||||||||||||||||||
| Portfolio Metrics | |||||||||||||||||||||||||||||
| Operating Properties | 3,885 | 3,855 | 3,831 | 3,820 | 3,836 | ||||||||||||||||||||||||
| Rentable Square Feet (in thousands) | 88,864 | 88,747 | 89,493 | 88,869 | 88,947 | ||||||||||||||||||||||||
| Economic Occupancy Rate | 97.1 | % | 98.0 | % | 98.1 | % | 98.5 | % | 98.8 | % | |||||||||||||||||||
| Weighted Average Remaining Lease Term (years) | 8.5 | 8.4 | 8.4 | 8.4 | 8.5 | ||||||||||||||||||||||||
Investment-Grade Tenants (1) | 37.8 | % | 37.8 | % | 38.7 | % | 37.7 | % | 37.0 | % | |||||||||||||||||||
| ||||||||
| Q2 2021 SUPPLEMENTAL INFORMATION | ||||||||
Financial and Operations Statistics and Ratios (unaudited, dollars in thousands) | ||
| Three Months Ended | ||||||||||||||||||||||||||||||||
| June 30, 2021 | March 31, 2021 | December 31, 2020 | September 30, 2020 | June 30, 2020 | ||||||||||||||||||||||||||||
| Interest Coverage Ratio | ||||||||||||||||||||||||||||||||
Interest Expense, excluding non-cash amortization (1) | $ | 56,866 | $ | 58,860 | $ | 63,153 | $ | 64,713 | $ | 63,636 | ||||||||||||||||||||||
Normalized EBITDA (2) | 251,606 | 251,171 | 246,689 | 252,933 | 238,479 | |||||||||||||||||||||||||||
Interest Coverage Ratio | 4.42x | 4.27x | 3.91x | 3.91x | 3.75x | |||||||||||||||||||||||||||
| Fixed Charge Coverage Ratio | ||||||||||||||||||||||||||||||||
Interest Expense, excluding non-cash amortization (1) | $ | 56,866 | $ | 58,860 | $ | 63,153 | $ | 64,713 | $ | 63,636 | ||||||||||||||||||||||
| Secured debt principal amortization | 524 | 687 | 858 | 834 | 861 | |||||||||||||||||||||||||||
Dividends attributable to preferred shares | 6,248 | 6,525 | 7,923 | 10,771 | 12,948 | |||||||||||||||||||||||||||
Total fixed charges | 63,638 | 66,072 | 71,934 | 76,318 | 77,445 | |||||||||||||||||||||||||||
Normalized EBITDA (2) | 251,606 | 251,171 | 246,689 | 252,933 | 238,479 | |||||||||||||||||||||||||||
| Fixed Charge Coverage Ratio | 3.95x | 3.80x | 3.43x | 3.31x | 3.08x | |||||||||||||||||||||||||||
| June 30, 2021 | March 31, 2021 | December 31, 2020 | September 30, 2020 | June 30, 2020 | ||||||||||||||||||||||||||||
| Net Debt Ratios | ||||||||||||||||||||||||||||||||
Net Debt (3) | $ | 5,490,670 | $ | 5,476,756 | $ | 5,564,553 | $ | 5,832,236 | $ | 5,804,109 | ||||||||||||||||||||||
Normalized EBITDA annualized | 1,006,424 | 1,004,684 | 986,756 | 1,011,732 | 953,916 | |||||||||||||||||||||||||||
Net Debt to Normalized EBITDA annualized ratio | 5.46x | 5.45x | 5.64x | 5.76x | 6.08x | |||||||||||||||||||||||||||
Net Debt (3) | $ | 5,490,670 | $ | 5,476,756 | $ | 5,564,553 | $ | 5,832,236 | $ | 5,804,109 | ||||||||||||||||||||||
Gross Real Estate Investments (3) | 14,551,239 | 14,485,227 | 14,646,970 | 14,621,857 | 14,704,629 | |||||||||||||||||||||||||||
Net Debt Leverage Ratio | 37.7 | % | 37.8 | % | 38.0 | % | 39.9 | % | 39.5 | % | ||||||||||||||||||||||
| Unencumbered Assets/Real Estate Assets | ||||||||||||||||||||||||||||||||
| Unencumbered Gross Real Estate Investments | $ | 12,600,755 | $ | 12,455,130 | $ | 11,968,277 | $ | 11,936,645 | $ | 11,933,717 | ||||||||||||||||||||||
Gross Real Estate Investments (3) | 14,551,239 | 14,485,227 | 14,646,970 | 14,621,857 | 14,704,629 | |||||||||||||||||||||||||||
| Unencumbered Asset Ratio | 86.6 | % | 86.0 | % | 81.7 | % | 81.6 | % | 81.2 | % | ||||||||||||||||||||||
| ||||||||
| Q2 2021 SUPPLEMENTAL INFORMATION | ||||||||
Key Balance Sheet Metrics and Capital Structure (unaudited, dollars and shares in thousands, except per share amounts) | ||
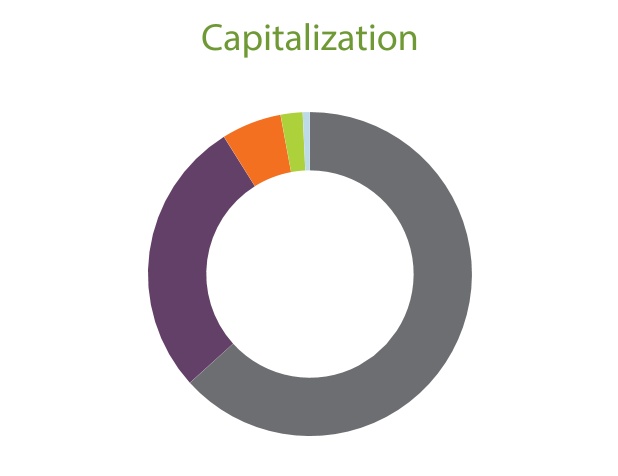
| Common equity | 63.3% | ||||||||||
| Corporate bonds | 27.8% | ||||||||||
| Mortgage notes payable | 6.0% | ||||||||||
| Preferred equity | 2.2% | ||||||||||
| Proportionate share of amounts for Unconsolidated Joint Ventures | 0.7% | ||||||||||
| Fixed | 99.3 | % | |||
| Variable | 0.7 | % | |||
| VEREIT Capitalization Table | |||||||||||||||||
Wtd. Avg. Maturity (Years) | Rate (1) | June 30, 2021 | |||||||||||||||
| Diluted shares outstanding | 230,589 | ||||||||||||||||
| Stock price | $ | 45.93 | |||||||||||||||
| Implied Equity Market Capitalization | $ | 10,590,953 | |||||||||||||||
Series F Perpetual Preferred (2) | 6.70 | % | $ | 373,025 | |||||||||||||
| Mortgage notes payable | 2.1 | 4.86 | % | 1,007,108 | |||||||||||||
| Proportionate share of amounts for Unconsolidated Joint Ventures | 3.6 | 2.90 | % | 109,678 | |||||||||||||
Total secured debt | 2.2 | 4.67 | % | $ | 1,116,786 | ||||||||||||
| Corporate bonds due 2024 | 2.6 | 4.60 | % | 500,000 | |||||||||||||
| Corporate bonds due 2025 | 4.3 | 4.63 | % | 550,000 | |||||||||||||
| Corporate bonds due 2026 | 4.9 | 4.88 | % | 600,000 | |||||||||||||
| Corporate bonds due 2027 | 6.1 | 3.95 | % | 600,000 | |||||||||||||
| Corporate bonds due January 2028 | 6.5 | 3.40 | % | 600,000 | |||||||||||||
| Corporate bonds due June 2028 | 7.0 | 2.20 | % | 500,000 | |||||||||||||
| Corporate bonds due 2029 | 8.5 | 3.10 | % | 600,000 | |||||||||||||
| Corporate bonds due 2032 | 11.5 | 2.85 | % | 700,000 | |||||||||||||
Total unsecured debt | 6.6 | 3.68 | % | $ | 4,650,000 | ||||||||||||
| Total Adjusted Principal Outstanding | 5.8 | 3.87 | % | $ | 5,766,786 | ||||||||||||
| Total Capitalization | $ | 16,730,764 | |||||||||||||||
| Cash and cash equivalents | (275,496) | ||||||||||||||||
| Pro rata share of Unconsolidated Joint Ventures' cash and cash equivalents | (621) | ||||||||||||||||
| Enterprise Value | $ | 16,454,647 | |||||||||||||||
| Net Debt/Enterprise Value | 33.4 | % | |||||||||||||||
| Net Debt/Normalized EBITDA Annualized | 5.46x | ||||||||||||||||
Net Debt + Preferred (2)/Normalized EBITDA Annualized | 5.83x | ||||||||||||||||
| Fixed Charge Coverage Ratio | 3.95x | ||||||||||||||||
Liquidity (3) | $ | 1,773,573 | |||||||||||||||
| ||||||||
| Q2 2021 SUPPLEMENTAL INFORMATION | ||||||||
Balance Sheets (unaudited, in thousands) | ||
| June 30, 2021 | March 31, 2021 | December 31, 2020 | September 30, 2020 | June 30, 2020 | ||||||||||||||||||||||||||||
| Assets | ||||||||||||||||||||||||||||||||
| Real estate investments, at cost: | ||||||||||||||||||||||||||||||||
| Land | $ | 2,724,975 | $ | 2,698,232 | $ | 2,699,110 | $ | 2,691,122 | $ | 2,705,149 | ||||||||||||||||||||||
| Buildings, fixtures and improvements | 9,912,886 | 9,941,903 | 10,032,055 | 10,046,076 | 10,117,636 | |||||||||||||||||||||||||||
| Intangible lease assets | 1,908,178 | 1,883,826 | 1,872,461 | 1,872,899 | 1,891,831 | |||||||||||||||||||||||||||
| Total real estate investments, at cost | 14,546,039 | 14,523,961 | 14,603,626 | 14,610,097 | 14,714,616 | |||||||||||||||||||||||||||
| Less: accumulated depreciation and amortization | 3,917,175 | 3,861,411 | 3,833,084 | 3,799,653 | 3,727,350 | |||||||||||||||||||||||||||
| Total real estate investments, net | 10,628,864 | 10,662,550 | 10,770,542 | 10,810,444 | 10,987,266 | |||||||||||||||||||||||||||
| Operating lease right-of-use assets | 188,628 | 191,443 | 195,518 | 205,346 | 208,037 | |||||||||||||||||||||||||||
| Investment in unconsolidated entities | 80,487 | 80,513 | 81,639 | 100,339 | 86,300 | |||||||||||||||||||||||||||
| Cash and cash equivalents | 275,496 | 318,561 | 523,539 | 207,321 | 278,883 | |||||||||||||||||||||||||||
| Restricted cash | 9,584 | 12,704 | 13,842 | 14,955 | 21,203 | |||||||||||||||||||||||||||
| Rent and tenant receivables and other assets, net | 365,186 | 368,926 | 366,620 | 391,239 | 382,409 | |||||||||||||||||||||||||||
| Goodwill | 1,337,773 | 1,337,773 | 1,337,773 | 1,337,773 | 1,337,773 | |||||||||||||||||||||||||||
| Real estate assets held for sale, net | 28,977 | 4,888 | 65,583 | 1,896 | 48,093 | |||||||||||||||||||||||||||
| Total assets | $ | 12,914,995 | $ | 12,977,358 | $ | 13,355,056 | $ | 13,069,313 | $ | 13,349,964 | ||||||||||||||||||||||
| Liabilities and Equity | ||||||||||||||||||||||||||||||||
| Mortgage notes payable, net | $ | 1,002,496 | $ | 1,035,328 | $ | 1,328,835 | $ | 1,330,174 | $ | 1,393,652 | ||||||||||||||||||||||
| Corporate bonds, net | 4,588,286 | 4,586,252 | 4,584,230 | 3,406,389 | 3,404,935 | |||||||||||||||||||||||||||
| Convertible debt, net | — | — | — | 252,077 | 270,152 | |||||||||||||||||||||||||||
| Credit facility, net | — | — | — | 896,630 | 896,314 | |||||||||||||||||||||||||||
| Below-market lease liabilities, net | 115,831 | 117,121 | 120,938 | 124,009 | 130,208 | |||||||||||||||||||||||||||
| Accounts payable and accrued expenses | 117,445 | 116,486 | 117,015 | 112,101 | 112,551 | |||||||||||||||||||||||||||
| Derivative, deferred rent and other liabilities | 64,371 | 62,944 | 63,204 | 162,952 | 161,538 | |||||||||||||||||||||||||||
| Distributions payable | 106,999 | 106,989 | 89,514 | 85,420 | 85,231 | |||||||||||||||||||||||||||
| Operating lease liabilities | 199,561 | 202,024 | 209,104 | 214,102 | 215,322 | |||||||||||||||||||||||||||
| Total liabilities | 6,194,989 | 6,227,144 | 6,512,840 | 6,583,854 | 6,669,903 | |||||||||||||||||||||||||||
Series F preferred stock | 149 | 149 | 189 | 189 | 309 | |||||||||||||||||||||||||||
Common stock | 2,291 | 2,291 | 2,289 | 2,183 | 2,156 | |||||||||||||||||||||||||||
| Additional paid-in capital | 13,354,657 | 13,350,661 | 13,449,412 | 13,057,408 | 13,264,911 | |||||||||||||||||||||||||||
| Accumulated other comprehensive income (loss) | 732 | 634 | 536 | (97,008) | (106,109) | |||||||||||||||||||||||||||
| Accumulated deficit | (6,644,896) | (6,610,678) | (6,617,380) | (6,484,456) | (6,488,521) | |||||||||||||||||||||||||||
| Total stockholders' equity | 6,712,933 | 6,743,057 | 6,835,046 | 6,478,316 | 6,672,746 | |||||||||||||||||||||||||||
| Non-controlling interests | 7,073 | 7,157 | 7,170 | 7,143 | 7,315 | |||||||||||||||||||||||||||
| Total equity | 6,720,006 | 6,750,214 | 6,842,216 | 6,485,459 | 6,680,061 | |||||||||||||||||||||||||||
Total liabilities and equity | $ | 12,914,995 | $ | 12,977,358 | $ | 13,355,056 | $ | 13,069,313 | $ | 13,349,964 | ||||||||||||||||||||||
| ||||||||
| Q2 2021 SUPPLEMENTAL INFORMATION | ||||||||
Statements of Operations (unaudited, in thousands, except per share data) | ||
| Three Months Ended | ||||||||||||||||||||||||||||||||
| June 30, 2021 | March 31, 2021 | December 31, 2020 | September 30, 2020 | June 30, 2020 | ||||||||||||||||||||||||||||
| Revenues: | ||||||||||||||||||||||||||||||||
| Rental | $ | 290,567 | $ | 290,309 | $ | 287,431 | $ | 293,692 | $ | 278,576 | ||||||||||||||||||||||
| Fees from managed partnerships | 700 | 500 | 478 | 1,586 | 421 | |||||||||||||||||||||||||||
| Total revenues | 291,267 | 290,809 | 287,909 | 295,278 | 278,997 | |||||||||||||||||||||||||||
| Operating expenses: | ||||||||||||||||||||||||||||||||
| Acquisition-related | 1,428 | 1,354 | 1,048 | 1,050 | 1,169 | |||||||||||||||||||||||||||
| Merger, litigation and non-routine costs, net | 6,605 | 68 | 10,925 | 105 | (118) | |||||||||||||||||||||||||||
| Property operating | 29,174 | 30,605 | 31,979 | 31,400 | 29,098 | |||||||||||||||||||||||||||
| General and administrative | 16,451 | 14,526 | 15,399 | 14,774 | 16,120 | |||||||||||||||||||||||||||
| Depreciation and amortization | 105,839 | 108,075 | 107,205 | 108,257 | 108,733 | |||||||||||||||||||||||||||
| Impairments | 14,129 | 31,849 | 28,204 | 16,397 | 12,094 | |||||||||||||||||||||||||||
| Total operating expenses | 173,626 | 186,477 | 194,760 | 171,983 | 167,096 | |||||||||||||||||||||||||||
| Other income (expense): | ||||||||||||||||||||||||||||||||
| Interest expense | (59,291) | (60,736) | (68,416) | (66,935) | (65,613) | |||||||||||||||||||||||||||
| Gain (loss) on extinguishment and forgiveness of debt, net | 35 | (2,132) | (67) | 61 | (200) | |||||||||||||||||||||||||||
Other income, net | 3,089 | 3,666 | 5,584 | 73 | 778 | |||||||||||||||||||||||||||
| Loss on derivative instruments, net | — | — | (85,392) | — | — | |||||||||||||||||||||||||||
| Equity in income and gain on disposition of unconsolidated entities | 464 | 447 | 1,133 | 663 | 1,497 | |||||||||||||||||||||||||||
Gain on disposition of real estate and held for sale assets, net | 16,896 | 76,074 | 18,434 | 42,814 | 8,795 | |||||||||||||||||||||||||||
| Total other (expenses) income, net | (38,807) | 17,319 | (128,724) | (23,324) | (54,743) | |||||||||||||||||||||||||||
| Income (loss) before taxes | 78,834 | 121,651 | (35,575) | 99,971 | 57,158 | |||||||||||||||||||||||||||
Provision for income taxes | (931) | (928) | (1,358) | (1,054) | (1,053) | |||||||||||||||||||||||||||
| Net income (loss) | 77,903 | 120,723 | (36,933) | 98,917 | 56,105 | |||||||||||||||||||||||||||
| Net (income) loss attributable to non-controlling interests | (7) | (76) | 46 | (51) | (31) | |||||||||||||||||||||||||||
| Net income (loss) attributable to the General Partner | $ | 77,896 | $ | 120,647 | $ | (36,887) | $ | 98,866 | $ | 56,074 | ||||||||||||||||||||||
| Basic and diluted net income (loss) per share attributable to common stockholders and limited partners | $ | 0.31 | $ | 0.50 | $ | (0.20) | $ | 0.41 | $ | 0.20 | ||||||||||||||||||||||
| ||||||||
| Q2 2021 SUPPLEMENTAL INFORMATION | ||||||||
Funds From Operations (FFO) (unaudited, in thousands, except share and per share data) | ||
| Three Months Ended | ||||||||||||||||||||||||||||||||
| June 30, 2021 | March 31, 2021 | December 31, 2020 | September 30, 2020 | June 30, 2020 | ||||||||||||||||||||||||||||
| Net income (loss) | $ | 77,903 | $ | 120,723 | $ | (36,933) | $ | 98,917 | $ | 56,105 | ||||||||||||||||||||||
Dividends on Series F Preferred Stock | (6,248) | (6,525) | (7,923) | (10,771) | (12,948) | |||||||||||||||||||||||||||
Gain on disposition of real estate assets, net | (16,896) | (76,074) | (18,965) | (42,814) | (8,795) | |||||||||||||||||||||||||||
Depreciation and amortization of real estate assets | 105,440 | 107,700 | 106,825 | 107,869 | 108,341 | |||||||||||||||||||||||||||
Impairment of real estate | 14,129 | 31,849 | 24,852 | 16,397 | 12,094 | |||||||||||||||||||||||||||
Proportionate share of adjustments for unconsolidated entities | 1,324 | 1,315 | 1,457 | 1,635 | 1,146 | |||||||||||||||||||||||||||
| FFO attributable to common stockholders and limited partners | $ | 175,652 | $ | 178,988 | $ | 69,313 | $ | 171,233 | $ | 155,943 | ||||||||||||||||||||||
| Weighted-average shares outstanding - basic | 229,251,460 | 229,159,472 | 222,152,574 | 216,737,561 | 215,673,313 | |||||||||||||||||||||||||||
Effect of weighted-average Limited Partner OP Units and dilutive securities (1) | 740,106 | 270,395 | 358,851 | 290,114 | 237,300 | |||||||||||||||||||||||||||
Weighted-average shares outstanding - diluted (2) | 229,991,566 | 229,429,867 | 222,511,425 | 217,027,675 | 215,910,613 | |||||||||||||||||||||||||||
FFO attributable to common stockholders and limited partners per diluted share (3) | $ | 0.76 | $ | 0.78 | $ | 0.31 | $ | 0.79 | $ | 0.72 | ||||||||||||||||||||||
| ||||||||
| Q2 2021 SUPPLEMENTAL INFORMATION | ||||||||
Adjusted Funds From Operations (AFFO) (unaudited, in thousands, except share and per share data) | ||
| Three Months Ended | ||||||||||||||||||||||||||||||||
| June 30, 2021 | March 31, 2021 | December 31, 2020 | September 30, 2020 | June 30, 2020 | ||||||||||||||||||||||||||||
FFO attributable to common stockholders and limited partners | $ | 175,652 | $ | 178,988 | $ | 69,313 | $ | 171,233 | $ | 155,943 | ||||||||||||||||||||||
Acquisition-related expenses | 1,428 | 1,354 | 1,048 | 1,050 | 1,169 | |||||||||||||||||||||||||||
| Merger, litigation and non-routine costs, net | 6,605 | 68 | 10,925 | 105 | (118) | |||||||||||||||||||||||||||
| Impairment of intangibles and right of use assets | — | — | 3,352 | — | — | |||||||||||||||||||||||||||
| Loss (gain) on investments | 22 | (695) | (313) | (76) | 142 | |||||||||||||||||||||||||||
Loss on derivative instruments, net | — | — | 85,392 | — | — | |||||||||||||||||||||||||||
Amortization of premiums and discounts on debt and investments, net | 555 | 87 | (193) | (201) | (362) | |||||||||||||||||||||||||||
Amortization of above-market lease assets and deferred lease incentives, net of amortization of below-market lease liabilities | 1,830 | 1,547 | 1,428 | 393 | 788 | |||||||||||||||||||||||||||
Net direct financing lease adjustments | 374 | 366 | 379 | 381 | 372 | |||||||||||||||||||||||||||
Amortization and write-off of deferred financing costs | 2,649 | 2,555 | 6,262 | 3,114 | 2,898 | |||||||||||||||||||||||||||
| (Gain) loss on extinguishment and forgiveness of debt, net | (35) | 2,132 | 67 | (61) | 200 | |||||||||||||||||||||||||||
Straight-line rent | (4,613) | (4,219) | (7,108) | (12,595) | (3,404) | |||||||||||||||||||||||||||
Equity-based compensation | 3,903 | 2,669 | 2,952 | 2,991 | 3,857 | |||||||||||||||||||||||||||
Other adjustments, net | (1,638) | (1,661) | (3,536) | 379 | 441 | |||||||||||||||||||||||||||
Proportionate share of adjustments for unconsolidated entities | (136) | (144) | (170) | (166) | (843) | |||||||||||||||||||||||||||
| AFFO attributable to common stockholders and limited partners | $ | 186,596 | $ | 183,047 | $ | 169,798 | $ | 166,547 | $ | 161,083 | ||||||||||||||||||||||
Weighted-average shares outstanding - basic | 229,251,460 | 229,159,472 | 222,152,574 | 216,737,561 | 215,673,313 | |||||||||||||||||||||||||||
Effect of weighted-average Limited Partner OP Units and dilutive securities (1) | 740,106 | 270,395 | 358,851 | 290,114 | 237,300 | |||||||||||||||||||||||||||
Weighted-average shares outstanding - diluted (2) | 229,991,566 | 229,429,867 | 222,511,425 | 217,027,675 | 215,910,613 | |||||||||||||||||||||||||||
AFFO attributable to common stockholders and limited partners per diluted share (3) | $ | 0.81 | $ | 0.80 | $ | 0.76 | $ | 0.77 | $ | 0.75 | ||||||||||||||||||||||
| ||||||||
| Q2 2021 SUPPLEMENTAL INFORMATION | ||||||||
EBITDAre and Normalized EBITDA (unaudited, in thousands) | ||
| Three Months Ended | ||||||||||||||||||||||||||||||||
| June 30, 2021 | March 31, 2021 | December 31, 2020 | September 30, 2020 | June 30, 2020 | ||||||||||||||||||||||||||||
| Net income (loss) | $ | 77,903 | $ | 120,723 | $ | (36,933) | $ | 98,917 | $ | 56,105 | ||||||||||||||||||||||
Adjustments: | ||||||||||||||||||||||||||||||||
Interest expense | 59,291 | 60,736 | 68,416 | 66,935 | 65,613 | |||||||||||||||||||||||||||
Depreciation and amortization | 105,839 | 108,075 | 107,205 | 108,257 | 108,733 | |||||||||||||||||||||||||||
Provision for income taxes | 931 | 928 | 1,358 | 1,054 | 1,053 | |||||||||||||||||||||||||||
Proportionate share of adjustments for unconsolidated entities | 2,267 | 2,249 | 2,443 | 2,451 | 1,775 | |||||||||||||||||||||||||||
Gain on disposition of real estate assets, net | (16,896) | (76,074) | (18,965) | (42,814) | (8,795) | |||||||||||||||||||||||||||
Impairment of real estate | 14,129 | 31,849 | 24,852 | 16,397 | 12,094 | |||||||||||||||||||||||||||
EBITDAre | $ | 243,464 | $ | 248,486 | $ | 148,376 | $ | 251,197 | $ | 236,578 | ||||||||||||||||||||||
| Impairment of intangibles and right of use assets | — | — | 3,352 | — | — | |||||||||||||||||||||||||||
Acquisition-related expenses | 1,428 | 1,354 | 1,048 | 1,050 | 1,169 | |||||||||||||||||||||||||||
| Merger, litigation and non-routine costs, net | 6,605 | 68 | 10,925 | 105 | (118) | |||||||||||||||||||||||||||
| Loss (gain) on investments | 22 | (695) | (313) | (76) | 142 | |||||||||||||||||||||||||||
Loss on derivative instruments, net | — | — | 85,392 | — | — | |||||||||||||||||||||||||||
Amortization of above-market lease assets and deferred lease incentives, net of amortization of below-market lease liabilities | 1,830 | 1,547 | 1,428 | 393 | 788 | |||||||||||||||||||||||||||
| (Gain) loss on extinguishment and forgiveness of debt, net | (35) | 2,132 | 67 | (61) | 200 | |||||||||||||||||||||||||||
Net direct financing lease adjustments | 374 | 366 | 379 | 381 | 372 | |||||||||||||||||||||||||||
Other adjustments, net | (2,050) | (2,055) | (3,919) | (8) | 54 | |||||||||||||||||||||||||||
Proportionate share of adjustments for unconsolidated entities | (32) | (32) | (46) | (48) | (706) | |||||||||||||||||||||||||||
| Normalized EBITDA | $ | 251,606 | $ | 251,171 | $ | 246,689 | $ | 252,933 | $ | 238,479 | ||||||||||||||||||||||
| ||||||||
| Q2 2021 SUPPLEMENTAL INFORMATION | ||||||||
Net Operating Income (unaudited, dollars in thousands) | ||
| Three Months Ended | ||||||||||||||||||||||||||||||||
| June 30, 2021 | March 31, 2021 | December 31, 2020 | September 30, 2020 | June 30, 2020 | ||||||||||||||||||||||||||||
Rental revenue - as reported (1) | $ | 290,567 | $ | 290,309 | $ | 287,431 | $ | 293,692 | $ | 278,576 | ||||||||||||||||||||||
| Property operating expense - as reported | (29,174) | (30,605) | (31,979) | (31,400) | (29,098) | |||||||||||||||||||||||||||
| NOI | 261,393 | 259,704 | 255,452 | 262,292 | 249,478 | |||||||||||||||||||||||||||
| Adjustments: | ||||||||||||||||||||||||||||||||
Straight-line rent | (4,613) | (4,219) | (7,108) | (12,595) | (3,404) | |||||||||||||||||||||||||||
Amortization of above-market lease assets and deferred lease incentives, net of amortization of below-market lease liabilities | 1,830 | 1,547 | 1,428 | 393 | 788 | |||||||||||||||||||||||||||
| Net direct financing lease adjustments | 374 | 366 | 379 | 381 | 372 | |||||||||||||||||||||||||||
| Other non-cash adjustments | (13) | (18) | — | — | — | |||||||||||||||||||||||||||
| Proportionate share of amounts for Unconsolidated Joint Ventures | 2,525 | 2,507 | 2,799 | 2,876 | 2,475 | |||||||||||||||||||||||||||
| Cash NOI | $ | 261,496 | $ | 259,887 | $ | 252,950 | $ | 253,347 | $ | 249,709 | ||||||||||||||||||||||
| Three Months Ended | ||||||||
| June 30, 2021 | ||||||||
| Cash NOI | $ | 261,496 | ||||||
Adjustments for intra-quarter acquisitions and dispositions (1) | 1,747 | |||||||
| Normalized Cash NOI | $ | 263,243 | ||||||
| ||||||||
| Q2 2021 SUPPLEMENTAL INFORMATION | ||||||||
Same Store Contract Rental Revenue (unaudited, dollars in thousands) | ||
| Three Months Ended June 30, | Increase/(Decrease) | |||||||||||||||||||||||||
| 2021 | 2020 | $ Change | % Change | |||||||||||||||||||||||
| Contract Rental Revenue | $ | 255,238 | $ | 242,472 | $ | 12,766 | 5.3 | % | ||||||||||||||||||
| Economic Occupancy Rate | 97.0 | % | 99.1 | % | N/A | (2.1) | % | |||||||||||||||||||
| Contract Rental Revenue | |||||||||||||||||||||||||||||||||||
| Number of | Three Months Ended June 30, | Increase/(Decrease) | |||||||||||||||||||||||||||||||||
| Properties | 2021 | 2020 | $ Change | % Change | |||||||||||||||||||||||||||||||
Retail | 2,042 | $ | 119,316 | $ | 117,446 | $ | 1,870 | 1.6 | % | ||||||||||||||||||||||||||
Restaurant | 1,498 | 51,661 | 41,168 | 10,493 | 25.5 | % | |||||||||||||||||||||||||||||
Industrial | 146 | 44,944 | 43,921 | 1,023 | 2.3 | % | |||||||||||||||||||||||||||||
| Office | 58 | 39,282 | 39,879 | (597) | (1.5) | % | |||||||||||||||||||||||||||||
Other (2) | 8 | 35 | 58 | (23) | (39.7) | % | |||||||||||||||||||||||||||||
| Total | 3,752 | $ | 255,238 | $ | 242,472 | $ | 12,766 | 5.3 | % | ||||||||||||||||||||||||||
| ||||||||
| Q2 2021 SUPPLEMENTAL INFORMATION | ||||||||
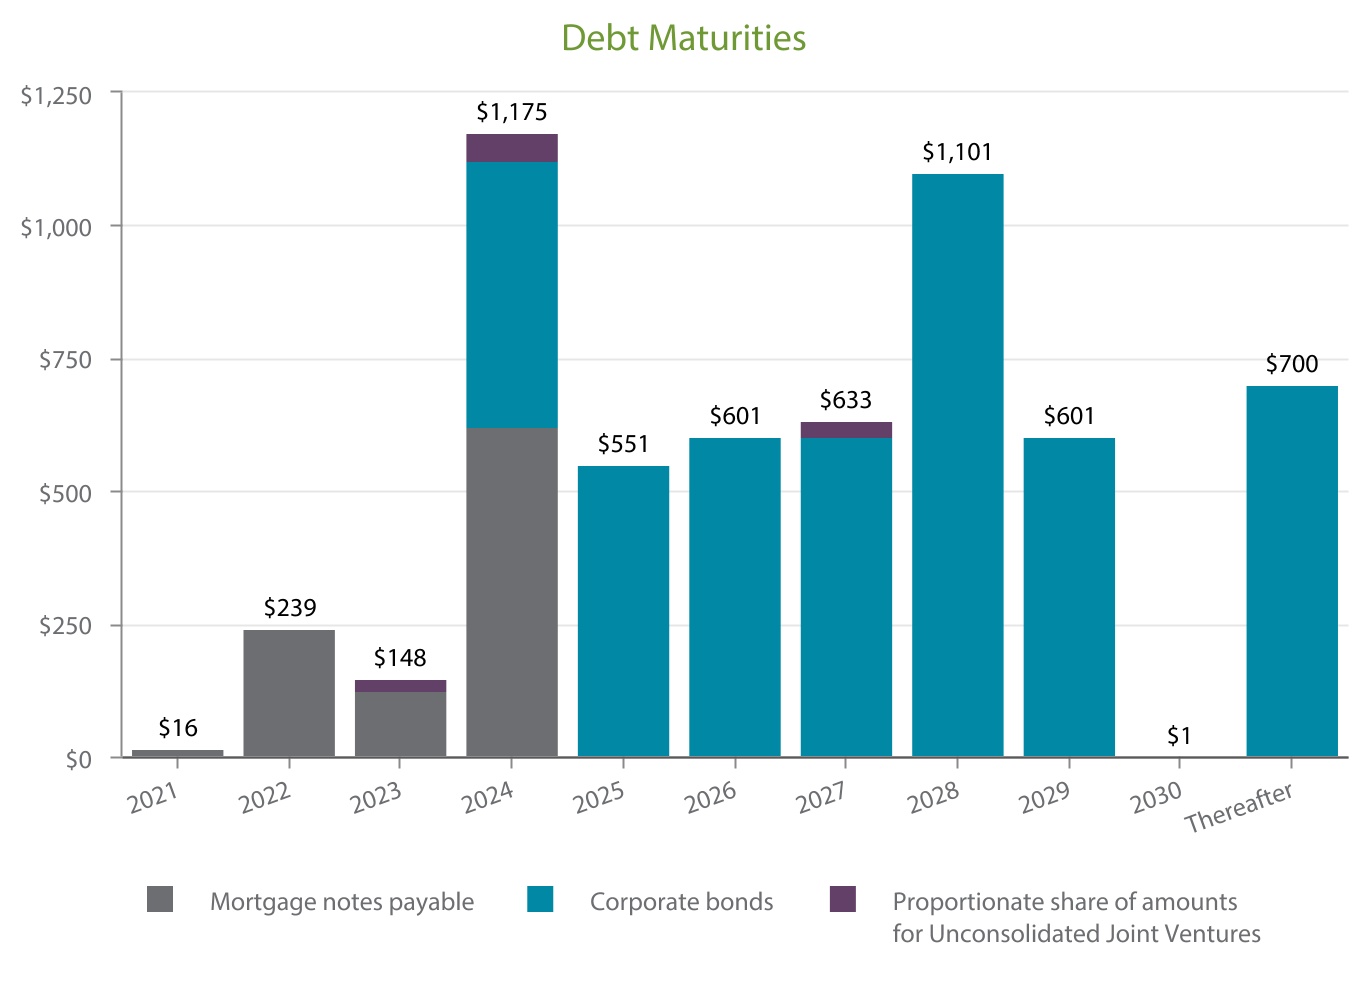
Adjusted Principal Outstanding and Preferred Equity Summary (unaudited, dollars in thousands) | ||
| Principal Payments Due | Total | 2021 | 2022 | 2023 | 2024 | 2025 | 2026 | 2027 | Thereafter | |||||||||||||||||||||||||||||||||||||||||||||||
| Mortgage notes payable | $ | 1,007,108 | $ | 15,705 | $ | 239,201 | $ | 124,217 | $ | 621,021 | $ | 1,078 | $ | 1,138 | $ | 1,202 | $ | 3,546 | ||||||||||||||||||||||||||||||||||||||
Corporate bonds | 4,650,000 | — | — | — | 500,000 | 550,000 | 600,000 | 600,000 | 2,400,000 | |||||||||||||||||||||||||||||||||||||||||||||||
| Proportionate share of amounts for Unconsolidated Joint Ventures | 109,678 | — | — | 23,672 | 53,850 | — | — | 32,156 | — | |||||||||||||||||||||||||||||||||||||||||||||||
Total Adjusted Principal Outstanding | $ | 5,766,786 | $ | 15,705 | $ | 239,201 | $ | 147,889 | $ | 1,174,871 | $ | 551,078 | $ | 601,138 | $ | 633,358 | $ | 2,403,546 | ||||||||||||||||||||||||||||||||||||||
| Debt Type | Percentage of Adjusted Principal Outstanding | Weighted-Average Interest Rate | Weighted-Average Years to Maturity | |||||||||||||||||
| Mortgage notes payable | 17.5 | % | 4.86 | % | 2.1 | |||||||||||||||
| Corporate bonds | 80.6 | % | 3.68 | % | 6.6 | |||||||||||||||
| Proportionate share of amounts for Unconsolidated Joint Ventures | 1.9 | % | 2.90 | % | 3.6 | |||||||||||||||
| Total | 100.0 | % | 3.87 | % | 5.8 | |||||||||||||||
| Debt Type | Percentage of Adjusted Principal Outstanding | Weighted-Average Interest Rate | Weighted-Average Years to Maturity | |||||||||||||||||
| Total unsecured debt | 80.6 | % | 3.68 | % | 6.6 | |||||||||||||||
Total secured debt | 19.4 | % | 4.67 | % | 2.2 | |||||||||||||||
Total | 100.0 | % | 3.87 | % | 5.8 | |||||||||||||||
| Total fixed-rate debt | 99.3 | % | 3.88 | % | 5.8 | |||||||||||||||
Total variable-rate debt | 0.7 | % | 2.43 | % | 1.0 | |||||||||||||||
| Total | 100.0 | % | 3.87 | % | 5.8 | |||||||||||||||
| Preferred Equity | Balance (1) | Dividend Rate | ||||||||||||
| Series F preferred stock | $ | 373,025 | 6.7 | % | ||||||||||
| ||||||||
| Q2 2021 SUPPLEMENTAL INFORMATION | ||||||||
Adjusted Principal Outstanding and Preferred Equity Summary (cont.) (unaudited, dollars in millions) | ||
| ||||||||
| Q2 2021 SUPPLEMENTAL INFORMATION | ||||||||
Credit Facility and Corporate Bond Covenants (unaudited) | ||
| Unsecured Credit Facility Key Covenants | Required | June 30, 2021 | ||||||||||||
Ratio of total indebtedness to total asset value | ≤ 60% | 37.1% | ||||||||||||
Ratio of adjusted EBITDA to fixed charges | ≥ 1.5x | 3.51x | ||||||||||||
Ratio of secured indebtedness to total asset value | ≤ 45% | 5.7% | ||||||||||||
Ratio of unsecured indebtedness to unencumbered asset value | ≤ 60% | 37.4% | ||||||||||||
Ratio of unencumbered adjusted NOI to unsecured interest expense | ≥ 1.75x | 4.71x | ||||||||||||
| Corporate Bond Key Covenants | Required | June 30, 2021 | ||||||||||||
Limitation on incurrence of total debt | ≤ 65% | 37.3% | ||||||||||||
Limitation on incurrence of secured debt | ≤ 40% | 6.7% | ||||||||||||
Debt service coverage | ≥ 1.5x | 4.26x | ||||||||||||
Maintenance of total unencumbered assets | ≥ 150% | 282.8% | ||||||||||||
| ||||||||
| Q2 2021 SUPPLEMENTAL INFORMATION | ||||||||
Acquisitions and Dispositions (unaudited, square feet and dollars in thousands) | ||
| Property Type | Number of Properties | Square Feet | Weighted Average Lease Term (Years) (1) | Weighted Average Cash Cap Rate | Purchase Price (2) | |||||||||||||||||||||||||||
| Retail | 51 | 746 | 15.4 | 6.8 | % | $ | 175,796 | |||||||||||||||||||||||||
| Restaurant | 1 | 3 | 19.9 | 6.2 | % | 1,585 | ||||||||||||||||||||||||||
Total acquisitions (3) | 52 | 749 | 15.4 | 6.7 | % | $ | 177,381 | |||||||||||||||||||||||||
| Number of Properties | Square Feet | Weighted Average Lease Term (Years) (4) | Weighted Average Cash Cap Rate (5) | Sale Price | Gain (Loss) | |||||||||||||||||||||||||||||||||
| Office | 2 | 218 | 5.7 | 7.3 | % | $ | 35,331 | $ | 2,850 | |||||||||||||||||||||||||||||
| Restaurant | 2 | 8 | 5.8 | 6.1 | % | 1,200 | 366 | |||||||||||||||||||||||||||||||
| Retail | 6 | 395 | 5.4 | 7.2 | % | 62,923 | 12,329 | |||||||||||||||||||||||||||||||
Vacant and other (6) | 12 | 89 | N/A | N/A | 9,529 | 1,465 | ||||||||||||||||||||||||||||||||
| Total dispositions | 22 | 710 | 5.5 | 7.2 | % | $ | 108,983 | $ | 17,010 | |||||||||||||||||||||||||||||
| Held for sale assets | (114) | |||||||||||||||||||||||||||||||||||||
| Total gain on disposition of real estate, net | $ | 16,896 | ||||||||||||||||||||||||||||||||||||
| ||||||||
| Q2 2021 SUPPLEMENTAL INFORMATION | ||||||||
Diversification Statistics: Real Estate Portfolio (unaudited, percentages based on portfolio Annualized Rental Income) | ||
Statistics (square feet in thousands) | |||||||||||
| Operating Properties | 3,885 | ||||||||||
| Rentable Square Feet | 88,864 | ||||||||||
Economic Occupancy Rate | 97.1 | % | |||||||||
Weighted Average Remaining Lease Term | 8.5 | ||||||||||
| Investment-Grade Tenants | 37.8 | % | |||||||||
| Flat leases | 19.1 | % | |||||||||
| NNN leases | 65.3 | % | |||||||||
| ||||||||
| Q2 2021 SUPPLEMENTAL INFORMATION | ||||||||
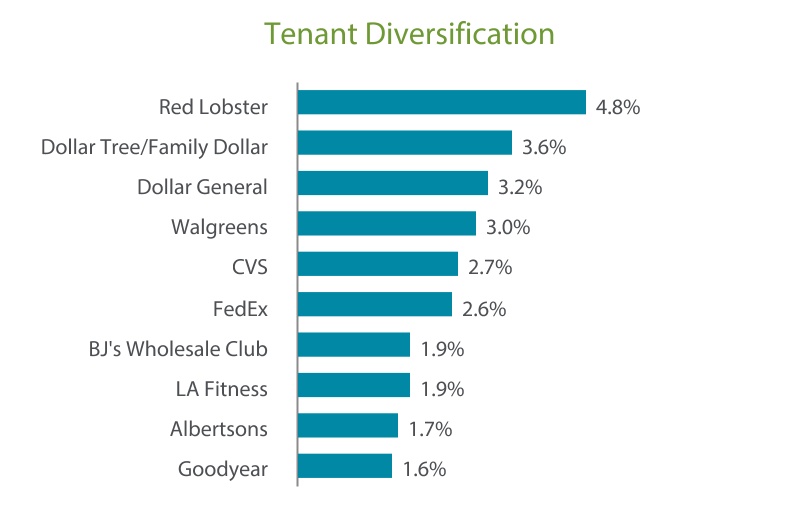
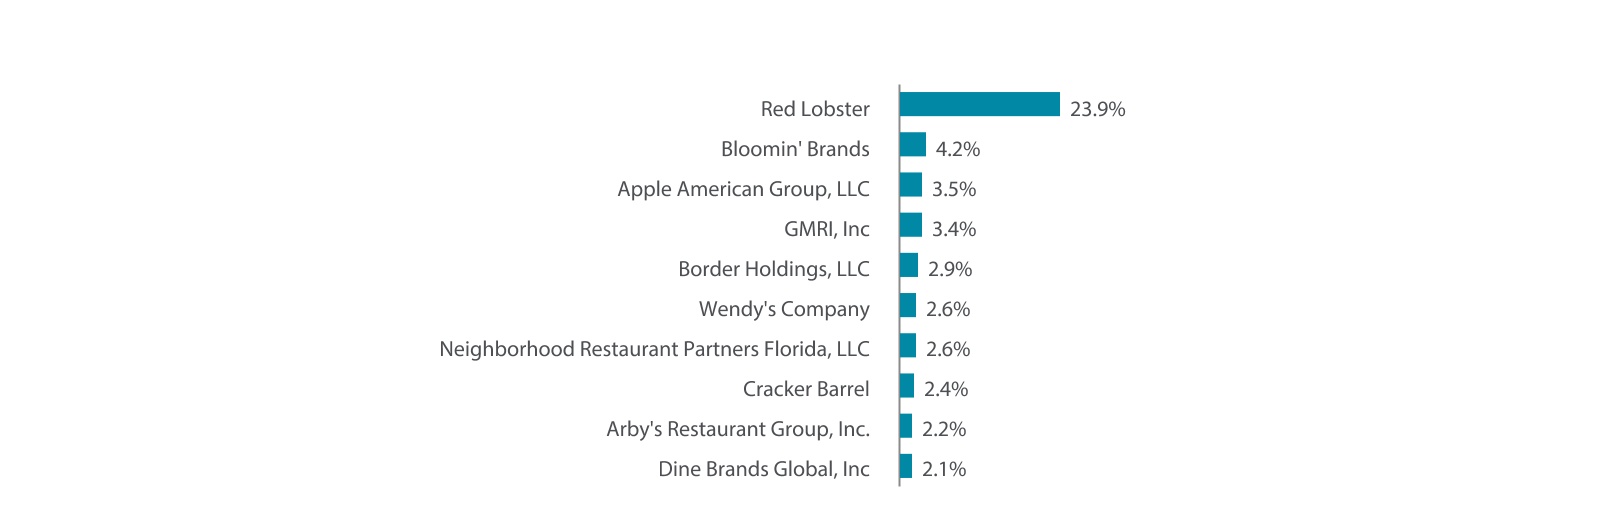
Top 10 Concentrations: Real Estate Portfolio (unaudited, square feet and dollars in thousands) | ||
| Tenant Concentration | Number of Leases | Leased Square Feet | Square Feet as a % of Total Portfolio | Annualized Rental Income | Annualized Rental Income as a % of Total Portfolio | Investment Rating | ||||||||||||||||||||||||||||||||
| Red Lobster | 25 | 1,489 | 1.7 | % | $ | 52,353 | 4.8 | % | NR | |||||||||||||||||||||||||||||
| Dollar Tree/Family Dollar | 113 | 3,354 | 3.8 | % | 39,310 | 3.6 | % | BBB | ||||||||||||||||||||||||||||||
| Dollar General | 403 | 3,734 | 4.2 | % | 34,597 | 3.2 | % | BBB | ||||||||||||||||||||||||||||||
| Walgreens | 92 | 1,310 | 1.5 | % | 32,436 | 3.0 | % | BBB | ||||||||||||||||||||||||||||||
| CVS | 90 | 1,293 | 1.5 | % | 28,774 | 2.7 | % | BBB | ||||||||||||||||||||||||||||||
| FedEx | 41 | 2,595 | 2.9 | % | 27,639 | 2.6 | % | BBB | ||||||||||||||||||||||||||||||
| BJ's Wholesale Club | 3 | 2,223 | 2.5 | % | 20,800 | 1.9 | % | BB | ||||||||||||||||||||||||||||||
| LA Fitness | 24 | 1,049 | 1.2 | % | 20,467 | 1.9 | % | CCC+ | ||||||||||||||||||||||||||||||
| Albertsons | 26 | 1,536 | 1.7 | % | 18,628 | 1.7 | % | BB- | ||||||||||||||||||||||||||||||
| Goodyear | 5 | 4,728 | 5.3 | % | 17,421 | 1.6 | % | BB- | ||||||||||||||||||||||||||||||
| Total | 822 | 23,311 | 26.3 | % | $ | 292,425 | 27.0 | % | ||||||||||||||||||||||||||||||
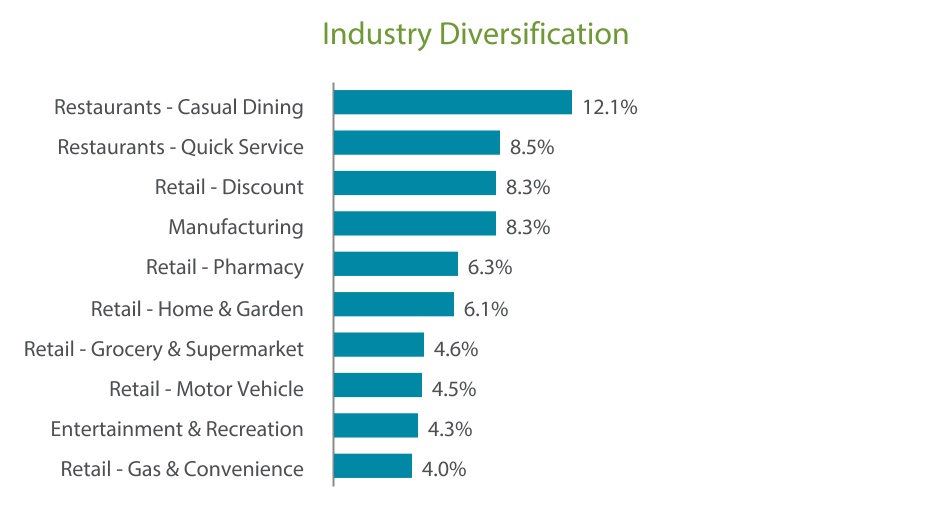
| Tenant Industry Concentration | Number of Leases | Leased Square Feet | Square Feet as a % of Total Portfolio | Annualized Rental Income | Annualized Rental Income as a % of Total Portfolio | |||||||||||||||||||||||||||
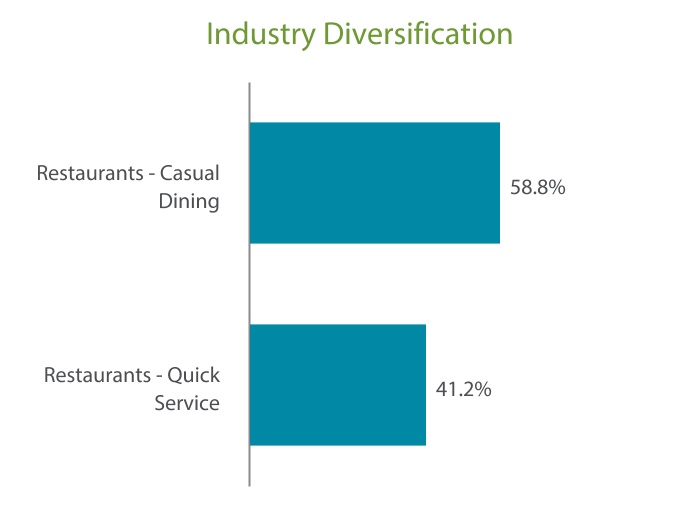
| Restaurants - Casual Dining | 298 | 3,683 | 4.1 | % | $ | 130,228 | 12.1 | % | ||||||||||||||||||||||||
| Restaurants - Quick Service | 773 | 2,860 | 3.2 | % | 91,336 | 8.5 | % | |||||||||||||||||||||||||
| Retail - Discount | 543 | 8,930 | 10.0 | % | 90,090 | 8.3 | % | |||||||||||||||||||||||||
| Manufacturing | 49 | 15,748 | 17.7 | % | 89,490 | 8.3 | % | |||||||||||||||||||||||||
| Retail - Pharmacy | 196 | 2,991 | 3.4 | % | 67,916 | 6.3 | % | |||||||||||||||||||||||||
| Retail - Home & Garden | 111 | 8,926 | 10.0 | % | 65,744 | 6.1 | % | |||||||||||||||||||||||||
| Retail - Grocery & Supermarket | 68 | 4,254 | 4.8 | % | 49,268 | 4.6 | % | |||||||||||||||||||||||||
| Retail - Motor Vehicle | 181 | 6,138 | 6.9 | % | 48,828 | 4.5 | % | |||||||||||||||||||||||||
| Entertainment & Recreation | 39 | 1,783 | 2.0 | % | 46,078 | 4.3 | % | |||||||||||||||||||||||||
| Retail - Gas & Convenience | 159 | 881 | 1.0 | % | 43,075 | 4.0 | % | |||||||||||||||||||||||||
| Total | 2,417 | 56,194 | 63.1 | % | $ | 722,053 | 67.0 | % | ||||||||||||||||||||||||
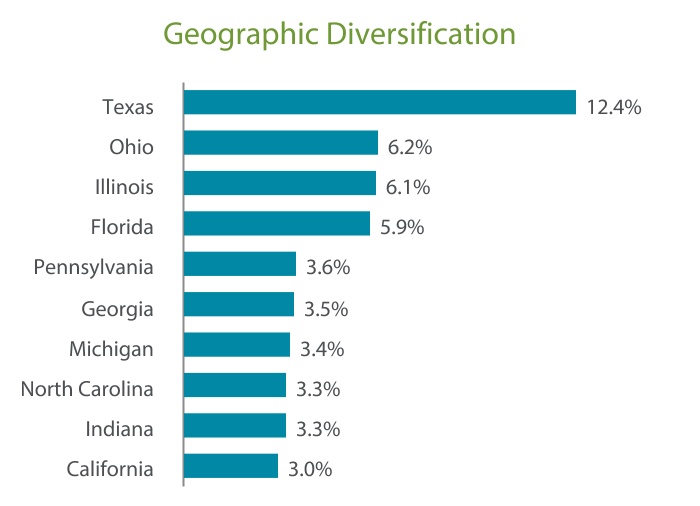
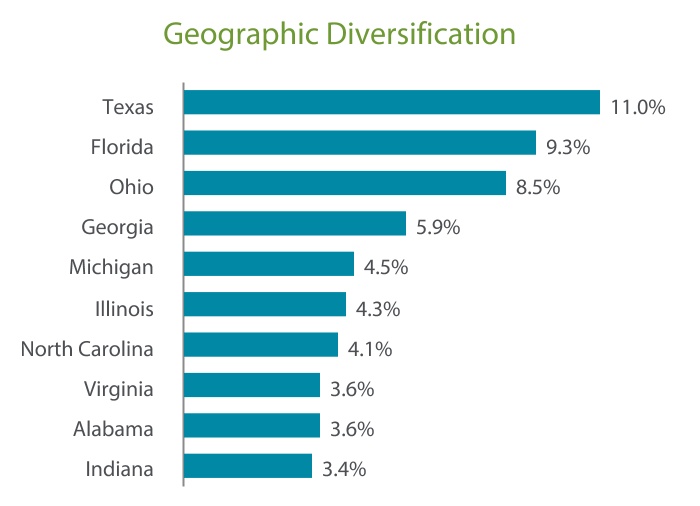
| Geographic Concentration | Number of Properties | Rentable Square Feet | Square Feet as a % of Total Portfolio | Annualized Rental Income | Annualized Rental Income as a % of Total Portfolio | |||||||||||||||||||||||||||
| Texas | 551 | 10,468 | 11.8 | % | $ | 133,471 | 12.4 | % | ||||||||||||||||||||||||
| Ohio | 277 | 8,587 | 9.7 | % | 67,368 | 6.2 | % | |||||||||||||||||||||||||
| Illinois | 153 | 4,758 | 5.4 | % | 65,672 | 6.1 | % | |||||||||||||||||||||||||
| Florida | 247 | 4,308 | 4.8 | % | 63,848 | 5.9 | % | |||||||||||||||||||||||||
| Pennsylvania | 100 | 3,772 | 4.2 | % | 38,654 | 3.6 | % | |||||||||||||||||||||||||
| Georgia | 163 | 3,135 | 3.5 | % | 38,149 | 3.5 | % | |||||||||||||||||||||||||
| Michigan | 190 | 2,022 | 2.3 | % | 36,651 | 3.4 | % | |||||||||||||||||||||||||
| North Carolina | 146 | 3,260 | 3.7 | % | 35,692 | 3.3 | % | |||||||||||||||||||||||||
| Indiana | 132 | 4,511 | 5.1 | % | 35,440 | 3.3 | % | |||||||||||||||||||||||||
| California | 58 | 3,154 | 3.5 | % | 32,455 | 3.0 | % | |||||||||||||||||||||||||
| Total | 2,017 | 47,975 | 54.0 | % | $ | 547,400 | 50.7 | % | ||||||||||||||||||||||||
| ||||||||
| Q2 2021 SUPPLEMENTAL INFORMATION | ||||||||
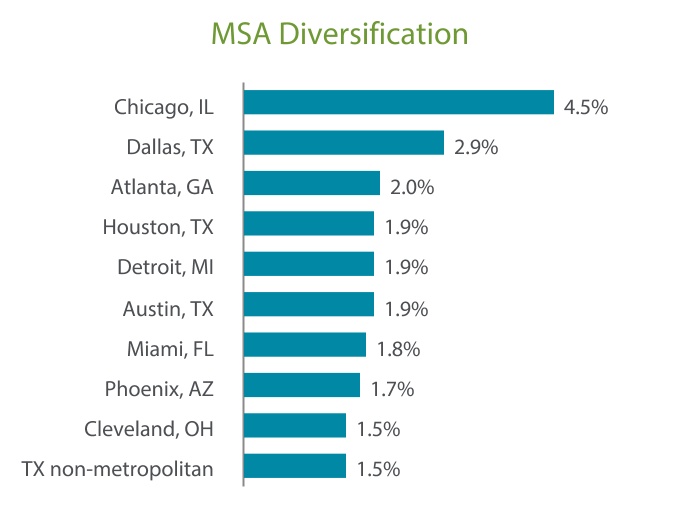
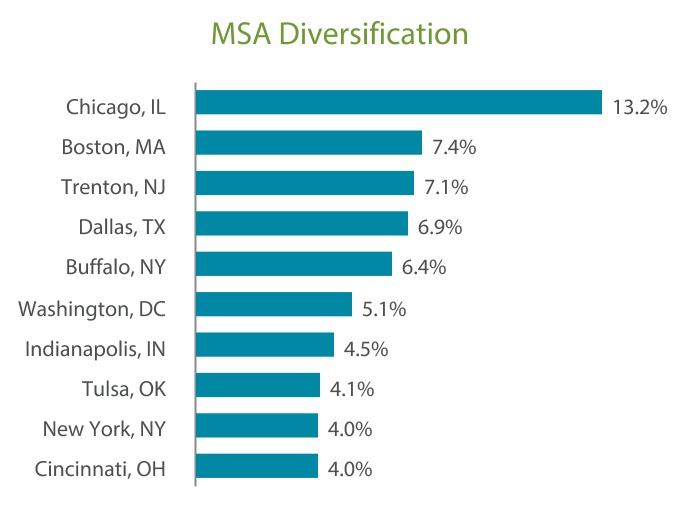
Top 10 Concentrations: Real Estate Portfolio (unaudited, square feet and dollars in thousands) | ||
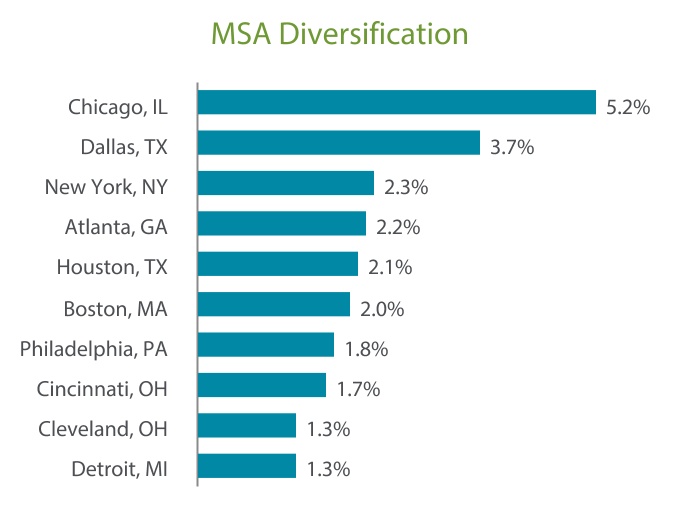
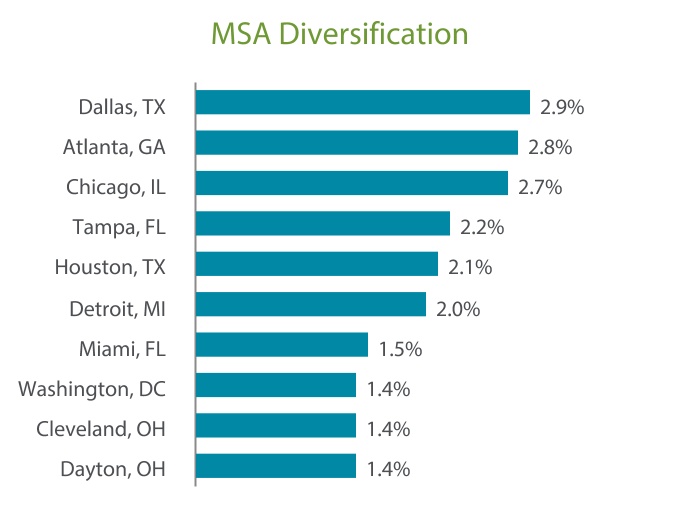
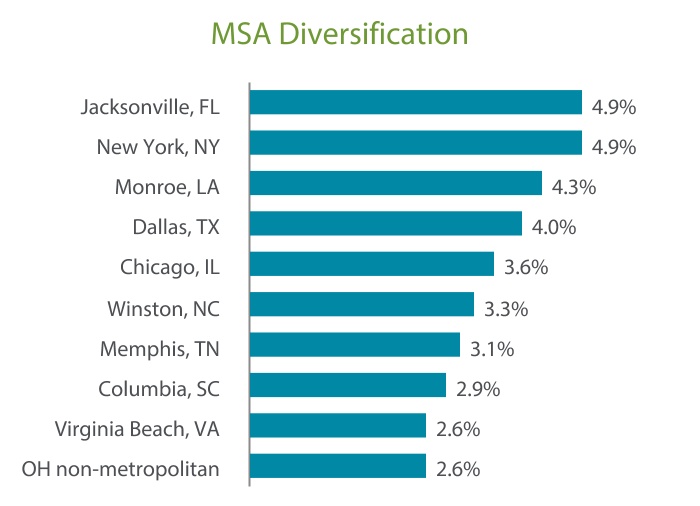
| Metropolitan Statistical Area (MSA) Concentration | Number of Properties | Rentable Square Feet | Square Feet as a % of Total Portfolio | Annualized Rental Income | Annualized Rental Income as a % of Total Portfolio | |||||||||||||||||||||||||||
| Chicago, IL | 98 | 4,078 | 4.6 | % | $ | 56,311 | 5.2 | % | ||||||||||||||||||||||||
| Dallas, TX | 107 | 3,411 | 3.8 | % | 39,772 | 3.7 | % | |||||||||||||||||||||||||
| New York, NY | 23 | 1,141 | 1.3 | % | 24,321 | 2.3 | % | |||||||||||||||||||||||||
| Atlanta, GA | 72 | 2,188 | 2.5 | % | 23,396 | 2.2 | % | |||||||||||||||||||||||||
| Houston, TX | 85 | 2,235 | 2.5 | % | 23,056 | 2.1 | % | |||||||||||||||||||||||||
| Boston, MA | 20 | 1,505 | 1.7 | % | 21,164 | 2.0 | % | |||||||||||||||||||||||||
| Philadelphia, PA | 35 | 1,114 | 1.3 | % | 19,716 | 1.8 | % | |||||||||||||||||||||||||
| Cincinnati, OH | 42 | 2,316 | 2.6 | % | 18,564 | 1.7 | % | |||||||||||||||||||||||||
| Cleveland, OH | 59 | 1,107 | 1.2 | % | 14,526 | 1.3 | % | |||||||||||||||||||||||||
| Detroit, MI | 60 | 714 | 0.8 | % | 14,372 | 1.3 | % | |||||||||||||||||||||||||
| Total | 601 | 19,809 | 22.3 | % | $ | 255,198 | 23.6 | % | ||||||||||||||||||||||||
| ||||||||
| Q2 2021 SUPPLEMENTAL INFORMATION | ||||||||
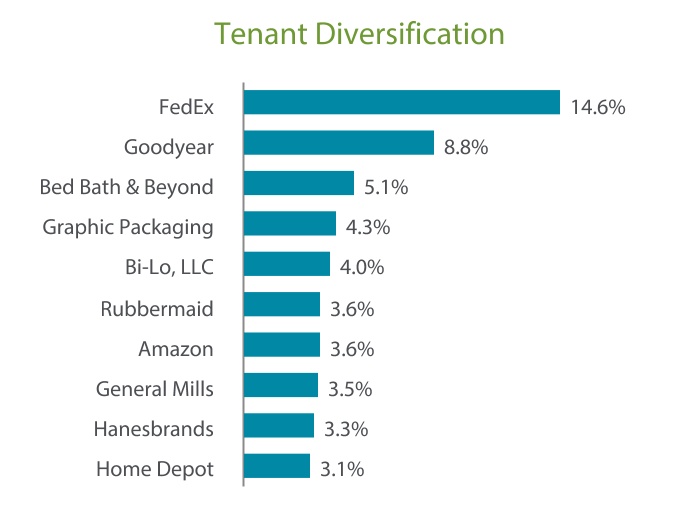
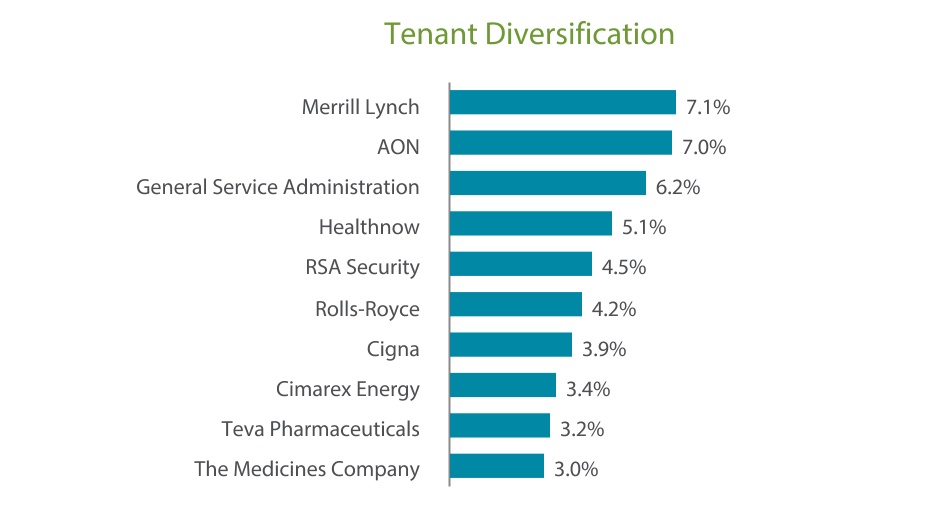
Tenants Comprising Over 1% of Annualized Rental Income (unaudited, square feet and dollars in thousands) | ||
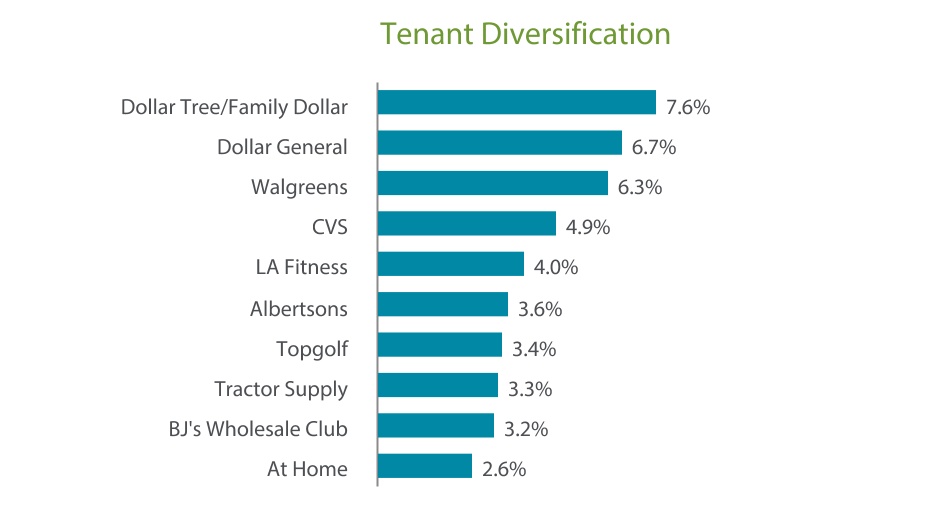
| Tenant | Number of Leases | Leased Square Feet | Square Feet as a % of Total Portfolio | Annualized Rental Income | Annualized Rental Income as a % of Total Portfolio | Investment Rating | ||||||||||||||||||||||||||||||||
| Red Lobster | 25 | 1,489 | 1.7 | % | $ | 52,353 | 4.8 | % | NR | |||||||||||||||||||||||||||||
| Dollar Tree/Family Dollar | 113 | 3,354 | 3.8 | % | 39,310 | 3.6 | % | BBB | ||||||||||||||||||||||||||||||
| Dollar General | 403 | 3,734 | 4.2 | % | 34,597 | 3.2 | % | BBB | ||||||||||||||||||||||||||||||
| Walgreens | 92 | 1,310 | 1.5 | % | 32,436 | 3.0 | % | BBB | ||||||||||||||||||||||||||||||
| CVS | 90 | 1,293 | 1.5 | % | 28,774 | 2.7 | % | BBB | ||||||||||||||||||||||||||||||
| FedEx | 41 | 2,595 | 2.9 | % | 27,639 | 2.6 | % | BBB | ||||||||||||||||||||||||||||||
| BJ's Wholesale Club | 3 | 2,223 | 2.5 | % | 20,800 | 1.9 | % | BB | ||||||||||||||||||||||||||||||
| LA Fitness | 24 | 1,049 | 1.2 | % | 20,467 | 1.9 | % | CCC+ | ||||||||||||||||||||||||||||||
| Albertsons | 26 | 1,536 | 1.7 | % | 18,628 | 1.7 | % | BB- | ||||||||||||||||||||||||||||||
| Goodyear | 5 | 4,728 | 5.3 | % | 17,421 | 1.6 | % | BB- | ||||||||||||||||||||||||||||||
| Topgolf | 5 | 290 | 0.3 | % | 17,281 | 1.6 | % | B- | ||||||||||||||||||||||||||||||
| Tractor Supply | 61 | 1,274 | 1.4 | % | 16,777 | 1.6 | % | BBB | ||||||||||||||||||||||||||||||
| At Home | 6 | 1,538 | 1.7 | % | 13,306 | 1.2 | % | B | ||||||||||||||||||||||||||||||
| Advance Auto Parts | 104 | 716 | 0.8 | % | 11,883 | 1.1 | % | BBB- | ||||||||||||||||||||||||||||||
| Home Depot | 9 | 1,751 | 2.0 | % | 11,837 | 1.1 | % | A | ||||||||||||||||||||||||||||||
| Lowe's | 14 | 1,751 | 2.0 | % | 11,541 | 1.1 | % | BBB+ | ||||||||||||||||||||||||||||||
| Merrill Lynch | 1 | 482 | 0.5 | % | 11,104 | 1.0 | % | A- | ||||||||||||||||||||||||||||||
| AON | 2 | 819 | 0.9 | % | 10,822 | 1.0 | % | A- | ||||||||||||||||||||||||||||||
| Total | 1,024 | 31,932 | 35.9 | % | $ | 396,976 | 36.7 | % | ||||||||||||||||||||||||||||||
| ||||||||
| Q2 2021 SUPPLEMENTAL INFORMATION | ||||||||
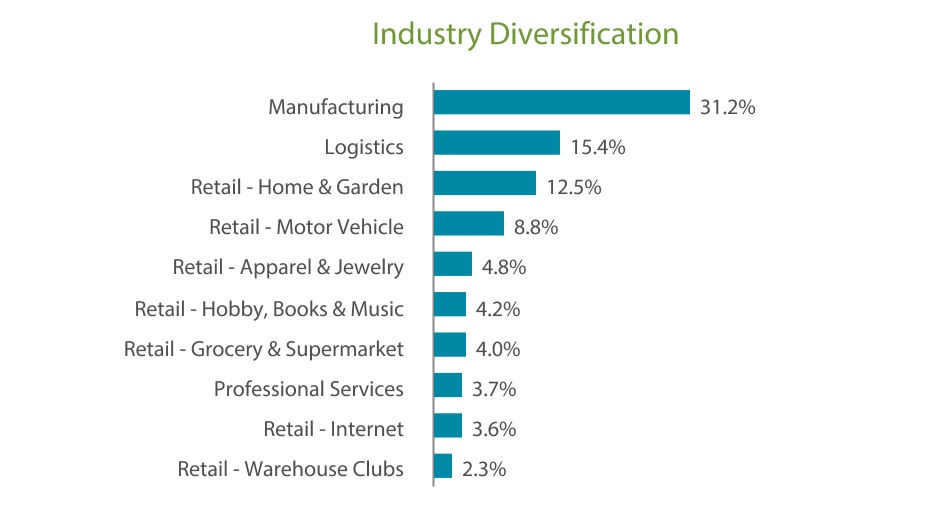
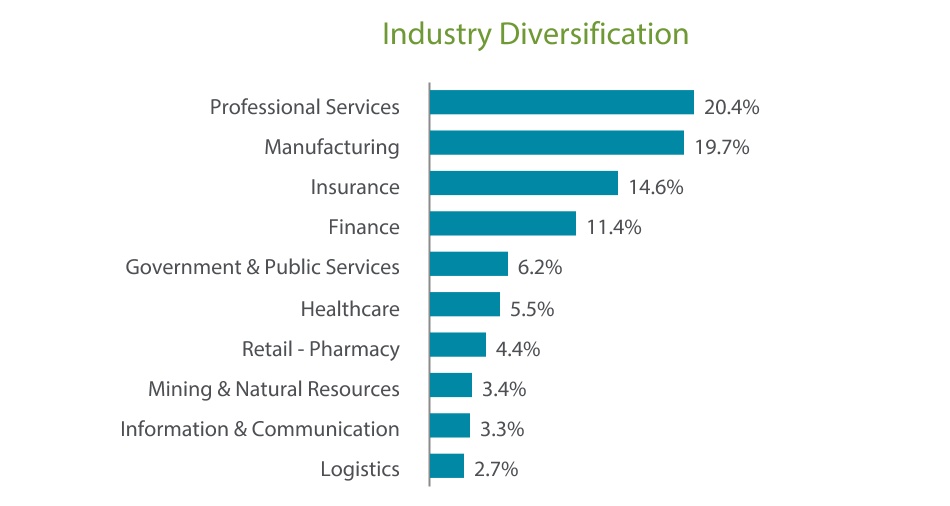
Diversification: Tenant Industry (unaudited, square feet and dollars in thousands) | ||
Industry | Number of Leases | Leased Square Feet | Leased Square Feet as a % of Total Portfolio | Annualized Rental Income | Annualized Rental Income as a % of Total Portfolio | |||||||||||||||||||||||||||
| Administration & Support Services | 3 | 425 | 0.5 | % | $ | 3,960 | 0.4 | % | ||||||||||||||||||||||||
| Agricultural | 2 | 138 | 0.2 | % | 1,245 | 0.1 | % | |||||||||||||||||||||||||
| Education | 3 | 24 | — | % | 445 | — | % | |||||||||||||||||||||||||
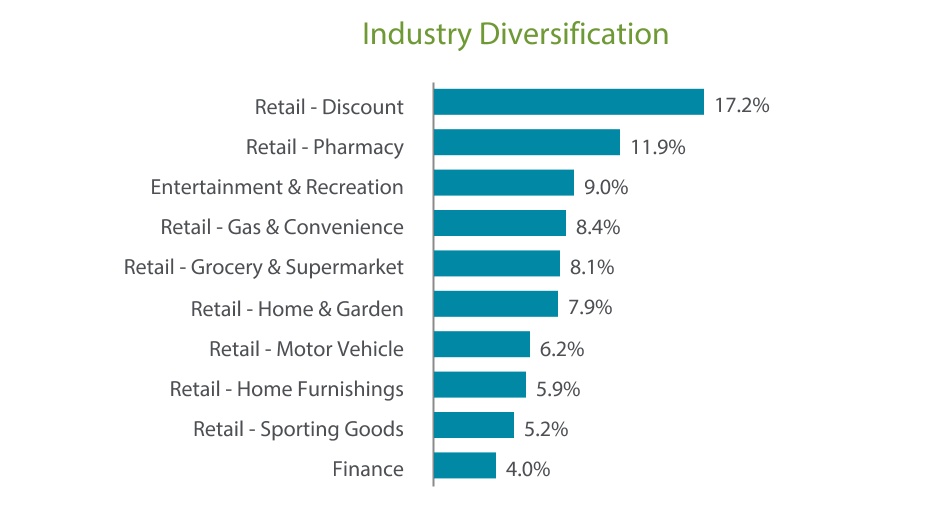
| Entertainment & Recreation | 39 | 1,783 | 2.0 | % | 46,078 | 4.3 | % | |||||||||||||||||||||||||
| Finance | 153 | 1,699 | 1.9 | % | 38,238 | 3.5 | % | |||||||||||||||||||||||||
| Government & Public Services | 11 | 589 | 0.7 | % | 10,059 | 0.9 | % | |||||||||||||||||||||||||
| Healthcare | 7 | 690 | 0.8 | % | 9,184 | 0.9 | % | |||||||||||||||||||||||||
| Information & Communication | 5 | 385 | 0.4 | % | 5,253 | 0.5 | % | |||||||||||||||||||||||||
| Insurance | 12 | 1,155 | 1.3 | % | 22,902 | 2.1 | % | |||||||||||||||||||||||||
| Logistics | 44 | 3,297 | 3.7 | % | 33,394 | 3.1 | % | |||||||||||||||||||||||||
| Manufacturing | 49 | 15,748 | 17.7 | % | 89,490 | 8.3 | % | |||||||||||||||||||||||||
| Mining & Natural Resources | 5 | 424 | 0.5 | % | 6,807 | 0.6 | % | |||||||||||||||||||||||||
| Other Services | 28 | 511 | 0.6 | % | 5,580 | 0.5 | % | |||||||||||||||||||||||||
| Professional Services | 46 | 3,075 | 3.5 | % | 38,916 | 3.6 | % | |||||||||||||||||||||||||
| Rental | 10 | 878 | 1.0 | % | 9,521 | 0.9 | % | |||||||||||||||||||||||||
| Restaurants - Casual Dining | 298 | 3,683 | 4.1 | % | 130,228 | 12.1 | % | |||||||||||||||||||||||||
| Restaurants - Quick Service | 773 | 2,860 | 3.2 | % | 91,336 | 8.5 | % | |||||||||||||||||||||||||
| Retail - Apparel & Jewelry | 13 | 1,360 | 1.5 | % | 16,197 | 1.5 | % | |||||||||||||||||||||||||
| Retail - Department Stores | 17 | 1,223 | 1.4 | % | 10,349 | 1.0 | % | |||||||||||||||||||||||||
| Retail - Discount | 543 | 8,930 | 10.0 | % | 90,090 | 8.3 | % | |||||||||||||||||||||||||
| Retail - Electronics & Appliances | 14 | 1,559 | 1.8 | % | 10,045 | 0.9 | % | |||||||||||||||||||||||||
| Retail - Gas & Convenience | 159 | 881 | 1.0 | % | 43,075 | 4.0 | % | |||||||||||||||||||||||||
| Retail - Grocery & Supermarket | 68 | 4,254 | 4.8 | % | 49,268 | 4.6 | % | |||||||||||||||||||||||||
| Retail - Hobby, Books & Music | 15 | 2,091 | 2.3 | % | 12,696 | 1.2 | % | |||||||||||||||||||||||||
| Retail - Home & Garden | 111 | 8,926 | 10.0 | % | 65,744 | 6.1 | % | |||||||||||||||||||||||||
| Retail - Home Furnishings | 48 | 2,731 | 3.1 | % | 30,133 | 2.8 | % | |||||||||||||||||||||||||
| Retail - Internet | 1 | 1,423 | 1.6 | % | 6,797 | 0.6 | % | |||||||||||||||||||||||||
| Retail - Medical Services | 63 | 526 | 0.6 | % | 11,520 | 1.1 | % | |||||||||||||||||||||||||
| Retail - Motor Vehicle | 181 | 6,138 | 6.9 | % | 48,828 | 4.5 | % | |||||||||||||||||||||||||
| Retail - Pet Supply | 14 | 558 | 0.6 | % | 10,670 | 1.0 | % | |||||||||||||||||||||||||
| Retail - Pharmacy | 196 | 2,991 | 3.4 | % | 67,916 | 6.3 | % | |||||||||||||||||||||||||
| Retail - Specialty (Other) | 18 | 520 | 0.6 | % | 5,602 | 0.5 | % | |||||||||||||||||||||||||
| Retail - Sporting Goods | 25 | 2,039 | 2.3 | % | 26,743 | 2.5 | % | |||||||||||||||||||||||||
| Retail - Warehouse Clubs | 5 | 2,466 | 2.8 | % | 22,989 | 2.1 | % | |||||||||||||||||||||||||
Other | 24 | 321 | 0.3 | % | 8,288 | 0.7 | % | |||||||||||||||||||||||||
Total | 3,003 | 86,301 | 97.1 | % | $ | 1,079,586 | 100.0 | % | ||||||||||||||||||||||||
| ||||||||
| Q2 2021 SUPPLEMENTAL INFORMATION | ||||||||
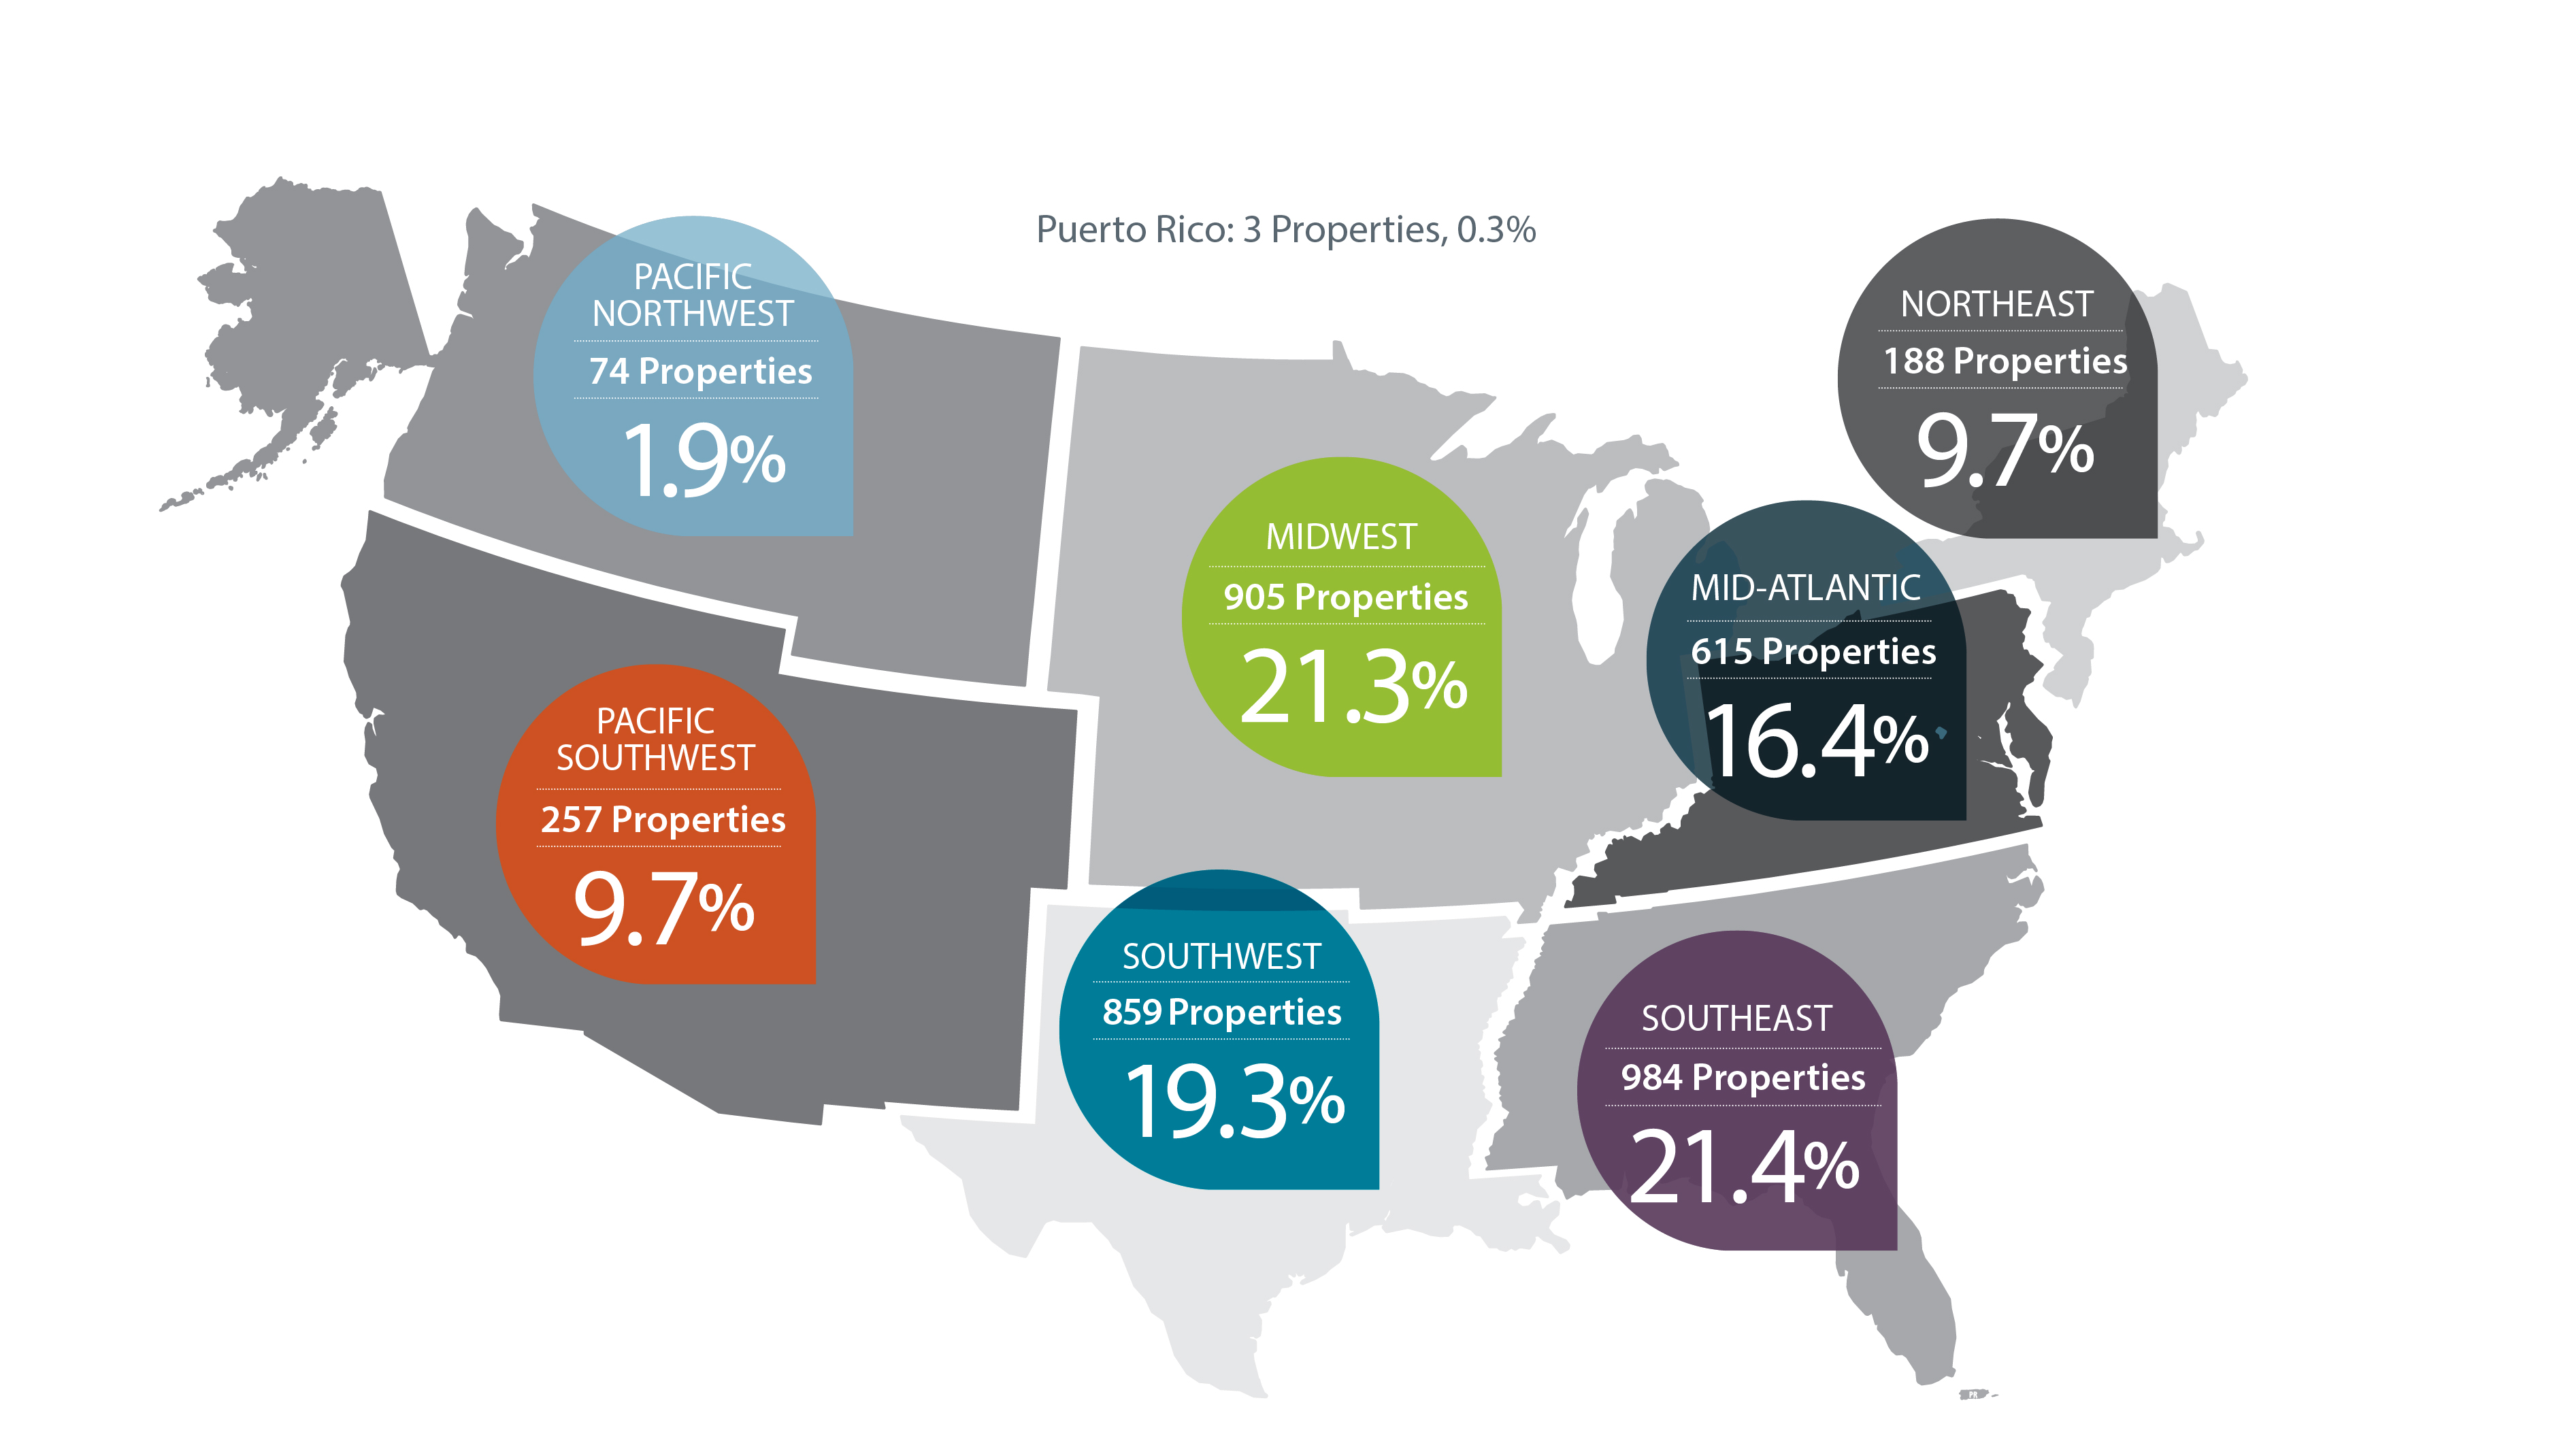
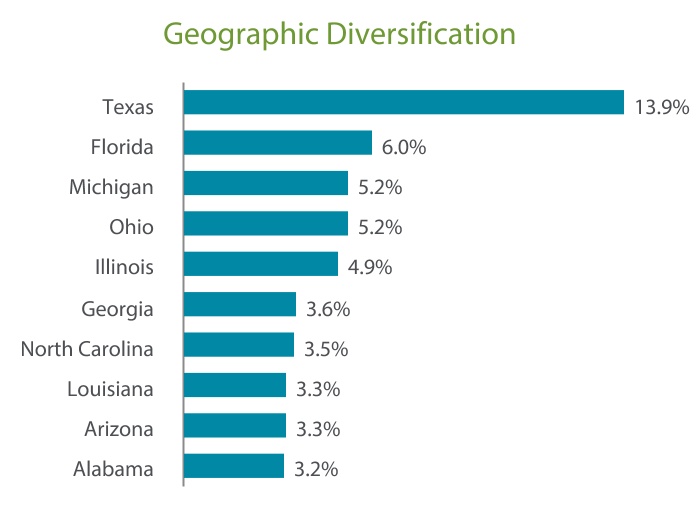
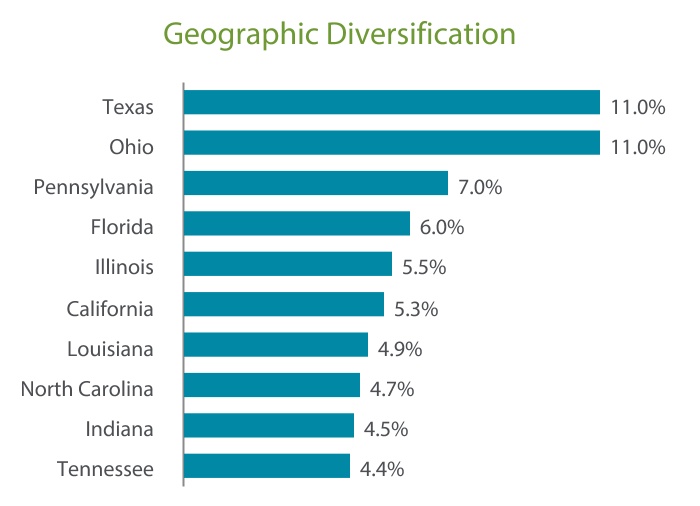
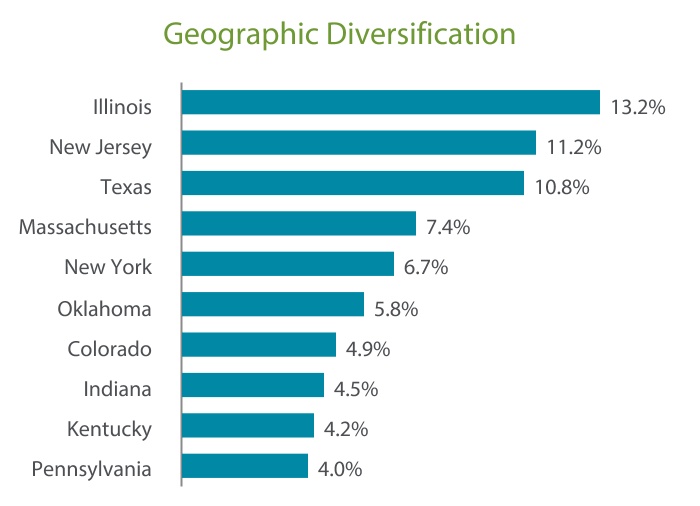
Diversification: Property Geographic (unaudited, square feet and dollars in thousands) | ||
Location | Number of Properties | Rentable Square Feet | Square Feet as a % of Total Portfolio | Annualized Rental Income | Annualized Rental Income as a % of Total Portfolio | |||||||||||||||||||||||||||
United States | ||||||||||||||||||||||||||||||||
| Alabama | 149 | 1,666 | 1.9 | % | $ | 26,784 | 2.5 | % | ||||||||||||||||||||||||
| Alaska | 3 | 25 | — | % | 821 | 0.1 | % | |||||||||||||||||||||||||
| Arizona | 75 | 1,457 | 1.6 | % | 23,666 | 2.2 | % | |||||||||||||||||||||||||
| Arkansas | 129 | 1,282 | 1.4 | % | 19,747 | 1.8 | % | |||||||||||||||||||||||||
| California | 58 | 3,154 | 3.6 | % | 32,455 | 3.0 | % | |||||||||||||||||||||||||
| Colorado | 42 | 1,548 | 1.7 | % | 23,527 | 2.2 | % | |||||||||||||||||||||||||
| Connecticut | 14 | 85 | 0.1 | % | 1,807 | 0.2 | % | |||||||||||||||||||||||||
| Delaware | 6 | 59 | 0.1 | % | 1,075 | 0.1 | % | |||||||||||||||||||||||||
| Florida | 247 | 4,308 | 4.8 | % | 63,848 | 5.9 | % | |||||||||||||||||||||||||
| Georgia | 163 | 3,135 | 3.5 | % | 38,149 | 3.5 | % | |||||||||||||||||||||||||
| Idaho | 17 | 143 | 0.2 | % | 3,386 | 0.3 | % | |||||||||||||||||||||||||
| Illinois | 153 | 4,758 | 5.4 | % | 65,672 | 6.1 | % | |||||||||||||||||||||||||
| Indiana | 132 | 4,511 | 5.1 | % | 35,440 | 3.3 | % | |||||||||||||||||||||||||
| Iowa | 46 | 1,067 | 1.2 | % | 12,398 | 1.1 | % | |||||||||||||||||||||||||
| Kansas | 41 | 2,208 | 2.5 | % | 10,155 | 0.9 | % | |||||||||||||||||||||||||
| Kentucky | 75 | 1,999 | 2.2 | % | 22,250 | 2.1 | % | |||||||||||||||||||||||||
| Louisiana | 97 | 2,785 | 3.1 | % | 29,131 | 2.7 | % | |||||||||||||||||||||||||
| Maine | 24 | 681 | 0.8 | % | 8,747 | 0.8 | % | |||||||||||||||||||||||||
| Maryland | 26 | 585 | 0.7 | % | 14,181 | 1.3 | % | |||||||||||||||||||||||||
| Massachusetts | 27 | 2,251 | 2.5 | % | 26,294 | 2.4 | % | |||||||||||||||||||||||||
| Michigan | 190 | 2,022 | 2.3 | % | 36,651 | 3.4 | % | |||||||||||||||||||||||||
| Minnesota | 53 | 1,162 | 1.3 | % | 14,356 | 1.3 | % | |||||||||||||||||||||||||
| Mississippi | 72 | 1,899 | 2.1 | % | 14,604 | 1.4 | % | |||||||||||||||||||||||||
| Missouri | 145 | 1,686 | 1.9 | % | 22,638 | 2.1 | % | |||||||||||||||||||||||||
| Montana | 9 | 115 | 0.1 | % | 2,024 | 0.2 | % | |||||||||||||||||||||||||
| Nebraska | 19 | 366 | 0.4 | % | 5,770 | 0.5 | % | |||||||||||||||||||||||||
| Nevada | 30 | 743 | 0.8 | % | 8,898 | 0.8 | % | |||||||||||||||||||||||||
| New Hampshire | 16 | 240 | 0.3 | % | 4,107 | 0.4 | % | |||||||||||||||||||||||||
| New Jersey | 29 | 1,601 | 1.8 | % | 30,057 | 2.8 | % | |||||||||||||||||||||||||
| New Mexico | 41 | 763 | 0.9 | % | 10,027 | 0.9 | % | |||||||||||||||||||||||||
| New York | 68 | 1,530 | 1.7 | % | 30,153 | 2.8 | % | |||||||||||||||||||||||||
| North Carolina | 146 | 3,260 | 3.7 | % | 35,692 | 3.3 | % | |||||||||||||||||||||||||
| North Dakota | 12 | 211 | 0.2 | % | 4,406 | 0.4 | % | |||||||||||||||||||||||||
| Ohio | 277 | 8,587 | 9.7 | % | 67,368 | 6.2 | % | |||||||||||||||||||||||||
| Oklahoma | 82 | 1,784 | 2.0 | % | 26,397 | 2.4 | % | |||||||||||||||||||||||||
| Oregon | 11 | 65 | 0.1 | % | 1,918 | 0.2 | % | |||||||||||||||||||||||||
| Pennsylvania | 100 | 3,772 | 4.2 | % | 38,654 | 3.6 | % | |||||||||||||||||||||||||
| Rhode Island | 4 | 141 | 0.2 | % | 1,957 | 0.2 | % | |||||||||||||||||||||||||
| South Carolina | 102 | 2,331 | 2.6 | % | 23,910 | 2.2 | % | |||||||||||||||||||||||||
| South Dakota | 10 | 169 | 0.2 | % | 2,072 | 0.2 | % | |||||||||||||||||||||||||
| Tennessee | 105 | 2,874 | 3.2 | % | 28,233 | 2.6 | % | |||||||||||||||||||||||||
| Texas | 551 | 10,468 | 11.8 | % | 133,471 | 12.4 | % | |||||||||||||||||||||||||
| Utah | 11 | 515 | 0.6 | % | 5,804 | 0.5 | % | |||||||||||||||||||||||||
| Vermont | 6 | 53 | 0.1 | % | 1,140 | 0.1 | % | |||||||||||||||||||||||||
| Virginia | 97 | 2,451 | 2.8 | % | 28,699 | 2.7 | % | |||||||||||||||||||||||||
| Washington | 26 | 607 | 0.7 | % | 10,475 | 1.0 | % | |||||||||||||||||||||||||
| West Virginia | 34 | 214 | 0.2 | % | 5,244 | 0.5 | % | |||||||||||||||||||||||||
| ||||||||
| Q2 2021 SUPPLEMENTAL INFORMATION | ||||||||
Diversification: Property Geographic (cont.) (unaudited, square feet and dollars in thousands) | ||
Location | Number of Properties | Rentable Square Feet | Square Feet as a % of Total Portfolio | Annualized Rental Income | Annualized Rental Income as a % of Total Portfolio | |||||||||||||||||||||||||||
| Wisconsin | 104 | 1,371 | 1.5 | % | 21,133 | 2.0 | % | |||||||||||||||||||||||||
| Wyoming | 8 | 69 | 0.1 | % | 1,375 | 0.1 | % | |||||||||||||||||||||||||
Territories | ||||||||||||||||||||||||||||||||
| Puerto Rico | 3 | 88 | 0.1 | % | 2,820 | 0.3 | % | |||||||||||||||||||||||||
Total | 3,885 | 88,864 | 100.0 | % | $ | 1,079,586 | 100.0 | % | ||||||||||||||||||||||||
| ||||||||
| Q2 2021 SUPPLEMENTAL INFORMATION | ||||||||
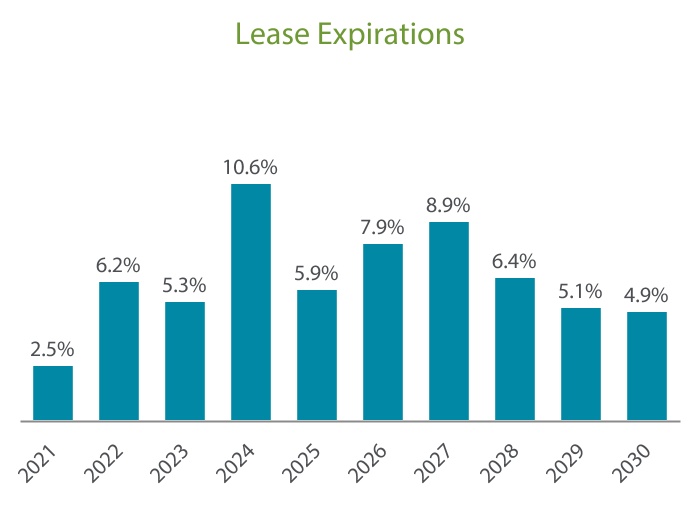
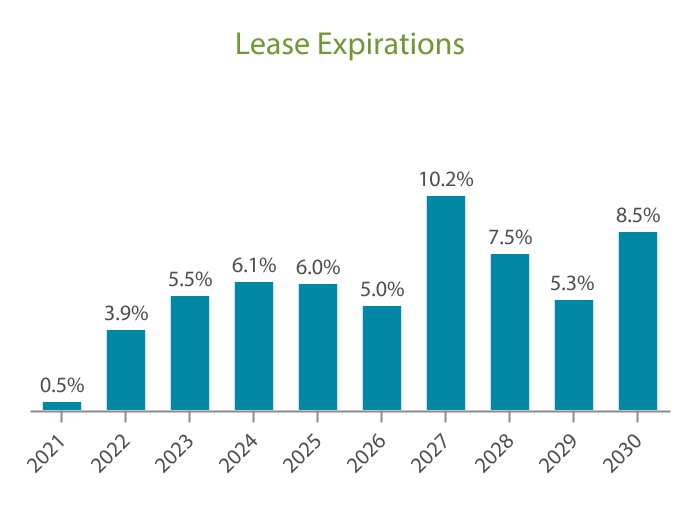
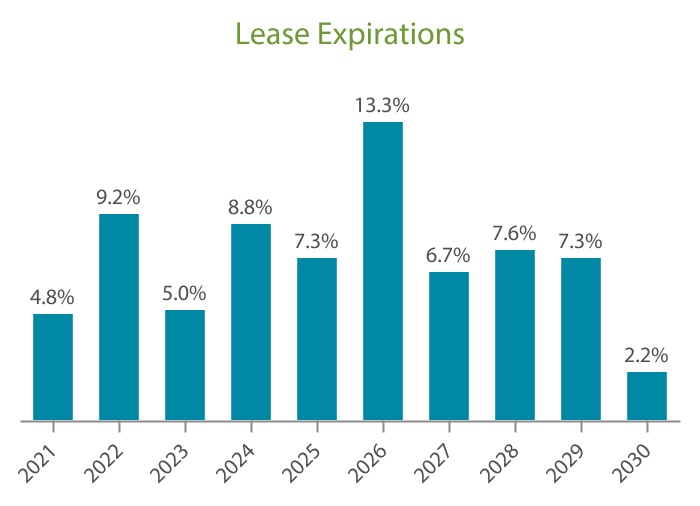
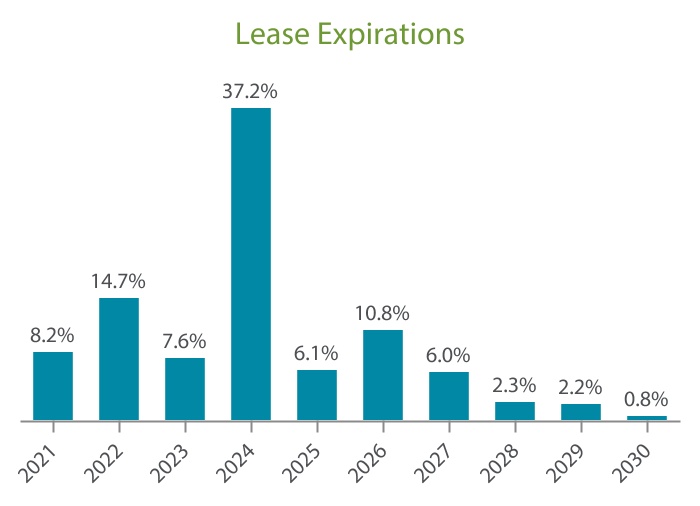
Lease Expirations (unaudited, square feet and dollars in thousands) | ||
| Year of Expiration | Number of Leases Expiring | Leased Square Feet | Leased Square Feet as a % of Total Portfolio | Annualized Rental Income Expiring | Annualized Rental Income Expiring as a % of Total Portfolio | |||||||||||||||||||||||||||
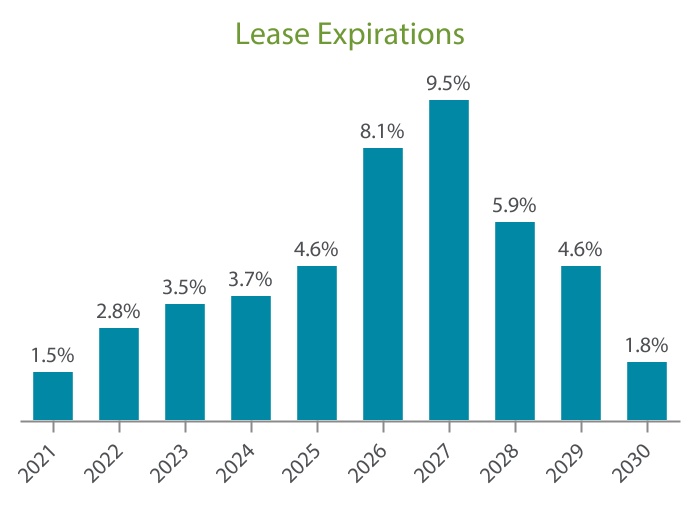
| 2021 | 45 | 3,756 | 4.2 | % | $ | 27,407 | 2.5 | % | ||||||||||||||||||||||||
| 2022 | 217 | 7,634 | 8.6 | % | 66,819 | 6.2 | % | |||||||||||||||||||||||||
| 2023 | 263 | 4,324 | 4.9 | % | 57,464 | 5.3 | % | |||||||||||||||||||||||||
| 2024 | 238 | 9,320 | 10.5 | % | 114,214 | 10.6 | % | |||||||||||||||||||||||||
| 2025 | 299 | 4,830 | 5.4 | % | 64,030 | 5.9 | % | |||||||||||||||||||||||||
| 2026 | 270 | 9,019 | 10.1 | % | 85,440 | 7.9 | % | |||||||||||||||||||||||||
| 2027 | 333 | 6,914 | 7.8 | % | 95,554 | 8.9 | % | |||||||||||||||||||||||||
| 2028 | 325 | 5,841 | 6.6 | % | 69,568 | 6.4 | % | |||||||||||||||||||||||||
| 2029 | 150 | 5,733 | 6.5 | % | 54,618 | 5.1 | % | |||||||||||||||||||||||||
| 2030 | 102 | 4,706 | 5.3 | % | 53,128 | 4.9 | % | |||||||||||||||||||||||||
| Thereafter | 761 | 24,224 | 27.2 | % | 391,344 | 36.3 | % | |||||||||||||||||||||||||
Total | 3,003 | 86,301 | 97.1 | % | $ | 1,079,586 | 100.0 | % | ||||||||||||||||||||||||
| ||||||||
| Q2 2021 SUPPLEMENTAL INFORMATION | ||||||||
Lease Expirations (cont.) (unaudited, square feet and dollars in thousands) | ||
| Year of Expiration | Number of Leases Expiring | Leased Square Feet | Square Feet as a % of Total Portfolio | Annualized Rental Income Expiring | Annualized Rental Income Expiring as a % of Total Portfolio | |||||||||||||||||||||||||||
| 2021 | ||||||||||||||||||||||||||||||||
| Retail | 13 | 123 | 0.1 | % | $ | 2,315 | 0.2 | % | ||||||||||||||||||||||||
| Restaurant | 24 | 149 | 0.2 | % | 3,255 | 0.3 | % | |||||||||||||||||||||||||
| Industrial | 1 | 2,717 | 3.0 | % | 9,024 | 0.8 | % | |||||||||||||||||||||||||
| Office | 6 | 767 | 0.9 | % | 12,776 | 1.2 | % | |||||||||||||||||||||||||
Other (1) | 1 | — | — | % | 37 | — | % | |||||||||||||||||||||||||
| Total 2021 | 45 | 3,756 | 4.2 | % | $ | 27,407 | 2.5 | % | ||||||||||||||||||||||||
| 2022 | ||||||||||||||||||||||||||||||||
| Retail | 127 | 1,245 | 1.4 | % | $ | 20,163 | 1.9 | % | ||||||||||||||||||||||||
| Restaurant | 54 | 218 | 0.2 | % | 6,237 | 0.6 | % | |||||||||||||||||||||||||
| Industrial | 22 | 4,859 | 5.5 | % | 17,402 | 1.6 | % | |||||||||||||||||||||||||
| Office | 13 | 1,312 | 1.5 | % | 22,944 | 2.1 | % | |||||||||||||||||||||||||
Other (1) | 1 | — | — | % | 73 | — | % | |||||||||||||||||||||||||
| Total 2022 | 217 | 7,634 | 8.6 | % | $ | 66,819 | 6.2 | % | ||||||||||||||||||||||||
| 2023 | ||||||||||||||||||||||||||||||||
| Retail | 161 | 2,157 | 2.4 | % | $ | 28,299 | 2.6 | % | ||||||||||||||||||||||||
| Restaurant | 73 | 296 | 0.4 | % | 7,716 | 0.7 | % | |||||||||||||||||||||||||
| Industrial | 17 | 1,234 | 1.4 | % | 9,490 | 0.9 | % | |||||||||||||||||||||||||
| Office | 8 | 637 | 0.7 | % | 11,756 | 1.1 | % | |||||||||||||||||||||||||
Other (1) | 4 | — | — | % | 203 | — | % | |||||||||||||||||||||||||
| Total 2023 | 263 | 4,324 | 4.9 | % | $ | 57,464 | 5.3 | % | ||||||||||||||||||||||||
| 2024 | ||||||||||||||||||||||||||||||||
| Retail | 130 | 1,992 | 2.2 | % | $ | 31,458 | 2.9 | % | ||||||||||||||||||||||||
| Restaurant | 71 | 307 | 0.4 | % | 8,014 | 0.7 | % | |||||||||||||||||||||||||
| Industrial | 14 | 3,558 | 4.0 | % | 16,654 | 1.6 | % | |||||||||||||||||||||||||
| Office | 21 | 3,463 | 3.9 | % | 57,894 | 5.4 | % | |||||||||||||||||||||||||
Other (1) | 2 | — | — | % | 194 | — | % | |||||||||||||||||||||||||
| Total 2024 | 238 | 9,320 | 10.5 | % | $ | 114,214 | 10.6 | % | ||||||||||||||||||||||||
| ||||||||
| Q2 2021 SUPPLEMENTAL INFORMATION | ||||||||
Lease Expirations (cont.) (unaudited, square feet and dollars in thousands) | ||
| Year of Expiration | Number of Leases Expiring | Leased Square Feet | Square Feet as a % of Total Portfolio | Annualized Rental Income Expiring | Annualized Rental Income Expiring as a % of Total Portfolio | |||||||||||||||||||||||||||
| 2025 | ||||||||||||||||||||||||||||||||
| Retail | 186 | 2,190 | 2.5 | % | $ | 30,688 | 2.8 | % | ||||||||||||||||||||||||
| Restaurant | 96 | 350 | 0.4 | % | 10,158 | 0.9 | % | |||||||||||||||||||||||||
| Industrial | 11 | 1,707 | 1.9 | % | 13,760 | 1.3 | % | |||||||||||||||||||||||||
| Office | 6 | 583 | 0.6 | % | 9,424 | 0.9 | % | |||||||||||||||||||||||||
| Total 2025 | 299 | 4,830 | 5.4 | % | $ | 64,030 | 5.9 | % | ||||||||||||||||||||||||
| 2026 | ||||||||||||||||||||||||||||||||
| Retail | 118 | 2,014 | 2.3 | % | $ | 25,764 | 2.4 | % | ||||||||||||||||||||||||
| Restaurant | 123 | 496 | 0.5 | % | 17,700 | 1.6 | % | |||||||||||||||||||||||||
| Industrial | 17 | 5,631 | 6.3 | % | 25,066 | 2.3 | % | |||||||||||||||||||||||||
| Office | 11 | 878 | 1.0 | % | 16,764 | 1.6 | % | |||||||||||||||||||||||||
Other (1) | 1 | — | — | % | 146 | — | % | |||||||||||||||||||||||||
| Total 2026 | 270 | 9,019 | 10.1 | % | $ | 85,440 | 7.9 | % | ||||||||||||||||||||||||
| 2027 | ||||||||||||||||||||||||||||||||
| Retail | 249 | 3,990 | 4.5 | % | $ | 52,653 | 4.9 | % | ||||||||||||||||||||||||
| Restaurant | 69 | 524 | 0.6 | % | 20,889 | 1.9 | % | |||||||||||||||||||||||||
| Industrial | 9 | 1,771 | 2.0 | % | 12,740 | 1.2 | % | |||||||||||||||||||||||||
| Office | 6 | 629 | 0.7 | % | 9,272 | 0.9 | % | |||||||||||||||||||||||||
| Total 2027 | 333 | 6,914 | 7.8 | % | $ | 95,554 | 8.9 | % | ||||||||||||||||||||||||
| 2028 | ||||||||||||||||||||||||||||||||
| Retail | 191 | 3,000 | 3.4 | % | $ | 38,408 | 3.6 | % | ||||||||||||||||||||||||
| Restaurant | 109 | 481 | 0.6 | % | 12,958 | 1.2 | % | |||||||||||||||||||||||||
| Industrial | 19 | 2,166 | 2.4 | % | 14,363 | 1.3 | % | |||||||||||||||||||||||||
| Office | 5 | 194 | 0.2 | % | 3,586 | 0.3 | % | |||||||||||||||||||||||||
Other (1) | 1 | — | — | % | 253 | — | % | |||||||||||||||||||||||||
| Total 2028 | 325 | 5,841 | 6.6 | % | $ | 69,568 | 6.4 | % | ||||||||||||||||||||||||
| ||||||||
| Q2 2021 SUPPLEMENTAL INFORMATION | ||||||||
Lease Expirations (cont.) (unaudited, square feet and dollars in thousands) | ||
| Year of Expiration | Number of Leases Expiring | Leased Square Feet | Square Feet as a % of Total Portfolio | Annualized Rental Income Expiring | Annualized Rental Income Expiring as a % of Total Portfolio | |||||||||||||||||||||||||||
| 2029 | ||||||||||||||||||||||||||||||||
| Retail | 90 | 2,177 | 2.5 | % | $ | 27,211 | 2.5 | % | ||||||||||||||||||||||||
| Restaurant | 52 | 321 | 0.4 | % | 10,179 | 1.0 | % | |||||||||||||||||||||||||
| Industrial | 6 | 3,024 | 3.4 | % | 13,810 | 1.3 | % | |||||||||||||||||||||||||
| Office | 2 | 211 | 0.2 | % | 3,418 | 0.3 | % | |||||||||||||||||||||||||
| Total 2029 | 150 | 5,733 | 6.5 | % | $ | 54,618 | 5.1 | % | ||||||||||||||||||||||||
| 2030 | ||||||||||||||||||||||||||||||||
| Retail | 73 | 3,362 | 3.8 | % | $ | 43,751 | 4.0 | % | ||||||||||||||||||||||||
| Restaurant | 23 | 183 | 0.2 | % | 3,919 | 0.4 | % | |||||||||||||||||||||||||
| Industrial | 6 | 1,128 | 1.3 | % | 4,246 | 0.4 | % | |||||||||||||||||||||||||
| Office | — | 33 | — | % | 1,212 | 0.1 | % | |||||||||||||||||||||||||
| Total 2030 | 102 | 4,706 | 5.3 | % | $ | 53,128 | 4.9 | % | ||||||||||||||||||||||||
| Thereafter | ||||||||||||||||||||||||||||||||
| Retail | 386 | 11,833 | 13.3 | % | $ | 213,431 | 19.8 | % | ||||||||||||||||||||||||
| Restaurant | 350 | 3,157 | 3.6 | % | 118,412 | 11.0 | % | |||||||||||||||||||||||||
| Industrial | 19 | 8,752 | 9.8 | % | 52,258 | 4.8 | % | |||||||||||||||||||||||||
| Office | 2 | 482 | 0.5 | % | 6,551 | 0.6 | % | |||||||||||||||||||||||||
Other (1) | 4 | — | — | % | 692 | 0.1 | % | |||||||||||||||||||||||||
| Total Thereafter | 761 | 24,224 | 27.2 | % | $ | 391,344 | 36.3 | % | ||||||||||||||||||||||||
| Total Remaining Lease Expirations | 3,003 | 86,301 | 97.1 | % | $ | 1,079,586 | 100.0 | % | ||||||||||||||||||||||||
| ||||||||
| Q2 2021 SUPPLEMENTAL INFORMATION | ||||||||
Lease Summary (unaudited) | ||
| Number of Leases | Leased Square Feet | Leased Square Feet as a % of Total Portfolio | Annualized Rental Income | Annualized Rental Income as a % of Total Portfolio | ||||||||||||||||||||||||||||
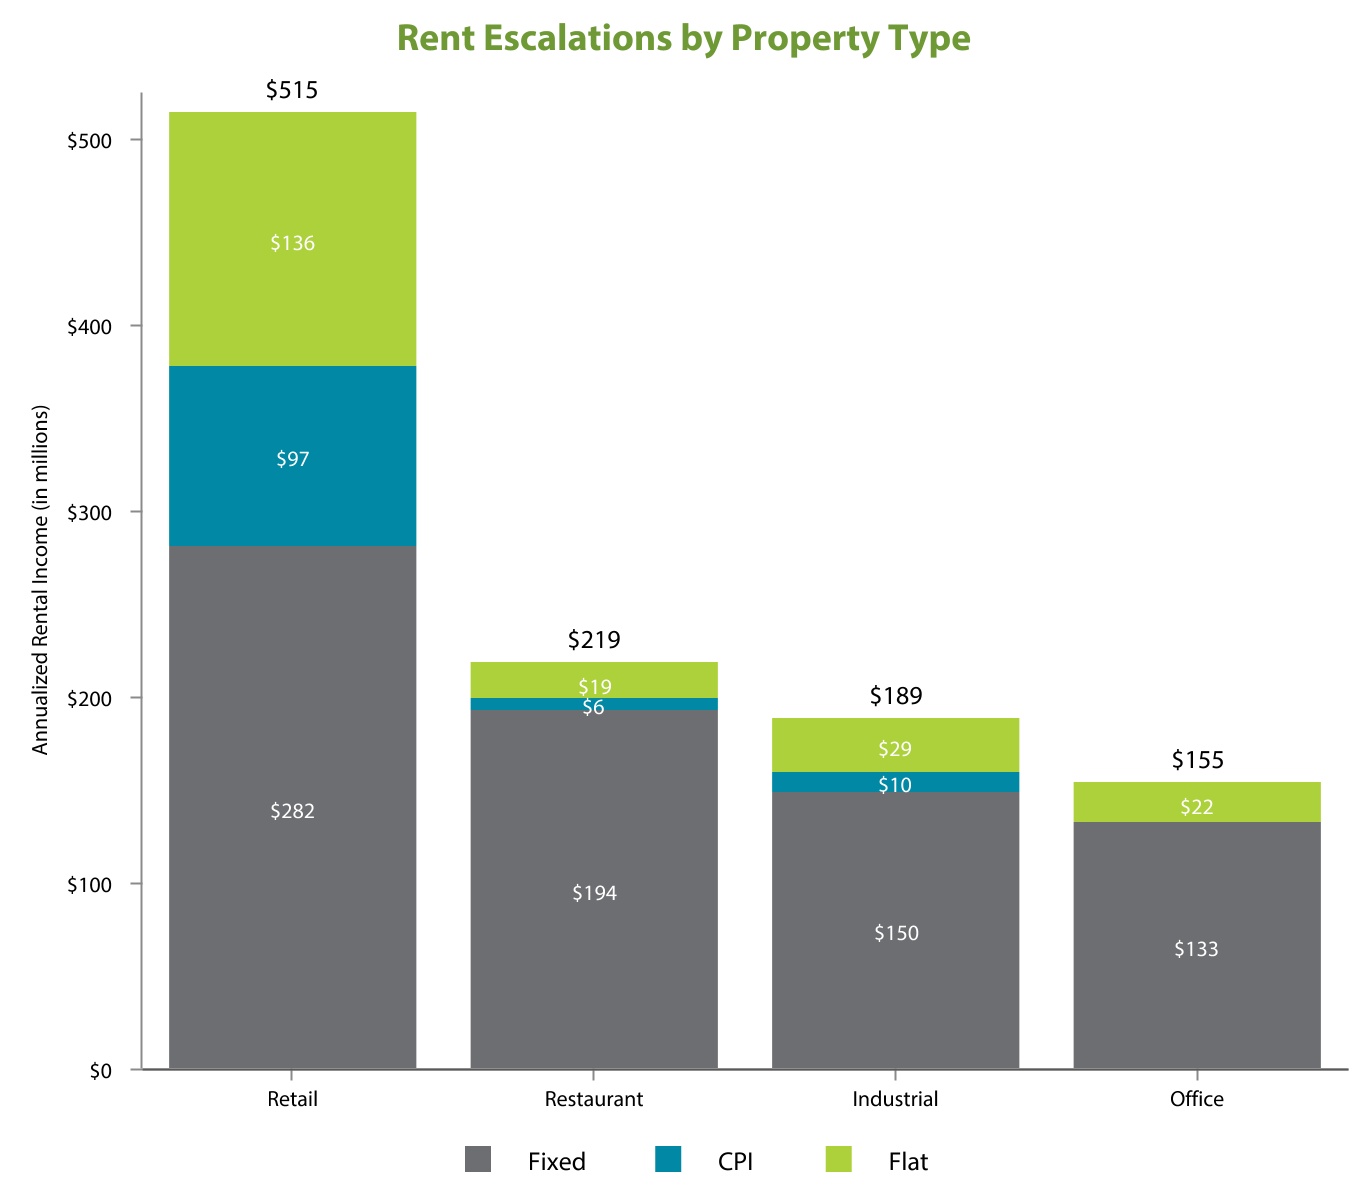
Fixed dollar or percent increase | 1,937 | 59,874 | 67.3 | % | $ | 759,993 | 70.4 | % | ||||||||||||||||||||||||
| CPI | 166 | 7,706 | 8.7 | % | 113,222 | 10.5 | % | |||||||||||||||||||||||||
| Flat | 900 | 18,721 | 21.1 | % | 206,371 | 19.1 | % | |||||||||||||||||||||||||
| Total | 3,003 | 86,301 | 97.1 | % | $ | 1,079,586 | 100.0 | % | ||||||||||||||||||||||||
| ||||||||
| Q2 2021 SUPPLEMENTAL INFORMATION | ||||||||
Lease Summary (cont.) (unaudited) | ||
| Number of Leases | Leased Square Feet | Leased Square Feet as a % of Total Portfolio | Annualized Rental Income | Annualized Rental Income as a % of Total Portfolio | ||||||||||||||||||||||||||||
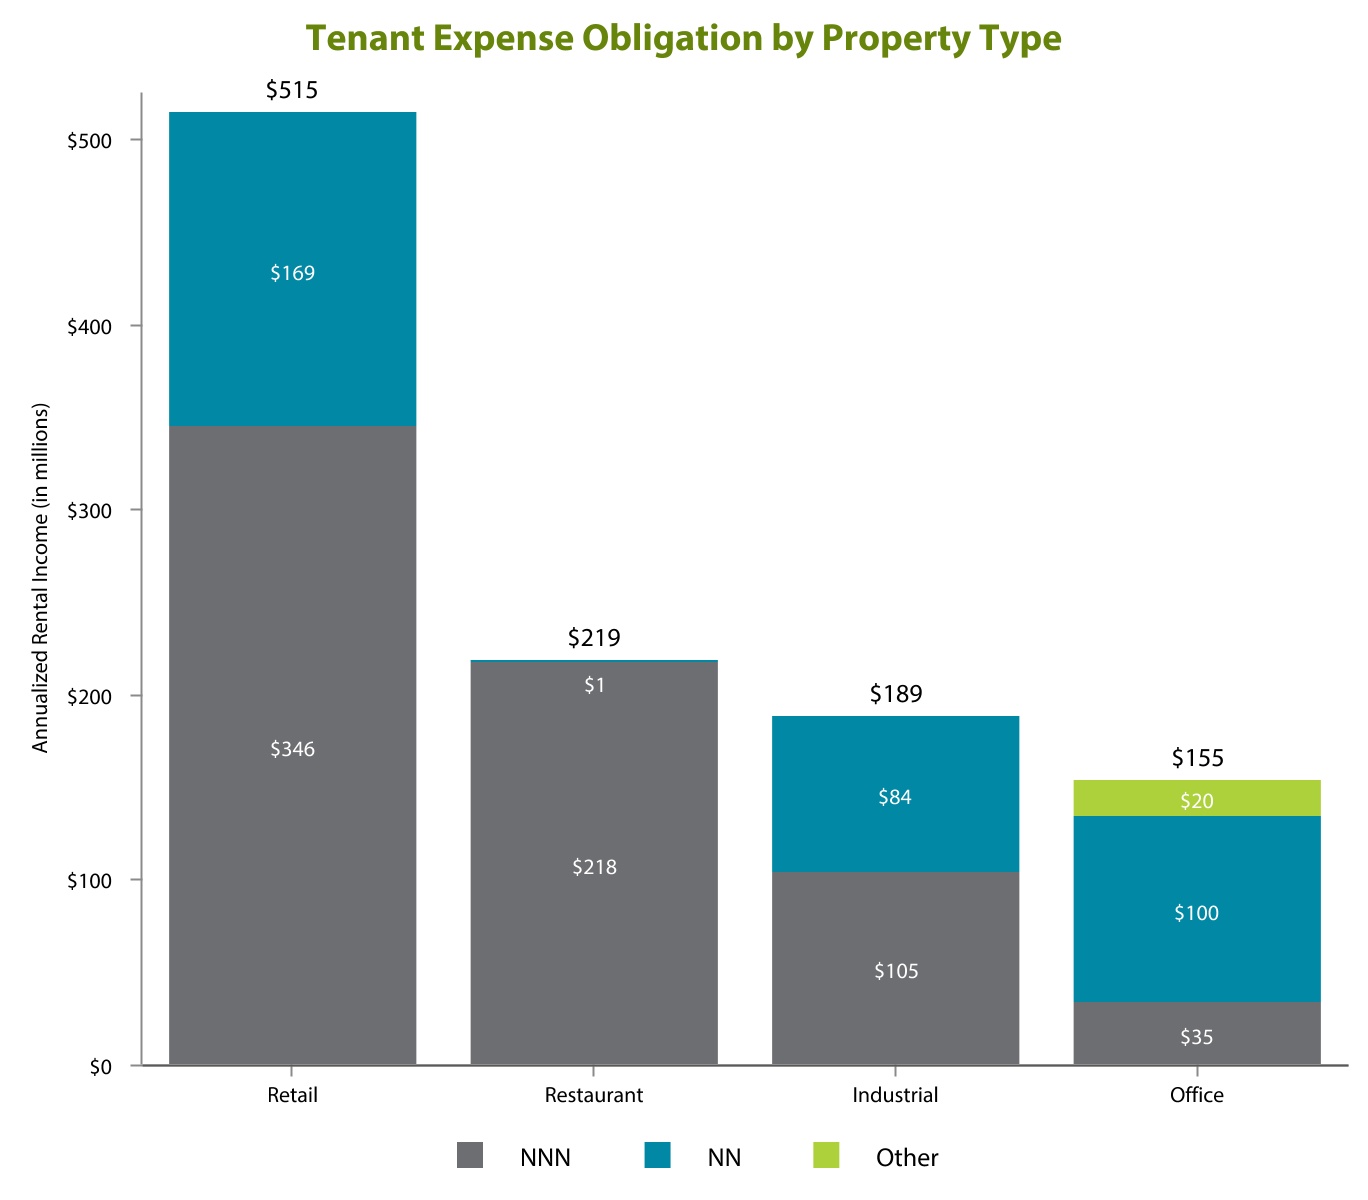
| NNN | 2,135 | 53,530 | 60.2 | % | $ | 704,515 | 65.3 | % | ||||||||||||||||||||||||
| NN | 849 | 31,800 | 35.8 | % | 354,511 | 32.8 | % | |||||||||||||||||||||||||
Other (1) | 19 | 971 | 1.1 | % | 20,560 | 1.9 | % | |||||||||||||||||||||||||
| Total | 3,003 | 86,301 | 97.1 | % | $ | 1,079,586 | 100.0 | % | ||||||||||||||||||||||||
| ||||||||
| Q2 2021 SUPPLEMENTAL INFORMATION | ||||||||
Property Type Diversification and Rent Coverage (unaudited, square feet and dollars in thousands) | ||
| Property Type | Number of Properties (1) | Rentable Square Feet | Square Feet as a % of Total Portfolio | Annualized Rental Income | Annualized Rental Income as a % of Total Portfolio | |||||||||||||||||||||||||||
Retail (1) | 2,143 | 34,803 | 39.2 | % | $ | 514,141 | 47.6 | % | ||||||||||||||||||||||||
Restaurant | 1,515 | 6,907 | 7.8 | % | 219,437 | 20.3 | % | |||||||||||||||||||||||||
Industrial | 158 | 37,396 | 42.1 | % | 188,813 | 17.5 | % | |||||||||||||||||||||||||
Office | 59 | 9,758 | 10.9 | % | 155,597 | 14.4 | % | |||||||||||||||||||||||||
Other (2) | 10 | — | — | % | 1,598 | 0.2 | % | |||||||||||||||||||||||||
Total | 3,885 | 88,864 | 100.0 | % | $ | 1,079,586 | 100.0 | % | ||||||||||||||||||||||||
| Property Type | Number of Properties (3) | 2021 Rent Coverage | ||||||||||||
| Retail and Restaurant | 1,438 | 2.69x | ||||||||||||
| ||||||||
| Q2 2021 SUPPLEMENTAL INFORMATION | ||||||||
Diversification by Property Type: Retail (unaudited, percentages based on Annualized Rental Income of the retail properties) | ||
 ____________________________________________________
 ______________________________________________________
 _________________________________________________
 _________________________________________________
Statistics (square feet in thousands) | |||||||||||
| Operating Properties | 2,143 | ||||||||||
| Rentable Square Feet | 34,803 | ||||||||||
| Economic Occupancy Rate | 97.9 | % | |||||||||
| Weighted Average Remaining Lease Term | 9.1 | ||||||||||
| Investment-Grade Tenants | 47.6 | % | |||||||||
| Flat leases | 26.4 | % | |||||||||
| NNN leases | 67.2 | % | |||||||||
| ||||||||
| Q2 2021 SUPPLEMENTAL INFORMATION | ||||||||
Diversification by Property Type: Restaurants (unaudited, percentages based on Annualized Rental Income of the retail properties) | ||
 ______________________________________________________
 _________________________________________________
Statistics (square feet in thousands) | |||||||||||
| Operating Properties | 1,515 | ||||||||||
| Rentable Square Feet | 6,907 | ||||||||||
| Economic Occupancy Rate | 93.8 | % | |||||||||
| Weighted Average Remaining Lease Term | 11.5 | ||||||||||
| Investment-Grade Tenants | 3.5 | % | |||||||||
| Flat leases | 8.8 | % | |||||||||
| NNN leases | 99.3 | % | |||||||||
| ||||||||
| Q2 2021 SUPPLEMENTAL INFORMATION | ||||||||
Diversification by Property Type: Industrial (unaudited, percentages based on Annualized Rental Income of the retail properties) | ||
 ____________________________________________________
 ______________________________________________________
 _________________________________________________
 _________________________________________________
Statistics (square feet in thousands) | |||||||||||
| Operating Properties | 158 | ||||||||||
| Rentable Square Feet | 37,396 | ||||||||||
| Economic Occupancy Rate | 97.7 | % | |||||||||
| Weighted Average Remaining Lease Term | 7.2 | ||||||||||
| Investment-Grade Tenants | 36.9 | % | |||||||||
| Flat leases | 15.0 | % | |||||||||
| NNN leases | 55.7 | % | |||||||||
| ||||||||
| Q2 2021 SUPPLEMENTAL INFORMATION | ||||||||
Diversification by Property Type: Office (unaudited, percentages based on Annualized Rental Income of the retail properties) | ||
 ____________________________________________________
 ______________________________________________________
 _________________________________________________
 _________________________________________________
Statistics (square feet in thousands) | |||||||||||
| Operating Properties | 59 | ||||||||||
| Rentable Square Feet | 9,758 | ||||||||||
| Economic Occupancy Rate | 94.2 | % | |||||||||
| Weighted Average Remaining Lease Term | 3.6 | ||||||||||
| Investment-Grade Tenants | 54.9 | % | |||||||||
| Flat leases | 14.4 | % | |||||||||
| NNN leases | 22.6 | % | |||||||||
| ||||||||
| Q2 2021 SUPPLEMENTAL INFORMATION | ||||||||
Unconsolidated Joint Venture Investment Summary (unaudited, square feet and dollars in thousands) | ||
| Joint Venture | Legal Ownership Percentage (1) | Property Type | Number of Properties | Pro Rata Share of Gross Real Estate Investments | Pro Rata Share of Rentable Square Feet | Pro Rata Share of Annualized Rental Income | Pro Rata Share of Adjusted Principal Outstanding | |||||||||||||||||||||||||||||||||||||
| Industrial partnership | 20% | Industrial | 7 | $ | 131,787 | 1,409 | $ | 8,154 | $ | 86,006 | ||||||||||||||||||||||||||||||||||
| Office partnership | 20% | Office | 5 | 39,195 | 165 | 3,551 | 23,672 | |||||||||||||||||||||||||||||||||||||
| Total | $ | 170,982 | 1,574 | $ | 11,705 | $ | 109,678 | |||||||||||||||||||||||||||||||||||||
| ||||||||
| Q2 2021 SUPPLEMENTAL INFORMATION | ||||||||
Definitions (unaudited, in thousands, except share and per share data) | ||
| Three Months Ended June 30, | ||||||||||||||
| 2021 | 2020 | |||||||||||||
| Rental revenue - as reported | $ | 290,567 | $ | 278,576 | ||||||||||
| Adjustments: | ||||||||||||||
| Costs reimbursed related to CAM, property operating expenses and ground leases | (15,523) | (22,681) | ||||||||||||
| Straight-line rent | (4,613) | (3,404) | ||||||||||||
| Amortization of above-market lease assets and deferred lease incentives, net of amortization of below-market lease liabilities | 1,830 | 788 | ||||||||||||
| Net direct financing lease adjustments | 374 | 372 | ||||||||||||
| Other non-contract rental revenue | (450) | (1,730) | ||||||||||||
Proportionate share of amounts for Unconsolidated Joint Ventures | 2,631 | 2,528 | ||||||||||||
| Contract Rental Revenue | $ | 274,816 | $ | 254,449 | ||||||||||
| ||||||||
| Q2 2021 SUPPLEMENTAL INFORMATION | ||||||||
Definitions (cont.) (unaudited, in thousands, except share and per share data) | ||
| ||||||||
| Q2 2021 SUPPLEMENTAL INFORMATION | ||||||||
Definitions (cont.) (unaudited, in thousands, except share and per share data) | ||
| ||||||||
| Q2 2021 SUPPLEMENTAL INFORMATION | ||||||||
Definitions (cont.) (unaudited, in thousands, except share and per share data) | ||
| June 30, 2021 | March 31, 2021 | December 31, 2020 | September 30, 2020 | June 30, 2020 | ||||||||||||||||||||||||||||
Total real estate investments, at cost - as reported | $ | 14,546,039 | $ | 14,523,961 | $ | 14,603,626 | $ | 14,610,097 | $ | 14,714,616 | ||||||||||||||||||||||
Adjustments: | ||||||||||||||||||||||||||||||||
Investment in Cole REITs | 7,929 | 7,951 | 7,255 | 6,943 | 6,867 | |||||||||||||||||||||||||||
Gross assets held for sale | 47,666 | 7,145 | 91,341 | 2,379 | 54,046 | |||||||||||||||||||||||||||
Investment in direct financing leases, net | 5,806 | 6,181 | 6,547 | 8,198 | 8,579 | |||||||||||||||||||||||||||
Mortgage notes receivable, net | — | — | — | 15,727 | 9,959 | |||||||||||||||||||||||||||
| Gross intangible lease liabilities | (227,183) | (225,657) | (227,442) | (227,165) | (236,324) | |||||||||||||||||||||||||||
Proportionate share of amounts for Unconsolidated Joint Ventures | 170,982 | 165,646 | 165,643 | 205,678 | 146,886 | |||||||||||||||||||||||||||
Gross Real Estate Investments | $ | 14,551,239 | $ | 14,485,227 | $ | 14,646,970 | $ | 14,621,857 | $ | 14,704,629 | ||||||||||||||||||||||
| Three Months Ended | ||||||||||||||||||||||||||||||||
| June 30, 2021 | March 31, 2021 | December 31, 2020 | September 30, 2020 | June 30, 2020 | ||||||||||||||||||||||||||||
Interest expense - as reported | $ | 59,291 | $ | 60,736 | $ | 68,416 | $ | 66,935 | $ | 65,613 | ||||||||||||||||||||||
Adjustments: | ||||||||||||||||||||||||||||||||
Amortization of deferred financing costs and other non-cash charges | (2,508) | (2,412) | (6,189) | (3,212) | (2,995) | |||||||||||||||||||||||||||
Amortization of net premiums | (709) | (248) | 120 | 299 | 459 | |||||||||||||||||||||||||||
Proportionate share of amounts for Unconsolidated Joint Ventures | 792 | 784 | 806 | 691 | 559 | |||||||||||||||||||||||||||
Interest Expense, excluding non-cash amortization | $ | 56,866 | $ | 58,860 | $ | 63,153 | $ | 64,713 | $ | 63,636 | ||||||||||||||||||||||
| ||||||||
| Q2 2021 SUPPLEMENTAL INFORMATION | ||||||||
Definitions (cont.) (unaudited, in thousands, except share and per share data) | ||
| June 30, 2021 | March 31, 2021 | December 31, 2020 | September 30, 2020 | June 30, 2020 | ||||||||||||||||||||||||||||
| Mortgage notes payable, net | $ | 1,002,496 | $ | 1,035,328 | $ | 1,328,835 | $ | 1,330,174 | $ | 1,393,652 | ||||||||||||||||||||||
| Corporate bonds, net | 4,588,286 | 4,586,252 | 4,584,230 | 3,406,389 | 3,404,935 | |||||||||||||||||||||||||||
| Convertible debt, net | — | — | — | 252,077 | 270,152 | |||||||||||||||||||||||||||
| Credit facility, net | — | — | — | 896,630 | 896,314 | |||||||||||||||||||||||||||
| Total debt - as reported | 5,590,782 | 5,621,580 | 5,913,065 | 5,885,270 | 5,965,053 | |||||||||||||||||||||||||||
| Deferred financing costs, net | 40,693 | 42,503 | 44,573 | 39,204 | 41,152 | |||||||||||||||||||||||||||
| Net discounts | 25,634 | 26,305 | 25,557 | 12,343 | 11,860 | |||||||||||||||||||||||||||
| Principal Outstanding | 5,657,109 | 5,690,388 | 5,983,195 | 5,936,817 | 6,018,065 | |||||||||||||||||||||||||||
Proportionate share of amounts for Unconsolidated Joint Ventures | 109,678 | 106,516 | 106,516 | 106,516 | 68,360 | |||||||||||||||||||||||||||
| Adjusted Principal Outstanding | $ | 5,766,787 | $ | 5,796,904 | $ | 6,089,711 | $ | 6,043,333 | $ | 6,086,425 | ||||||||||||||||||||||
| Cash and cash equivalents | (275,496) | (318,561) | (523,539) | (207,321) | (278,883) | |||||||||||||||||||||||||||
Pro rata share of Unconsolidated Joint Ventures' cash and cash equivalents | (621) | (1,587) | (1,619) | (3,776) | (3,433) | |||||||||||||||||||||||||||
| Net Debt | $ | 5,490,670 | $ | 5,476,756 | $ | 5,564,553 | $ | 5,832,236 | $ | 5,804,109 | ||||||||||||||||||||||
| ||||||||
| Q2 2021 SUPPLEMENTAL INFORMATION | ||||||||
Definitions (cont.) (unaudited, in thousands, except share and per share data) | ||
| Three Months Ended | ||||||||||||||||||||||||||||||||
| June 30, 2021 | March 31, 2021 | December 31, 2020 | September 30, 2020 | June 30, 2020 | ||||||||||||||||||||||||||||
| Total revenues | $ | 291,267 | $ | 290,809 | $ | 287,909 | $ | 295,278 | $ | 278,997 | ||||||||||||||||||||||
| Less total operating expenses | (173,626) | (186,477) | (194,760) | (171,983) | (167,096) | |||||||||||||||||||||||||||
| Partnership fee revenue | (700) | (500) | (478) | (1,586) | (421) | |||||||||||||||||||||||||||
| Acquisition-related expenses | 1,428 | 1,354 | 1,048 | 1,050 | 1,169 | |||||||||||||||||||||||||||
| Merger, litigation and non-routine costs, net | 6,605 | 68 | 10,925 | 105 | (118) | |||||||||||||||||||||||||||
| General and administrative | 16,451 | 14,526 | 15,399 | 14,774 | 16,120 | |||||||||||||||||||||||||||
| Depreciation and amortization | 105,839 | 108,075 | 107,205 | 108,257 | 108,733 | |||||||||||||||||||||||||||
| Impairment of real estate | 14,129 | 31,849 | 28,204 | 16,397 | 12,094 | |||||||||||||||||||||||||||
| NOI | 261,393 | 259,704 | 255,452 | 262,292 | 249,478 | |||||||||||||||||||||||||||
Straight-line rent | (4,613) | (4,219) | (7,108) | (12,595) | (3,404) | |||||||||||||||||||||||||||
Amortization of above-market lease assets and deferred lease incentives, net of amortization of below-market lease liabilities | 1,830 | 1,547 | 1,428 | 393 | 788 | |||||||||||||||||||||||||||
Net direct financing lease adjustments | 374 | 366 | 379 | 381 | 372 | |||||||||||||||||||||||||||
| Other non-cash adjustments | (13) | (18) | — | — | — | |||||||||||||||||||||||||||
Proportionate share of amounts for Unconsolidated Joint Ventures | 2,525 | 2,507 | 2,799 | 2,876 | 2,475 | |||||||||||||||||||||||||||
| Cash NOI | $ | 261,496 | $ | 259,887 | $ | 252,950 | $ | 253,347 | $ | 249,709 | ||||||||||||||||||||||
| ||||||||
| Q2 2021 SUPPLEMENTAL INFORMATION | ||||||||
Definitions (cont.) (unaudited, in thousands, except share and per share data) | ||