Exhibit (C)(1)
1 Project Cheetah – Presentation to the Special Committee September 12 th , 2021
2 Fort Capital • This analysis presented by Fort Capital Partners (“ us ”, “ we ” or “ Fort Capital ”) was prepared solely to provide the special committee of the Board (the “ Special Committee ”) of Corvus Gold Inc. (“ Corvus ” or the “ Company ”) with a formal valuation (the “ Valuation ”) as defined by Multilateral Instrument 61 - 101 – Protection of Minority Shareholders in Special Transactions (“ MI 61 - 101 ”) with respect to the fair market value the Company’s common shares (the “ Shares ”) as well as an opinion (the “ Fairness Opinion ” and together with the Valuation, the “ Opinions ”) as to the fairness, from a financial point of view, of the consideration to be received by shareholders of the Company in the pr oposed Arrangement Agreement with AngloGold Ashanti Limited (“ AngloGold ” or the “ Acquiror ”). • Fort Capital has, subject to the exercise of its professional judgment, relied, without independent verification, upon the co mpl eteness, accuracy and fair presentation of all of the financial and other information, data, advice, opinions and representations obtained by i t f rom public sources, or that was provided to us, by the Company, and its associates and affiliates and advisors (collectively, the “ Information ”), and we have assumed that this Information did not omit to state any material fact or any fact necessary to be stated to make that Informa tio n not misleading. The Opinions are conditional upon the completeness, accuracy and fair presentation of such Information. With respect to the C omp any’s financial projections provided to Fort Capital by management of the Company and used in the analysis supporting the Opinions, we have assumed that they have been reasonably prepared on bases reflecting the best currently available estimates and judgments of m ana gement of the Company as to the matters covered thereby. • The Valuation has been prepared in accordance with the Canadian Institute of Chartered Business Valuators (“ CICBV ”) Standard 110 for Valuation Opinions. Additionally, Fort Capital has conducted other such analyses as it considered necessary in the circumstan ces to prepare and deliver the Fairness Opinion. In addition, the Opinions have been prepared in accordance with the Disclosure Standards fo r F ormal Valuations and Fairness Opinions of the Investment Industry Regulatory Organization of Canada (“ IIROC ”), though Fort Capital is not a member of IIROC and neither CICBV or IIROC have been involved in the preparation or review of the Opinions. • The materials are intended for the benefit and the use of the Special Committee of the Company in connection with the transac tio n discussed herein and may not be reproduced, disseminated, quoted or referred to, in whole or in part, or used for any other p urp ose without the consent of Fort Capital. All monetary amounts in these discussion notes are in Canadian dollars unless otherwise indicated. All share prices as of Sep tem ber 10, 2021 unless otherwise indicated Disclaimer Valuation and Fairness Opinion Limitations
Fort Capital 3 Table of Contents 1. Mandate and Summary 2. Overview of Corvus 3. Valuation 4. Summary and Conclusion Appendices A. Completed Scope of Review B. Detailed Financial Model C. Trading Comparables D. Precedent Transactions E. Consensus Commodity Prices
1. Mandate and Summary
5 Fort Capital • We understand that AngloGold provided Corvus with an unsolicited non - binding letter of intent where AngloGold proposed to acquir e all of the issued and outstanding common shares of Corvus not already owned by AngloGold (the “ Corvus Shares ”), including shares issuable upon the exercise of any dilutive securities (the “ Proposed Transaction ”) ‒ AngloGold initially submitted an unsolicited, non - binding offer on July 13 th which set out proposed consideration of $4.00 per Corvus Share, payable fully in cash ‒ AngloGold has since been in discussions with the Company and the two parties intend to enter into an arrangement agreement to be dated on or about September 12 (the “ Arrangement Agreement ”) that outlines a revised consideration (the “ Consideration ”) of $4.10 per Corvus Share, payable in cash • The Special Committee has determined that the Proposed Transaction is subject to MI 61 - 101 , which will require the approval of existing Corvus shareholders other than AngloGold (the “ Public Shareholders ”), the preparation of a Valuation of the Corvus Shares, and the inclusion of the Valuation or a summary thereof in the management information circular to be sent by the Company in connection with a special mee ting of shareholders to consider the Proposed Transaction • Fort Capital has also been engaged by the Special Committee of Corvus to provide it with advice in evaluating the Proposed Tr ans action, including the preparation and delivery of the Valuation and providing an opinion as to the fairness, from a financial point o f v iew, of the Consideration to be received by the Public Shareholders under the Proposed Transaction ‒ This presentation is not intended to be made public and is strictly for the internal use of the Company ‒ As part of the Valuation, Fort Capital will also provide a Fairness Opinion letter for inclusion in the information circular to be prepared and disseminated to shareholders of Corvus • Fort Capital confirms that it meets the requirements of an independent valuator as the term is described in MI 61 - 101 ‒ Neither Fort Capital, nor any of our affiliates, is an insider, associate, or affiliate (as those terms are defined in the Securities Act (Ontario)) of Corvus, AngloGold, or any of their respective associates or affiliates (collectively the “ Interested Parties ”) ‒ Fort Capital is not acting as an advisor to Corvus or any Interested Party in connection with any matter, other than acting a s a dvisor to the Special Committee ‒ There are no fees payable to Fort Capital under our engagement that are contingent upon the conclusions reached Fort Capital in the Valuation or the Fairness Opinion, or upon the successful completion of the Proposed Transaction Fort Capital Mandate Fort Capital has been engaged by the Special Committee to provide a Valuation and Fairness Opinion in connection with Project Cheetah
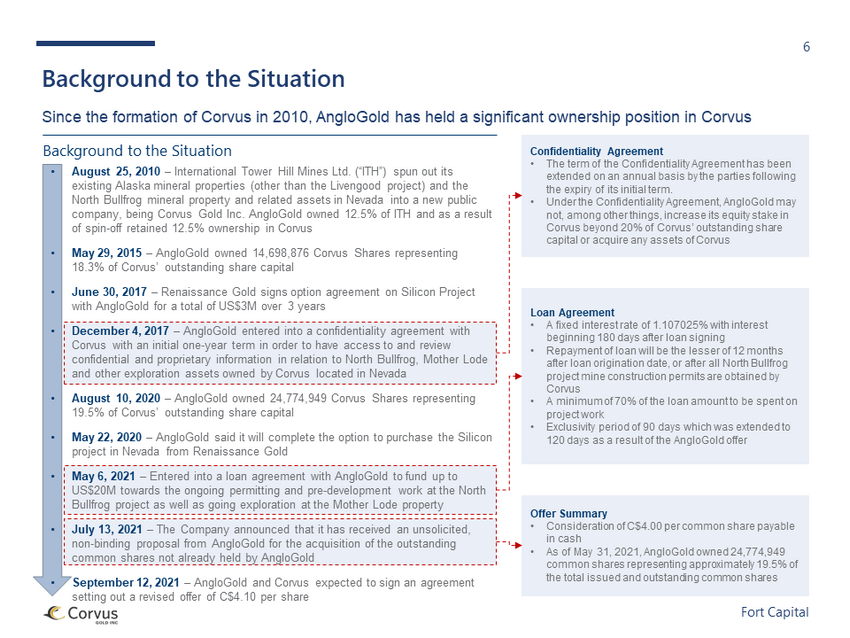
6 Fort Capital Background to the Situation Since the formation of Corvus in 2010, AngloGold has held a significant ownership position in Corvus Loan Agreement • A fixed interest rate of 1.107025% with interest beginning 180 days after loan signing • Repayment of loan will be the lesser of 12 months after loan origination date, or after all North Bullfrog project mine construction permits are obtained by Corvus • A minimum of 70% of the loan amount to be spent on project work • Exclusivity period of 90 days which was extended to 120 days as a result of the AngloGold offer Offer Summary • Consideration of C$4.00 per common share payable in cash • As of May 31, 2021, AngloGold owned 24,774,949 common shares representing approximately 19.5% of the total issued and outstanding common shares Background to the Situation Confidentiality Agreement • The term of the Confidentiality Agreement has been extended on an annual basis by the parties following the expiry of its initial term. • Under the Confidentiality Agreement, AngloGold may not, among other things, increase its equity stake in Corvus beyond 20% of Corvus’ outstanding share capital or acquire any assets of Corvus • August 25, 2010 – International Tower Hill Mines Ltd. (“ITH”) spun out its existing Alaska mineral properties (other than the Livengood project) and the North Bullfrog mineral property and related assets in Nevada into a new public company, being Corvus Gold Inc. AngloGold owned 12.5% of ITH and as a result of spin - off retained 12.5% ownership in Corvus • May 29, 2015 – AngloGold owned 14,698,876 Corvus Shares representing 18.3% of Corvus’ outstanding share capital • June 30, 2017 – Renaissance Gold signs option agreement on Silicon Project with AngloGold for a total of US$3M over 3 years • December 4, 2017 – AngloGold entered into a confidentiality agreement with Corvus with an initial one - year term in order to have access to and review confidential and proprietary information in relation to North Bullfrog, Mother Lode and other exploration assets owned by Corvus located in Nevada • August 10, 2020 – AngloGold owned 24,774,949 Corvus Shares representing 19.5% of Corvus’ outstanding share capital • May 22, 2020 – AngloGold said it will complete the option to purchase the Silicon project in Nevada from Renaissance Gold • May 6, 2021 – Entered into a loan agreement with AngloGold to fund up to US$20M towards the ongoing permitting and pre - development work at the North Bullfrog project as well as going exploration at the Mother Lode property • July 13, 2021 – The Company announced that it has received an unsolicited, non - binding proposal from AngloGold for the acquisition of the outstanding common s hares not already held by AngloGold • September 12, 2021 – AngloGold and Corvus expected to sign an agreement setting out a revised offer of C$4.10 per share
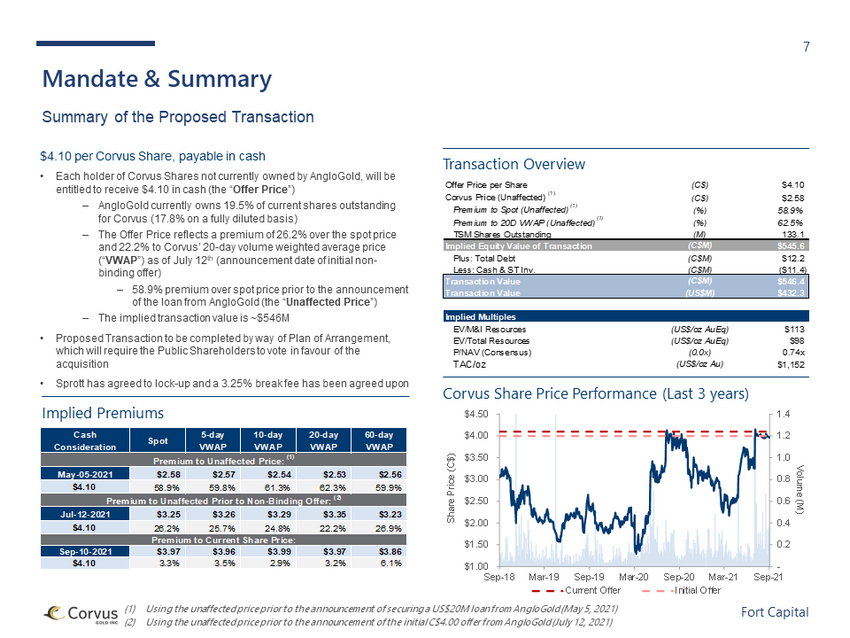
7 Fort Capital $4.10 per Corvus Share, payable in cash • Each holder of Corvus Shares not currently owned by AngloGold, will be entitled to receive $4.10 in cash (the “ Offer Price ”) ‒ AngloGold currently owns 19.5% of current shares outstanding for Corvus (17.8% on a fully diluted basis) ‒ The Offer Price reflects a premium of 26.2% over the spot price and 22.2% to Corvus’ 20 - day volume weighted average price (“ VWAP ”) as of July 12 th (announcement date of initial non - binding offer) ‒ 58.9% premium over spot price prior to the announcement of the loan from AngloGold (the “ Unaffected Price ”) ‒ The implied transaction value is ~$546M • Proposed Transaction to be completed by way of Plan of Arrangement, which will require the Public Shareholders to vote in favour of the acquisition • Sprott has agreed to lock - up and a 3.25% break fee has been agreed upon (1) Using the unaffected price prior to the announcement of securing a US$20M loan from AngloGold (May 5, 2021) (2) Using the unaffected price prior to the announcement of the initial C$4.00 offer from AngloGold (July 12, 2021) Mandate & Summary Summary of the Proposed Transaction Transaction Overview Corvus Share Price Performance (Last 3 years) Implied Premiums - 0.2 0.4 0.6 0.8 1.0 1.2 1.4 $1.00 $1.50 $2.00 $2.50 $3.00 $3.50 $4.00 $4.50 Sep-18 Mar-19 Sep-19 Mar-20 Sep-20 Mar-21 Sep-21 Volume (M) Share Price (C$) Current Offer Initial Offer Offer Price per Share (C$) $4.10 Corvus Price (Unaffected) (1) (C$) $2.58 Premium to Spot (Unaffected) (1) (%) 58.9% Premium to 20D VWAP (Unaffected) (1) (%) 62.5% TSM Shares Outstanding (M) 133.1 Implied Equity Value of Transaction (C$M) $545.6 Plus: Total Debt (C$M) $12.2 Less: Cash & ST Inv. (C$M) ($11.4) Transaction Value (C$M) $546.4 Transaction Value (US$M) $432.3 Implied Multiples EV/M&I Resources (US$/oz AuEq) $113 EV/Total Resources (US$/oz AuEq) $98 P/NAV (Consensus) (0.0x) 0.74x TAC/oz (US$/oz Au) $1,152 Cash Consideration Spot 5-day VWAP 10-day VWAP 20-day VWAP 60-day VWAP Premium to Unaffected Price: (1) May-05-2021 $2.58 $2.57 $2.54 $2.53 $2.56 $4.10 58.9% 59.8% 61.3% 62.3% 59.9% Premium to Unaffected Prior to Non-Binding Offer: (2) Jul-12-2021 $3.25 $3.26 $3.29 $3.35 $3.23 $4.10 26.2% 25.7% 24.8% 22.2% 26.9% Premium to Current Share Price: Sep-10-2021 $3.97 $3.96 $3.99 $3.97 $3.86 $4.10 3.3% 3.5% 2.9% 3.2% 6.1%
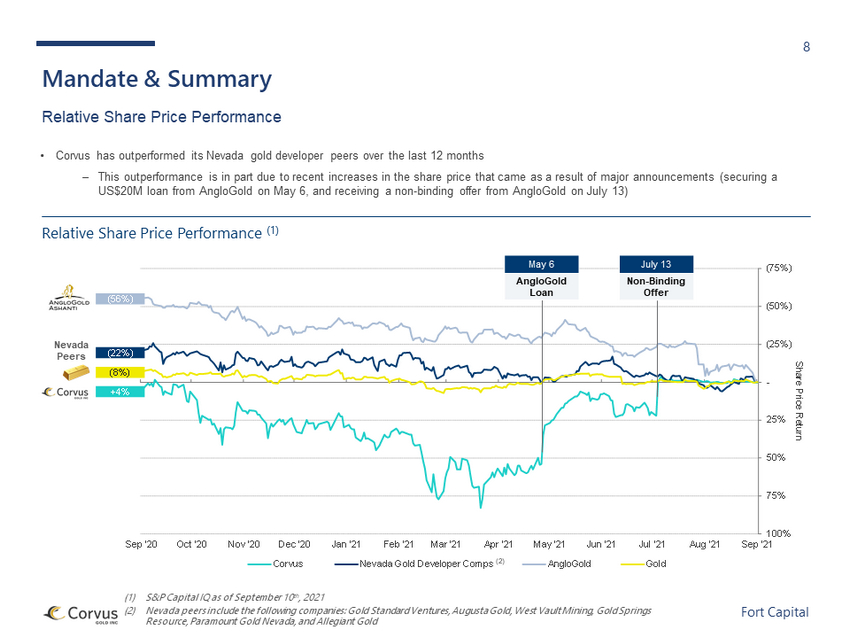
8 Fort Capital Sep '20 Oct '20 Nov '20 Dec '20 Jan '21 Feb '21 Mar '21 Apr '21 May '21 Jun '21 Jul '21 Aug '21 Sep '21 (75%) (50%) (25%) - 25% 50% 75% 100% Share Price Return Corvus Nevada Gold Developer Comps AngloGold Gold +4% (22%) (8%) (56%) • Corvus has outperformed its Nevada gold developer peers over the last 12 months ‒ This outperformance is in part due to recent increases in the share price that came as a result of major announcements (secur ing a US$20M loan from AngloGold on May 6, and receiving a non - binding offer from AngloGold on July 13) (1) S&P Capital IQ as of September 10 th , 2021 (2) Nevada peers include the following companies: Gold Standard Ventures, Augusta Gold, West Vault Mining, Gold Springs Resource, Paramount Gold Nevada, and Allegiant Gold Mandate & Summary Relative Share Price Performance Relative Share Price Performance (1) (2) Nevada Peers May 6 AngloGold Loan July 13 Non - Binding Offer
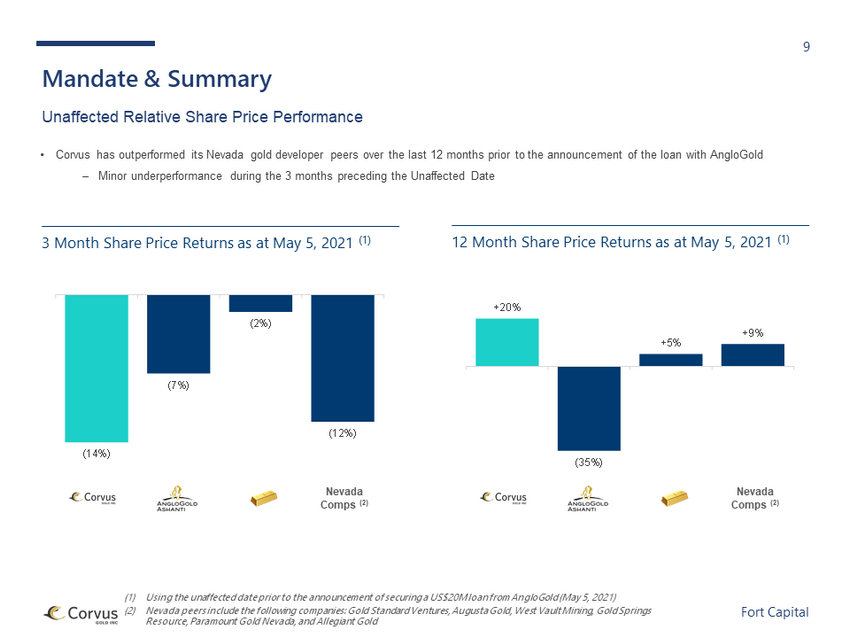
9 Fort Capital (1) Using the unaffected date prior to the announcement of securing a US$20M loan from AngloGold (May 5, 2021) (2) Nevada peers include the following companies: Gold Standard Ventures, Augusta Gold, West Vault Mining, Gold Springs Resource, Paramount Gold Nevada, and Allegiant Gold Mandate & Summary Unaffected Relative Share Price Performance 12 Month Share Price Returns as at May 5, 2021 (1) Nevada Comps (2) Nevada Comps (2) • Corvus has outperformed its Nevada gold developer peers over the last 12 months prior to the announcement of the loan with An glo Gold ‒ Minor underperformance during the 3 months preceding the Unaffected Date 3 Month Share Price Returns as at May 5, 2021 (1) (14%) (7%) (2%) (12%) +20% (35%) +5% +9%
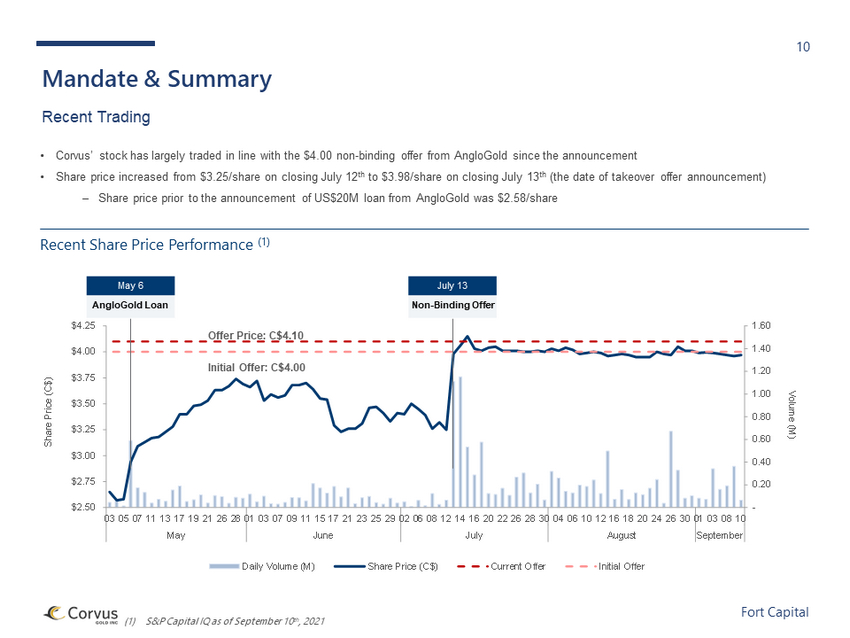
10 Fort Capital - 0.20 0.40 0.60 0.80 1.00 1.20 1.40 1.60 $2.50 $2.75 $3.00 $3.25 $3.50 $3.75 $4.00 $4.25 10 08 03 01 30 26 24 20 18 16 12 10 06 04 30 28 26 22 20 16 14 12 08 06 02 29 25 23 21 17 15 11 09 07 03 01 28 26 21 19 17 13 11 07 05 03 September August July June May Share Price (C$) Volume (M) Daily Volume (M) Share Price (C$) Current Offer Initial Offer (1) S&P Capital IQ as of September 10 th , 2021 Mandate & Summary Recent Trading Recent Share Price Performance (1) • Corvus’ stock has largely traded in line with the $4.00 non - binding offer from AngloGold since the announcement • Share price increased from $3.25/share on closing July 12 th to $3.98/share on closing July 13 th (the date of takeover offer announcement) ‒ Share price prior to the announcement of US$20M loan from AngloGold was $2.58/share Offer Price: C$4.10 Initial Offer: C$4.00 May 6 AngloGold Loan July 13 Non - Binding Offer
2. Overview of Corvus
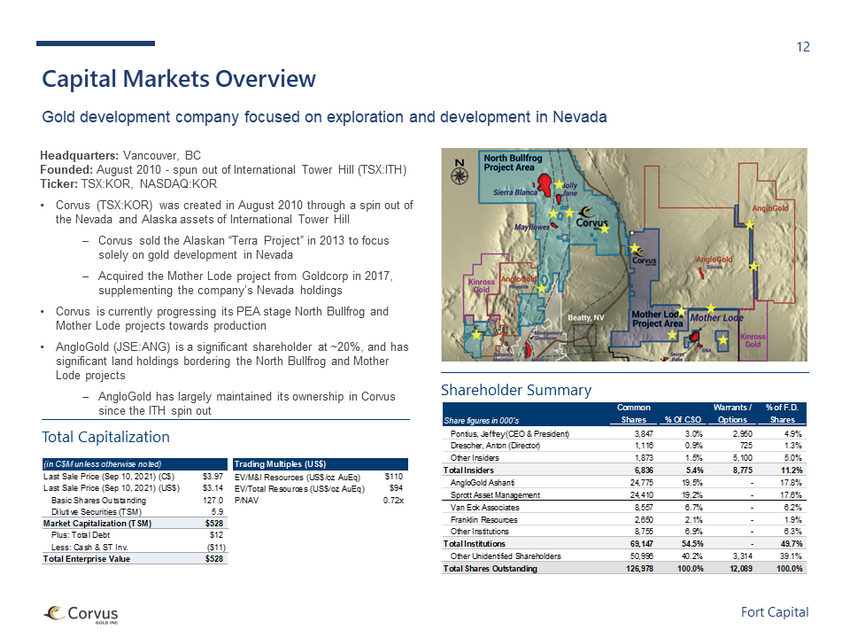
12 Fort Capital Headquarters: Vancouver, BC Founded: August 2010 - spun out of International Tower Hill (TSX:ITH) Ticker: TSX:KOR, NASDAQ:KOR • Corvus (TSX:KOR) was created in August 2010 through a spin out of the Nevada and Alaska assets of International Tower Hill ‒ Corvus sold the Alaskan “Terra Project” in 2013 to focus solely on gold development in Nevada ‒ Acquired the Mother Lode project from Goldcorp in 2017, supplementing the company’s Nevada holdings • Corvus is currently progressing its PEA stage North Bullfrog and Mother Lode projects towards production • AngloGold (JSE:ANG) is a significant shareholder at ~20%, and has significant land holdings bordering the North Bullfrog and Mother Lode projects ‒ AngloGold has largely maintained its ownership in Corvus since the ITH spin out Capital Markets Overview Gold development company focused on exploration and development in Nevada Shareholder Summary Total Capitalization (in C$M unless otherwise noted) Trading Multiples (US$) Last Sale Price (Sep 10, 2021) (C$) $3.97 EV/M&I Resources (US$/oz AuEq) $110 Last Sale Price (Sep 10, 2021) (US$) $3.14 EV/Total Resources (US$/oz AuEq) $94 Basic Shares Outstanding 127.0 P/NAV 0.72x Dilutive Securities (TSM) 5.9 Market Capitalization (TSM) $528 Plus: Total Debt $12 Less: Cash & ST Inv. ($11) Total Enterprise Value $528 Share figures in 000's Common Shares % Of CSO Warrants / Options % of F.D. Shares Pontius, Jeffrey (CEO & President) 3,847 3.0% 2,950 4.9% Drescher, Anton (Director) 1,116 0.9% 725 1.3% Other Insiders 1,873 1.5% 5,100 5.0% Total Insiders 6,836 5.4% 8,775 11.2% AngloGold Ashanti 24,775 19.5% - 17.8% Sprott Asset Management 24,410 19.2% - 17.6% Van Eck Associates 8,557 6.7% - 6.2% Franklin Resources 2,650 2.1% - 1.9% Other Institutions 8,755 6.9% - 6.3% Total Institutions 69,147 54.5% - 49.7% Other Unidentified Shareholders 50,996 40.2% 3,314 39.1% Total Shares Outstanding 126,978 100.0% 12,089 100.0%
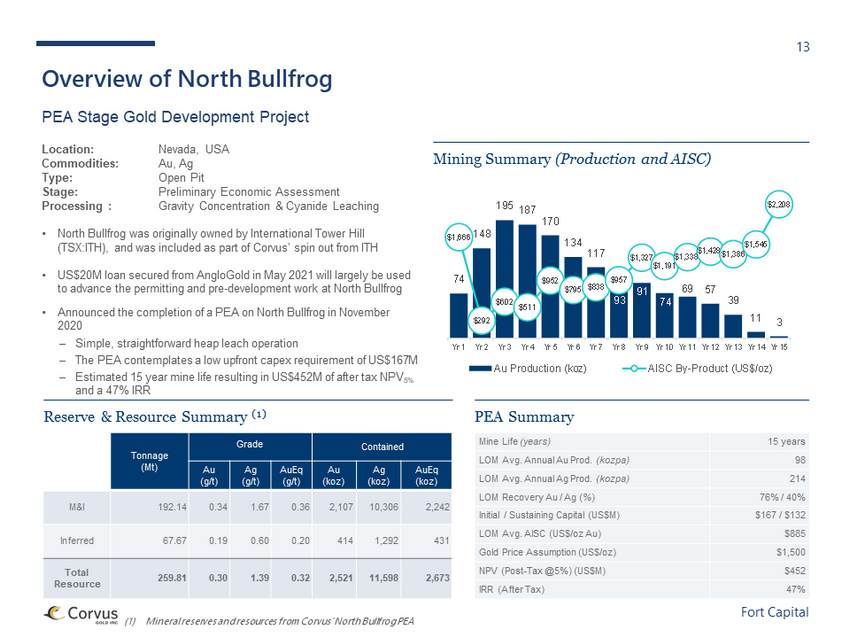
13 Fort Capital Overview of North Bullfrog PEA Stage Gold Development Project Location: Nevada, USA Commodities: Au, Ag Type: Open Pit Stage: Preliminary Economic Assessment Processing : Gravity Concentration & Cyanide Leaching • North Bullfrog was originally owned by International Tower Hill (TSX:ITH), and was included as part of Corvus’ spin out from ITH • US$20M loan secured from AngloGold in May 2021 will largely be used to advance the permitting and pre - development work at North Bullfrog • Announced the completion of a PEA on North Bullfrog in November 2020 ‒ Simple, straightforward heap leach operation ‒ The PEA contemplates a low upfront capex requirement of US$167M ‒ Estimated 15 year mine life resulting in US$452M of after tax NPV 5% and a 47% IRR (1) Mineral reserves and resources from Corvus’ North Bullfrog PEA Mine Life (years) 15 years LOM Avg. Annual Au Prod. (kozpa) 98 LOM Avg. Annual Ag Prod. (kozpa) 214 LOM Recovery Au / Ag ( % ) 76% / 40% Initial / Sustaining Capital (US$M) $167 / $132 LOM Avg. AISC (US$/oz Au) $885 Gold Price Assumption (US$/oz) $1,500 NPV (Post - Tax @5%) (US$M) $452 IRR (After Tax) 47% Reserve & Resource Summary (1) PEA Summary Tonnage (Mt) Grade Contained Au (g/t) Ag (g/t) AuEq (g/t) Au (koz) Ag (koz) AuEq (koz) M&I 192.14 0.34 1.67 0.36 2,107 10,306 2,242 Inferred 67.67 0.19 0.60 0.20 414 1,292 431 Total Resource 259.81 0.30 1.39 0.32 2,521 11,598 2,673 Mining Summary (Production and AISC) 74 148 195 187 170 134 117 93 91 74 69 57 39 11 3 $1,666 $292 $602 $511 $952 $795 $838 $957 $1,327 $1,191 $1,338 $1,428 $1,386 $1,545 $2,208 Yr 1 Yr 2 Yr 3 Yr 4 Yr 5 Yr 6 Yr 7 Yr 8 Yr 9 Yr 10 Yr 11 Yr 12 Yr 13 Yr 14 Yr 15 Au Production (koz) AISC By-Product (US$/oz)
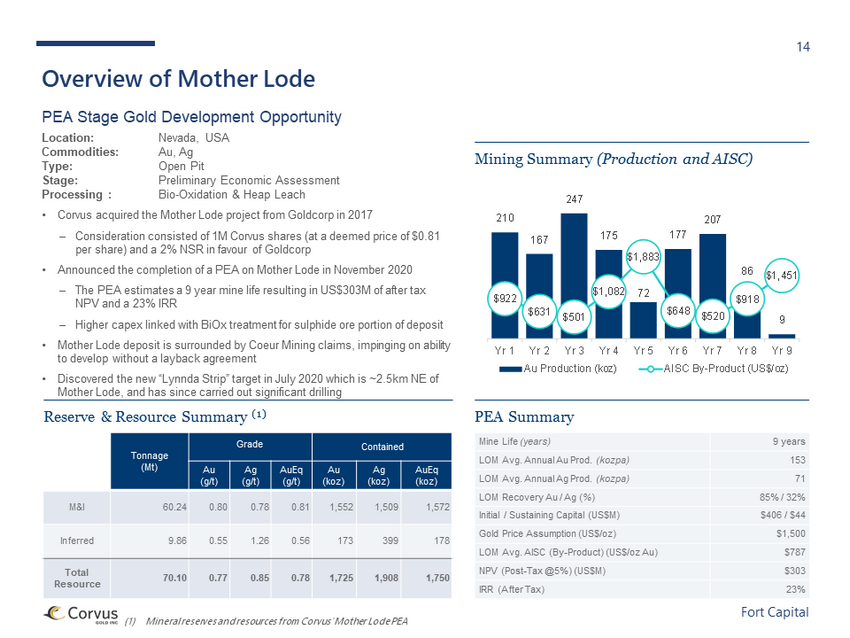
14 Fort Capital Overview of Mother Lode PEA Stage Gold Development Opportunity Location: Nevada, USA Commodities: Au, Ag Type: Open Pit Stage: Preliminary Economic Assessment Processing : Bio - Oxidation & Heap Leach • Corvus acquired the Mother Lode project from Goldcorp in 2017 ‒ Consideration consisted of 1M Corvus shares (at a deemed price of $0.81 per share) and a 2% NSR in favour of Goldcorp • Announced the completion of a PEA on Mother Lode in November 2020 ‒ The PEA estimates a 9 year mine life resulting in US$303M of after tax NPV and a 23% IRR ‒ Higher capex linked with BiOx treatment for sulphide ore portion of deposit • Mother Lode deposit is surrounded by Coeur Mining claims, impinging on ability to develop without a layback agreement • Discovered the new “Lynnda Strip” target in July 2020 which is ~2.5km NE of Mother Lode, and has since carried out significant drilling (1) Mineral reserves and resources from Corvus’ Mother Lode PEA Mine Life (years) 9 years LOM Avg. Annual Au Prod. (kozpa) 153 LOM Avg. Annual Ag Prod. (kozpa) 71 LOM Recovery Au / Ag ( % ) 85% / 32% Initial / Sustaining Capital (US$M) $406 / $44 Gold Price Assumption (US$/oz) $1,500 LOM Avg. AISC (By - Product) (US$/oz Au) $787 NPV (Post - Tax @5%) (US$M) $303 IRR (After Tax) 23% Reserve & Resource Summary (1) PEA Summary Tonnage (Mt) Grade Contained Au (g/t) Ag (g/t) AuEq (g/t) Au (koz) Ag (koz) AuEq (koz) M&I 60.24 0.80 0.78 0.81 1,552 1,509 1,572 Inferred 9.86 0.55 1.26 0.56 173 399 178 Total Resource 70.10 0.77 0.85 0.78 1,725 1,908 1,750 Mining Summary (Production and AISC) 210 167 247 175 72 177 207 86 9 $922 $631 $501 $1,082 $1,883 $648 $520 $918 $1,451 Yr 1 Yr 2 Yr 3 Yr 4 Yr 5 Yr 6 Yr 7 Yr 8 Yr 9 Au Production (koz) AISC By-Product (US$/oz)
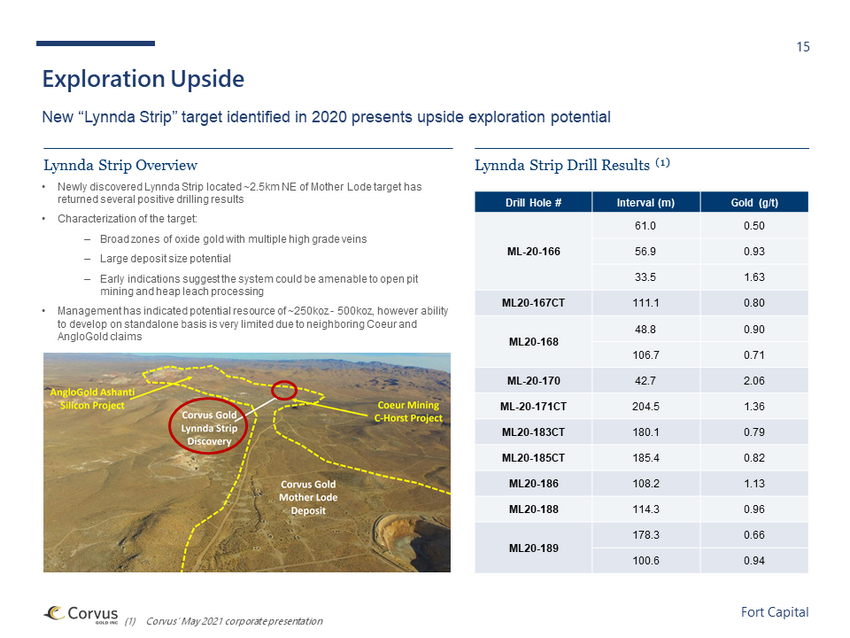
15 Fort Capital Exploration Upside New “Lynnda Strip” target identified in 2020 presents upside exploration potential (1) Corvus’ May 2021 corporate presentation Lynnda Strip Overview Lynnda Strip Drill Results (1) • Newly discovered Lynnda Strip located ~2.5km NE of Mother Lode target has returned several positive drilling results • Characterization of the target: ‒ Broad zones of oxide gold with multiple high grade veins ‒ Large deposit size potential ‒ Early indications suggest the system could be amenable to open pit mining and heap leach processing • Management has indicated potential resource of ~250koz - 500koz, however ability to develop on standalone basis is very limited due to neighboring Coeur and AngloGold claims Drill Hole # Interval (m) Gold (g/t) ML - 20 - 166 61.0 0.50 56.9 0.93 33.5 1.63 ML20 - 167CT 111.1 0.80 ML20 - 168 48.8 0.90 106.7 0.71 ML - 20 - 170 42.7 2.06 ML - 20 - 171CT 204.5 1.36 ML20 - 183CT 180.1 0.79 ML20 - 185CT 185.4 0.82 ML20 - 186 108.2 1.13 ML20 - 188 114.3 0.96 ML20 - 189 178.3 0.66 100.6 0.94
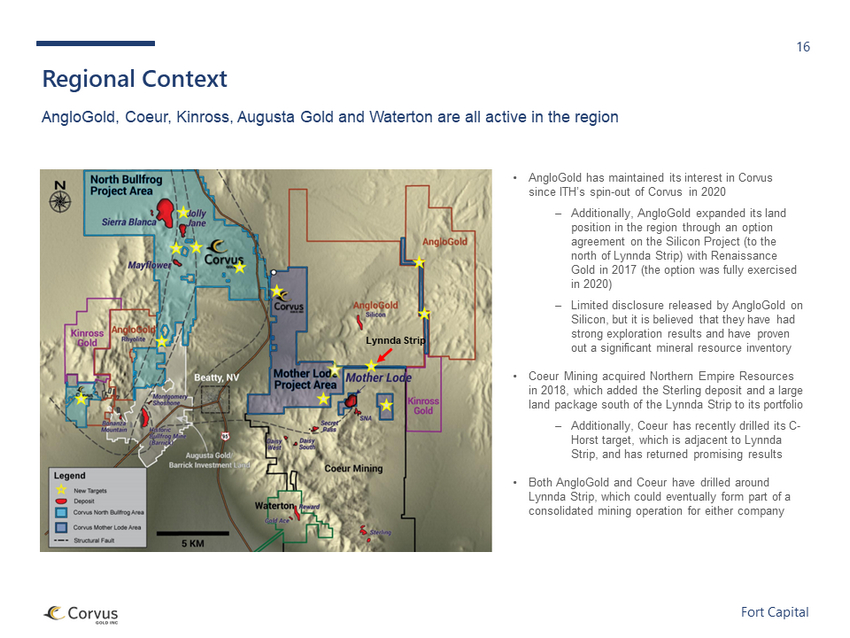
16 Fort Capital Regional Context AngloGold, Coeur, Kinross, Augusta Gold and Waterton are all active in the region • AngloGold has maintained its interest in Corvus since ITH’s spin - out of Corvus in 2020 ‒ Additionally, AngloGold expanded its land position in the region through an option agreement on the Silicon Project (to the north of Lynnda Strip) with Renaissance Gold in 2017 (the option was fully exercised in 2020) ‒ Limited disclosure released by AngloGold on Silicon, but it is believed that they have had strong exploration results and have proven out a significant mineral resource inventory • Coeur Mining acquired Northern Empire Resources in 2018, which added the Sterling deposit and a large land package south of the Lynnda Strip to its portfolio ‒ Additionally, Coeur has recently drilled its C - Horst target, which is adjacent to Lynnda Strip, and has returned promising results • Both AngloGold and Coeur have drilled around Lynnda Strip, which could eventually form part of a consolidated mining operation for either company Lynnda Strip
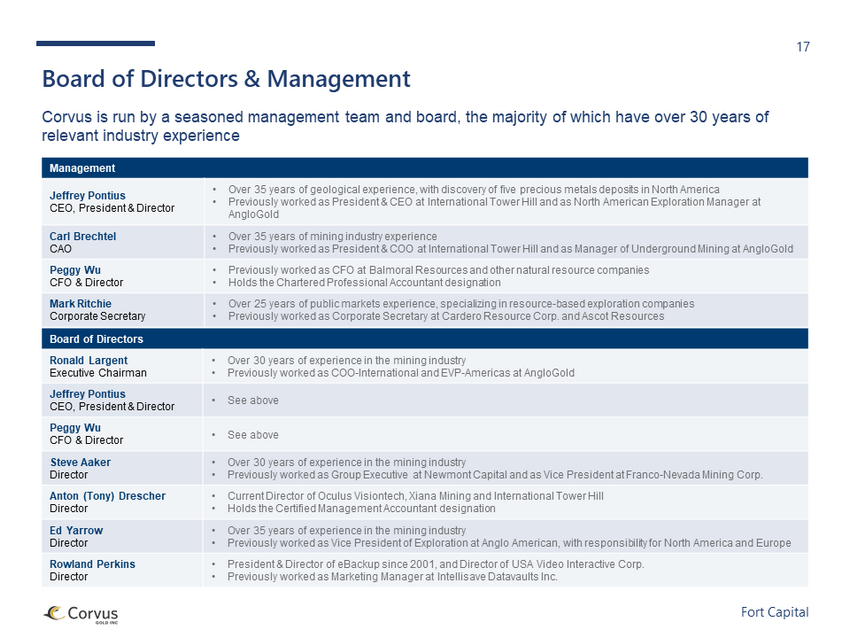
17 Fort Capital Board of Directors & Management Corvus is run by a seasoned management team and board, the majority of which have over 30 years of relevant industry experience Management Jeffrey Pontius CEO, President & Director • Over 35 years of geological experience, with discovery of five precious metals deposits in North America • Previously worked as President & CEO at International Tower Hill and as North American Exploration Manager at AngloGold Carl Brechtel CAO • Over 35 years of mining industry experience • Previously worked as President & COO at International Tower Hill and as Manager of Underground Mining at AngloGold Peggy Wu CFO & Director • Previously worked as CFO at Balmoral Resources and other natural resource companies • Holds the Chartered Professional Accountant designation Mark Ritchie Corporate Secretary • Over 25 years of public markets experience, specializing in resource - based exploration companies • Previously worked as Corporate Secretary at Cardero Resource Corp. and Ascot Resources Board of Directors Ronald Largent Executive Chairman • Over 30 years of experience in the mining industry • Previously worked as COO - International and EVP - Americas at AngloGold Jeffrey Pontius CEO, President & Director • See above Peggy Wu CFO & Director • See above Steve Aaker Director • Over 30 years of experience in the mining industry • Previously worked as Group Executive at Newmont Capital and as Vice President at Franco - Nevada Mining Corp. Anton (Tony) Drescher Director • Current Director of Oculus Visiontech, Xiana Mining and International Tower Hill • Holds the Certified Management Accountant designation Ed Yarrow Director • Over 35 years of experience in the mining industry • Previously worked as Vice President of Exploration at Anglo American, with responsibility for North America and Europe Rowland Perkins Director • President & Director of eBackup since 2001, and Director of USA Video Interactive Corp. • Previously worked as Marketing Manager at Intellisave Datavaults Inc.
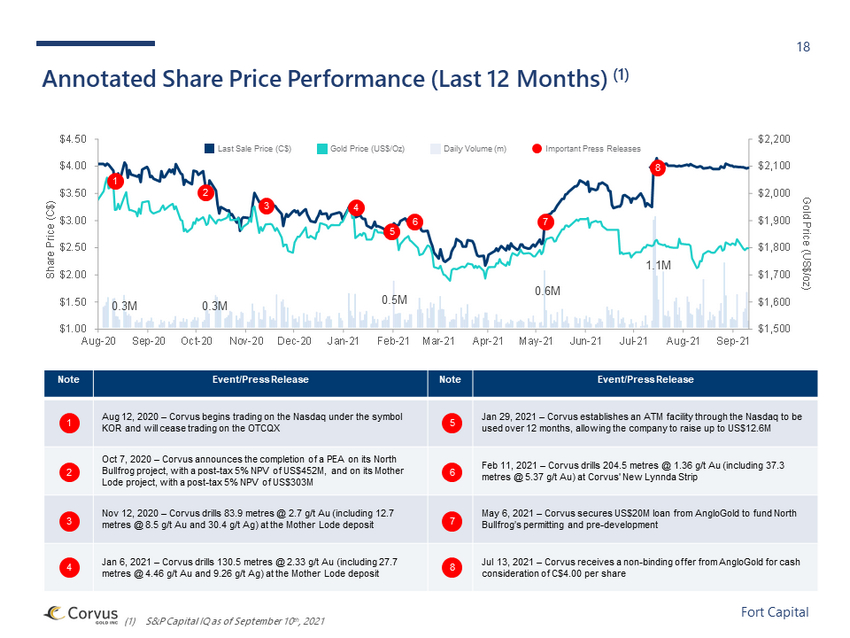
18 Fort Capital $1,500 $1,600 $1,700 $1,800 $1,900 $2,000 $2,100 $2,200 $1.00 $1.50 $2.00 $2.50 $3.00 $3.50 $4.00 $4.50 Aug-20 Sep-20 Oct-20 Nov-20 Dec-20 Jan-21 Feb-21 Mar-21 Apr-21 May-21 Jun-21 Jul-21 Aug-21 Sep-21 Gold Price (US$/oz) Share Price (C$) (1) S&P Capital IQ as of September 10 th , 2021 Annotated Share Price Performance (Last 12 Months) (1) Note Event/Press Release Note Event/Press Release Aug 12, 2020 – Corvus begins trading on the Nasdaq under the symbol KOR and will cease trading on the OTCQX Jan 29, 2021 – Corvus establishes an ATM facility through the Nasdaq to be used over 12 months, allowing the company to raise up to US$12.6M Oct 7, 2020 – Corvus announces the completion of a PEA on its North Bullfrog project, with a post - tax 5% NPV of US$452M, and on its Mother Lode project, with a post - tax 5% NPV of US$303M Feb 11, 2021 – Corvus drills 204.5 metres @ 1.36 g/t Au (including 37.3 metres @ 5.37 g/t Au) at Corvus' New Lynnda Strip Nov 12, 2020 – Corvus drills 83.9 metres @ 2.7 g/t Au (including 12.7 metres @ 8.5 g/t Au and 30.4 g/t Ag) at the Mother Lode deposit May 6, 2021 – Corvus secures US$20M loan from AngloGold to fund North Bullfrog’s permitting and pre - development Jan 6, 2021 – Corvus drills 130.5 metres @ 2.33 g/t Au (including 27.7 metres @ 4.46 g/t Au and 9.26 g/t Ag) at the Mother Lode deposit Jul 13, 2021 – Corvus receives a non - binding offer from AngloGold for cash consideration of C$4.00 per share 1 2 3 4 5 6 7 8 1 2 3 5 6 7 8 4 Last Sale Price (C$) Gold Price (US$/Oz) Daily Volume (m) Important Press Releases 0.3M 0.3M 0.5M 0.6M 1.1M
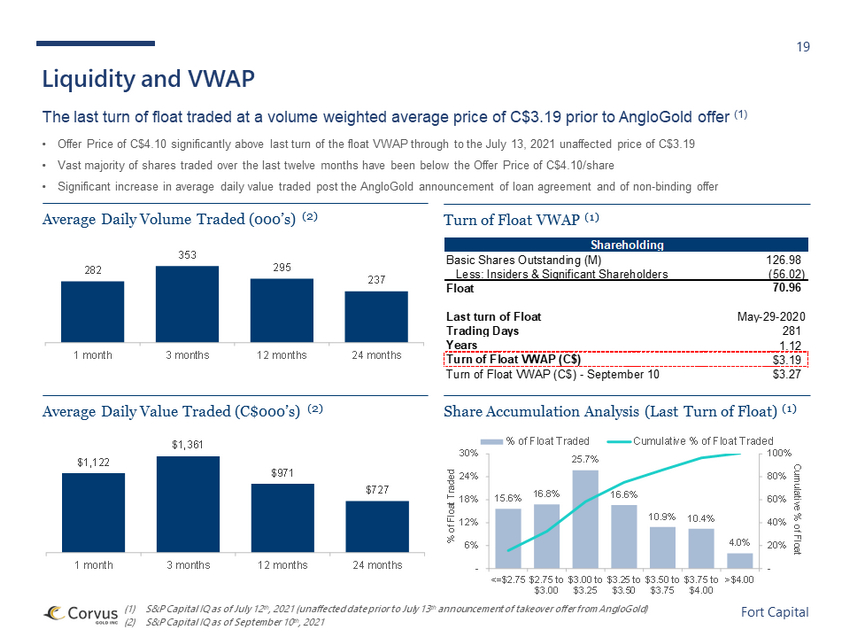
19 Fort Capital (1) S&P Capital IQ as of July 12 th , 2021 (unaffected date prior to July 13 th announcement of takeover offer from AngloGold) (2) S&P Capital IQ as of September 10 th , 2021 Liquidity and VWAP The last turn of float traded at a volume weighted average price of C$3.19 prior to AngloGold offer (1) • Offer Price of C$4.10 significantly above last turn of the float VWAP through to the July 13, 2021 unaffected price of C$3.19 • Vast majority of shares traded over the last twelve months have been below the Offer Price of C$4.10/share • Significant increase in average daily value traded post the AngloGold announcement of loan agreement and of non - binding offer Average Daily Volume Traded (000’s) (2) Average Daily Value Traded (C$000’s) (2) Turn of Float VWAP (1) Share Accumulation Analysis (Last Turn of Float) (1) $1,122 $1,361 $971 $727 1 month 3 months 12 months 24 months 282 353 295 237 1 month 3 months 12 months 24 months Shareholding Basic Shares Outstanding (M) 126.98 Less: Insiders & Significant Shareholders (56.02) Float 70.96 Last turn of Float May-29-2020 Trading Days 281 Years 1.12 Turn of Float VWAP (C$) $3.19 Turn of Float VWAP (C$) - September 10 $3.27 15.6% 16.8% 25.7% 16.6% 10.9% 10.4% 4.0% - 20% 40% 60% 80% 100% - 6% 12% 18% 24% 30% <=$2.75 $2.75 to $3.00 $3.00 to $3.25 $3.25 to $3.50 $3.50 to $3.75 $3.75 to $4.00 >$4.00 Cumulative % of Float % of Float Traded % of Float Traded Cumulative % of Float Traded
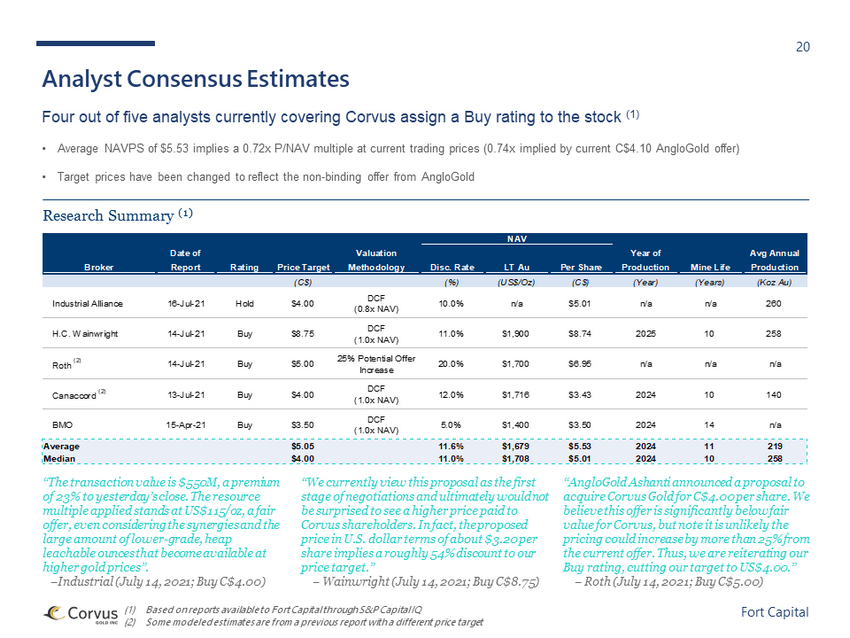
20 Fort Capital • Average NAVPS of $5.53 implies a 0.72x P/NAV multiple at current trading prices (0.74x implied by current C$4.10 AngloGold of fer ) • Target prices have been changed to reflect the non - binding offer from AngloGold (1) Based on reports available to Fort Capital through S&P Capital IQ (2) Some modeled estimates are from a previous report with a different price target Analyst Consensus Estimates Four out of five analysts currently covering Corvus assign a Buy rating to the stock (1) “The transaction value is $550M, a premium of 23% to yesterday’s close. The resource multiple applied stands at US$115/oz, a fair offer, even considering the synergies and the large amount of lower - grade, heap leachable ounces that become available at higher gold prices”. – Industrial (July 14, 2021; Buy C$4.00) Research Summary (1) “AngloGold Ashanti announced a proposal to acquire Corvus Gold for C$4.00 per share. We believe this offer is significantly below fair value for Corvus, but note it is unlikely the pricing could increase by more than 25% from the current offer. Thus, we are reiterating our Buy rating, cutting our target to US$4.00.” – Roth (July 14, 2021; Buy C$5.00) “We currently view this proposal as the first stage of negotiations and ultimately would not be surprised to see a higher price paid to Corvus shareholders. In fact, the proposed price in U.S. dollar terms of about $3.20 per share implies a roughly 54% discount to our price target.” – Wainwright (July 14, 2021; Buy C$8.75) Broker Date of Report Rating Price Target Valuation Methodology Disc. Rate LT Au Per Share Year of Production Mine Life Avg Annual Production (C$) (%) (US$/Oz) (C$) (Year) (Years) (Koz Au) Industrial Alliance 16-Jul-21 Hold $4.00 DCF (0.8x NAV) 10.0% n/a $5.01 n/a n/a 260 H.C. Wainwright 14-Jul-21 Buy $8.75 DCF (1.0x NAV) 11.0% $1,900 $8.74 2025 10 258 Roth (2) 14-Jul-21 Buy $5.00 25% Potential Offer Increase 20.0% $1,700 $6.95 n/a n/a n/a Canaccord (2) 13-Jul-21 Buy $4.00 DCF (1.0x NAV) 12.0% $1,716 $3.43 2024 10 140 BMO 15-Apr-21 Buy $3.50 DCF (1.0x NAV) 5.0% $1,400 $3.50 2024 14 n/a Average $5.05 11.6% $1,679 $5.53 2024 11 219 Median $4.00 11.0% $1,708 $5.01 2024 10 258 NAV
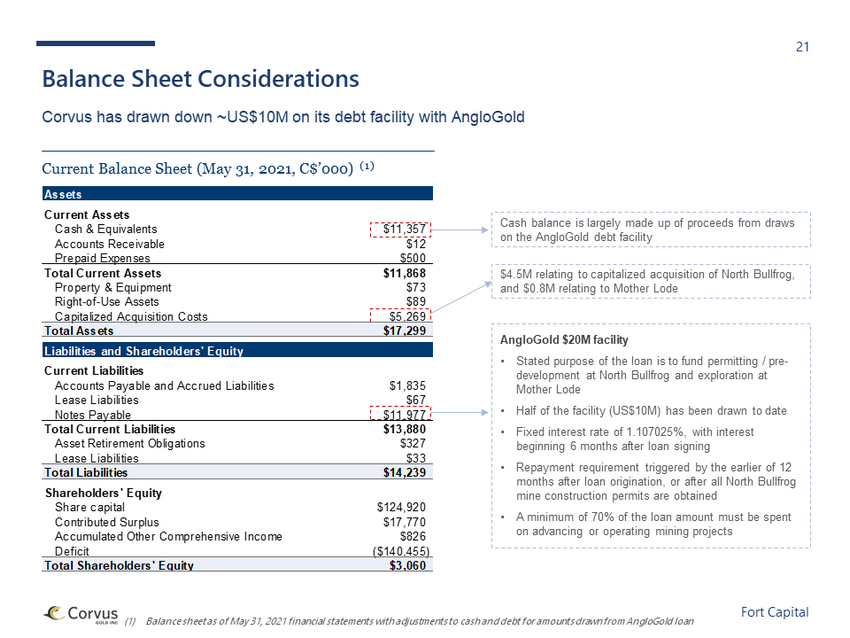
21 Fort Capital (1) Balance sheet as of May 31, 2021 financial statements with adjustments to cash and debt for amounts drawn from AngloGold loan Balance Sheet Considerations Corvus has drawn down ~US$10M on its debt facility with AngloGold Current Balance Sheet (May 31, 2021, C$’000) (1) Cash balance is largely made up of proceeds from draws on the AngloGold debt facility $4.5M relating to capitalized acquisition of North Bullfrog, and $0.8M relating to Mother Lode AngloGold $20M facility • Stated purpose of the loan is to fund permitting / pre - development at North Bullfrog and exploration at Mother Lode • Half of the facility (US$10M) has been drawn to date • Fixed interest rate of 1.107025%, with interest beginning 6 months after loan signing • Repayment requirement triggered by the earlier of 12 months after loan origination, or after all North Bullfrog mine construction permits are obtained • A minimum of 70% of the loan amount must be spent on advancing or operating mining projects Assets Current Assets Cash & Equivalents $11,357 Accounts Receivable $12 Prepaid Expenses $500 Total Current Assets $11,868 Property & Equipment $73 Right-of-Use Assets $89 Capitalized Acquisition Costs $5,269 Total Assets $17,299 Liabilities and Shareholders' Equity Current Liabilities Accounts Payable and Accrued Liabilities $1,835 Lease Liabilities $67 Notes Payable $11,977 Total Current Liabilities $13,880 Asset Retirement Obligations $327 Lease Liabilities $33 Total Liabilities $14,239 Shareholders' Equity Share capital $124,920 Contributed Surplus $17,770 Accumulated Other Comprehensive Income $826 Deficit ($140,455) Total Shareholders' Equity $3,060
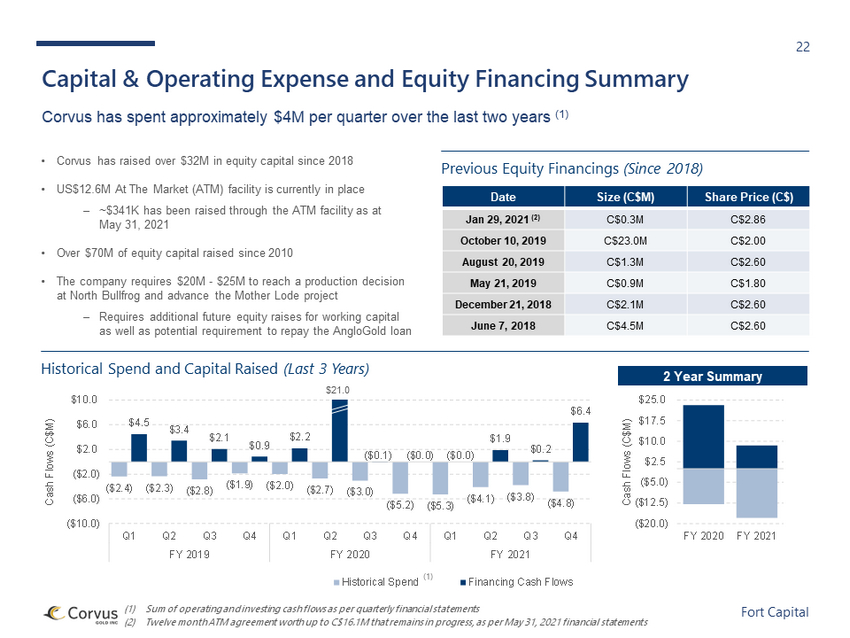
22 Fort Capital ($2.4) ($2.3) ($2.8) ($1.9) ($2.0) ($2.7) ($3.0) ($5.2) ($5.3) ($4.1) ($3.8) ($4.8) $4.5 $3.4 $2.1 $0.9 $2.2 ($0.1) ($0.0) ($0.0) $1.9 $0.2 $6.4 ($10.0) ($6.0) ($2.0) $2.0 $6.0 $10.0 Q1 Q2 Q3 Q4 Q1 Q2 Q3 Q4 Q1 Q2 Q3 Q4 FY 2019 FY 2020 FY 2021 Cash Flows (C$M) Historical Spend Financing Cash Flows (1) Sum of operating and investing cash flows as per quarterly financial statements (2) Twelve month ATM agreement worth up to C$16.1M that remains in progress, as per May 31, 2021 financial statements Capital & Operating Expense and Equity Financing Summary Corvus has spent approximately $4M per quarter over the last two years (1) Date Size (C$M) Share Price (C$) Jan 29, 2021 (2) C$0.3M C$2.86 October 10, 2019 C$23.0M C$2.00 August 20, 2019 C$1.3M C$2.60 May 21, 2019 C$0.9M C$1.80 December 21, 2018 C$2.1M C$2.60 June 7, 2018 C$4.5M C$2.60 Previous Equity Financings (Since 2018) Historical Spend and Capital Raised (Last 3 Years) (1) $21.0 • Corvus has raised over $32M in equity capital since 2018 • US$12.6M At The Market (ATM) facility is currently in place ‒ ~$341K has been raised through the ATM facility as at May 31, 2021 • Over $70M of equity capital raised since 2010 • The company requires $20M - $25M to reach a production decision at North Bullfrog and advance the Mother Lode project ‒ Requires additional future equity raises for working capital as well as potential requirement to repay the AngloGold loan 2 Year Summary ($20.0) ($12.5) ($5.0) $2.5 $10.0 $17.5 $25.0 FY 2020 FY 2021 Cash Flows (C$M)
3. Valuation
24 Fort Capital Valuation Approach and Considerations Definition of Fair Market Value • The Valuation is based on techniques and assumptions that Fort Capital considers appropriate in the circumstances for the pur pos es of arriving at an opinion as to the range of fair market value for the Shares of the Company not owned by AngloGold • Fair market value (“ FMV ” or “ Fair Market Value ”) means the monetary consideration that, in an open and unrestricted market, a prudent and informed buyer would pay to a prudent and informed seller, each acting at arm’s length with the other, where neither party is un der any compulsion to act • FMV was determined based on a valuation date (the “ Valuation Date ”) of September 10, 2021 • FMV of the common shares of the Company was analyzed on a going concern basis and is expressed on an en bloc basis ‒ Going concern remains a significant assumption (and outlined as a risk in the audit report) and there is a risk that the Comp any is unable to secure sufficient funds to finance continued exploration, development and construction of the North Bullfrog and Mother Lo de projects. However, given the substantial progress to date, the delineation of a resource and the potential future earnings potential of th e project(s) (which would be far in excess of likely liquidation value), a going concern assumption was deemed appropriate ‒ We have not applied any liquidity or minority discounts in accordance with requirements of Section 6.4(d) of MI 61 - 101 ‒ “…in determining the fair market value of the offeree or affected securities, not include in the formal valuation a downward adjustment to reflect the liquidity of the securities, the effect of the transaction on the securities or the fact that the s ecu rities do not form part of a controlling interest” (1) ‒ In addition, we have not taken into account any potential synergies that could accrue to the Company as it relates to the Pro pos ed Transaction, other than elimination of public company costs, where such savings would be available to most potential purchase rs and not limited to Special Purchasers ‒ While AngloGold would be considered a Special Purchaser, given the relationships between the two companies and the location o f t he properties, any potential benefits that would accrue to AngloGold are speculative in nature and there is insufficient informa tio n available to determine any specific amount of net value - added. As such, the existence of such Special Purchasers has not influenced the conclusion of this Valuation (1) MI 61 - 101 – Section 6.4(d)
25 Fort Capital Valuation Summary Key forms of analysis • In reaching our conclusion with respect to the Valuation, we have considered the following ‒ Net asset value (“ NAV ”) analysis ‒ Forecast developed with management assistance based largely on the Technical Report NI 43 - 101 mine plans effective November 2020 (the “ PEA models ”) for both the North Bullfrog and Mother Lode projects ‒ The following changes have also been made to the PEA models to reflect an updated profile. The revised model is referred to a s a “ Base Case ” scenario ‒ Reflected recent consensus commodity pricing (assumes long term gold price of $1,600 per ounce) ‒ Included additional $4M of pre - construction development expenditures to be spent in 2021, $20M in 2022 to get the North Bullfrog project to a final investment decision stage (“ FID ”) ‒ ~$3M per year in corporate costs above the mine level (excludes public company costs that would be eliminated as part of the Transaction) ‒ Reflect the Valuation Date (September 10, 2021) versus the starting construction dates as reflected in the PEA models ‒ Adjusted the construction start date to 2023 and 2026 for North Bullfrog and Mother Lode, respectively ‒ We have applied a 5% discount rate to make the projects comparable with other development projects and in keeping with industry standards ‒ We have then reflected the value of any other exploration assets, debt or cash to develop the net asset value for the Company ‒ Based on the risk profile of the underlying projects, we have then applied a discount to the underlying NAV, as well as compa rin g the implied discount rate as determined by the adjusted NAV relative to overall risk profile of the Company ‒ Comparable company analysis ‒ Fort Capital has assessed P/NAV multiples of comparable gold developers with assets North America as well as EV/Reserve and EV/Resources trading multiples ‒ Precedent transaction analysis ‒ We have considered gold project precedents with estimated NAV multiples and asset based metrics such as EV/Reserves and EV/Resources, and Total Acquisition Cost (TAC) ‒ Fort Capital typically places primary reliance on NAV analysis given the nature of the projects, the assumptions for revenue and operating costs and the capital expenditures required to place the projects into production
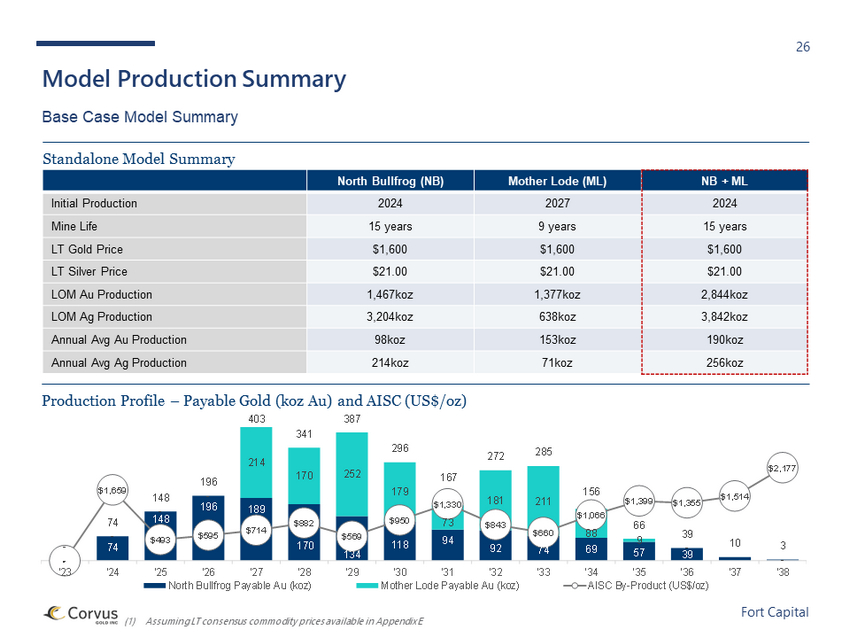
26 Fort Capital Model Production Summary Base Case Model Summary (1) Assuming LT consensus commodity prices available in Appendix E Production Profile – Payable Gold (koz Au) and AISC (US$/oz) Standalone Model Summary North Bullfrog (NB) Mother Lode (ML) NB + ML Initial Production 2024 2027 2024 Mine Life 15 years 9 years 15 years LT Gold Price $1,600 $1,600 $1,600 LT Silver Price $21.00 $21.00 $21.00 LOM Au Production 1,467koz 1,377koz 2,844koz LOM Ag Production 3,204koz 638koz 3,842koz Annual Avg Au Production 98koz 153koz 190koz Annual Avg Ag Production 214koz 71koz 256koz - 74 148 196 189 170 134 118 94 92 74 69 57 39 10 3 - - - - 214 170 252 179 73 181 211 88 9 - - - 74 148 196 403 341 387 296 167 272 285 156 66 39 10 3 - $1,659 $493 $595 $714 $882 $569 $950 $1,330 $843 $660 $1,066 $1,399 $1,355 $1,514 $2,177 '23 '24 '25 '26 '27 '28 '29 '30 '31 '32 '33 '34 '35 '36 '37 '38 North Bullfrog Payable Au (koz) Mother Lode Payable Au (koz) AISC By-Product (US$/oz)
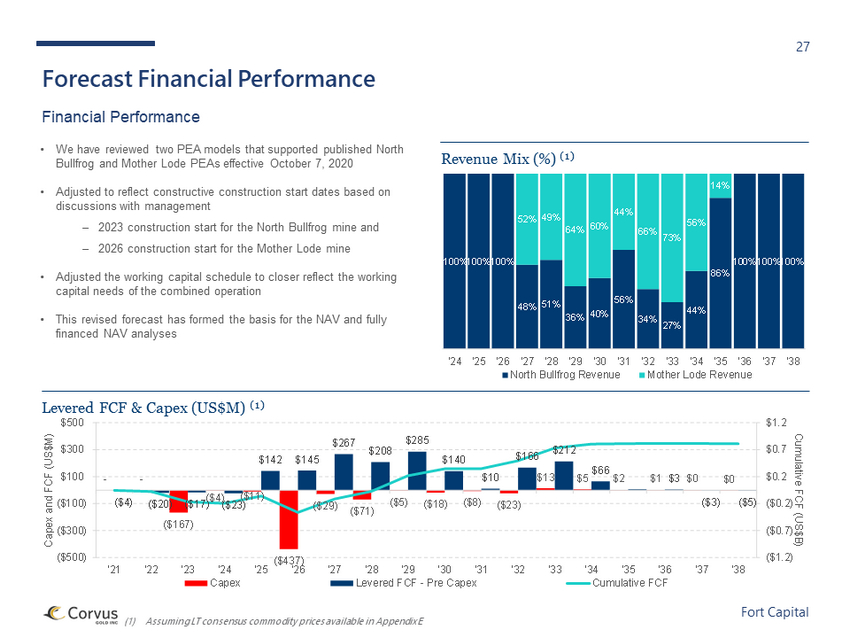
27 Fort Capital Forecast Financial Performance Financial Performance • We have reviewed two PEA models that supported published North Bullfrog and Mother Lode PEAs effective October 7, 2020 • Adjusted to reflect constructive construction start dates based on discussions with management ‒ 2023 construction start for the North Bullfrog mine and ‒ 2026 construction start for the Mother Lode mine • Adjusted the working capital schedule to closer reflect the working capital needs of the combined operation • This revised forecast has formed the basis for the NAV and fully financed NAV analyses (1) Assuming LT consensus commodity prices available in Appendix E Levered FCF & Capex (US$M) (1) Revenue Mix (%) (1) - - ($167) ($4) ($11) ($437) ($29) ($71) ($5) ($18) ($8) ($23) $13 $5 $2 $1 $0 $0 ($4) ($20) ($17) ($23) $142 $145 $267 $208 $285 $140 $10 $166 $212 $66 $3 ($3) ($5) ($1.2) ($0.7) ($0.2) $0.2 $0.7 $1.2 ($500) ($300) ($100) $100 $300 $500 '21 '22 '23 '24 '25 '26 '27 '28 '29 '30 '31 '32 '33 '34 '35 '36 '37 '38 Cumulative FCF (US$B) Capex and FCF (US$M) Capex Levered FCF - Pre Capex Cumulative FCF 100% 100% 100% 48% 51% 36% 40% 56% 34% 27% 44% 86% 100% 100% 100% 52% 49% 64% 60% 44% 66% 73% 56% 14% '24 '25 '26 '27 '28 '29 '30 '31 '32 '33 '34 '35 '36 '37 '38 North Bullfrog Revenue Mother Lode Revenue
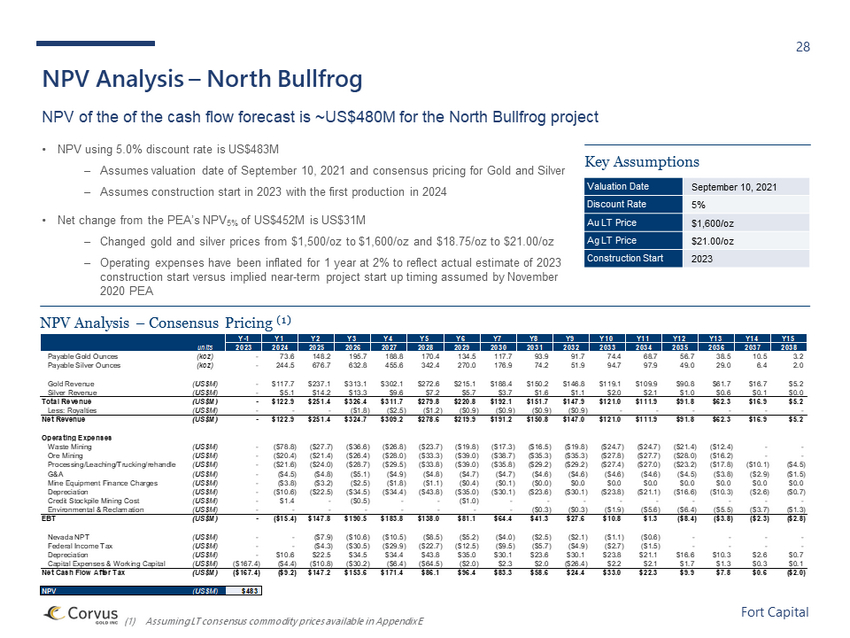
28 Fort Capital NPV Analysis – North Bullfrog NPV of the of the cash flow forecast is ~US$480M for the North Bullfrog project • NPV using 5.0% discount rate is US$483M ‒ Assumes valuation date of September 10, 2021 and consensus pricing for Gold and Silver ‒ Assumes construction start in 2023 with the first production in 2024 • Net change from the PEA’s NPV 5% of US$452M is US$31M ‒ Changed gold and silver prices from $1,500/oz to $1,600/oz and $18.75/oz to $21.00/oz ‒ Operating expenses have been inflated for 1 year at 2% to reflect actual estimate of 2023 construction start versus implied near - term project start up timing assumed by November 2020 PEA (1) Assuming LT consensus commodity prices available in Appendix E NPV Analysis – Consensus Pricing (1) Key Assumptions Valuation Date September 10, 2021 Discount Rate 5% Au LT Price $1,600/oz Ag LT Price $21.00/oz Construction Start 2023 Y-1 Y1 Y2 Y3 Y4 Y5 Y6 Y7 Y8 Y9 Y10 Y11 Y12 Y13 Y14 Y15 units 2023 2024 2025 2026 2027 2028 2029 2030 2031 2032 2033 2034 2035 2036 2037 2038 Payable Gold Ounces (koz) - 73.6 148.2 195.7 188.8 170.4 134.5 117.7 93.9 91.7 74.4 68.7 56.7 38.5 10.5 3.2 Payable Silver Ounces (koz) - 244.5 676.7 632.8 455.6 342.4 270.0 176.9 74.2 51.9 94.7 97.9 49.0 29.0 6.4 2.0 Gold Revenue (US$M) - $117.7 $237.1 $313.1 $302.1 $272.6 $215.1 $188.4 $150.2 $146.8 $119.1 $109.9 $90.8 $61.7 $16.7 $5.2 Silver Revenue (US$M) - $5.1 $14.2 $13.3 $9.6 $7.2 $5.7 $3.7 $1.6 $1.1 $2.0 $2.1 $1.0 $0.6 $0.1 $0.0 Total Revenue (US$M) - $122.9 $251.4 $326.4 $311.7 $279.8 $220.8 $192.1 $151.7 $147.9 $121.0 $111.9 $91.8 $62.3 $16.9 $5.2 Less: Royalties (US$M) - - - ($1.8) ($2.5) ($1.2) ($0.9) ($0.9) ($0.9) ($0.9) - - - - - - Net Revenue (US$M) - $122.9 $251.4 $324.7 $309.2 $278.6 $219.9 $191.2 $150.8 $147.0 $121.0 $111.9 $91.8 $62.3 $16.9 $5.2 Operating Expenses Waste Mining (US$M) - ($78.8) ($27.7) ($36.6) ($26.8) ($23.7) ($19.8) ($17.3) ($16.5) ($19.8) ($24.7) ($24.7) ($21.4) ($12.4) - - Ore Mining (US$M) - ($20.4) ($21.4) ($26.4) ($28.0) ($33.3) ($39.0) ($38.7) ($35.3) ($35.3) ($27.8) ($27.7) ($28.0) ($16.2) - - Processing/Leaching/Trucking/rehandle (US$M) - ($21.6) ($24.0) ($28.7) ($29.5) ($33.8) ($39.0) ($35.8) ($29.2) ($29.2) ($27.4) ($27.0) ($23.2) ($17.8) ($10.1) ($4.5) G&A (US$M) - ($4.5) ($4.8) ($5.1) ($4.9) ($4.8) ($4.7) ($4.7) ($4.6) ($4.6) ($4.6) ($4.6) ($4.5) ($3.8) ($2.9) ($1.5) Mine Equipment Finance Charges (US$M) - ($3.8) ($3.2) ($2.5) ($1.8) ($1.1) ($0.4) ($0.1) ($0.0) $0.0 $0.0 $0.0 $0.0 $0.0 $0.0 $0.0 Depreciation (US$M) - ($10.6) ($22.5) ($34.5) ($34.4) ($43.8) ($35.0) ($30.1) ($23.6) ($30.1) ($23.8) ($21.1) ($16.6) ($10.3) ($2.6) ($0.7) Credit Stockpile Mining Cost (US$M) - $1.4 - ($0.5) - - ($1.0) - - - - - - - - - Environmental & Reclamation (US$M) - - - - - - - - ($0.3) ($0.3) ($1.9) ($5.6) ($6.4) ($5.5) ($3.7) ($1.3) EBT (US$M) - ($15.4) $147.8 $190.5 $183.8 $138.0 $81.1 $64.4 $41.3 $27.6 $10.8 $1.3 ($8.4) ($3.8) ($2.3) ($2.8) Nevada NPT (US$M) - - ($7.9) ($10.6) ($10.5) ($8.5) ($5.2) ($4.0) ($2.5) ($2.1) ($1.1) ($0.6) - - - - Federal Income Tax (US$M) - - ($4.3) ($30.5) ($29.9) ($22.7) ($12.5) ($9.5) ($5.7) ($4.9) ($2.7) ($1.5) - - - - Depreciation (US$M) - $10.6 $22.5 $34.5 $34.4 $43.8 $35.0 $30.1 $23.6 $30.1 $23.8 $21.1 $16.6 $10.3 $2.6 $0.7 Capital Expenses & Working Capital (US$M) ($167.4) ($4.4) ($10.8) ($30.2) ($6.4) ($64.5) ($2.0) $2.3 $2.0 ($26.4) $2.2 $2.1 $1.7 $1.3 $0.3 $0.1 Net Cash Flow After Tax (US$M) ($167.4) ($9.2) $147.2 $153.6 $171.4 $86.1 $96.4 $83.3 $58.6 $24.4 $33.0 $22.3 $9.9 $7.8 $0.6 ($2.0) NPV (US$M) $483
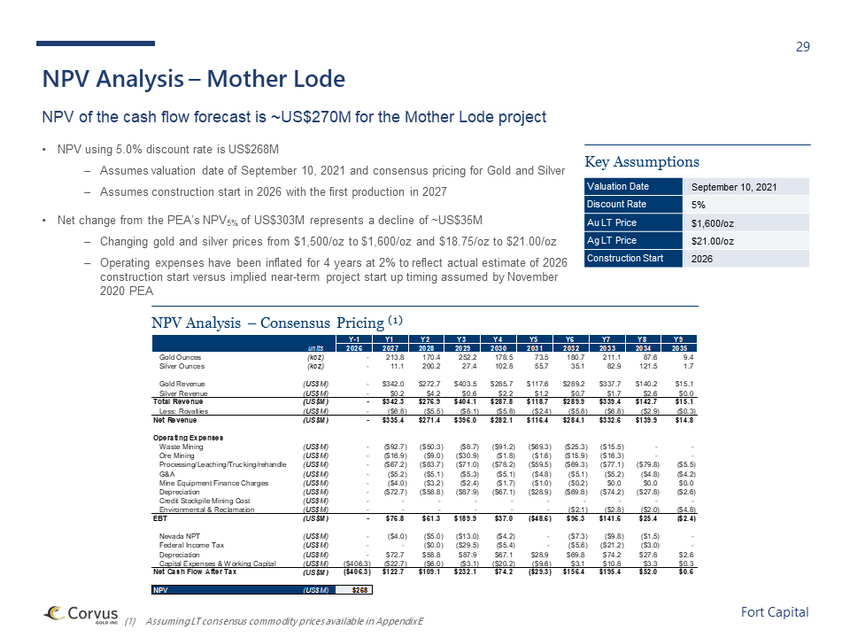
29 Fort Capital NPV Analysis – Mother Lode NPV of the cash flow forecast is ~US$270M for the Mother Lode project • NPV using 5.0% discount rate is US$268M ‒ Assumes valuation date of September 10, 2021 and consensus pricing for Gold and Silver ‒ Assumes construction start in 2026 with the first production in 2027 • Net change from the PEA’s NPV 5% of US$303M represents a decline of ~US$35M ‒ Changing gold and silver prices from $1,500/oz to $1,600/oz and $18.75/oz to $21.00/oz ‒ Operating expenses have been inflated for 4 years at 2% to reflect actual estimate of 2026 construction start versus implied near - term project start up timing assumed by November 2020 PEA (1) Assuming LT consensus commodity prices available in Appendix E NPV Analysis – Consensus Pricing (1) Key Assumptions Valuation Date September 10, 2021 Discount Rate 5% Au LT Price $1,600/oz Ag LT Price $21.00/oz Construction Start 2026 Y-1 Y1 Y2 Y3 Y4 Y5 Y6 Y7 Y8 Y9 units 2026 2027 2028 2029 2030 2031 2032 2033 2034 2035 Gold Ounces (koz) - 213.8 170.4 252.2 178.5 73.5 180.7 211.1 87.6 9.4 Silver Ounces (koz) - 11.1 200.2 27.4 102.8 55.7 35.1 82.9 121.5 1.7 Gold Revenue (US$M) - $342.0 $272.7 $403.5 $285.7 $117.6 $289.2 $337.7 $140.2 $15.1 Silver Revenue (US$M) - $0.2 $4.2 $0.6 $2.2 $1.2 $0.7 $1.7 $2.6 $0.0 Total Revenue (US$M) - $342.3 $276.9 $404.1 $287.8 $118.7 $289.9 $339.4 $142.7 $15.1 Less: Royalties (US$M) - ($6.8) ($5.5) ($8.1) ($5.8) ($2.4) ($5.8) ($6.8) ($2.9) ($0.3) Net Revenue (US$M) - $335.4 $271.4 $396.0 $282.1 $116.4 $284.1 $332.6 $139.9 $14.8 Operating Expenses Waste Mining (US$M) - ($92.7) ($50.3) ($8.7) ($91.2) ($69.3) ($25.3) ($15.5) - - Ore Mining (US$M) - ($16.9) ($9.0) ($30.9) ($1.8) ($1.6) ($15.9) ($16.3) - - Processing/Leaching/Trucking/rehandle (US$M) - ($67.2) ($83.7) ($71.0) ($78.2) ($59.5) ($69.3) ($77.1) ($79.8) ($5.5) G&A (US$M) - ($5.2) ($5.1) ($5.3) ($5.1) ($4.8) ($5.1) ($5.2) ($4.8) ($4.2) Mine Equipment Finance Charges (US$M) - ($4.0) ($3.2) ($2.4) ($1.7) ($1.0) ($0.2) $0.0 $0.0 $0.0 Depreciation (US$M) - ($72.7) ($58.8) ($87.9) ($67.1) ($28.9) ($69.8) ($74.2) ($27.8) ($2.6) Credit Stockpile Mining Cost (US$M) - - - - - - - - - - Environmental & Reclamation (US$M) - - - - - - ($2.1) ($2.8) ($2.0) ($4.8) EBT (US$M) - $76.8 $61.3 $189.9 $37.0 ($48.6) $96.3 $141.6 $25.4 ($2.4) Nevada NPT (US$M) - ($4.0) ($5.0) ($13.0) ($4.2) - ($7.3) ($9.8) ($1.5) - Federal Income Tax (US$M) - - ($0.0) ($29.5) ($5.4) - ($5.6) ($21.2) ($3.0) - Depreciation (US$M) - $72.7 $58.8 $87.9 $67.1 $28.9 $69.8 $74.2 $27.8 $2.6 Capital Expenses & Working Capital (US$M) ($406.3) ($22.7) ($6.0) ($3.1) ($20.2) ($9.6) $3.1 $10.8 $3.3 $0.3 Net Cash Flow After Tax (US$M) ($406.3) $122.7 $109.1 $232.1 $74.2 ($29.3) $156.4 $195.4 $52.0 $0.6 NPV (US$M) $268
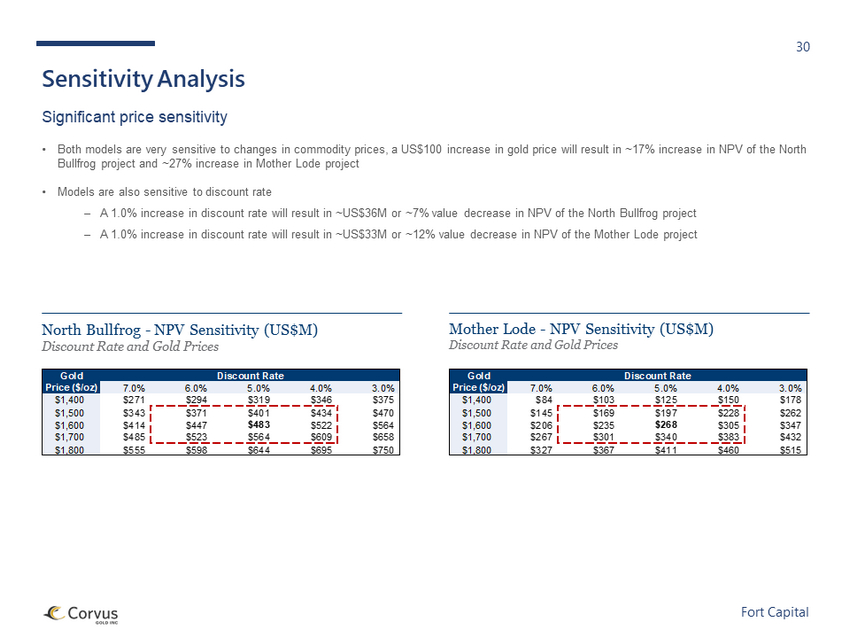
30 Fort Capital Sensitivity Analysis Significant price sensitivity • Both models are very sensitive to changes in commodity prices, a US$100 increase in gold price will result in ~17% increase i n N PV of the North Bullfrog project and ~27% increase in Mother Lode project • Models are also sensitive to discount rate ‒ A 1.0% increase in discount rate will result in ~US$36M or ~7% value decrease in NPV of the North Bullfrog project ‒ A 1.0% increase in discount rate will result in ~US$33M or ~12% value decrease in NPV of the Mother Lode project North Bullfrog - NPV Sensitivity (US$M) Discount Rate and Gold Prices Mother Lode - NPV Sensitivity (US$M) Discount Rate and Gold Prices Gold Discount Rate Price ($/oz) 7.0% 6.0% 5.0% 4.0% 3.0% $1,400 $84 $103 $125 $150 $178 $1,500 $145 $169 $197 $228 $262 $1,600 $206 $235 $268 $305 $347 $1,700 $267 $301 $340 $383 $432 $1,800 $327 $367 $411 $460 $515 Gold Discount Rate Price ($/oz) 7.0% 6.0% 5.0% 4.0% 3.0% $1,400 $271 $294 $319 $346 $375 $1,500 $343 $371 $401 $434 $470 $1,600 $414 $447 $483 $522 $564 $1,700 $485 $523 $564 $609 $658 $1,800 $555 $598 $644 $695 $750
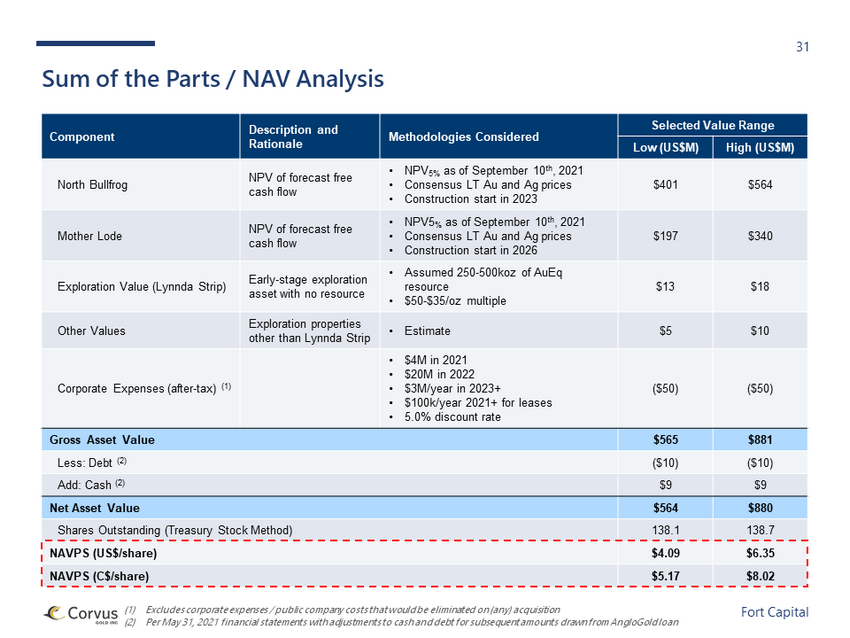
31 Fort Capital (1) Excludes corporate expenses / public company costs that would be eliminated on (any) acquisition (2) Per May 31, 2021 financial statements with adjustments to cash and debt for subsequent amounts drawn from AngloGold loan Sum of the Parts / NAV Analysis Component Description and Rationale Methodologies Considered Selected Value Range Low (US$M) High (US$M) North Bullfrog NPV of forecast free cash flow • NPV 5% as of September 10 th , 2021 • Consensus LT Au and Ag prices • Construction start in 2023 $401 $564 Mother Lode NPV of forecast free cash flow • NPV5 % as of September 10 th , 2021 • Consensus LT Au and Ag prices • Construction start in 2026 $197 $340 Exploration Value (Lynnda Strip) Early - stage exploration asset with no resource • Assumed 250 - 500koz of AuEq resource • $50 - $35/oz multiple $13 $18 Other Values Exploration properties other than Lynnda Strip • Estimate $5 $10 Corporate Expenses (after - tax) (1) • $4M in 2021 • $20M in 2022 • $3M/year in 2023+ • $100k/year 2021+ for leases • 5.0% discount rate ($50) ($50) Gross Asset Value $565 $881 Less: Debt (2) ($10) ($10) Add: Cash (2) $9 $9 Net Asset Value $564 $880 Shares Outstanding (Treasury Stock Method) 138.1 138.7 NAVPS (US$/share) $4.09 $6.35 NAVPS (C$/share) $5.17 $8.02
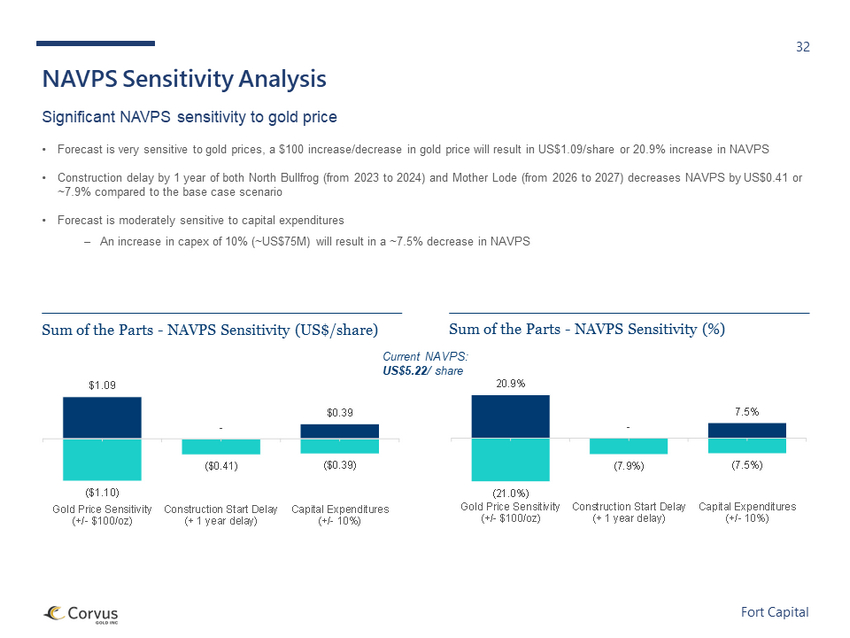
32 Fort Capital NAVPS Sensitivity Analysis Significant NAVPS sensitivity to gold price • Forecast is very sensitive to gold prices, a $100 increase/decrease in gold price will result in US$1.09/share or 20.9% incre ase in NAVPS • Construction delay by 1 year of both North Bullfrog (from 2023 to 2024) and Mother Lode (from 2026 to 2027) decreases NAVPS b y U S$0.41 or ~7.9% compared to the base case scenario • Forecast is moderately sensitive to capital expenditures ‒ An increase in capex of 10% (~US$75M) will result in a ~7.5% decrease in NAVPS Sum of the Parts - NAVPS Sensitivity (US$/share) Sum of the Parts - NAVPS Sensitivity (%) Current NAVPS: US$5.22 / share $1.09 - $0.39 ($1.10) ($0.41) ($0.39) Gold Price Sensitivity (+/- $100/oz) Construction Start Delay (+ 1 year delay) Capital Expenditures (+/- 10%) 20.9% - 7.5% (21.0%) (7.9%) (7.5%) Gold Price Sensitivity (+/- $100/oz) Construction Start Delay (+ 1 year delay) Capital Expenditures (+/- 10%)
33 Fort Capital Risk Profile Analysis NAV Multiples • While industry standard is to use a standard NPV5% to allow for comparison of cash flows from projects, it does not necessari ly reflect the associated risks of any specific project or company • This is primarily the rationale that most developers trade at a significant discount (0.4x - 0.7x) to their underlying NAV, to ref lect the risk of developing, permitting and constructing the mine. These discounts can encapsulate multiple risk factors: ‒ Mine / project location (e.g. mine friendly jurisdictions versus politically unstable countries) ‒ Stage of project and expected time to completion (PEA, PFS, FS) ‒ Ease of permitting ‒ Type of ore body and associated processing technology, including relative capex intensity ‒ Potential for additional exploration upside • In considering the North Bullfrog project, we see a stable jurisdiction, straightforward timeline, permitting and processing (st andard heap leach operation in Nevada for oxide ore), along with modest exploration upside (based on discussions with management), which would lea d us towards the higher end of the range of NAV multiples (0.6x - 0.7x) • In considering the Mother Lode project, while in a similar jurisdiction, faces more difficult permitting, including the need for a layback agreement with Coeur Mining, more difficult and expensive processing for the sulphide ores (use of BiOx technology) and limited explora tio n upside due to land constraints (surrounded by Coeur claims). As a result, we would apply a lower multiple against the Mother Lode project of 0.35x - 0.45x • We have then compared the selected NAV multiples and implied IRRs against the developed cost of capital for each mine to test fo r reasonableness
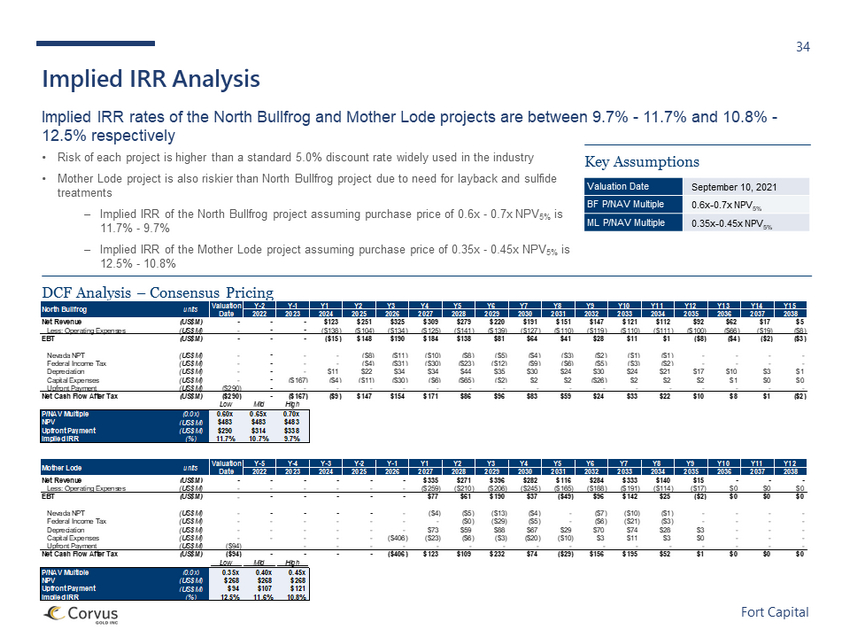
34 Fort Capital Implied IRR Analysis Implied IRR rates of the North Bullfrog and Mother Lode projects are between 9.7% - 11.7% and 10.8% - 12.5% respectively • Risk of each project is higher than a standard 5.0% discount rate widely used in the industry • Mother Lode project is also riskier than North Bullfrog project due to need for layback and sulfide treatments ‒ Implied IRR of the North Bullfrog project assuming purchase price of 0.6x - 0.7x NPV 5% is 11.7% - 9.7% ‒ Implied IRR of the Mother Lode project assuming purchase price of 0.35x - 0.45x NPV 5% is 12.5% - 10.8% DCF Analysis – Consensus Pricing Key Assumptions Valuation Date September 10, 2021 BF P/NAV Multiple 0.6x - 0.7x NPV 5% ML P/NAV Multiple 0.35x - 0.45x NPV 5% Valuation Y-2 Y-1 Y1 Y2 Y3 Y4 Y5 Y6 Y7 Y8 Y9 Y10 Y11 Y12 Y13 Y14 Y15 Date 2022 2023 2024 2025 2026 2027 2028 2029 2030 2031 2032 2033 2034 2035 2036 2037 2038 Net Revenue (US$M) - - - $123 $251 $325 $309 $279 $220 $191 $151 $147 $121 $112 $92 $62 $17 $5 Less: Operating Expenses (US$M) - - - ($138) ($104) ($134) ($125) ($141) ($139) ($127) ($110) ($119) ($110) ($111) ($100) ($66) ($19) ($8) EBT (US$M) - - - ($15) $148 $190 $184 $138 $81 $64 $41 $28 $11 $1 ($8) ($4) ($2) ($3) Nevada NPT (US$M) - - - - ($8) ($11) ($10) ($8) ($5) ($4) ($3) ($2) ($1) ($1) - - - - Federal Income Tax (US$M) - - - - ($4) ($31) ($30) ($23) ($12) ($9) ($6) ($5) ($3) ($2) - - - - Depreciation (US$M) - - - $11 $22 $34 $34 $44 $35 $30 $24 $30 $24 $21 $17 $10 $3 $1 Capital Expenses (US$M) - - ($167) ($4) ($11) ($30) ($6) ($65) ($2) $2 $2 ($26) $2 $2 $2 $1 $0 $0 Upfront Payment (US$M) ($290) - - - - - - - - - - - - - - - - - Net Cash Flow After Tax (US$M) ($290) - ($167) ($9) $147 $154 $171 $86 $96 $83 $59 $24 $33 $22 $10 $8 $1 ($2) Low Mid High P/NAV Multiple (0.0x) 0.60x 0.65x 0.70x NPV (US$M) $483 $483 $483 Upfront Payment (US$M) $290 $314 $338 Implied IRR (%) 11.7% 10.7% 9.7% Valuation Y-5 Y-4 Y-3 Y-2 Y-1 Y1 Y2 Y3 Y4 Y5 Y6 Y7 Y8 Y9 Y10 Y11 Y12 Date 2022 2023 2024 2025 2026 2027 2028 2029 2030 2031 2032 2033 2034 2035 2036 2037 2038 Net Revenue (US$M) - - - - - - $335 $271 $396 $282 $116 $284 $333 $140 $15 - - - Less: Operating Expenses (US$M) - - - - - - ($259) ($210) ($206) ($245) ($165) ($188) ($191) ($114) ($17) $0 $0 $0 EBT (US$M) - - - - - - $77 $61 $190 $37 ($49) $96 $142 $25 ($2) $0 $0 $0 Nevada NPT (US$M) - - - - - - ($4) ($5) ($13) ($4) - ($7) ($10) ($1) - - - - Federal Income Tax (US$M) - - - - - - - ($0) ($29) ($5) - ($6) ($21) ($3) - - - - Depreciation (US$M) - - - - - - $73 $59 $88 $67 $29 $70 $74 $28 $3 - - - Capital Expenses (US$M) - - - - - ($406) ($23) ($6) ($3) ($20) ($10) $3 $11 $3 $0 - - - Upfront Payment (US$M) ($94) - - - - - - - - - - - - - - - - Net Cash Flow After Tax (US$M) ($94) - - - - ($406) $123 $109 $232 $74 ($29) $156 $195 $52 $1 $0 $0 $0 Low Mid High P/NAV Multiple (0.0x) 0.35x 0.40x 0.45x NPV (US$M) $268 $268 $268 Upfront Payment (US$M) $94 $107 $121 Implied IRR (%) 12.5% 11.6% 10.8% Mother Lode units North Bullfrog units
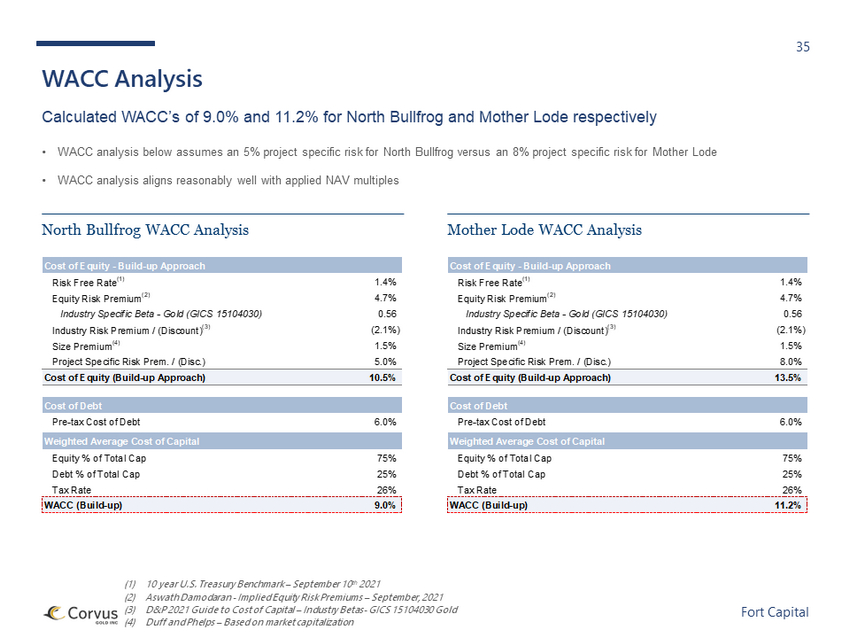
35 Fort Capital WACC Analysis Calculated WACC’s of 9.0% and 11.2% for North Bullfrog and Mother Lode respectively • WACC analysis below assumes an 5% project specific risk for North Bullfrog versus an 8% project specific risk for Mother Lode • WACC analysis aligns reasonably well with applied NAV multiples (1) 10 year U.S. Treasury Benchmark – September 10 th 2021 (2) Aswath Damodaran - Implied Equity Risk Premiums – September, 2021 (3) D&P 2021 Guide to Cost of Capital – Industry Betas - GICS 15104030 Gold (4) Duff and Phelps – Based on market capitalization North Bullfrog WACC Analysis Mother Lode WACC Analysis Cost of Debt Pre-tax Cost of Debt 6.0% Weighted Average Cost of Capital Equity % of Total Cap 75% Debt % of Total Cap 25% Tax Rate 26% WACC (Build-up) 11.2% Cost of Equity - Build-up Approach Risk Free Rate (1) 1.4% Equity Risk Premium (2) 4.7% Industry Specific Beta - Gold (GICS 15104030) 0.56 Industry Risk Premium / (Discount) (3) (2.1%) Size Premium (4) 1.5% Project Specific Risk Prem. / (Disc.) 8.0% Cost of Equity (Build-up Approach) 13.5% Cost of Equity - Build-up Approach Risk Free Rate (1) 1.4% Equity Risk Premium (2) 4.7% Industry Specific Beta - Gold (GICS 15104030) 0.56 Industry Risk Premium / (Discount) (3) (2.1%) Size Premium (4) 1.5% Project Specific Risk Prem. / (Disc.) 5.0% Cost of Equity (Build-up Approach) 10.5% Cost of Debt Pre-tax Cost of Debt 6.0% Weighted Average Cost of Capital Equity % of Total Cap 75% Debt % of Total Cap 25% Tax Rate 26% WACC (Build-up) 9.0%
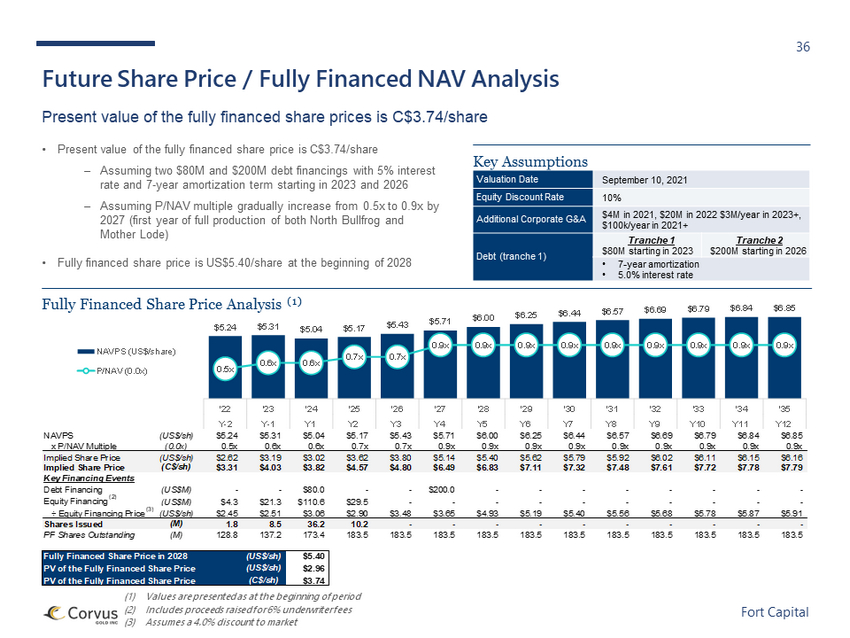
36 Fort Capital Y-2 Y-1 Y1 Y2 Y3 Y4 Y5 Y6 Y7 Y8 Y9 Y10 Y11 Y12 '22 '23 '24 '25 '26 '27 '28 '29 '30 '31 '32 '33 '34 '35 NAVPS (US$/sh) $5.24 $5.31 $5.04 $5.17 $5.43 $5.71 $6.00 $6.25 $6.44 $6.57 $6.69 $6.79 $6.84 $6.85 x P/NAV Multiple (0.0x) 0.5x 0.6x 0.6x 0.7x 0.7x 0.9x 0.9x 0.9x 0.9x 0.9x 0.9x 0.9x 0.9x 0.9x Implied Share Price (US$/sh) $2.62 $3.19 $3.02 $3.62 $3.80 $5.14 $5.40 $5.62 $5.79 $5.92 $6.02 $6.11 $6.15 $6.16 Implied Share Price (C$/sh) $3.31 $4.03 $3.82 $4.57 $4.80 $6.49 $6.83 $7.11 $7.32 $7.48 $7.61 $7.72 $7.78 $7.79 Key Financing Events Debt Financing (US$M) - - $80.0 - - $200.0 - - - - - - - - Equity Financing (2) (US$M) $4.3 $21.3 $110.6 $29.5 - - - - - - - - - - ÷ Equity Financing Price (3) (US$/sh) $2.45 $2.51 $3.06 $2.90 $3.48 $3.65 $4.93 $5.19 $5.40 $5.56 $5.68 $5.78 $5.87 $5.91 Shares Issued (M) 1.8 8.5 36.2 10.2 - - - - - - - - - - PF Shares Outstanding (M) 128.8 137.2 173.4 183.5 183.5 183.5 183.5 183.5 183.5 183.5 183.5 183.5 183.5 183.5 Fully Financed Share Price in 2028 (US$/sh) $5.40 PV of the Fully Financed Share Price (US$/sh) $2.96 PV of the Fully Financed Share Price (C$/sh) $3.74 $5.24 $5.31 $5.04 $5.17 $5.43 $5.71 $6.00 $6.25 $6.44 $6.57 $6.69 $6.79 $6.84 $6.85 0.5x 0.6x 0.6x 0.7x 0.7x 0.9x 0.9x 0.9x 0.9x 0.9x 0.9x 0.9x 0.9x 0.9x '22 '23 '24 '25 '26 '27 '28 '29 '30 '31 '32 '33 '34 '35 Y-2 Y-1 Y1 Y2 Y3 Y4 Y5 Y6 Y7 Y8 Y9 Y10 Y11 Y12 NAVPS (US$/share) P/NAV (0.0x) Future Share Price / Fully Financed NAV Analysis Present value of the fully financed share prices is C$3.74/share • Present value of the fully financed share price is C$3.74/share ‒ Assuming two $80M and $200M debt financings with 5% interest rate and 7 - year amortization term starting in 2023 and 2026 ‒ Assuming P/NAV multiple gradually increase from 0.5x to 0.9x by 2027 (first year of full production of both North Bullfrog and Mother Lode) • Fully financed share price is US$5.40/share at the beginning of 2028 (1) Values are presented as at the beginning of period (2) Includes proceeds raised for 6% underwriter fees (3) Assumes a 4.0% discount to market Key Assumptions Valuation Date September 10, 2021 Equity Discount Rate 10% Additional Corporate G&A $4M in 2021, $20M in 2022 $3M/year in 2023+, $100k/year in 2021+ Debt (tranche 1) Tranche 1 $80M starting in 2023 Tranche 2 $200M starting in 2026 • 7 - year amortization • 5.0% interest rate Fully Financed Share Price Analysis (1)
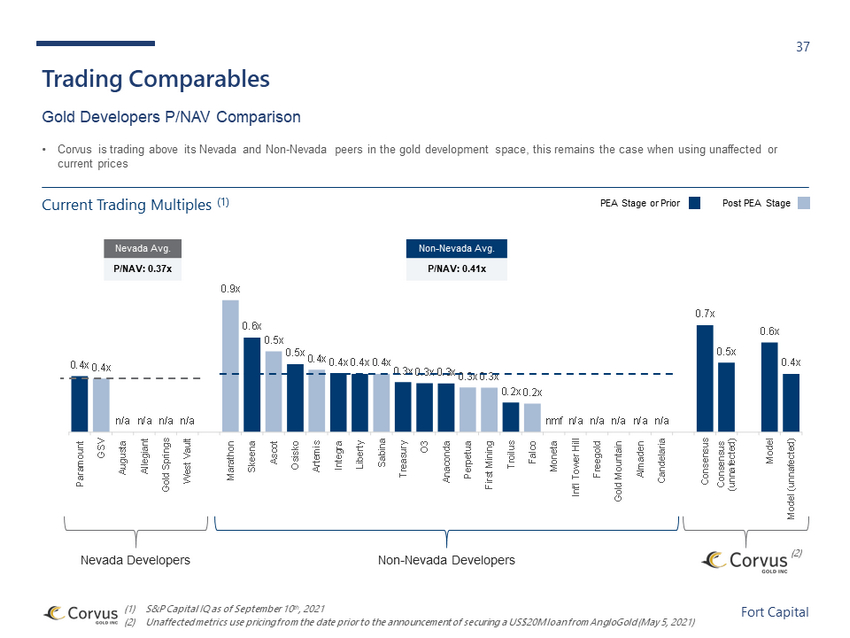
37 Fort Capital 0.4x 0.4x n/a n/a n/a n/a 0.9x 0.6x 0.5x 0.5x 0.4x 0.4x 0.4x 0.4x 0.3x 0.3x 0.3x 0.3x 0.3x 0.2x 0.2x nmf n/a n/a n/a n/a n/a 0.7x 0.5x 0.6x 0.4x Paramount GSV Augusta Allegiant Gold Springs West Vault Marathon Skeena Ascot Osisko Artemis Integra Liberty Sabina Treasury O3 Anaconda Perpetua First Mining Troilus Falco Moneta Int'l Tower Hill Freegold Gold Mountain Almaden Candelaria Consensus Consensus (unnafected) Model Model (unnafected) (1) S&P Capital IQ as of September 10 th , 2021 (2) U naffected metrics use pricing from the date prior to the announcement of securing a US$20M loan from AngloGold (May 5, 2021) Trading Comparables Gold Developers P/NAV Comparison Nevada Developers Non - Nevada Developers Nevada Avg. P/NAV: 0.37x Non - Nevada Avg. P/NAV: 0.41x • Corvus is trading above its Nevada and Non - Nevada peers in the gold development space, this remains the case when using unaffect ed or current prices Current Trading Multiples (1) (2) PEA Stage or Prior Post PEA Stage
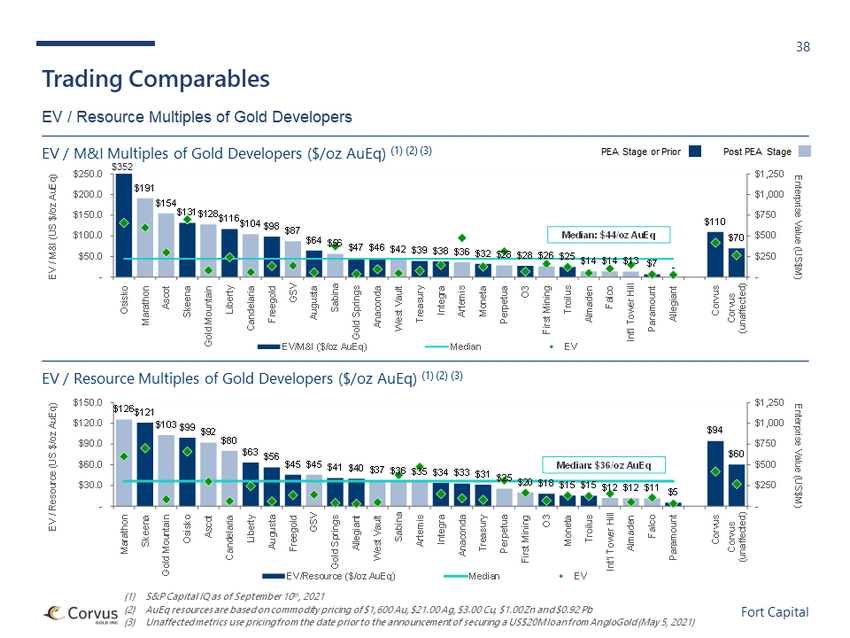
38 Fort Capital (1) S&P Capital IQ as of September 10 th , 2021 (2) AuEq resources are based on commodity pricing of $1,600 Au, $21.00 Ag, $3.00 Cu, $1.00 Zn and $0.92 Pb (3) Unaffected metrics use pricing from the date prior to the announcement of securing a US$20M loan from AngloGold (May 5, 2021) Trading Comparables EV / Resource Multiples of Gold Developers EV / M&I Multiples of Gold Developers ($/oz AuEq) (1) (2) (3) EV / Resource Multiples of Gold Developers ($/oz AuEq) (1) (2) (3) $352 PEA Stage or Prior Post PEA Stage $126 $121 $103 $99 $92 $80 $63 $56 $45 $45 $41 $40 $37 $36 $35 $34 $33 $31 $25 $20 $18 $15 $15 $12 $12 $11 $5 $94 $60 - $250 $500 $750 $1,000 $1,250 - $30.0 $60.0 $90.0 $120.0 $150.0 Marathon Skeena Gold Mountain Osisko Ascot Candelaria Liberty Augusta Freegold GSV Gold Springs Allegiant West Vault Sabina Artemis Integra Anaconda Treasury Perpetua First Mining O3 Moneta Troilus Int'l Tower Hill Almaden Falco Paramount Corvus Corvus (unaffected) Enterprise Value (US$M) EV / Resource (US $/oz AuEq) EV/Resource ($/oz AuEq) Median EV Median: $36 /oz AuEq $191 $154 $131 $128 $116 $104 $98 $87 $64 $56 $47 $46 $42 $39 $38 $36 $32 $28 $28 $26 $25 $14 $14 $13 $7 - $110 $70 - $250 $500 $750 $1,000 $1,250 - $50.0 $100.0 $150.0 $200.0 $250.0 Osisko Marathon Ascot Skeena Gold Mountain Liberty Candelaria Freegold GSV Augusta Sabina Gold Springs Anaconda West Vault Treasury Integra Artemis Moneta Perpetua O3 First Mining Troilus Almaden Falco Int'l Tower Hill Paramount Allegiant Corvus Corvus (unaffected) Enterprise Value (US$M) EV / M&I (US $/oz AuEq) EV/M&I ($/oz AuEq) Median EV Median: $44 /oz AuEq
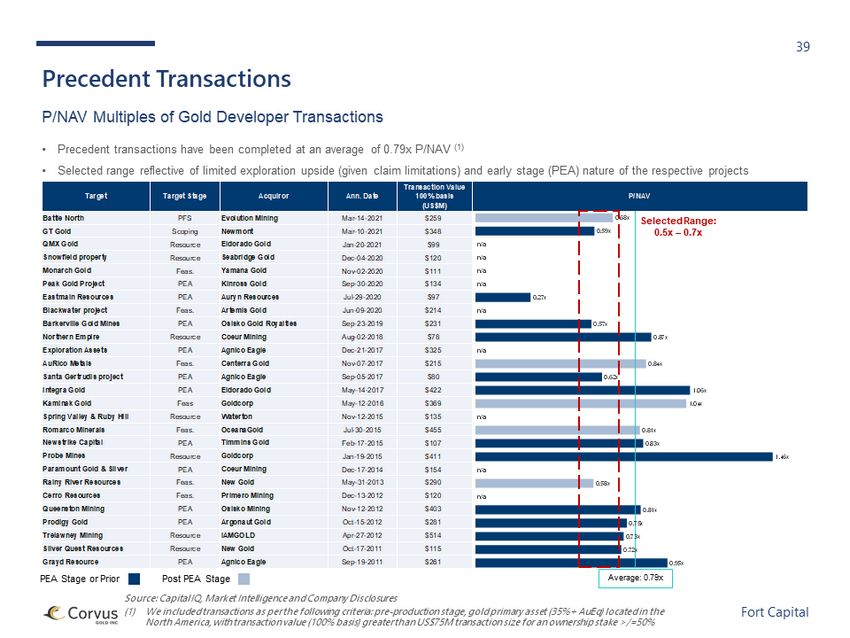
39 Fort Capital Target Target Stage Acquiror Ann. Date Transaction Value 100% basis (US$M) P/NAV Battle North PFS Evolution Mining Mar-14-2021 $259 GT Gold Scoping Newmont Mar-10-2021 $348 QMX Gold Resource Eldorado Gold Jan-20-2021 $99 Snowfield property Resource Seabridge Gold Dec-04-2020 $120 Monarch Gold Feas. Yamana Gold Nov-02-2020 $111 Peak Gold Project PEA Kinross Gold Sep-30-2020 $134 Eastmain Resources PEA Auryn Resources Jul-29-2020 $97 Blackwater project Feas. Artemis Gold Jun-09-2020 $214 Barkerville Gold Mines PEA Osisko Gold Royalties Sep-23-2019 $231 Northern Empire Resource Coeur Mining Aug-02-2018 $78 Exploration Assets PEA Agnico Eagle Dec-21-2017 $325 AuRico Metals Feas. Centerra Gold Nov-07-2017 $215 Santa Gertrudis project PEA Agnico Eagle Sep-05-2017 $80 Integra Gold PEA Eldorado Gold May-14-2017 $422 Kaminak Gold Feas Goldcorp May-12-2016 $369 Spring Valley & Ruby Hill Resource Waterton Nov-12-2015 $135 Romarco Minerals Feas. OceanaGold Jul-30-2015 $455 Newstrike Capital PEA Timmins Gold Feb-17-2015 $107 Probe Mines Resource Goldcorp Jan-19-2015 $411 Paramount Gold & Silver PEA Coeur Mining Dec-17-2014 $154 Rainy River Resources Feas. New Gold May-31-2013 $290 Cerro Resources Feas. Primero Mining Dec-13-2012 $120 Queenston Mining PEA Osisko Mining Nov-12-2012 $403 Prodigy Gold PEA Argonaut Gold Oct-15-2012 $281 Trelawney Mining Resource IAMGOLD Apr-27-2012 $514 Silver Quest Resources Resource New Gold Oct-17-2011 $115 Grayd Resource PEA Agnico Eagle Sep-19-2011 $261 0.68x 0.59x n/a n/a n/a n/a 0.27x n/a 0.57x 0.87x n/a 0.84x 0.62x 1.06x 1.04x n/a 0.81x 0.83x 1.46x n/a 0.58x n/a 0.81x 0.75x 0.73x 0.72x 0.95x Precedent Transactions P/NAV Multiples of Gold Developer Transactions • Precedent transactions have been completed at an average of 0.79x P/NAV (1) • Selected range reflective of limited exploration upside (given claim limitations) and early stage (PEA) nature of the respect ive projects Source: Capital IQ, Market Intelligence and Company Disclosures (1) We included transactions as per the following criteria: pre - production stage, gold primary asset (35%+ AuEq) located in the North America, with transaction value (100% basis) greater than US$75M transaction size for an ownership stake >/=50% Selected Range: 0.5x – 0.7x Average: 0.79x PEA Stage or Prior Post PEA Stage
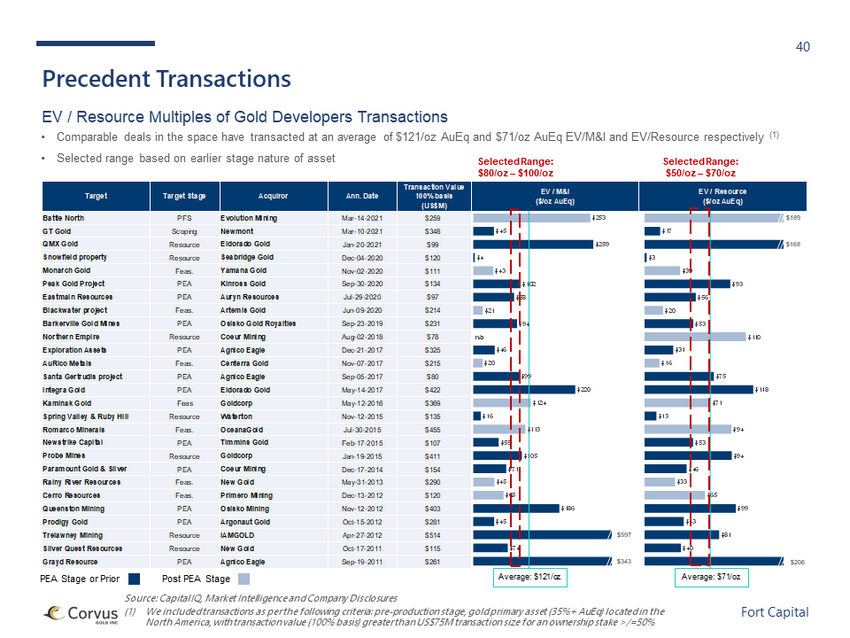
40 Fort Capital Target Target Stage Acquiror Ann. Date Transaction Value 100% basis (US$M) EV / M&I ($/oz AuEq) EV / Resource ($/oz AuEq) Battle North PFS Evolution Mining Mar-14-2021 $259 GT Gold Scoping Newmont Mar-10-2021 $348 QMX Gold Resource Eldorado Gold Jan-20-2021 $99 Snowfield property Resource Seabridge Gold Dec-04-2020 $120 Monarch Gold Feas. Yamana Gold Nov-02-2020 $111 Peak Gold Project PEA Kinross Gold Sep-30-2020 $134 Eastmain Resources PEA Auryn Resources Jul-29-2020 $97 Blackwater project Feas. Artemis Gold Jun-09-2020 $214 Barkerville Gold Mines PEA Osisko Gold Royalties Sep-23-2019 $231 Northern Empire Resource Coeur Mining Aug-02-2018 $78 Exploration Assets PEA Agnico Eagle Dec-21-2017 $325 AuRico Metals Feas. Centerra Gold Nov-07-2017 $215 Santa Gertrudis project PEA Agnico Eagle Sep-05-2017 $80 Integra Gold PEA Eldorado Gold May-14-2017 $422 Kaminak Gold Feas Goldcorp May-12-2016 $369 Spring Valley & Ruby Hill Resource Waterton Nov-12-2015 $135 Romarco Minerals Feas. OceanaGold Jul-30-2015 $455 Newstrike Capital PEA Timmins Gold Feb-17-2015 $107 Probe Mines Resource Goldcorp Jan-19-2015 $411 Paramount Gold & Silver PEA Coeur Mining Dec-17-2014 $154 Rainy River Resources Feas. New Gold May-31-2013 $290 Cerro Resources Feas. Primero Mining Dec-13-2012 $120 Queenston Mining PEA Osisko Mining Nov-12-2012 $403 Prodigy Gold PEA Argonaut Gold Oct-15-2012 $281 Trelawney Mining Resource IAMGOLD Apr-27-2012 $514 Silver Quest Resources Resource New Gold Oct-17-2011 $115 Grayd Resource PEA Agnico Eagle Sep-19-2011 $261 $17 $3 $39 $93 $56 $20 $53 $110 $31 $16 $75 $118 $71 $13 $94 $53 $94 $46 $33 $65 $99 $43 $81 $40 $253 $45 $259 $4 $43 $102 $88 $21 $94 n/a $46 $20 $99 $220 $124 $16 $113 $55 $105 $71 $45 $65 $186 $45 $74 Precedent Transactions EV / Resource Multiples of Gold Developers Transactions • Comparable deals in the space have transacted at an average of $121/oz AuEq and $71/oz AuEq EV/M&I and EV/Resource respective ly (1) • Selected range based on earlier stage nature of asset Average: $121/oz Average: $71/oz Source: Capital IQ, Market Intelligence and Company Disclosures (1) We included transactions as per the following criteria: pre - production stage, gold primary asset (35%+ AuEq) located in the North America, with transaction value (100% basis) greater than US$75M transaction size for an ownership stake >/=50% Selected Range: $80/oz – $100/oz Selected Range: $50/oz – $70/oz $597 $343 $206 PEA Stage or Prior Post PEA Stage $168 $189
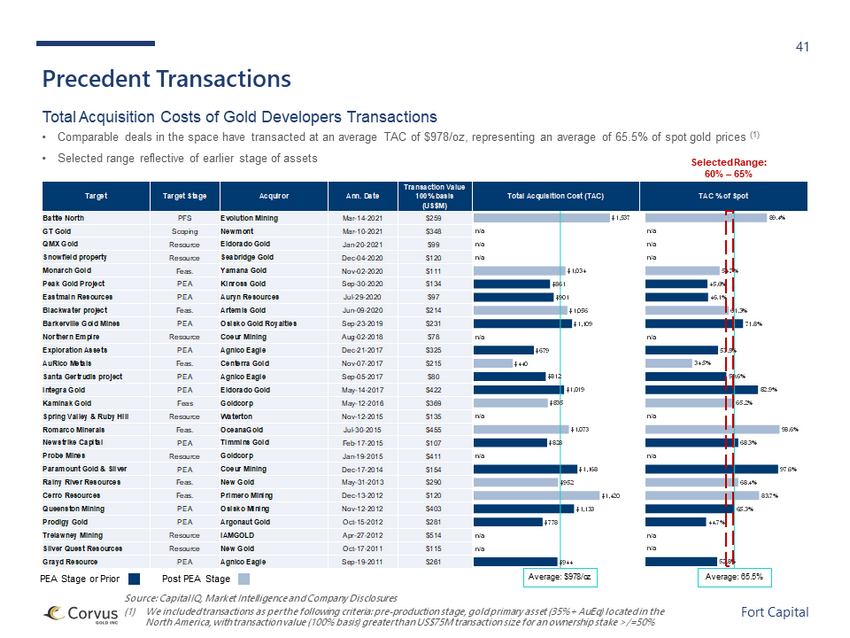
41 Fort Capital Average: 65.5% Target Target Stage Acquiror Ann. Date Transaction Value 100% basis (US$M) Total Acquisition Cost (TAC) TAC % of Spot Total Acquisition Cost (TAC) Battle North PFS Evolution Mining Mar-14-2021 $259 GT Gold Scoping Newmont Mar-10-2021 $348 QMX Gold Resource Eldorado Gold Jan-20-2021 $99 Snowfield property Resource Seabridge Gold Dec-04-2020 $120 Monarch Gold Feas. Yamana Gold Nov-02-2020 $111 Peak Gold Project PEA Kinross Gold Sep-30-2020 $134 Eastmain Resources PEA Auryn Resources Jul-29-2020 $97 Blackwater project Feas. Artemis Gold Jun-09-2020 $214 Barkerville Gold Mines PEA Osisko Gold Royalties Sep-23-2019 $231 Northern Empire Resource Coeur Mining Aug-02-2018 $78 Exploration Assets PEA Agnico Eagle Dec-21-2017 $325 AuRico Metals Feas. Centerra Gold Nov-07-2017 $215 Santa Gertrudis project PEA Agnico Eagle Sep-05-2017 $80 Integra Gold PEA Eldorado Gold May-14-2017 $422 Kaminak Gold Feas Goldcorp May-12-2016 $369 Spring Valley & Ruby Hill Resource Waterton Nov-12-2015 $135 Romarco Minerals Feas. OceanaGold Jul-30-2015 $455 Newstrike Capital PEA Timmins Gold Feb-17-2015 $107 Probe Mines Resource Goldcorp Jan-19-2015 $411 Paramount Gold & Silver PEA Coeur Mining Dec-17-2014 $154 Rainy River Resources Feas. New Gold May-31-2013 $290 Cerro Resources Feas. Primero Mining Dec-13-2012 $120 Queenston Mining PEA Osisko Mining Nov-12-2012 $403 Prodigy Gold PEA Argonaut Gold Oct-15-2012 $281 Trelawney Mining Resource IAMGOLD Apr-27-2012 $514 Silver Quest Resources Resource New Gold Oct-17-2011 $115 Grayd Resource PEA Agnico Eagle Sep-19-2011 $261 89.4% n/a n/a n/a 54.7% 45.6% 46.1% 61.3% 71.8% n/a 53.5% 34.5% 59.6% 82.9% 65.2% n/a 98.6% 68.3% n/a 97.6% 68.4% 83.7% 65.3% 44.7% n/a n/a 52.8% $1,537 n/a n/a n/a $1,034 $861 $901 $1,056 $1,109 n/a $679 $440 $812 $1,019 $835 n/a $1,073 $828 n/a $1,168 $952 $1,420 $1,133 $778 n/a n/a $944 Precedent Transactions Total Acquisition Costs of Gold Developers Transactions • Comparable deals in the space have transacted at an average TAC of $978/oz, representing an average of 65.5% of spot gold pri ces (1) • Selected range reflective of earlier stage of assets Average: $978/oz Source: Capital IQ, Market Intelligence and Company Disclosures (1) We included transactions as per the following criteria: pre - production stage, gold primary asset (35%+ AuEq) located in the North America, with transaction value (100% basis) greater than US$75M transaction size for an ownership stake >/=50% Selected Range: 60% – 65% PEA Stage or Prior Post PEA Stage
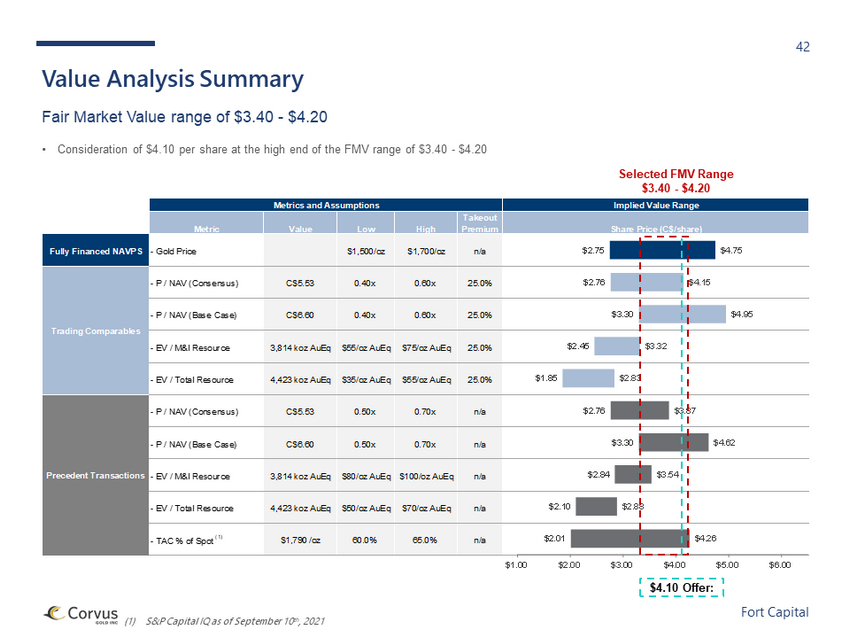
42 Fort Capital Metrics and Assumptions Implied Value Range Metric Value Low High Takeout Premium Share Price (C$/share) Fully Financed NAVPS - Gold Price $1,500/oz $1,700/oz n/a - P / NAV (Consensus) C$5.53 0.40x 0.60x 25.0% - P / NAV (Base Case) C$6.60 0.40x 0.60x 25.0% - EV / M&I Resource 3,814 koz AuEq $55/oz AuEq $75/oz AuEq 25.0% - EV / Total Resource 4,423 koz AuEq $35/oz AuEq $55/oz AuEq 25.0% - P / NAV (Consensus) C$5.53 0.50x 0.70x n/a - P / NAV (Base Case) C$6.60 0.50x 0.70x n/a - EV / M&I Resource 3,814 koz AuEq $80/oz AuEq $100/oz AuEq n/a - EV / Total Resource 4,423 koz AuEq $50/oz AuEq $70/oz AuEq n/a - TAC % of Spot (1) $1,790 /oz 60.0% 65.0% n/a Trading Comparables Precedent Transactions $2.75 $2.76 $3.30 $2.45 $1.85 $2.76 $3.30 $2.84 $2.10 $2.01 $4.75 $4.15 $4.95 $3.32 $2.83 $3.87 $4.62 $3.54 $2.88 $4.26 $1.00 $2.00 $3.00 $4.00 $5.00 $6.00 Value Analysis Summary Fair Market Value range of $3.40 - $4.20 • Consideration of $4.10 per share at the high end of the FMV range of $3.40 - $4.20 $4.10 Offer: Selected FMV Range $3.40 - $4.20 (1) S&P Capital IQ as of September 10 th , 2021
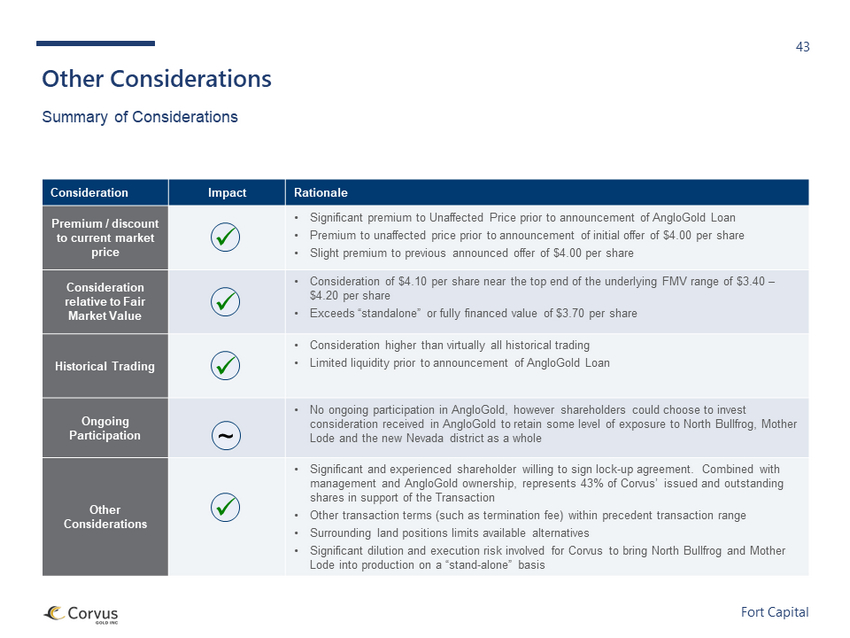
43 Fort Capital Other Considerations Summary of Considerations Consideration Impact Rationale Premium / discount to current market price • Significant premium to Unaffected Price prior to announcement of AngloGold Loan • Premium to unaffected price prior to announcement of initial offer of $4.00 per share • Slight premium to previous announced offer of $4.00 per share Consideration relative to Fair Market Value • Consideration of $4.10 per share near the top end of the underlying FMV range of $3.40 – $4.20 per share • Exceeds “standalone” or fully financed value of $3.70 per share Historical Trading • Consideration higher than virtually all historical trading • Limited liquidity prior to announcement of AngloGold Loan Ongoing Participation • No ongoing participation in AngloGold, however shareholders could choose to invest consideration received in AngloGold to retain some level of exposure to North Bullfrog, Mother Lode and the new Nevada district as a whole Other Considerations • Significant and experienced shareholder willing to sign lock - up agreement. Combined with management and AngloGold ownership, represents 43% of Corvus’ issued and outstanding shares in support of the Transaction • Other transaction terms (such as termination fee) within precedent transaction range • Surrounding land positions limits available alternatives • Significant dilution and execution risk involved for Corvus to bring North Bullfrog and Mother Lode into production on a “stand - alone” basis x x x ~ x
4. Summary and Conclusion
45 Fort Capital Valuation and Fairness Opinion Conclusion It is the opinion of Fort Capital Partners that, based upon the preceding analysis, assumptions, limitations and other relevant factors, the Fair Market Value range of the Corvus Shares is $3.40 to $4.20 per share and the Consideration to be received under the Transaction is within the Fair Market Value range. As the Consideration of $4.10 falls within the range of Fair Market Value, it is the opinion of Fort Capital Partners that, based upon the preceding analysis, assumptions, limitations and other relevant factors, the Consideration to be received under the Transaction is fair, from a financial point of view, to the shareholders of Corvus, excluding AngloGold If agreement with respect to a transaction is reached, Fort Capital would be in a position to deliver to the Special Committee its written Opinions for inclusion in a shareholders circular, based on the analysis contained in this presentation , and assumptions, limitations and other relevant factors we would set forth This presentation is highly confidential, and is not to be distributed to any parties other than as agreed by Fort Capital

Appendices
47 Fort Capital Appendix A: Completed Scope of Review In preparing the Valuation and Fairness Opinion, Fort Capital has, among other things, reviewed, considered and relied upon, without attempting to verify independently the completeness or accuracy thereof, the following: • draft of the Arrangement Agreement dated September 9, 2021 • draft of the Lock - up Agreements dated September 9, 2021 • non - binding proposal letter from AngloGold dated July 13, 2021 • loan agreement between Corvus and AngloGold dated May 6, 2021 • Technical Report ( NI 43 - 101 ) titled “Technical Report and Preliminary Economic Assessment for Gravity Milling and Heap Leach Processing at the North Bullfrog Project”, dated November 21, 2020 • Technical Report ( NI 43 - 101 ) titled “Technical Report and Preliminary Economic Assessment for Biox Mill and Heap Leach Processing at the Mother Lode Project”, dated November 21, 2020 • consolidated annual financial statements of the Company for the years ended May 31, 2021, 2020, 2019, and 2018, together with th e notes thereto and the auditors’ reports thereon; • management’s discussion and analysis of the results of operations and financial condition for the Company for the years ended Ma y 31, 2021, 2020, 2019 and 2018; • interim financial statements and associated management’s discussion and analysis documents for the period ending August 31, 2 020 , November 30, 2020 and February 28, 2021; • various material change reports and press releases as filed by the Company over the past 3 years; • certain publicly available information relating to the business, operations, financial condition and trading history of the C omp any and other selected public companies that we considered relevant;
48 Fort Capital Appendix A: Completed Scope of Review (Cont’d) • the trading history of the Company and other selected public companies we considered relevant; • public information with respect to precedent transactions we considered relevant; • certain internal financial, operating, corporate and other information prepared or provided by or on behalf of the Company re lat ing to the business, operations and financial condition of the Company; • internal management forecasts, projections, estimates and budgets prepared or provided by or on behalf of management of the C omp any; • various presentations prepared by management of the Company; • discussions with senior management of the Company relating to the current business, plans, financial conditions and prospects of the Company; • representations contained in separate certificates to be dated September 12, 2021 addressed to Fort Capital from senior manag eme nt of the Company as to the completeness, accuracy and fair presentation of the information upon which the Valuation and Fairness Opini on are based; • various research publications prepared by industry and equity research analysts regarding the Company, including other gold d eve loper entities we considered relevant; • discussions with legal counsel to the Company with respect to various legal matters relating to the Proposed Transaction and oth er matters considered relevant; and • such other information, investigations, analyses and discussion as we considered necessary or appropriate in the circumstance s. Fort Capital has not, to the best of its knowledge, been denied access by the Company to any information under the Company’s control requested by Fort Capital.
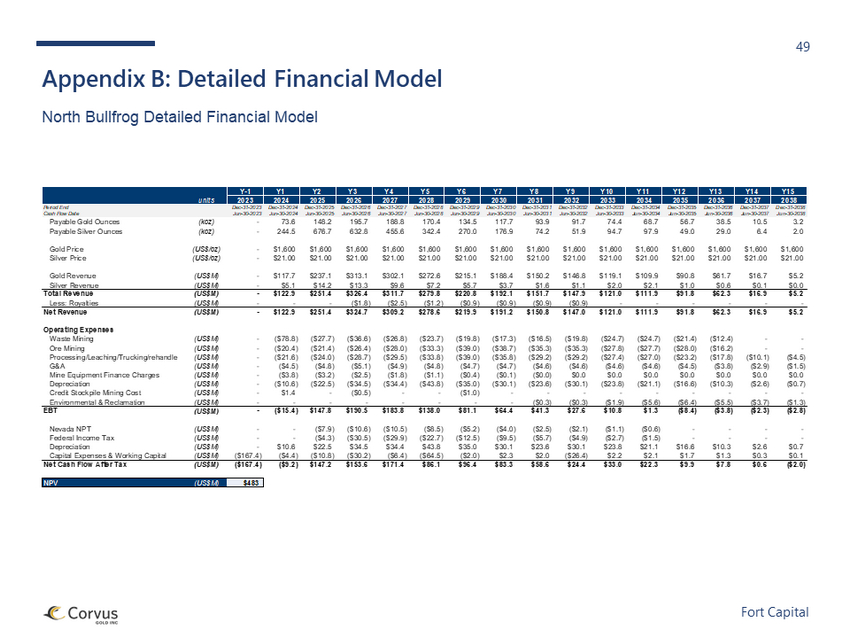
49 Fort Capital Appendix B: Detailed Financial Model North Bullfrog Detailed Financial Model Y-1 Y1 Y2 Y3 Y4 Y5 Y6 Y7 Y8 Y9 Y10 Y11 Y12 Y13 Y14 Y15 units 2023 2024 2025 2026 2027 2028 2029 2030 2031 2032 2033 2034 2035 2036 2037 2038 Period End Dec-31-2023 Dec-31-2024 Dec-31-2025 Dec-31-2026 Dec-31-2027 Dec-31-2028 Dec-31-2029 Dec-31-2030 Dec-31-2031 Dec-31-2032 Dec-31-2033 Dec-31-2034 Dec-31-2035 Dec-31-2036 Dec-31-2037 Dec-31-2038 Cash Flow Date Jun-30-2023 Jun-30-2024 Jun-30-2025 Jun-30-2026 Jun-30-2027 Jun-30-2028 Jun-30-2029 Jun-30-2030 Jun-30-2031 Jun-30-2032 Jun-30-2033 Jun-30-2034 Jun-30-2035 Jun-30-2036 Jun-30-2037 Jun-30-2038 Payable Gold Ounces (koz) - 73.6 148.2 195.7 188.8 170.4 134.5 117.7 93.9 91.7 74.4 68.7 56.7 38.5 10.5 3.2 Payable Silver Ounces (koz) - 244.5 676.7 632.8 455.6 342.4 270.0 176.9 74.2 51.9 94.7 97.9 49.0 29.0 6.4 2.0 Gold Price (US$/oz) - $1,600 $1,600 $1,600 $1,600 $1,600 $1,600 $1,600 $1,600 $1,600 $1,600 $1,600 $1,600 $1,600 $1,600 $1,600 Silver Price (US$/oz) - $21.00 $21.00 $21.00 $21.00 $21.00 $21.00 $21.00 $21.00 $21.00 $21.00 $21.00 $21.00 $21.00 $21.00 $21.00 Gold Revenue (US$M) - $117.7 $237.1 $313.1 $302.1 $272.6 $215.1 $188.4 $150.2 $146.8 $119.1 $109.9 $90.8 $61.7 $16.7 $5.2 Silver Revenue (US$M) - $5.1 $14.2 $13.3 $9.6 $7.2 $5.7 $3.7 $1.6 $1.1 $2.0 $2.1 $1.0 $0.6 $0.1 $0.0 Total Revenue (US$M) - $122.9 $251.4 $326.4 $311.7 $279.8 $220.8 $192.1 $151.7 $147.9 $121.0 $111.9 $91.8 $62.3 $16.9 $5.2 Less: Royalties (US$M) - - - ($1.8) ($2.5) ($1.2) ($0.9) ($0.9) ($0.9) ($0.9) - - - - - - Net Revenue (US$M) - $122.9 $251.4 $324.7 $309.2 $278.6 $219.9 $191.2 $150.8 $147.0 $121.0 $111.9 $91.8 $62.3 $16.9 $5.2 Operating Expenses Waste Mining (US$M) - ($78.8) ($27.7) ($36.6) ($26.8) ($23.7) ($19.8) ($17.3) ($16.5) ($19.8) ($24.7) ($24.7) ($21.4) ($12.4) - - Ore Mining (US$M) - ($20.4) ($21.4) ($26.4) ($28.0) ($33.3) ($39.0) ($38.7) ($35.3) ($35.3) ($27.8) ($27.7) ($28.0) ($16.2) - - Processing/Leaching/Trucking/rehandle (US$M) - ($21.6) ($24.0) ($28.7) ($29.5) ($33.8) ($39.0) ($35.8) ($29.2) ($29.2) ($27.4) ($27.0) ($23.2) ($17.8) ($10.1) ($4.5) G&A (US$M) - ($4.5) ($4.8) ($5.1) ($4.9) ($4.8) ($4.7) ($4.7) ($4.6) ($4.6) ($4.6) ($4.6) ($4.5) ($3.8) ($2.9) ($1.5) Mine Equipment Finance Charges (US$M) - ($3.8) ($3.2) ($2.5) ($1.8) ($1.1) ($0.4) ($0.1) ($0.0) $0.0 $0.0 $0.0 $0.0 $0.0 $0.0 $0.0 Depreciation (US$M) - ($10.6) ($22.5) ($34.5) ($34.4) ($43.8) ($35.0) ($30.1) ($23.6) ($30.1) ($23.8) ($21.1) ($16.6) ($10.3) ($2.6) ($0.7) Credit Stockpile Mining Cost (US$M) - $1.4 - ($0.5) - - ($1.0) - - - - - - - - - Environmental & Reclamation (US$M) - - - - - - - - ($0.3) ($0.3) ($1.9) ($5.6) ($6.4) ($5.5) ($3.7) ($1.3) EBT (US$M) - ($15.4) $147.8 $190.5 $183.8 $138.0 $81.1 $64.4 $41.3 $27.6 $10.8 $1.3 ($8.4) ($3.8) ($2.3) ($2.8) Nevada NPT (US$M) - - ($7.9) ($10.6) ($10.5) ($8.5) ($5.2) ($4.0) ($2.5) ($2.1) ($1.1) ($0.6) - - - - Federal Income Tax (US$M) - - ($4.3) ($30.5) ($29.9) ($22.7) ($12.5) ($9.5) ($5.7) ($4.9) ($2.7) ($1.5) - - - - Depreciation (US$M) - $10.6 $22.5 $34.5 $34.4 $43.8 $35.0 $30.1 $23.6 $30.1 $23.8 $21.1 $16.6 $10.3 $2.6 $0.7 Capital Expenses & Working Capital (US$M) ($167.4) ($4.4) ($10.8) ($30.2) ($6.4) ($64.5) ($2.0) $2.3 $2.0 ($26.4) $2.2 $2.1 $1.7 $1.3 $0.3 $0.1 Net Cash Flow After Tax (US$M) ($167.4) ($9.2) $147.2 $153.6 $171.4 $86.1 $96.4 $83.3 $58.6 $24.4 $33.0 $22.3 $9.9 $7.8 $0.6 ($2.0) NPV (US$M) $483
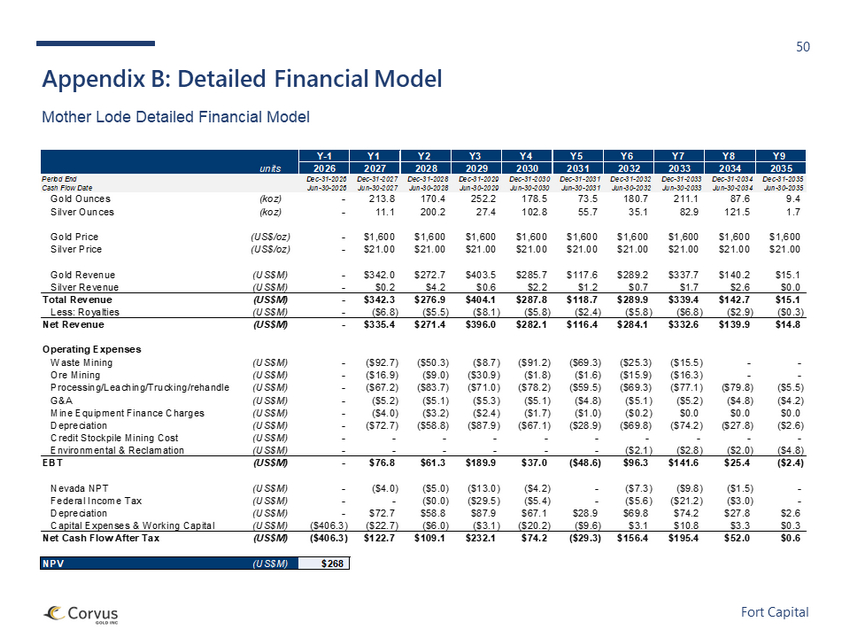
50 Fort Capital Appendix B: Detailed Financial Model Mother Lode Detailed Financial Model Y-1 Y1 Y2 Y3 Y4 Y5 Y6 Y7 Y8 Y9 units 2026 2027 2028 2029 2030 2031 2032 2033 2034 2035 Period End Dec-31-2026 Dec-31-2027 Dec-31-2028 Dec-31-2029 Dec-31-2030 Dec-31-2031 Dec-31-2032 Dec-31-2033 Dec-31-2034 Dec-31-2035 Cash Flow Date Jun-30-2026 Jun-30-2027 Jun-30-2028 Jun-30-2029 Jun-30-2030 Jun-30-2031 Jun-30-2032 Jun-30-2033 Jun-30-2034 Jun-30-2035 Gold Ounces (koz) - 213.8 170.4 252.2 178.5 73.5 180.7 211.1 87.6 9.4 Silver Ounces (koz) - 11.1 200.2 27.4 102.8 55.7 35.1 82.9 121.5 1.7 Gold Price (US$/oz) - $1,600 $1,600 $1,600 $1,600 $1,600 $1,600 $1,600 $1,600 $1,600 Silver Price (US$/oz) - $21.00 $21.00 $21.00 $21.00 $21.00 $21.00 $21.00 $21.00 $21.00 Gold Revenue (US$M) - $342.0 $272.7 $403.5 $285.7 $117.6 $289.2 $337.7 $140.2 $15.1 Silver Revenue (US$M) - $0.2 $4.2 $0.6 $2.2 $1.2 $0.7 $1.7 $2.6 $0.0 Total Revenue (US$M) - $342.3 $276.9 $404.1 $287.8 $118.7 $289.9 $339.4 $142.7 $15.1 Less: Royalties (US$M) - ($6.8) ($5.5) ($8.1) ($5.8) ($2.4) ($5.8) ($6.8) ($2.9) ($0.3) Net Revenue (US$M) - $335.4 $271.4 $396.0 $282.1 $116.4 $284.1 $332.6 $139.9 $14.8 Operating Expenses Waste Mining (US$M) - ($92.7) ($50.3) ($8.7) ($91.2) ($69.3) ($25.3) ($15.5) - - Ore Mining (US$M) - ($16.9) ($9.0) ($30.9) ($1.8) ($1.6) ($15.9) ($16.3) - - Processing/Leaching/Trucking/rehandle (US$M) - ($67.2) ($83.7) ($71.0) ($78.2) ($59.5) ($69.3) ($77.1) ($79.8) ($5.5) G&A (US$M) - ($5.2) ($5.1) ($5.3) ($5.1) ($4.8) ($5.1) ($5.2) ($4.8) ($4.2) Mine Equipment Finance Charges (US$M) - ($4.0) ($3.2) ($2.4) ($1.7) ($1.0) ($0.2) $0.0 $0.0 $0.0 Depreciation (US$M) - ($72.7) ($58.8) ($87.9) ($67.1) ($28.9) ($69.8) ($74.2) ($27.8) ($2.6) Credit Stockpile Mining Cost (US$M) - - - - - - - - - - Environmental & Reclamation (US$M) - - - - - - ($2.1) ($2.8) ($2.0) ($4.8) EBT (US$M) - $76.8 $61.3 $189.9 $37.0 ($48.6) $96.3 $141.6 $25.4 ($2.4) Nevada NPT (US$M) - ($4.0) ($5.0) ($13.0) ($4.2) - ($7.3) ($9.8) ($1.5) - Federal Income Tax (US$M) - - ($0.0) ($29.5) ($5.4) - ($5.6) ($21.2) ($3.0) - Depreciation (US$M) - $72.7 $58.8 $87.9 $67.1 $28.9 $69.8 $74.2 $27.8 $2.6 Capital Expenses & Working Capital (US$M) ($406.3) ($22.7) ($6.0) ($3.1) ($20.2) ($9.6) $3.1 $10.8 $3.3 $0.3 Net Cash Flow After Tax (US$M) ($406.3) $122.7 $109.1 $232.1 $74.2 ($29.3) $156.4 $195.4 $52.0 $0.6 NPV (US$M) $268
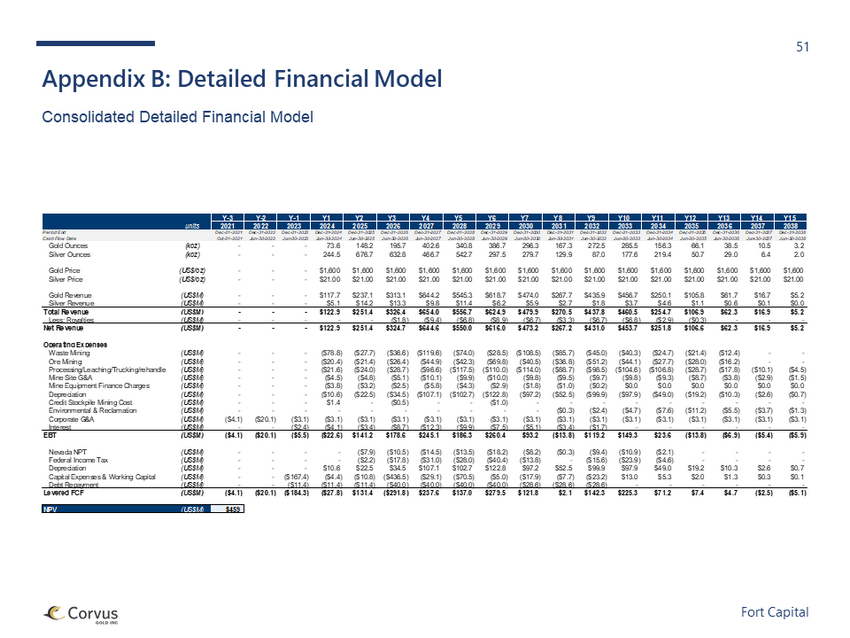
51 Fort Capital Appendix B: Detailed Financial Model Consolidated Detailed Financial Model Y-3 Y-2 Y-1 Y1 Y2 Y3 Y4 Y5 Y6 Y7 Y8 Y9 Y10 Y11 Y12 Y13 Y14 Y15 units 2021 2022 2023 2024 2025 2026 2027 2028 2029 2030 2031 2032 2033 2034 2035 2036 2037 2038 Period End Dec-31-2021 Dec-31-2022 Dec-31-2023 Dec-31-2024 Dec-31-2025 Dec-31-2026 Dec-31-2027 Dec-31-2028 Dec-31-2029 Dec-31-2030 Dec-31-2031 Dec-31-2032 Dec-31-2033 Dec-31-2034 Dec-31-2035 Dec-31-2036 Dec-31-2037 Dec-31-2038 Cash Flow Date Oct-31-2021 Jun-30-2022 Jun-30-2023 Jun-30-2024 Jun-30-2025 Jun-30-2026 Jun-30-2027 Jun-30-2028 Jun-30-2029 Jun-30-2030 Jun-30-2031 Jun-30-2032 Jun-30-2033 Jun-30-2034 Jun-30-2035 Jun-30-2036 Jun-30-2037 Jun-30-2038 Gold Ounces (koz) - - - 73.6 148.2 195.7 402.6 340.8 386.7 296.3 167.3 272.5 285.5 156.3 66.1 38.5 10.5 3.2 Silver Ounces (koz) - - - 244.5 676.7 632.8 466.7 542.7 297.5 279.7 129.9 87.0 177.6 219.4 50.7 29.0 6.4 2.0 Gold Price (US$/oz) - - - $1,600 $1,600 $1,600 $1,600 $1,600 $1,600 $1,600 $1,600 $1,600 $1,600 $1,600 $1,600 $1,600 $1,600 $1,600 Silver Price (US$/oz) - - - $21.00 $21.00 $21.00 $21.00 $21.00 $21.00 $21.00 $21.00 $21.00 $21.00 $21.00 $21.00 $21.00 $21.00 $21.00 Gold Revenue (US$M) - - - $117.7 $237.1 $313.1 $644.2 $545.3 $618.7 $474.0 $267.7 $435.9 $456.7 $250.1 $105.8 $61.7 $16.7 $5.2 Silver Revenue (US$M) - - - $5.1 $14.2 $13.3 $9.8 $11.4 $6.2 $5.9 $2.7 $1.8 $3.7 $4.6 $1.1 $0.6 $0.1 $0.0 Total Revenue (US$M) - - - $122.9 $251.4 $326.4 $654.0 $556.7 $624.9 $479.9 $270.5 $437.8 $460.5 $254.7 $106.9 $62.3 $16.9 $5.2 Less: Royalties (US$M) - - - - - ($1.8) ($9.4) ($6.8) ($8.9) ($6.7) ($3.3) ($6.7) ($6.8) ($2.9) ($0.3) - - - Net Revenue (US$M) - - - $122.9 $251.4 $324.7 $644.6 $550.0 $616.0 $473.2 $267.2 $431.0 $453.7 $251.8 $106.6 $62.3 $16.9 $5.2 Operating Expenses Waste Mining (US$M) - - - ($78.8) ($27.7) ($36.6) ($119.6) ($74.0) ($28.5) ($108.5) ($85.7) ($45.0) ($40.3) ($24.7) ($21.4) ($12.4) - - Ore Mining (US$M) - - - ($20.4) ($21.4) ($26.4) ($44.9) ($42.3) ($69.8) ($40.5) ($36.8) ($51.2) ($44.1) ($27.7) ($28.0) ($16.2) - - Processing/Leaching/Trucking/rehandle (US$M) - - - ($21.6) ($24.0) ($28.7) ($96.6) ($117.5) ($110.0) ($114.0) ($88.7) ($98.5) ($104.6) ($106.8) ($28.7) ($17.8) ($10.1) ($4.5) Mine Site G&A (US$M) - - - ($4.5) ($4.8) ($5.1) ($10.1) ($9.9) ($10.0) ($9.8) ($9.5) ($9.7) ($9.8) ($9.3) ($8.7) ($3.8) ($2.9) ($1.5) Mine Equipment Finance Charges (US$M) - - - ($3.8) ($3.2) ($2.5) ($5.8) ($4.3) ($2.9) ($1.8) ($1.0) ($0.2) $0.0 $0.0 $0.0 $0.0 $0.0 $0.0 Depreciation (US$M) - - - ($10.6) ($22.5) ($34.5) ($107.1) ($102.7) ($122.8) ($97.2) ($52.5) ($99.9) ($97.9) ($49.0) ($19.2) ($10.3) ($2.6) ($0.7) Credit Stockpile Mining Cost (US$M) - - - $1.4 - ($0.5) - - ($1.0) - - - - - - - - - Environmental & Reclamation (US$M) - - - - - - - - - - ($0.3) ($2.4) ($4.7) ($7.6) ($11.2) ($5.5) ($3.7) ($1.3) Corporate G&A (US$M) ($4.1) ($20.1) ($3.1) ($3.1) ($3.1) ($3.1) ($3.1) ($3.1) ($3.1) ($3.1) ($3.1) ($3.1) ($3.1) ($3.1) ($3.1) ($3.1) ($3.1) ($3.1) Interest (US$M) - - ($2.4) ($4.1) ($3.4) ($8.7) ($12.3) ($9.9) ($7.5) ($5.1) ($3.4) ($1.7) - - - - - - EBT (US$M) ($4.1) ($20.1) ($5.5) ($22.6) $141.2 $178.6 $245.1 $186.3 $260.4 $93.2 ($13.8) $119.2 $149.3 $23.6 ($13.8) ($6.9) ($5.4) ($5.9) Nevada NPT (US$M) - - - - ($7.9) ($10.5) ($14.5) ($13.5) ($18.2) ($8.2) ($0.3) ($9.4) ($10.9) ($2.1) - - - - Federal Income Tax (US$M) - - - - ($2.2) ($17.8) ($31.0) ($28.0) ($40.4) ($13.8) - ($15.6) ($23.9) ($4.6) - - - - Depreciation (US$M) - - - $10.6 $22.5 $34.5 $107.1 $102.7 $122.8 $97.2 $52.5 $99.9 $97.9 $49.0 $19.2 $10.3 $2.6 $0.7 Capital Expenses & Working Capital (US$M) - - ($167.4) ($4.4) ($10.8) ($436.5) ($29.1) ($70.5) ($5.0) ($17.9) ($7.7) ($23.2) $13.0 $5.3 $2.0 $1.3 $0.3 $0.1 Debt Repayment (US$M) - - ($11.4) ($11.4) ($11.4) ($40.0) ($40.0) ($40.0) ($40.0) ($28.6) ($28.6) ($28.6) - - - - - - Levered FCF (US$M) ($4.1) ($20.1) ($184.3) ($27.8) $131.4 ($291.8) $237.6 $137.0 $279.5 $121.8 $2.1 $142.3 $225.3 $71.2 $7.4 $4.7 ($2.5) ($5.1) NPV (US$M) $459
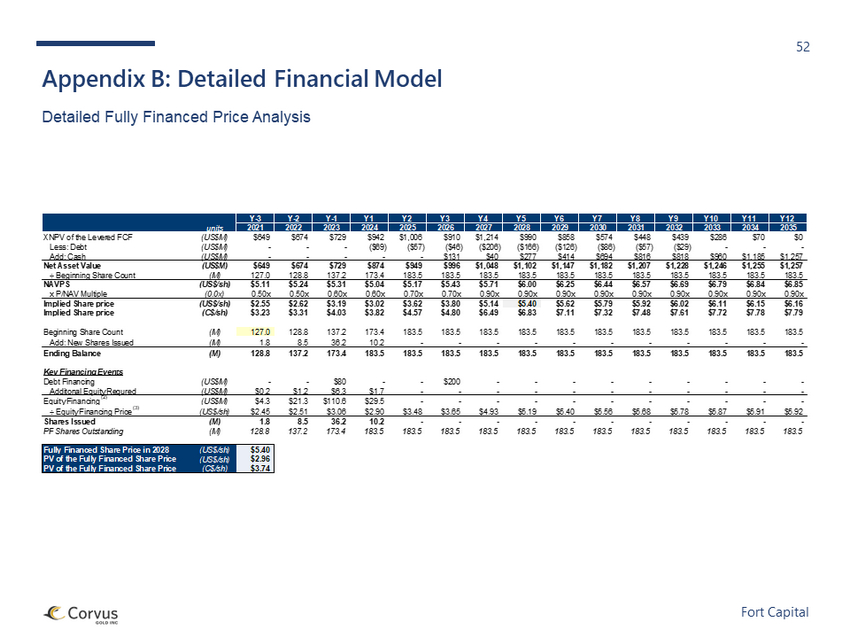
52 Fort Capital Appendix B: Detailed Financial Model Detailed Fully Financed Price Analysis Y-3 Y-2 Y-1 Y1 Y2 Y3 Y4 Y5 Y6 Y7 Y8 Y9 Y10 Y11 Y12 units 2021 2022 2023 2024 2025 2026 2027 2028 2029 2030 2031 2032 2033 2034 2035 XNPV of the Levered FCF (US$M) $649 $674 $729 $942 $1,006 $910 $1,214 $990 $858 $574 $448 $439 $286 $70 $0 Less: Debt (US$M) - - - ($69) ($57) ($46) ($206) ($166) ($126) ($86) ($57) ($29) - - - Add: Cash (US$M) - - - - - $131 $40 $277 $414 $694 $816 $818 $960 $1,185 $1,257 Net Asset Value (US$M) $649 $674 $729 $874 $949 $996 $1,048 $1,102 $1,147 $1,182 $1,207 $1,228 $1,246 $1,255 $1,257 ÷ Beginning Share Count (M) 127.0 128.8 137.2 173.4 183.5 183.5 183.5 183.5 183.5 183.5 183.5 183.5 183.5 183.5 183.5 NAVPS (US$/sh) $5.11 $5.24 $5.31 $5.04 $5.17 $5.43 $5.71 $6.00 $6.25 $6.44 $6.57 $6.69 $6.79 $6.84 $6.85 x P/NAV Multiple (0.0x) 0.50x 0.50x 0.60x 0.60x 0.70x 0.70x 0.90x 0.90x 0.90x 0.90x 0.90x 0.90x 0.90x 0.90x 0.90x Implied Share price (US$/sh) $2.55 $2.62 $3.19 $3.02 $3.62 $3.80 $5.14 $5.40 $5.62 $5.79 $5.92 $6.02 $6.11 $6.15 $6.16 Implied Share price (C$/sh) $3.23 $3.31 $4.03 $3.82 $4.57 $4.80 $6.49 $6.83 $7.11 $7.32 $7.48 $7.61 $7.72 $7.78 $7.79 Beginning Share Count (M) 127.0 128.8 137.2 173.4 183.5 183.5 183.5 183.5 183.5 183.5 183.5 183.5 183.5 183.5 183.5 Add: New Shares Issued (M) 1.8 8.5 36.2 10.2 - - - - - - - - - - - Ending Balance (M) 128.8 137.2 173.4 183.5 183.5 183.5 183.5 183.5 183.5 183.5 183.5 183.5 183.5 183.5 183.5 Key Financing Events Debt Financing (US$M) - - $80 - - $200 - - - - - - - - - Additonal Equity Requred (US$M) $0.2 $1.2 $6.3 $1.7 - - - - - - - - - - - Equity Financing (2) (US$M) $4.3 $21.3 $110.6 $29.5 - - - - - - - - - - - ÷ Equity Financing Price (3) (US$/sh) $2.45 $2.51 $3.06 $2.90 $3.48 $3.65 $4.93 $5.19 $5.40 $5.56 $5.68 $5.78 $5.87 $5.91 $5.92 Shares Issued (M) 1.8 8.5 36.2 10.2 - - - - - - - - - - - PF Shares Outstanding (M) 128.8 137.2 173.4 183.5 183.5 183.5 183.5 183.5 183.5 183.5 183.5 183.5 183.5 183.5 183.5 Fully Financed Share Price in 2028 (US$/sh) $5.40 PV of the Fully Financed Share Price (US$/sh) $2.96 PV of the Fully Financed Share Price (C$/sh) $3.74
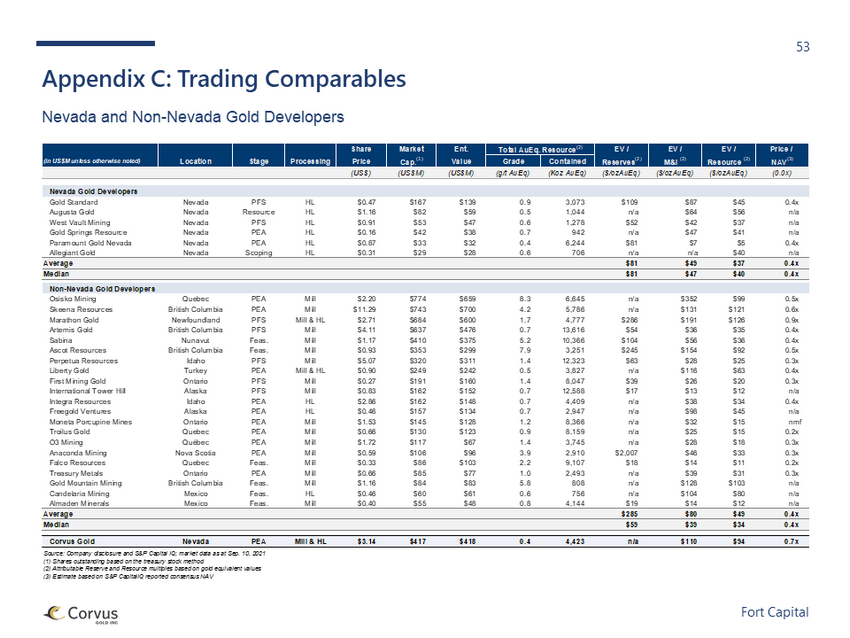
53 Fort Capital Appendix C: Trading Comparables Nevada and Non - Nevada Gold Developers Share Market Ent. Total AuEq. Resource (2) EV / EV / EV / Price / (in US$M unless otherwise noted) Location Stage Processing Price Cap. (1) Value Grade Contained Reserves (2) M&I (2) Resource (2) NAV (3) (US$) (US$M) (US$M) (g/t AuEq) (Koz AuEq) ($/ozAuEq) ($/ozAuEq) ($/ozAuEq) (0.0x) Nevada Gold Developers Gold Standard Nevada PFS HL $0.47 $167 $139 0.9 3,073 $109 $87 $45 0.4x Augusta Gold Nevada Resource HL $1.16 $82 $59 0.5 1,044 n/a $64 $56 n/a West Vault Mining Nevada PFS HL $0.91 $53 $47 0.6 1,278 $52 $42 $37 n/a Gold Springs Resource Nevada PEA HL $0.16 $42 $38 0.7 942 n/a $47 $41 n/a Paramount Gold Nevada Nevada PEA HL $0.87 $33 $32 0.4 6,244 $81 $7 $5 0.4x Allegiant Gold Nevada Scoping HL $0.31 $29 $28 0.6 706 n/a n/a $40 n/a Average $81 $49 $37 0.4x Median $81 $47 $40 0.4x Non-Nevada Gold Developers Osisko Mining Quebec PEA Mill $2.20 $774 $659 8.3 6,645 n/a $352 $99 0.5x Skeena Resources British Columbia PEA Mill $11.29 $743 $700 4.2 5,786 n/a $131 $121 0.6x Marathon Gold Newfoundland PFS Mill & HL $2.71 $684 $600 1.7 4,777 $286 $191 $126 0.9x Artemis Gold British Columbia PFS Mill $4.11 $637 $476 0.7 13,616 $54 $36 $35 0.4x Sabina Nunavut Feas. Mill $1.17 $410 $375 5.2 10,366 $104 $56 $36 0.4x Ascot Resources British Columbia Feas. Mill $0.93 $353 $299 7.9 3,251 $245 $154 $92 0.5x Perpetua Resources Idaho PFS Mill $5.07 $320 $311 1.4 12,323 $63 $28 $25 0.3x Liberty Gold Turkey PEA Mill & HL $0.90 $249 $242 0.5 3,827 n/a $116 $63 0.4x First Mining Gold Ontario PFS Mill $0.27 $191 $160 1.4 8,047 $39 $26 $20 0.3x International Tower Hill Alaska PFS Mill $0.83 $162 $152 0.7 12,588 $17 $13 $12 n/a Integra Resources Idaho PEA HL $2.86 $162 $148 0.7 4,409 n/a $38 $34 0.4x Freegold Ventures Alaska PEA HL $0.46 $157 $134 0.7 2,947 n/a $98 $45 n/a Moneta Porcupine Mines Ontario PEA Mill $1.53 $145 $128 1.2 8,366 n/a $32 $15 nmf Troilus Gold Quebec PEA Mill $0.66 $130 $123 0.9 8,159 n/a $25 $15 0.2x O3 Mining Québec PEA Mill $1.72 $117 $67 1.4 3,745 n/a $28 $18 0.3x Anaconda Mining Nova Scotia PEA Mill $0.59 $106 $96 3.9 2,910 $2,007 $46 $33 0.3x Falco Resources Quebec Feas. Mill $0.33 $86 $103 2.2 9,107 $18 $14 $11 0.2x Treasury Metals Ontario PEA Mill $0.66 $85 $77 1.0 2,493 n/a $39 $31 0.3x Gold Mountain Mining British Columbia Feas. Mill $1.16 $84 $83 5.8 808 n/a $128 $103 n/a Candelaria Mining Mexico Feas. HL $0.46 $60 $61 0.6 756 n/a $104 $80 n/a Almaden Minerals Mexico Feas. Mill $0.40 $55 $48 0.8 4,144 $19 $14 $12 n/a Average $285 $80 $49 0.4x Median $59 $39 $34 0.4x Corvus Gold Nevada PEA Mill & HL $3.14 $417 $418 0.4 4,423 n/a $110 $94 0.7x Source: Company disclosure and S&P Capital IQ; market data as at Sep. 10, 2021 (1) Shares outstanding based on the treasury stock method (2) Attributable Reserve and Resource multiples based on gold equivalent values (3) Estimate based on S&P CapitalIQ reported consensus NAV
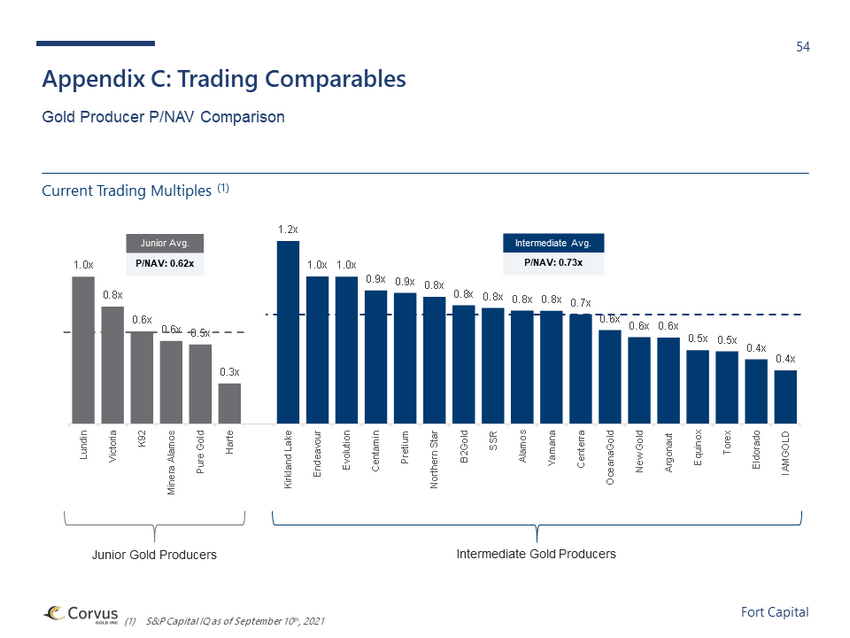
54 Fort Capital 1.0x 0.8x 0.6x 0.6x 0.5x 0.3x 1.2x 1.0x 1.0x 0.9x 0.9x 0.8x 0.8x 0.8x 0.8x 0.8x 0.7x 0.6x 0.6x 0.6x 0.5x 0.5x 0.4x 0.4x Lundin Victoria K92 Minera Alamos Pure Gold Harte Kirkland Lake Endeavour Evolution Centamin Pretium Northern Star B2Gold SSR Alamos Yamana Centerra OceanaGold New Gold Argonaut Equinox Torex Eldorado IAMGOLD (1) S&P Capital IQ as of September 10 th , 2021 Appendix C: Trading Comparables Gold Producer P/NAV Comparison Junior Gold Producers Intermediate Gold Producers Junior Avg. P/NAV: 0.62x Intermediate Avg. P/NAV: 0.73x Current Trading Multiples (1)
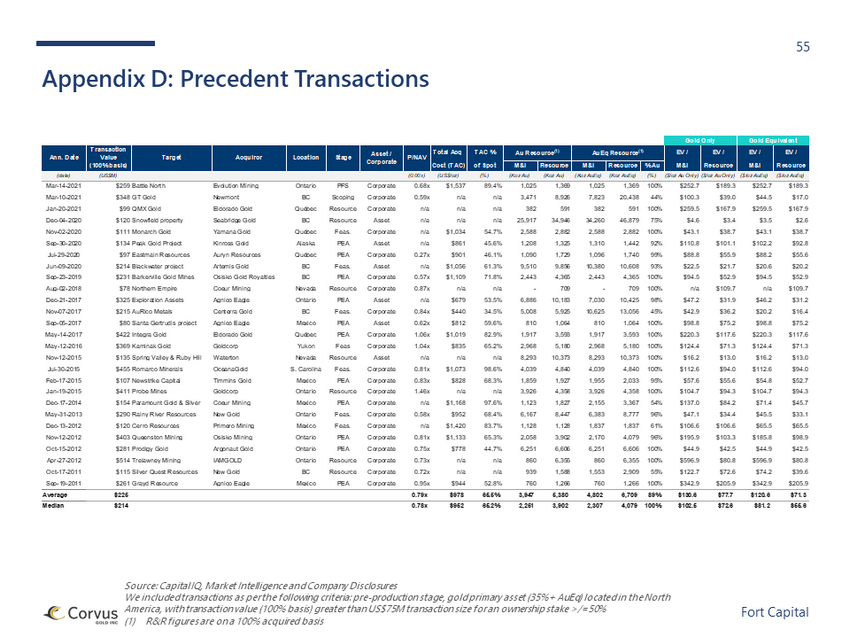
55 Fort Capital Source: Capital IQ, Market Intelligence and Company Disclosures We included transactions as per the following criteria: pre - production stage, gold primary asset (35%+ AuEq) located in the North America, with transaction value (100% basis) greater than US$75M transaction size for an ownership stake >/=50% (1) R&R figures are on a 100% acquired basis Appendix D: Precedent Transactions Gold Only Gold Equivalent Total Acq TAC % Au Resource (1) AuEq Resource (1) EV / EV / EV / EV / Cost (TAC) of Spot M&I Resource M&I Resource % Au M&I Resource M&I Resource (date) (US$M) (0.00x) (US$/oz) (%) (Koz Au) (Koz Au) (Koz AuEq) (Koz AuEq) (%) ($/oz Au Only) ($/oz Au Only) ($/oz AuEq) ($/oz AuEq) Mar-14-2021 $259 Battle North Evolution Mining Ontario PFS Corporate 0.68x $1,537 89.4% 1,025 1,369 1,025 1,369 100% $252.7 $189.3 $252.7 $189.3 Mar-10-2021 $348 GT Gold Newmont BC Scoping Corporate 0.59x n/a n/a 3,471 8,926 7,823 20,438 44% $100.3 $39.0 $44.5 $17.0 Jan-20-2021 $99 QMX Gold Eldorado Gold Québec Resource Corporate n/a n/a n/a 382 591 382 591 100% $259.5 $167.9 $259.5 $167.9 Dec-04-2020 $120 Snowfield property Seabridge Gold BC Resource Asset n/a n/a n/a 25,917 34,946 34,260 46,879 75% $4.6 $3.4 $3.5 $2.6 Nov-02-2020 $111 Monarch Gold Yamana Gold Québec Feas. Corporate n/a $1,034 54.7% 2,588 2,882 2,588 2,882 100% $43.1 $38.7 $43.1 $38.7 Sep-30-2020 $134 Peak Gold Project Kinross Gold Alaska PEA Asset n/a $861 45.6% 1,208 1,325 1,310 1,442 92% $110.8 $101.1 $102.2 $92.8 Jul-29-2020 $97 Eastmain Resources Auryn Resources Québec PEA Corporate 0.27x $901 46.1% 1,090 1,729 1,096 1,740 99% $88.8 $55.9 $88.2 $55.6 Jun-09-2020 $214 Blackwater project Artemis Gold BC Feas. Asset n/a $1,056 61.3% 9,510 9,856 10,380 10,608 93% $22.5 $21.7 $20.6 $20.2 Sep-23-2019 $231 Barkerville Gold Mines Osisko Gold Royalties BC PEA Corporate 0.57x $1,109 71.8% 2,443 4,365 2,443 4,365 100% $94.5 $52.9 $94.5 $52.9 Aug-02-2018 $78 Northern Empire Coeur Mining Nevada Resource Corporate 0.87x n/a n/a - 709 - 709 100% n/a $109.7 n/a $109.7 Dec-21-2017 $325 Exploration Assets Agnico Eagle Ontario PEA Asset n/a $679 53.5% 6,886 10,183 7,030 10,425 98% $47.2 $31.9 $46.2 $31.2 Nov-07-2017 $215 AuRico Metals Centerra Gold BC Feas. Corporate 0.84x $440 34.5% 5,008 5,925 10,625 13,056 45% $42.9 $36.2 $20.2 $16.4 Sep-05-2017 $80 Santa Gertrudis project Agnico Eagle Mexico PEA Asset 0.62x $812 59.6% 810 1,064 810 1,064 100% $98.8 $75.2 $98.8 $75.2 May-14-2017 $422 Integra Gold Eldorado Gold Québec PEA Corporate 1.06x $1,019 82.9% 1,917 3,593 1,917 3,593 100% $220.3 $117.6 $220.3 $117.6 May-12-2016 $369 Kaminak Gold Goldcorp Yukon Feas Corporate 1.04x $835 65.2% 2,968 5,180 2,968 5,180 100% $124.4 $71.3 $124.4 $71.3 Nov-12-2015 $135 Spring Valley & Ruby Hill Waterton Nevada Resource Asset n/a n/a n/a 8,293 10,373 8,293 10,373 100% $16.2 $13.0 $16.2 $13.0 Jul-30-2015 $455 Romarco Minerals OceanaGold S. Carolina Feas. Corporate 0.81x $1,073 98.6% 4,039 4,840 4,039 4,840 100% $112.6 $94.0 $112.6 $94.0 Feb-17-2015 $107 Newstrike Capital Timmins Gold Mexico PEA Corporate 0.83x $828 68.3% 1,859 1,927 1,955 2,033 95% $57.6 $55.6 $54.8 $52.7 Jan-19-2015 $411 Probe Mines Goldcorp Ontario Resource Corporate 1.46x n/a n/a 3,926 4,358 3,926 4,358 100% $104.7 $94.3 $104.7 $94.3 Dec-17-2014 $154 Paramount Gold & Silver Coeur Mining Mexico PEA Corporate n/a $1,168 97.6% 1,123 1,827 2,155 3,367 54% $137.0 $84.2 $71.4 $45.7 May-31-2013 $290 Rainy River Resources New Gold Ontario Feas. Corporate 0.58x $952 68.4% 6,167 8,447 6,383 8,777 96% $47.1 $34.4 $45.5 $33.1 Dec-13-2012 $120 Cerro Resources Primero Mining Mexico Feas. Corporate n/a $1,420 83.7% 1,128 1,128 1,837 1,837 61% $106.6 $106.6 $65.5 $65.5 Nov-12-2012 $403 Queenston Mining Osisko Mining Ontario PEA Corporate 0.81x $1,133 65.3% 2,058 3,902 2,170 4,079 96% $195.9 $103.3 $185.8 $98.9 Oct-15-2012 $281 Prodigy Gold Argonaut Gold Ontario PEA Corporate 0.75x $778 44.7% 6,251 6,606 6,251 6,606 100% $44.9 $42.5 $44.9 $42.5 Apr-27-2012 $514 Trelawney Mining IAMGOLD Ontario Resource Corporate 0.73x n/a n/a 860 6,355 860 6,355 100% $596.9 $80.8 $596.9 $80.8 Oct-17-2011 $115 Silver Quest Resources New Gold BC Resource Corporate 0.72x n/a n/a 939 1,588 1,553 2,909 55% $122.7 $72.6 $74.2 $39.6 Sep-19-2011 $261 Grayd Resource Agnico Eagle Mexico PEA Corporate 0.95x $944 52.8% 760 1,266 760 1,266 100% $342.9 $205.9 $342.9 $205.9 Average $225 0.79x $978 65.5% 3,947 5,380 4,802 6,709 89% $130.6 $77.7 $120.6 $71.3 Median $214 0.78x $952 65.2% 2,251 3,902 2,307 4,079 100% $102.5 $72.6 $81.2 $55.6 StageAnn. Date P/NAVTarget Acquiror Transaction Value (100% basis) Asset / Corporate Location
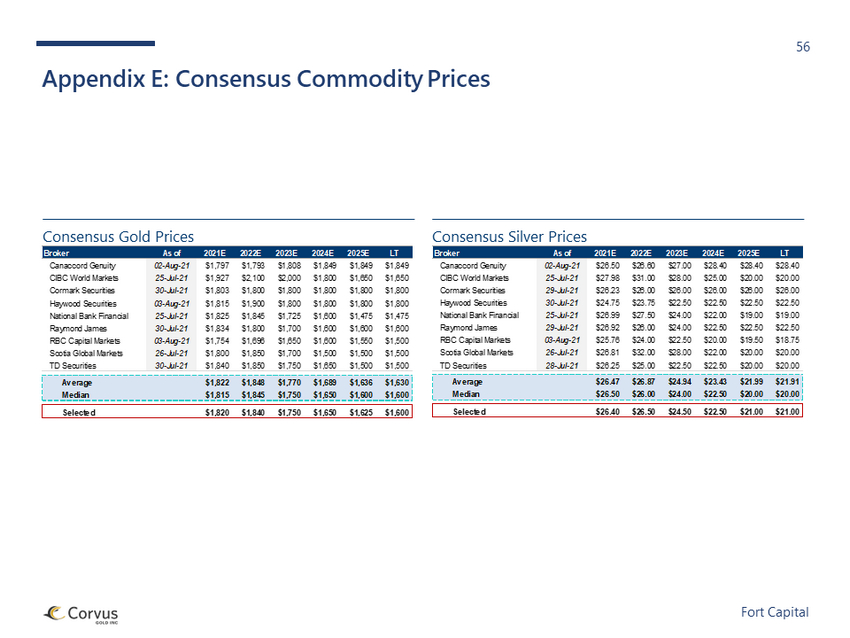
56 Fort Capital Appendix E: Consensus Commodity Prices Consensus Gold Prices Consensus Silver Prices Broker As of 2021E 2022E 2023E 2024E 2025E LT Canaccord Genuity 02-Aug-21 $1,797 $1,793 $1,808 $1,849 $1,849 $1,849 CIBC World Markets 25-Jul-21 $1,927 $2,100 $2,000 $1,800 $1,650 $1,650 Cormark Securities 30-Jul-21 $1,803 $1,800 $1,800 $1,800 $1,800 $1,800 Haywood Securities 03-Aug-21 $1,815 $1,900 $1,800 $1,800 $1,800 $1,800 National Bank Financial 25-Jul-21 $1,825 $1,845 $1,725 $1,600 $1,475 $1,475 Raymond James 30-Jul-21 $1,834 $1,800 $1,700 $1,600 $1,600 $1,600 RBC Capital Markets 03-Aug-21 $1,754 $1,696 $1,650 $1,600 $1,550 $1,500 Scotia Global Markets 26-Jul-21 $1,800 $1,850 $1,700 $1,500 $1,500 $1,500 TD Securities 30-Jul-21 $1,840 $1,850 $1,750 $1,650 $1,500 $1,500 Average $1,822 $1,848 $1,770 $1,689 $1,636 $1,630 Median $1,815 $1,845 $1,750 $1,650 $1,600 $1,600 Selected $1,820 $1,840 $1,750 $1,650 $1,625 $1,600 Broker As of 2021E 2022E 2023E 2024E 2025E LT Canaccord Genuity 02-Aug-21 $26.50 $26.60 $27.00 $28.40 $28.40 $28.40 CIBC World Markets 25-Jul-21 $27.98 $31.00 $28.00 $25.00 $20.00 $20.00 Cormark Securities 29-Jul-21 $26.23 $26.00 $26.00 $26.00 $26.00 $26.00 Haywood Securities 30-Jul-21 $24.75 $23.75 $22.50 $22.50 $22.50 $22.50 National Bank Financial 25-Jul-21 $26.99 $27.50 $24.00 $22.00 $19.00 $19.00 Raymond James 29-Jul-21 $26.92 $26.00 $24.00 $22.50 $22.50 $22.50 RBC Capital Markets 03-Aug-21 $25.76 $24.00 $22.50 $20.00 $19.50 $18.75 Scotia Global Markets 26-Jul-21 $26.81 $32.00 $28.00 $22.00 $20.00 $20.00 TD Securities 28-Jul-21 $26.25 $25.00 $22.50 $22.50 $20.00 $20.00 Average $26.47 $26.87 $24.94 $23.43 $21.99 $21.91 Median $26.50 $26.00 $24.00 $22.50 $20.00 $20.00 Selected $26.40 $26.50 $24.50 $22.50 $21.00 $21.00