Please wait
.2
Management’s Discussion and Analysis
Years ended December 31, 2020 and 2019
1
Forward looking statements
Certain statements in this Management’s Discussion & Analysis (“MD&A”), and in particular the “Business Performance Highlights” section and “Outlook” section, contain forward-looking information and forward-looking statements (collectively referred to herein as the “Forward-Looking Statements”) within the meaning of applicable Canadian and U.S. securities laws. The use of any of the words “expect”, “anticipate”, “continue”, “estimate”, “may”, “will”, “project”, “should”, “believe”, “plans”, “intends” and similar expressions are intended to identify Forward-Looking Statements. In particular, but without limiting the forgoing, this MD&A contains Forward-Looking Statements pertaining to: (i) the belief that distortion in financial asset valuations is now so extreme that there has never been a stronger argument for investors to hold non-correlated assets, such as precious metals and their related equities, in their portfolios; (ii) the belief that there will be a rotation of investor capital into precious metal equities; (iii) the commitment to extend the company’s reach by increasing our presence in key markets such as Europe and Asia; (iv) the expectation of expanding the client base with the launch of complementary new investment strategies in 2021; (v) the belief that 2021 will be a great year for the company, as it continues to strive to be the world’s leading precious metals investment firm; (vi) continued strength in global precious metals pricing and mining equities markets throughout 2021; (vii) anticipation of flat-to-lower AUM in our lending segment as capital calls into new lending LPs are offset by capital distributions from older lending LPs that will be wound up later in the year, including the expectation of crystallized material carried interest gains from those LPs; (viii) anticipation of mining sector equity origination and M&A activity to remain constructive in 2021; (ix) at a consolidated level, the belief that the aforementioned segment level results will lead to another strong year for Sprott Inc. as far as continued earnings growth and strong operating margins; (x) expectation of the effects of COVID-19, and in particular, world government responses thereto via fiscal and monetary policy, will continue to be highly constructive to precious metals markets; and (xi) the declaration, payment and designation of dividends and confidence that our business will support the dividend level without impacting our ability to fund future growth initiatives.
Although the Company believes that the Forward-Looking Statements are reasonable, they are not guarantees of future results, performance or achievements. A number of factors or assumptions have been used to develop the Forward-Looking Statements, including: (i) the impact of increasing competition in each business in which the Company operates will not be material; (ii) quality management will be available; (iii) the effects of regulation and tax laws of governmental agencies will be consistent with the current environment; and (iv) those assumptions disclosed herein under the heading “Critical Accounting Estimates, Judgments and Changes in Accounting Policies”. Actual results, performance or achievements could vary materially from those expressed or implied by the Forward-Looking Statements should assumptions underlying the Forward-Looking Statements prove incorrect or should one or more risks or other factors materialize, including: (i) difficult market conditions; (ii) poor investment performance; (iii) failure to continue to retain and attract quality staff; (iv) employee errors or misconduct resulting in regulatory sanctions or reputational harm; (v) performance fee fluctuations; (vi) a business segment or another counterparty failing to pay its financial obligation; (vii) failure of the Company to meet its demand for cash or fund obligations as they come due; (viii) changes in the investment management industry; (ix) failure to implement effective information security policies, procedures and capabilities; (x) lack of investment opportunities; (xi) risks related to regulatory compliance; (xii) failure to manage risks appropriately; (xiii) failure to deal appropriately with conflicts of interest; (xiv) competitive pressures; (xv) corporate growth which may be difficult to sustain and may place significant demands on existing administrative, operational and financial resources; (xvi) failure to comply with privacy laws; (xvii) failure to successfully implement succession planning; (xviii) foreign exchange risk relating to the relative value of the U.S. dollar; (xix) litigation risk; (xx) failure to develop effective business resiliency plans; (xxi) failure to obtain or maintain sufficient insurance coverage on favourable economic terms; (xxii) historical financial information being not necessarily indicative of future performance; (xxiii) the market price of common shares of the Company may fluctuate widely and rapidly; (xxiv) risks relating to the Company’s investment products; (xxv) risks relating to the Company’s proprietary investments; (xxvi) risks relating to the Company’s lending business; (xxvii) risks relating to the Company’s brokerage business; (xxviii) those risks described under the heading “Risk Factors” in the Company’s annual information form dated February 25, 2021; and (xxix) those risks described under the headings “Managing Risk: Financial” and “Managing Risk: Non-Financial” in this MD&A. In addition, the payment of dividends is not guaranteed and the amount and timing of any dividends payable by the Company will be at the discretion of the Board of Directors of the Company and will be established on the basis of the Company’s earnings, the satisfaction of solvency tests imposed by applicable corporate law for the declaration and payment of dividends, and other relevant factors. The Forward-Looking Statements speak only as of the date hereof, unless otherwise specifically noted, and the Company does not assume any obligation to publicly update any Forward-Looking Statements, whether as a result of new information, future events or otherwise, except as may be expressly required by applicable securities laws.
Management’s discussion and analysis
This MD&A of financial condition and results of operations, dated February 25, 2021, presents an analysis of the consolidated financial condition of the Company and its subsidiaries as at December 31, 2020, compared with December 31, 2019, and the consolidated results of operations for the three and twelve months ended December 31, 2020, compared with the three and twelve months ended December 31, 2019. The board of directors approved this MD&A on February 25, 2021. All note references in this MD&A are to the notes to the Company’s December 31, 2020 audited annual consolidated financial statements (“annual financial statements”), unless otherwise noted. The Company was incorporated under the Business Corporations Act (Ontario) on February 13, 2008.
Presentation of financial information
The financial statements, including the required comparative information, have been prepared in accordance with International Financial Reporting Standards (“IFRS”), as issued by the International Accounting Standards Board (“IASB”). Financial results, including related historical comparatives contained in this MD&A, unless otherwise specified herein, are based on the annual financial statements. While the Company’s functional currency is the Canadian dollar, its presentation currency has changed to US dollars effective January 1, 2020, with the prior period figures restated accordingly. We believe the US dollar better reflects the Company’s consolidated financial position and results of operations given the materiality of revenues denominated in US dollars that further increased in 2020 with the January 17, 2020 close of the Tocqueville Asset Management gold strategies acquisition (the “Acquisition”). Accordingly, all dollar references in this MD&A are in US dollars, unless otherwise specified. The use of the term “prior period” refers to the three and twelve months ended December 31, 2019.
2
Key performance indicators (non-IFRS financial measures)
The Company measures the success of its business using a number of key performance indicators that are not measurements in accordance with IFRS and should not be considered as an alternative to net income (loss) or any other measure of performance under IFRS. Non-IFRS financial measures do not have a standardized meaning prescribed by IFRS and are therefore unlikely to be comparable to similar measures presented by other issuers. Our key performance indicators are discussed below:
Assets under management
Assets under management (“AUM”) refers to the total net assets managed by the Company through its various investment product offerings, managed accounts and managed companies.
Net inflows
Net inflows (consisting of net sales, capital calls and fee earning capital commitments) result in changes to AUM and are described individually below:
Net sales
Fund sales (net of redemptions), including ‘at-the-market’ transactions and secondary offerings of our physical trusts and new ‘creations’ of ETF units, are a key performance indicator as new assets being managed will lead to higher management fees and can potentially lead to increased carried interest and performance fee generation (as applicable) given that AUM is also the basis upon which carried interest and performance fees are calculated.
Capital calls and commitments
Capital calls into our lending LPs are a key source of AUM creation, and ultimately, earnings for the Company. Once capital is called into our lending LPs, it is included within the AUM of the Company as it will now earn a management fee (NOTE: it is possible for some forms of committed capital to earn a commitment fee despite being uncalled, in which case, it will also be included in AUM at that time). Conversely, once loans in our lending LPs are repaid, capital may be returned to investors in the form of a distribution, thereby reducing our AUM (“capital distributions”).
Net fees
Management fees (net of trailer and sub-advisor fees) and carried interest and performance fees (net of carried interest and performance fee payouts) are key revenue indicators as they represent the net revenue contribution after directly associated costs that we generate from our AUM.
Net commissions
Commissions, net of commission expenses, arise primarily from the transaction based service offerings of our brokerage segment.
Net compensation
Net compensation excludes commissions, carried interest and performance fee payouts, which are presented net of their related revenues in this MD&A, and severance and new hire accruals which are non-recurring.
Total shareholder return
Total shareholder return is the financial gain (loss) that results from the change in the Company’s share price, plus any dividends paid over the period.
Return on capital
Return on capital is calculated as adjusted base EBITDA, plus gain (loss) on investments divided by capital stock plus outstanding loan facility.
3
EBITDA, adjusted EBITDA, adjusted base EBITDA and operating margin
EBITDA in its most basic form is defined as earnings before interest expense, income taxes, depreciation and amortization. EBITDA is a measure commonly used in the investment industry by management, investors and investment analysts in understanding and comparing results by factoring out the impact of different financing methods, capital structures, amortization techniques and income tax rates between companies in the same industry. While other companies, investors or investment analysts may not utilize the same method of calculating EBITDA (or adjustments thereto), the Company believes its adjusted base EBITDA metric, in particular, results in a better comparison of the Company’s underlying operations against its peers and a better indicator of recurring results from operations as compared to other non-IFRS financial measures.
Neither EBITDA, adjusted EBITDA or adjusted base EBITDA have standardized meaning under IFRS. Consequently, they should not be considered in isolation, nor should they be used in substitute for measures of performance prepared in accordance with IFRS.
The following table outlines how our EBITDA, Adjusted EBITDA and Adjusted base EBITDA measures are determined:
|
|
|
3 months ended |
|
12 months ended |
|
|
(in thousands $) |
|
Dec. 31, 2020 |
|
Dec. 31, 2019 |
|
Dec. 31, 2020 |
|
Dec. 31, 2019 |
|
|
Net income for the periods |
|
6,720 |
|
1,445 |
|
26,978 |
|
10,209 |
|
|
Adjustments: |
|
|
|
|
|
|
|
|
|
|
Interest expense |
|
331 |
|
269 |
|
1,237 |
|
1,036 |
|
|
Provision for income taxes |
|
2,561 |
|
948 |
|
7,684 |
|
2,741 |
|
|
Depreciation and amortization |
|
1,023 |
|
1,254 |
|
4,052 |
|
3,795 |
|
|
EBITDA |
|
10,635 |
|
3,916 |
|
39,951 |
|
17,781 |
|
|
Other adjustments: |
|
|
|
|
|
|
|
|
|
|
(Gain) loss on investments (1) |
|
3,089 |
|
1,422 |
|
(5,109 |
) |
1,055 |
|
|
Non-cash stock-based compensation |
|
1,307 |
|
648 |
|
2,835 |
|
3,863 |
|
|
Other expenses (2) |
|
4,266 |
|
2,274 |
|
11,035 |
|
7,123 |
|
|
Adjusted EBITDA |
|
19,297 |
|
8,260 |
|
48,712 |
|
29,822 |
|
|
Other adjustments: |
|
|
|
|
|
|
|
|
|
|
Carried interest and performance fees |
|
(10,075 |
) |
(1,811 |
) |
(10,075 |
) |
(1,811 |
) |
|
Carried interest and performance fee related expenses |
|
5,529 |
|
992 |
|
5,529 |
|
992 |
|
|
Adjusted base EBITDA |
|
14,751 |
|
7,441 |
|
44,166 |
|
29,003 |
|
|
Operating margin (3) |
|
51 |
% |
38 |
% |
49 |
% |
38 |
% |
(1) This adjustment removes the income effects of certain gains or losses on short-term investments, co-investments, and digital gold strategies to ensure the reporting objectives of our EBITDA metric as described above are met.
(2) In addition to the items outlined in Note 5 of the annual financial statements, Other expenses also include severance and new hire accruals of $0.1 million for the 3 months ended (3 months ended December 31, 2019 - $0.2 million) and $1.3 million for the 12 months ended (12 months ended December 31, 2019 - $1.1 million) and excludes income attributable to non-controlling interests of $0.3 million for the 3 months ended (3 months ended December 31, 2019 - $Nil) and $0.8 million for the 12 months ended (12 months ended December 31, 2019 - $Nil) (see Other expenses in Note 5 of the financial statements).
(3) Calculated as adjusted base EBITDA inclusive of depreciation and amortization, and excluding income related to legacy balance sheet loans. This figure is then divided by revenues before gains (losses) on investments, net of direct costs as applicable.
4
Business overview
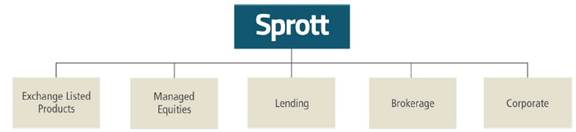
Our reportable operating segments are as follows:
Exchange listed products
· The Company’s closed-end physical trusts and exchange traded funds (“ETFs”).
Managed equities
· The Company’s alternative investment strategies managed in-house and on a sub-advised basis.
Lending
· The Company’s lending and streaming activities occur through limited partnership vehicles (“lending LPs”).
Brokerage
· The Company’s regulated broker-dealer activities (equity origination, corporate advisory, sales and trading).
Corporate
· Provides the Company’s operating segments with capital, balance sheet management and other shared services.
All other segments
· Contains all non-reportable segments as per IFRS 8, Operating Segments (“IFRS 8”). See Note 14 of the annual financial statements for further details.
For a detailed account of the underlying principal subsidiaries within our reportable business segments, refer to the Company’s Annual Information Form and Note 2 of the annual financial statements.
5
Performance highlights
Financial highlights
Environmental, Social, Governance highlights
Sprott is committed to incorporating ESG matters into our investment decision making and active ownership practices pursuant to the United Nations Principles for Responsible Investment. See “Environmental, social and governance” in the 2020 Annual Information Form for additional details. Below are additional ESG related highlights pertaining to the 2020 fiscal year.
Environmental
· Donation to American Australian Association’s Bush Fire Relief Fund
· Closed on the acquisition of U.S clean energy fund assets (Brookfield Renewable Partners: 50.1%; Sprott Korea led consortium: 49.9%)
Social
· Women and BIPOC make up 30%+ of board and senior leadership
· Signed 2020 BlackNorth initiative (along with over 200 public and private companies) to address workplace injustice against BIPOC in Canada
· Donation to various COVID-19 relief projects (including Toronto General Hospital and YMCA)
· Launched Sprott scholarship for women in finance at Carlton University
· Launched mandatory company wide unconscious bias training
Governance
· Engaged Global Governance Advisors for a 2021 project to assist in further enhancing our governance practices as we grow and expand our reach into international regulatory environments in the U.S, Europe and Asia
· Our compensation practices continue to produce a mix of pay reflecting the objectives of our shareholders that management be compensated more towards variable at-risk pay (annual incentive plan; “AIP”) and long-term stock incentives (long-term incentive plan; “LTIP”)
· Hired an independent audit firm to conduct a 2021 review of our cybersecurity framework against the best practices noted in the National Institute of Standards & Technology Cybersecurity Framework (“NIST Framework”)
6
Outlook
Our businesses
We anticipate continued strength in global precious metals and mining equities markets throughout 2021, which benefits our exchange listed products and managed equities segments. However, we anticipate flat-to-lower AUM in our lending segment as capital calls into new lending LPs are offset by capital distributions from older lending LPs that will be wound up later in the year (at which time, we would expect to crystallize material carried interest gains from those LPs). On the transactions side of the business, we anticipate mining sector equity origination and M&A activity to remain constructive in 2021, which benefits our brokerage segment.
At a consolidated level, we believe the aforementioned segment level results will lead to another strong year for Sprott Inc. in terms of continued earnings growth and strong operating margins.
Acquisition update
On January 17, 2020, the Company closed on the acquisition of Tocqueville Asset Management’s gold fund strategies. The Acquisition cost was $15 million and contingent consideration up to $35 million was payable over the two years following the close of the Acquisition, subject to the achievement of certain financial performance conditions.
Subsequent to year-end, Sprott successfully negotiated an amendment to the original terms of the purchase agreement. In lieu of any contingent consideration entitlement for the 2020 and 2021 fiscal years, the vendor accepted a final payment from Sprott of $30 million ($27 million in cash and $3 million in Sprott Inc. common shares). This enabled Sprott to lock-in the total acquisition price and return on investment economics going into 2021 and further enabled Sprott to retain the full benefits of any additional increase in AUM expected over 2021.
COVID-19 update
The changing economic and market climate as a result of COVID-19 has led to the Company implementing its business continuity plan. Our portfolio managers, brokerage professionals, enterprise shared services teams and key outsource service providers are fully operational. While the exact impacts of COVID-19 over the short and long-term are undeterminable at the date of this report, management believes the effects of COVID-19 we have witnessed thus far, and in particular, world government responses thereto via fiscal and monetary policy, will continue to be highly constructive to precious metals markets as we progress into 2021.
7
Summary financial information
|
(In thousands $) |
|
Q4
2020 |
|
Q3
2020 |
|
Q2
2020 |
|
Q1
2020 |
|
Q4
2019 |
|
Q3
2019 |
|
Q2
2019 |
|
Q1
2019 |
|
|
Summary income statements |
|
|
|
|
|
|
|
|
|
|
|
|
|
|
|
|
|
|
Management fees |
|
22,032 |
|
19,934 |
|
15,825 |
|
15,125 |
|
10,685 |
|
10,577 |
|
9,962 |
|
10,195 |
|
|
Carried interest and performance fees |
|
10,075 |
|
— |
|
— |
|
— |
|
1,811 |
|
— |
|
— |
|
— |
|
|
less: Trailer and sub-advisor fees |
|
371 |
|
291 |
|
326 |
|
154 |
|
966 |
|
50 |
|
67 |
|
— |
|
|
less: Carried interest and performance fee payouts |
|
5,529 |
|
— |
|
— |
|
— |
|
86 |
|
— |
|
— |
|
— |
|
|
Net fees |
|
26,207 |
|
19,643 |
|
15,499 |
|
14,971 |
|
11,444 |
|
10,527 |
|
9,895 |
|
10,195 |
|
|
Commissions |
|
6,761 |
|
9,386 |
|
6,133 |
|
5,179 |
|
6,599 |
|
6,056 |
|
3,293 |
|
3,315 |
|
|
less: Commission expense |
|
2,788 |
|
3,789 |
|
2,377 |
|
1,870 |
|
2,658 |
|
2,654 |
|
1,356 |
|
1,386 |
|
|
Net commissions |
|
3,973 |
|
5,597 |
|
3,756 |
|
3,309 |
|
3,941 |
|
3,402 |
|
1,937 |
|
1,929 |
|
|
Finance income (1) |
|
1,629 |
|
757 |
|
656 |
|
914 |
|
2,481 |
|
2,561 |
|
3,435 |
|
2,946 |
|
|
Gain (loss) on investments |
|
(3,089 |
) |
4,408 |
|
8,142 |
|
(4,352 |
) |
(1,252 |
) |
600 |
|
(408 |
) |
5 |
|
|
Other income |
|
949 |
|
914 |
|
285 |
|
113 |
|
364 |
|
91 |
|
93 |
|
77 |
|
|
Total net revenues |
|
29,669 |
|
31,319 |
|
28,338 |
|
14,955 |
|
16,978 |
|
17,181 |
|
14,952 |
|
15,152 |
|
|
|
|
|
|
|
|
|
|
|
|
|
|
|
|
|
|
|
|
|
Compensation |
|
20,193 |
|
16,280 |
|
10,991 |
|
10,125 |
|
10,269 |
|
9,714 |
|
7,463 |
|
7,801 |
|
|
less: Carried interest and performance fee payouts |
|
5,529 |
|
— |
|
— |
|
— |
|
86 |
|
— |
|
— |
|
— |
|
|
less: Commission expense |
|
2,788 |
|
3,789 |
|
2,377 |
|
1,870 |
|
2,658 |
|
2,654 |
|
1,356 |
|
1,386 |
|
|
less: Severance and new hire accruals |
|
65 |
|
210 |
|
358 |
|
667 |
|
157 |
|
168 |
|
650 |
|
109 |
|
|
Net compensation |
|
11,811 |
|
12,281 |
|
8,256 |
|
7,588 |
|
7,368 |
|
6,892 |
|
5,457 |
|
6,306 |
|
|
Severance and new hire accruals |
|
65 |
|
210 |
|
358 |
|
667 |
|
157 |
|
168 |
|
650 |
|
109 |
|
|
Placement and referral fees |
|
191 |
|
522 |
|
246 |
|
86 |
|
434 |
|
114 |
|
251 |
|
58 |
|
|
Selling, general and administrative |
|
2,439 |
|
2,523 |
|
3,049 |
|
3,544 |
|
2,986 |
|
3,175 |
|
3,256 |
|
3,062 |
|
|
Interest expense |
|
331 |
|
320 |
|
350 |
|
236 |
|
269 |
|
297 |
|
226 |
|
244 |
|
|
Depreciation and amortization |
|
1,023 |
|
992 |
|
1,049 |
|
988 |
|
1,254 |
|
893 |
|
819 |
|
829 |
|
|
Other expenses (gain) |
|
4,528 |
|
4,154 |
|
2,893 |
|
(1,081 |
) |
2,117 |
|
(167 |
) |
3,051 |
|
1,038 |
|
|
Total expenses |
|
20,388 |
|
21,002 |
|
16,201 |
|
12,028 |
|
14,585 |
|
11,372 |
|
13,710 |
|
11,646 |
|
|
|
|
|
|
|
|
|
|
|
|
|
|
|
|
|
|
|
|
|
Net income |
|
6,720 |
|
8,704 |
|
10,492 |
|
1,062 |
|
1,445 |
|
4,336 |
|
1,581 |
|
2,847 |
|
|
Net Iincome per share (2) |
|
0.27 |
|
0.36 |
|
0.43 |
|
0.04 |
|
0.06 |
|
0.18 |
|
0.06 |
|
0.12 |
|
|
Adjusted base EBITDA |
|
14,751 |
|
12,024 |
|
9,204 |
|
8,187 |
|
7,441 |
|
7,612 |
|
7,032 |
|
6,918 |
|
|
Adjusted base EBITDA per share (2) |
|
0.60 |
|
0.49 |
|
0.38 |
|
0.33 |
|
0.31 |
|
0.31 |
|
0.29 |
|
0.28 |
|
|
Operating margin |
|
51 |
% |
47 |
% |
49 |
% |
43 |
% |
38 |
% |
36 |
% |
39 |
% |
39 |
% |
|
Summary balance sheet |
|
|
|
|
|
|
|
|
|
|
|
|
|
|
|
|
|
|
Total assets |
|
377,348 |
|
358,300 |
|
338,931 |
|
318,318 |
|
324,943 |
|
325,442 |
|
338,530 |
|
332,504 |
|
|
Total liabilities |
|
86,365 |
|
81,069 |
|
70,818 |
|
65,945 |
|
53,313 |
|
51,774 |
|
68,008 |
|
54,009 |
|
|
|
|
|
|
|
|
|
|
|
|
|
|
|
|
|
|
|
|
|
Total AUM |
|
17,390,389 |
|
16,259,184 |
|
13,893,039 |
|
10,734,831 |
|
9,252,515 |
|
8,548,982 |
|
8,103,723 |
|
7,909,488 |
|
|
Average AUM |
|
16,719,815 |
|
16,705,046 |
|
13,216,415 |
|
11,007,781 |
|
8,932,651 |
|
8,608,001 |
|
7,898,334 |
|
7,887,089 |
|
(1) Finance income includes: (1) co-investment income from lending LP units; (2) ancillary income earned directly or indirectly from lending activities; and (3) interest income from on-balance sheet loans and brokerage client accounts
(2) Per share amounts for periods before May 28, 2020 reflect retrospective treatment of the 10:1 share consolidation.
8
Results of operations
AUM summary
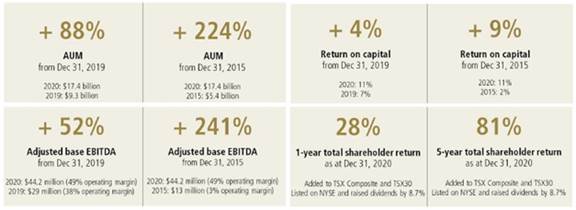
AUM reached a record $17.4 billion as at December 31, 2020, up $1.1 billion (7%) from September 30, 2020 and up $8.1 billion (88%) from December 31, 2019. On a three and twelve months ended basis, we benefited from strong market value appreciation across most of our fund products. We also benefited from strong inflows in our physical trusts that more than offset the anticipated redemption experience in our precious metals strategies post-Acquisition (the Acquisition added $1.7 billion of AUM at time of closing).
3 months results
|
(In millions $) |
|
AUM
Sep. 30, 2020 |
|
Net
inflows (1) |
|
Market
value
changes |
|
Other (2) |
|
AUM
Dec. 31, 2020 |
|
Blended
management
fee rate (3) |
|
|
Exchange listed products |
|
|
|
|
|
|
|
|
|
|
|
|
|
|
- Physical trusts |
|
11,131 |
|
201 |
|
519 |
|
— |
|
11,851 |
|
0.39 |
% |
|
- ETFs |
|
381 |
|
15 |
|
(14 |
) |
— |
|
382 |
|
0.35 |
% |
|
|
|
11,512 |
|
216 |
|
505 |
|
— |
|
12,233 |
|
0.39 |
% |
|
|
|
|
|
|
|
|
|
|
|
|
|
|
|
|
Managed equities |
|
|
|
|
|
|
|
|
|
|
|
|
|
|
- Precious metals strategies |
|
2,447 |
|
(9 |
) |
41 |
|
— |
|
2,479 |
|
0.79 |
% |
|
- Other (4) |
|
312 |
|
— |
|
40 |
|
— |
|
352 |
|
0.92 |
% |
|
|
|
2,759 |
|
(9 |
) |
81 |
|
— |
|
2,831 |
|
0.81 |
% |
|
|
|
|
|
|
|
|
|
|
|
|
|
|
|
|
Lending (5) |
|
906 |
|
94 |
|
18 |
|
(19 |
) |
999 |
|
1.05 |
% |
|
|
|
|
|
|
|
|
|
|
|
|
|
|
|
|
Other (6) |
|
1,082 |
|
87 |
|
158 |
|
— |
|
1,327 |
|
0.79 |
% |
|
|
|
|
|
|
|
|
|
|
|
|
|
|
|
|
Total (7) |
|
16,259 |
|
388 |
|
762 |
|
(19 |
) |
17,390 |
|
0.53 |
% |
12 months results
|
(In millions $) |
|
AUM
Dec. 31, 2019 |
|
Net
inflows (1) |
|
Market
value
changes |
|
Other (2) |
|
AUM
Dec. 31, 2020 |
|
Blended
management
fee rate (3) |
|
|
Exchange listed products |
|
|
|
|
|
|
|
|
|
|
|
|
|
|
- Physical trusts |
|
6,579 |
|
2,752 |
|
2,520 |
|
— |
|
11,851 |
|
0.39 |
% |
|
- ETFs |
|
252 |
|
61 |
|
69 |
|
— |
|
382 |
|
0.35 |
% |
|
|
|
6,831 |
|
2,813 |
|
2,589 |
|
— |
|
12,233 |
|
0.39 |
% |
|
|
|
|
|
|
|
|
|
|
|
|
|
|
|
|
Managed equities |
|
|
|
|
|
|
|
|
|
|
|
|
|
|
- Precious metals strategies |
|
601 |
|
(658 |
) |
795 |
|
1,741 |
|
2,479 |
|
0.79 |
% |
|
- Other (4) |
|
350 |
|
16 |
|
(14 |
) |
— |
|
352 |
|
0.92 |
% |
|
|
|
951 |
|
(642 |
) |
781 |
|
1,741 |
|
2,831 |
|
0.81 |
% |
|
|
|
|
|
|
|
|
|
|
|
|
|
|
|
|
Lending (5) |
|
783 |
|
260 |
|
41 |
|
(85 |
) |
999 |
|
1.05 |
% |
|
|
|
|
|
|
|
|
|
|
|
|
|
|
|
|
Other (6) |
|
688 |
|
226 |
|
413 |
|
— |
|
1,327 |
|
0.79 |
% |
|
|
|
|
|
|
|
|
|
|
|
|
|
|
|
|
Total (7) |
|
9,253 |
|
2,657 |
|
3,824 |
|
1,656 |
|
17,390 |
|
0.53 |
% |
(1) See ‘Net inflows’ in the key performance indicators (non-IFRS financial measures) section of this MD&A.
(2) Includes new AUM from fund acquisitions and lost AUM from fund divestitures and capital distributions of our lending LPs.
(3) Management fee rate represents the net amount received by the Company.
(4) Includes institutional managed accounts.
(5) $1.1 billion of committed capital remains uncalled, of which $0.4 billion earns a commitment fee (AUM), and $0.7 billion does not (future AUM).
(6) Includes Sprott Korea Corp., private equity strategy in Sprott Asia and high net worth discretionary managed accounts in the U.S.
(7) No performance fees are earned on exchange listed products. Performance fees are earned on all precious metals strategies (other than bullion funds) based on returns above relevant benchmarks. Other managed equities strategies primarily earn performance fees on flow-through products. Lending funds earn carried interest calculated as a pre-determined net profit over a preferred return.
9
Key revenue lines
Management fees
Management fees were $22 million in the quarter, up $11.3 million from the prior period and were $72.9 million on a full year basis, up $31.5 million. Performance fees finished the year at $10.1 million, up $8.3 million from the prior period. Net fees were $26.2 million in the quarter, up $14.8 million from the prior period and were $76.3 million on a full year basis, up $34.3 million. The revenue increases in the quarter and on a full year basis were primarily due to strong net inflows and market value appreciation in our exchange listed products segment. We also benefited from strong market value appreciation and the addition of new AUM from the Acquisition in our managed equities segment and higher fees in our lending segment.
Commission revenues
Commission revenues were $6.8 million in the quarter, up $0.2 million (2%) from the prior period and were $27.5 million on a full year basis, up $8.2 million (43%). Net commissions were $4 million in the quarter, up slightly from the prior period and were $16.6 million on a full year basis, up $5.4 million (48%). The increase was due to strong equity origination, sales and trading activities in our brokerage segment throughout the year.
Finance income
Finance income was $1.6 million in the quarter, down $0.9 million (34%) from the prior period and was $4 million on a full year basis, down $7.5 million (65%). Finance income primarily includes interest income from our co-investments in LP units and other ancillary income earned directly or indirectly from lending activities. The comparative period finance income also includes interest income from legacy loans. Lower finance income in the quarter and on a full year basis was primarily due to the repayment of legacy balance sheet loans.
10
Key expense lines
Compensation
Compensation was $20.2 million in the quarter, up $9.9 million (97%) from the prior period and was $57.6 million on a full year basis, up $22.3 million (63%). Net compensation was $11.8 million in the quarter, up $4.4 million (60%) from the prior period and was $39.9 million on a full year basis, up $13.9 million (53%).

The increase in the quarter and on a full year basis was primarily due to higher variable at-risk pay relating to the Company’s significantly improved financial performance over the year. Annual adjusted base EBITDA was up 52% year-over-year, consistent with the 53% increase year-over-year in net compensation. Adjusted base EBITDA, operating margins and net revenue targets form the basis of the quantitative performance measures used when determining variable at-risk compensation. Higher compensation was also the result of additional base salaries attributable to new hires from the Acquisition. The Company reduced its compensation ratio over the last five years (net compensation / net fees & net commissions) from a high of 54% to a low of 43% in 2020 while correspondingly increasing the proportion of variable at-risk pay (AIP and LTIP) our employees receive relative to fixed compensation.
Selling, general & administrative (“SG&A”)
SG&A was $2.4 million in the quarter, down $0.5 million (18%) from the prior period and was $11.6 million on a full year basis, down $0.9 million (7%). The decrease in the quarter and on a full year basis was the result of lower marketing and sales costs relating to travel restrictions due to COVID-19.
11
Earnings
Net income was $6.7 million in the quarter, up $5.3 million from the prior period and was $27 million on a full year basis, up $16.8 million. Adjusted base EBITDA was $14.8 million in the quarter, up $7.3 million (98%) from the prior period and was $44.2 million on a full year basis, up $15.2 million (52%). During the quarter and on a full year basis, we benefited from increased fees due to strong net inflows and market value appreciation in our exchange listed products segment, the Acquisition and additional market value appreciation in our managed equities segment. We also benefited from increased commission revenues in our brokerage segment. These increases more than offset lower finance income in our lending segment and higher variable at-risk compensation on increased revenues, earnings generation and strong operating margins across the Company.
Additional revenues and expenses
Investment gains on a full year basis were mainly due to market value appreciation of certain equity holdings and co-investments. These gains were partially offset by unrealized losses on digital gold strategies in the fourth quarter.
Other income was higher mainly due to the consolidation of certain feeder funds. Interest expense, placement and referral fees were largely flat year-over-year.
Amortization of intangibles was flat from the prior period. Depreciation of property was slightly higher on a full year basis from the prior period mainly due to increased depreciation expense related to a new lease attributable to the Acquisition.
Other expenses were higher primarily due to the increase in contingent consideration related to the Acquisition.
Balance sheet
Total assets were $377.3 million, up $52.4 million (16%) from December 31, 2019. The increase was primarily due to the increase in intangible assets related to the Acquisition.
Total liabilities were $86.4 million, up $33.1 million (62%) from December 31, 2019. The increase was primarily due to the accrual of contingent consideration related to the Acquisition and accrued liabilities related to non-controlling interest.
Total shareholder’s equity was $291 million, up $19.4 million (7%) from December 31, 2019.
12
Reportable operating segments
Exchange listed products
|
|
|
3 months ended |
|
12 months ended |
|
|
(In thousands $) |
|
Dec. 31, 2020 |
|
Dec. 31, 2019 |
|
Dec. 31, 2020 |
|
Dec. 31, 2019 |
|
|
Summary income statement |
|
|
|
|
|
|
|
|
|
|
Management fees |
|
11,449 |
|
6,574 |
|
37,670 |
|
24,481 |
|
|
Other income |
|
1 |
|
21 |
|
10 |
|
47 |
|
|
Total revenues |
|
11,450 |
|
6,595 |
|
37,680 |
|
24,528 |
|
|
|
|
|
|
|
|
|
|
|
|
|
Net compensation |
|
1,437 |
|
1,101 |
|
5,085 |
|
3,662 |
|
|
Severance and new hire accruals |
|
— |
|
21 |
|
73 |
|
147 |
|
|
Selling, general and administrative |
|
553 |
|
939 |
|
2,230 |
|
3,034 |
|
|
Interest expense |
|
76 |
|
201 |
|
338 |
|
824 |
|
|
Depreciation and amortization |
|
242 |
|
239 |
|
940 |
|
952 |
|
|
Other expenses |
|
994 |
|
320 |
|
485 |
|
655 |
|
|
Total expenses |
|
3,302 |
|
2,821 |
|
9,151 |
|
9,274 |
|
|
|
|
|
|
|
|
|
|
|
|
|
Income before income taxes |
|
8,148 |
|
3,774 |
|
28,529 |
|
15,254 |
|
|
Adjusted base EBITDA |
|
9,497 |
|
4,575 |
|
30,563 |
|
17,988 |
|
|
Operating margin |
|
81 |
% |
68 |
% |
79 |
% |
73 |
% |
|
|
|
|
|
|
|
|
|
|
|
|
Total AUM |
|
12,233,316 |
|
6,831,093 |
|
12,233,316 |
|
6,831,093 |
|
|
Average AUM |
|
11,786,235 |
|
6,741,239 |
|
9,914,709 |
|
6,261,066 |
|
3 and 12 months ended
Income before income taxes was $8.1 million in the quarter, up $4.4 million from the prior period and was $28.5 million on a full year basis, up $13.3 million. Adjusted base EBITDA was $9.5 million in the quarter, up $4.9 million from the prior period and was $30.6 million on a full year basis, up $12.6 million. Our quarter and full year results benefited from higher average AUM given strong inflows and market value appreciation in our physical trust products which more than offset higher net compensation.
13
Managed equities
|
|
|
3 months ended |
|
12 months ended |
|
|
(In thousands $) |
|
Dec. 31, 2020 |
|
Dec. 31, 2019 |
|
Dec. 31, 2020 |
|
Dec. 31, 2019 |
|
|
Summary income statement |
|
|
|
|
|
|
|
|
|
|
Management fees |
|
5,901 |
|
2,001 |
|
20,621 |
|
7,805 |
|
|
Carried interest and performance fees |
|
10,075 |
|
1,811 |
|
10,075 |
|
1,811 |
|
|
less: Trailer and sub-advisor fees |
|
400 |
|
998 |
|
1,262 |
|
1,211 |
|
|
less: Carried interest and performance fee payouts |
|
5,529 |
|
86 |
|
5,529 |
|
86 |
|
|
Net fees |
|
10,047 |
|
2,728 |
|
23,905 |
|
8,319 |
|
|
Gain on investments |
|
1,719 |
|
1,176 |
|
9,803 |
|
3,558 |
|
|
Other income |
|
297 |
|
364 |
|
855 |
|
884 |
|
|
Total net revenues |
|
12,063 |
|
4,268 |
|
34,563 |
|
12,761 |
|
|
|
|
|
|
|
|
|
|
|
|
|
Net compensation |
|
2,287 |
|
954 |
|
8,234 |
|
4,470 |
|
|
Severance and new hire accruals |
|
12 |
|
90 |
|
142 |
|
90 |
|
|
Selling, general and administrative |
|
356 |
|
613 |
|
1,726 |
|
1,876 |
|
|
Interest expense |
|
200 |
|
— |
|
686 |
|
— |
|
|
Depreciation and amortization |
|
54 |
|
51 |
|
208 |
|
212 |
|
|
Other expenses |
|
2,579 |
|
20 |
|
4,899 |
|
200 |
|
|
Total expenses |
|
5,488 |
|
1,728 |
|
15,895 |
|
6,848 |
|
|
|
|
|
|
|
|
|
|
|
|
|
Income before income taxes |
|
6,575 |
|
2,540 |
|
18,668 |
|
5,913 |
|
|
Adjusted base EBITDA |
|
3,288 |
|
791 |
|
10,762 |
|
3,167 |
|
|
Operating margin |
|
56 |
% |
32 |
% |
53 |
% |
35 |
% |
|
|
|
|
|
|
|
|
|
|
|
|
Total AUM |
|
2,831,023 |
|
950,911 |
|
2,831,023 |
|
950,911 |
|
|
Average AUM |
|
2,735,878 |
|
907,365 |
|
2,649,120 |
|
854,691 |
|
3 and 12 months ended
Income before income taxes was $6.6 million in the quarter, up $4 million from the prior period and was $18.7 million on a full year basis, up $12.8 million. Our quarter and full year results benefited from increased management fees from the Acquisition, higher net performance fees and improved equity valuations in our funds, which more than offset higher net compensation and higher other expenses resulting from increase in contingent consideration related to the Acquisition. Adjusted base EBITDA was $3.3 million in the quarter, up $2.5 million from the prior period and was $10.8 million on a full year basis, up $7.6 million. Our quarter and full year results benefited from increased management fees, which more than offset higher net compensation.
14
Lending
|
|
|
3 months ended |
|
12 months ended |
|
|
(In thousands $) |
|
Dec. 31, 2020 |
|
Dec. 31, 2019 |
|
Dec. 31, 2020 |
|
Dec. 31, 2019 |
|
|
Summary income statement |
|
|
|
|
|
|
|
|
|
|
Management fees |
|
2,198 |
|
1,388 |
|
9,366 |
|
5,646 |
|
|
Finance income (1) |
|
1,629 |
|
2,261 |
|
3,838 |
|
9,962 |
|
|
Gain (loss) on investments |
|
2,062 |
|
(101 |
) |
2,037 |
|
(1,152 |
) |
|
Other income |
|
185 |
|
268 |
|
268 |
|
289 |
|
|
Total revenues |
|
6,074 |
|
3,816 |
|
15,509 |
|
14,745 |
|
|
|
|
|
|
|
|
|
|
|
|
|
Net compensation |
|
1,631 |
|
1,256 |
|
5,788 |
|
4,944 |
|
|
Severance and new hire accruals |
|
15 |
|
— |
|
212 |
|
61 |
|
|
Placement and referral fees |
|
41 |
|
15 |
|
192 |
|
44 |
|
|
Selling, general and administrative |
|
318 |
|
222 |
|
887 |
|
777 |
|
|
Interest expense |
|
— |
|
30 |
|
11 |
|
61 |
|
|
Depreciation and amortization |
|
1 |
|
27 |
|
53 |
|
107 |
|
|
Other expenses |
|
2,115 |
|
1,577 |
|
1,326 |
|
2,230 |
|
|
Total expenses |
|
4,121 |
|
3,127 |
|
8,469 |
|
8,224 |
|
|
|
|
|
|
|
|
|
|
|
|
|
Income before income taxes |
|
1,953 |
|
689 |
|
7,040 |
|
6,521 |
|
|
Adjusted base EBITDA |
|
2,423 |
|
2,459 |
|
7,272 |
|
10,725 |
|
|
Operating margin |
|
61 |
% |
64 |
% |
59 |
% |
56 |
% |
|
|
|
|
|
|
|
|
|
|
|
|
Total AUM (2) |
|
999,037 |
|
783,328 |
|
999,037 |
|
783,328 |
|
|
Average AUM |
|
950,909 |
|
555,868 |
|
880,577 |
|
496,361 |
|
(1) Includes: (1) co-investment income from lending LP units held as part of our co-investment portfolio; and (2) interest income from on-balance sheet loans in the prior period.
(2) $1.1 billion of committed capital remains uncalled, of which $0.4 billion earns a commitment fee (AUM), and $0.7 billion does not (future AUM).
3 and 12 months ended
Income before income taxes was $2 million in the quarter, up $1.3 million from the prior period and was $7 million on a full year basis, up $0.5 million. Adjusted base EBITDA was $2.4 million in the quarter, down slightly from the prior period and was $7.3 million on a full year basis, down $3.5 million (32%). Income before income taxes benefited from higher management fees and gains on our co-investments. However, our quarter and full year adjusted base EBITDA results were primarily impacted by lower finance income given the full repayment of legacy loans in the third quarter of 2019, which more than offset increased management fees on a full year basis.
15
Brokerage
|
|
|
3 months ended |
|
12 months ended |
|
|
(In thousands $) |
|
Dec. 31, 2020 |
|
Dec. 31, 2019 |
|
Dec. 31, 2020 |
|
Dec. 31, 2019 |
|
|
Summary income statement |
|
|
|
|
|
|
|
|
|
|
Commissions |
|
6,882 |
|
6,261 |
|
26,705 |
|
18,480 |
|
|
less: Commission expense |
|
2,713 |
|
2,650 |
|
10,749 |
|
8,024 |
|
|
Net commissions |
|
4,169 |
|
3,611 |
|
15,956 |
|
10,456 |
|
|
Management fees |
|
886 |
|
358 |
|
2,168 |
|
1,298 |
|
|
Finance income |
|
— |
|
220 |
|
118 |
|
1,461 |
|
|
Gain (loss) on investments |
|
5 |
|
165 |
|
1,590 |
|
(113 |
) |
|
Other income |
|
24 |
|
22 |
|
102 |
|
82 |
|
|
Total net revenues |
|
5,084 |
|
4,376 |
|
19,934 |
|
13,184 |
|
|
|
|
|
|
|
|
|
|
|
|
|
Net compensation (1) |
|
1,859 |
|
1,667 |
|
6,033 |
|
6,510 |
|
|
Severance and new hire accruals |
|
30 |
|
25 |
|
680 |
|
390 |
|
|
Placement and referral fees |
|
98 |
|
355 |
|
603 |
|
673 |
|
|
Selling, general and administrative |
|
1,031 |
|
835 |
|
4,151 |
|
4,299 |
|
|
Interest expense |
|
12 |
|
13 |
|
45 |
|
58 |
|
|
Depreciation and amortization |
|
145 |
|
136 |
|
533 |
|
491 |
|
|
Other expenses (gain) |
|
494 |
|
24 |
|
660 |
|
(3 |
) |
|
Total expenses |
|
3,669 |
|
3,055 |
|
12,705 |
|
12,418 |
|
|
|
|
|
|
|
|
|
|
|
|
|
Income before income taxes |
|
1,415 |
|
1,321 |
|
7,229 |
|
766 |
|
|
Adjusted base EBITDA |
|
2,522 |
|
1,756 |
|
8,052 |
|
3,342 |
|
|
Operating margin |
|
53 |
% |
41 |
% |
47 |
% |
24 |
% |
(1) Net compensation is presented excluding commission expense, which is reported net of commission revenue.
3 and 12 months ended
Income before income taxes was $1.4 million in the quarter, up $0.1 million from the prior period and was $7.2 million on a full year basis, up $6.5 million. Adjusted base EBITDA was $2.5 million in the quarter, up $0.8 million from the prior period and was $8.1 million on a full year basis, up $4.7 million. Our quarter and full year results benefited from strong equity origination, sales and trading activities.
16
Corporate
This segment is primarily a cost centre that provides capital, balance sheet management and shared services to the Company’s subsidiaries.
|
|
|
3 months ended |
|
12 months ended |
|
|
(In thousands $) |
|
Dec. 31, 2020 |
|
Dec. 31, 2019 |
|
Dec. 31, 2020 |
|
Dec. 31, 2019 |
|
|
Summary income statement |
|
|
|
|
|
|
|
|
|
|
Loss on investments |
|
(6,793 |
) |
(2,111 |
) |
(7,351 |
) |
(2,668 |
) |
|
Other income |
|
71 |
|
19 |
|
137 |
|
64 |
|
|
Total revenues |
|
(6,722 |
) |
(2,092 |
) |
(7,214 |
) |
(2,604 |
) |
|
|
|
|
|
|
|
|
|
|
|
|
Net compensation |
|
3,987 |
|
1,933 |
|
13,036 |
|
5,745 |
|
|
Severance and new hire accruals |
|
— |
|
21 |
|
52 |
|
25 |
|
|
Selling, general and administrative |
|
331 |
|
366 |
|
1,699 |
|
1,922 |
|
|
Interest expense |
|
43 |
|
25 |
|
157 |
|
93 |
|
|
Depreciation and amortization |
|
572 |
|
795 |
|
2,286 |
|
2,006 |
|
|
Other expenses (gain) |
|
389 |
|
(211 |
) |
1,336 |
|
113 |
|
|
Total expenses |
|
5,322 |
|
2,929 |
|
18,566 |
|
9,904 |
|
|
|
|
|
|
|
|
|
|
|
|
|
Income (loss) before income taxes |
|
(12,044 |
) |
(5,021 |
) |
(25,780 |
) |
(12,508 |
) |
|
Adjusted base EBITDA |
|
(3,965 |
) |
(2,045 |
) |
(13,722 |
) |
(7,290 |
) |
3 and 12 months ended
· Investments losses were primarily due to unrealized losses on our digital gold strategies in the fourth quarter.
· Net compensation increased primarily due to higher variable at-risk compensation on increased revenues, earnings generation and strong operating margins across the Company, and higher base salaries as a result of the Acquisition.
· SG&A decreased due to our ongoing multi-year cost containment program.
· Other expenses were primarily due to FX translation movements.
17
Dividends
The following dividends were declared by the Company during the twelve months ended December 31, 2020:
|
Record date |
|
Payment Date |
|
Cash dividend
per share (1) |
|
Total dividend amount
(in thousands $) |
|
|
March 9, 2020 - Regular dividend Q4 2019 |
|
March 24, 2020 |
|
CAD$ |
0.30 |
|
5,387 |
|
|
May 19, 2020 - Regular dividend Q1 2020 |
|
June 3, 2020 |
|
CAD$ |
0.30 |
|
5,560 |
|
|
August 17, 2020 - Regular dividend Q2 2020 |
|
September 1, 2020 |
|
US$ |
0.23 |
|
5,915 |
|
|
November 23, 2020 - Regular dividend Q3 2020 |
|
December 8, 2020 |
|
US$ |
0.25 |
|
6,378 |
|
|
Dividends (2) |
|
|
|
|
|
23,240 |
|
(1) Dividends per share in this MD&A for periods before May 28 reflect retrospective treatment of the 10:1 share consolidation.
(2) Subsequent to quarter-end, on February 25, 2021, a regular dividend of US$0.25 per common share was declared for the year ended December 31, 2020. This dividend is payable on March 23, 2021 to shareholders of record at the close of business on March 8, 2021.
Capital stock
On May 28, 2020, the Company successfully completed a 10:1 common share consolidation. Shareholders received 1 post-consolidation share for every 10 pre-consolidation shares. All information pertaining to shares and per-share amounts in this MD&A for periods before May 28 reflect retrospective treatment of this share consolidation.
Including the 0.8 million unvested common shares currently held in the EPSP Trust (December 31, 2019 - 0.9 million), total capital stock issued and outstanding was 25.6 million (December 31, 2019 - 25.3 million).
Earnings per share for the current and prior periods have been calculated using the weighted average number of shares outstanding during the respective periods. Basic earnings per share was $0.27 for the quarter and $1.10 on a full year basis compared to $0.06 and $0.42 in the prior periods respectively. Diluted earnings per share was $0.26 in the quarter and $1.05 on a full year basis compared to $0.06 and $0.40 in the prior periods respectively. Diluted earnings per share reflects the dilutive effect of in-the-money stock options, unvested shares held in the EPSP Trust and outstanding restricted stock units.
A total of 162,500 stock options are outstanding pursuant to our stock option plan, all of which are exercisable.
18
Liquidity and capital resources
As at December 31, 2020, the Company had $17 million (December 31, 2019 - $15.3 million) outstanding on its credit facility, all of which is due after 12 months (December 31, 2019 - $3.8 million due within 12 months and $11.5 million due after 12 months).
On November 13, 2020, the Company extended and upsized its previous credit facility to $70 million, up from $61 million at the time of the extension. Amounts under the new facility may be borrowed under the facility through prime rate loans or bankers’ acceptances. Similar to the previous facility, amounts may also be borrowed in US dollars through base rate loans. As at December 31, 2020, the Company was in compliance with all covenants, terms and conditions under the credit facility. Key terms under the credit facility are noted below:
Structure
· 5-year, $70 million revolver with “bullet maturity” December 14, 2025
Interest rate
· Prime rate + 0 bps or;
· Banker acceptance rate + 170 bps
Covenant terms
· Minimum AUM: 70% of AUM on November 13, 2020
· Debt to EBITDA less than or equal to 2.5:1
· EBITDA to interest expense more than or equal to 2.5:1
Commitments
Besides the Company’s long-term lease agreements, there are commitments to make co-investments in lending LPs arising from our lending segment or commitments to make investments in the net investments portfolio of the Company. As at December 31, 2020, the Company had $4.6 million in co-investment commitments from the lending segment (December 31, 2019 - $6.6 million).
19
Critical accounting estimates, judgements and changes in accounting policies
The key assumptions concerning the future and other key sources of estimation uncertainty at the reporting date that have a significant risk of causing a material adjustment to the carrying amounts of assets and liabilities are described below. The Company based its assumptions and estimates on parameters available when the annual financial statements were prepared. Existing circumstances and assumptions about future developments may change due to market changes or circumstances arising beyond the control of the Company. Such changes are reflected in the assumptions and estimates as they occur. The Company’s significant accounting policies are described in Note 2 of the annual financial statements. Certain of these accounting policies require management to make key assumptions concerning the future and consider other sources of estimation uncertainty at the reporting date. These accounting estimates are considered critical because they require subjective and/or complex judgements that may have a material impact on the value of our assets, liabilities, revenues and expenses.
Critical accounting estimates
Impairment of goodwill and intangible assets
All indefinite life intangible assets and goodwill are assessed for impairment, however, finite life intangibles are only tested for impairment to the extent indicators of impairment exist at the time of a quarterly assessment. In the case of goodwill and indefinite life intangibles, this annual test for impairment augments the quarterly impairment indicator assessments. Values associated with goodwill and intangibles involve estimates and assumptions, including those with respect to future cash inflows and outflows, discount rates, AUM, net inflows, and asset lives. These estimates require significant judgment regarding market growth rates, fund flow assumptions, expected margins and costs, which could affect the Company’s future results if estimates of future performance and fair value change.
Fair value of financial instruments
When the fair value of financial assets and financial liabilities recorded in the consolidated balance sheets cannot be derived from active markets, they are determined using valuation techniques and models. Model inputs are taken from observable markets where possible, but where this is not feasible, unobservable inputs may be used. These unobservable inputs include, but are not limited to, projected cash flows, discount rates, comparable recent transactions, volatility of underlying securities in warrant valuations and extraction recovery rates of mining projects. The use of unobservable inputs can involve significant judgment and materially affect the reported fair value of financial instruments.
Contingent consideration
The Acquisition necessitated the recognition of contingent consideration for the amounts payable in cash and shares under the terms of the purchase agreement. The cash settled portion of the contingent consideration was measured at the closing date fair value, based on management’s estimate of the level of future revenue obtained from the contracts over the contingent consideration measurement period. The equity settled portion of the contingent consideration was measured at its grant date fair value in accordance with the requirements of IFRS 2 Share-based Payment. The key judgments utilized in the estimation of the contingent consideration were fund flow assumptions. As at December 31, 2020, the contingent consideration payable was updated to reflect current estimates with the resulting adjustment recorded in Other expense.
Significant judgements
Investments in other entities
IFRS 10 Consolidated Financial Statements (“IFRS 10”) and IAS 28 Investments in Associates and Joint Ventures (“IAS 28”) provide for the use of judgment in determining whether an investee should be included within the consolidated financial statements of the Company and on what basis (subsidiary, joint venture, financial instrument or associate). Significant judgment is applied in evaluating facts and circumstances relevant to the Company and investee, including: (1) the extent of the Company’s direct and indirect interests in the investee; (2) the level of compensation to be received from the investee for management and other services provided to it; (3) “kick out rights” available to other investors in the investee; and (4) other indicators of the extent of power that the Company has over the investee.
20
Change in accounting policies
Change in presentation currency
Effective January 1, 2020, the Company changed its presentation currency from Canadian to US dollars to better reflect the Company’s business activities, given the significance of our revenues denominated in US dollars that further increased in 2020 with the January 17, 2020 close of the Acquisition.
The Company followed the guidance of IAS 21 Effects of Changes in Foreign Exchange Rates (“IAS 21”) and have applied the change retroactively. As a result, the Company has restated prior year comparatives, including the January 1 opening balance sheet as required by IFRS 1 First-time Adoption of International Financial Reporting Standards (“IFRS 1”). The change in presentation currency had the following effect:
· Assets and liabilities have been translated at the exchange rate on the respective reporting dates;
· Equity transactions have been translated at the historical exchange rate at the date of the transaction;
· The statements of operations has been translated at the average exchange rate on the respective reporting dates; and
· Exchange differences arising on translation are presented in the Accumulated other comprehensive loss line in shareholders’ equity on the balance sheet.
21
Managing financial risks
Market risk
The Company separates market risk into three categories: price risk, interest rate risk and foreign currency risk.
Price risk
Price risk arises from the possibility that changes in the price of the Company’s on and off-balance sheet assets and liabilities will result in changes in carrying value or recoverable amounts. The Company’s revenues are also exposed to price risk since management fees, carried interests and performance fees are correlated with AUM, which fluctuates with changes in the market values of the assets in the funds and managed accounts managed by the Company.
Interest rate risk
Interest rate risk arises from the possibility that changes in interest rates will adversely affect the value of, or cash flows from, financial instrument assets. The Company’s earnings, particularly through its lending segment, are exposed to volatility as a result of sudden changes in interest rates. Management takes into account a number of factors and is committed to several processes to ensure that this risk is appropriately managed.
Foreign currency risk
The Company enters into transactions that are denominated primarily in US dollar and Canadian dollar. Foreign currency risk arises from foreign exchange rate movements that could negatively impact either the carrying value of financial assets and liabilities or the related cash flows which are denominated in currencies other than the functional currency of the Company and its subsidiaries. The Company may employ certain hedging strategies to mitigate foreign currency risk.
Credit risk
Credit risk is the risk that a borrower will not honor its commitments and a loss to the Company may result. Credit risk generally arises in the Company’s investments portfolio.
Investments
The Company incurs credit risk when entering into, settling and financing transactions with counterparties. Management takes into account a number of factors and is committed to several processes to ensure that this risk is appropriately managed.
Other
The majority of accounts receivable relate to management fees, carried interest and performance fees receivable from the funds, managed accounts and managed companies managed by the Company. These receivables are short-term in nature and any credit risk associated with them is managed by dealing with counterparties that the Company believes to be creditworthy and by actively monitoring credit exposure and the financial health of the counterparties.
Liquidity risk
Liquidity risk is the risk that the Company cannot meet a demand for cash or fund its obligations as they come due. The Company’s exposure to liquidity risk is minimal as it maintains sufficient levels of liquid assets to meet its obligations as they come due. Additionally, the Company has access to a $70 million committed line of credit with a major Canadian schedule I chartered bank. As part of its cash management program, the Company primarily invests in short-term debt securities issued by the Government of Canada with maturities of less than three months.
22
The Company’s exposure to liquidity risk as it relates to our co-investments in lending LPs arises from fluctuations in cash flows from making capital calls and receiving capital distributions. The Company manages its loan co-investment liquidity risk through the ongoing monitoring of scheduled capital calls and distributions (“match funding”) and through its broader treasury risk management program and enterprise capital budgeting.
Financial liabilities, including accounts payable and accrued liabilities and compensation and employee bonuses payable, are short-term in nature and are generally due within a year.
The Company’s management team is responsible for reviewing resources to ensure funds are readily available to meet its financial obligations as they come due, as well as ensuring adequate funds exist to support business strategies and operations growth. The Company manages liquidity risk by monitoring cash balances on a daily basis and through its broader treasury risk management program. To meet any liquidity shortfalls, actions taken by the Company could include: slowing its co-investment activities; adjust or otherwise temporarily suspend AIPs; cut or temporarily suspend its dividend; drawing on the line of credit; liquidating net investments; and/or issuing common shares.
Concentration risk
A significant portion of the Company’s AUM as well as its investments are focused on the natural resource sector, and in particular, precious metals related investments and transactions. In addition, from time-to-time, certain investment may be concentrated to a material degree in a single position or group of positions. Management takes into account a number of factors and is committed to several processes to ensure that this risk is appropriately managed.
Disclosure controls and procedures (“DC&P”) and internal control over financial reporting (“ICFR”)
Management is responsible for the design and operational effectiveness of DC&P and ICFR in order to provide reasonable assurance regarding the disclosure of material information relating to the Company. This includes information required to be disclosed in the Company’s annual filings, interim filings and other reports filed under securities legislation, as well as the reliability of financial reporting and the preparation of financial statements for external purposes in accordance with IFRS.
Our chief executive officer and chief financial officer, after evaluating the effectiveness of our disclosure controls and procedures (as defined in the applicable U.S. and Canadian securities law), concluded that the Company’s DC&P and ICFR were properly designed and were operating effectively as of December 31, 2020. In addition, there were no material changes to ICFR during the quarter, and the implementation of our business continuity plan as a result of COVID-19 has not prevented the normal function of our internal controls.
Managing non-financial risks
Confidentiality of information
Confidentiality is essential to the success of the Company’s business, and it strives to consistently maintain the highest standards of trust, integrity and professionalism. Account information is kept under strict control in compliance with all applicable laws, and physical, procedural, and electronic safeguards are maintained in order to protect this information from access by unauthorized parties. The Company keeps the affairs of its clients confidential and does not disclose the identities of clients (absent expressed client consent to do so). If a prospective client requests a reference, the Company will not provide the name of an existing client before receiving permission from that client to do so.
23
Conflicts of interest
The Company established a number of policies with respect to employee personal trading. Employees may not trade any of the securities held or being considered for investment by any of the Company’s funds without prior approval. In addition, employees must receive prior approval before they are permitted to buy or sell securities. Speculative trading is strongly discouraged. All employees must comply with the Company’s Code of Ethics. The code establishes strict rules for professional conduct including the management of conflicts of interest.
Independent review committee
National Instrument 81-107 - Independent Review Committee for Investment Funds (“NI 81-107”) requires all publicly offered investment funds to establish an independent review committee (“IRC”) to whom all conflicts of interest matters must be referred for review and approval. The Company established an IRC for its public funds. As required by NI 81-107, the Company established written policies and procedures for dealing with conflict of interest matters and maintains records in respect of these matters and provides assistance to the IRC in carrying out its functions. The IRC is comprised of three independent members, and is subject to requirements to conduct regular assessments and provide reports to the Company and to the holders of interests in public mutual funds in respect of its functions.
Insurance
The Company maintains appropriate insurance coverage for general business and liability risks as well as insurance coverage required by regulation. Insurance coverage is reviewed periodically to ensure continued adequacy.
Internal controls and procedures
Several of the Company’s subsidiaries operate in regulated environments and are subject to business conduct rules and other rules and regulations. The Company has internal control policies related to business conduct. They include controls required to ensure compliance with the rules and regulations of relevant regulatory bodies including the OSC, IIROC, FINRA and the U.S. Securities and Exchange Commission (“SEC”).
Enterprise risk management
The starting point to any enterprise risk management program (“ERM”) is the articulation of a risk appetite, which is the amount and types of risk we are willing to accept in our pursuit of business objectives. A company’s risk appetite is the bedrock upon which an ERM framework is established.
Our risk appetite is primarily based on specific regulatory and legal environment considerations; general environmental social and governance responsibilities (“ESG”); the need for sound capital adequacy and treasury management processes; the preservation of our positive reputation among current and future stakeholders; the natural expectation of our shareholders that we take appropriate and reasonable levels of risk in our various business segments to maximize shareholder returns; and our overall desire to be good corporate citizens as part of our organizational culture and core values. The aforementioned considerations formed the basis for our risk appetite statements noted below:
· Regardless of loss probability, we will only accept inherent or residual risks that we have a proven, demonstrable ability to understand, diligently manage on an ongoing basis and thoroughly consider and balance relative to the outcomes; and
· Our risk appetite is low around any actions or inactions that could materially jeopardize the company’s reputation, core values or commitment to its stakeholders. Furthermore, at no point would we ever accept existential inherent or residual risks, regardless of loss probability.
24
The ERM process involves a comprehensive drill down through the organization to its constituent parts to identify all salient risks and evaluate them through the lens of our risk appetite. The following is a summary of the ERM steps used to filter organizational risks through our risk appetite:
· Identify all major processes within each business segment (and enterprise shared services function supporting them);
· Identify materially relevant inherent risks (both quantitative and qualitative), that may arise in each major process area;
· Rate each inherent risk (in the absence of internal controls), based on the degree of event probability and impact to the organization;
· Determine our risk tolerance for each inherent risk previously identified and rated;
· Identify internal controls in place (or needed) to mitigate the inherent risks down to the appropriate “residual level” (i.e. determine the post-controls risk rating and compare it to our predetermined risk tolerance level). NOTE: we stratify our internal controls universe using the “three lines of defense” approach recommended by the Institute of Internal Auditors prior to evaluating the effectiveness of internal controls;
· Compare all residual risk ratings to their corresponding risk tolerance level to ensure the risk is being appropriately managed (i.e. there are a sufficient number of, and appropriate types of, internal controls in place to manage the risk in light of our risk tolerance), and if not, take further action;
· Test, document and report on the effectiveness of the ERM program in managing risks within the boundaries of our risk appetite.
COVID-19 risk
The changing economic and market climate as a result of COVID-19 has led to the Company implementing its business continuity plan. Our portfolio managers, brokerage professionals, enterprise shared services teams and key outsource service providers are fully operational. While the exact impacts of COVID-19 over the short and long-term are undeterminable at the date of this report, management believes the effects of COVID-19 we have witnessed thus far, and in particular, world government responses thereto via fiscal and monetary policy, will continue to be highly constructive to precious metals markets as we progress into 2021.
Additional information relating to the Company, including the Company’s Annual Information Form is available on EDGAR at www.edgar.com and SEDAR at www.sedar.com
25