Exhibit (c)(10)
Preliminary Draft Subject to Change Valuation Impact Analysis March 13, 2019 Discussion Materials Prepared for The Conflicts Committee of the Board of Directors of American Midstream GP, LLC
Exhibit (c)(10)
Preliminary Draft Subject to Change Valuation Impact Analysis March 13, 2019 Discussion Materials Prepared for The Conflicts Committee of the Board of Directors of American Midstream GP, LLC
Preliminary Draft Subject to Change These materials have been prepared by Evercore Group L.L.C. (“Evercore”) for the Conflicts Committee of the Board of Directors of American Midstream GP, LLC (the “Conflicts Committee”), the general partner of American Midstream Partners, L.P., to whom such materials are directly addressed and delivered and may not be used or relied upon for any purpose other than as specifically contemplated by a written agreement with Evercore. These materials are based on information provided by or on behalf of the Conflicts Committee, from public sourcesor otherwise reviewed by Evercore. Evercore assumes no responsibility for independent investigation or verification of such information and has relied on such information being complete and accurate in all material respects. To the extent such information includes estimates and forecasts of future financial performance prepared by or reviewed with the management of the Partnership and/or other potential transaction participants or obtained from public sources, Evercore has assumed that such estimates and forecasts have been reasonably prepared on bases reflecting the best currently available estimates and judgments of such management (or, with respect to estimates and forecasts obtained from public sources, represent reasonable estimates). No representation or warranty, express or implied, is made as to the accuracy or completeness of such information and nothing contained herein is, or shall be relied upon as, a representation, whether as to the past, the present or the future. These materials were designed for use by specific persons familiar with the business and affairs of the Partnership. These materials are not intended to provide the sole basis for evaluating, and should not be considered a recommendation with respect to, any transaction or other matter. These materials have been developed by and are proprietary to Evercore and were prepared for the benefit and internaluse of the Conflicts Committee. These materials were compiled on a confidential basis for use by the Conflicts Committee and not with a view to public disclosure or filing thereof under state or federal securities laws, and may not be reproduced, disseminated, quoted or referred to, in whole or in part, without the prior written consent of Evercore. These materials do not constitute an offer or solicitation to sell or purchase any securities and are not a commitment by Evercore or any of its affiliates to provide or arrange any financing for any transaction or to purchase any security in connection therewith. Evercoreassumes no obligation to update or otherwise revise these materials. These materials may not reflect information known to other professionals in other business areas of Evercore and its affiliates. Evercore and its affiliates do not provide legal, accounting or tax advice. Accordingly, any statements contained herein as to tax matters were neither written nor intended by Evercore or its affiliates to be used and cannot be used by any taxpayer for the purpose of avoiding tax penalties that may be imposed on such taxpayer. Each person should seek legal, accounting and tax advice based on his, her or its particular circumstances from independent advisors regarding the impact of the transactions or matters described herein.
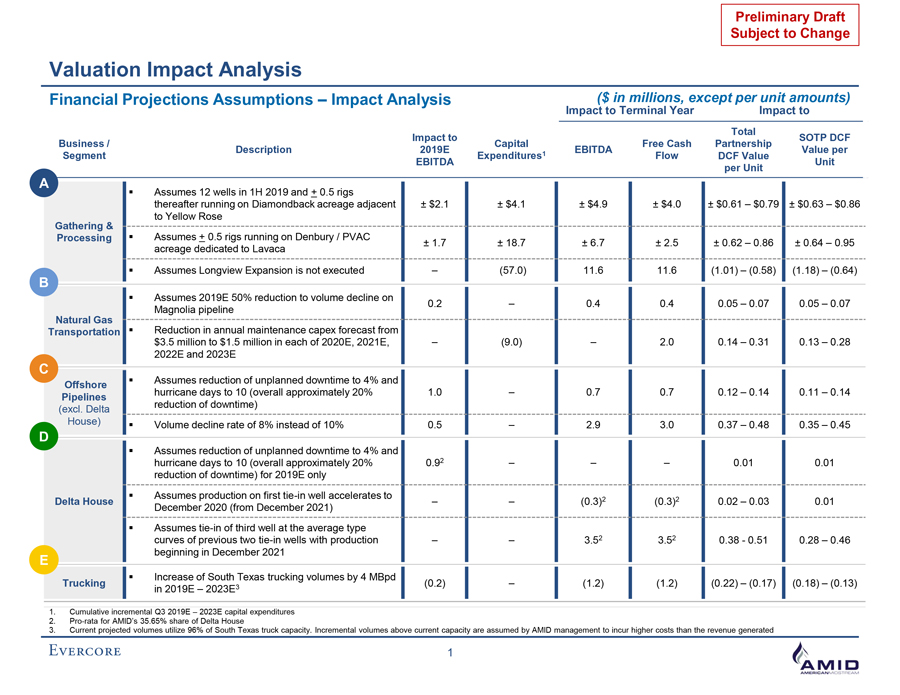
Preliminary Draft Subject to Change Valuation Impact Analysis Financial Projections Assumptions – Impact Analysis ($ in millions, except per unit amounts) Impact to Terminal Year Impact to Total Impact to SOTP DCF Business / Capital Free Cash Partnership Description 2019E 1 EBITDA Value per Segment Expenditures Flow DCF Value EBITDA Unit per Unit A Assumes 12 wells in 1H 2019 and + 0.5 rigs thereafter running on Diamondback acreage adjacent ± $2.1 ± $4.1 ± $4.9 ± $4.0 ± $0.61 – $0.79 ± $0.63 – $0.86 to Yellow Rose Gathering & Processing Assumes + 0.5 rigs running on Denbury / PVAC ± 1.7 ± 18.7 ± 6.7 ± 2.5 ± 0.62 – 0.86 ± 0.64 – 0.95 acreage dedicated to Lavaca Assumes Longview Expansion is not executed – (57.0) 11.6 11.6 (1.01) – (0.58) (1.18) – (0.64) B Assumes 2019E 50% reduction to volume decline on 0.2 – 0.4 0.4 0.05 – 0.07 0.05 – 0.07 Magnolia pipeline Natural Gas Transportation Reduction in annual maintenance capex forecast from $3.5 million to $1.5 million in each of 2020E, 2021E, – (9.0) – 2.0 0.14 – 0.31 0.13 – 0.28 2022E and 2023E C Assumes reduction of unplanned downtime to 4% and Offshore hurricane days to 10 (overall approximately 20% 1.0 – 0.7 0.7 0.12 – 0.14 0.11 – 0.14 Pipelines reduction of downtime) (excl. Delta House) Volume decline rate of 8% instead of 10% 0.5 – 2.9 3.0 0.37 – 0.48 0.35 – 0.45 D Assumes reduction of unplanned downtime to 4% and hurricane days to 10 (overall approximately 20% 0.92 – – – 0.01 0.01 reduction of downtime) for 2019E only Assumes production on first tie-in well accelerates to 2 2 Delta House – – (0.3) (0.3) 0.02 – 0.03 0.01 December 2020 (from December 2021) Assumes tie-in of third well at the average type curves of previous two tie-in wells with production – – 3.52 3.52 0.38 - 0.51 0.28 – 0.46 beginning in December 2021 E Increase of South Texas trucking volumes by 4 MBpd Trucking 3 (0.2) – (1.2) (1.2) (0.22) – (0.17) (0.18) – (0.13) in 2019E – 2023E 1. Cumulative incremental Q3 2019E – 2023E capital expenditures 2. Pro-rata for AMID’s 35.65% share of Delta House 3. Current projected volumes utilize 96% of South Texas truck capacity. Incremental volumes above current capacity are assumed by AMID management to incur higher costs than the revenue generated 1
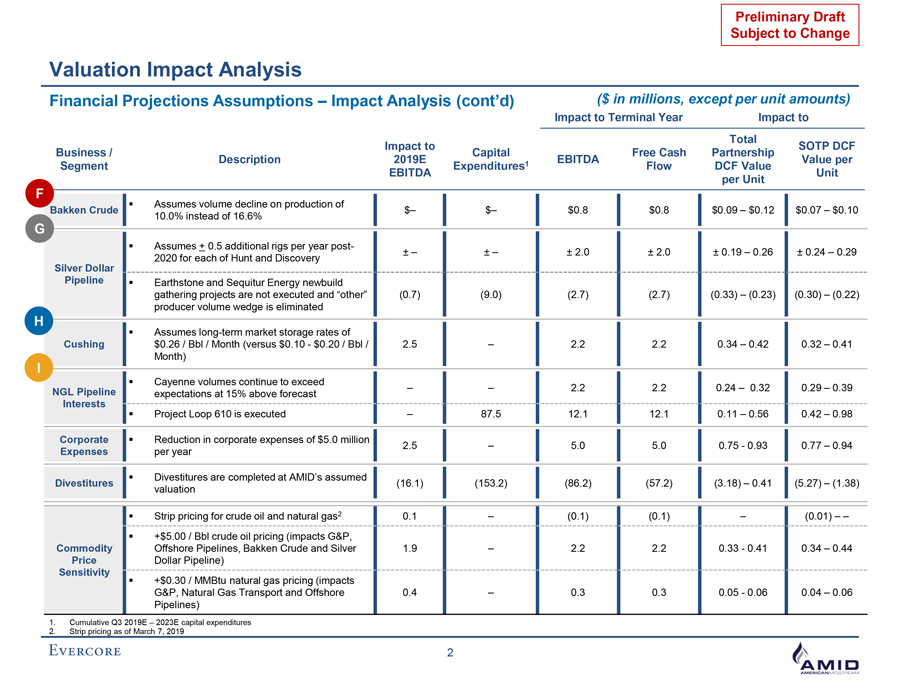
Preliminary Draft Subject to Change Valuation Impact Analysis Financial Projections Assumptions – Impact Analysis (cont’d) ($ in millions, except per unit amounts) Impact to Terminal Year Impact to Total Impact to SOTP DCF Business / Capital Free Cash Partnership Description 2019E 1 EBITDA Value per Segment Expenditures Flow DCF Value EBITDA Unit per Unit F Assumes volume decline on production of Bakken Crude $– $– $0.8 $0.8 $0.09 – $0.12 $0.07 – $0.10 10.0% instead of 16.6% G Assumes + 0.5 additional rigs per year post- ± – ± – ± 2.0 ± 2.0 ± 0.19 – 0.26 ± 0.24 – 0.29 2020 for each of Hunt and Discovery Silver Dollar Pipeline Earthstone and Sequitur Energy newbuild gathering projects are not executed and “other” (0.7) (9.0) (2.7) (2.7) (0.33) – (0.23) (0.30) – (0.22) producer volume wedge is eliminated H Assumes long-term market storage rates of Cushing $0.26 / Bbl / Month (versus $0.10 - $0.20 / Bbl / 2.5 – 2.2 2.2 0.34 – 0.42 0.32 – 0.41 Month) I Cayenne volumes continue to exceed NGL Pipeline – – 2.2 2.2 0.24 – 0.32 0.29 – 0.39 expectations at 15% above forecast Interests Project Loop 610 is executed – 87.5 12.1 12.1 0.11 – 0.56 0.42 – 0.98 Corporate Reduction in corporate expenses of $5.0 million 2.5 – 5.0 5.0 0.75 - 0.93 0.77 – 0.94 Expenses per year Divestitures are completed at AMID’s assumed Divestitures (16.1) (153.2) (86.2) (57.2) (3.18) – 0.41 (5.27) – (1.38) valuation Strip pricing for crude oil and natural gas2 0.1 – (0.1) (0.1) – (0.01) – – +$5.00 / Bbl crude oil pricing (impacts G&P, Commodity Offshore Pipelines, Bakken Crude and Silver 1.9 – 2.2 2.2 0.33 - 0.41 0.34 – 0.44 Price Dollar Pipeline) Sensitivity +$0.30 / MMBtu natural gas pricing (impacts G&P, Natural Gas Transport and Offshore 0.4 – 0.3 0.3 0.05 - 0.06 0.04 – 0.06 Pipelines) 1. Cumulative Q3 2019E – 2023E capital expenditures 2. Strip pricing as of March 7, 2019 2