1 TPG Mortgage Investment Trust, Inc. Q1 2026 Earnings Presentation March 31, 2026
2NYSE: MITT Forward Looking Statements & Non-GAAP Financial Information Forward Looking Statements: This presentation includes "forward-looking statements" within the meaning of the safe harbor provisions of the United States Private Securities Litigation Reform Act of 1995 related to dividends, book value, our investments, our business and investment strategy, investment returns, return on equity, liquidity, financing, taxes, our assets, our interest rate sensitivity, and our views on certain macroeconomic trends and conditions, among others. Forward-looking statements are based on estimates, projections, beliefs and assumptions of management of our company at the time of such statements and are not guarantees of future performance. Forward-looking statements involve risks and uncertainties in predicting future results and conditions. Actual results could differ materially from those projected in these forward-looking statements due to a variety of factors, including, without limitation, our ability to generate attractive risk adjusted returns over the long term as a programmatic aggregator and issuer of Non-Agency residential loan securitizations; the strength in our earnings available for distribution (EAD), including whether it will continue to support dividend; whether our investment portfolio will continue to deliver durable net interest income; our levels of operating expenses; our ability to continue to opportunistically rotate capital, including through sales of legacy WMC or other non-core assets; our ability to consummate sales and/or deed-in-lieu of the properties underlying legacy WMC commercial loans within the timeframe or manner anticipated or at all; our ability to continue to grow our residential investment portfolio; whether we will achieve the anticipated benefits of acquiring additional interests in Arc Home within the timeframe contemplated or at all, including driving our earnings power and continuing contribution to EAD; our acquisition pipeline; our ability to invest in higher yielding assets through Arc Home, other origination partners or otherwise; our levels of liquidity, including whether our liquidity will sufficiently enable us to continue to deploy capital within the residential whole loan space as anticipated or at all; the availability of committed financing to support our liquidity; the impact of market, regulatory and structural changes on the market opportunities we expect to have, and whether we will be able to capitalize on such opportunities in the manner we anticipate, including our ability to participate in, and benefit from, the home equity loan market; the impact of market volatility on our business, including our book value, and ability to execute our strategy; our trading volume and liquidity; our portfolio mix, including levels of Residential Investments and Agency RMBS; our ability to manage warehouse exposure as anticipated or at all; our levels of leverage, including our levels of recourse and non-recourse financing; our ability to repay or refinance corporate leverage; our ability to execute securitizations, including at the pace anticipated or at all; our ability to achieve our forecasted returns on equity on warehoused assets and post-securitization, including whether such returns will support earnings growth; changes in our business and investment strategy; our ability to grow our book value; our ability to predict and control costs; changes in inflation, tariffs, interest rates and the fair value of our assets, including negative changes resulting in margin calls relating to the financing of our assets; the impact of credit spread movements on our business; the impact of interest rate changes on our asset yields and net interest margin; changes in the yield curve; the timing and amount of stock issuances pursuant to our ATM program or otherwise; the timing and amount of stock repurchases, if any; our capitalization, including the timing and amount of preferred stock repurchases or exchanges, if any; expense levels, including levels of management fees; changes in prepayment rates on the loans we own or that underlie our investment securities; our distribution policy; Arc Home’s performance, including its profitability, liquidity position and ability to increase market share or benefit from improved gain on sale margins; Arc Home’s origination volumes; the composition of Arc Home’s portfolio, including levels of MSR exposure; costs and levels of leverage on Arc Home’s portfolio; our percentage allocation of loans originated by Arc Home; increased rates of default or delinquencies and/or decreased recovery rates on our assets; the availability of and competition for our target investments; our ability to obtain and maintain financing arrangements on terms favorable to us or at all; changes in general economic or market conditions in our industry and in the finance and real estate markets, including the impact on the value of our assets; conditions in the market for Residential Investments and Agency RMBS; our levels of EAD; market conditions impacting commercial real estate; legislative and regulatory actions by the U.S. Department of the Treasury, the Federal Reserve and other agencies and instrumentalities; regional bank failures; our ability to make distributions to our stockholders in the future; our ability to maintain our qualification as a REIT for federal tax purposes; and our ability to qualify for an exemption from registration under the Investment Company Act of 1940, as amended. Additional information concerning these and other risk factors are contained in our filings with the Securities and Exchange Commission ("SEC"), including those described in Part I – Item 1A. “Risk Factors” of our Annual Report on Form 10-K for the fiscal year ended December 31, 2025, as such factors may be updated from time to time in our filings with the SEC. Copies are available free of charge on the SEC's website, http://www.sec.gov/. All forward looking statements in this presentation speak only as of the date of this presentation. We undertake no duty to update any forward-looking statements to reflect any change in our expectations or any change in events, conditions or circumstances on which any such statement is based. All financial information in this presentation is as of March 31, 2026, unless otherwise indicated. Non-GAAP Financial Information: In addition to the results presented in accordance with GAAP, this presentation includes certain non-GAAP financial results and financial metrics derived therefrom, including EAD, investment portfolio, financing arrangements, and economic leverage ratio, which are calculated by including or excluding unconsolidated investments in affiliates, as described in the footnotes to this presentation. Our management team believes that this non-GAAP financial information, when considered with our GAAP financial statements, provides supplemental information useful for investors to help evaluate our financial performance. However, our management team also believes that our definition of EAD has important limitations as it does not include certain earnings or losses our management team considers in evaluating our financial performance. Our presentation of non-GAAP financial information may not be comparable to similarly-titled measures of other companies, who may use different calculations. This non-GAAP financial information should not be considered a substitute for, or superior to, the financial measures calculated in accordance with GAAP. Our GAAP financial results and the reconciliations of the non-GAAP financial measures included in this presentation to the most directly comparable financial measures prepared in accordance with GAAP should be carefully evaluated. This presentation may contain statistics and other data that has been obtained or compiled from information made available by third-party service providers. We have not independently verified such statistics or data.
3NYSE: MITT Q1 2026 MITT Earnings Call Presenters T.J. Durkin Nicholas Smith Anthony Rossiello Chief Executive Officer & President Chief Investment Officer Chief Financial Officer
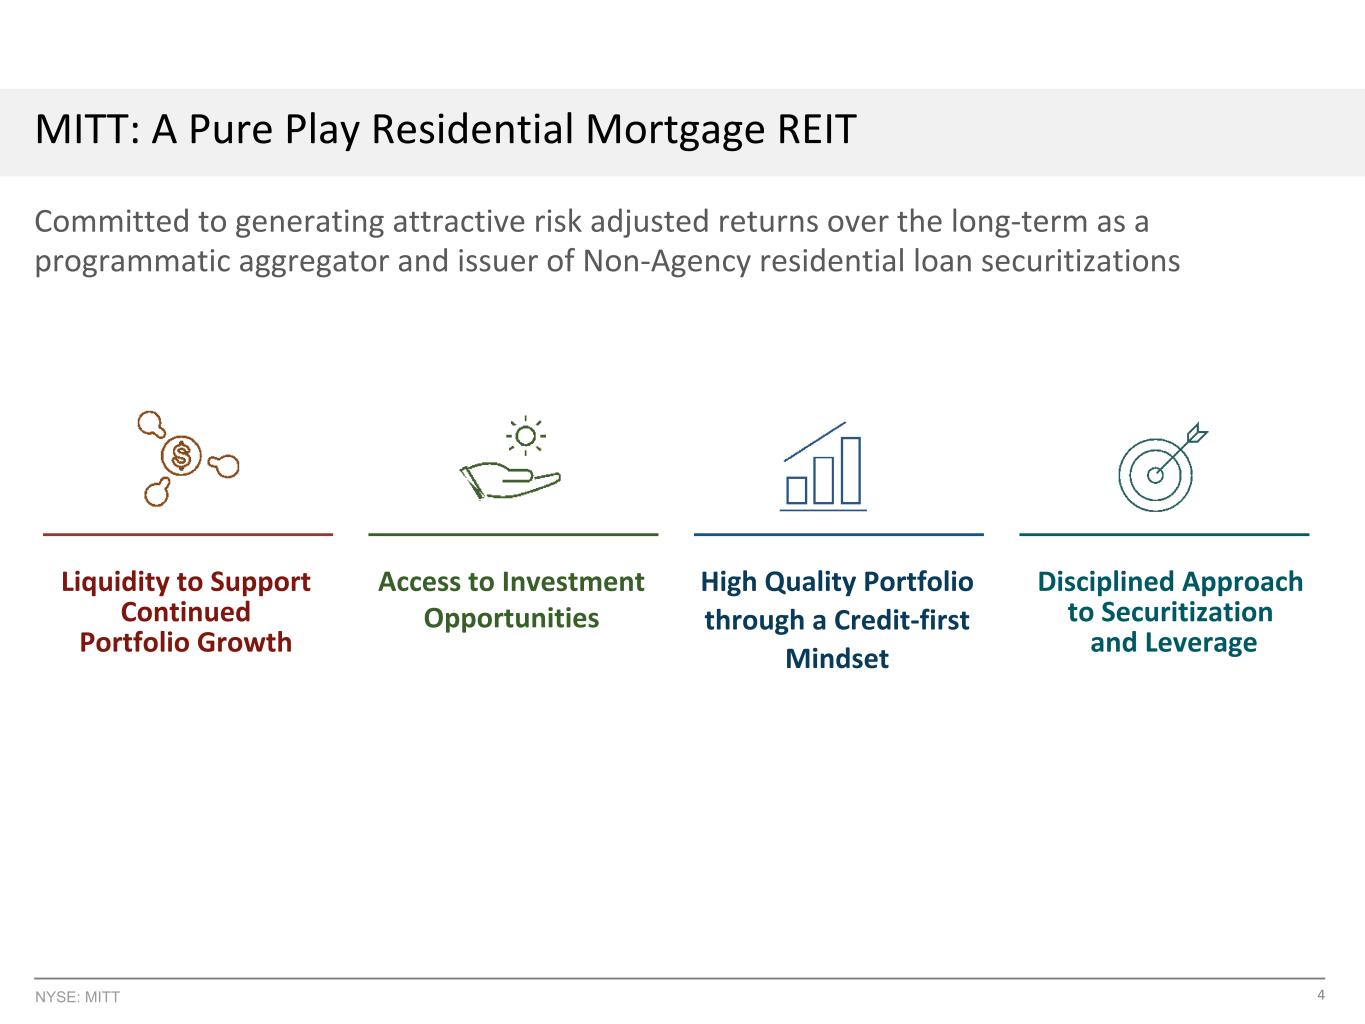
4NYSE: MITT MITT: A Pure Play Residential Mortgage REIT Committed to generating attractive risk adjusted returns over the long-term as a programmatic aggregator and issuer of Non-Agency residential loan securitizations Liquidity to Support Continued Portfolio Growth Access to Investment Opportunities High Quality Portfolio through a Credit-first Mindset Disciplined Approach to Securitization and Leverage
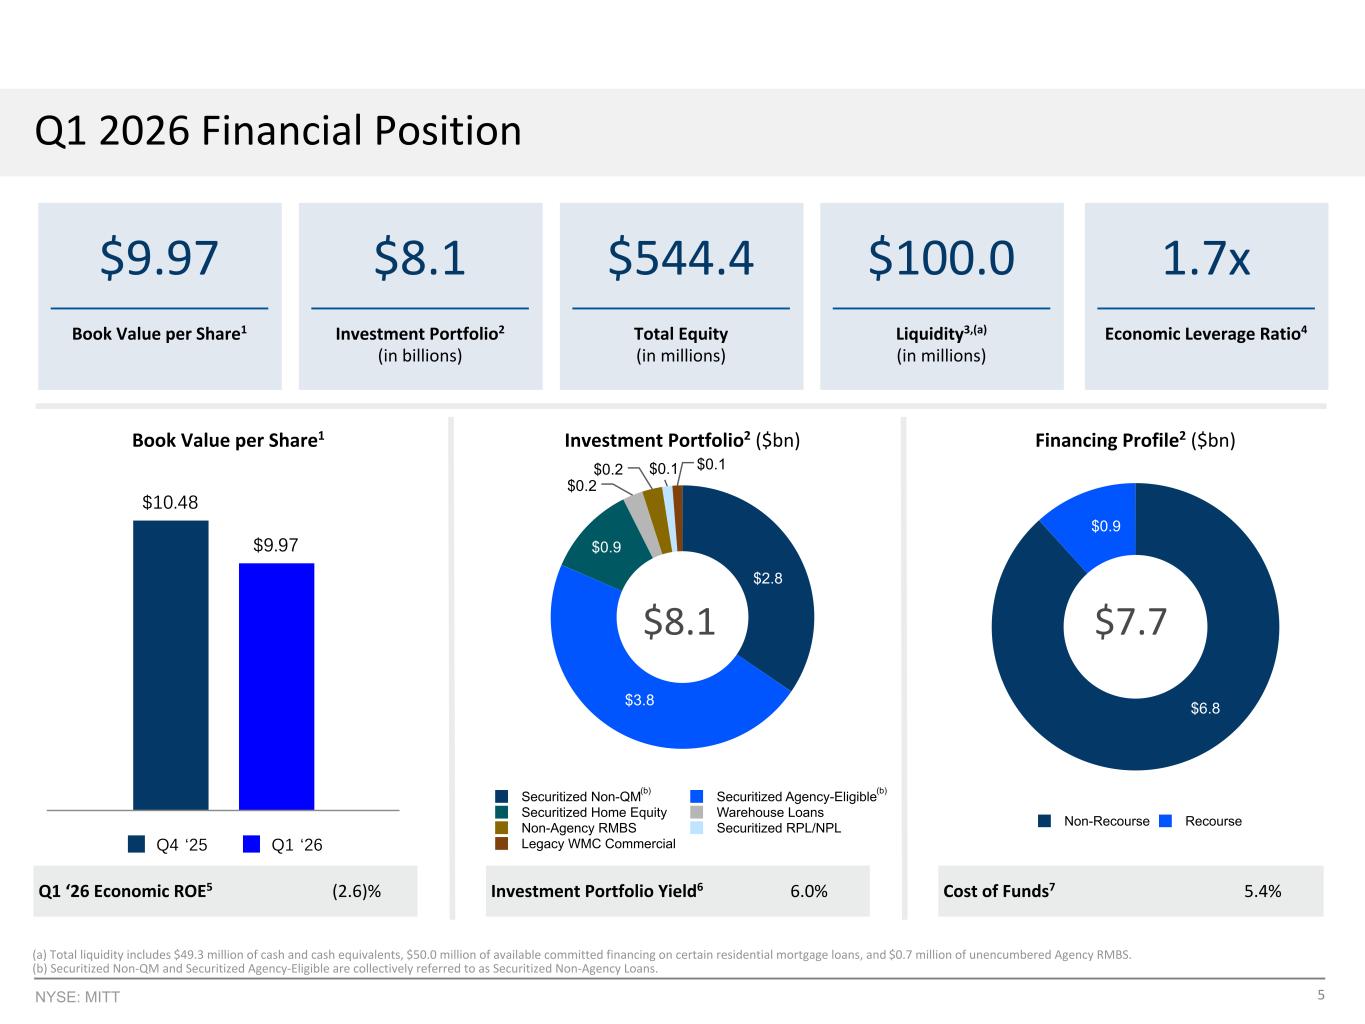
5NYSE: MITT $10.48 $9.97 Q4 ‘25 Q1 ‘26 $2.8 $3.8 $0.9 $0.2 $0.2 $0.1 $0.1 Securitized Non-QM Securitized Agency-Eligible Securitized Home Equity Warehouse Loans Non-Agency RMBS Securitized RPL/NPL Legacy WMC Commercial Q1 2026 Financial Position Cost of Funds7 5.4% $8.1 Investment Portfolio2 (in billions) $9.97 Book Value per Share1 $544.4 Total Equity (in millions) $100.0 Liquidity3,(a) (in millions) 1.7x Economic Leverage Ratio4 Investment Portfolio2 ($bn) Financing Profile2 ($bn)Book Value per Share1 Q1 ‘26 Economic ROE5 (2.6)% (5.8)% Investment Portfolio Yield6 6.0% $6.8 $0.9 Non-Recourse Recourse $7.7$8.1 (a) Total liquidity includes $49.3 million of cash and cash equivalents, $50.0 million of available committed financing on certain residential mortgage loans, and $0.7 million of unencumbered Agency RMBS. (b) Securitized Non-QM and Securitized Agency-Eligible are collectively referred to as Securitized Non-Agency Loans. (b) (b)
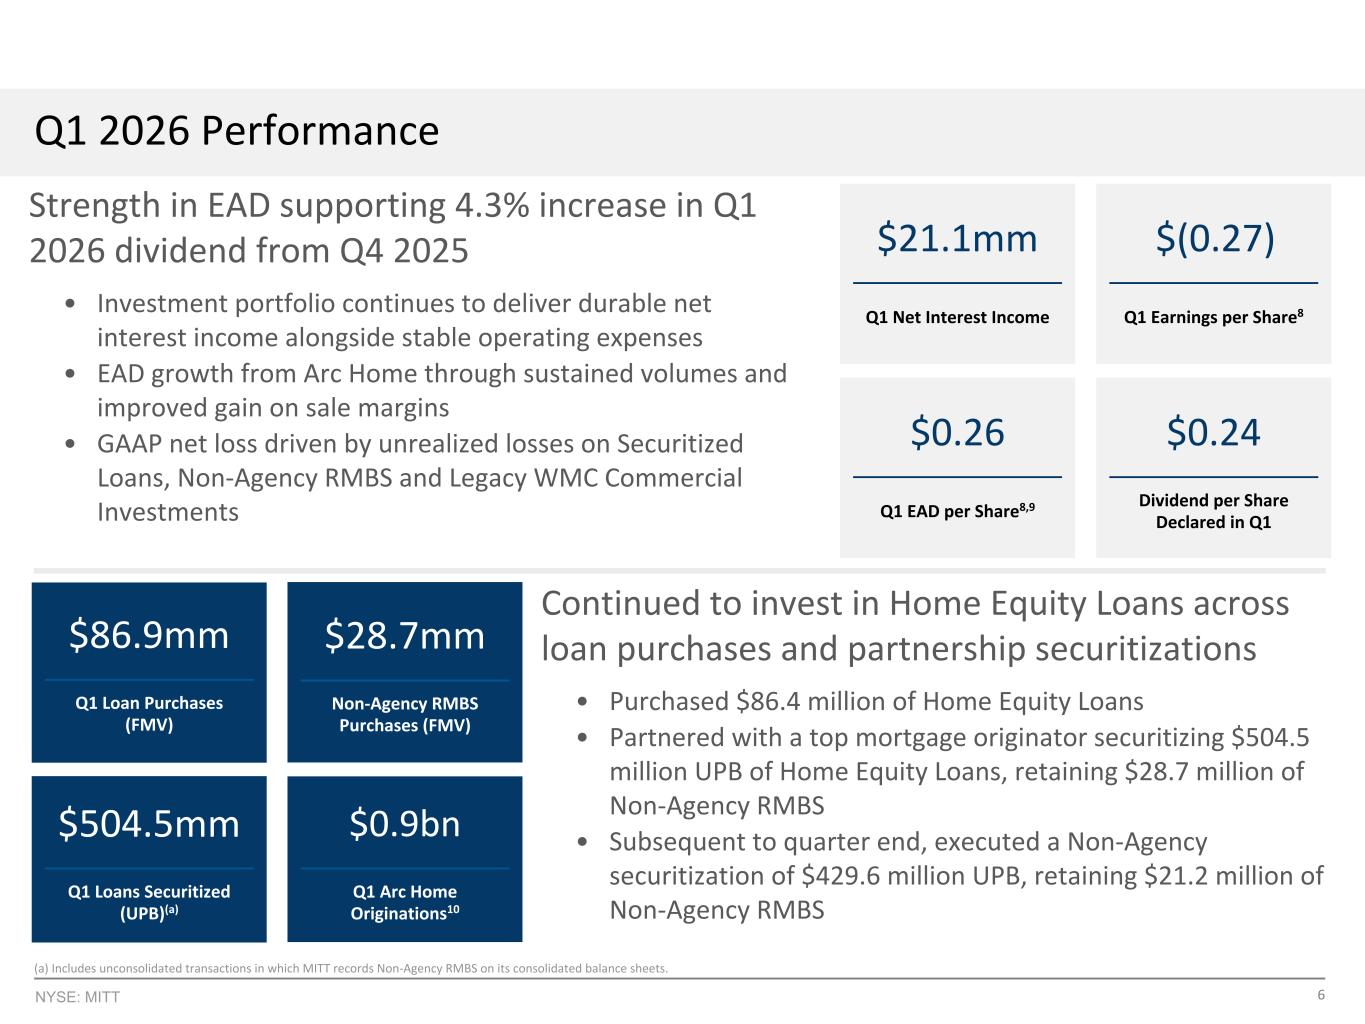
6NYSE: MITT Q1 2026 Performance Continued to invest in Home Equity Loans across loan purchases and partnership securitizations • Purchased $86.4 million of Home Equity Loans • Partnered with a top mortgage originator securitizing $504.5 million UPB of Home Equity Loans, retaining $28.7 million of Non-Agency RMBS • Subsequent to quarter end, executed a Non-Agency securitization of $429.6 million UPB, retaining $21.2 million of Non-Agency RMBS $21.1mm Q1 Net Interest Income $(0.27) Q1 Earnings per Share8 $0.26 Q1 EAD per Share8,9 $0.24 Dividend per Share Declared in Q1 $86.9mm Q1 Loan Purchases (FMV) $28.7mm Non-Agency RMBS Purchases (FMV) $504.5mm Q1 Loans Securitized (UPB)(a) $0.9bn Q1 Arc Home Originations10 Strength in EAD supporting 4.3% increase in Q1 2026 dividend from Q4 2025 • Investment portfolio continues to deliver durable net interest income alongside stable operating expenses • EAD growth from Arc Home through sustained volumes and improved gain on sale margins • GAAP net loss driven by unrealized losses on Securitized Loans, Non-Agency RMBS and Legacy WMC Commercial Investments (a) Includes unconsolidated transactions in which MITT records Non-Agency RMBS on its consolidated balance sheets.
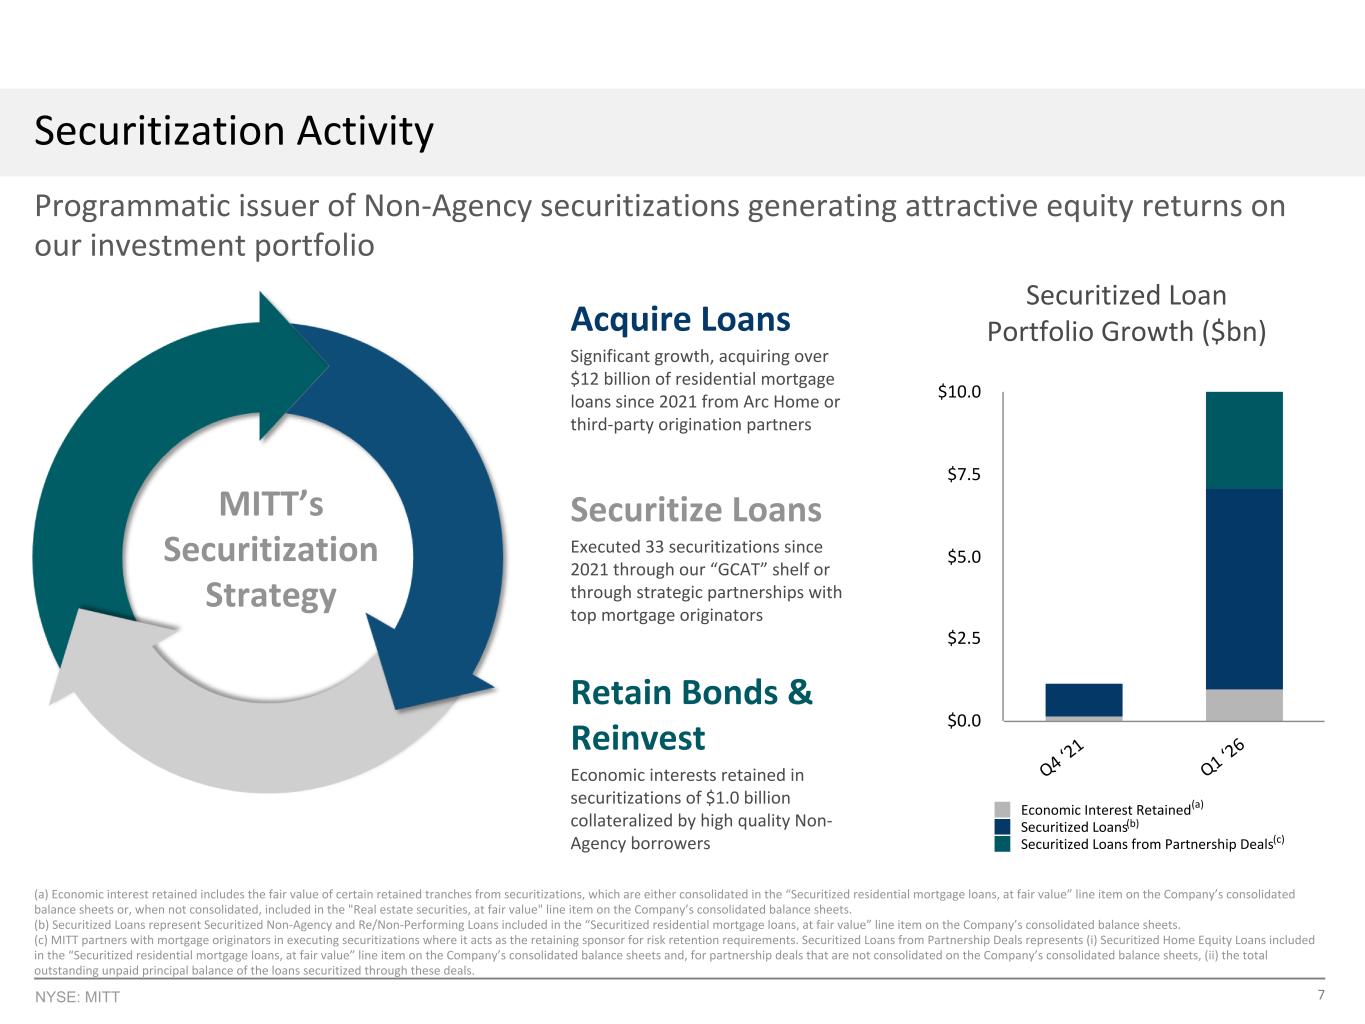
7NYSE: MITT (a) Economic interest retained includes the fair value of certain retained tranches from securitizations, which are either consolidated in the “Securitized residential mortgage loans, at fair value” line item on the Company’s consolidated balance sheets or, when not consolidated, included in the "Real estate securities, at fair value" line item on the Company’s consolidated balance sheets. (b) Securitized Loans represent Securitized Non-Agency and Re/Non-Performing Loans included in the “Securitized residential mortgage loans, at fair value” line item on the Company’s consolidated balance sheets. (c) MITT partners with mortgage originators in executing securitizations where it acts as the retaining sponsor for risk retention requirements. Securitized Loans from Partnership Deals represents (i) Securitized Home Equity Loans included in the “Securitized residential mortgage loans, at fair value” line item on the Company’s consolidated balance sheets and, for partnership deals that are not consolidated on the Company’s consolidated balance sheets, (ii) the total outstanding unpaid principal balance of the loans securitized through these deals. Economic Interest Retained Securitized Loans Securitized Loans from Partnership Deals Q4 ‘2 1 Q1 ‘2 6 $0.0 $2.5 $5.0 $7.5 $10.0 Securitization Activity Programmatic issuer of Non-Agency securitizations generating attractive equity returns on our investment portfolio Securitized Loan Portfolio Growth ($bn) (a) (c) (b) Acquire Loans Significant growth, acquiring over $12 billion of residential mortgage loans since 2021 from Arc Home or third-party origination partners Retain Bonds & Reinvest Economic interests retained in securitizations of $1.0 billion collateralized by high quality Non- Agency borrowers MITT’s Securitization Strategy Securitize Loans Executed 33 securitizations since 2021 through our “GCAT” shelf or through strategic partnerships with top mortgage originators
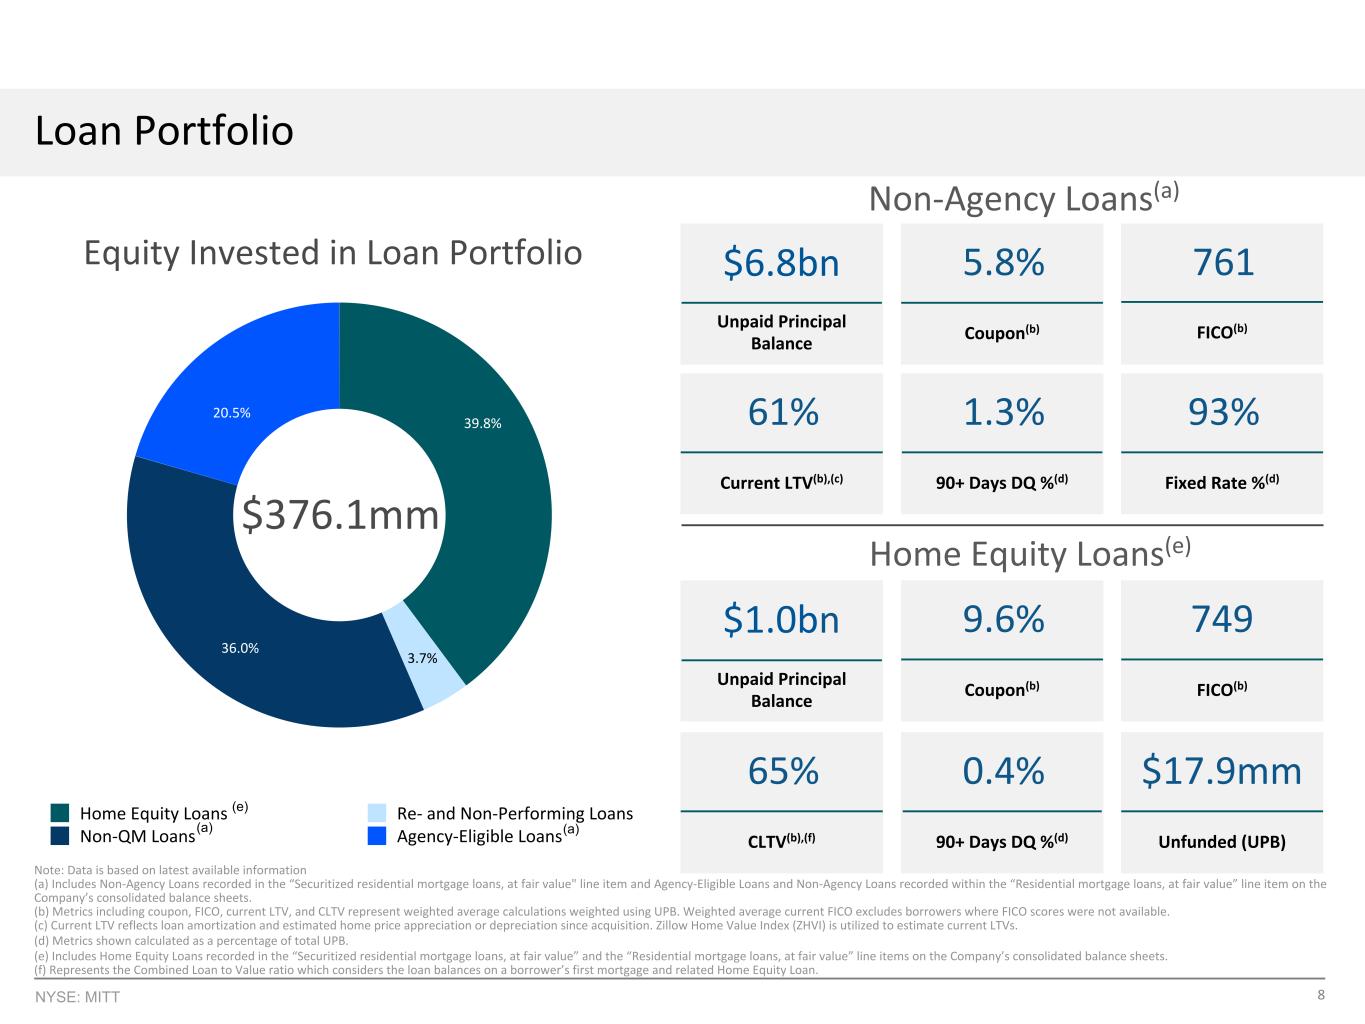
8NYSE: MITT Note: Data is based on latest available information (a) Includes Non-Agency Loans recorded in the “Securitized residential mortgage loans, at fair value" line item and Agency-Eligible Loans and Non-Agency Loans recorded within the “Residential mortgage loans, at fair value” line item on the Company’s consolidated balance sheets. (b) Metrics including coupon, FICO, current LTV, and CLTV represent weighted average calculations weighted using UPB. Weighted average current FICO excludes borrowers where FICO scores were not available. (c) Current LTV reflects loan amortization and estimated home price appreciation or depreciation since acquisition. Zillow Home Value Index (ZHVI) is utilized to estimate current LTVs. (d) Metrics shown calculated as a percentage of total UPB. (e) Includes Home Equity Loans recorded in the “Securitized residential mortgage loans, at fair value” and the “Residential mortgage loans, at fair value” line items on the Company’s consolidated balance sheets. (f) Represents the Combined Loan to Value ratio which considers the loan balances on a borrower’s first mortgage and related Home Equity Loan. Loan Portfolio $1.0bn Unpaid Principal Balance 65% CLTV(b),(f) 0.4% 90+ Days DQ %(d) 749 FICO(b) $17.9mm Unfunded (UPB) $6.8bn Unpaid Principal Balance 61% Current LTV(b),(c) 1.3% 90+ Days DQ %(d) 93% Fixed Rate %(d) 5.8% Coupon(b) Home Equity Loans(e) 39.8% 3.7% 36.0% 20.5% Home Equity Loans Re- and Non-Performing Loans Non-QM Loans Agency-Eligible Loans 9.6% Coupon(b) Equity Invested in Loan Portfolio Non-Agency Loans(a) 761 FICO(b) $376.1mm (e) (a) (a)
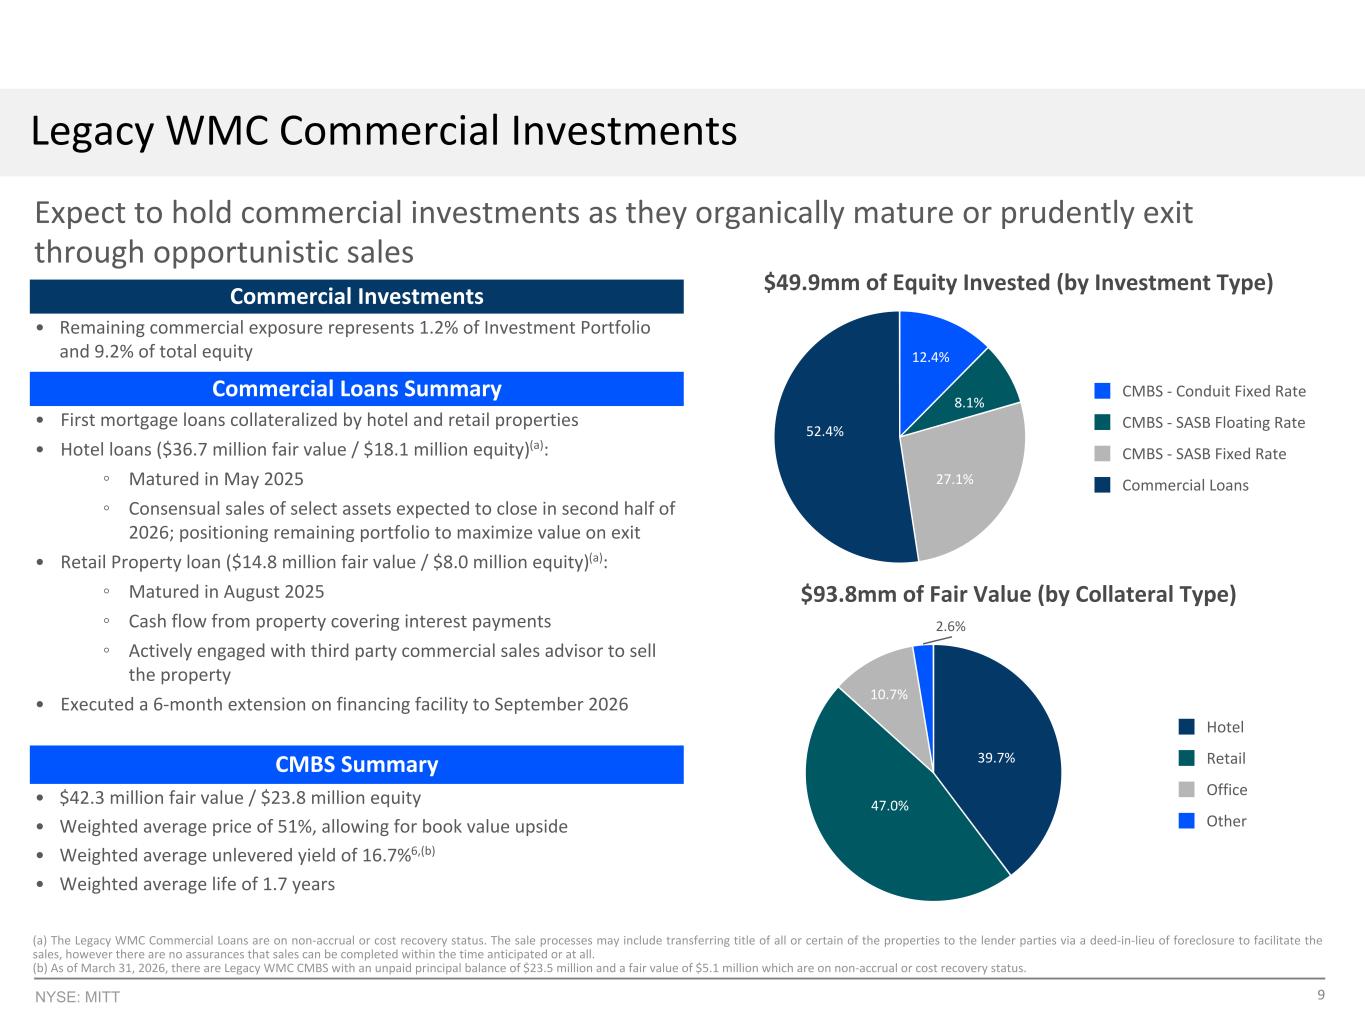
9NYSE: MITT Expect to hold commercial investments as they organically mature or prudently exit through opportunistic sales Commercial Investments • Remaining commercial exposure represents 1.2% of Investment Portfolio and 9.2% of total equity Legacy WMC Commercial Investments 39.7% 47.0% 10.7% 2.6% Hotel Retail Office Other 12.4% 8.1% 27.1% 52.4% CMBS - Conduit Fixed Rate CMBS - SASB Floating Rate CMBS - SASB Fixed Rate Commercial Loans $49.9mm of Equity Invested (by Investment Type) $93.8mm of Fair Value (by Collateral Type) CMBS Summary • $42.3 million fair value / $23.8 million equity • Weighted average price of 51%, allowing for book value upside • Weighted average unlevered yield of 16.7%6,(b) • Weighted average life of 1.7 years Commercial Loans Summary • First mortgage loans collateralized by hotel and retail properties • Hotel loans ($36.7 million fair value / $18.1 million equity)(a): ◦ Matured in May 2025 ◦ Consensual sales of select assets expected to close in second half of 2026; positioning remaining portfolio to maximize value on exit • Retail Property loan ($14.8 million fair value / $8.0 million equity)(a): ◦ Matured in August 2025 ◦ Cash flow from property covering interest payments ◦ Actively engaged with third party commercial sales advisor to sell the property • Executed a 6-month extension on financing facility to September 2026 (a) The Legacy WMC Commercial Loans are on non-accrual or cost recovery status. The sale processes may include transferring title of all or certain of the properties to the lender parties via a deed-in-lieu of foreclosure to facilitate the sales, however there are no assurances that sales can be completed within the time anticipated or at all. (b) As of March 31, 2026, there are Legacy WMC CMBS with an unpaid principal balance of $23.5 million and a fair value of $5.1 million which are on non-accrual or cost recovery status.
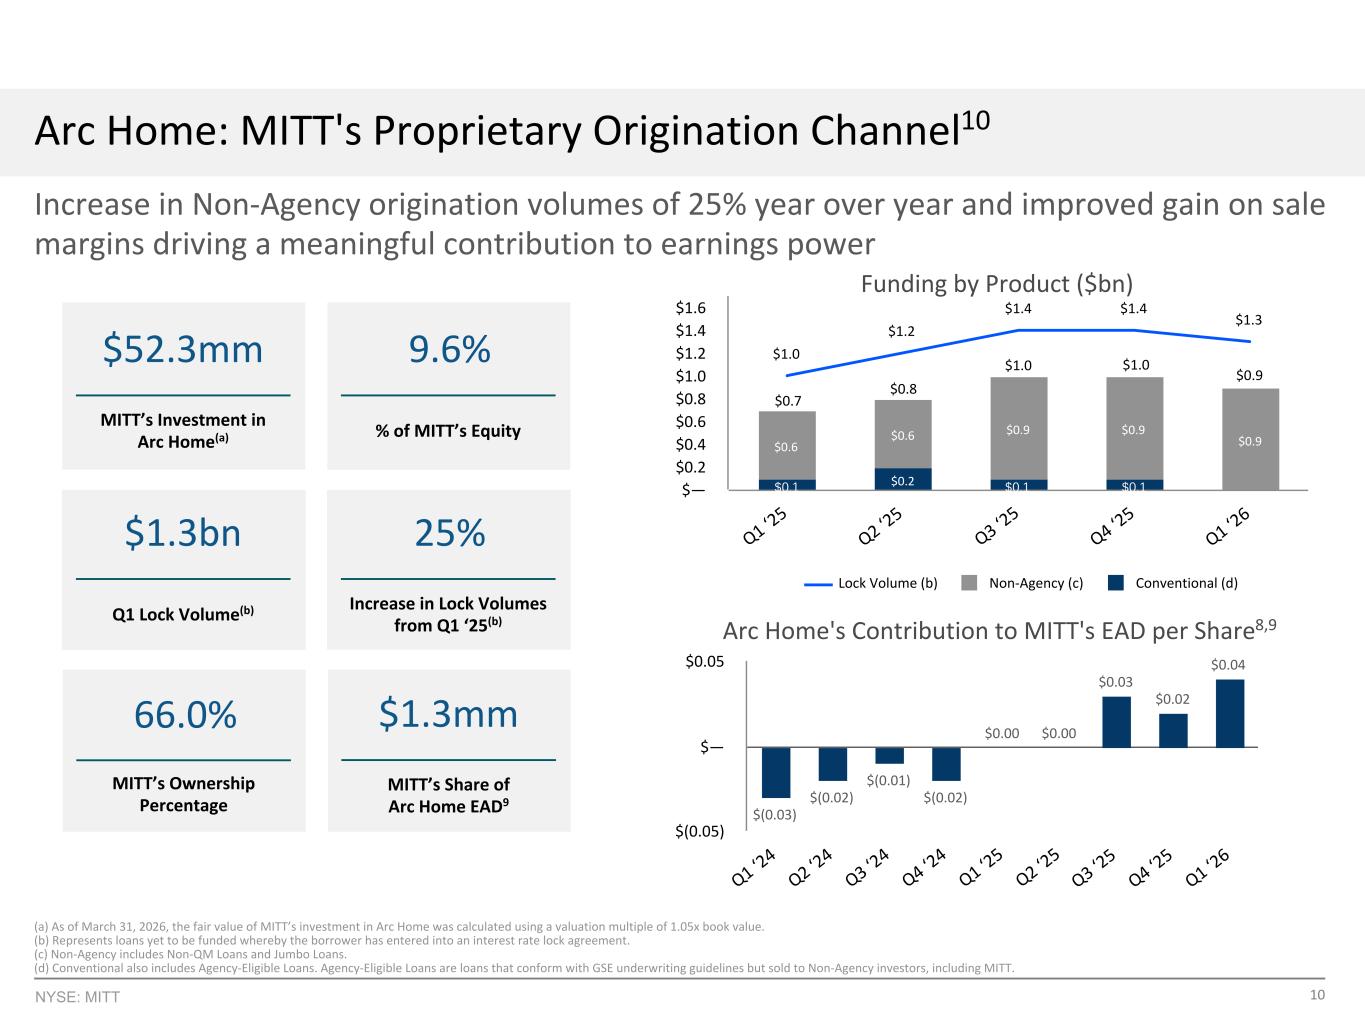
10NYSE: MITT Arc Home: MITT's Proprietary Origination Channel10 66.0% MITT’s Ownership Percentage $1.3mm MITT’s Share of Arc Home EAD9 $52.3mm MITT’s Investment in Arc Home(a) $0.1 $0.2 $0.1 $0.1 $0.6 $0.6 $0.9 $0.9 $0.9 $1.0 $1.2 $1.4 $1.4 $1.3 Lock Volume (b) Non-Agency (c) Conventional (d) Q1 ‘2 5 Q2 ‘2 5 Q3 ‘2 5 Q4 ‘2 5 Q1 ‘2 6 $— $0.2 $0.4 $0.6 $0.8 $1.0 $1.2 $1.4 $1.6 Increase in Non-Agency origination volumes of 25% year over year and improved gain on sale margins driving a meaningful contribution to earnings power Funding by Product ($bn) $0.7 $0.8 $1.0 $(0.03) $(0.02) $(0.01) $(0.02) $0.00 $0.00 $0.03 $0.02 $0.04 Q1 ‘2 4 Q2 ‘2 4 Q3 ‘2 4 Q4 ‘2 4 Q1 ‘2 5 Q2 ‘2 5 Q3 ‘2 5 Q4 ‘2 5 Q1 ‘2 6 $(0.05) $— $0.05 Arc Home's Contribution to MITT's EAD per Share8,9 (a) As of March 31, 2026, the fair value of MITT’s investment in Arc Home was calculated using a valuation multiple of 1.05x book value. (b) Represents loans yet to be funded whereby the borrower has entered into an interest rate lock agreement. (c) Non-Agency includes Non-QM Loans and Jumbo Loans. (d) Conventional also includes Agency-Eligible Loans. Agency-Eligible Loans are loans that conform with GSE underwriting guidelines but sold to Non-Agency investors, including MITT. 9.6% % of MITT’s Equity $1.3bn Q1 Lock Volume(b) 25% Increase in Lock Volumes from Q1 ‘25(b) $1.0 GOS Margin Q1 ‘25 Q2 ‘25 Q3 ‘25 Q4 ‘25 Q1 ‘26 100 125 150 $0.9
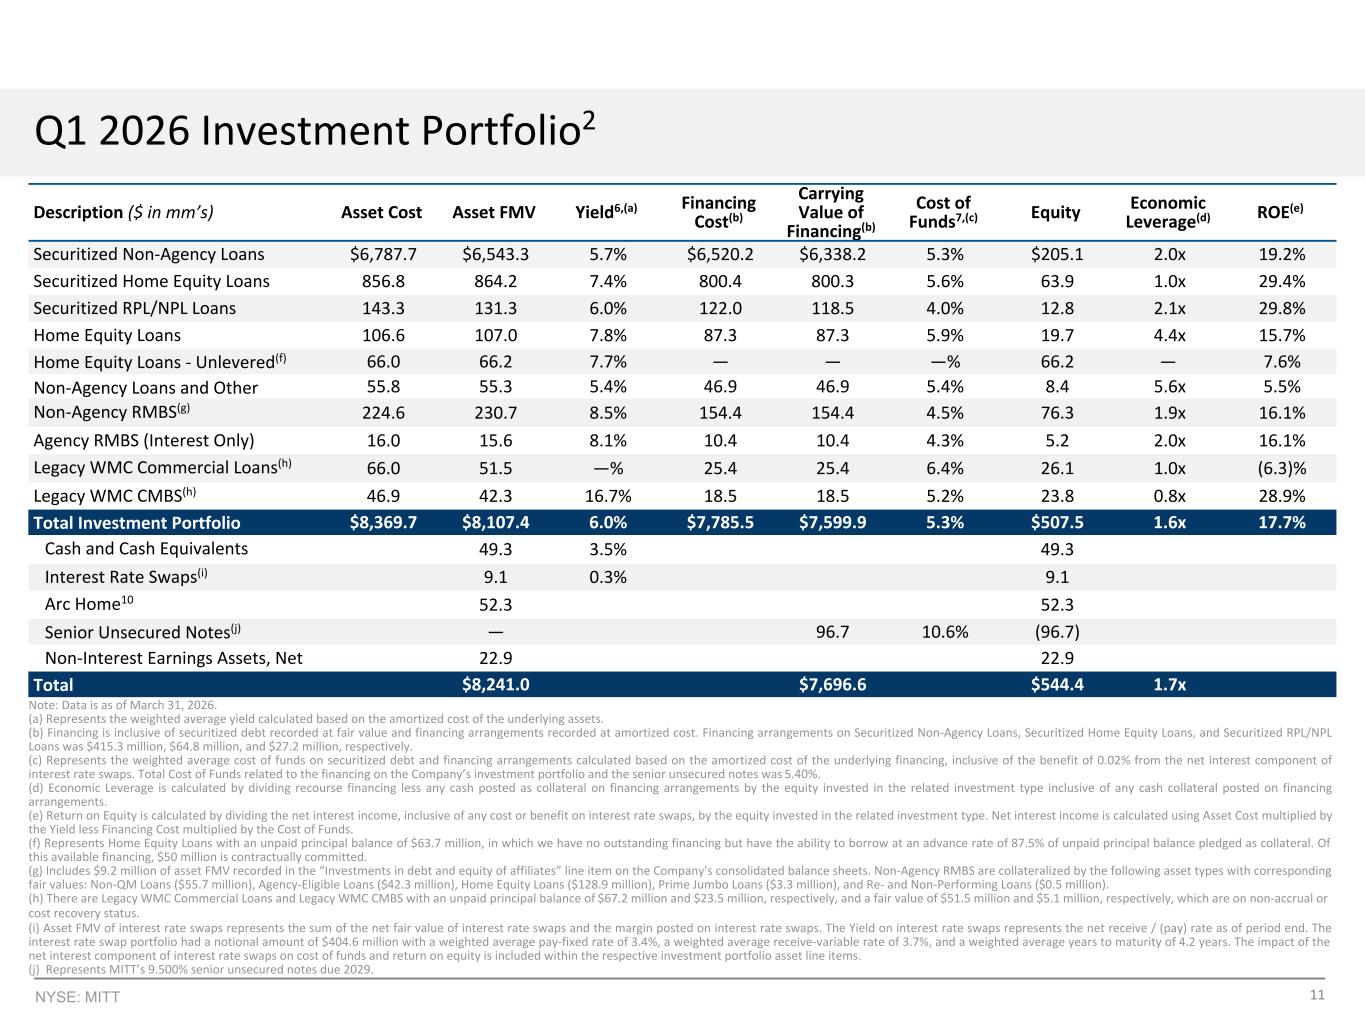
11NYSE: MITT Description ($ in mm’s) Asset Cost Asset FMV Yield6,(a) Financing Cost(b) Carrying Value of Financing(b) Cost of Funds7,(c) Equity Economic Leverage(d) ROE(e) Securitized Non-Agency Loans $6,787.7 $6,543.3 5.7% $6,520.2 $6,338.2 5.3% $205.1 2.0x 19.2% Securitized Home Equity Loans 856.8 864.2 7.4% 800.4 800.3 5.6% 63.9 1.0x 29.4% Securitized RPL/NPL Loans 143.3 131.3 6.0% 122.0 118.5 4.0% 12.8 2.1x 29.8% Home Equity Loans 106.6 107.0 7.8% 87.3 87.3 5.9% 19.7 4.4x 15.7% Home Equity Loans - Unlevered(f) 66.0 66.2 7.7% — — —% 66.2 — 7.6% Non-Agency Loans and Other 55.8 55.3 5.4% 46.9 46.9 5.4% 8.4 5.6x 5.5% Non-Agency RMBS(g) 224.6 230.7 8.5% 154.4 154.4 4.5% 76.3 1.9x 16.1% Agency RMBS (Interest Only) 16.0 15.6 8.1% 10.4 10.4 4.3% 5.2 2.0x 16.1% Legacy WMC Commercial Loans(h) 66.0 51.5 —% 25.4 25.4 6.4% 26.1 1.0x (6.3)% Legacy WMC CMBS(h) 46.9 42.3 16.7% 18.5 18.5 5.2% 23.8 0.8x 28.9% Total Investment Portfolio $8,369.7 $8,107.4 6.0% $7,785.5 $7,599.9 5.3% $507.5 1.6x 17.7% Cash and Cash Equivalents 49.3 3.5% 49.3 Interest Rate Swaps(i) 9.1 0.3% 9.1 Arc Home10 52.3 52.3 Senior Unsecured Notes(j) — 96.7 10.6% (96.7) Non-Interest Earnings Assets, Net 22.9 22.9 Total $8,241.0 $7,696.6 $544.4 1.7x Q1 2026 Investment Portfolio2 Note: Data is as of March 31, 2026. (a) Represents the weighted average yield calculated based on the amortized cost of the underlying assets. (b) Financing is inclusive of securitized debt recorded at fair value and financing arrangements recorded at amortized cost. Financing arrangements on Securitized Non-Agency Loans, Securitized Home Equity Loans, and Securitized RPL/NPL Loans was $415.3 million, $64.8 million, and $27.2 million, respectively. (c) Represents the weighted average cost of funds on securitized debt and financing arrangements calculated based on the amortized cost of the underlying financing, inclusive of the benefit of 0.02% from the net interest component of interest rate swaps. Total Cost of Funds related to the financing on the Company’s investment portfolio and the senior unsecured notes was 5.40%. (d) Economic Leverage is calculated by dividing recourse financing less any cash posted as collateral on financing arrangements by the equity invested in the related investment type inclusive of any cash collateral posted on financing arrangements. (e) Return on Equity is calculated by dividing the net interest income, inclusive of any cost or benefit on interest rate swaps, by the equity invested in the related investment type. Net interest income is calculated using Asset Cost multiplied by the Yield less Financing Cost multiplied by the Cost of Funds. (f) Represents Home Equity Loans with an unpaid principal balance of $63.7 million, in which we have no outstanding financing but have the ability to borrow at an advance rate of 87.5% of unpaid principal balance pledged as collateral. Of this available financing, $50 million is contractually committed. (g) Includes $9.2 million of asset FMV recorded in the “Investments in debt and equity of affiliates” line item on the Company's consolidated balance sheets. Non-Agency RMBS are collateralized by the following asset types with corresponding fair values: Non-QM Loans ($55.7 million), Agency-Eligible Loans ($42.3 million), Home Equity Loans ($128.9 million), Prime Jumbo Loans ($3.3 million), and Re- and Non-Performing Loans ($0.5 million). (h) There are Legacy WMC Commercial Loans and Legacy WMC CMBS with an unpaid principal balance of $67.2 million and $23.5 million, respectively, and a fair value of $51.5 million and $5.1 million, respectively, which are on non-accrual or cost recovery status. (i) Asset FMV of interest rate swaps represents the sum of the net fair value of interest rate swaps and the margin posted on interest rate swaps. The Yield on interest rate swaps represents the net receive / (pay) rate as of period end. The interest rate swap portfolio had a notional amount of $404.6 million with a weighted average pay-fixed rate of 3.4%, a weighted average receive-variable rate of 3.7%, and a weighted average years to maturity of 4.2 years. The impact of the net interest component of interest rate swaps on cost of funds and return on equity is included within the respective investment portfolio asset line items. (j) Represents MITT’s 9.500% senior unsecured notes due 2029.
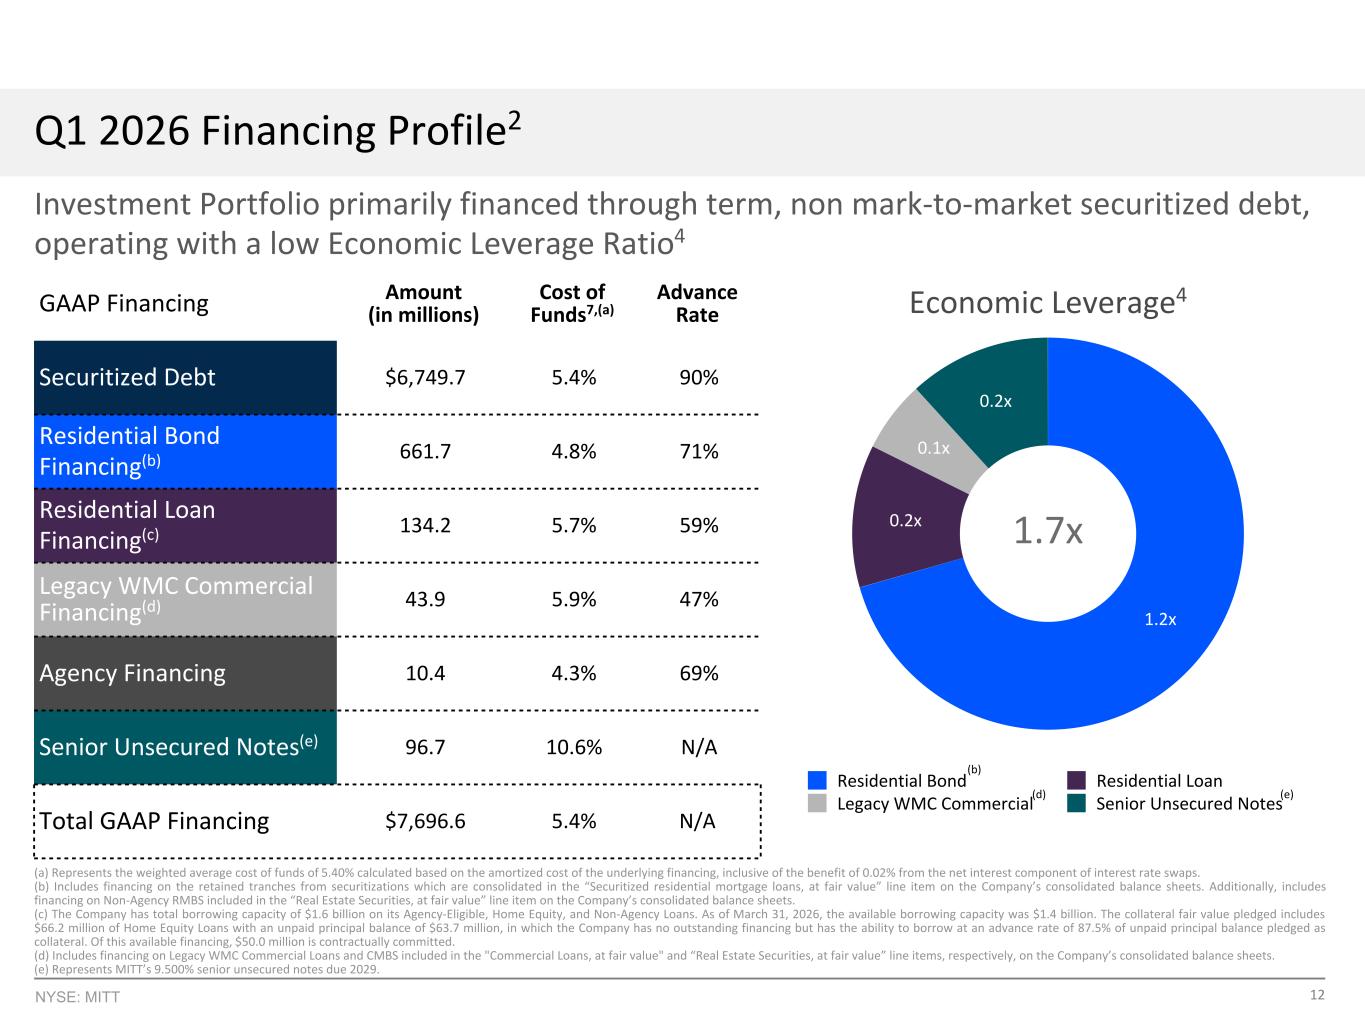
12NYSE: MITT Investment Portfolio primarily financed through term, non mark-to-market securitized debt, operating with a low Economic Leverage Ratio4 1.4x 2.5x 1.5x 1.4x 1.6x Residential Agency Commercial Unsecured Notes Q1 ‘ 24 Q2 ‘ 24 Q3 ‘ 24 Q4 ‘ 24 Q1 ‘ 25 0.0x 1.0x 2.0x 3.0x (a) Represents the weighted average cost of funds of 5.40% calculated based on the amortized cost of the underlying financing, inclusive of the benefit of 0.02% from the net interest component of interest rate swaps. (b) Includes financing on the retained tranches from securitizations which are consolidated in the “Securitized residential mortgage loans, at fair value” line item on the Company’s consolidated balance sheets. Additionally, includes financing on Non-Agency RMBS included in the “Real Estate Securities, at fair value” line item on the Company’s consolidated balance sheets. (c) The Company has total borrowing capacity of $1.6 billion on its Agency-Eligible, Home Equity, and Non-Agency Loans. As of March 31, 2026, the available borrowing capacity was $1.4 billion. The collateral fair value pledged includes $66.2 million of Home Equity Loans with an unpaid principal balance of $63.7 million, in which the Company has no outstanding financing but has the ability to borrow at an advance rate of 87.5% of unpaid principal balance pledged as collateral. Of this available financing, $50.0 million is contractually committed. (d) Includes financing on Legacy WMC Commercial Loans and CMBS included in the "Commercial Loans, at fair value" and “Real Estate Securities, at fair value” line items, respectively, on the Company’s consolidated balance sheets. (e) Represents MITT’s 9.500% senior unsecured notes due 2029. Residential, 10.3% Commercial, 0.6% Unsecured Notes, 1.3% Securitized Debt, 87.7% GAAP Financing Amount (in millions) Cost of Funds7,(a) Advance Rate Securitized Debt $6,749.7 5.4% 90% Residential Bond Financing(b) 661.7 4.8% 71% Residential Loan Financing(c) 134.2 5.7% 59% Legacy WMC Commercial Financing(d) 43.9 5.9% 47% Agency Financing 10.4 4.3% 69% Senior Unsecured Notes(e) 96.7 10.6% N/A Total GAAP Financing $7,696.6 5.4% N/A Q1 2026 Financing Profile2 Economic Leverage4 1.2x 0.2x 0.1x 0.2x Residential Bond Residential Loan Legacy WMC Commercial Senior Unsecured Notes 1.7x (b) (d) (e)
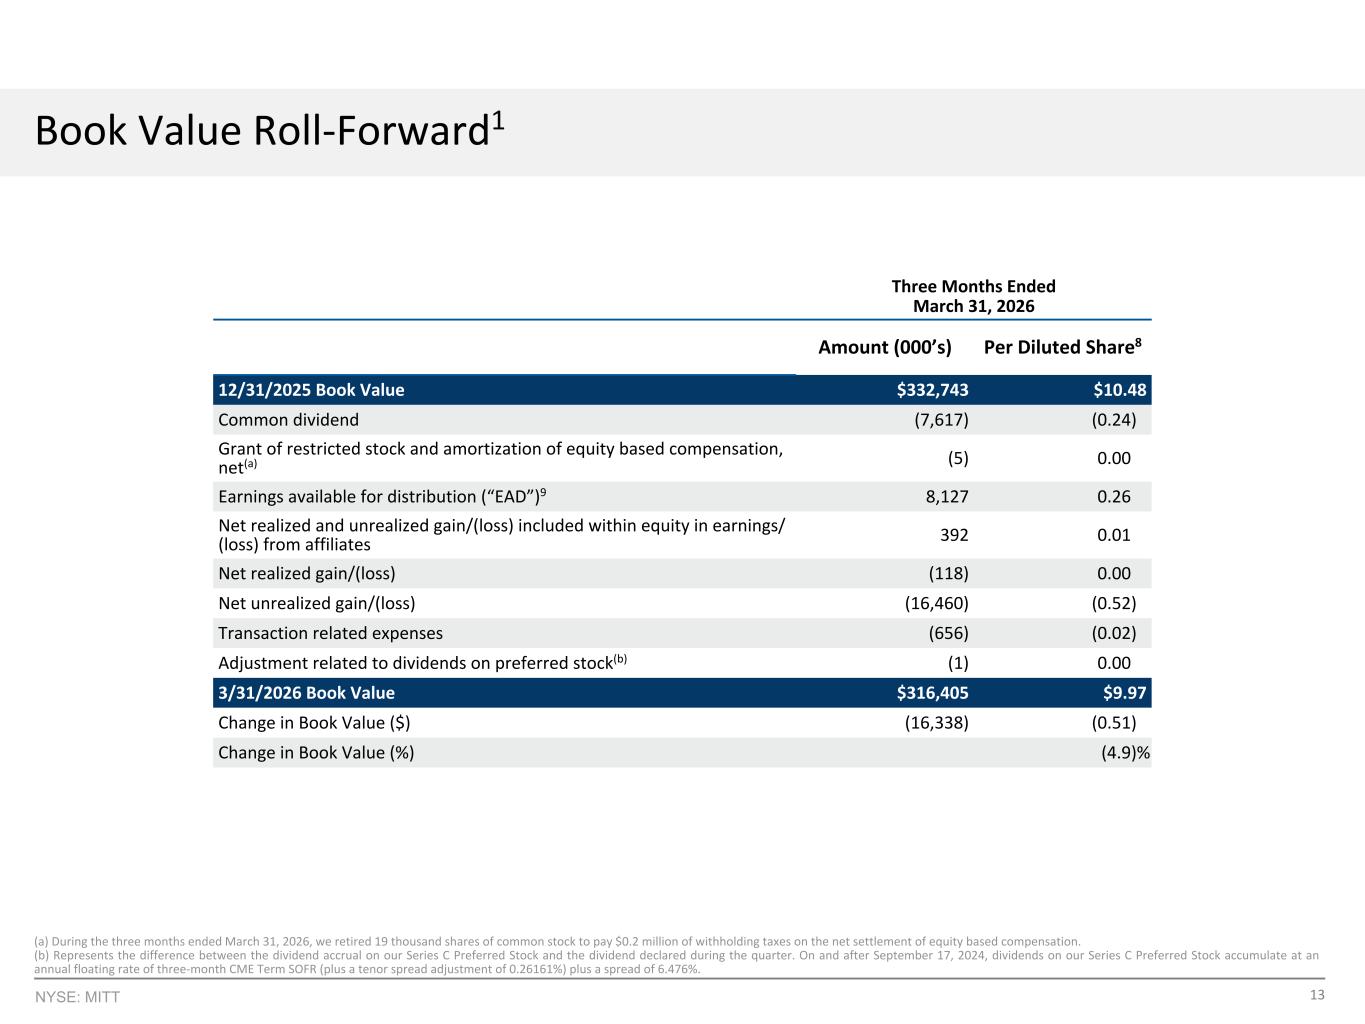
13NYSE: MITT Three Months Ended March 31, 2026 Amount (000’s) Per Diluted Share8 12/31/2025 Book Value $332,743 $10.48 Common dividend (7,617) (0.24) Grant of restricted stock and amortization of equity based compensation, net(a) (5) 0.00 Earnings available for distribution (“EAD”)9 8,127 0.26 Net realized and unrealized gain/(loss) included within equity in earnings/ (loss) from affiliates 392 0.01 Net realized gain/(loss) (118) 0.00 Net unrealized gain/(loss) (16,460) (0.52) Transaction related expenses (656) (0.02) Adjustment related to dividends on preferred stock(b) (1) 0.00 3/31/2026 Book Value $316,405 $9.97 Change in Book Value ($) (16,338) (0.51) Change in Book Value (%) (4.9) % Book Value Roll-Forward1 (a) During the three months ended March 31, 2026, we retired 19 thousand shares of common stock to pay $0.2 million of withholding taxes on the net settlement of equity based compensation. (b) Represents the difference between the dividend accrual on our Series C Preferred Stock and the dividend declared during the quarter. On and after September 17, 2024, dividends on our Series C Preferred Stock accumulate at an annual floating rate of three-month CME Term SOFR (plus a tenor spread adjustment of 0.26161%) plus a spread of 6.476%.
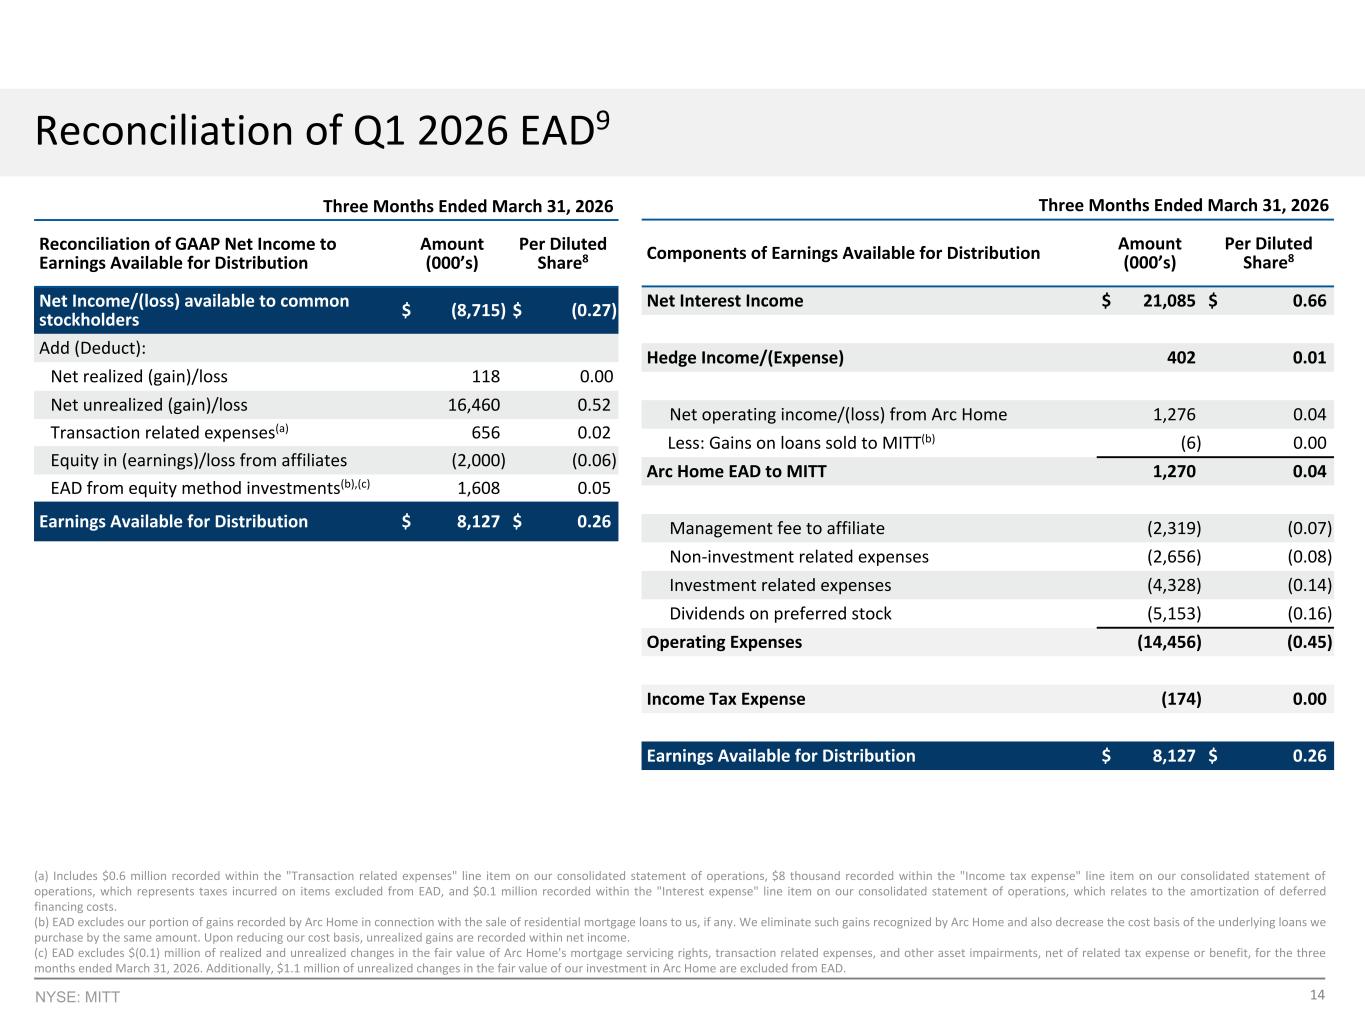
14NYSE: MITT Three Months Ended March 31, 2026 Components of Earnings Available for Distribution Amount (000’s) Per Diluted Share8 Net Interest Income $ 21,085 $ 0.66 Hedge Income/(Expense) 402 0.01 Net operating income/(loss) from Arc Home 1,276 0.04 Less: Gains on loans sold to MITT(b) (6) 0.00 Arc Home EAD to MITT 1,270 0.04 Management fee to affiliate (2,319) (0.07) Non-investment related expenses (2,656) (0.08) Investment related expenses (4,328) (0.14) Dividends on preferred stock (5,153) (0.16) Operating Expenses (14,456) (0.45) Income Tax Expense (174) 0.00 Earnings Available for Distribution $ 8,127 $ 0.26 Reconciliation of Q1 2026 EAD9 (a) Includes $0.6 million recorded within the "Transaction related expenses" line item on our consolidated statement of operations, $8 thousand recorded within the "Income tax expense" line item on our consolidated statement of operations, which represents taxes incurred on items excluded from EAD, and $0.1 million recorded within the "Interest expense" line item on our consolidated statement of operations, which relates to the amortization of deferred financing costs. (b) EAD excludes our portion of gains recorded by Arc Home in connection with the sale of residential mortgage loans to us, if any. We eliminate such gains recognized by Arc Home and also decrease the cost basis of the underlying loans we purchase by the same amount. Upon reducing our cost basis, unrealized gains are recorded within net income. (c) EAD excludes $(0.1) million of realized and unrealized changes in the fair value of Arc Home's mortgage servicing rights, transaction related expenses, and other asset impairments, net of related tax expense or benefit, for the three months ended March 31, 2026. Additionally, $1.1 million of unrealized changes in the fair value of our investment in Arc Home are excluded from EAD. Three Months Ended March 31, 2026 Reconciliation of GAAP Net Income to Earnings Available for Distribution Amount (000’s) Per Diluted Share8 Net Income/(loss) available to common stockholders $ (8,715) $ (0.27) Add (Deduct): Net realized (gain)/loss 118 0.00 Net unrealized (gain)/loss 16,460 0.52 Transaction related expenses(a) 656 0.02 Equity in (earnings)/loss from affiliates (2,000) (0.06) EAD from equity method investments(b),(c) 1,608 0.05 Earnings Available for Distribution $ 8,127 $ 0.26
15 Appendix
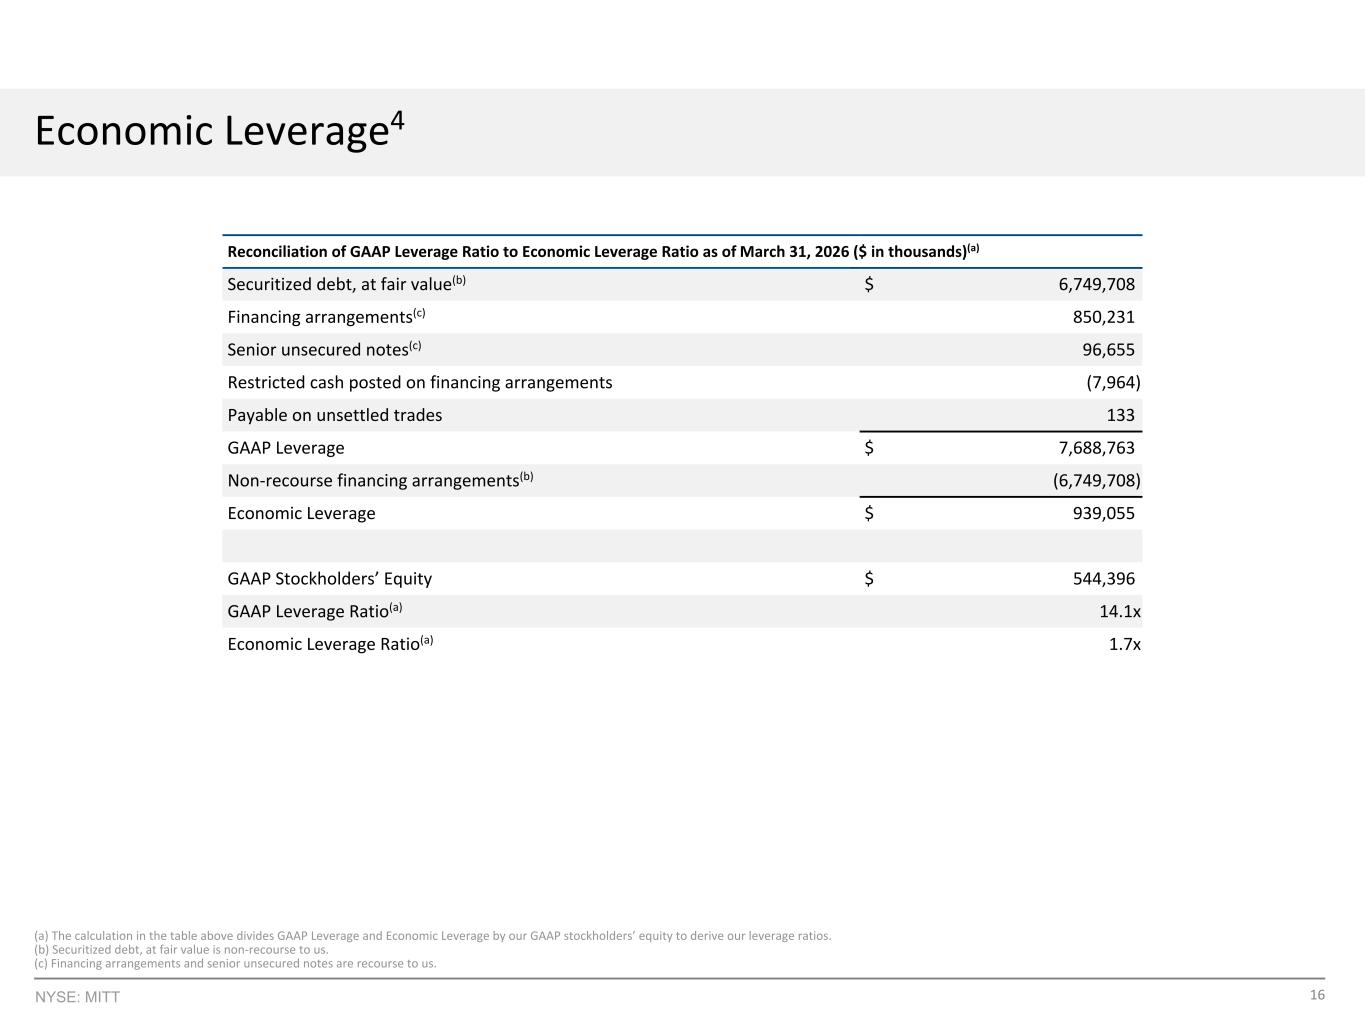
16NYSE: MITT Reconciliation of GAAP Leverage Ratio to Economic Leverage Ratio as of March 31, 2026 ($ in thousands)(a) Securitized debt, at fair value(b) $ 6,749,708 Financing arrangements(c) 850,231 Senior unsecured notes(c) 96,655 Restricted cash posted on financing arrangements (7,964) Payable on unsettled trades 133 GAAP Leverage $ 7,688,763 Non-recourse financing arrangements(b) (6,749,708) Economic Leverage $ 939,055 GAAP Stockholders’ Equity $ 544,396 GAAP Leverage Ratio(a) 14.1x Economic Leverage Ratio(a) 1.7x Economic Leverage4 (a) The calculation in the table above divides GAAP Leverage and Economic Leverage by our GAAP stockholders’ equity to derive our leverage ratios. (b) Securitized debt, at fair value is non-recourse to us. (c) Financing arrangements and senior unsecured notes are recourse to us.
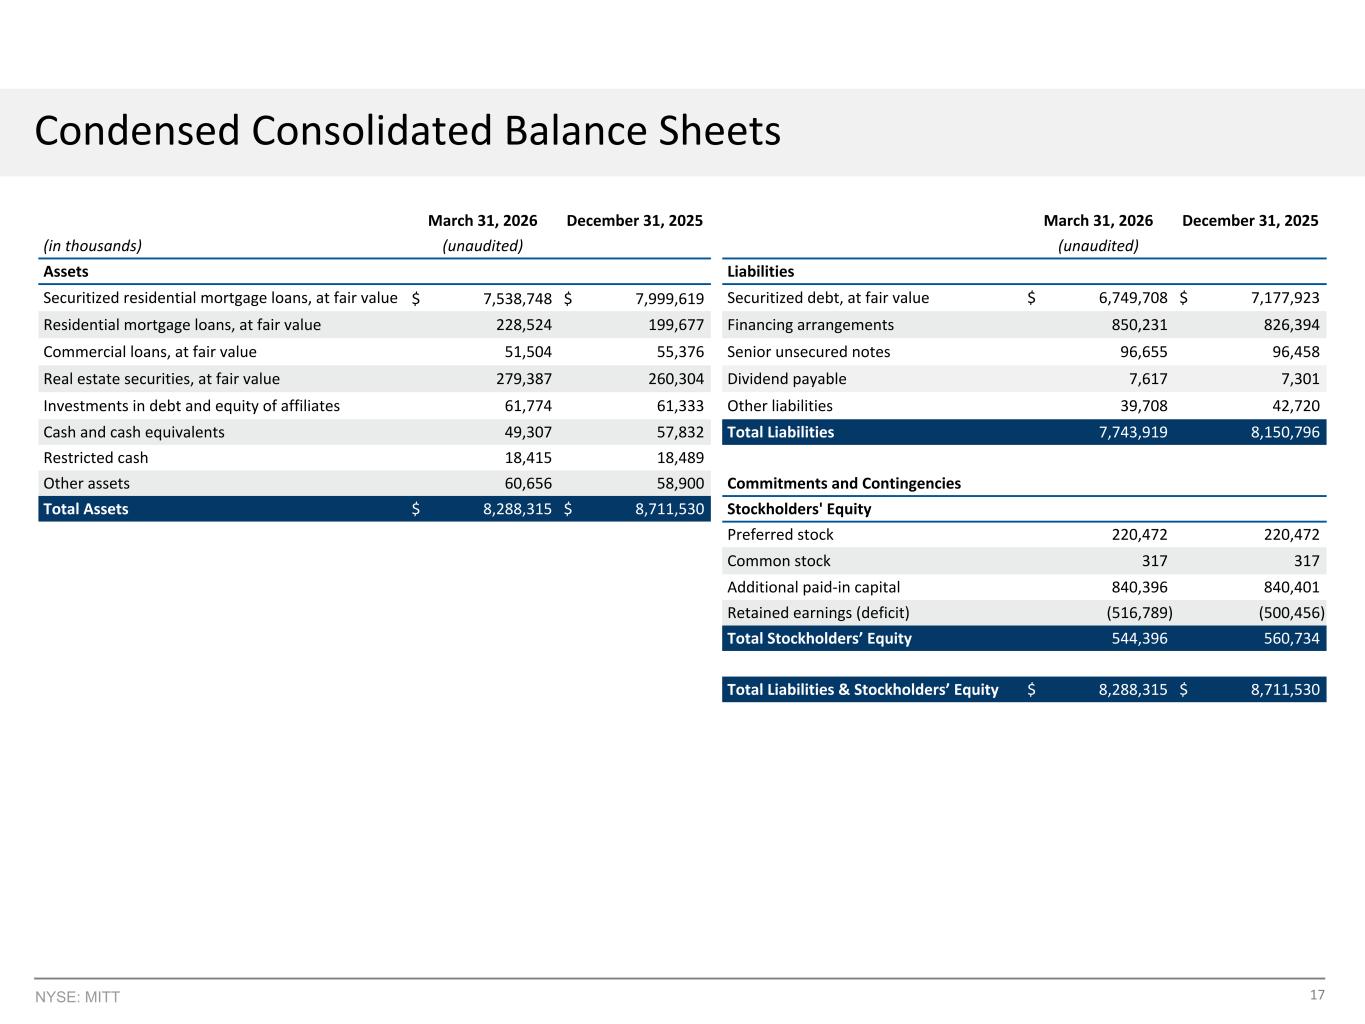
17NYSE: MITT Condensed Consolidated Balance Sheets March 31, 2026 December 31, 2025 March 31, 2026 December 31, 2025 (in thousands) (unaudited) (unaudited) Assets Liabilities Securitized residential mortgage loans, at fair value $ 7,538,748 $ 7,999,619 Securitized debt, at fair value $ 6,749,708 $ 7,177,923 Residential mortgage loans, at fair value 228,524 199,677 Financing arrangements 850,231 826,394 Commercial loans, at fair value 51,504 55,376 Senior unsecured notes 96,655 96,458 Real estate securities, at fair value 279,387 260,304 Dividend payable 7,617 7,301 Investments in debt and equity of affiliates 61,774 61,333 Other liabilities 39,708 42,720 Cash and cash equivalents 49,307 57,832 Total Liabilities 7,743,919 8,150,796 Restricted cash 18,415 18,489 Other assets 60,656 58,900 Commitments and Contingencies Total Assets $ 8,288,315 $ 8,711,530 Stockholders' Equity Preferred stock 220,472 220,472 Common stock 317 317 Additional paid-in capital 840,396 840,401 Retained earnings (deficit) (516,789) (500,456) Total Stockholders’ Equity 544,396 560,734 Total Liabilities & Stockholders’ Equity $ 8,288,315 $ 8,711,530
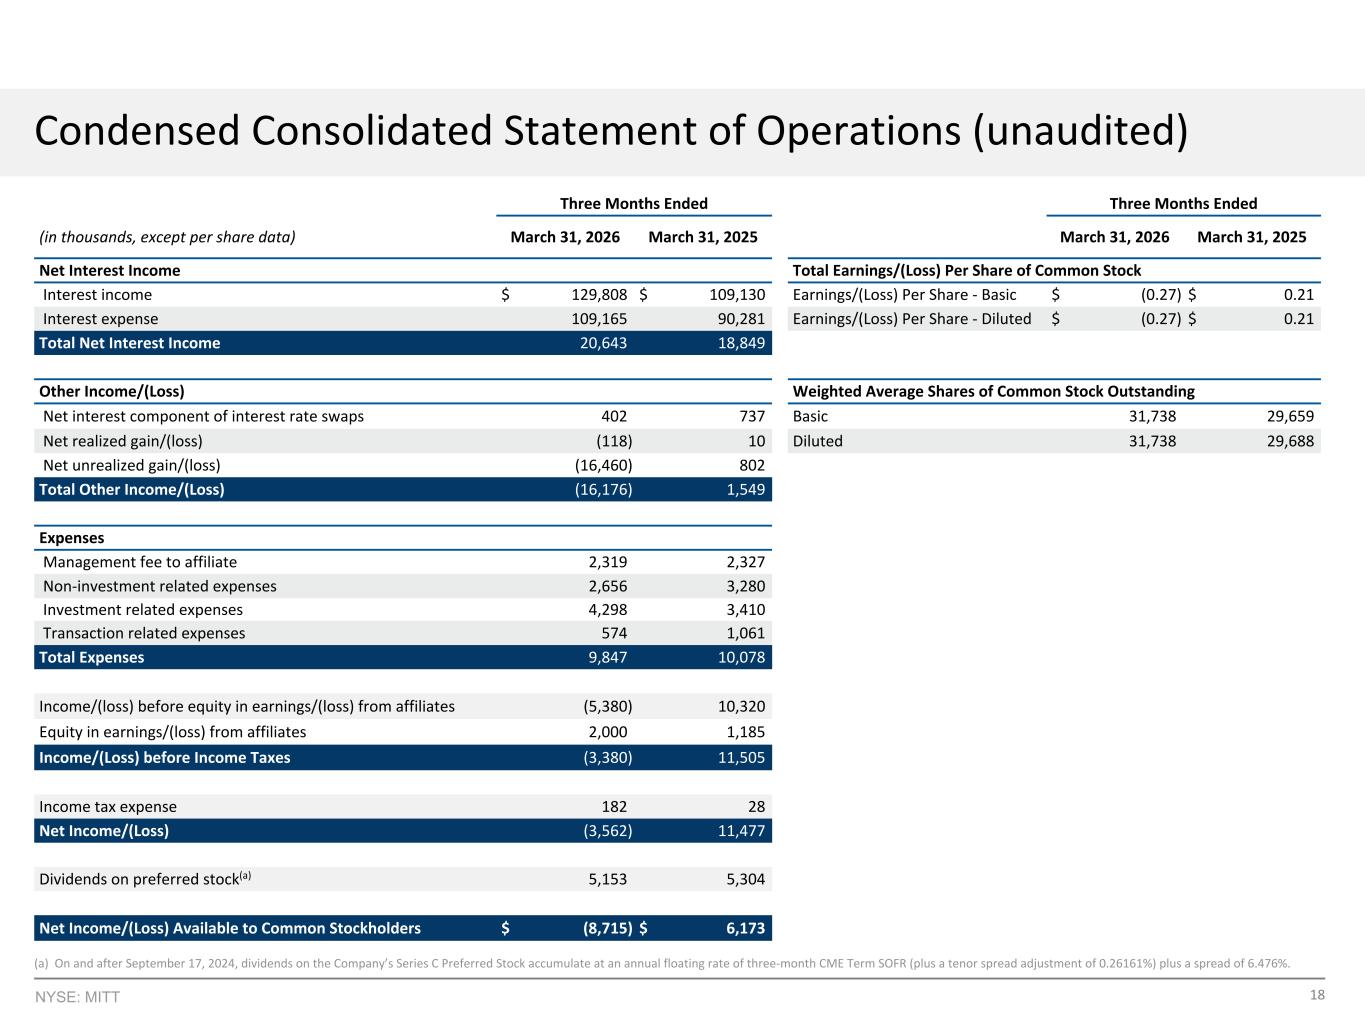
18NYSE: MITT (a) On and after September 17, 2024, dividends on the Company’s Series C Preferred Stock accumulate at an annual floating rate of three-month CME Term SOFR (plus a tenor spread adjustment of 0.26161%) plus a spread of 6.476%. Three Months Ended Three Months Ended (in thousands, except per share data) March 31, 2026 March 31, 2025 March 31, 2026 March 31, 2025 Net Interest Income Total Earnings/(Loss) Per Share of Common Stock Interest income $ 129,808 $ 109,130 Earnings/(Loss) Per Share - Basic $ (0.27) $ 0.21 Interest expense 109,165 90,281 Earnings/(Loss) Per Share - Diluted $ (0.27) $ 0.21 Total Net Interest Income 20,643 18,849 Other Income/(Loss) Weighted Average Shares of Common Stock Outstanding Net interest component of interest rate swaps 402 737 Basic 31,738 29,659 Net realized gain/(loss) (118) 10 Diluted 31,738 29,688 Net unrealized gain/(loss) (16,460) 802 Total Other Income/(Loss) (16,176) 1,549 Expenses Management fee to affiliate 2,319 2,327 Non-investment related expenses 2,656 3,280 Investment related expenses 4,298 3,410 Transaction related expenses 574 1,061 Total Expenses 9,847 10,078 Income/(loss) before equity in earnings/(loss) from affiliates (5,380) 10,320 Equity in earnings/(loss) from affiliates 2,000 1,185 Income/(Loss) before Income Taxes (3,380) 11,505 Income tax expense 182 28 Net Income/(Loss) (3,562) 11,477 Dividends on preferred stock(a) 5,153 5,304 Net Income/(Loss) Available to Common Stockholders $ (8,715) $ 6,173 Condensed Consolidated Statement of Operations (unaudited)
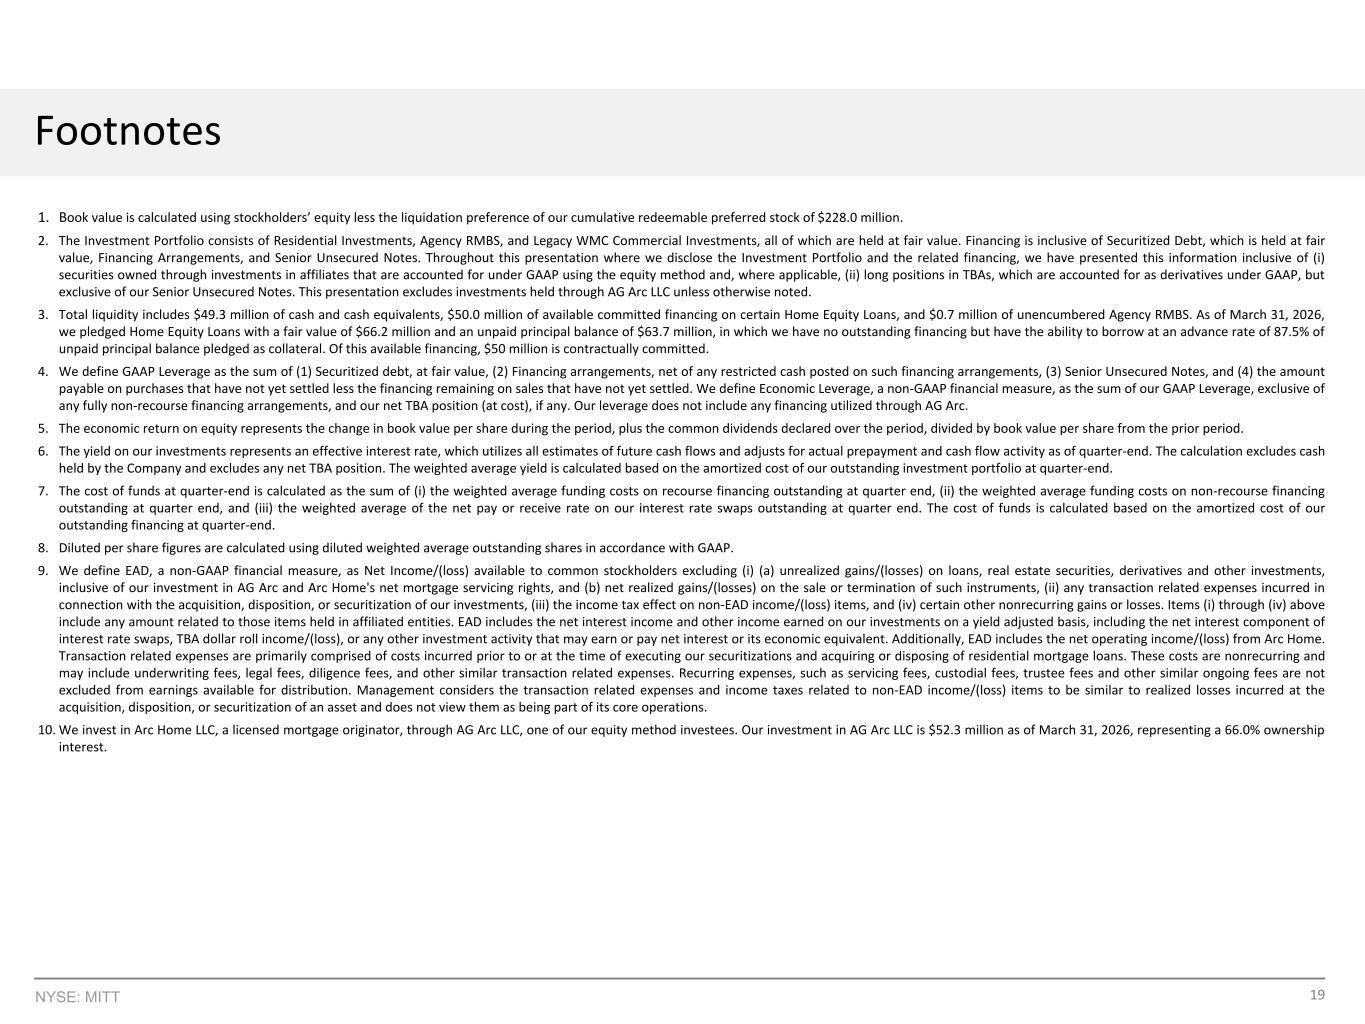
19NYSE: MITT Footnotes 1. Book value is calculated using stockholders’ equity less the liquidation preference of our cumulative redeemable preferred stock of $228.0 million. 2. The Investment Portfolio consists of Residential Investments, Agency RMBS, and Legacy WMC Commercial Investments, all of which are held at fair value. Financing is inclusive of Securitized Debt, which is held at fair value, Financing Arrangements, and Senior Unsecured Notes. Throughout this presentation where we disclose the Investment Portfolio and the related financing, we have presented this information inclusive of (i) securities owned through investments in affiliates that are accounted for under GAAP using the equity method and, where applicable, (ii) long positions in TBAs, which are accounted for as derivatives under GAAP, but exclusive of our Senior Unsecured Notes. This presentation excludes investments held through AG Arc LLC unless otherwise noted. 3. Total liquidity includes $49.3 million of cash and cash equivalents, $50.0 million of available committed financing on certain Home Equity Loans, and $0.7 million of unencumbered Agency RMBS. As of March 31, 2026, we pledged Home Equity Loans with a fair value of $66.2 million and an unpaid principal balance of $63.7 million, in which we have no outstanding financing but have the ability to borrow at an advance rate of 87.5% of unpaid principal balance pledged as collateral. Of this available financing, $50 million is contractually committed. 4. We define GAAP Leverage as the sum of (1) Securitized debt, at fair value, (2) Financing arrangements, net of any restricted cash posted on such financing arrangements, (3) Senior Unsecured Notes, and (4) the amount payable on purchases that have not yet settled less the financing remaining on sales that have not yet settled. We define Economic Leverage, a non-GAAP financial measure, as the sum of our GAAP Leverage, exclusive of any fully non-recourse financing arrangements, and our net TBA position (at cost), if any. Our leverage does not include any financing utilized through AG Arc. 5. The economic return on equity represents the change in book value per share during the period, plus the common dividends declared over the period, divided by book value per share from the prior period. 6. The yield on our investments represents an effective interest rate, which utilizes all estimates of future cash flows and adjusts for actual prepayment and cash flow activity as of quarter-end. The calculation excludes cash held by the Company and excludes any net TBA position. The weighted average yield is calculated based on the amortized cost of our outstanding investment portfolio at quarter-end. 7. The cost of funds at quarter-end is calculated as the sum of (i) the weighted average funding costs on recourse financing outstanding at quarter end, (ii) the weighted average funding costs on non-recourse financing outstanding at quarter end, and (iii) the weighted average of the net pay or receive rate on our interest rate swaps outstanding at quarter end. The cost of funds is calculated based on the amortized cost of our outstanding financing at quarter-end. 8. Diluted per share figures are calculated using diluted weighted average outstanding shares in accordance with GAAP. 9. We define EAD, a non-GAAP financial measure, as Net Income/(loss) available to common stockholders excluding (i) (a) unrealized gains/(losses) on loans, real estate securities, derivatives and other investments, inclusive of our investment in AG Arc and Arc Home's net mortgage servicing rights, and (b) net realized gains/(losses) on the sale or termination of such instruments, (ii) any transaction related expenses incurred in connection with the acquisition, disposition, or securitization of our investments, (iii) the income tax effect on non-EAD income/(loss) items, and (iv) certain other nonrecurring gains or losses. Items (i) through (iv) above include any amount related to those items held in affiliated entities. EAD includes the net interest income and other income earned on our investments on a yield adjusted basis, including the net interest component of interest rate swaps, TBA dollar roll income/(loss), or any other investment activity that may earn or pay net interest or its economic equivalent. Additionally, EAD includes the net operating income/(loss) from Arc Home. Transaction related expenses are primarily comprised of costs incurred prior to or at the time of executing our securitizations and acquiring or disposing of residential mortgage loans. These costs are nonrecurring and may include underwriting fees, legal fees, diligence fees, and other similar transaction related expenses. Recurring expenses, such as servicing fees, custodial fees, trustee fees and other similar ongoing fees are not excluded from earnings available for distribution. Management considers the transaction related expenses and income taxes related to non-EAD income/(loss) items to be similar to realized losses incurred at the acquisition, disposition, or securitization of an asset and does not view them as being part of its core operations. 10. We invest in Arc Home LLC, a licensed mortgage originator, through AG Arc LLC, one of our equity method investees. Our investment in AG Arc LLC is $52.3 million as of March 31, 2026, representing a 66.0% ownership interest.

20 www.mitt.tpg.com