2Q TWENTY25 INVESTOR PRESENTATION ORIGIN BANCORP, INC.
2 FORWARD-LOOKING STATEMENTS AND NON-GAAP MEASURES This presentation contains certain forward-looking statements within the meaning of the Private Securities Litigation Reform Act of 1995. Forward-looking statements include information regarding Origin Bancorp, Inc’s (“Origin”, “we”, “our” or the “Company”) future financial performance, business and growth strategies, projected plans and objectives, and any expected purchases of its outstanding common stock, and related transactions and other projections based on macroeconomic and industry trends, including changes to interest rates by the Federal Reserve and the resulting impact on Origin’s results of operations, estimated forbearance amounts and expectations regarding the Company’s liquidity, including in connection with advances obtained from the FHLB, which are all subject to change and may be inherently unreliable due to the multiple factors that impact broader economic and industry trends, and any such changes may be material. Such forward-looking statements are based on various facts and derived utilizing important assumptions and current expectations, estimates and projections about Origin and its subsidiaries, any of which may change over time and some of which may be beyond Origin’s control. Statements or statistics preceded by, followed by or that otherwise include the words “assumes,” “anticipates,” “believes,” “estimates,” “expects,” “foresees,” “intends,” “plans,” “projects,” and similar expressions or future or conditional verbs such as “could,” “may,” “might,” “should,” “will,” and “would” and variations of such terms are generally forward-looking in nature and not historical facts, although not all forward-looking statements include the foregoing words. Further, certain factors that could affect Origin’s future results and cause actual results to differ materially from those expressed in the forward- looking statements include, but are not limited to: (1) the impact of current and future economic conditions generally and in the financial services industry, nationally and within Origin’s primary market areas, including the impact of tariffs, as well as the financial stress on borrowers and changes to customer and client behavior as a result of the foregoing; (2) changes in benchmark interest rates and the resulting impacts on net interest income; (3) deterioration of Origin’s asset quality; (4) factors that can impact the performance of Origin’s loan portfolio, including real estate values and liquidity in Origin’s primary market areas; (5) the financial health of Origin’s commercial borrowers and the success of construction projects that Origin finances; (6) changes in the value of collateral securing Origin’s loans; (7) the impact of generative artificial intelligence; (8) Origin’s ability to anticipate interest rate changes and manage interest rate risk; (9) the impact of heightened regulatory requirements, reduced debit interchange and overdraft income and the possibility of facing related adverse business consequences if our total assets grow in excess of $10 billion as of December 31 of any calendar year; (10) the effectiveness of Origin’s risk management framework and quantitative models; (11) Origin’s inability to receive dividends from Origin Bank and to service debt, pay dividends to Origin’s common stockholders, repurchase Origin’s shares of common stock and satisfy obligations as they become due; (12) the impact of labor pressures; (13) changes in Origin’s operation or expansion strategy or Origin’s ability to prudently manage its growth and execute its strategy; (14) changes in management personnel; (15) Origin’s ability to maintain important customer relationships, reputation or otherwise avoid liquidity risks; (16) increasing costs as Origin grows deposits; (17) operational risks associated with Origin’s business; (18) significant turbulence or a disruption in the capital or financial markets and the effect of market disruption and interest rate volatility on our investment securities; (19) increased competition in the financial services industry, particularly from regional and national institutions, as well as from fintech companies; (20) compliance with governmental and regulatory requirements and changes in laws, rules, regulations, interpretations or policies relating to financial institutions; (21) periodic changes to the extensive body of accounting rules and best practices; (22) further government intervention in the U.S. financial system; (23) a deterioration of the credit rating for U.S. long-term sovereign debt; (24) Origin’s ability to comply with applicable capital and liquidity requirements, including its ability to generate liquidity internally or raise capital on favorable terms, including continued access to the debt and equity capital markets; (25) natural disasters and other adverse weather events, pandemics, acts of terrorism, war, and other matters beyond Origin’s control; (26) developments in our mortgage banking business, including loan modifications, general demand, and the effects of judicial or regulatory requirements or guidance; (27) fraud or misconduct by internal or external actors (including Origin employees); (28) cybersecurity threats or security breaches and the cost of defending against them; (29) Origin’s ability to maintain adequate internal controls over financial and non-financial reporting; and (30) potential claims, damages, penalties, fines, costs and reputational damage resulting from pending or future litigation, regulatory proceedings and enforcement actions. For a discussion of these and other risks that may cause actual results to differ from expectations, please refer to the sections titled “Cautionary Note Regarding Forward-Looking Statements” and “Risk Factors” in Origin’s most recent Annual Report on Form 10-K filed with the Securities and Exchange Commission and any updates to those sections set forth in Origin’s subsequent Quarterly Reports on Form 10-Q and Current Reports on Form 8-K. If one or more events related to these or other risks or uncertainties materialize, or if Origin’s underlying assumptions prove to be incorrect, actual results may differ materially from what Origin anticipates. Accordingly, you should not place undue reliance on any forward-looking statements. Any forward-looking statement speaks only as of the date on which it is made, and Origin does not undertake any obligation to publicly update or review any forward-looking statement, whether as a result of new information, future developments or otherwise. New risks and uncertainties arise from time to time, and it is not possible for Origin to predict those events or how they may affect Origin. In addition, Origin cannot assess the impact of each factor on Origin’s business or the extent to which any factor, or combination of factors, may cause actual results to differ materially from those contained in any forward-looking statements. All forward-looking statements, expressed or implied, included in this communication are expressly qualified in their entirety by this cautionary statement. This cautionary statement should also be considered in connection with any subsequent written or oral forward-looking statements that Origin or persons acting on Origin’s behalf may issue. Annualized, pro forma, adjusted, projected, and estimated numbers are used for illustrative purposes only, are not forecasts, and may not reflect actual results. This presentation contains projected financial information with respect to Origin, including with respect to certain goals and strategic initiatives of Origin and the anticipated benefits thereof. This projected financial information constitutes forward-looking information and is for illustrative purposes only and should not be relied upon as necessarily being indicative of future results. The assumptions and estimates underlying such projected financial information are inherently uncertain and are subject to significant business, economic (including interest rate), competitive, and other risks and uncertainties. Actual results may differ materially from the results contemplated by the projected financial information contained herein and the inclusion of such projected financial information in this presentation should not be regarded as a representation by any person that such actions will be taken or accomplished or that the results reflected in such projected financial information with respect thereto will be achieved. Origin reports its results in accordance with generally accepted accounting principles in the United States ("GAAP"). However, management believes that certain supplemental non-GAAP financial measures may provide meaningful information to investors that is useful in understanding Origin's results of operations and underlying trends in its business. However, non-GAAP financial measures are supplemental and should be viewed in addition to, and not as an alternative for, Origin's reported results prepared in accordance with GAAP. The following are the non-GAAP measures used in this presentation: Pre-tax, pre-provision (“PTPP”) earnings, PTPP ROAA, tangible book value per common share, tangible common equity to tangible assets, return on average tangible common equity (“ROATCE”) and core efficiency ratio. Please see “Reconciliation of Non-GAAP Financial Measures” at the end of this presentation for reconciliations of non-GAAP measures to the most directly comparable financial measures calculated in accordance with GAAP. ORIGIN BANCORP, INC. _______
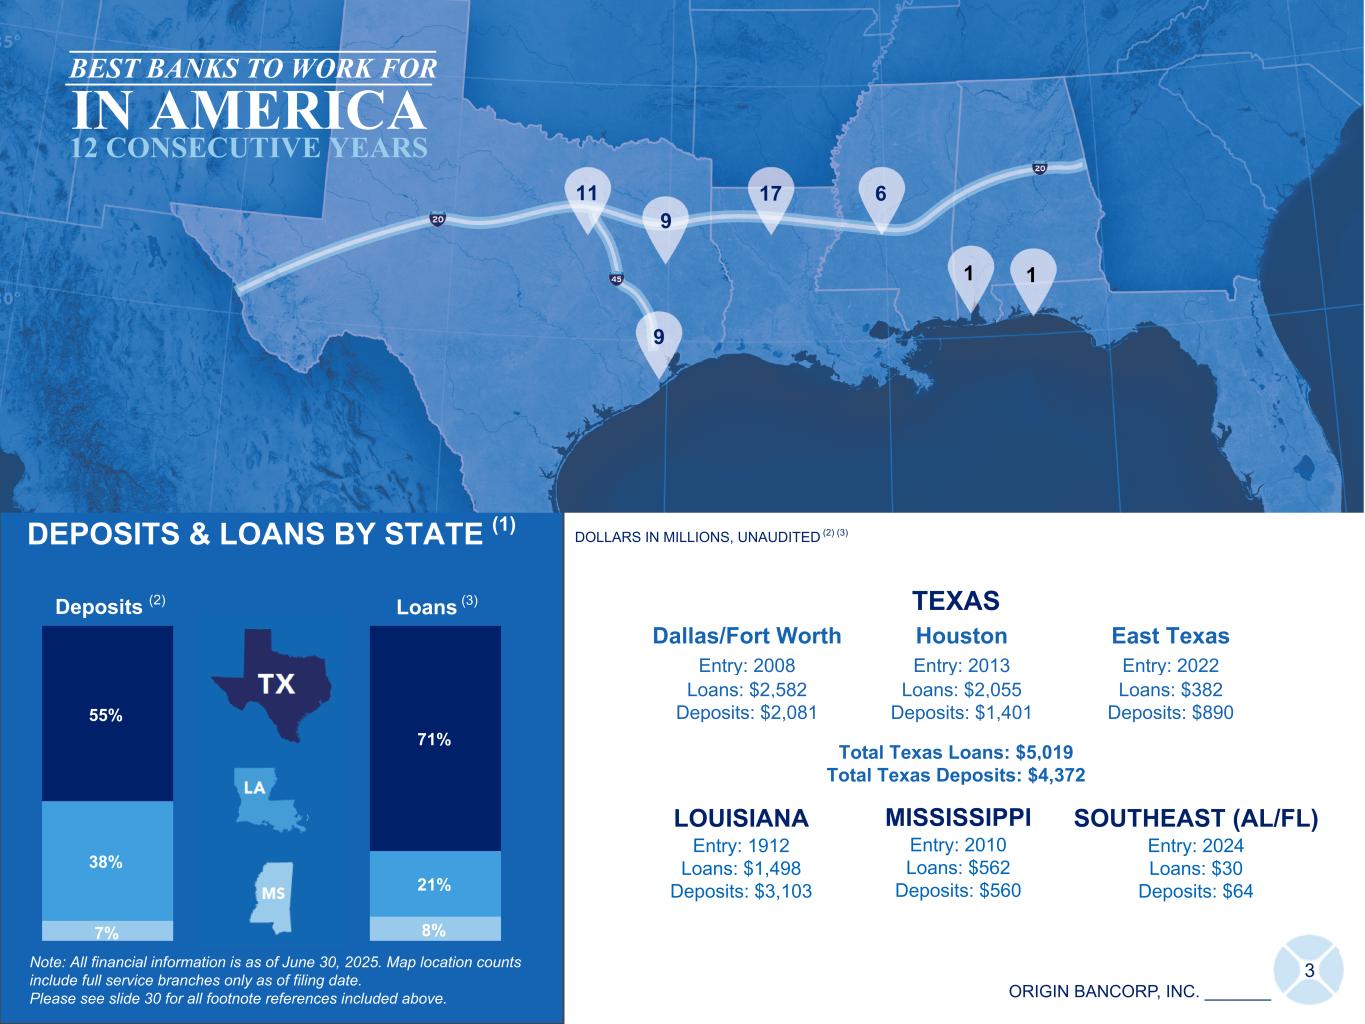
ORIGIN BANCORP, INC. _______ LOUISIANA Entry: 1912 Loans: $1,498 Deposits: $3,103 DOLLARS IN MILLIONS, UNAUDITED (2) (3) 3 DEPOSITS & LOANS BY STATE (1) Note: All financial information is as of June 30, 2025. Map location counts include full service branches only as of filing date. Please see slide 30 for all footnote references included above. MISSISSIPPI Entry: 2010 Loans: $562 Deposits: $560 7% 8% 38% 21% 55% 71% Loans (3)Deposits (2) ICS ICS TEXAS Dallas/Fort Worth Houston East Texas Entry: 2008 Entry: 2013 Entry: 2022 Loans: $2,582 Loans: $2,055 Loans: $382 Deposits: $2,081 Deposits: $1,401 Deposits: $890 Total Texas Loans: $5,019 Total Texas Deposits: $4,372 SOUTHEAST (AL/FL) Entry: 2024 Loans: $30 Deposits: $64 11 9 9 17 6 11 BEST BANKS TO WORK FOR IN AMERICA 12 CONSECUTIVE YEARS
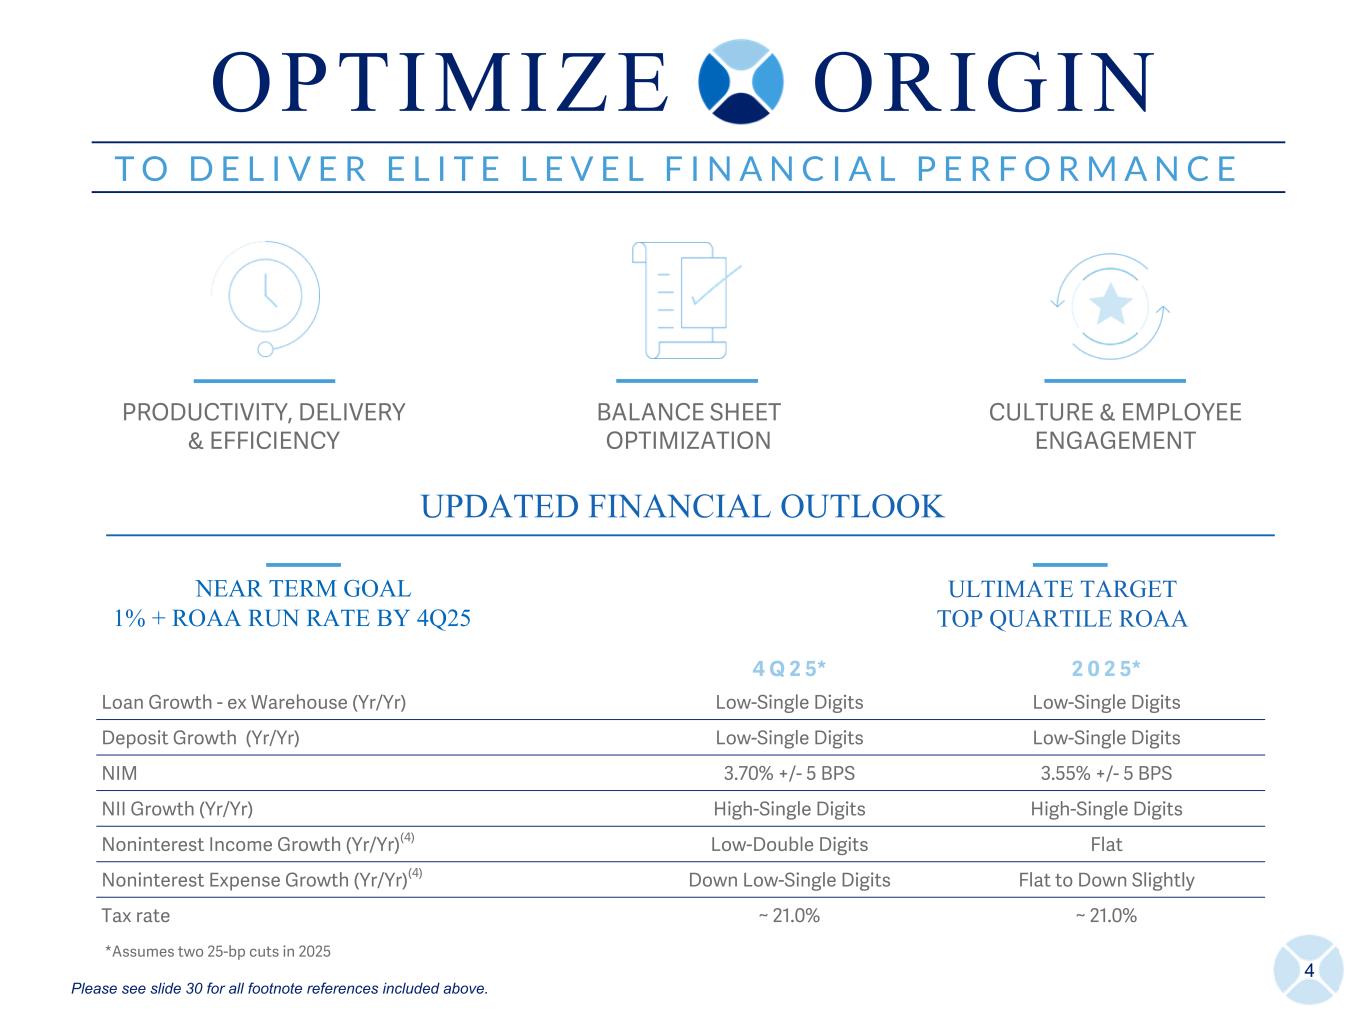
4 T O D E L I V E R E L I T E L E V E L F I N A N C I A L P E R F O R M A N C E T O D E L I V E R E L I T E L E V E L F I N A N C I A L P E R F O R M A N C E PRODUCTIVITY, DELIVERY & EFFICIENCY BALANCE SHEET OPTIMIZATION CULTURE & EMPLOYEE ENGAGEMENT UPDATED FINANCIAL OUTLOOK 4 Q 2 5* 2 0 2 5* Loan Growth - ex Warehouse (Yr/Yr) Low-Single Digits Low-Single Digits Deposit Growth (Yr/Yr) Low-Single Digits Low-Single Digits NIM 3.70% +/- 5 BPS 3.55% +/- 5 BPS NII Growth (Yr/Yr) High-Single Digits High-Single Digits Noninterest Income Growth (Yr/Yr)(4) Low-Double Digits Flat Noninterest Expense Growth (Yr/Yr)(4) Down Low-Single Digits Flat to Down Slightly Tax rate ~ 21.0% ~ 21.0% *Assumes two 25-bp cuts in 2025 NEAR TERM GOAL 1% + ROAA RUN RATE BY 4Q25 ULTIMATE TARGET TOP QUARTILE ROAA O P T I M I Z E O R I G I N Please see slide 30 for all footnote references included above.
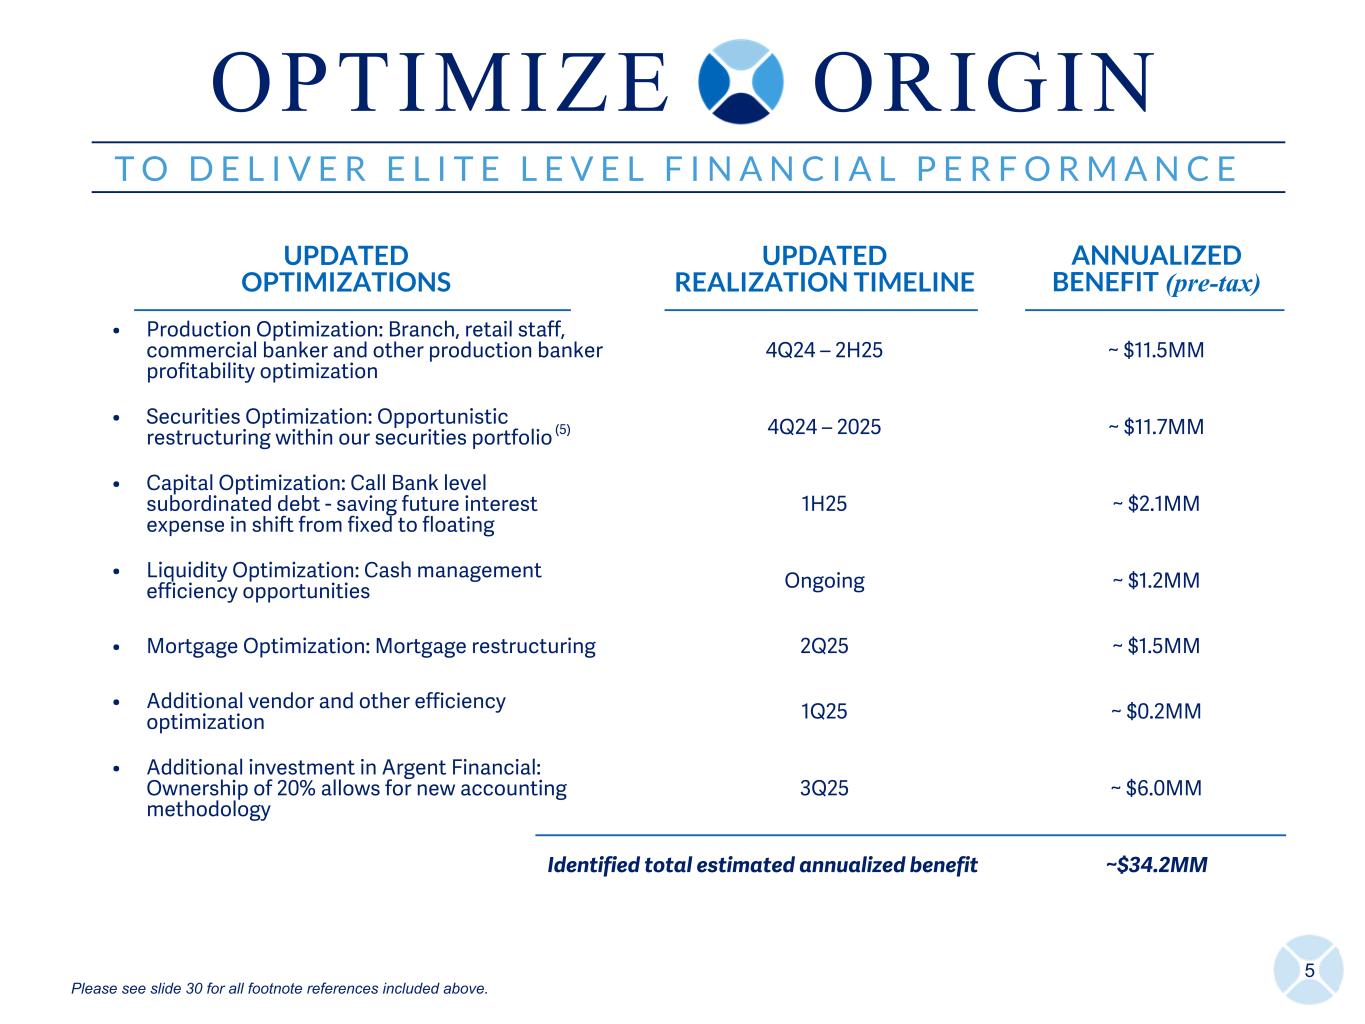
UPDATED OPTIMIZATIONS UPDATED REALIZATION TIMELINE ANNUALIZED BENEFIT (pre-tax) • Production Optimization: Branch, retail staff, commercial banker and other production banker profitability optimization 4Q24 – 2H25 ~ $11.5MM • Securities Optimization: Opportunistic restructuring within our securities portfolio (5) 4Q24 – 2025 ~ $11.7MM • Capital Optimization: Call Bank level subordinated debt - saving future interest expense in shift from fixed to floating 1H25 ~ $2.1MM • Liquidity Optimization: Cash management efficiency opportunities Ongoing ~ $1.2MM • Mortgage Optimization: Mortgage restructuring 2Q25 ~ $1.5MM • Additional vendor and other efficiency optimization 1Q25 ~ $0.2MM • Additional investment in Argent Financial: Ownership of 20% allows for new accounting methodology 3Q25 ~ $6.0MM Identified total estimated annualized benefit ~$34.2MM 5 T O D E L I V E R E L I T E L E V E L F I N A N C I A L P E R F O R M A N C E O P T I M I Z E O R I G I N Please see slide 30 for all footnote references included above.
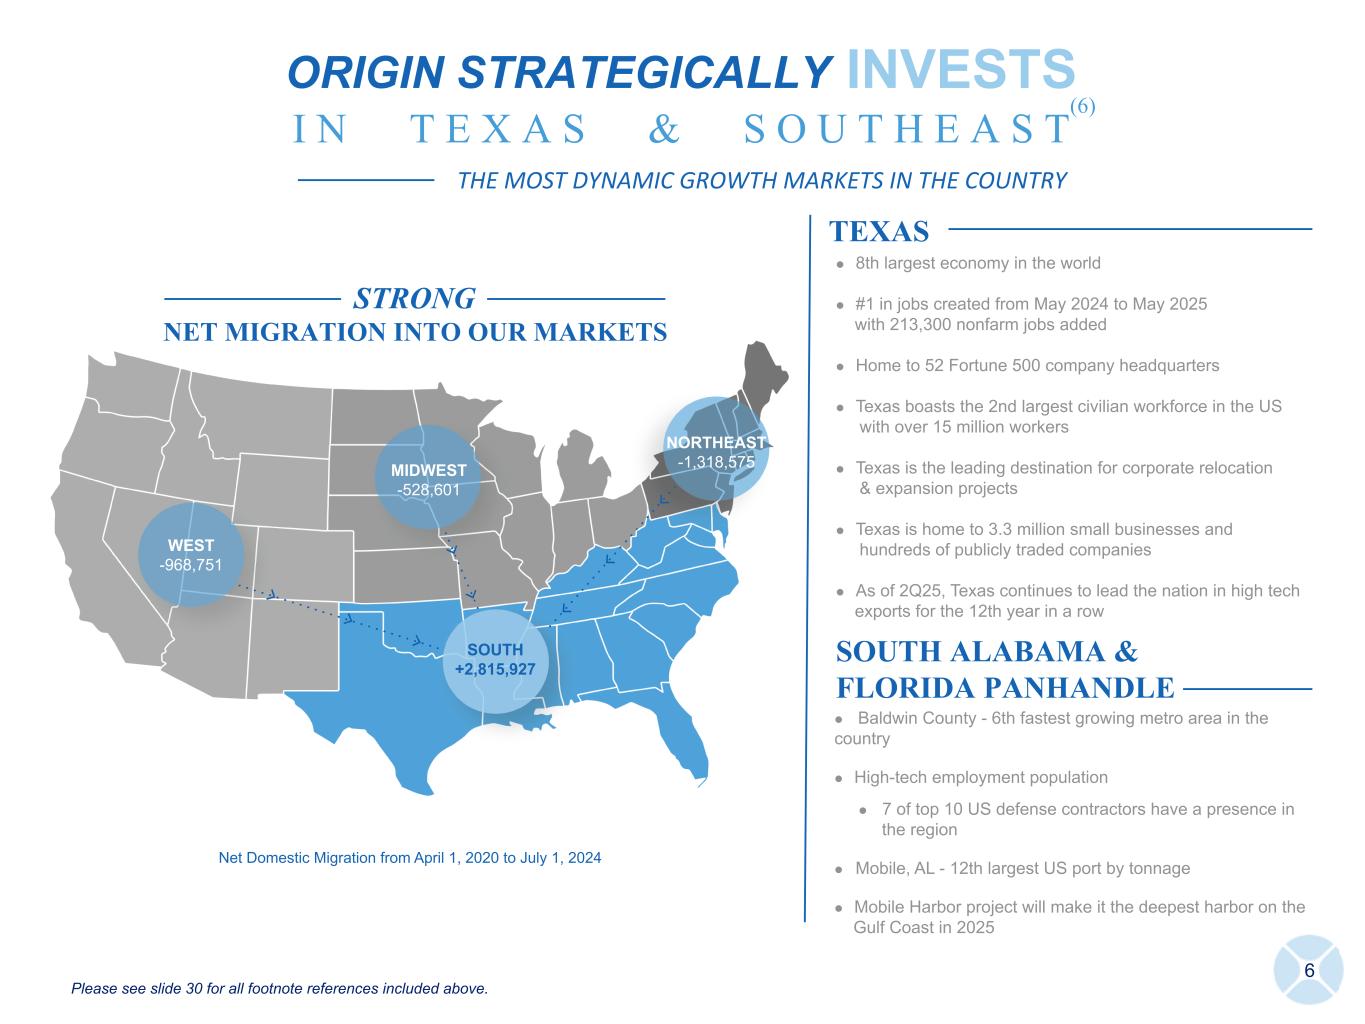
Net Domestic Migration from April 1, 2020 to July 1, 2024 STRONG NET MIGRATION INTO OUR MARKETS WEST -968,751 MIDWEST -528,601 NORTHEAST -1,318,575 SOUTH +2,815,927 6 TEXAS SOUTH ALABAMA & FLORIDA PANHANDLE l Baldwin County - 6th fastest growing metro area in the country l High-tech employment population l 7 of top 10 US defense contractors have a presence in the region l Mobile, AL - 12th largest US port by tonnage l Mobile Harbor project will make it the deepest harbor on the Gulf Coast in 2025 l 8th largest economy in the world l #1 in jobs created from May 2024 to May 2025 with 213,300 nonfarm jobs added l Home to 52 Fortune 500 company headquarters l Texas boasts the 2nd largest civilian workforce in the US with over 15 million workers l Texas is the leading destination for corporate relocation & expansion projects l Texas is home to 3.3 million small businesses and hundreds of publicly traded companies l As of 2Q25, Texas continues to lead the nation in high tech exports for the 12th year in a row ORIGIN STRATEGICALLY INVESTS I N T E X A S & S O U T H E A S T THE MOST DYNAMIC GROWTH MARKETS IN THE COUNTRY (6) Please see slide 30 for all footnote references included above.
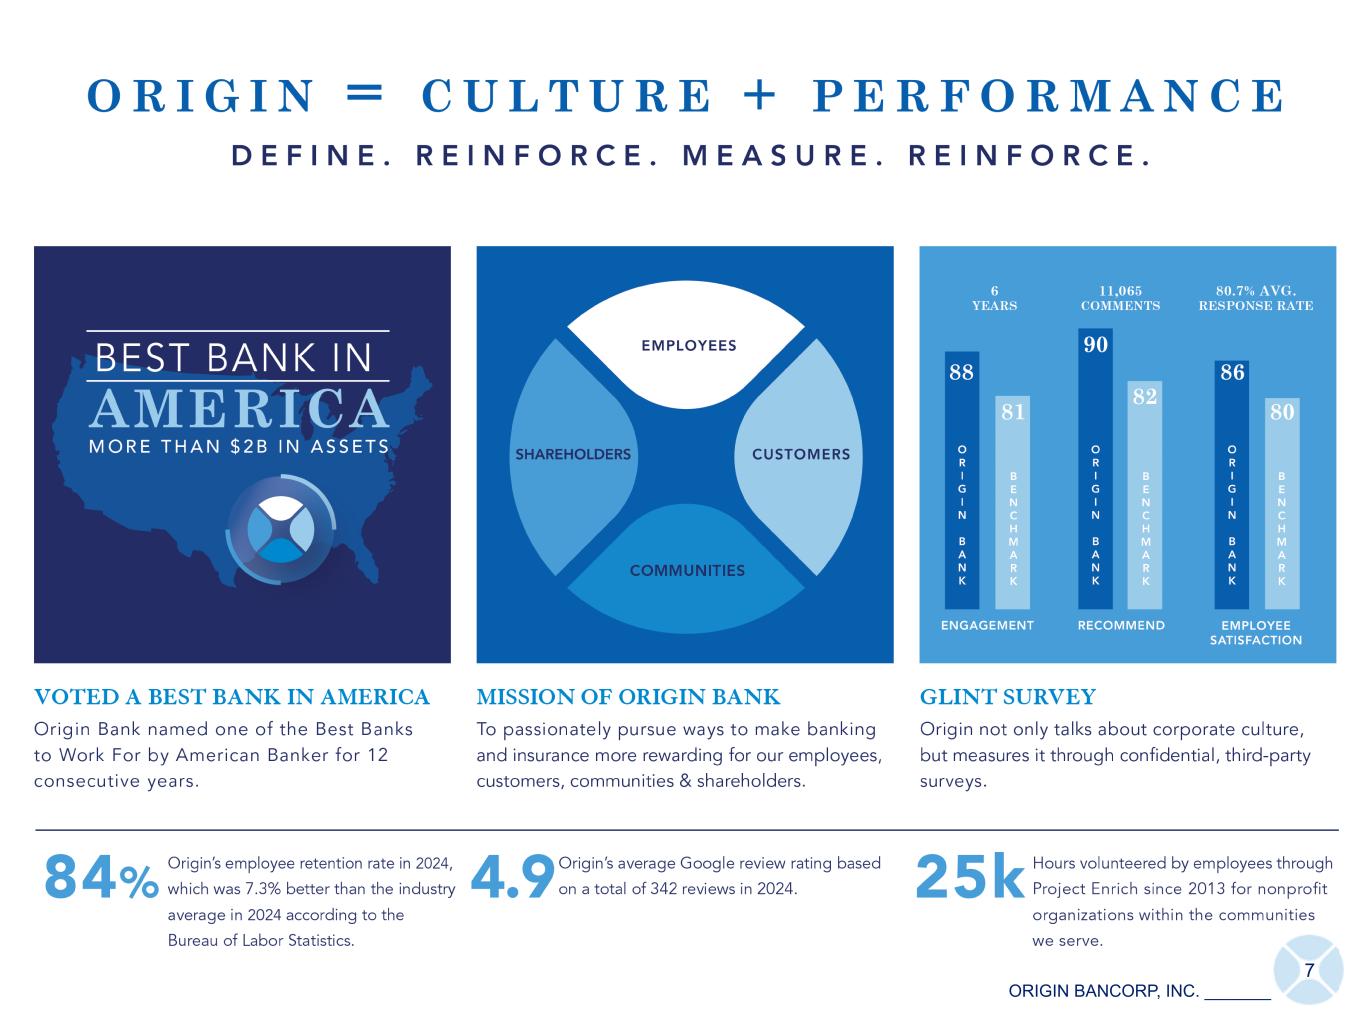
7 ORIGIN BANCORP, INC. _______
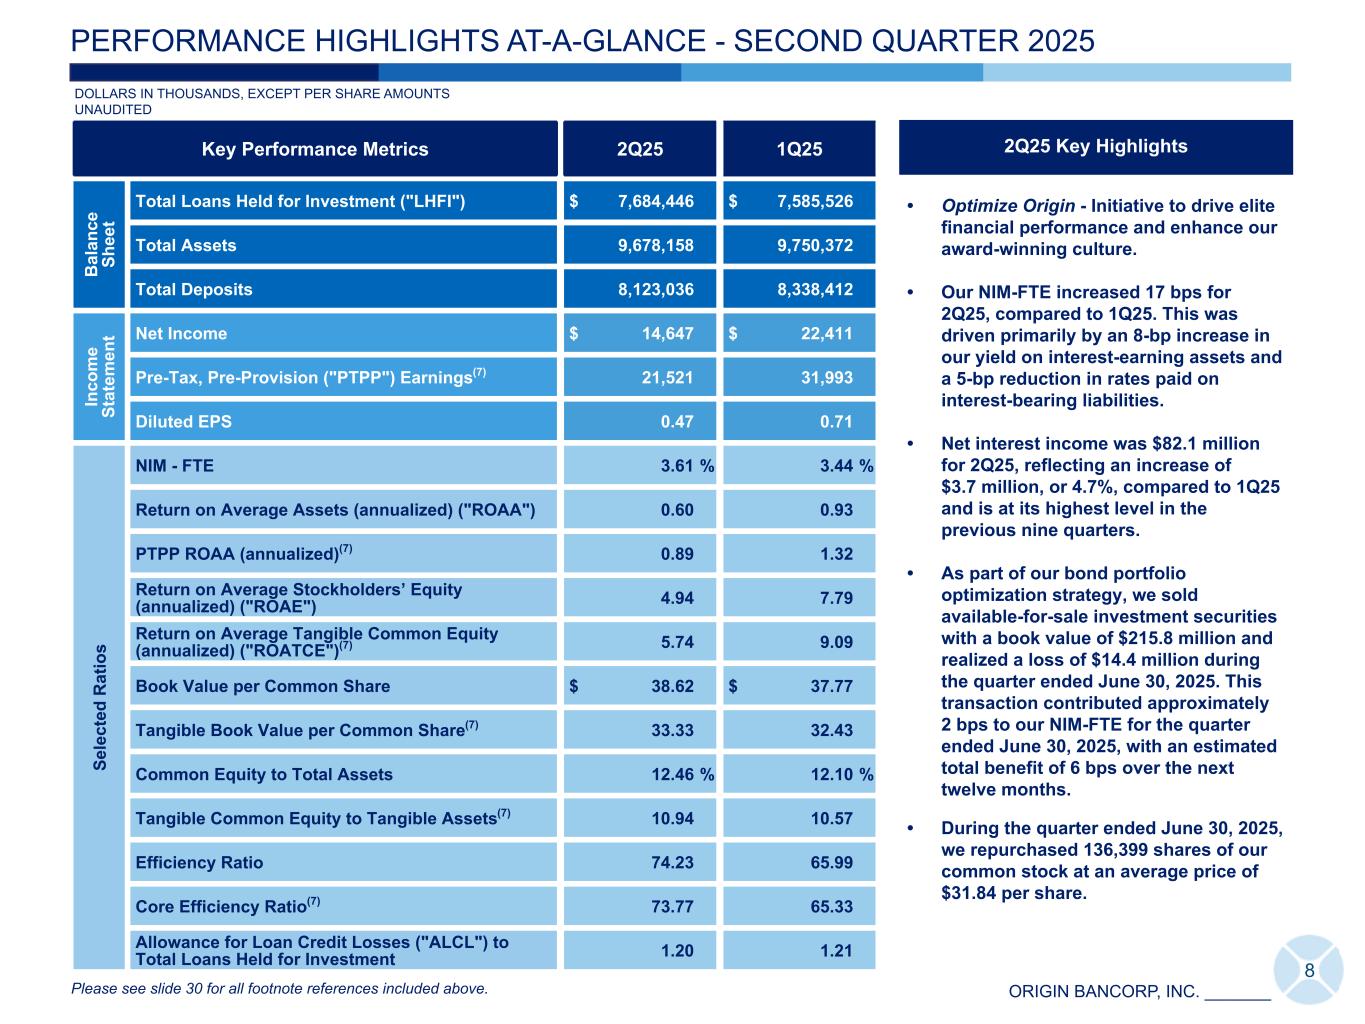
ORIGIN BANCORP, INC. _______ • Optimize Origin - Initiative to drive elite financial performance and enhance our award-winning culture. • Our NIM-FTE increased 17 bps for 2Q25, compared to 1Q25. This was driven primarily by an 8-bp increase in our yield on interest-earning assets and a 5-bp reduction in rates paid on interest-bearing liabilities. • Net interest income was $82.1 million for 2Q25, reflecting an increase of $3.7 million, or 4.7%, compared to 1Q25 and is at its highest level in the previous nine quarters. • As part of our bond portfolio optimization strategy, we sold available-for-sale investment securities with a book value of $215.8 million and realized a loss of $14.4 million during the quarter ended June 30, 2025. This transaction contributed approximately 2 bps to our NIM-FTE for the quarter ended June 30, 2025, with an estimated total benefit of 6 bps over the next twelve months. • During the quarter ended June 30, 2025, we repurchased 136,399 shares of our common stock at an average price of $31.84 per share. Key Performance Metrics 2Q25 1Q25 B al an ce Sh ee t Total Loans Held for Investment ("LHFI") $ 7,684,446 $ 7,585,526 Total Assets 9,678,158 9,750,372 Total Deposits 8,123,036 8,338,412 In co m e St at em en t Net Income $ 14,647 $ 22,411 Pre-Tax, Pre-Provision ("PTPP") Earnings(7) 21,521 31,993 Diluted EPS 0.47 0.71 Se le ct ed R at io s NIM - FTE 3.61 % 3.44 % Return on Average Assets (annualized) ("ROAA") 0.60 0.93 PTPP ROAA (annualized)(7) 0.89 1.32 Return on Average Stockholders’ Equity (annualized) ("ROAE") 4.94 7.79 Return on Average Tangible Common Equity (annualized) ("ROATCE")(7) 5.74 9.09 Book Value per Common Share $ 38.62 $ 37.77 Tangible Book Value per Common Share(7) 33.33 32.43 Common Equity to Total Assets 12.46 % 12.10 % Tangible Common Equity to Tangible Assets(7) 10.94 10.57 Efficiency Ratio 74.23 65.99 Core Efficiency Ratio(7) 73.77 65.33 Allowance for Loan Credit Losses ("ALCL") to Total Loans Held for Investment 1.20 1.21 DOLLARS IN THOUSANDS, EXCEPT PER SHARE AMOUNTS UNAUDITED 8 PERFORMANCE HIGHLIGHTS AT-A-GLANCE - SECOND QUARTER 2025 2Q25 Key Highlights Please see slide 30 for all footnote references included above.
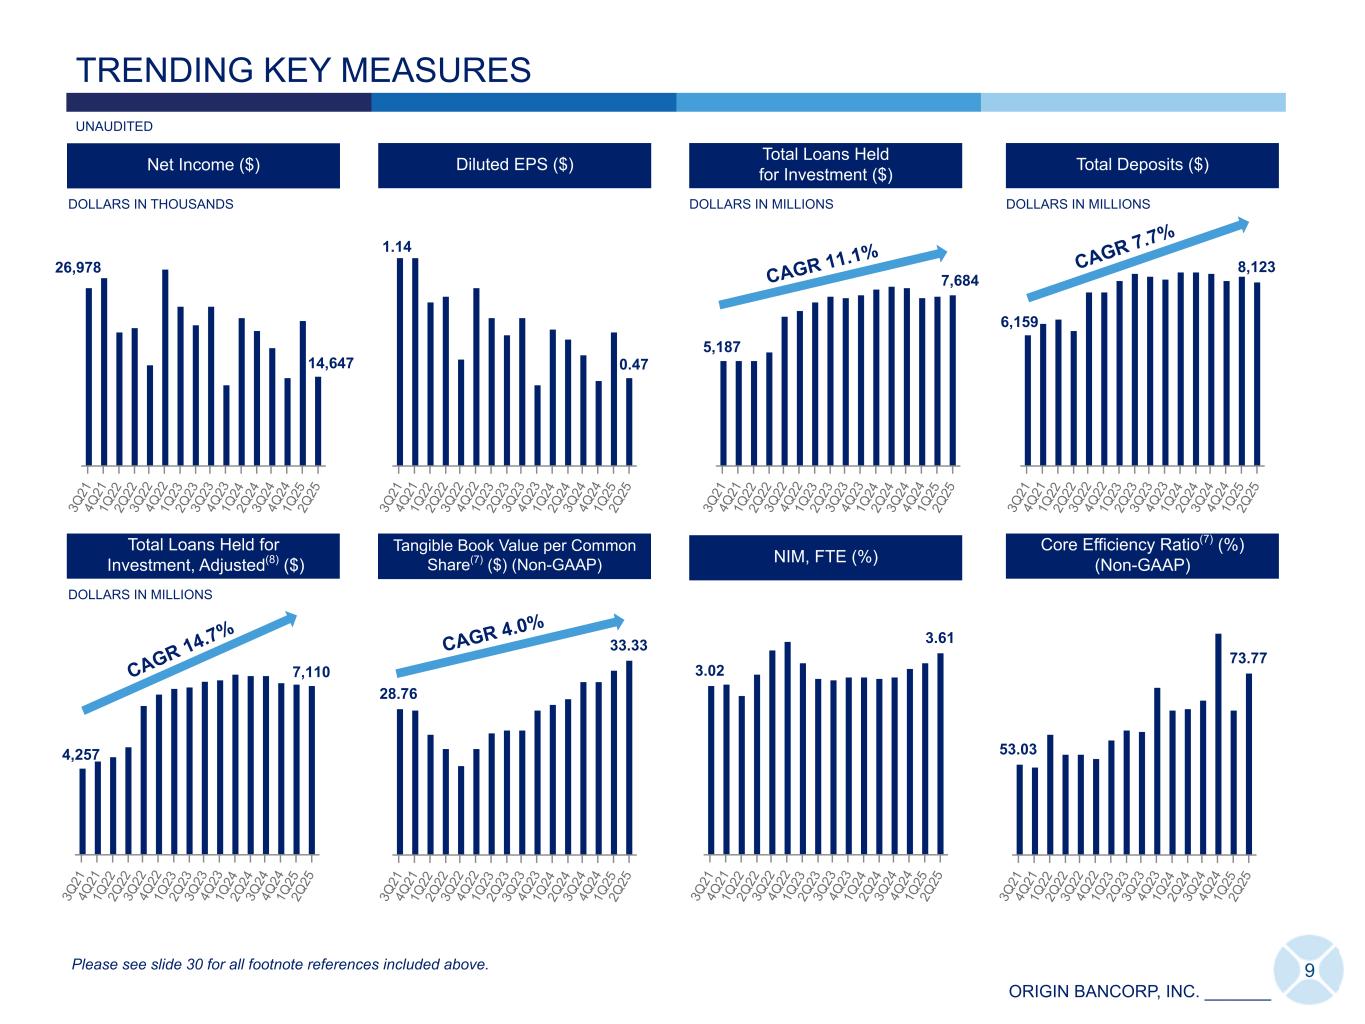
ORIGIN BANCORP, INC. _______ TRENDING KEY MEASURES UNAUDITED Diluted EPS ($)Net Income ($) Total Loans Held for Investment, Adjusted(8) ($) Total Deposits ($) 3Q 21 4Q 21 1Q 22 2Q 22 3Q 22 4Q 22 1Q 23 2Q 23 3Q 23 4Q 23 1Q 24 2Q 24 3Q 24 4Q 24 1Q 25 2Q 25 3Q 21 4Q 21 1Q 22 2Q 22 3Q 22 4Q 22 1Q 23 2Q 23 3Q 23 4Q 23 1Q 24 2Q 24 3Q 24 4Q 24 1Q 25 2Q 25 8,123 3Q 21 4Q 21 1Q 22 2Q 22 3Q 22 4Q 22 1Q 23 2Q 23 3Q 23 4Q 23 1Q 24 2Q 24 3Q 24 4Q 24 1Q 25 2Q 25 4,257 7,110 3Q 21 4Q 21 1Q 22 2Q 22 3Q 22 4Q 22 1Q 23 2Q 23 3Q 23 4Q 23 1Q 24 2Q 24 3Q 24 4Q 24 1Q 25 2Q 25 DOLLARS IN THOUSANDS 9 Total Loans Held for Investment ($) DOLLARS IN MILLIONS 5,187 3Q 21 4Q 21 1Q 22 2Q 22 3Q 22 4Q 22 1Q 23 2Q 23 3Q 23 4Q 23 1Q 24 2Q 24 3Q 24 4Q 24 1Q 25 2Q 25 DOLLARS IN MILLIONS DOLLARS IN MILLIONS Please see slide 30 for all footnote references included above. CAGR 11.1% CAGR 14.7% CAGR 7.7% 6,159 26,978 14,647 Core Efficiency Ratio(7) (%) (Non-GAAP) 53.03 73.77 3Q 21 4Q 21 1Q 22 2Q 22 3Q 22 4Q 22 1Q 23 2Q 23 3Q 23 4Q 23 1Q 24 2Q 24 3Q 24 4Q 24 1Q 25 2Q 25 28.76 33.33 3Q 21 4Q 21 1Q 22 2Q 22 3Q 22 4Q 22 1Q 23 2Q 23 3Q 23 4Q 23 1Q 24 2Q 24 3Q 24 4Q 24 1Q 25 2Q 25 Tangible Book Value per Common Share(7) ($) (Non-GAAP) 3Q 21 4Q 21 1Q 22 2Q 22 3Q 22 4Q 22 1Q 23 2Q 23 3Q 23 4Q 23 1Q 24 2Q 24 3Q 24 4Q 24 1Q 25 2Q 25 Return on Average Assets (%) CAGR 4.0% CAGR (20.5)% 1.14 0.47 7,684 1.43 0.60 3.02 3.61 3Q 21 4Q 21 1Q 22 2Q 22 3Q 22 4Q 22 1Q 23 2Q 23 3Q 23 4Q 23 1Q 24 2Q 24 3Q 24 4Q 24 1Q 25 2Q 25 CAGR 4.8%% NIM, FTE (%)
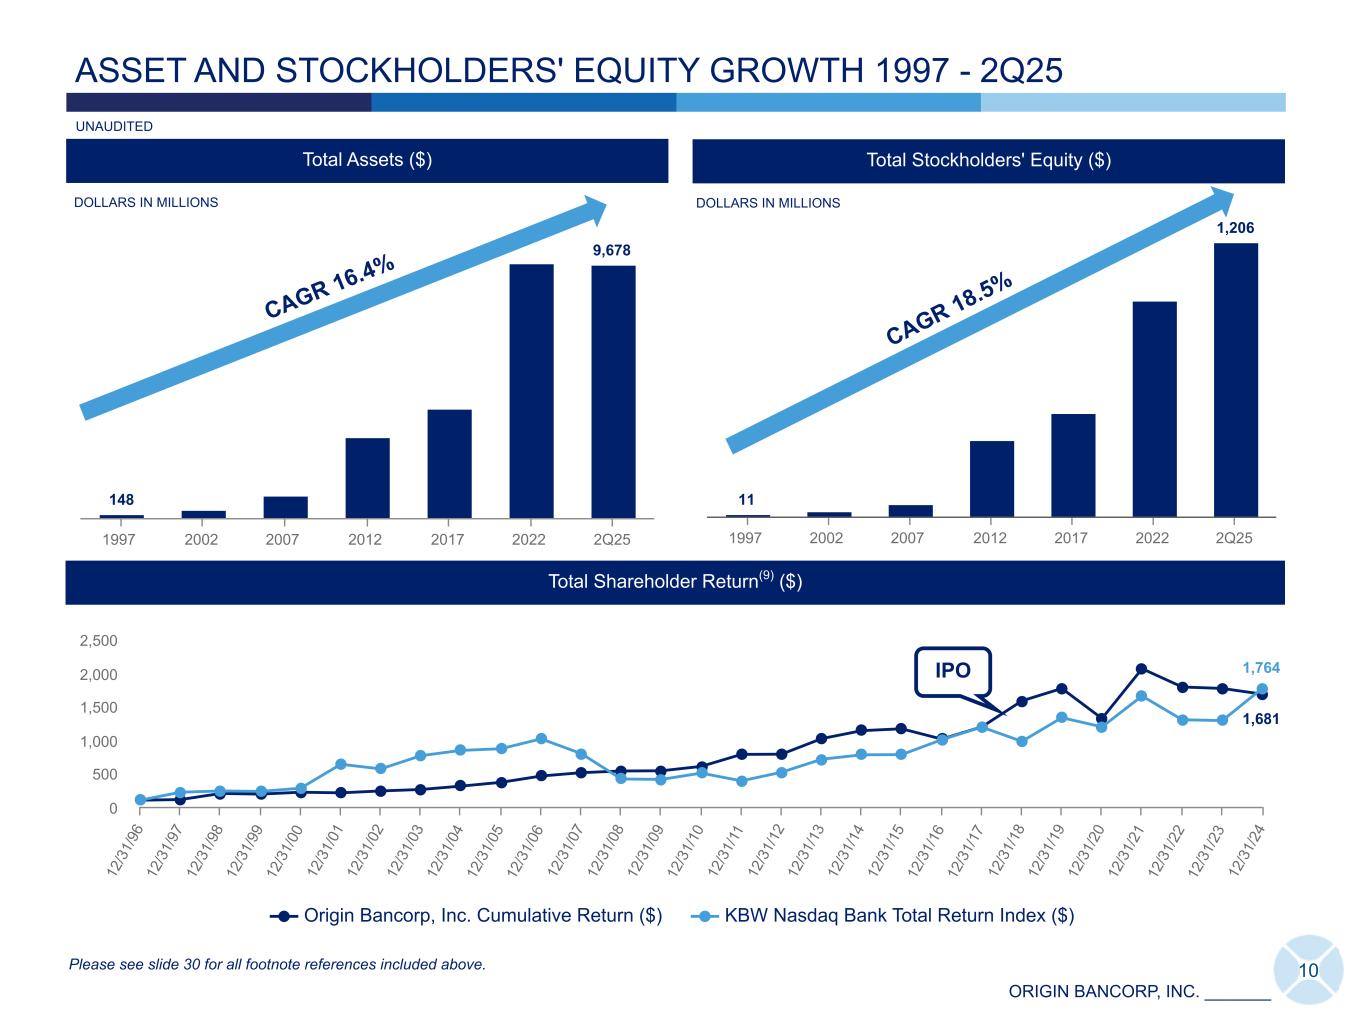
ORIGIN BANCORP, INC. _______ ASSET AND STOCKHOLDERS' EQUITY GROWTH 1997 - 2Q25 DOLLARS IN MILLIONS Total Assets ($) 148 9,678 1997 2002 2007 2012 2017 2022 2Q25 Total Stockholders' Equity ($) 11 1,206 1997 2002 2007 2012 2017 2022 2Q25 CAGR 16.4% CAGR 18.5% 10 1,681 1,764 Origin Bancorp, Inc. Cumulative Return ($) KBW Nasdaq Bank Total Return Index ($) 12 /3 1/ 96 12 /3 1/ 97 12 /3 1/ 98 12 /3 1/ 99 12 /3 1/ 00 12 /3 1/ 01 12 /3 1/ 02 12 /3 1/ 03 12 /3 1/ 04 12 /3 1/ 05 12 /3 1/ 06 12 /3 1/ 07 12 /3 1/ 08 12 /3 1/ 09 12 /3 1/ 10 12 /3 1/ 11 12 /3 1/ 12 12 /3 1/ 13 12 /3 1/ 14 12 /3 1/ 15 12 /3 1/ 16 12 /3 1/ 17 12 /3 1/ 18 12 /3 1/ 19 12 /3 1/ 20 12 /3 1/ 21 12 /3 1/ 22 12 /3 1/ 23 12 /3 1/ 24 0 500 1,000 1,500 2,000 2,500 Total Shareholder Return(9) ($) IPO Please see slide 30 for all footnote references included above. DOLLARS IN MILLIONS UNAUDITED
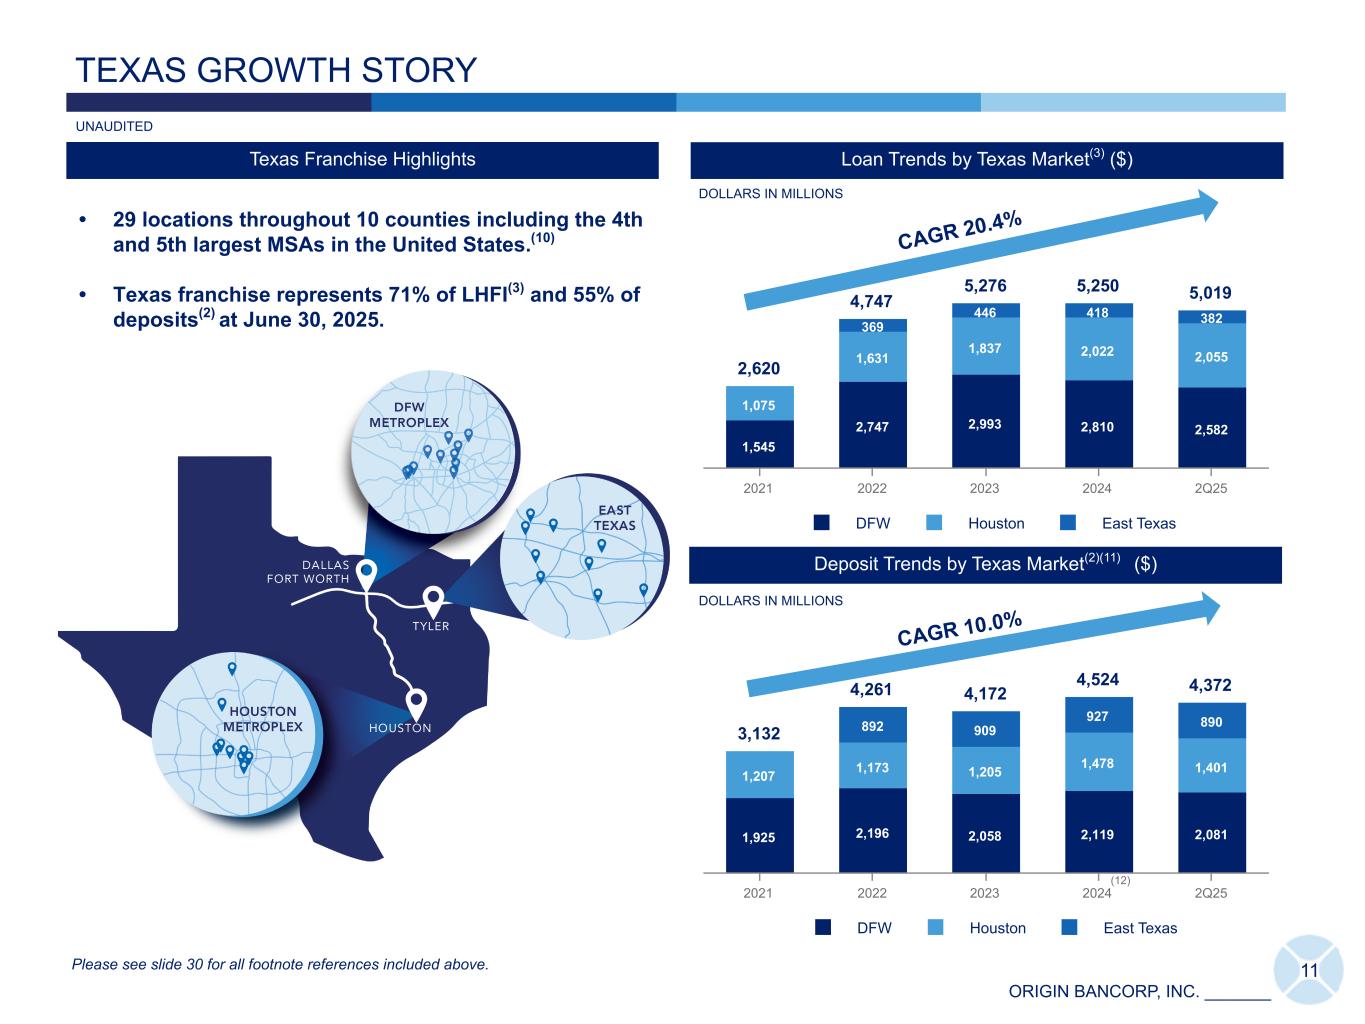
ORIGIN BANCORP, INC. _______ 11 2,620 4,747 5,276 5,250 5,019 1,545 2,747 2,993 2,810 2,582 1,075 1,631 1,837 2,022 2,055 369 446 418 382 DFW Houston East Texas 2021 2022 2023 2024 2Q25 Deposit Trends by Texas Market(2)(11) ($) Loan Trends by Texas Market(3) ($) TEXAS GROWTH STORY Texas Franchise Highlights DOLLARS IN MILLIONS • 29 locations throughout 10 counties including the 4th and 5th largest MSAs in the United States.(10) • Texas franchise represents 71% of LHFI(3) and 55% of deposits(2) at June 30, 2025. 3,132 4,261 4,172 4,524 4,372 1,925 2,196 2,058 2,119 2,081 1,207 1,173 1,205 1,478 1,401 892 909 927 890 DFW Houston East Texas 2021 2022 2023 2024 2Q25 CAGR 20.4% CAGR 10.0% Please see slide 30 for all footnote references included above. DOLLARS IN MILLIONS UNAUDITED (12)
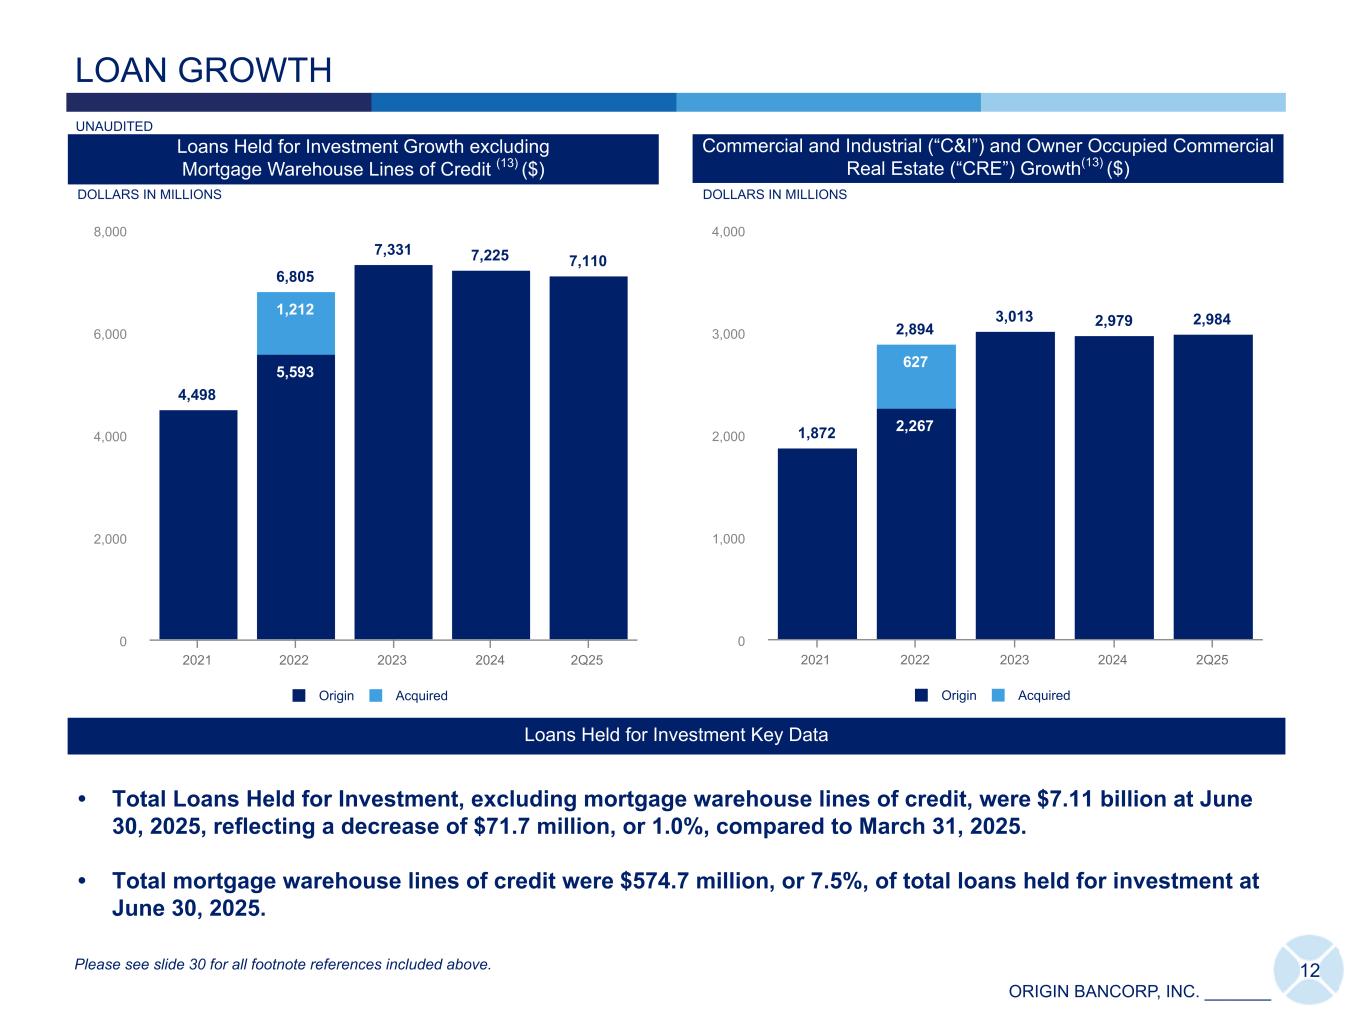
ORIGIN BANCORP, INC. _______ 12 LOAN GROWTH 4,498 6,805 7,331 7,225 7,110 4,498 5,593 7,225 7,110 1,212 Origin Acquired 2021 2022 2023 2024 2Q25 0 2,000 4,000 6,000 8,000 Loans Held for Investment Key Data DOLLARS IN MILLIONS IDT • Total Loans Held for Investment, excluding mortgage warehouse lines of credit, were $7.11 billion at June 30, 2025, reflecting a decrease of $71.7 million, or 1.0%, compared to March 31, 2025. • Total mortgage warehouse lines of credit were $574.7 million, or 7.5%, of total loans held for investment at June 30, 2025. Loans Held for Investment Growth excluding Mortgage Warehouse Lines of Credit (13) ($) 1,872 2,894 3,013 2,979 2,984 1,872 2,267 2,979 2,984627 Origin Acquired 2021 2022 2023 2024 2Q25 0 1,000 2,000 3,000 4,000 Commercial and Industrial (“C&I”) and Owner Occupied Commercial Real Estate (“CRE”) Growth(13) ($) Please see slide 30 for all footnote references included above. DOLLARS IN MILLIONS UNAUDITED
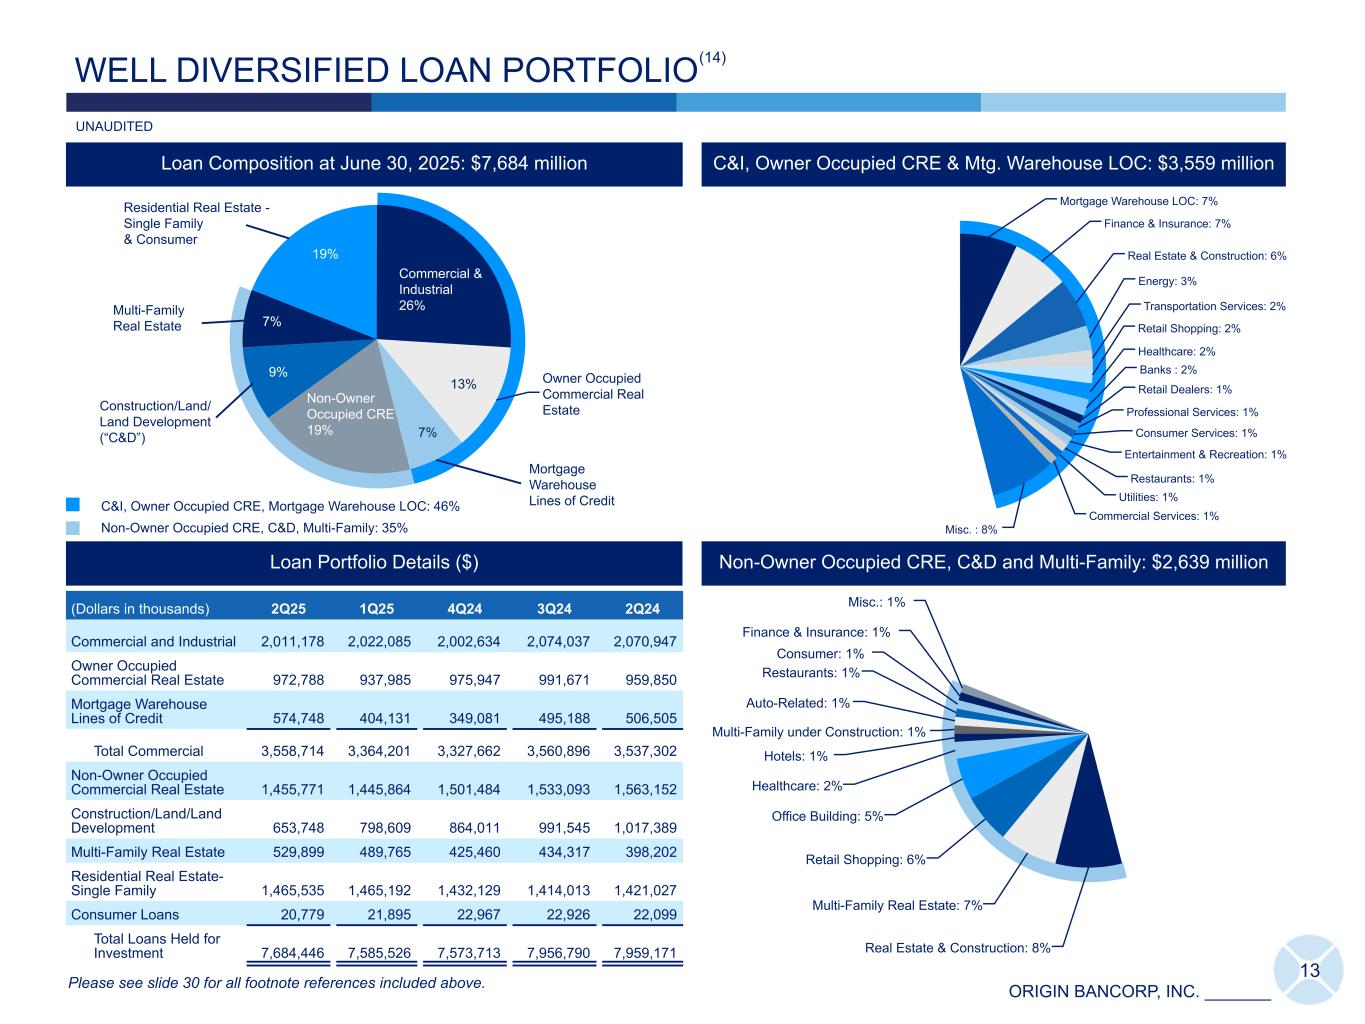
ORIGIN BANCORP, INC. _______ Mortgage Warehouse LOC: 7% Finance & Insurance: 7% Real Estate & Construction: 6% Energy: 3% Transportation Services: 2% Retail Shopping: 2% Healthcare: 2% Banks : 2% Retail Dealers: 1% Professional Services: 1% Consumer Services: 1% Entertainment & Recreation: 1% Restaurants: 1% Utilities: 1% Commercial Services: 1% Misc. : 8% Commercial & Industrial 26% Owner Occupied Commercial Real Estate Non-Owner Occupied CRE 19% Construction/Land/ Land Development (“C&D”) Multi-Family Real Estate Residential Real Estate - Single Family & Consumer 13 WELL DIVERSIFIED LOAN PORTFOLIO (Dollars in thousands) 2Q25 1Q25 4Q24 3Q24 2Q24 Commercial and Industrial 2,011,178 2,022,085 2,002,634 2,074,037 2,070,947 Owner Occupied Commercial Real Estate 972,788 937,985 975,947 991,671 959,850 Mortgage Warehouse Lines of Credit 574,748 404,131 349,081 495,188 506,505 Total Commercial 3,558,714 3,364,201 3,327,662 3,560,896 3,537,302 Non-Owner Occupied Commercial Real Estate 1,455,771 1,445,864 1,501,484 1,533,093 1,563,152 Construction/Land/Land Development 653,748 798,609 864,011 991,545 1,017,389 Multi-Family Real Estate 529,899 489,765 425,460 434,317 398,202 Residential Real Estate- Single Family 1,465,535 1,465,192 1,432,129 1,414,013 1,421,027 Consumer Loans 20,779 21,895 22,967 22,926 22,099 Total Loans Held for Investment 7,684,446 7,585,526 7,573,713 7,956,790 7,959,171 Loan Portfolio Details ($) C&I, Owner Occupied CRE & Mtg. Warehouse LOC: $3,559 million C&I, Owner Occupied CRE, Mortgage Warehouse LOC: 46% Non-Owner Occupied CRE, C&D, Multi-Family: 35% Loan Composition at June 30, 2025: $7,684 million Please see slide 30 for all footnote references included above. UNAUDITED (14) Mortgage Warehouse Lines of Credit 7% 19% 13% 7% Real Estate & Construction: 8% Multi-Family Real Estate: 7% Retail Shopping: 6% Office Building: 5% Healthcare: 2% Hotels: 1% Multi-Family under Construction: 1% Auto-Related: 1% Restaurants: 1% Consumer: 1% Finance & Insurance: 1% Misc.: 1% Non-Owner Occupied CRE, C&D and Multi-Family: $2,639 million 9%
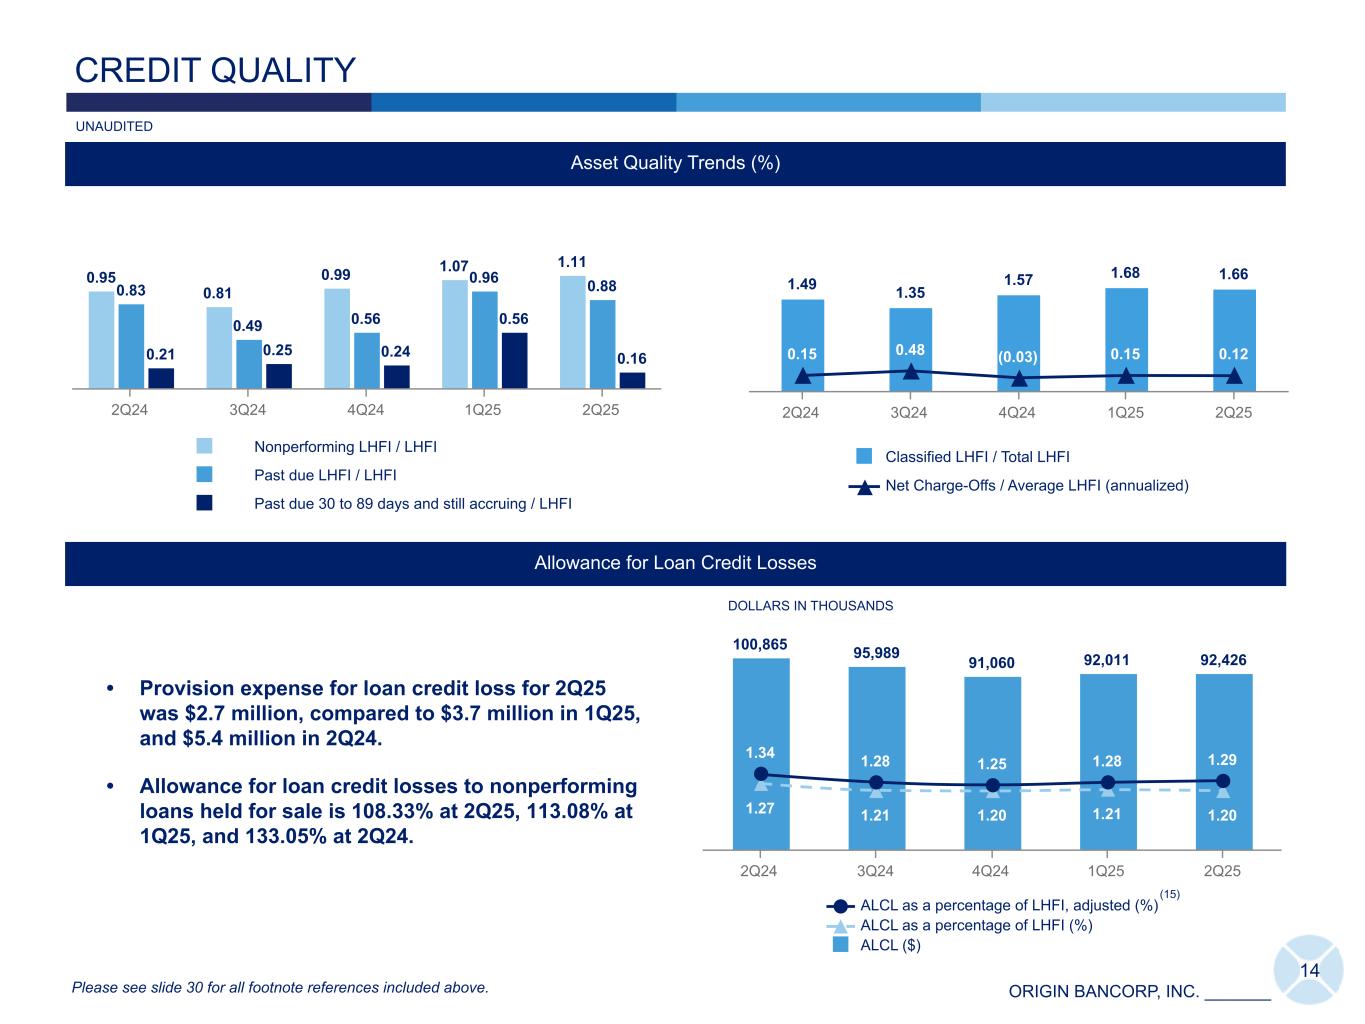
ORIGIN BANCORP, INC. _______ 1.49 1.35 1.57 1.68 1.66 0.15 0.48 (0.03) 0.15 0.12 Classified LHFI / Total LHFI Net Charge-Offs / Average LHFI (annualized) 2Q24 3Q24 4Q24 1Q25 2Q25 0.95 0.81 0.99 1.07 1.11 0.83 0.49 0.56 0.96 0.88 0.21 0.25 0.24 0.56 0.16 Nonperforming LHFI / LHFI Past due LHFI / LHFI Past due 30 to 89 days and still accruing / LHFI 2Q24 3Q24 4Q24 1Q25 2Q25 14 CREDIT QUALITY Asset Quality Trends (%) Allowance for Loan Credit Losses 100,865 95,989 91,060 92,011 92,426 1.27 1.21 1.20 1.21 1.20 1.34 1.28 1.25 1.28 1.29 ALCL as a percentage of LHFI, adjusted (%) ALCL as a percentage of LHFI (%) ALCL ($) 2Q24 3Q24 4Q24 1Q25 2Q25 • Provision expense for loan credit loss for 2Q25 was $2.7 million, compared to $3.7 million in 1Q25, and $5.4 million in 2Q24. • Allowance for loan credit losses to nonperforming loans held for sale is 108.33% at 2Q25, 113.08% at 1Q25, and 133.05% at 2Q24. DOLLARS IN THOUSANDS (15) Please see slide 30 for all footnote references included above. UNAUDITED
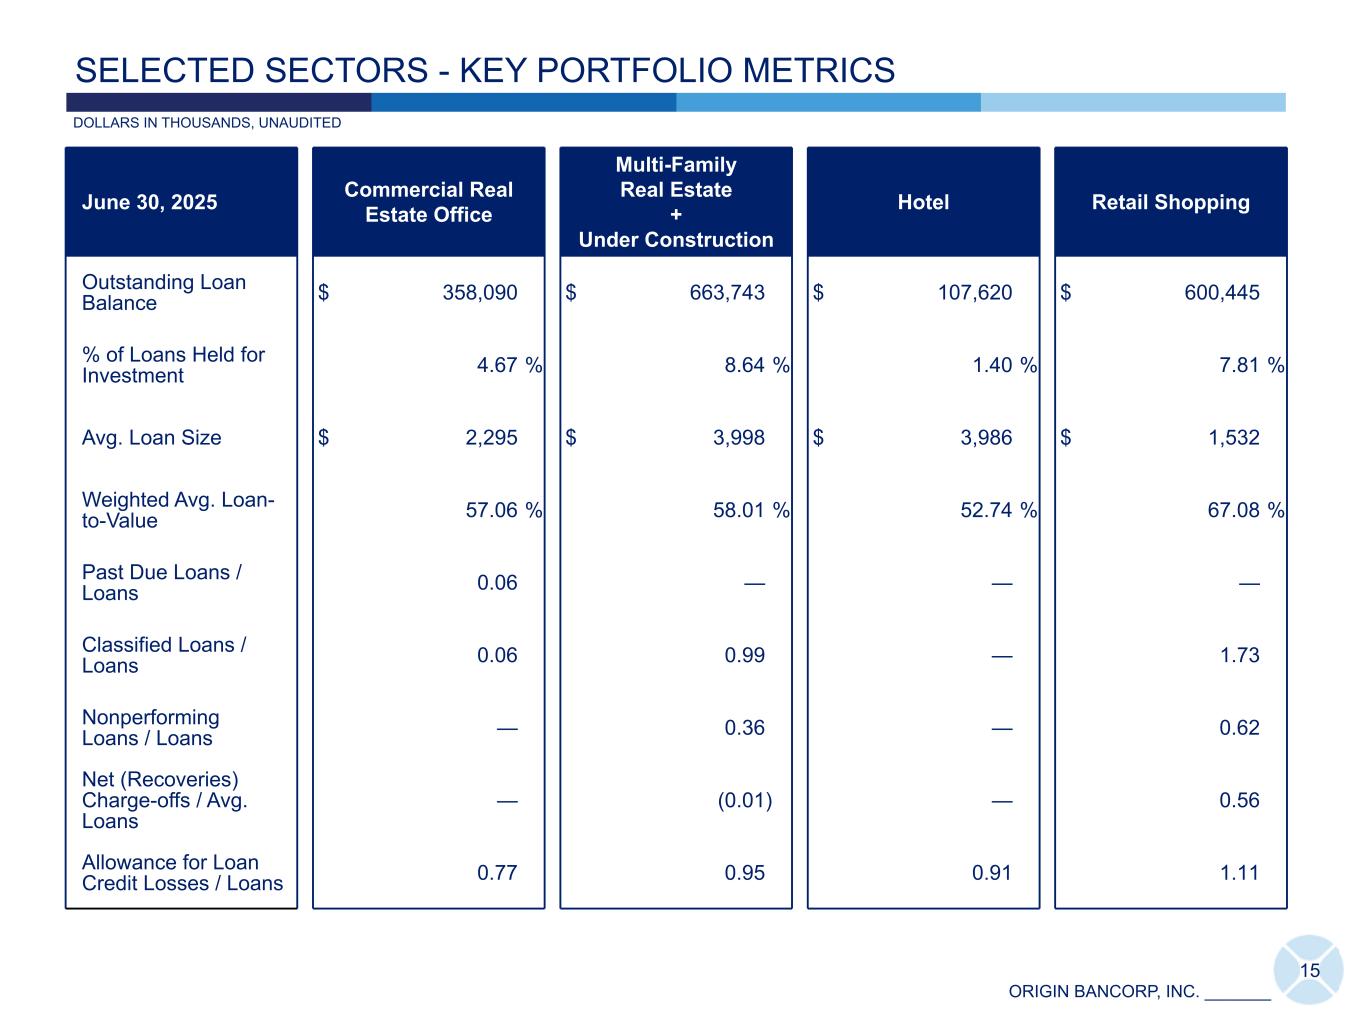
ORIGIN BANCORP, INC. _______ 15 SELECTED SECTORS - KEY PORTFOLIO METRICS June 30, 2025 Commercial Real Estate Office Multi-Family Real Estate + Under Construction Hotel Retail Shopping Outstanding Loan Balance $ 358,090 $ 663,743 $ 107,620 $ 600,445 % of Loans Held for Investment 4.67 % 8.64 % 1.40 % 7.81 % Avg. Loan Size $ 2,295 $ 3,998 $ 3,986 $ 1,532 Weighted Avg. Loan- to-Value 57.06 % 58.01 % 52.74 % 67.08 % Past Due Loans / Loans 0.06 — — — Classified Loans / Loans 0.06 0.99 — 1.73 Nonperforming Loans / Loans — 0.36 — 0.62 Net (Recoveries) Charge-offs / Avg. Loans — (0.01) — 0.56 Allowance for Loan Credit Losses / Loans 0.77 0.95 0.91 1.11 DOLLARS IN THOUSANDS, UNAUDITED
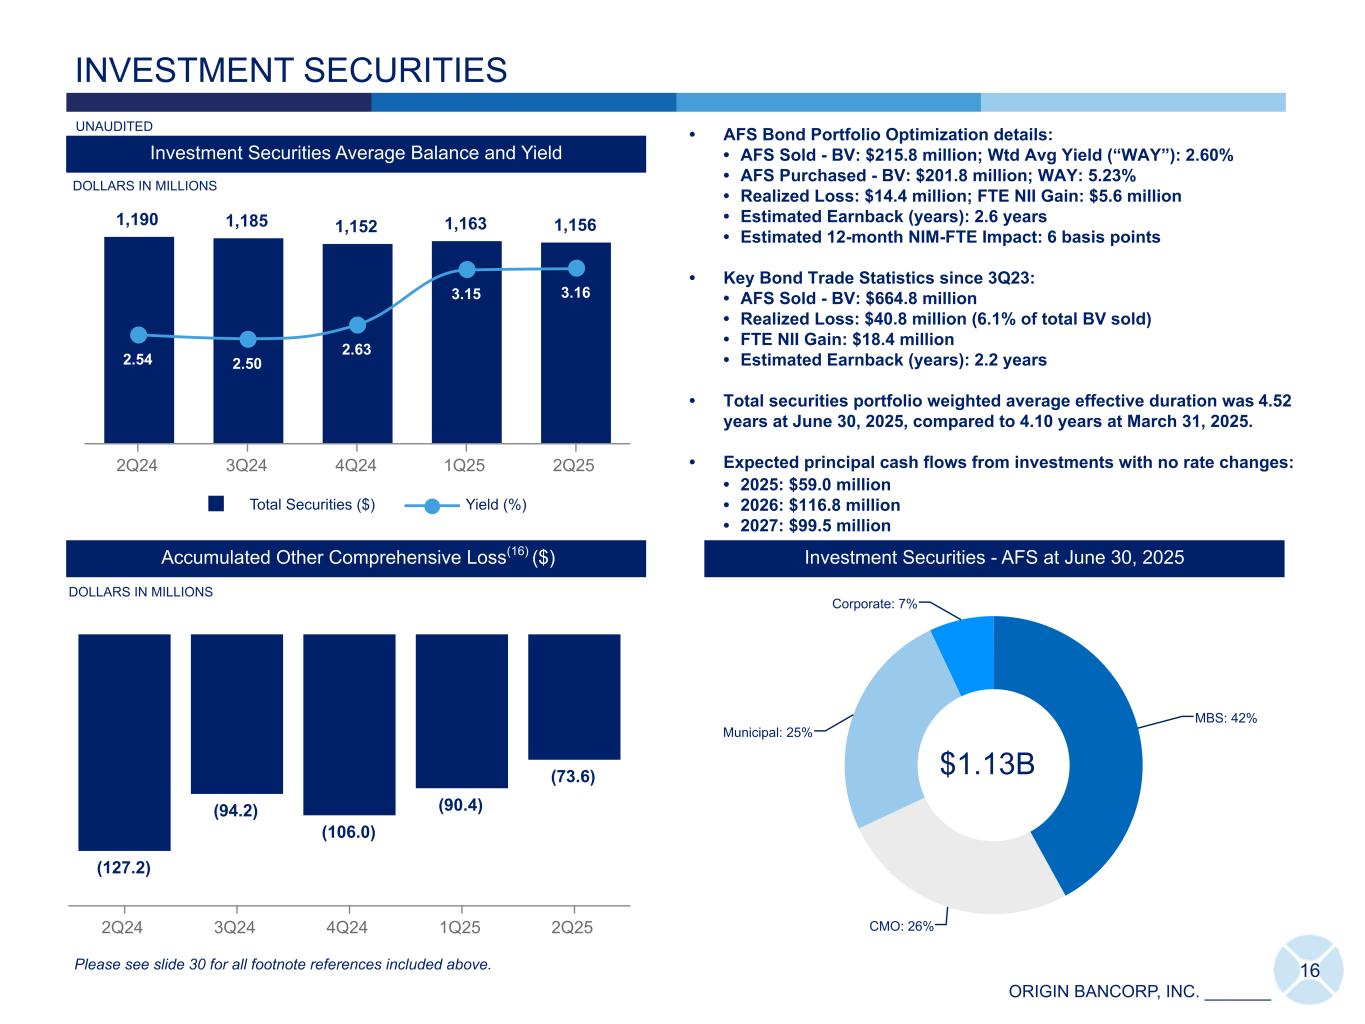
ORIGIN BANCORP, INC. _______ MBS: 42% CMO: 26% Municipal: 25% Corporate: 7% 1,190 1,185 1,152 1,163 1,156 2.54 2.50 2.63 3.15 3.16 Total Securities ($) Yield (%) 2Q24 3Q24 4Q24 1Q25 2Q25 Investment Securities Average Balance and Yield INVESTMENT SECURITIES DOLLARS IN MILLIONS • AFS Bond Portfolio Optimization details: • AFS Sold - BV: $215.8 million; Wtd Avg Yield (“WAY”): 2.60% • AFS Purchased - BV: $201.8 million; WAY: 5.23% • Realized Loss: $14.4 million; FTE NII Gain: $5.6 million • Estimated Earnback (years): 2.6 years • Estimated 12-month NIM-FTE Impact: 6 basis points • Key Bond Trade Statistics since 3Q23: • AFS Sold - BV: $664.8 million • Realized Loss: $40.8 million (6.1% of total BV sold) • FTE NII Gain: $18.4 million • Estimated Earnback (years): 2.2 years • Total securities portfolio weighted average effective duration was 4.52 years at June 30, 2025, compared to 4.10 years at March 31, 2025. • Expected principal cash flows from investments with no rate changes: • 2025: $59.0 million • 2026: $116.8 million • 2027: $99.5 million 16 (127.2) (94.2) (106.0) (90.4) (73.6) 2Q24 3Q24 4Q24 1Q25 2Q25 Accumulated Other Comprehensive Loss(16) ($) Investment Securities - AFS at June 30, 2025 Please see slide 30 for all footnote references included above. $1.13B DOLLARS IN MILLIONS UNAUDITED
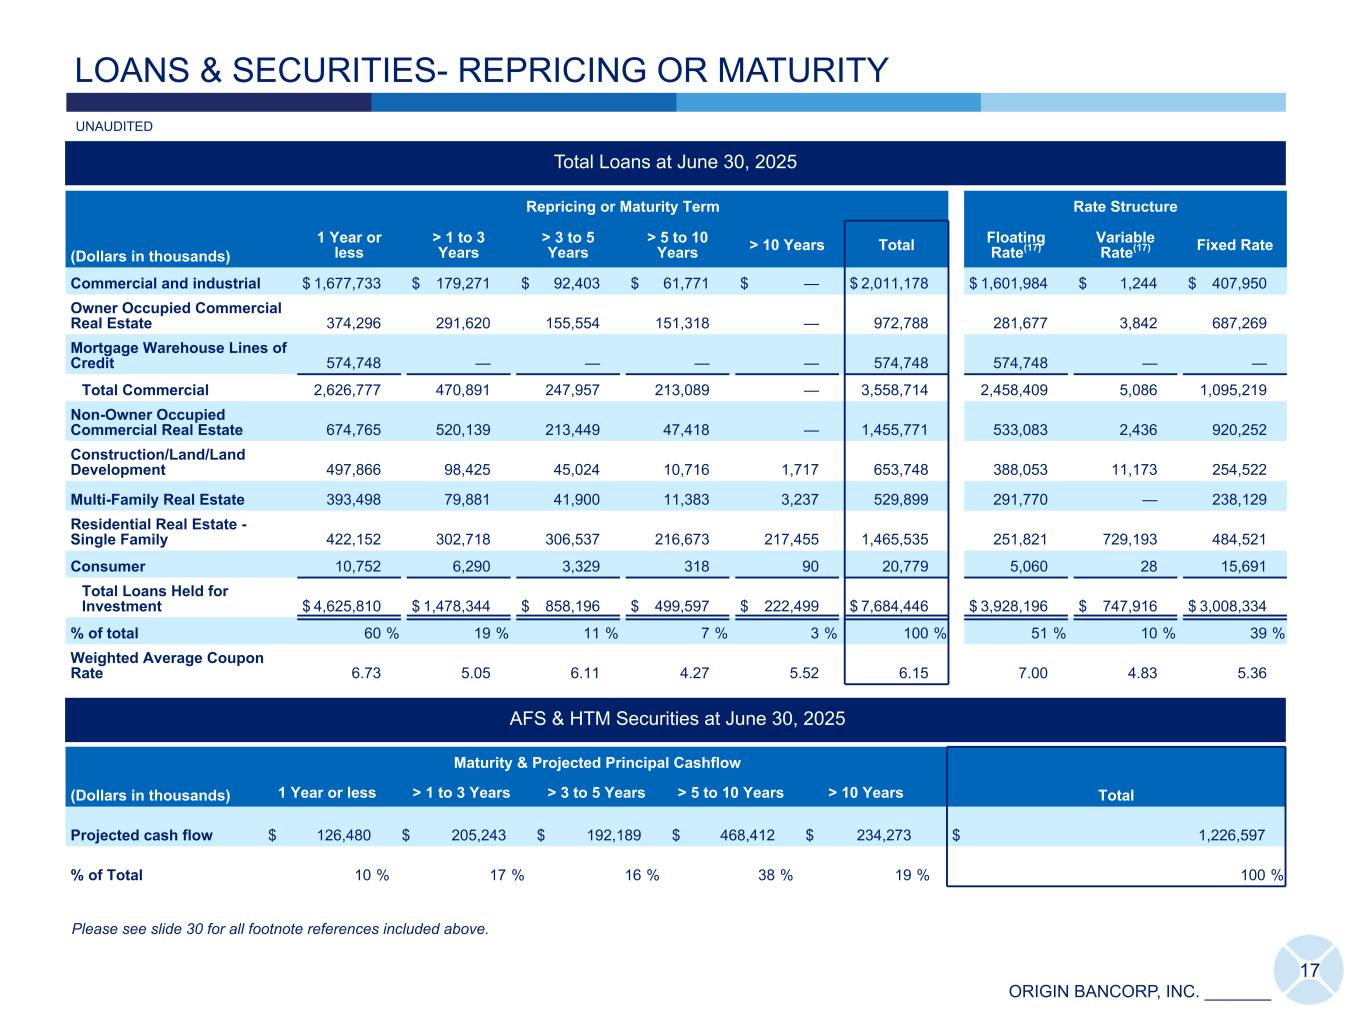
ORIGIN BANCORP, INC. _______ Total Loans at June 30, 2025 (Dollars in thousands) Repricing or Maturity Term Rate Structure 1 Year or less > 1 to 3 Years > 3 to 5 Years > 5 to 10 Years > 10 Years Total Floating Rate(17) Variable Rate(17) Fixed Rate Commercial and industrial $ 1,677,733 $ 179,271 $ 92,403 $ 61,771 $ — $ 2,011,178 $ 1,601,984 $ 1,244 $ 407,950 Owner Occupied Commercial Real Estate 374,296 291,620 155,554 151,318 — 972,788 281,677 3,842 687,269 Mortgage Warehouse Lines of Credit 574,748 — — — — 574,748 574,748 — — Total Commercial 2,626,777 470,891 247,957 213,089 — 3,558,714 2,458,409 5,086 1,095,219 Non-Owner Occupied Commercial Real Estate 674,765 520,139 213,449 47,418 — 1,455,771 533,083 2,436 920,252 Construction/Land/Land Development 497,866 98,425 45,024 10,716 1,717 653,748 388,053 11,173 254,522 Multi-Family Real Estate 393,498 79,881 41,900 11,383 3,237 529,899 291,770 — 238,129 Residential Real Estate - Single Family 422,152 302,718 306,537 216,673 217,455 1,465,535 251,821 729,193 484,521 Consumer 10,752 6,290 3,329 318 90 20,779 5,060 28 15,691 Total Loans Held for Investment $ 4,625,810 $ 1,478,344 $ 858,196 $ 499,597 $ 222,499 $ 7,684,446 $ 3,928,196 $ 747,916 $ 3,008,334 % of total 60 % 19 % 11 % 7 % 3 % 100 % 51 % 10 % 39 % Weighted Average Coupon Rate 6.73 5.05 6.11 4.27 5.52 6.15 7.00 4.83 5.36 AFS & HTM Securities at June 30, 2025 (Dollars in thousands) Maturity & Projected Principal Cashflow Total1 Year or less > 1 to 3 Years > 3 to 5 Years > 5 to 10 Years > 10 Years Projected cash flow $ 126,480 $ 205,243 $ 192,189 $ 468,412 $ 234,273 $ 1,226,597 % of Total 10 % 17 % 16 % 38 % 19 % 100 % LOANS & SECURITIES- REPRICING OR MATURITY 17 UNAUDITED Please see slide 30 for all footnote references included above.
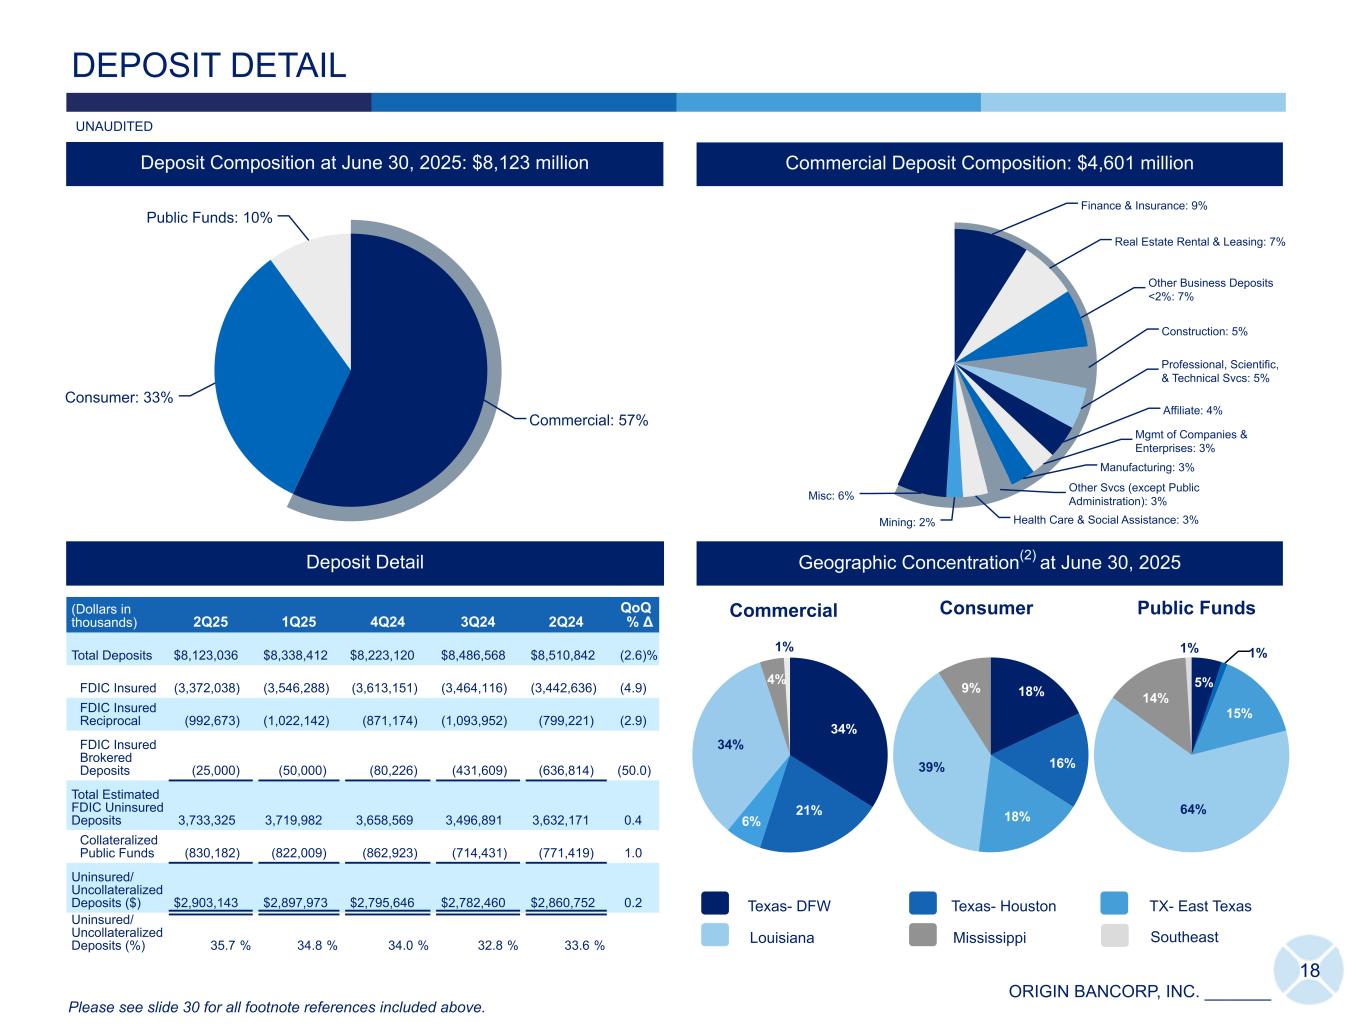
ORIGIN BANCORP, INC. _______ Finance & Insurance: 9% Real Estate Rental & Leasing: 7% Other Business Deposits <2%: 7% Construction: 5% Professional, Scientific, & Technical Svcs: 5% Affiliate: 4% Mgmt of Companies & Enterprises: 3% Manufacturing: 3% Other Svcs (except Public Administration): 3% Health Care & Social Assistance: 3%Mining: 2% Misc: 6% Commercial: 57% Consumer: 33% Public Funds: 10% 34% 21% 6% 34% 4% 1% 5% 1% 15% 64% 14% 1% 18 DEPOSIT DETAIL (Dollars in thousands) 2Q25 1Q25 4Q24 3Q24 2Q24 QoQ % Δ Total Deposits $ 8,123,036 $ 8,486,568 $ 8,510,842 $ 8,505,464 $ 8,251,125 (4.3) % FDIC Insured (3,464,116) (3,464,116) (3,442,636) (3,447,538) (3,425,268) — FDIC Insured Reciprocal (1,093,952) (1,093,952) (799,221) (801,145) (801,699) — FDIC Insured Brokered Deposits (431,609) (431,609) (636,814) (597,110) (444,989) — Total Estimated FDIC Uninsured Deposits 3,133,359 3,496,891 3,632,171 3,659,671 3,579,169 (10.4) Collateralized Public Funds (714,431) (714,431) (771,419) (836,150) (849,603) — Uninsured/ Uncollateralized Deposits ($) $ 2,418,928 $ 2,782,460 $ 2,860,752 $ 2,823,521 $ 2,729,566 (13.1) Uninsured/ Uncollateralized Deposits (%) 29.8 % 32.8 % 33.6 % 33.2 % 33.1 % Deposit Detail Geographic Concentration(2) at June 30, 2025 Commercial Deposit Composition: $4,601 millionDeposit Composition at June 30, 2025: $8,123 million Commercial Public FundsConsumer MississippiLouisiana Texas- DFW TX- East TexasTexas- Houston Please see slide 30 for all footnote references included above. UNAUDITED Southeast 18% 16% 18% 39% 9% (Dollars in thousands) 2Q25 1Q25 4Q24 3Q24 2Q24 QoQ % Δ Total Deposits $ 8,123,036 $ 8,338,412 $ 8,223,120 $ 8,486,568 $ 8,510,842 (2.6) % FDIC Insured (3,372,038) (3,546,288) (3,613,151) (3,464,116) (3,442,636) (4.9) FDIC Insured Reciprocal (992,673) (1,022,142) (871,174) (1,093,952) (799,221) (2.9) FDIC Insured Brokered Deposits (25,000) (50,000) (80,226) (431,609) (636,814) (50.0) Total Estimated FDIC Uninsured Deposits 3,733,325 3,719,982 3,658,569 3,496,891 3,632,171 0.4 Collateralized Public Funds (830,182) (822,009) (862,923) (714,431) (771,419) 1.0 Uninsured/ Uncollateralized Deposits ($) $ 2,903,143 $ 2,897,973 $ 2,795,646 $ 2,782,460 $ 2,860,752 0.2 Uninsured/ Uncollateralized Deposits (%) 35.7 % 34.8 % 34.0 % 32.8 % 33.6 % Deposit Detail
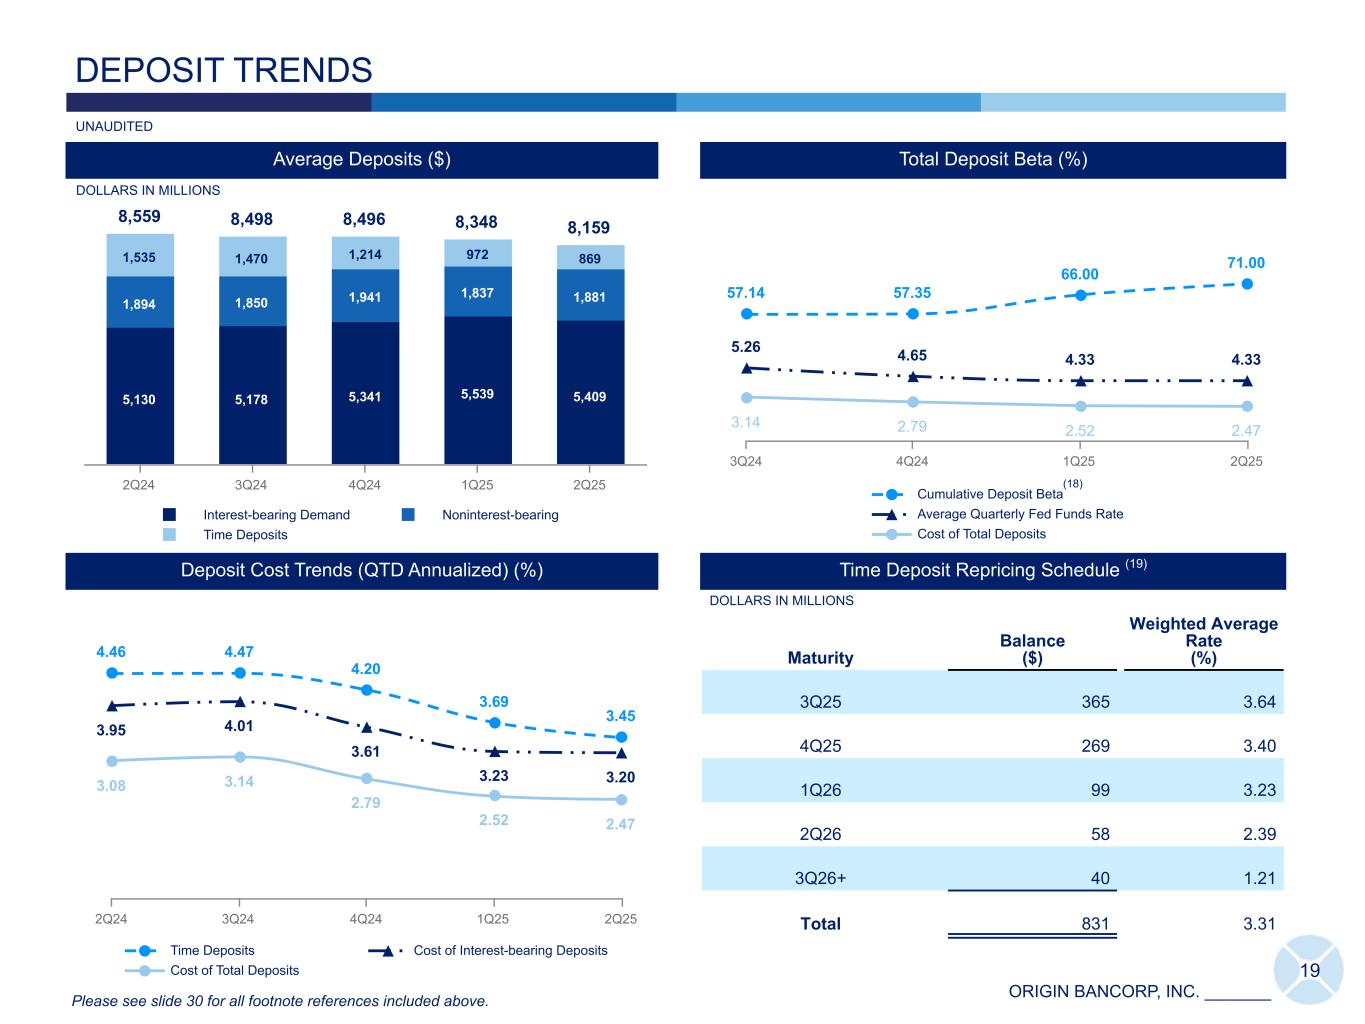
ORIGIN BANCORP, INC. _______ 4.46 4.47 4.20 3.69 3.45 3.95 4.01 3.61 3.23 3.203.08 3.14 2.79 2.52 2.47 Time Deposits Cost of Interest-bearing Deposits Cost of Total Deposits 2Q24 3Q24 4Q24 1Q25 2Q25 19 8,559 8,498 8,496 8,348 8,159 5,130 5,178 5,341 5,539 5,409 1,894 1,850 1,941 1,837 1,881 1,535 1,470 1,214 972 869 Interest-bearing Demand Noninterest-bearing Time Deposits 2Q24 3Q24 4Q24 1Q25 2Q25 Average Deposits ($) DEPOSIT TRENDS IDT Total Deposit Beta (%) DOLLARS IN MILLIONS UNAUDITED Deposit Cost Trends (QTD Annualized) (%) Time Deposit Repricing Schedule (19) Maturity Balance ($) Weighted Average Rate (%) 3Q25 365 3.64 4Q25 269 3.40 1Q26 99 3.23 2Q26 58 2.39 3Q26+ 40 1.21 Total 831 3.31 DOLLARS IN MILLIONS Noninterest-bearing Deposits Interest-bearing Deposits Index-based Interest- bearing Deposits 12% 65% 23%57.14 57.35 66.00 71.00 5.26 4.65 4.33 4.33 3.14 2.79 2.52 2.47 Cumulative Deposit Beta Average Quarterly Fed Funds Rate Cost of Total Deposits 3Q24 4Q24 1Q25 2Q25 Please see slide 30 for all footnote references included above. (18)
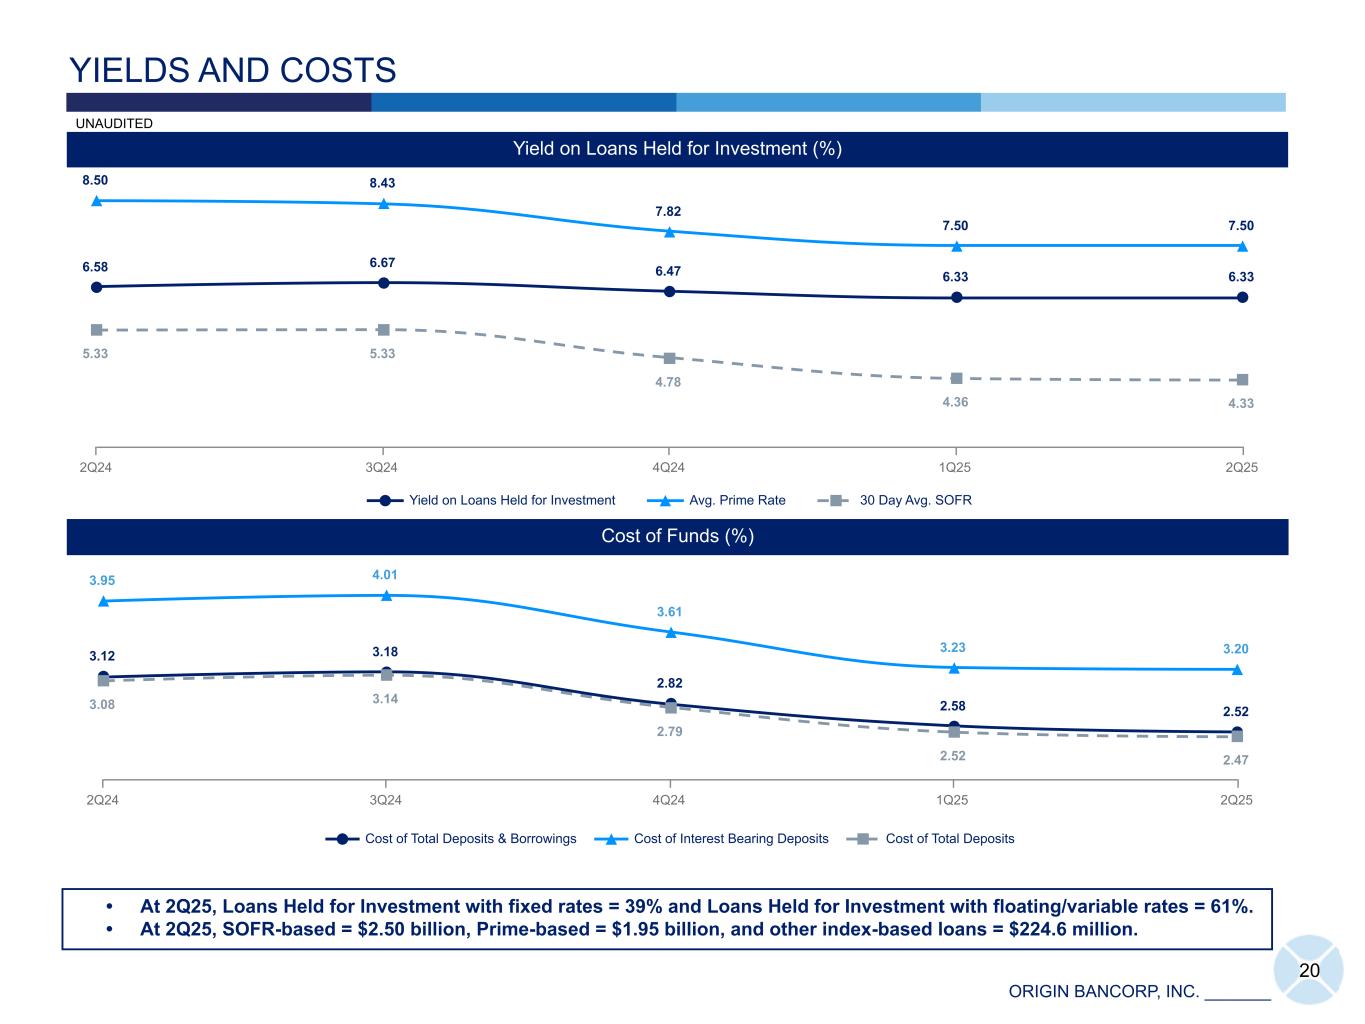
ORIGIN BANCORP, INC. _______ 20 YIELDS AND COSTS Yield on Loans Held for Investment (%) Cost of Funds (%) • At 2Q25, Loans Held for Investment with fixed rates = 39% and Loans Held for Investment with floating/variable rates = 61%. • At 2Q25, SOFR-based = $2.50 billion, Prime-based = $1.95 billion, and other index-based loans = $224.6 million. UNAUDITED 6.58 6.67 6.47 6.33 6.33 8.50 8.43 7.82 7.50 7.50 5.33 5.33 4.78 4.36 4.33 Yield on Loans Held for Investment Avg. Prime Rate 30 Day Avg. SOFR 2Q24 3Q24 4Q24 1Q25 2Q25 3.12 3.18 2.82 2.58 2.52 3.95 4.01 3.61 3.23 3.20 3.08 3.14 2.79 2.52 2.47 Cost of Total Deposits & Borrowings Cost of Interest Bearing Deposits Cost of Total Deposits 2Q24 3Q24 4Q24 1Q25 2Q25
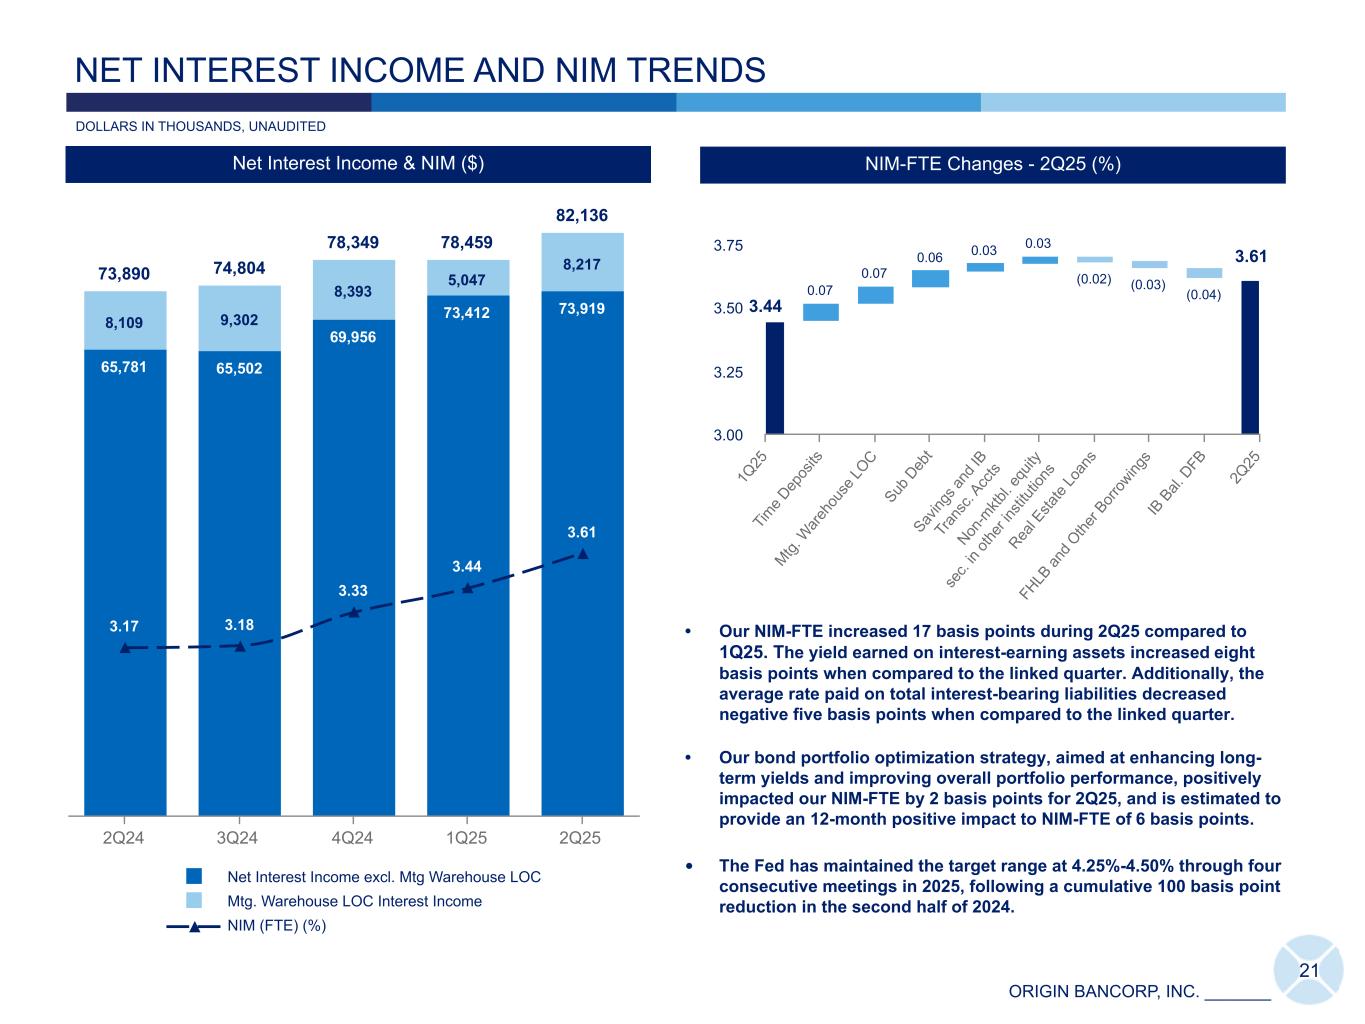
ORIGIN BANCORP, INC. _______ 73,890 74,804 78,349 78,459 82,136 65,781 65,502 69,956 73,412 73,919 8,109 9,302 8,393 5,047 8,217 3.17 3.18 3.33 3.44 3.61 Net Interest Income excl. Mtg Warehouse LOC Mtg. Warehouse LOC Interest Income NIM (FTE) (%) 2Q24 3Q24 4Q24 1Q25 2Q25 21 DOLLARS IN THOUSANDS, UNAUDITED NET INTEREST INCOME AND NIM TRENDS 3.44 0.07 0.07 0.06 0.03 0.03 (0.02) (0.03) (0.04) 1Q 25 Tim e D ep os its Mtg. W ar eh ou se LO C Sub D eb t Sav ing s a nd IB Tr an sc . A cc ts Non -m ktb l. e qu ity se c. in oth er in sti tut ion s Rea l E sta te Lo an s FH LB an d O the r B or ro wing s IB B al. D FB 2Q 25 3.00 3.25 3.50 3.75 24.64 29.52 21.01 8.58 2.041.54 2.480.77 2.18 3.65 4.51 5.26 5.33 5.33 4.65 Cumulative NIM-FTE Beta Average Quarterly Fed Funds Rate 3Q22 4Q22 1Q23 2Q23 4Q23 1Q24 2Q24 3Q24 2Q25 NIM Beta - 2Q25 (%) 2.48 2.48 4.99 NIM-FTE Changes - 2Q25 (%) NIM-FTE Changes - 2Q25 (%) 73,32372,989 1,362 1,537 568 432 (298) (3,267) 4Q 23 RE Lo an s C&I MW LO C Othe r FH LB & O the r Bor ro wing s Sav ing s & IB Tr an sa c. Acc ts. 1Q 24 40,000 60,000 80,000 • Our NIM-FTE increased 17 basis points during 2Q25 compared to 1Q25. The yield earned on interest-earning assets increased eight basis points when compared to the linked quarter. Additionally, the average rate paid on total interest-bearing liabilities decreased negative five basis points when compared to the linked quarter. • Our bond portfolio optimization strategy, aimed at enhancing long- term yields and improving overall portfolio performance, positively impacted our NIM-FTE by 2 basis points for 2Q25, and is estimated to provide an 12-month positive impact to NIM-FTE of 6 basis points. • The Fed has maintained the target range at 4.25%-4.50% through four consecutive meetings in 2025, following a cumulative 100 basis point reduction in the second half of 2024. Net Interest Income & NIM ($) 3.61
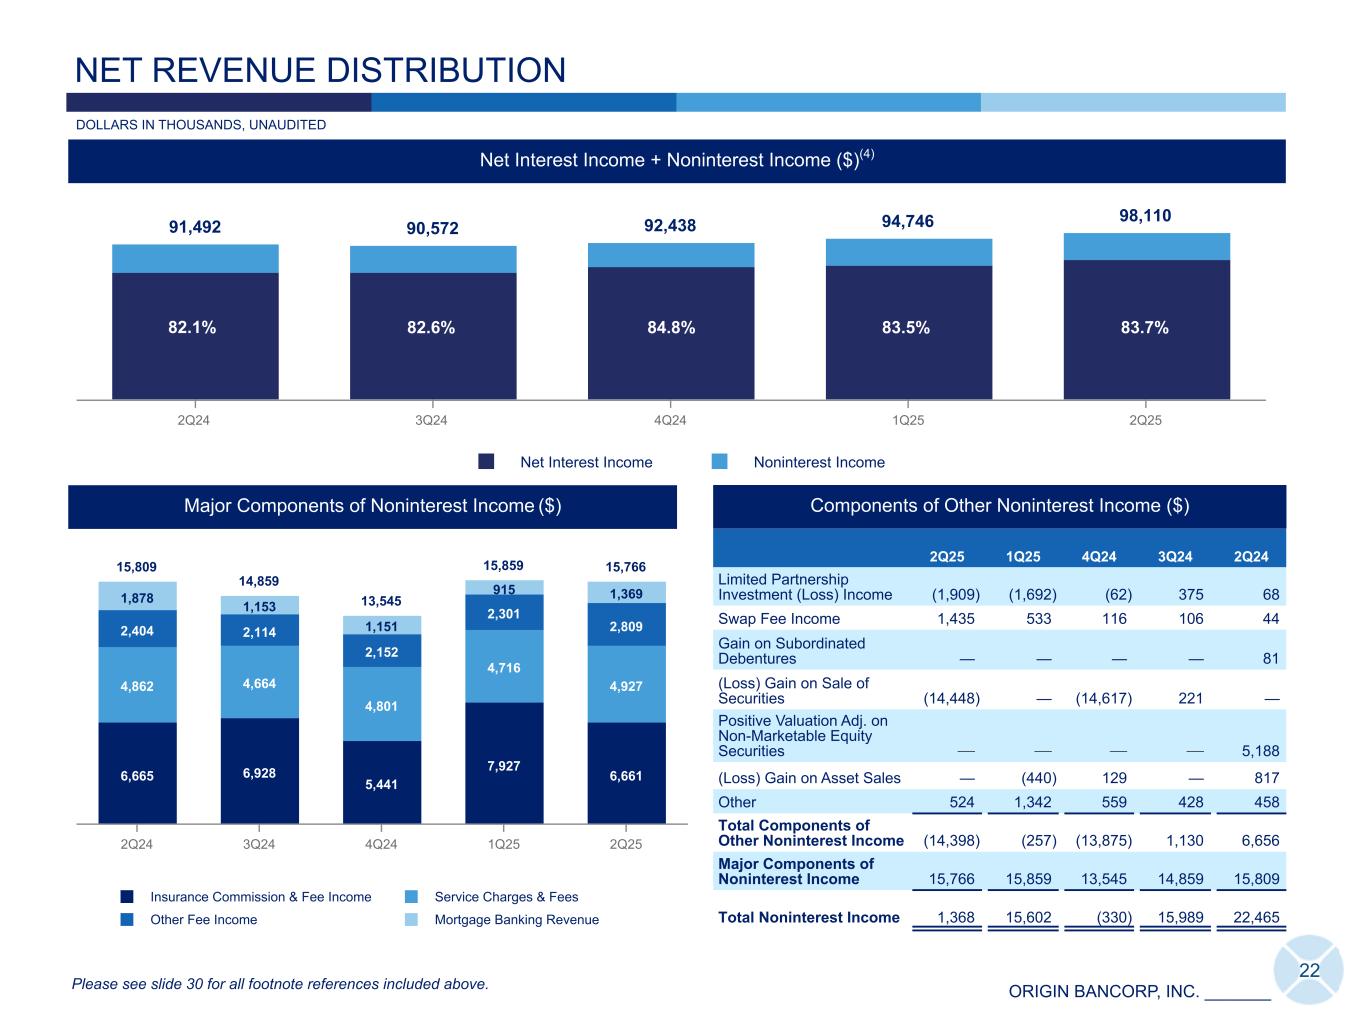
ORIGIN BANCORP, INC. _______ 91,492 90,572 92,438 94,746 98,110 Net Interest Income Noninterest Income 2Q24 3Q24 4Q24 1Q25 2Q25 15,809 14,859 13,545 15,859 15,766 6,665 6,928 5,441 7,927 6,661 4,862 4,664 4,801 4,716 4,927 2,404 2,114 2,152 2,301 2,809 1,878 1,153 1,151 915 1,369 Insurance Commission & Fee Income Service Charges & Fees Other Fee Income Mortgage Banking Revenue 2Q24 3Q24 4Q24 1Q25 2Q25 22 Major Components of Noninterest Income ($) Net Interest Income + Noninterest Income ($)(4) NET REVENUE DISTRIBUTION Components of Other Noninterest Income ($) 2Q25 1Q25 4Q24 3Q24 2Q24 Limited Partnership Investment (Loss) Income (1,909) (1,692) (62) 375 68 Swap Fee Income 1,435 533 116 106 44 Gain on Subordinated Debentures — — — — 81 (Loss) Gain on Sale of Securities (14,448) — (14,617) 221 — Positive Valuation Adj. on Non-Marketable Equity Securities — — — — 5,188 (Loss) Gain on Asset Sales — (440) 129 — 817 Other 524 1,342 559 428 458 Total Components of Other Noninterest Income (14,398) (257) (13,875) 1,130 6,656 Major Components of Noninterest Income 15,766 15,859 13,545 14,859 15,809 Total Noninterest Income 1,368 15,602 (330) 15,989 22,465 82.1% 83.7% Please see slide 30 for all footnote references included above. DOLLARS IN THOUSANDS, UNAUDITED 83.5%84.8%82.6%
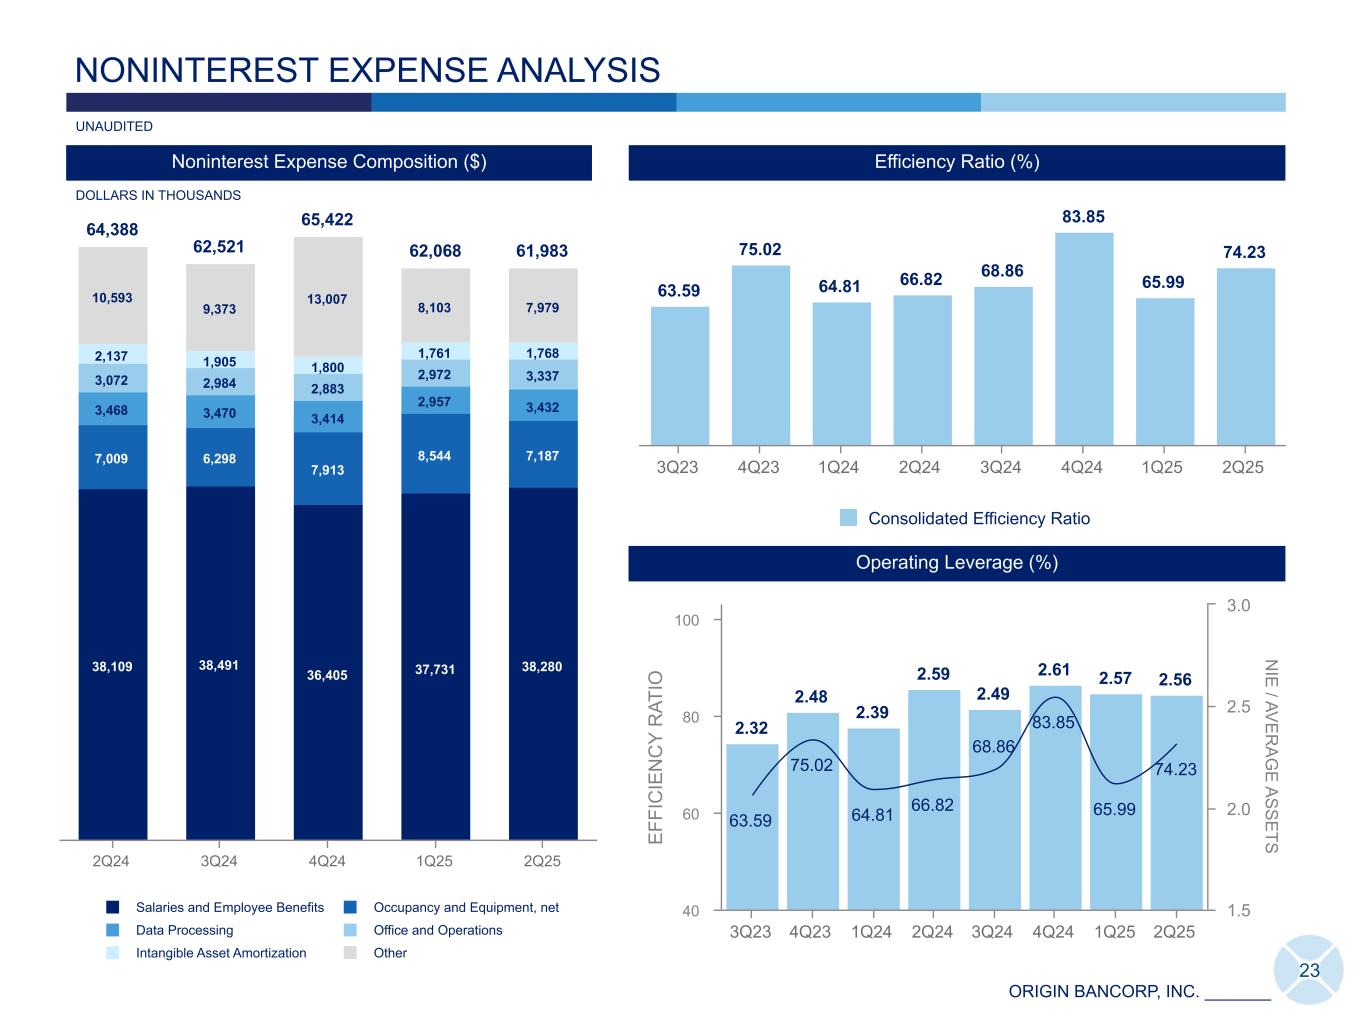
ORIGIN BANCORP, INC. _______ 23 Efficiency Ratio (%) NONINTEREST EXPENSE ANALYSIS DOLLARS IN THOUSANDS Noninterest Expense Composition ($) 63.59 75.02 64.81 66.82 68.86 83.85 65.99 74.23 Consolidated Efficiency Ratio 3Q23 4Q23 1Q24 2Q24 3Q24 4Q24 1Q25 2Q25 Operating Leverage (%) E FF IC IE N C Y R AT IO N IE / AV E R A G E A S S E TS 2.32 2.48 2.39 2.59 2.49 2.61 2.57 2.56 63.59 75.02 64.81 66.82 68.86 83.85 65.99 74.23 3Q23 4Q23 1Q24 2Q24 3Q24 4Q24 1Q25 2Q25 40 60 80 100 1.5 2.0 2.5 3.0 66 .8 2 65 .5 5 67 .4 8 68 .8 6 82 .7 9 74 .2 3 UNAUDITED 73 .7 7 83 .8 5 65 .9 9 65 .3 3 64,388 62,521 65,422 62,068 61,983 38,109 38,491 36,405 37,731 38,280 7,009 6,298 7,913 8,544 7,187 3,468 3,470 3,414 2,957 3,432 3,072 2,984 2,883 2,972 3,337 2,137 1,905 1,800 1,761 1,768 10,593 9,373 13,007 8,103 7,979 Salaries and Employee Benefits Occupancy and Equipment, net Data Processing Office and Operations Intangible Asset Amortization Other 2Q24 3Q24 4Q24 1Q25 2Q25
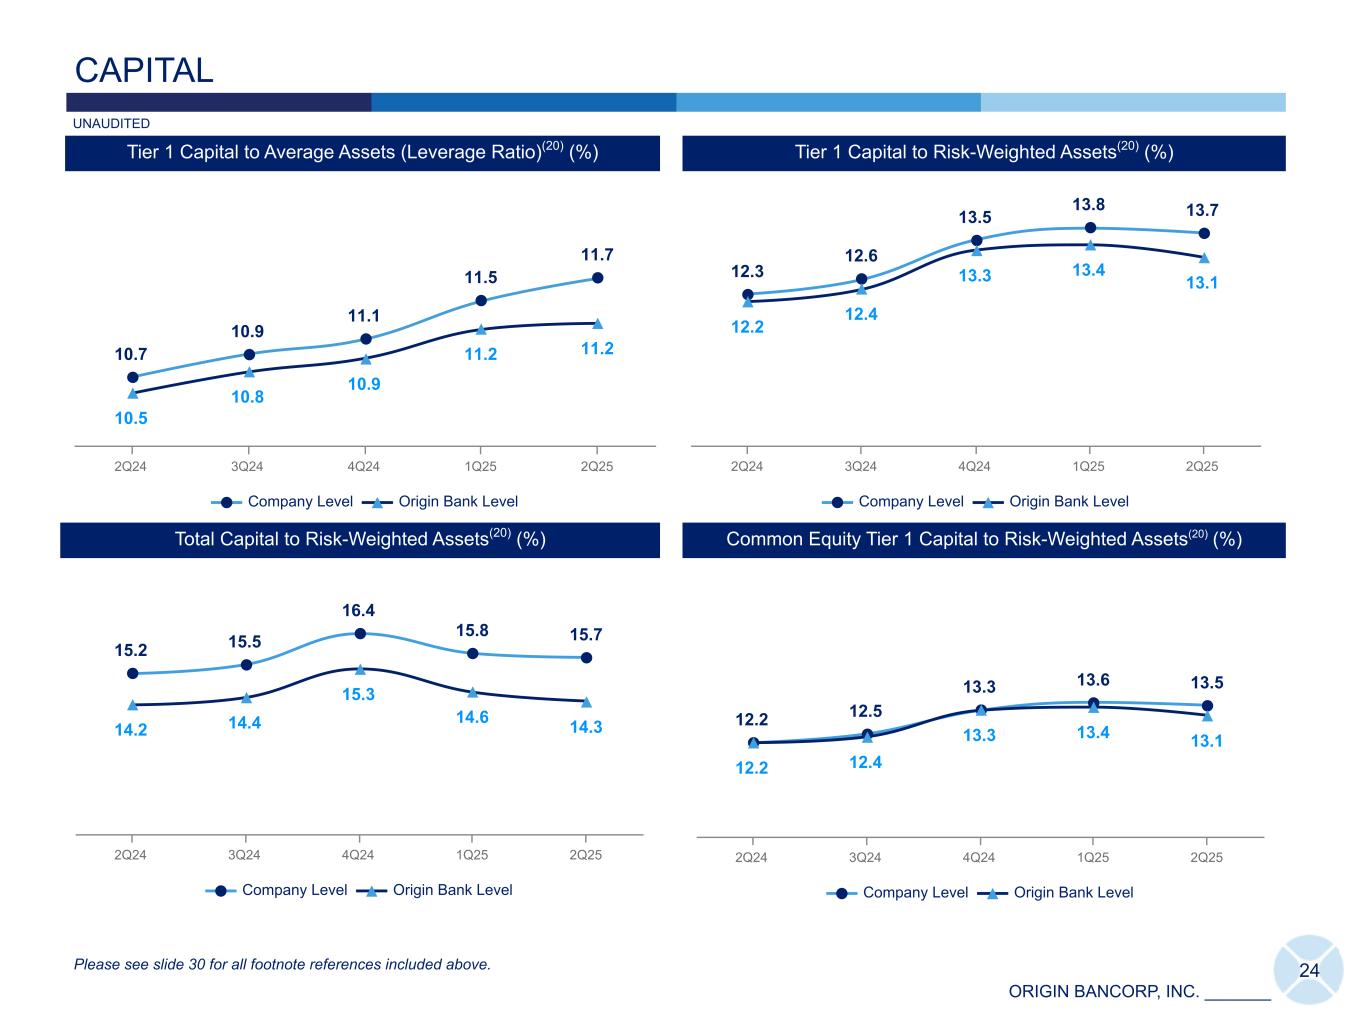
ORIGIN BANCORP, INC. _______ 10.7 10.9 11.1 11.5 11.7 10.5 10.8 10.9 11.2 11.2 Company Level Origin Bank Level 2Q24 3Q24 4Q24 1Q25 2Q25 12.3 12.6 13.5 13.8 13.7 12.2 12.4 13.3 13.4 13.1 Company Level Origin Bank Level 2Q24 3Q24 4Q24 1Q25 2Q25 24 CAPITAL 15.2 15.5 16.4 15.8 15.7 14.2 14.4 15.3 14.6 14.3 Company Level Origin Bank Level 2Q24 3Q24 4Q24 1Q25 2Q25 Common Equity Tier 1 Capital to Risk-Weighted Assets(20) (%) ICap ICap Total Capital to Risk-Weighted Assets(20) (%) Tier 1 Capital to Risk-Weighted Assets(20) (%)Tier 1 Capital to Average Assets (Leverage Ratio)(20) (%) Please see slide 30 for all footnote references included above. UNAUDITED 12.2 12.5 13.3 13.6 13.5 12.2 12.4 13.3 13.4 13.1 Company Level Origin Bank Level 2Q24 3Q24 4Q24 1Q25 2Q25
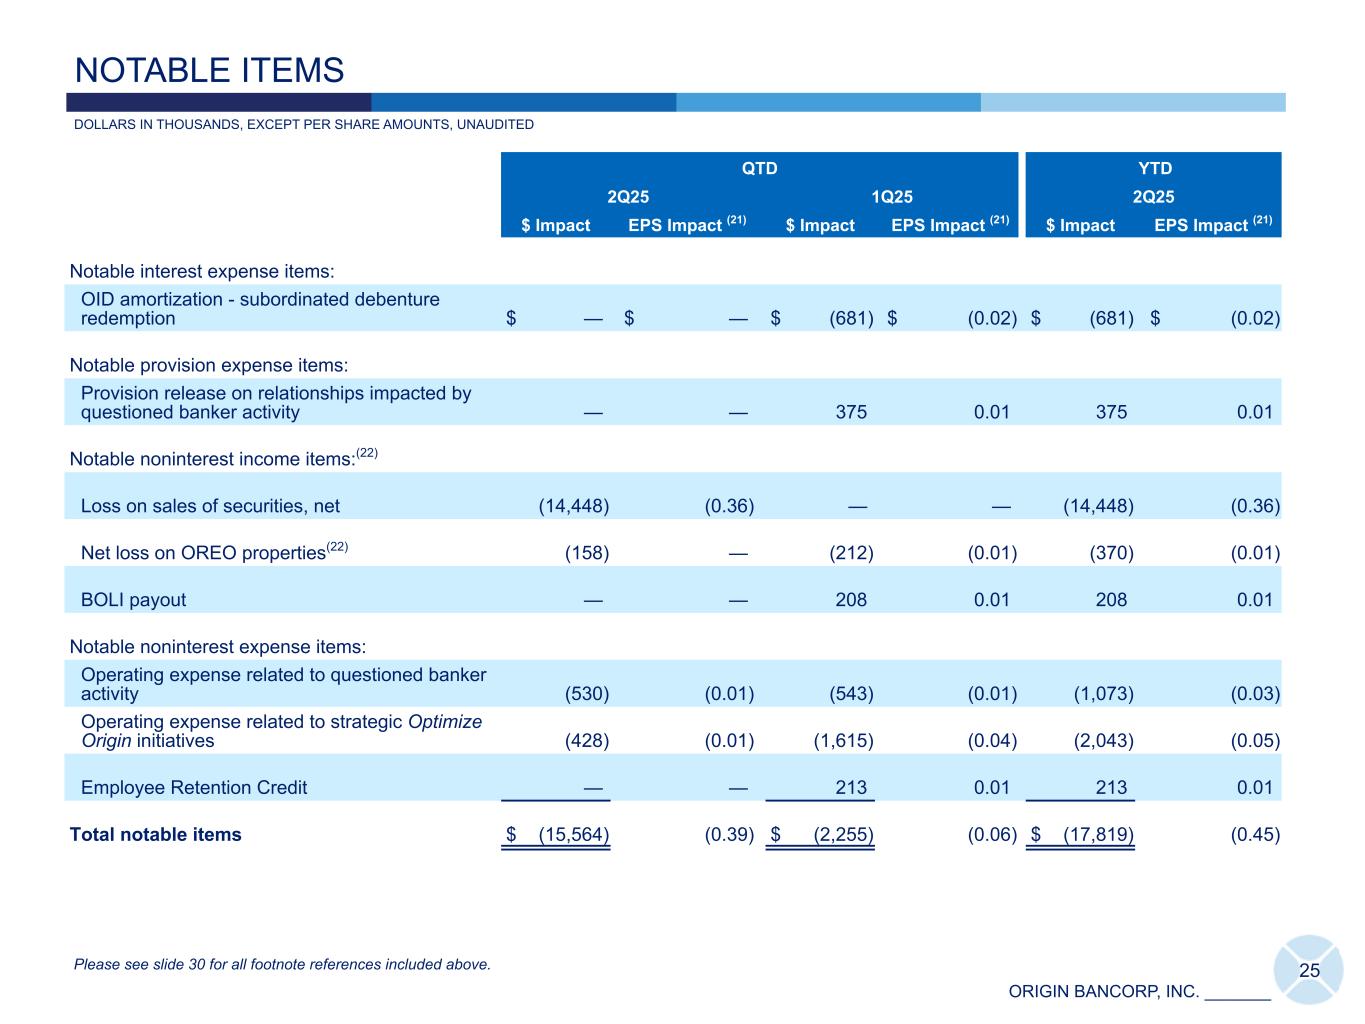
ORIGIN BANCORP, INC. _______ QTD YTD 2Q25 1Q25 2Q25 $ Impact EPS Impact (21) $ Impact EPS Impact (21) $ Impact EPS Impact (21) Notable interest expense items: OID amortization - subordinated debenture redemption $ — $ — $ (681) $ (0.02) $ (681) $ (0.02) Notable provision expense items: Provision release on relationships impacted by questioned banker activity — — 375 0.01 375 0.01 Notable noninterest income items:(22) Loss on sales of securities, net (14,448) (0.36) — — (14,448) (0.36) Net loss on OREO properties(22) (158) — (212) (0.01) (370) (0.01) BOLI payout — — 208 0.01 208 0.01 Notable noninterest expense items: Operating expense related to questioned banker activity (530) (0.01) (543) (0.01) (1,073) (0.03) Operating expense related to strategic Optimize Origin initiatives (428) (0.01) (1,615) (0.04) (2,043) (0.05) Employee Retention Credit — — 213 0.01 213 0.01 Total notable items $ (15,564) (0.39) $ (2,255) (0.06) $ (17,819) (0.45) 25 DOLLARS IN THOUSANDS, EXCEPT PER SHARE AMOUNTS, UNAUDITED NOTABLE ITEMS Please see slide 30 for all footnote references included above.
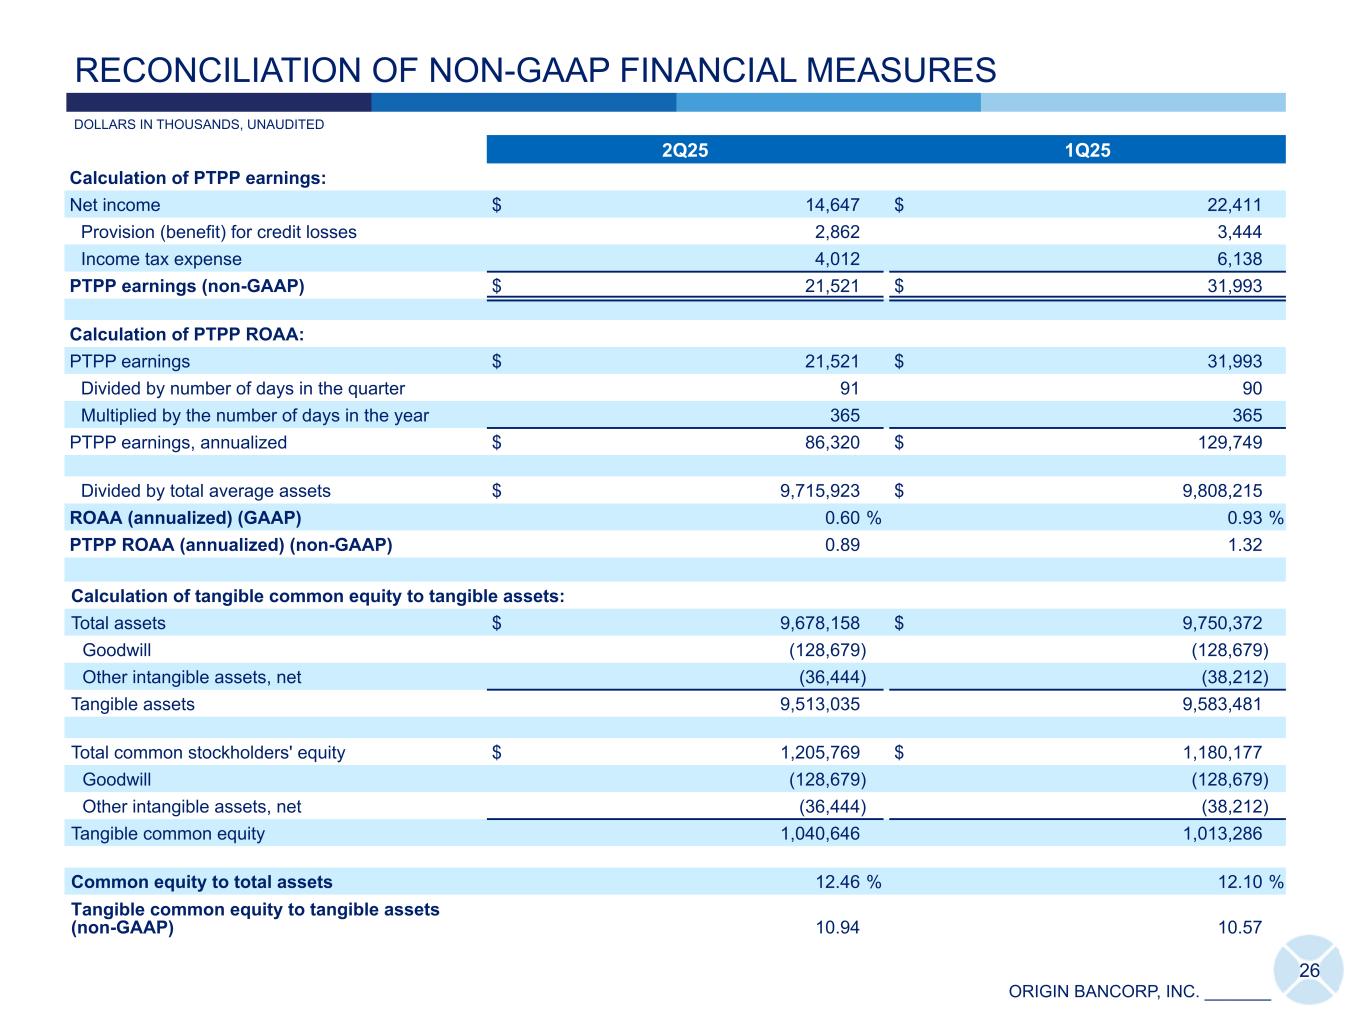
ORIGIN BANCORP, INC. _______ 2Q25 1Q25 Calculation of PTPP earnings: Net income $ 14,647 $ 22,411 Provision (benefit) for credit losses 2,862 3,444 Income tax expense 4,012 6,138 PTPP earnings (non-GAAP) $ 21,521 $ 31,993 Calculation of PTPP ROAA: PTPP earnings $ 21,521 $ 31,993 Divided by number of days in the quarter 91 90 Multiplied by the number of days in the year 365 365 PTPP earnings, annualized $ 86,320 $ 129,749 Divided by total average assets $ 9,715,923 $ 9,808,215 ROAA (annualized) (GAAP) 0.60 % 0.93 % PTPP ROAA (annualized) (non-GAAP) 0.89 1.32 Calculation of tangible common equity to tangible assets: Total assets $ 9,678,158 $ 9,750,372 Goodwill (128,679) (128,679) Other intangible assets, net (36,444) (38,212) Tangible assets 9,513,035 9,583,481 Total common stockholders' equity $ 1,205,769 $ 1,180,177 Goodwill (128,679) (128,679) Other intangible assets, net (36,444) (38,212) Tangible common equity 1,040,646 1,013,286 Common equity to total assets 12.46 % 12.10 % Tangible common equity to tangible assets (non-GAAP) 10.94 10.57 26 DOLLARS IN THOUSANDS, UNAUDITED RECONCILIATION OF NON-GAAP FINANCIAL MEASURES
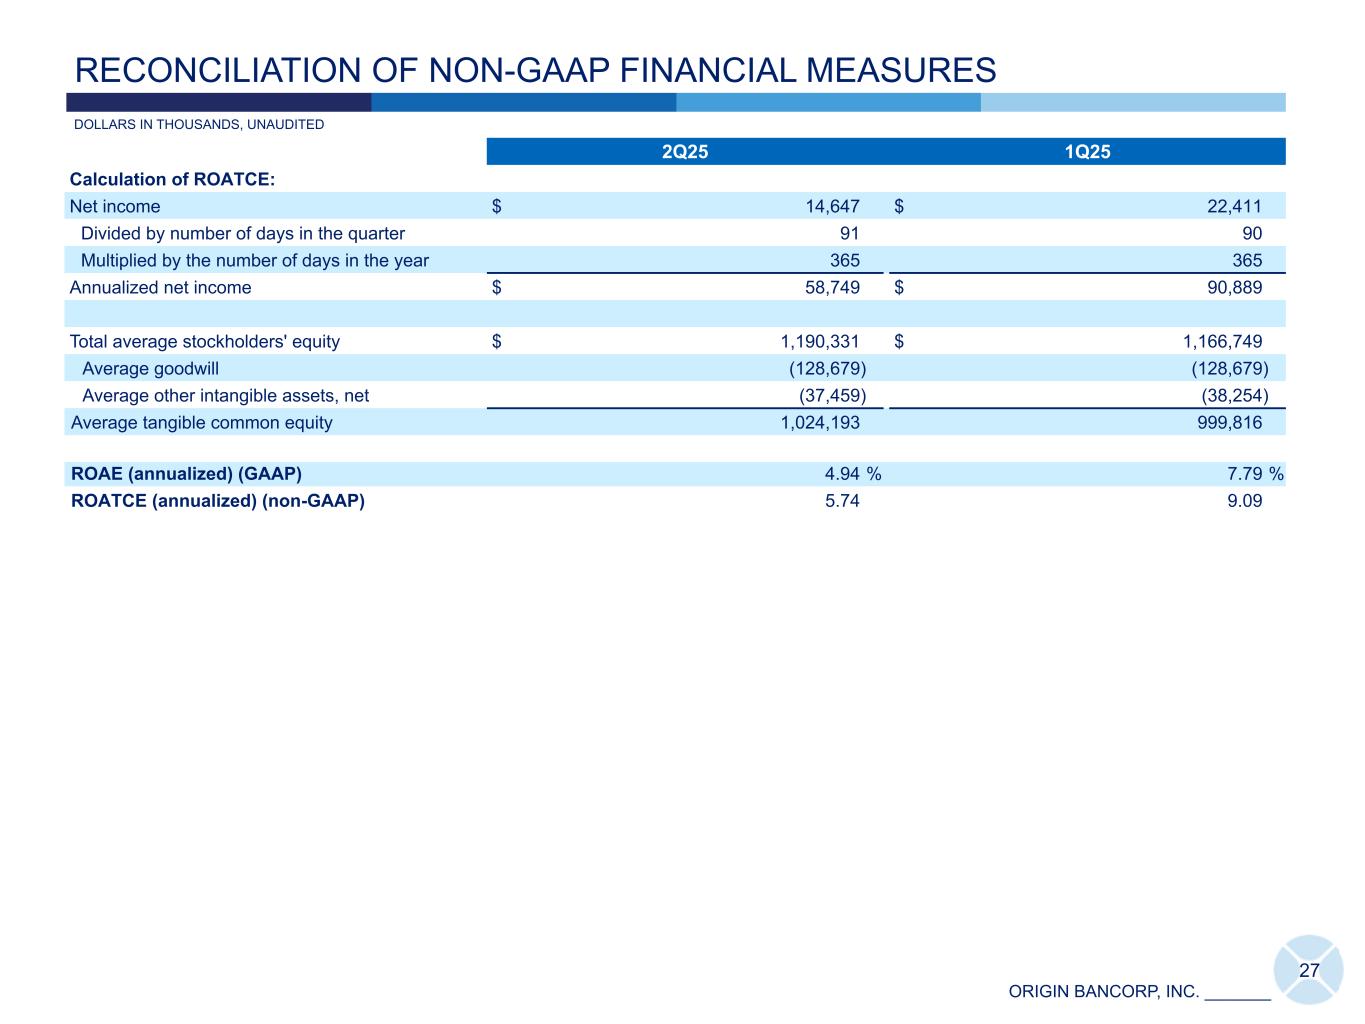
ORIGIN BANCORP, INC. _______ 2Q25 1Q25 Calculation of ROATCE: Net income $ 14,647 $ 22,411 Divided by number of days in the quarter 91 90 Multiplied by the number of days in the year 365 365 Annualized net income $ 58,749 $ 90,889 Total average stockholders' equity $ 1,190,331 $ 1,166,749 Average goodwill (128,679) (128,679) Average other intangible assets, net (37,459) (38,254) Average tangible common equity 1,024,193 999,816 ROAE (annualized) (GAAP) 4.94 % 7.79 % ROATCE (annualized) (non-GAAP) 5.74 9.09 27 DOLLARS IN THOUSANDS, UNAUDITED RECONCILIATION OF NON-GAAP FINANCIAL MEASURES
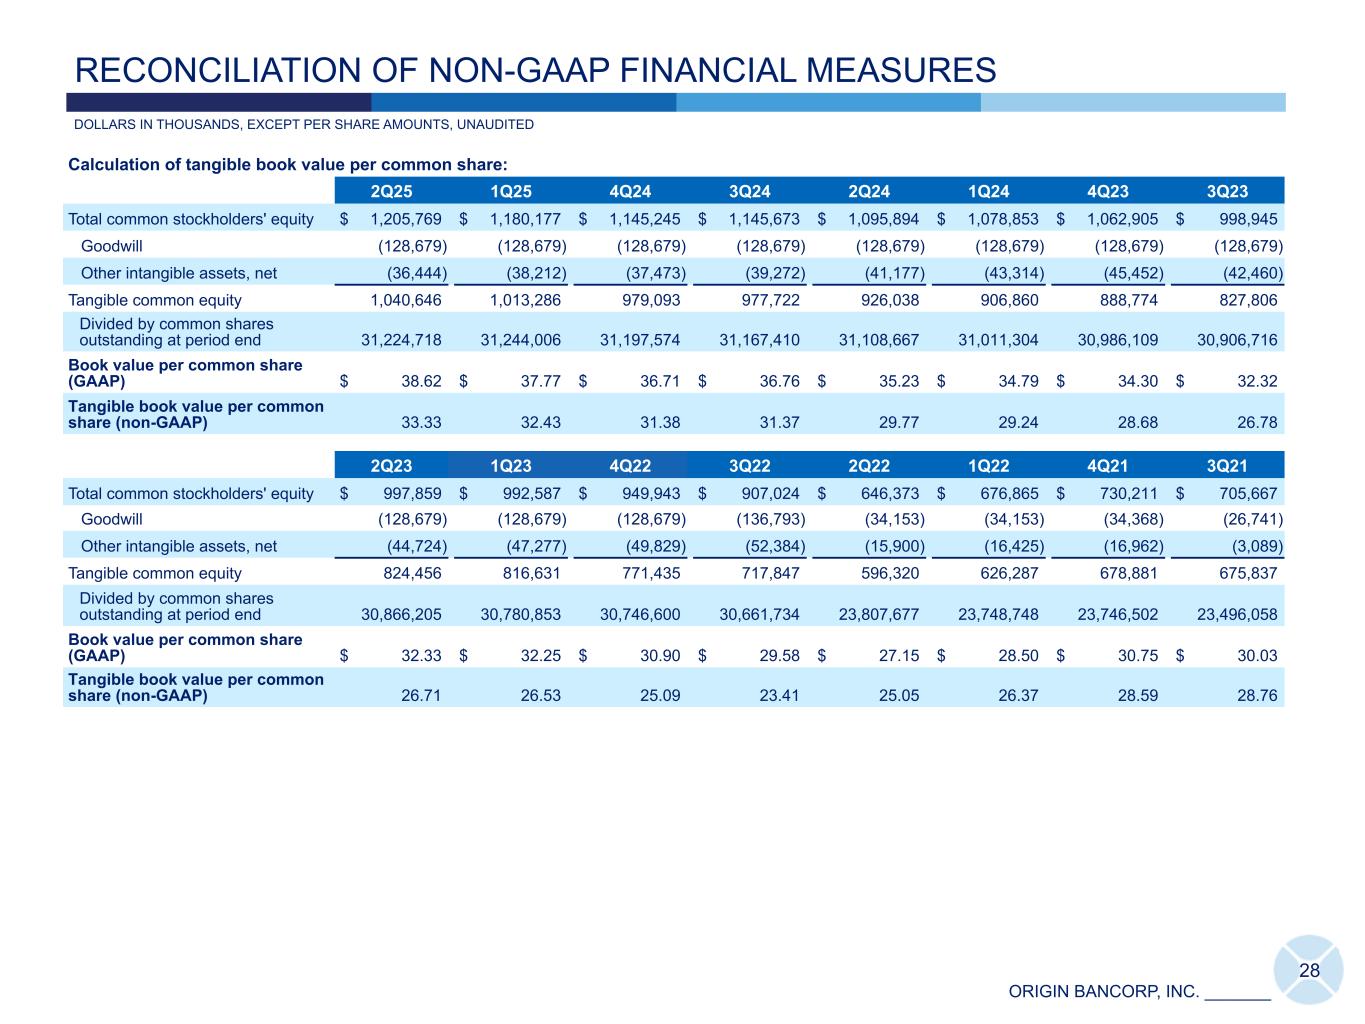
ORIGIN BANCORP, INC. _______ Calculation of tangible book value per common share: 2Q25 1Q25 4Q24 3Q24 2Q24 1Q24 4Q23 3Q23 Total common stockholders' equity $ 1,205,769 $ 1,180,177 $ 1,145,245 $ 1,145,673 $ 1,095,894 $ 1,078,853 $ 1,062,905 $ 998,945 Goodwill (128,679) (128,679) (128,679) (128,679) (128,679) (128,679) (128,679) (128,679) Other intangible assets, net (36,444) (38,212) (37,473) (39,272) (41,177) (43,314) (45,452) (42,460) Tangible common equity 1,040,646 1,013,286 979,093 977,722 926,038 906,860 888,774 827,806 Divided by common shares outstanding at period end 31,224,718 31,244,006 31,197,574 31,167,410 31,108,667 31,011,304 30,986,109 30,906,716 Book value per common share (GAAP) $ 38.62 $ 37.77 $ 36.71 $ 36.76 $ 35.23 $ 34.79 $ 34.30 $ 32.32 Tangible book value per common share (non-GAAP) 33.33 32.43 31.38 31.37 29.77 29.24 28.68 26.78 2Q23 1Q23 4Q22 3Q22 2Q22 1Q22 4Q21 3Q21 Total common stockholders' equity $ 997,859 $ 992,587 $ 949,943 $ 907,024 $ 646,373 $ 676,865 $ 730,211 $ 705,667 Goodwill (128,679) (128,679) (128,679) (136,793) (34,153) (34,153) (34,368) (26,741) Other intangible assets, net (44,724) (47,277) (49,829) (52,384) (15,900) (16,425) (16,962) (3,089) Tangible common equity 824,456 816,631 771,435 717,847 596,320 626,287 678,881 675,837 Divided by common shares outstanding at period end 30,866,205 30,780,853 30,746,600 30,661,734 23,807,677 23,748,748 23,746,502 23,496,058 Book value per common share (GAAP) $ 32.33 $ 32.25 $ 30.90 $ 29.58 $ 27.15 $ 28.50 $ 30.75 $ 30.03 Tangible book value per common share (non-GAAP) 26.71 26.53 25.09 23.41 25.05 26.37 28.59 28.76 28 RECONCILIATION OF NON-GAAP FINANCIAL MEASURES DOLLARS IN THOUSANDS, EXCEPT PER SHARE AMOUNTS, UNAUDITED
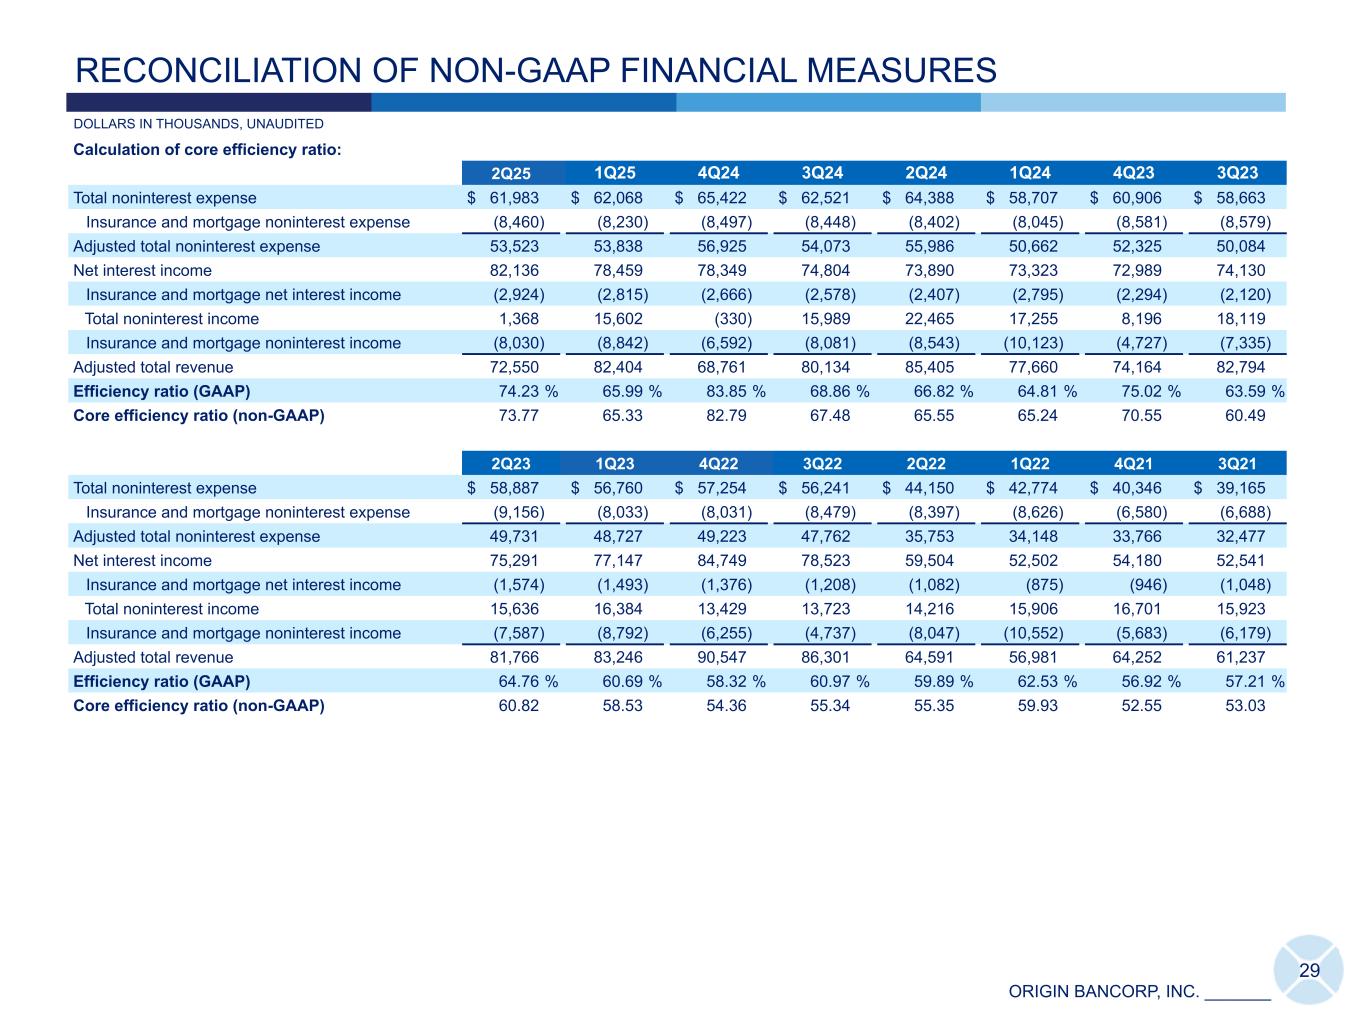
ORIGIN BANCORP, INC. _______ RECONCILIATION OF NON-GAAP FINANCIAL MEASURES DOLLARS IN THOUSANDS, UNAUDITED Calculation of core efficiency ratio: 2Q25 1Q25 4Q24 3Q24 2Q24 1Q24 4Q23 3Q23 Total noninterest expense $ 61,983 $ 62,068 $ 65,422 $ 62,521 $ 64,388 $ 58,707 $ 60,906 $ 58,663 Insurance and mortgage noninterest expense (8,460) (8,230) (8,497) (8,448) (8,402) (8,045) (8,581) (8,579) Adjusted total noninterest expense 53,523 53,838 56,925 54,073 55,986 50,662 52,325 50,084 Net interest income 82,136 78,459 78,349 74,804 73,890 73,323 72,989 74,130 Insurance and mortgage net interest income (2,924) (2,815) (2,666) (2,578) (2,407) (2,795) (2,294) (2,120) Total noninterest income 1,368 15,602 (330) 15,989 22,465 17,255 8,196 18,119 Insurance and mortgage noninterest income (8,030) (8,842) (6,592) (8,081) (8,543) (10,123) (4,727) (7,335) Adjusted total revenue 72,550 82,404 68,761 80,134 85,405 77,660 74,164 82,794 Efficiency ratio (GAAP) 74.23 % 65.99 % 83.85 % 68.86 % 66.82 % 64.81 % 75.02 % 63.59 % Core efficiency ratio (non-GAAP) 73.77 65.33 82.79 67.48 65.55 65.24 70.55 60.49 2Q23 1Q23 4Q22 3Q22 2Q22 1Q22 4Q21 3Q21 Total noninterest expense $ 58,887 $ 56,760 $ 57,254 $ 56,241 $ 44,150 $ 42,774 $ 40,346 $ 39,165 Insurance and mortgage noninterest expense (9,156) (8,033) (8,031) (8,479) (8,397) (8,626) (6,580) (6,688) Adjusted total noninterest expense 49,731 48,727 49,223 47,762 35,753 34,148 33,766 32,477 Net interest income 75,291 77,147 84,749 78,523 59,504 52,502 54,180 52,541 Insurance and mortgage net interest income (1,574) (1,493) (1,376) (1,208) (1,082) (875) (946) (1,048) Total noninterest income 15,636 16,384 13,429 13,723 14,216 15,906 16,701 15,923 Insurance and mortgage noninterest income (7,587) (8,792) (6,255) (4,737) (8,047) (10,552) (5,683) (6,179) Adjusted total revenue 81,766 83,246 90,547 86,301 64,591 56,981 64,252 61,237 Efficiency ratio (GAAP) 64.76 % 60.69 % 58.32 % 60.97 % 59.89 % 62.53 % 56.92 % 57.21 % Core efficiency ratio (non-GAAP) 60.82 58.53 54.36 55.34 55.35 59.93 52.55 53.03 29
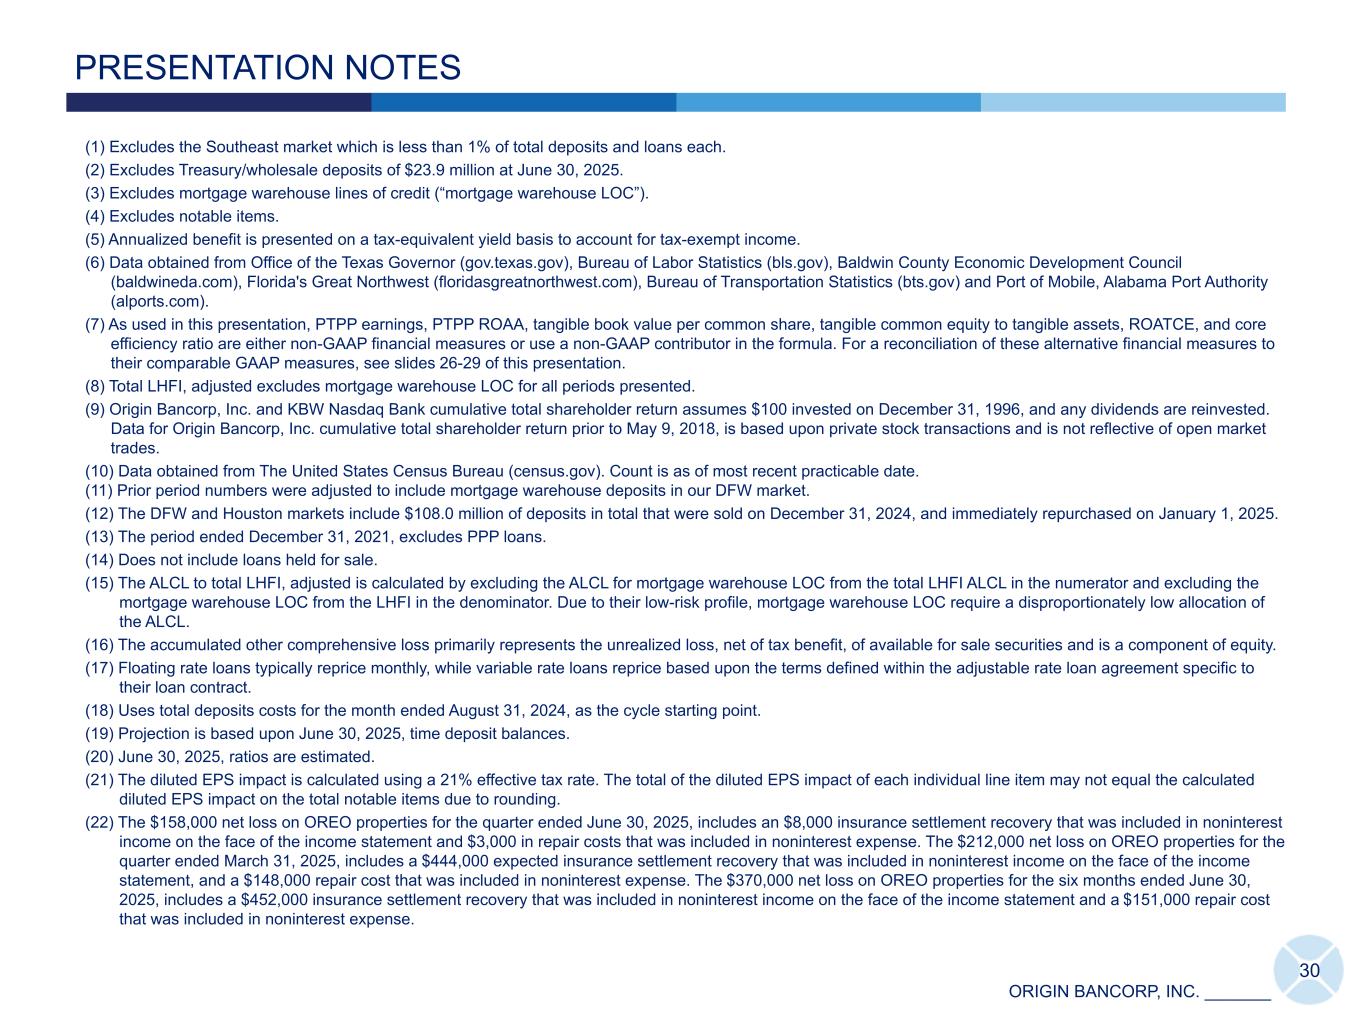
ORIGIN BANCORP, INC. _______ 30 PRESENTATION NOTES (1) Excludes the Southeast market which is less than 1% of total deposits and loans each. (2) Excludes Treasury/wholesale deposits of $23.9 million at June 30, 2025. (3) Excludes mortgage warehouse lines of credit (“mortgage warehouse LOC”). (4) Excludes notable items. (5) Annualized benefit is presented on a tax-equivalent yield basis to account for tax-exempt income. (6) Data obtained from Office of the Texas Governor (gov.texas.gov), Bureau of Labor Statistics (bls.gov), Baldwin County Economic Development Council (baldwineda.com), Florida's Great Northwest (floridasgreatnorthwest.com), Bureau of Transportation Statistics (bts.gov) and Port of Mobile, Alabama Port Authority (alports.com). (7) As used in this presentation, PTPP earnings, PTPP ROAA, tangible book value per common share, tangible common equity to tangible assets, ROATCE, and core efficiency ratio are either non-GAAP financial measures or use a non-GAAP contributor in the formula. For a reconciliation of these alternative financial measures to their comparable GAAP measures, see slides 26-29 of this presentation. (8) Total LHFI, adjusted excludes mortgage warehouse LOC for all periods presented. (9) Origin Bancorp, Inc. and KBW Nasdaq Bank cumulative total shareholder return assumes $100 invested on December 31, 1996, and any dividends are reinvested. Data for Origin Bancorp, Inc. cumulative total shareholder return prior to May 9, 2018, is based upon private stock transactions and is not reflective of open market trades. (10) Data obtained from The United States Census Bureau (census.gov). Count is as of most recent practicable date. (11) Prior period numbers were adjusted to include mortgage warehouse deposits in our DFW market. (12) The DFW and Houston markets include $108.0 million of deposits in total that were sold on December 31, 2024, and immediately repurchased on January 1, 2025. (13) The period ended December 31, 2021, excludes PPP loans. (14) Does not include loans held for sale. (15) The ALCL to total LHFI, adjusted is calculated by excluding the ALCL for mortgage warehouse LOC from the total LHFI ALCL in the numerator and excluding the mortgage warehouse LOC from the LHFI in the denominator. Due to their low-risk profile, mortgage warehouse LOC require a disproportionately low allocation of the ALCL. (16) The accumulated other comprehensive loss primarily represents the unrealized loss, net of tax benefit, of available for sale securities and is a component of equity. (17) Floating rate loans typically reprice monthly, while variable rate loans reprice based upon the terms defined within the adjustable rate loan agreement specific to their loan contract. (18) Uses total deposits costs for the month ended August 31, 2024, as the cycle starting point. (19) Projection is based upon June 30, 2025, time deposit balances. (20) June 30, 2025, ratios are estimated. (21) The diluted EPS impact is calculated using a 21% effective tax rate. The total of the diluted EPS impact of each individual line item may not equal the calculated diluted EPS impact on the total notable items due to rounding. (22) The $158,000 net loss on OREO properties for the quarter ended June 30, 2025, includes an $8,000 insurance settlement recovery that was included in noninterest income on the face of the income statement and $3,000 in repair costs that was included in noninterest expense. The $212,000 net loss on OREO properties for the quarter ended March 31, 2025, includes a $444,000 expected insurance settlement recovery that was included in noninterest income on the face of the income statement, and a $148,000 repair cost that was included in noninterest expense. The $370,000 net loss on OREO properties for the six months ended June 30, 2025, includes a $452,000 insurance settlement recovery that was included in noninterest income on the face of the income statement and a $151,000 repair cost that was included in noninterest expense.