
Mechanics Bancorp Third Quarter Earnings Presentation October 30, 2025 Seattle, WA San Francisco, CA Los Angeles, CA 1
Disclaimer FORWARD-LOOKING STATEMENTS This presentation and statements made by representatives of Mechanics Bancorp (“Mechanics” or the “Company”) during the course of this presentation include “forward- looking statements” within the meaning of the Private Securities Litigation Reform Act of 1995. These forward-looking statements involve known and unknown risks, uncertainties and other factors that may cause the Company’s actual results, performance or achievements to be materially different from any future results, performance or achievements anticipated in such statements. Forward-looking statements speak only as of the date they are made and, except as required by law, the Company does not assume any duty to update forward-looking statements. Such forward-looking statements include, but are not limited to, statements concerning such things as the Company’s outlook, business strategy, financial condition, efforts to make strategic acquisitions, integration activities and outlook, liquidity and sources of funding, market trends, operations and business, the impact of natural disasters or public health emergencies, information technology expenses, capital levels, mortgage servicing rights (“MSR”) assets, stock repurchases, dividend payments, projected losses on mortgage loans originated, total expenses, anticipated changes in our revenue, earnings, or taxes, the effects of government regulation applicable to our operations, the appropriateness of, and changes in, our allowance for credit losses and provision for (reversal of) credit losses, future benchmark rates and economic growth, anticipated investment yields, the collectability of loans, cybersecurity incidents, the outcome of litigation, and the Company’s other plans, objectives, strategies, expectations and intentions and other statements that are not statements of historical fact, and may be identified by words such as “anticipates,” “believes,” “building,” “continue,” “could,” “drive,” “estimates,” “expects,” “forecasts,” “goal,” “guidance,” “intends,” “may,” “might,” “outlook,” “plan,” “probable,” “projects,” “seeks,” “should,” “track,” “target,” “view” or “would” or the negative of these words and phrases or similar words or phrases. The following factors, among others, could cause actual results to differ from those set forth in the forward-looking statements: (i) the credit risks of lending activities, including the Company’s ability to estimate credit losses and increases to the allowance for credit losses, as well as the effects of changes in the level of, and trends in, loan delinquencies and write-offs; (ii) effectiveness of the Company’s data security controls in the face of cyberattacks and any legal, reputational and financial risks following a cybersecurity incident; (iii) changes in general economic, market and business conditions in areas or markets where the Company competes; (iv) changes in the interest rate environment; (v) risks associated with concentration in real estate related loans; (vi) the effects of the Company’s indebtedness on its ability to manage its business successfully, including the restrictions imposed by the indenture governing such indebtedness; (vii) disruptions to the economy and financial services industry, risks associated with uninsured deposits and responsive measures by federal or state governments or banking regulators, including increases in the cost of the Company’s deposit insurance assessments; (viii) cost and availability of capital; (ix) changes in state and federal laws, regulations or policies affecting one or more of the Company’s business segments, including changes in regulatory fees, capital requirements and the Dodd-Frank Wall Street Reform and Consumer Protection Act; (x) changes in key management; (xi) competition in the Company’s various lines of business from other banks and financial institutions, as well as investment banking and financial firms, asset-based non- bank lenders and government agencies; (xii) legal and regulatory proceedings; (xiii) risks associated with merger and acquisition integration; and (xiv) the Company’s ability to use excess capital in an effective manner. For further discussion of such factors, see the risk factors described in our current Report on Form 8-K filed on September 2, 2025, subsequent Quarterly Reports on Form 10-Q and other reports that we have filed with the Securities and Exchange Commission. All forward-looking statements are qualified in their entirety by this cautionary statement. The information contained herein is preliminary and based on Company data available at the time of the earnings presentation. It speaks only as of the particular date or dates included in the accompanying slides. Except as required by law, Mechanics does not undertake an obligation to, and disclaims any duty to, update any of the information herein. 2
Disclaimer (cont’d) Presentation of Results – HomeStreet Bank Merger On September 2, 2025, the merger of HomeStreet Bank, the wholly owned subsidiary of Mechanics Bancorp (formerly known as HomeStreet, Inc.) with and into Mechanics Bank, was completed. Mechanics Bank is the accounting acquirer (legal acquiree), HomeStreet Bank is the accounting acquiree and Mechanics Bancorp is the legal acquirer. Mechanic’s financial results for all periods ended prior to September 2, 2025 reflect Mechanics Bank’s historical financial results on a standalone basis. In addition, Mechanics’ reported financial results for the quarter and nine months ended September 30, 2025 reflect Mechanics Bank’s financial results on a standalone basis until the closing of the merger on September 2, 2025 and results of the combined company for September 2, 2025 through September 30, 2025. The number of shares issued and outstanding, earnings per share, and all references to share quantities or metrics of Mechanics have been retrospectively restated to reflect the equivalent number of shares issued in the merger since the merger was accounted for as a reverse acquisition. As the accounting acquirer, Mechanics Bank remeasured the identifiable assets acquired and liabilities assumed in the merger as of September 2, 2025 at their acquisition date fair values. 3
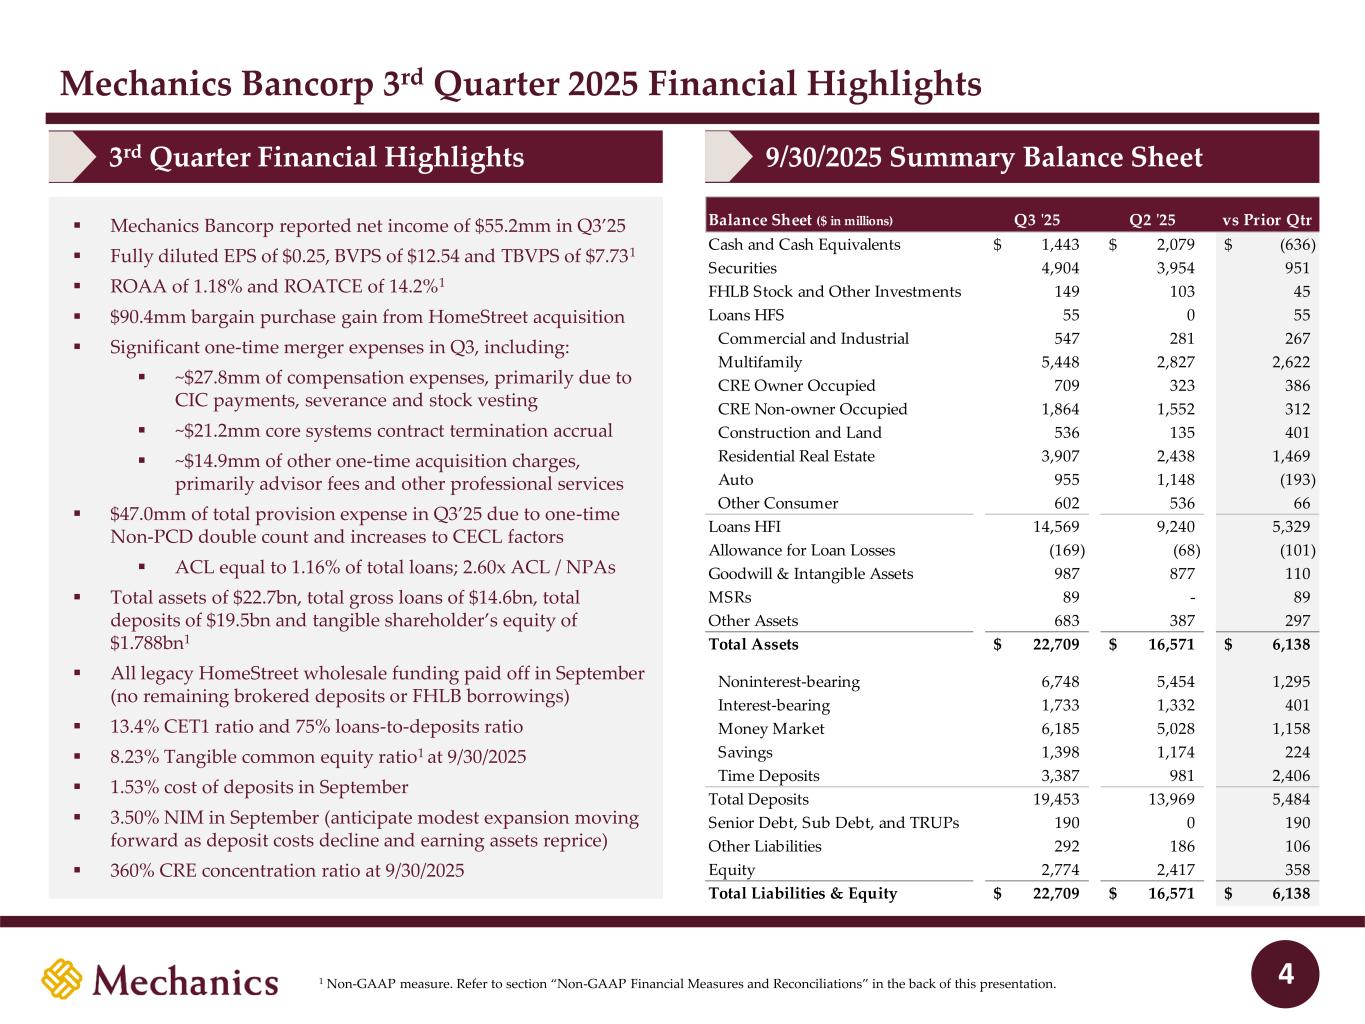
Mechanics Bancorp 3rd Quarter 2025 Financial Highlights 4 3rd Quarter Financial Highlights 9/30/2025 Summary Balance Sheet ▪ Mechanics Bancorp reported net income of $55.2mm in Q3’25 ▪ Fully diluted EPS of $0.25, BVPS of $12.54 and TBVPS of $7.731 ▪ ROAA of 1.18% and ROATCE of 14.2%1 ▪ $90.4mm bargain purchase gain from HomeStreet acquisition ▪ Significant one-time merger expenses in Q3, including: ▪ ~$27.8mm of compensation expenses, primarily due to CIC payments, severance and stock vesting ▪ ~$21.2mm core systems contract termination accrual ▪ ~$14.9mm of other one-time acquisition charges, primarily advisor fees and other professional services ▪ $47.0mm of total provision expense in Q3’25 due to one-time Non-PCD double count and increases to CECL factors ▪ ACL equal to 1.16% of total loans; 2.60x ACL / NPAs ▪ Total assets of $22.7bn, total gross loans of $14.6bn, total deposits of $19.5bn and tangible shareholder’s equity of $1.788bn1 ▪ All legacy HomeStreet wholesale funding paid off in September (no remaining brokered deposits or FHLB borrowings) ▪ 13.4% CET1 ratio and 75% loans-to-deposits ratio ▪ 8.23% Tangible common equity ratio1 at 9/30/2025 ▪ 1.53% cost of deposits in September ▪ 3.50% NIM in September (anticipate modest expansion moving forward as deposit costs decline and earning assets reprice) ▪ 360% CRE concentration ratio at 9/30/2025 1 Non-GAAP measure. Refer to section “Non-GAAP Financial Measures and Reconciliations” in the back of this presentation. Balance Sheet ($ in millions) Q3 '25 Q2 '25 vs Prior Qtr Cash and Cash Equivalents 1,443$ 2,079$ (636)$ Securities 4,904 3,954 951 FHLB Stock and Other Investments 149 103 45 Loans HFS 55 0 55 Commercial and Industrial 547 281 267 Multifamily 5,448 2,827 2,622 CRE Owner Occupied 709 323 386 CRE Non-owner Occupied 1,864 1,552 312 Construction and Land 536 135 401 Residential Real Estate 3,907 2,438 1,469 Auto 955 1,148 (193) Other Consumer 602 536 66 Loans HFI 14,569 9,240 5,329 Allowance for Loan Losses (169) (68) (101) Goodwill & Intangible Assets 987 877 110 MSRs 89 - 89 Other Assets 683 387 297 Total Assets 22,709$ 16,571$ 6,138$ Noninterest-bearing 6,748 5,454 1,295 Interest-bearing 1,733 1,332 401 Money Market 6,185 5,028 1,158 Savings 1,398 1,174 224 Time Deposits 3,387 981 2,406 Total Deposits 19,453 13,969 5,484 Senior Debt, Sub Debt, and TRUPs 190 0 190 Other Liabilities 292 186 106 Equity 2,774 2,417 358 Total Liabilities & Equity 22,709$ 16,571$ 6,138$
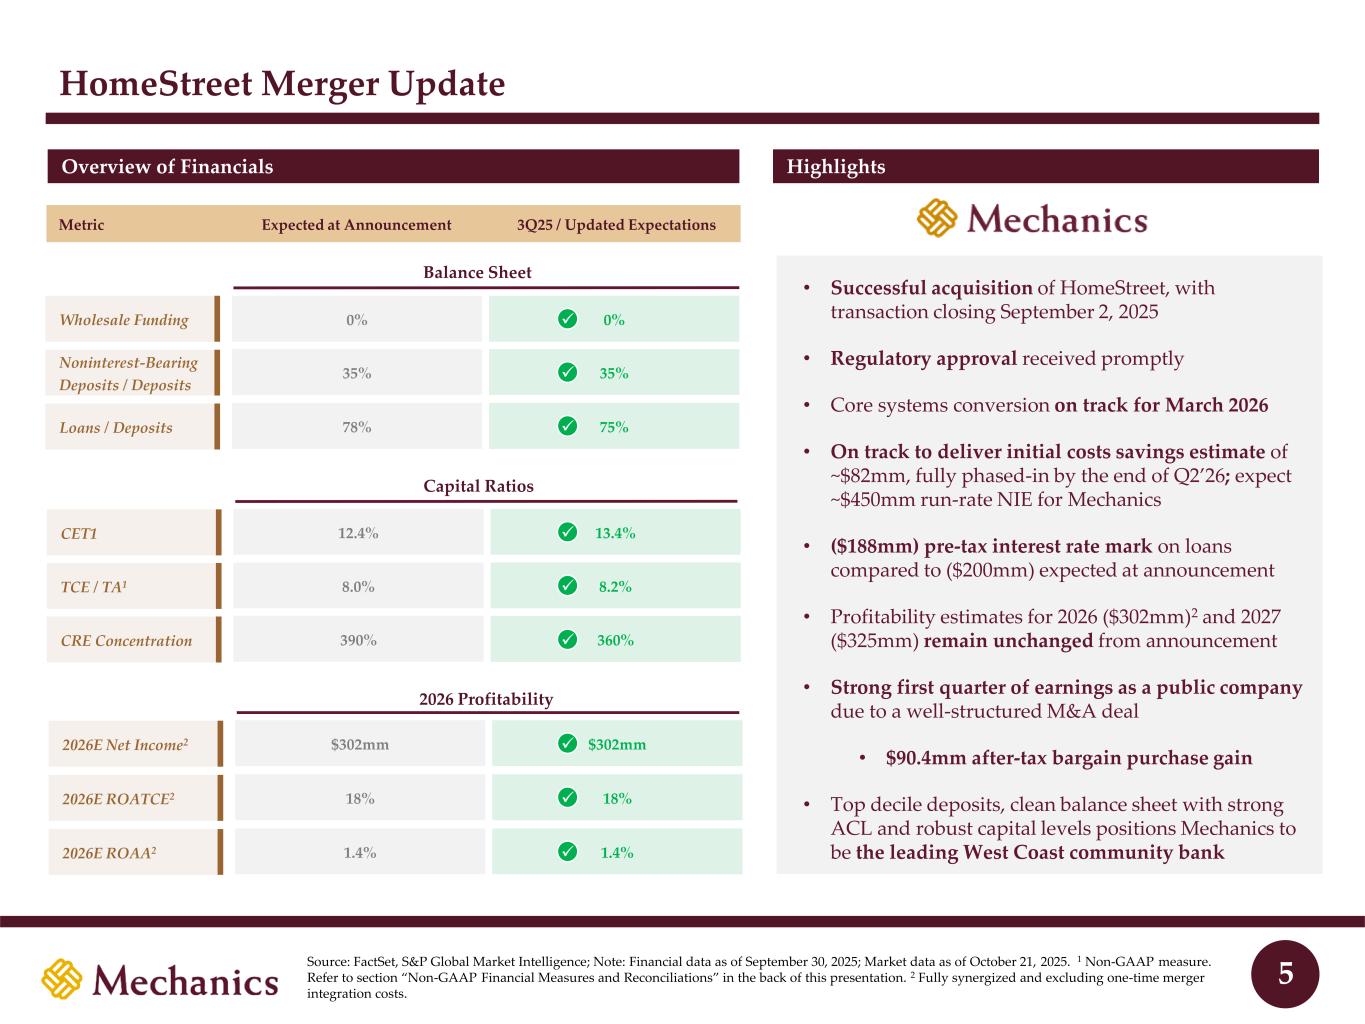
HomeStreet Merger Update Overview of Financials Highlights 5 Expected at Announcement 3Q25 / Updated ExpectationsMetric • Successful acquisition of HomeStreet, with transaction closing September 2, 2025 • Regulatory approval received promptly • Core systems conversion on track for March 2026 • On track to deliver initial costs savings estimate of ~$82mm, fully phased-in by the end of Q2’26; expect ~$450mm run-rate NIE for Mechanics • ($188mm) pre-tax interest rate mark on loans compared to ($200mm) expected at announcement • Profitability estimates for 2026 ($302mm)2 and 2027 ($325mm) remain unchanged from announcement • Strong first quarter of earnings as a public company due to a well-structured M&A deal • $90.4mm after-tax bargain purchase gain • Top decile deposits, clean balance sheet with strong ACL and robust capital levels positions Mechanics to be the leading West Coast community bank Capital Ratios CET1 12.4% 13.4% TCE / TA1 8.0% 8.2% CRE Concentration 390% 360% ✓ ✓ ✓ Source: FactSet, S&P Global Market Intelligence; Note: Financial data as of September 30, 2025; Market data as of October 21, 2025. 1 Non-GAAP measure. Refer to section “Non-GAAP Financial Measures and Reconciliations” in the back of this presentation. 2 Fully synergized and excluding one-time merger integration costs. Wholesale Funding 0% 0% Noninterest-Bearing Deposits / Deposits 35% 35% Loans / Deposits 78% 75% Balance Sheet ✓ 2026E ROATCE2 18% 18% 2026E Net Income2 $302mm $302mm 2026E ROAA2 1.4% 1.4% 2026 Profitability ✓ ✓ ✓ ✓ ✓
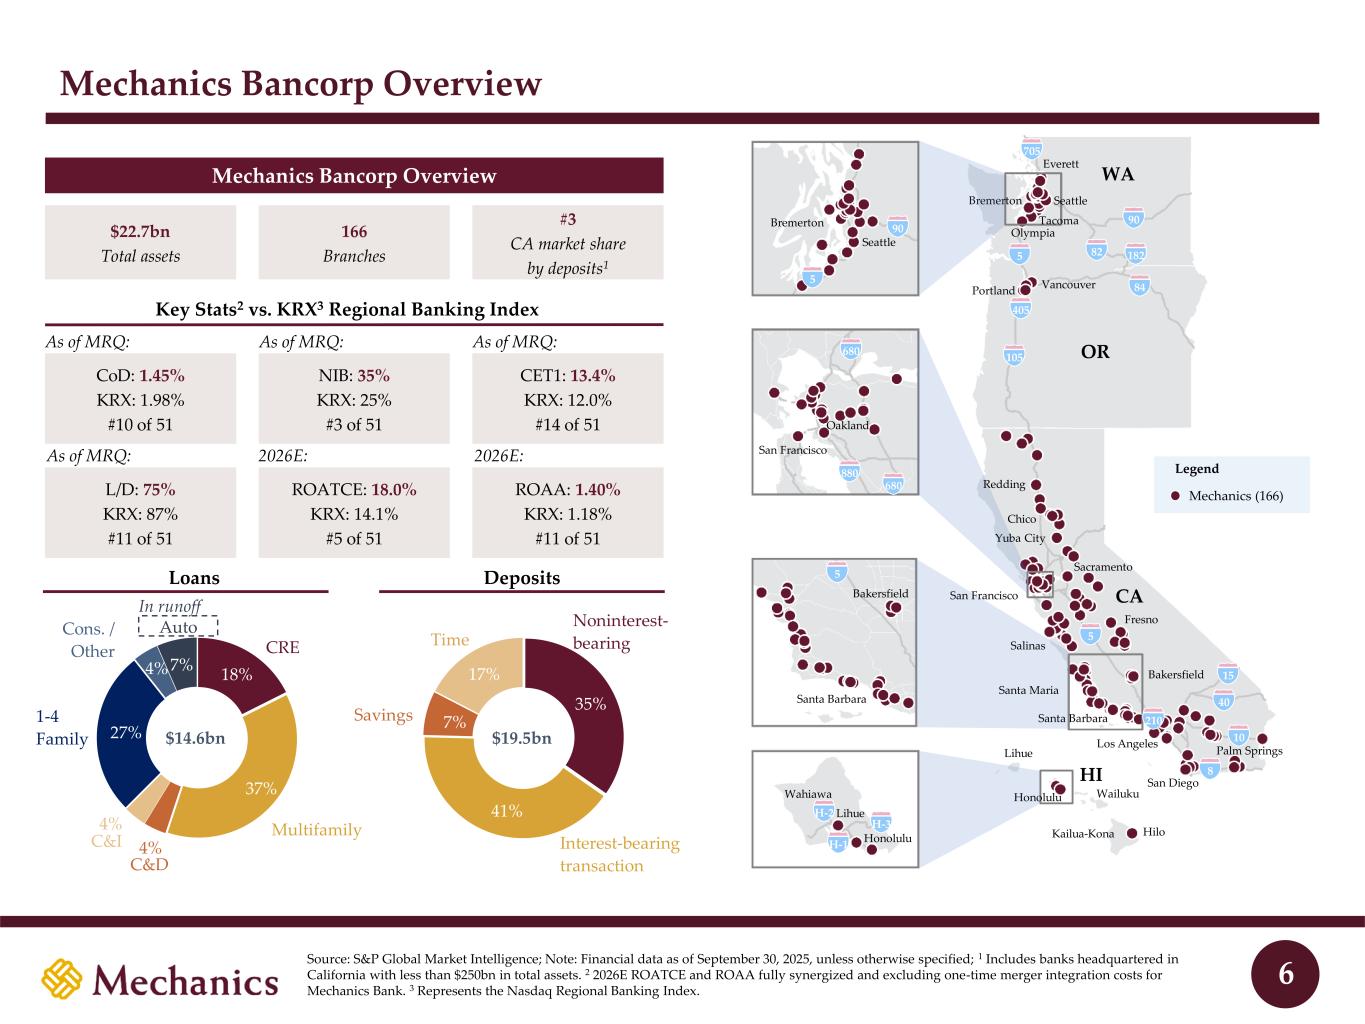
Key Stats2 vs. KRX3 Regional Banking Index Mechanics Bancorp Overview Source: S&P Global Market Intelligence; Note: Financial data as of September 30, 2025, unless otherwise specified; 1 Includes banks headquartered in California with less than $250bn in total assets. 2 2026E ROATCE and ROAA fully synergized and excluding one-time merger integration costs for Mechanics Bank. 3 Represents the Nasdaq Regional Banking Index. CoD: 1.45% KRX: 1.98% #10 of 51 NIB: 35% KRX: 25% #3 of 51 L/D: 75% KRX: 87% #11 of 51 ROATCE: 18.0% KRX: 14.1% #5 of 51 As of MRQ: CET1: 13.4% KRX: 12.0% #14 of 51 ROAA: 1.40% KRX: 1.18% #11 of 51 $22.7bn Total assets 166 Branches #3 CA market share by deposits1 Mechanics Bancorp Overview 18% 37% 27% 4% 7% $14.6bn CRE C&I 1-4 Family Cons. / Other Auto 35% 41% 7% 17% $19.5bn Noninterest- bearing Interest-bearing transaction Savings Time Loans Multifamily C&D Deposits 4% 4% 6 In runoff As of MRQ: San Francisco Oakland 880 680 680 90 5 5 Santa Barbara Bakersfield CA OR WA 8 10 40 15 5 5 90 82 182 84 105 405 210 Palm Springs San Diego Los Angeles Santa Maria Santa Barbara Bakersfield Fresno Salinas San Francisco Sacramento Yuba City Chico Redding Seattle Bremerton Seattle Everett Bremerton Tacoma Olympia Vancouver Portland 705 H-3 Lihue Honolulu Hilo Lihue Wailuku H-1 Kailua-Kona Wahiawa H-2 Honolulu Legend Mechanics (166) HI As of MRQ: As of MRQ: 2026E: 2026E:
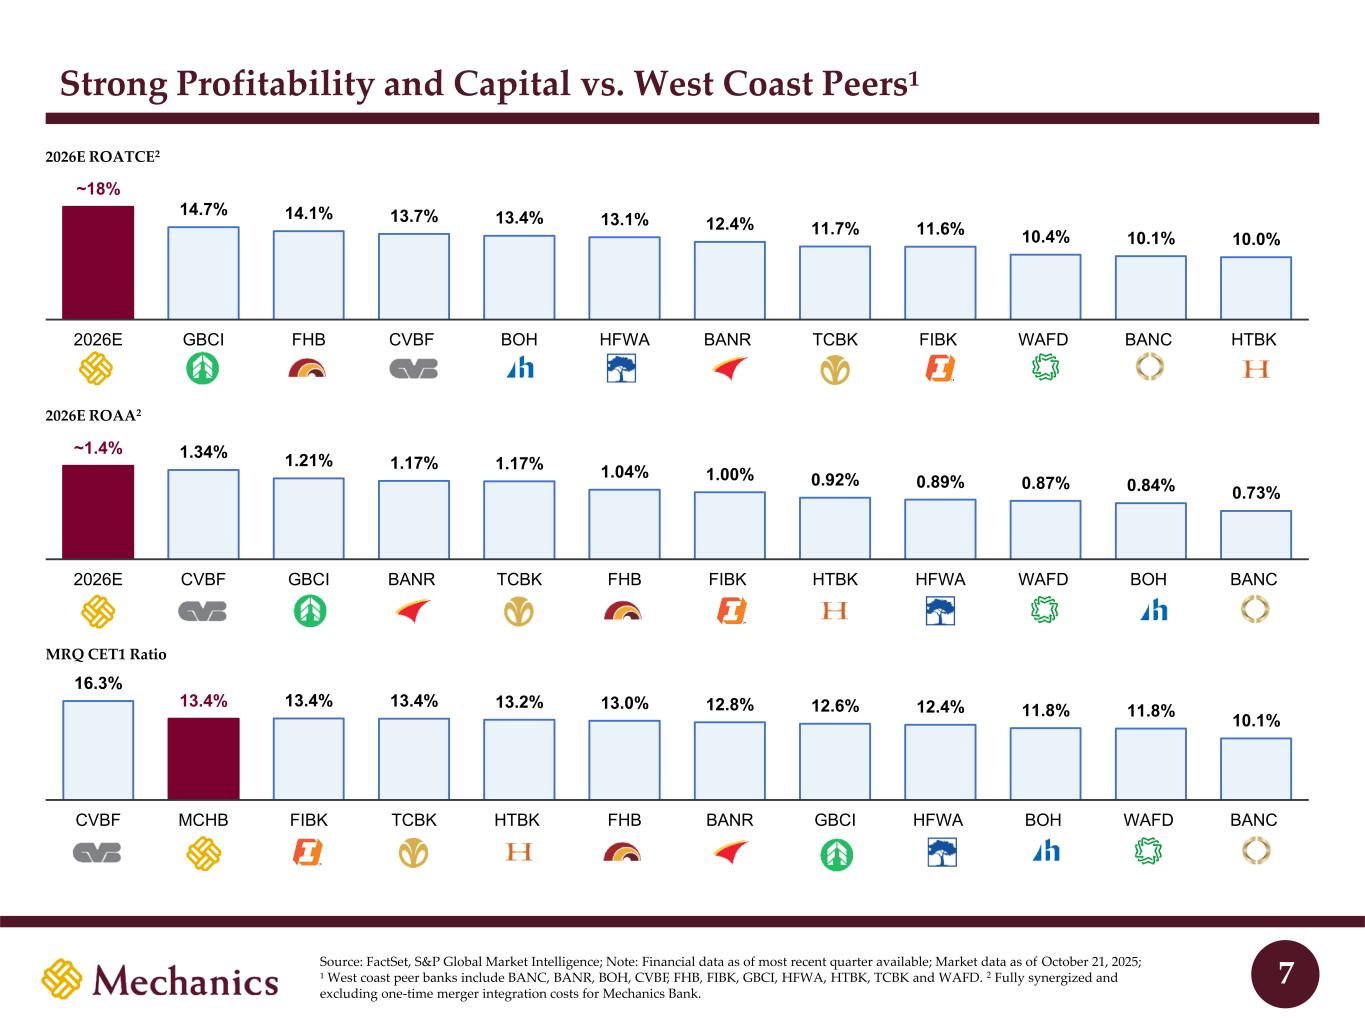
Strong Profitability and Capital vs. West Coast Peers¹ 2026E ROATCE2 ~1.4% 1.34% 1.21% 1.17% 1.17% 1.04% 1.00% 0.92% 0.89% 0.87% 0.84% 0.73% 2026E CVBF GBCI BANR TCBK FHB FIBK HTBK HFWA WAFD BOH BANC 2026E ROAA2 Source: FactSet, S&P Global Market Intelligence; Note: Financial data as of most recent quarter available; Market data as of October 21, 2025; ¹ West coast peer banks include BANC, BANR, BOH, CVBF, FHB, FIBK, GBCI, HFWA, HTBK, TCBK and WAFD. 2 Fully synergized and excluding one-time merger integration costs for Mechanics Bank. 7 ~18% 14.7% 14.1% 13.7% 13.4% 13.1% 12.4% 11.7% 11.6% 10.4% 10.1% 10.0% 2026E GBCI FHB CVBF BOH HFWA BANR TCBK FIBK WAFD BANC HTBK 16.3% 13.4% 13.4% 13.4% 13.2% 13.0% 12.8% 12.6% 12.4% 11.8% 11.8% 10.1% CVBF MCHB FIBK TCBK HTBK FHB BANR GBCI HFWA BOH WAFD BANC MRQ CET1 Ratio
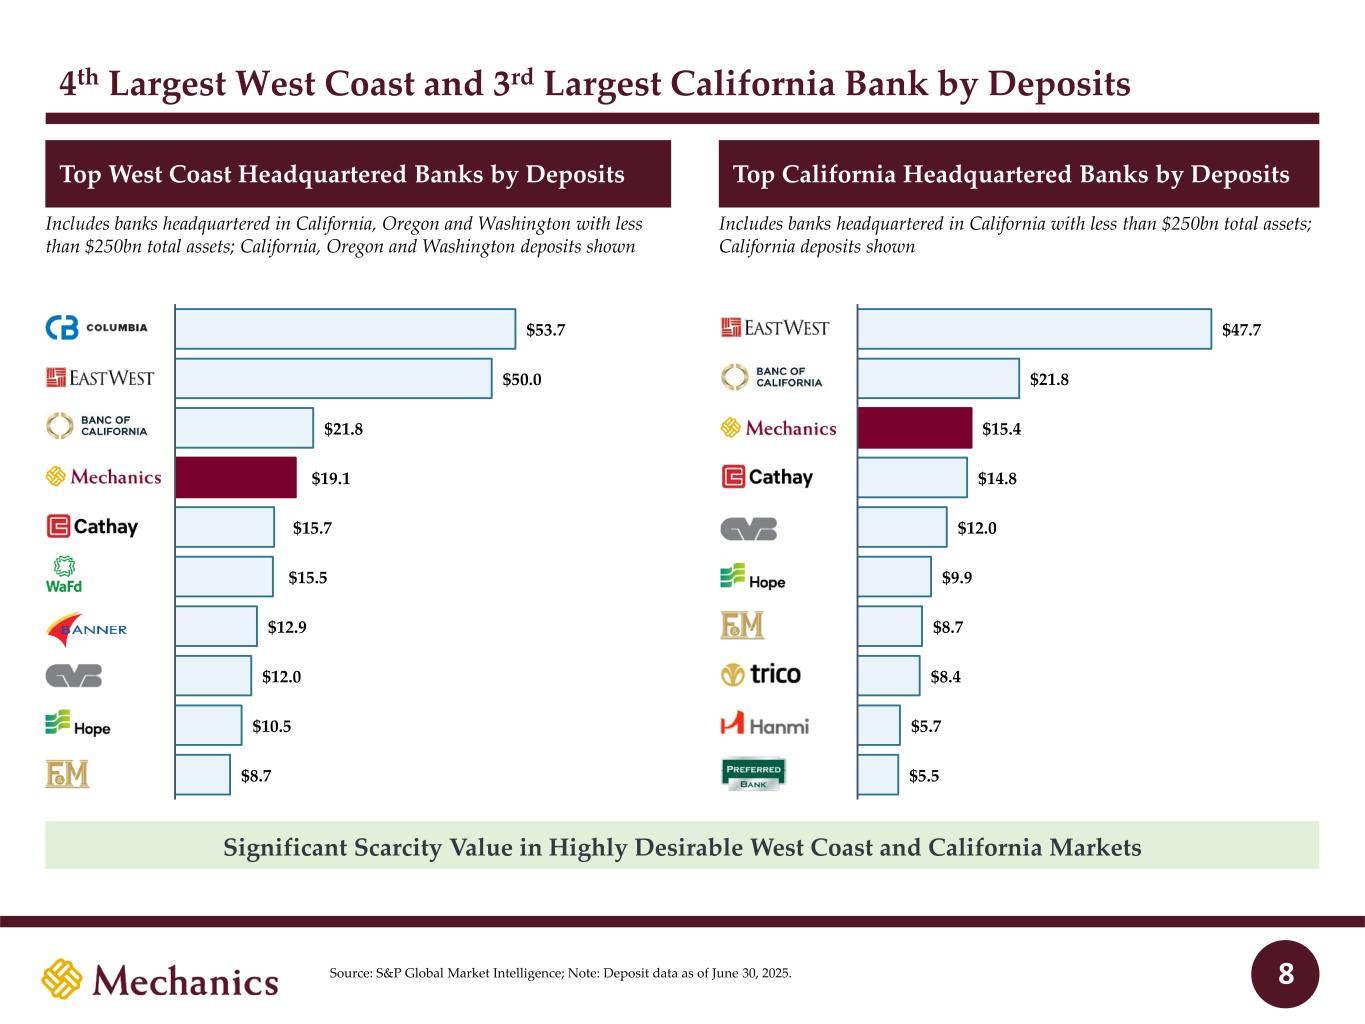
4th Largest West Coast and 3rd Largest California Bank by Deposits Top West Coast Headquartered Banks by Deposits Top California Headquartered Banks by Deposits Significant Scarcity Value in Highly Desirable West Coast and California Markets $47.7 $21.8 $15.4 $14.8 $12.0 $9.9 $8.7 $8.4 $5.7 $5.5 $53.7 $50.0 $21.8 $19.1 $15.7 $15.5 $12.9 $12.0 $10.5 $8.7 Includes banks headquartered in California, Oregon and Washington with less than $250bn total assets; California, Oregon and Washington deposits shown Includes banks headquartered in California with less than $250bn total assets; California deposits shown 8Source: S&P Global Market Intelligence; Note: Deposit data as of June 30, 2025.
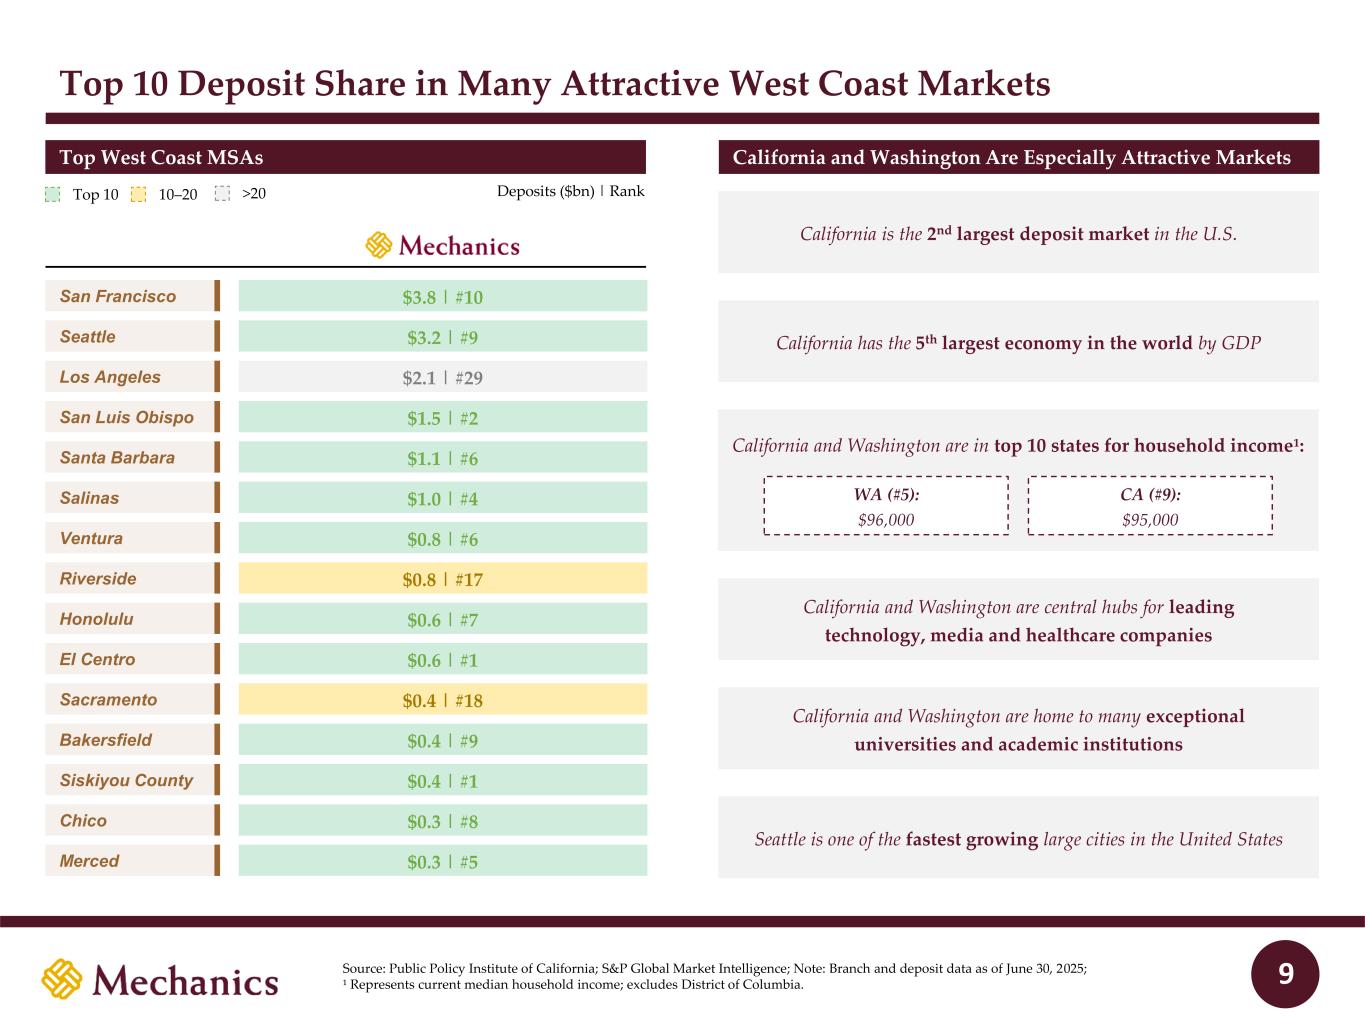
Top 10 Deposit Share in Many Attractive West Coast Markets Top West Coast MSAs Seattle San Francisco Los Angeles San Luis Obispo Santa Barbara Salinas Ventura Riverside El Centro Siskiyou County $3.8 | #10 $1.1 | #6 $3.2 | #9 $2.1 | #29 $1.5 | #2 $1.0 | #4 $0.8 | #17 $0.6 | #7 $0.4 | #1 $0.8 | #6 Top 10 10–20 >20 California and Washington Are Especially Attractive Markets Deposits ($bn) | Rank California is the 2nd largest deposit market in the U.S. California and Washington are in top 10 states for household income¹: WA (#5): $96,000 CA (#9): $95,000 California and Washington are central hubs for leading technology, media and healthcare companies California and Washington are home to many exceptional universities and academic institutions California has the 5th largest economy in the world by GDP Seattle is one of the fastest growing large cities in the United States 9 Honolulu $0.6 | #1 Sacramento $0.4 | #18 Chico $0.4 | #9Bakersfield $0.3 | #8 Merced $0.3 | #5 Source: Public Policy Institute of California; S&P Global Market Intelligence; Note: Branch and deposit data as of June 30, 2025; ¹ Represents current median household income; excludes District of Columbia.
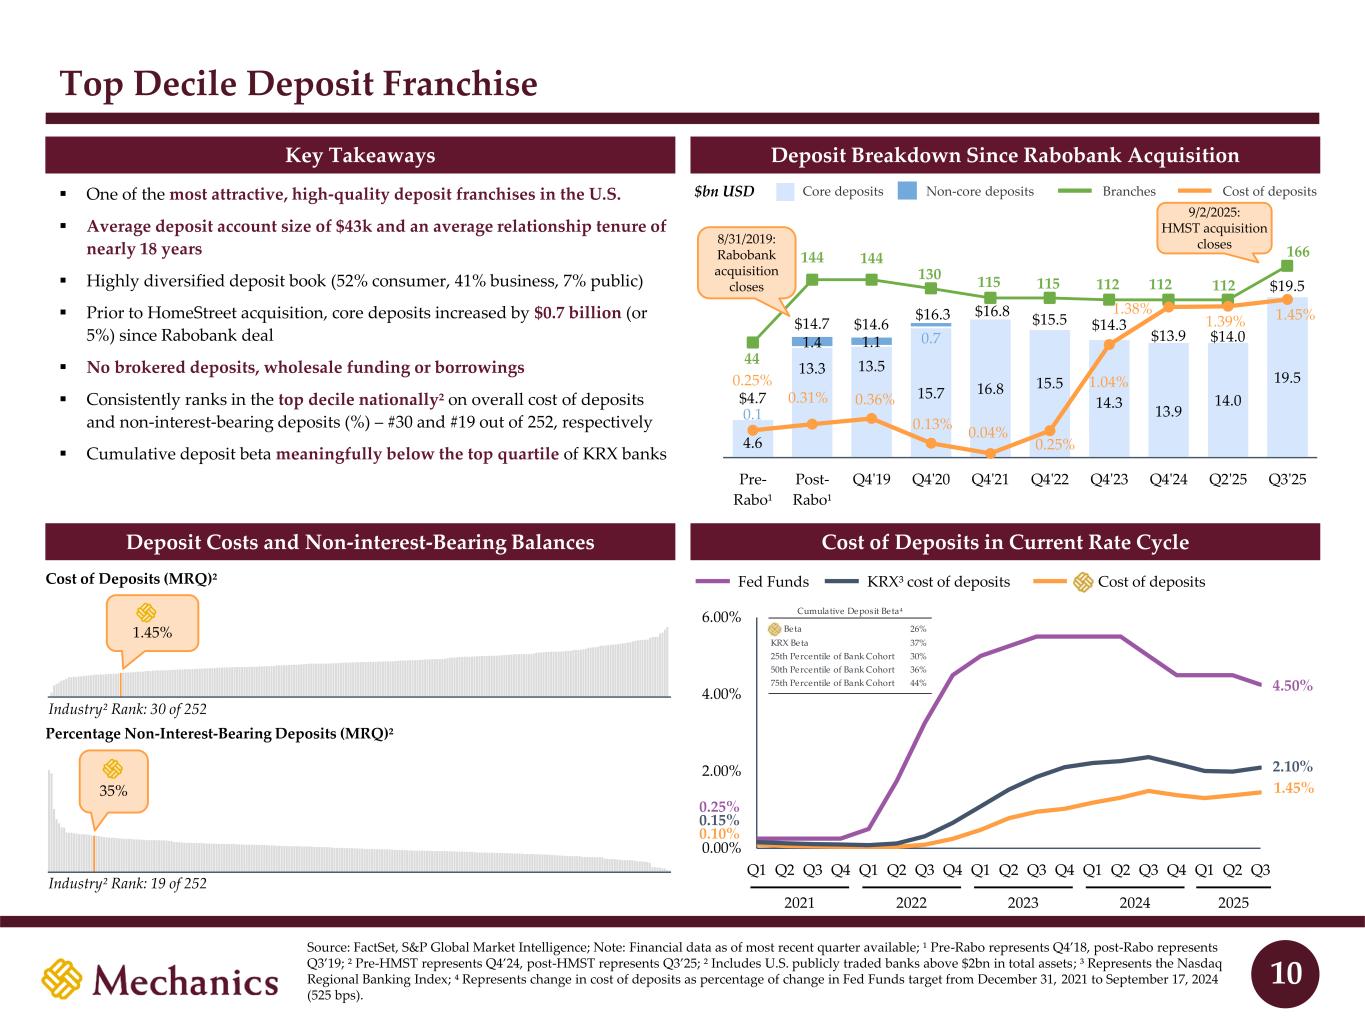
Top Decile Deposit Franchise ▪ One of the most attractive, high-quality deposit franchises in the U.S. ▪ Average deposit account size of $43k and an average relationship tenure of nearly 18 years ▪ Highly diversified deposit book (52% consumer, 41% business, 7% public) ▪ Prior to HomeStreet acquisition, core deposits increased by $0.7 billion (or 5%) since Rabobank deal ▪ No brokered deposits, wholesale funding or borrowings ▪ Consistently ranks in the top decile nationally² on overall cost of deposits and non-interest-bearing deposits (%) – #30 and #19 out of 252, respectively ▪ Cumulative deposit beta meaningfully below the top quartile of KRX banks Key Takeaways Deposit Costs and Non-interest-Bearing Balances Percentage Non-Interest-Bearing Deposits (MRQ)² Industry² Rank: 19 of 252 35% Cost of Deposits (MRQ)² 1.45% Industry² Rank: 30 of 252 10 Source: FactSet, S&P Global Market Intelligence; Note: Financial data as of most recent quarter available; ¹ Pre-Rabo represents Q4’18, post-Rabo represents Q3’19; ² Pre-HMST represents Q4’24, post-HMST represents Q3’25; ² Includes U.S. publicly traded banks above $2bn in total assets; ³ Represents the Nasdaq Regional Banking Index; ⁴ Represents change in cost of deposits as percentage of change in Fed Funds target from December 31, 2021 to September 17, 2024 (525 bps). 44 144 144 130 115 115 112 112 112 166 4.6 13.3 13.5 15.7 16.8 15.5 14.3 13.9 14.0 19.5 0.1 1.4 1.1 0.7 $4.7 $14.7 $14.6 $16.3 $16.8 $15.5 $14.3 $13.9 $14.0 $19.5 0.25% 0.31% 0.36% 0.13% 0.04% 0.25% 1.04% 1.38% 1.39% 1.45% Pre- Rabo¹ Post- Rabo¹ Q4'19 Q4'20 Q4'21 Q4'22 Q4'23 Q4'24 Q2'25 Q3'25 9/2/2025: HMST acquisition closes 0.00% 2.00% 4.00% 6.00% Q1 Q2 Q3 Q4 Q1 Q2 Q3 Q4 Q1 Q2 Q3 Q4 Q1 Q2 Q3 Q4 Q1 Q2 Q3 Core deposits Non-core deposits Cost of deposits 0.25% 0.10% 0.15% Fed Funds KRX³ cost of deposits Cost of deposits Deposit Breakdown Since Rabobank Acquisition Cost of Deposits in Current Rate Cycle $bn USD 2021 20232022 2024 4.50% 1.45% 2.10% Cumulative Deposit Beta⁴ Beta 26% KRX Beta 37% 25th Percentile of Bank Cohort 30% 50th Percentile of Bank Cohort 36% 75th Percentile of Bank Cohort 44% Branches 8/31/2019: Rabobank acquisition closes 2025
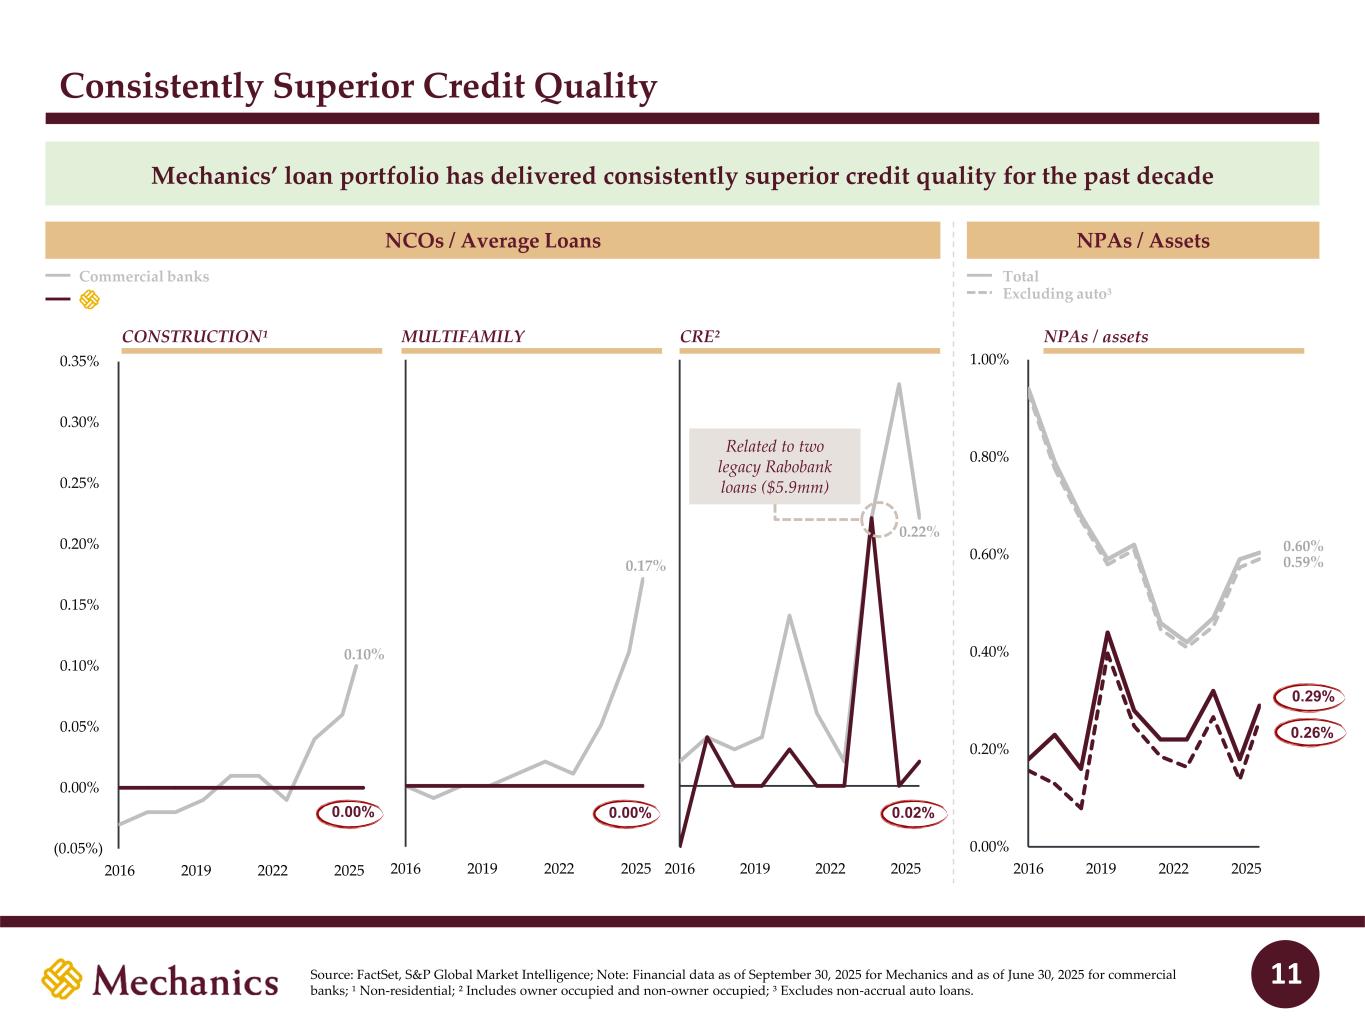
2016 2019 2022 2025 Consistently Superior Credit Quality Commercial banks 0.59% 0.26% 0.00% 0.20% 0.40% 0.60% 0.80% 1.00% 2016 2019 2022 2025 11 (0.05%) 0.00% 0.05% 0.10% 0.15% 0.20% 0.25% 0.30% 0.35% 2016 2019 2022 2025 2016 2019 2022 2025 0.10% 0.17% 0.22% 0.00% 0.00% 0.02% NCOs / Average Loans NPAs / Assets CONSTRUCTION¹ MULTIFAMILY CRE² NPAs / assets 0.60% 0.29% Total Excluding auto³ Related to two legacy Rabobank loans ($5.9mm) Mechanics’ loan portfolio has delivered consistently superior credit quality for the past decade Source: FactSet, S&P Global Market Intelligence; Note: Financial data as of September 30, 2025 for Mechanics and as of June 30, 2025 for commercial banks; ¹ Non-residential; ² Includes owner occupied and non-owner occupied; ³ Excludes non-accrual auto loans.
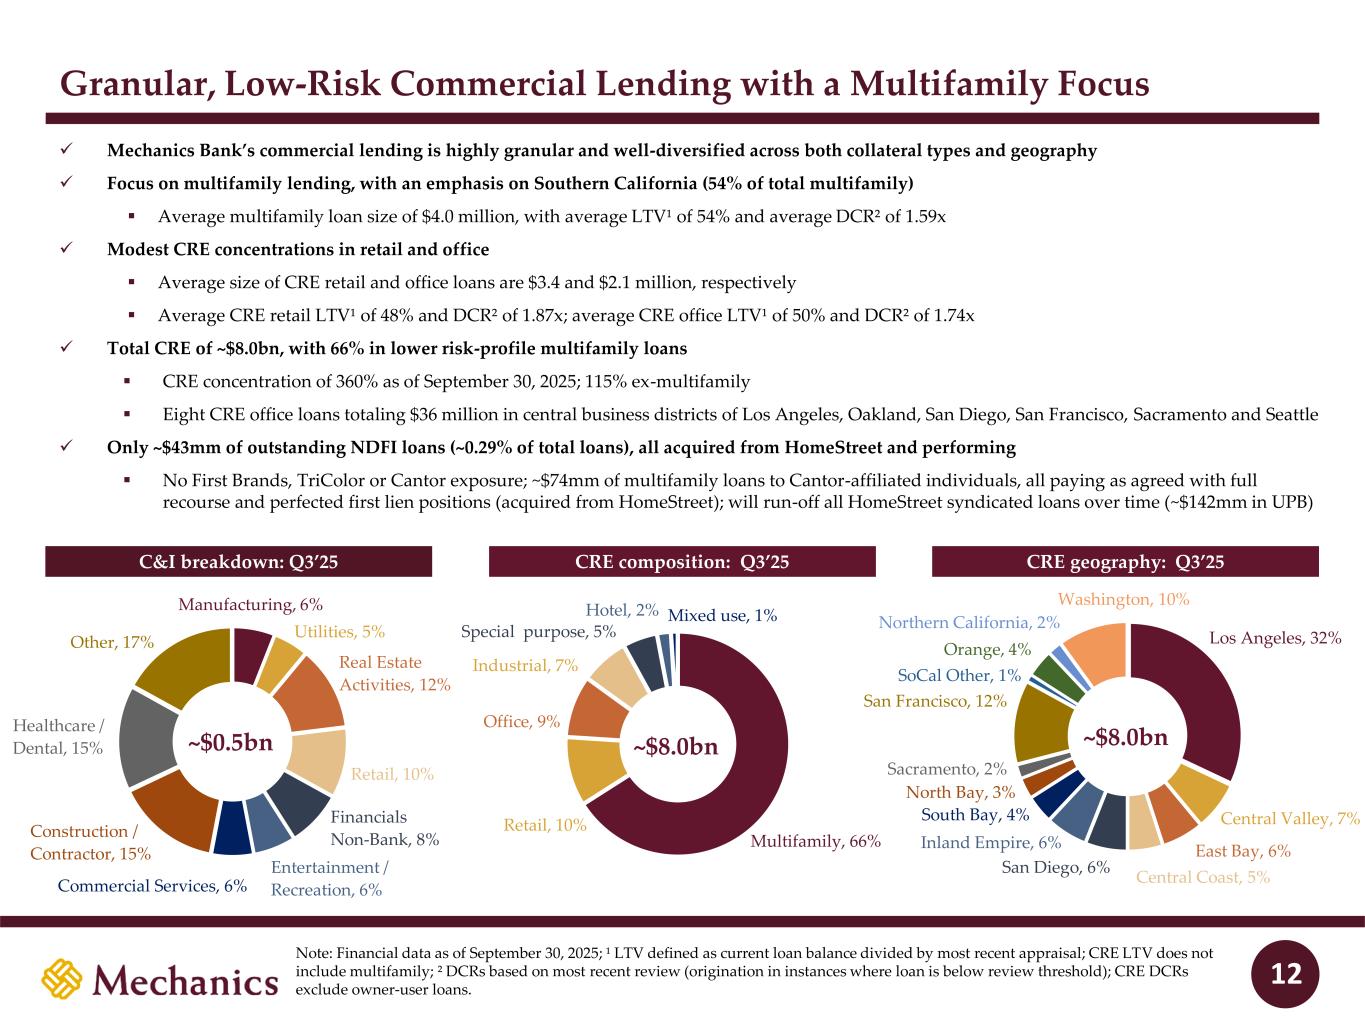
Granular, Low-Risk Commercial Lending with a Multifamily Focus ✓ Mechanics Bank’s commercial lending is highly granular and well-diversified across both collateral types and geography ✓ Focus on multifamily lending, with an emphasis on Southern California (54% of total multifamily) ▪ Average multifamily loan size of $4.0 million, with average LTV¹ of 54% and average DCR² of 1.59x ✓ Modest CRE concentrations in retail and office ▪ Average size of CRE retail and office loans are $3.4 and $2.1 million, respectively ▪ Average CRE retail LTV¹ of 48% and DCR² of 1.87x; average CRE office LTV¹ of 50% and DCR² of 1.74x ✓ Total CRE of ~$8.0bn, with 66% in lower risk-profile multifamily loans ▪ CRE concentration of 360% as of September 30, 2025; 115% ex-multifamily ▪ Eight CRE office loans totaling $36 million in central business districts of Los Angeles, Oakland, San Diego, San Francisco, Sacramento and Seattle ✓ Only ~$43mm of outstanding NDFI loans (~0.29% of total loans), all acquired from HomeStreet and performing ▪ No First Brands, TriColor or Cantor exposure; ~$74mm of multifamily loans to Cantor-affiliated individuals, all paying as agreed with full recourse and perfected first lien positions (acquired from HomeStreet); will run-off all HomeStreet syndicated loans over time (~$142mm in UPB) CRE composition: Q3’25C&I breakdown: Q3’25 CRE geography: Q3’25 12 Multifamily, 66% Retail, 10% Office, 9% Industrial, 7% Special purpose, 5% Hotel, 2% Mixed use, 1% ~$8.0bn Note: Financial data as of September 30, 2025; ¹ LTV defined as current loan balance divided by most recent appraisal; CRE LTV does not include multifamily; ² DCRs based on most recent review (origination in instances where loan is below review threshold); CRE DCRs exclude owner-user loans. Los Angeles, 32% Central Valley, 7% East Bay, 6% Central Coast, 5% San Diego, 6% Inland Empire, 6% South Bay, 4% North Bay, 3% Sacramento, 2% San Francisco, 12% SoCal Other, 1% Orange, 4% Northern California, 2% ~$8.0bn Washington, 10%Manufacturing, 6% Utilities, 5% Real Estate Activities, 12% Retail, 10% Financials Non-Bank, 8% Entertainment / Recreation, 6%Commercial Services, 6% Construction / Contractor, 15% Healthcare / Dental, 15% Other, 17% ~$0.5bn
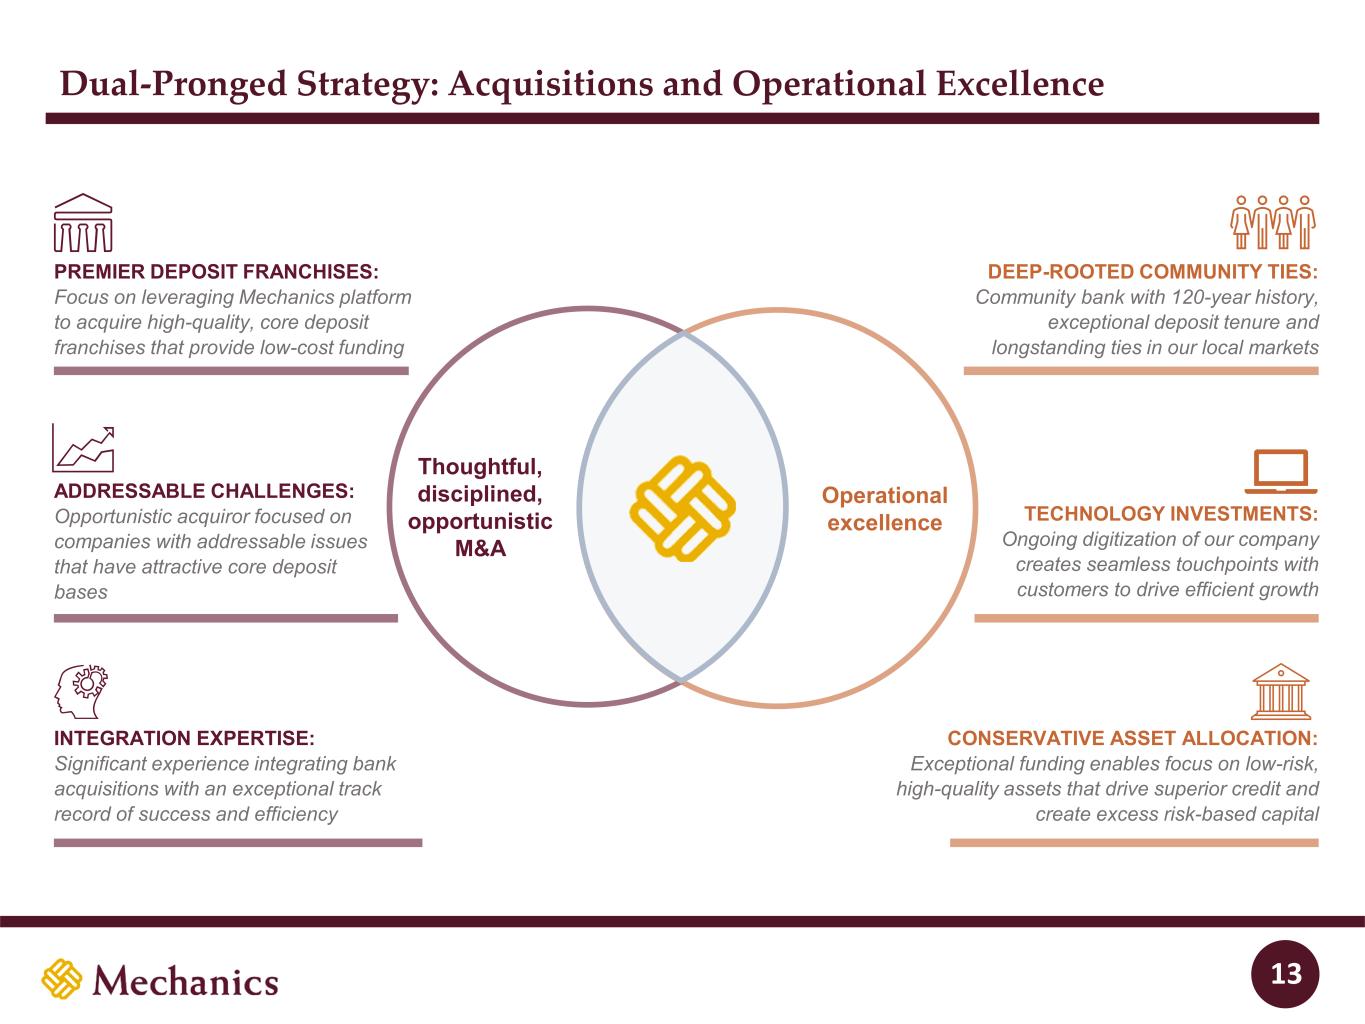
Dual-Pronged Strategy: Acquisitions and Operational Excellence 13 PREMIER DEPOSIT FRANCHISES: Focus on leveraging Mechanics platform to acquire high-quality, core deposit franchises that provide low-cost funding ADDRESSABLE CHALLENGES: Opportunistic acquiror focused on companies with addressable issues that have attractive core deposit bases INTEGRATION EXPERTISE: Significant experience integrating bank acquisitions with an exceptional track record of success and efficiency DEEP-ROOTED COMMUNITY TIES: Community bank with 120-year history, exceptional deposit tenure and longstanding ties in our local markets TECHNOLOGY INVESTMENTS: Ongoing digitization of our company creates seamless touchpoints with customers to drive efficient growth CONSERVATIVE ASSET ALLOCATION: Exceptional funding enables focus on low-risk, high-quality assets that drive superior credit and create excess risk-based capital Thoughtful, disciplined, opportunistic M&A Operational excellence
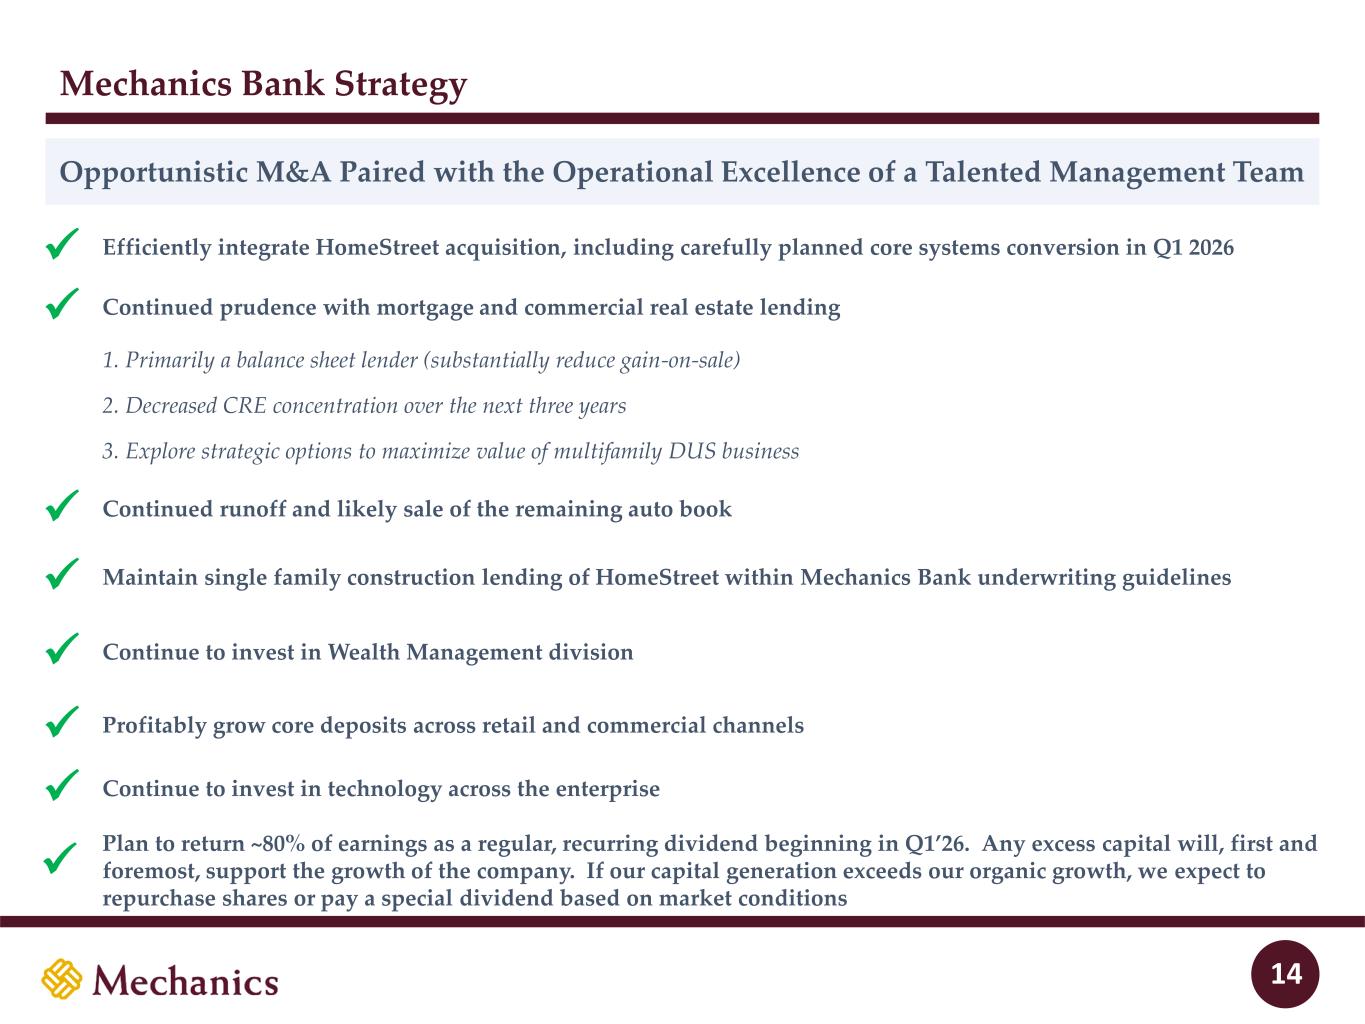
Mechanics Bank Strategy 14 Efficiently integrate HomeStreet acquisition, including carefully planned core systems conversion in Q1 2026✓ Continued prudence with mortgage and commercial real estate lending✓ Continued runoff and likely sale of the remaining auto book✓ Maintain single family construction lending of HomeStreet within Mechanics Bank underwriting guidelines✓ Opportunistic M&A Paired with the Operational Excellence of a Talented Management Team Continue to invest in Wealth Management division✓ 1. Primarily a balance sheet lender (substantially reduce gain-on-sale) 3. Explore strategic options to maximize value of multifamily DUS business 2. Decreased CRE concentration over the next three years Profitably grow core deposits across retail and commercial channels✓ Continue to invest in technology across the enterprise✓ Plan to return ~80% of earnings as a regular, recurring dividend beginning in Q1’26. Any excess capital will, first and foremost, support the growth of the company. If our capital generation exceeds our organic growth, we expect to repurchase shares or pay a special dividend based on market conditions ✓
Third Quarter 2025 Financial Highlights 15
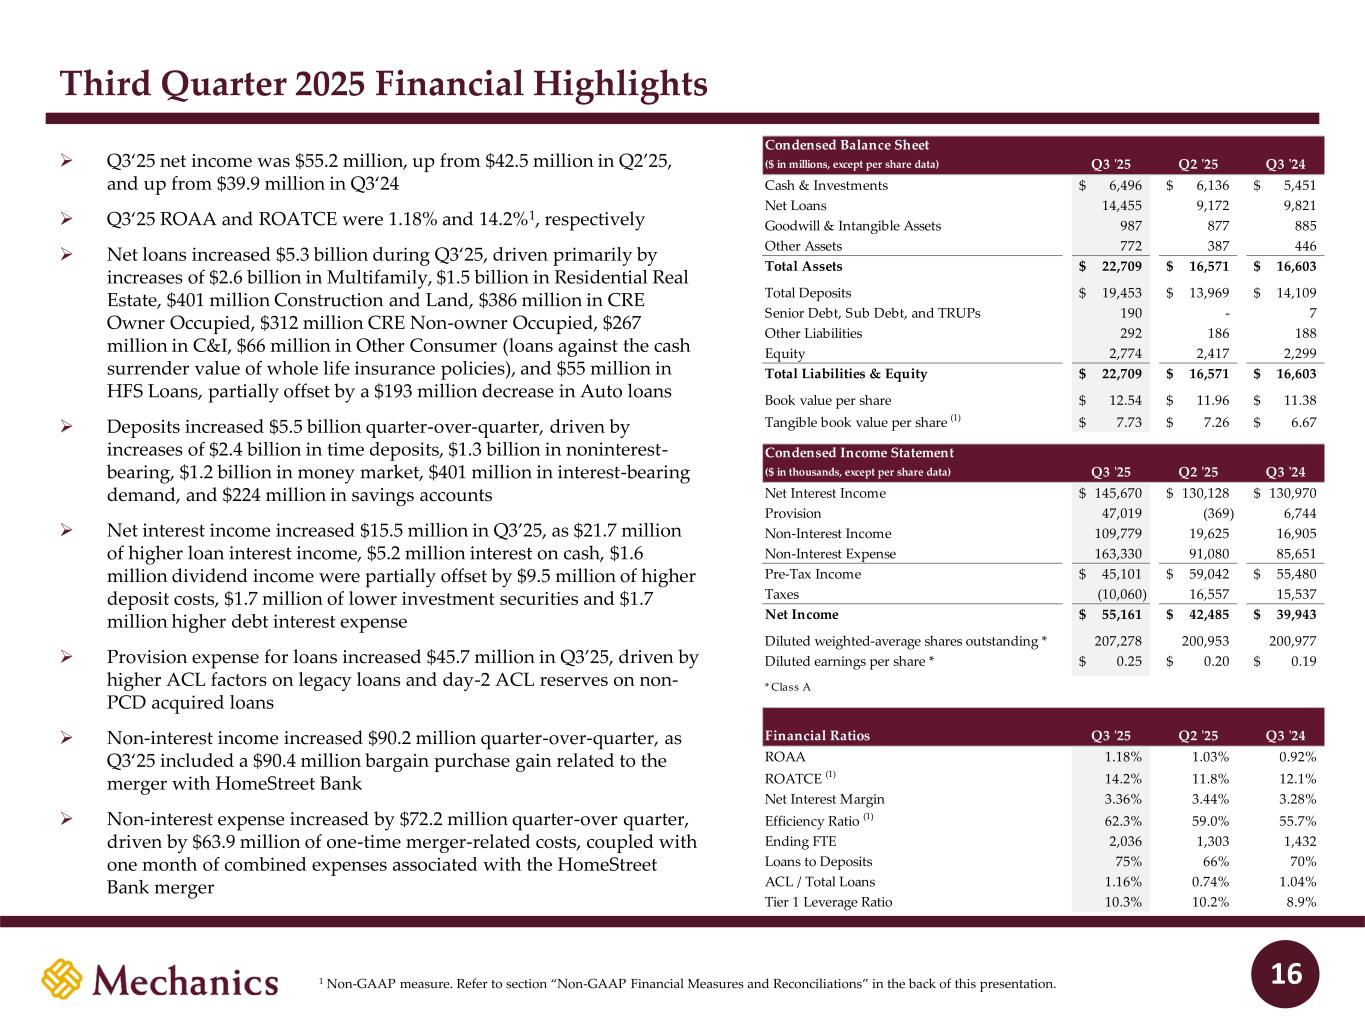
Third Quarter 2025 Financial Highlights 16 ➢ Q3‘25 net income was $55.2 million, up from $42.5 million in Q2’25, and up from $39.9 million in Q3‘24 ➢ Q3‘25 ROAA and ROATCE were 1.18% and 14.2%1, respectively ➢ Net loans increased $5.3 billion during Q3‘25, driven primarily by increases of $2.6 billion in Multifamily, $1.5 billion in Residential Real Estate, $401 million Construction and Land, $386 million in CRE Owner Occupied, $312 million CRE Non-owner Occupied, $267 million in C&I, $66 million in Other Consumer (loans against the cash surrender value of whole life insurance policies), and $55 million in HFS Loans, partially offset by a $193 million decrease in Auto loans ➢ Deposits increased $5.5 billion quarter-over-quarter, driven by increases of $2.4 billion in time deposits, $1.3 billion in noninterest- bearing, $1.2 billion in money market, $401 million in interest-bearing demand, and $224 million in savings accounts ➢ Net interest income increased $15.5 million in Q3’25, as $21.7 million of higher loan interest income, $5.2 million interest on cash, $1.6 million dividend income were partially offset by $9.5 million of higher deposit costs, $1.7 million of lower investment securities and $1.7 million higher debt interest expense ➢ Provision expense for loans increased $45.7 million in Q3’25, driven by higher ACL factors on legacy loans and day-2 ACL reserves on non- PCD acquired loans ➢ Non-interest income increased $90.2 million quarter-over-quarter, as Q3‘25 included a $90.4 million bargain purchase gain related to the merger with HomeStreet Bank ➢ Non-interest expense increased by $72.2 million quarter-over quarter, driven by $63.9 million of one-time merger-related costs, coupled with one month of combined expenses associated with the HomeStreet Bank merger Condensed Balance Sheet ($ in millions, except per share data) Q3 '25 Q2 '25 Q3 '24 Cash & Investments 6,496$ 6,136$ 5,451$ Net Loans 14,455 9,172 9,821 Goodwill & Intangible Assets 987 877 885 Other Assets 772 387 446 Total Assets 22,709$ 16,571$ 16,603$ Total Deposits 19,453$ 13,969$ 14,109$ Senior Debt, Sub Debt, and TRUPs 190 - 7 Other Liabilities 292 186 188 Equity 2,774 2,417 2,299 Total Liabilities & Equity 22,709$ 16,571$ 16,603$ Book value per share 12.54$ 11.96$ 11.38$ Tangible book value per share (1) 7.73$ 7.26$ 6.67$ Condensed Income Statement ($ in thousands, except per share data) Q3 '25 Q2 '25 Q3 '24 Net Interest Income 145,670$ 130,128$ 130,970$ Provision 47,019 (369) 6,744 Non-Interest Income 109,779 19,625 16,905 Non-Interest Expense 163,330 91,080 85,651 Pre-Tax Income 45,101$ 59,042$ 55,480$ Taxes (10,060) 16,557 15,537 Net Income 55,161$ 42,485$ 39,943$ Diluted weighted-average shares outstanding * 207,278 200,953 200,977 Diluted earnings per share * 0.25$ 0.20$ 0.19$ * Class A Financial Ratios Q3 '25 Q2 '25 Q3 '24 ROAA 1.18% 1.03% 0.92% ROATCE (1) 14.2% 11.8% 12.1% Net Interest Margin 3.36% 3.44% 3.28% Efficiency Ratio (1) 62.3% 59.0% 55.7% Ending FTE 2,036 1,303 1,432 Loans to Deposits 75% 66% 70% ACL / Total Loans 1.16% 0.74% 1.04% Tier 1 Leverage Ratio 10.3% 10.2% 8.9% 1 Non-GAAP measure. Refer to section “Non-GAAP Financial Measures and Reconciliations” in the back of this presentation.
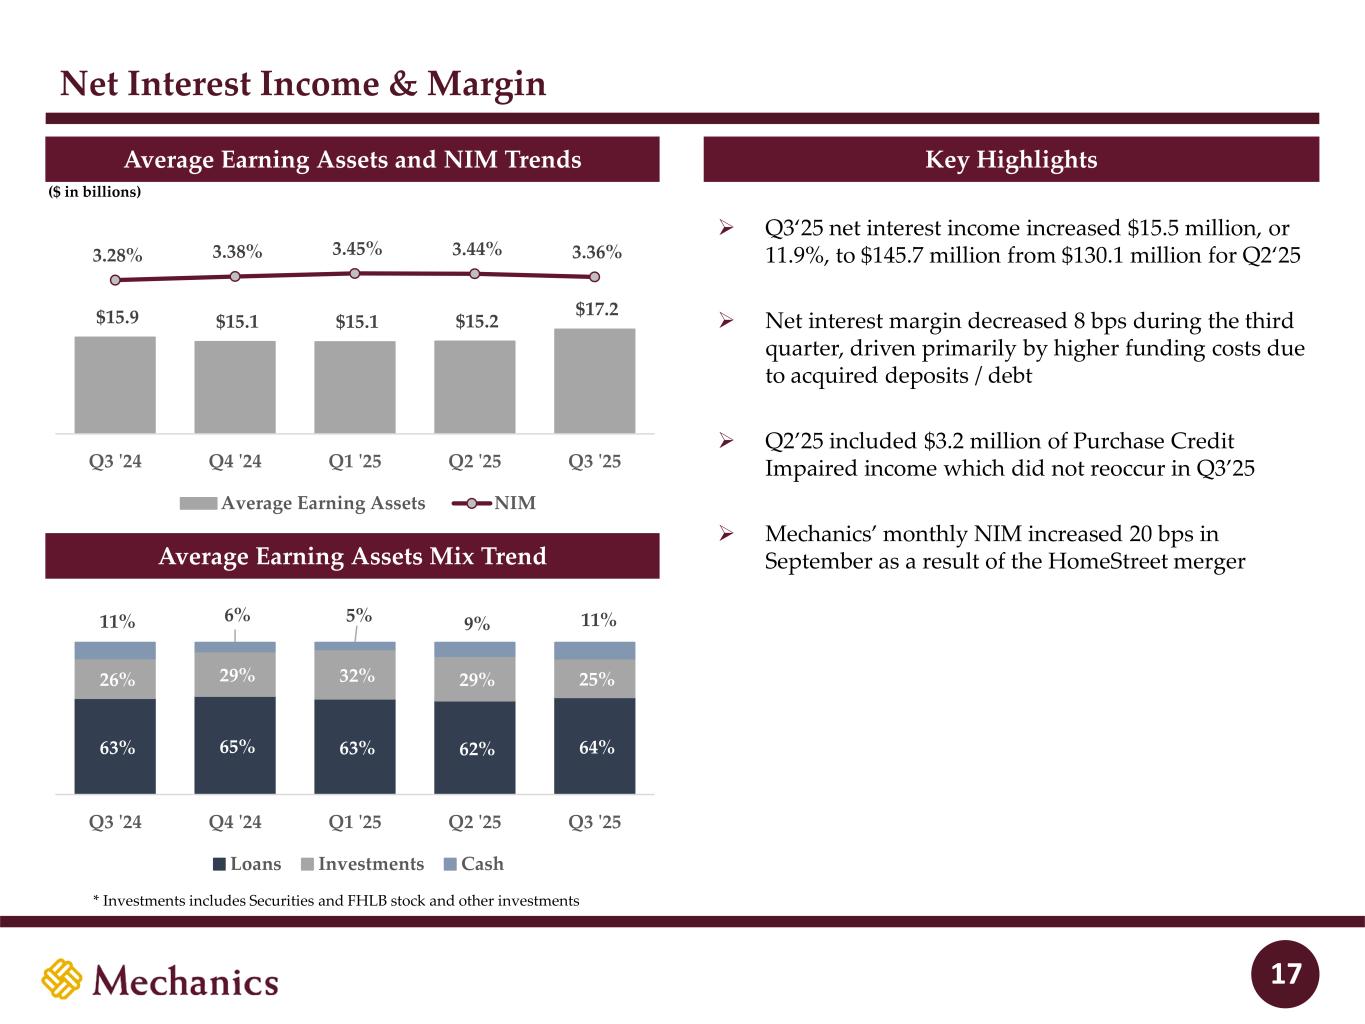
$15.9 $15.1 $15.1 $15.2 $17.2 3.28% 3.38% 3.45% 3.44% 3.36% Q3 '24 Q4 '24 Q1 '25 Q2 '25 Q3 '25 Average Earning Assets NIM Net Interest Income & Margin Average Earning Assets and NIM Trends Key Highlights 17 Average Earning Assets Mix Trend ($ in billions) ➢ Q3‘25 net interest income increased $15.5 million, or 11.9%, to $145.7 million from $130.1 million for Q2‘25 ➢ Net interest margin decreased 8 bps during the third quarter, driven primarily by higher funding costs due to acquired deposits / debt ➢ Q2’25 included $3.2 million of Purchase Credit Impaired income which did not reoccur in Q3’25 ➢ Mechanics’ monthly NIM increased 20 bps in September as a result of the HomeStreet merger 63% 65% 63% 62% 64% 26% 29% 32% 29% 25% 11% 6% 5% 9% 11% Q3 '24 Q4 '24 Q1 '25 Q2 '25 Q3 '25 Loans Investments Cash * Investments includes Securities and FHLB stock and other investments
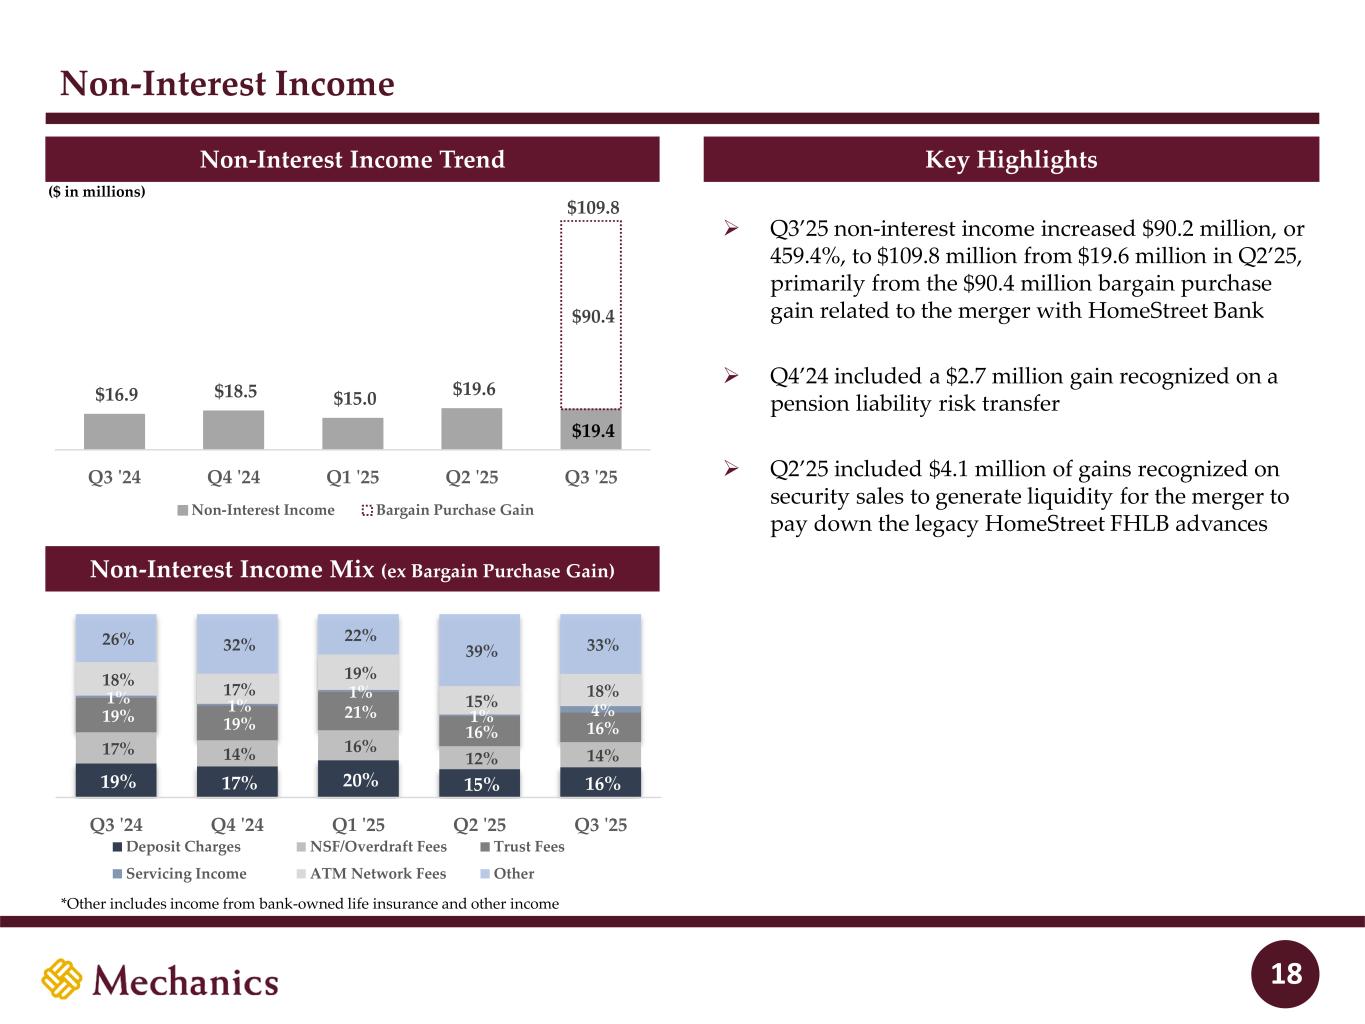
Non-Interest Income Non-Interest Income Trend Non-Interest Income Mix (ex Bargain Purchase Gain) Key Highlights 18 ($ in millions) ➢ Q3’25 non-interest income increased $90.2 million, or 459.4%, to $109.8 million from $19.6 million in Q2’25, primarily from the $90.4 million bargain purchase gain related to the merger with HomeStreet Bank ➢ Q4’24 included a $2.7 million gain recognized on a pension liability risk transfer ➢ Q2’25 included $4.1 million of gains recognized on security sales to generate liquidity for the merger to pay down the legacy HomeStreet FHLB advances $19.4 $90.4 $16.9 $18.5 $15.0 $19.6 $109.8 Q3 '24 Q4 '24 Q1 '25 Q2 '25 Q3 '25 Non-Interest Income Bargain Purchase Gain 19% 17% 20% 15% 16% 17% 14% 16% 12% 14% 19% 19% 21% 16% 16% 1% 1% 1% 1% 4% 18% 17% 19% 15% 18% 26% 32% 22% 39% 33% Q3 '24 Q4 '24 Q1 '25 Q2 '25 Q3 '25 Deposit Charges NSF/Overdraft Fees Trust Fees Servicing Income ATM Network Fees Other *Other includes income from bank-owned life insurance and other income
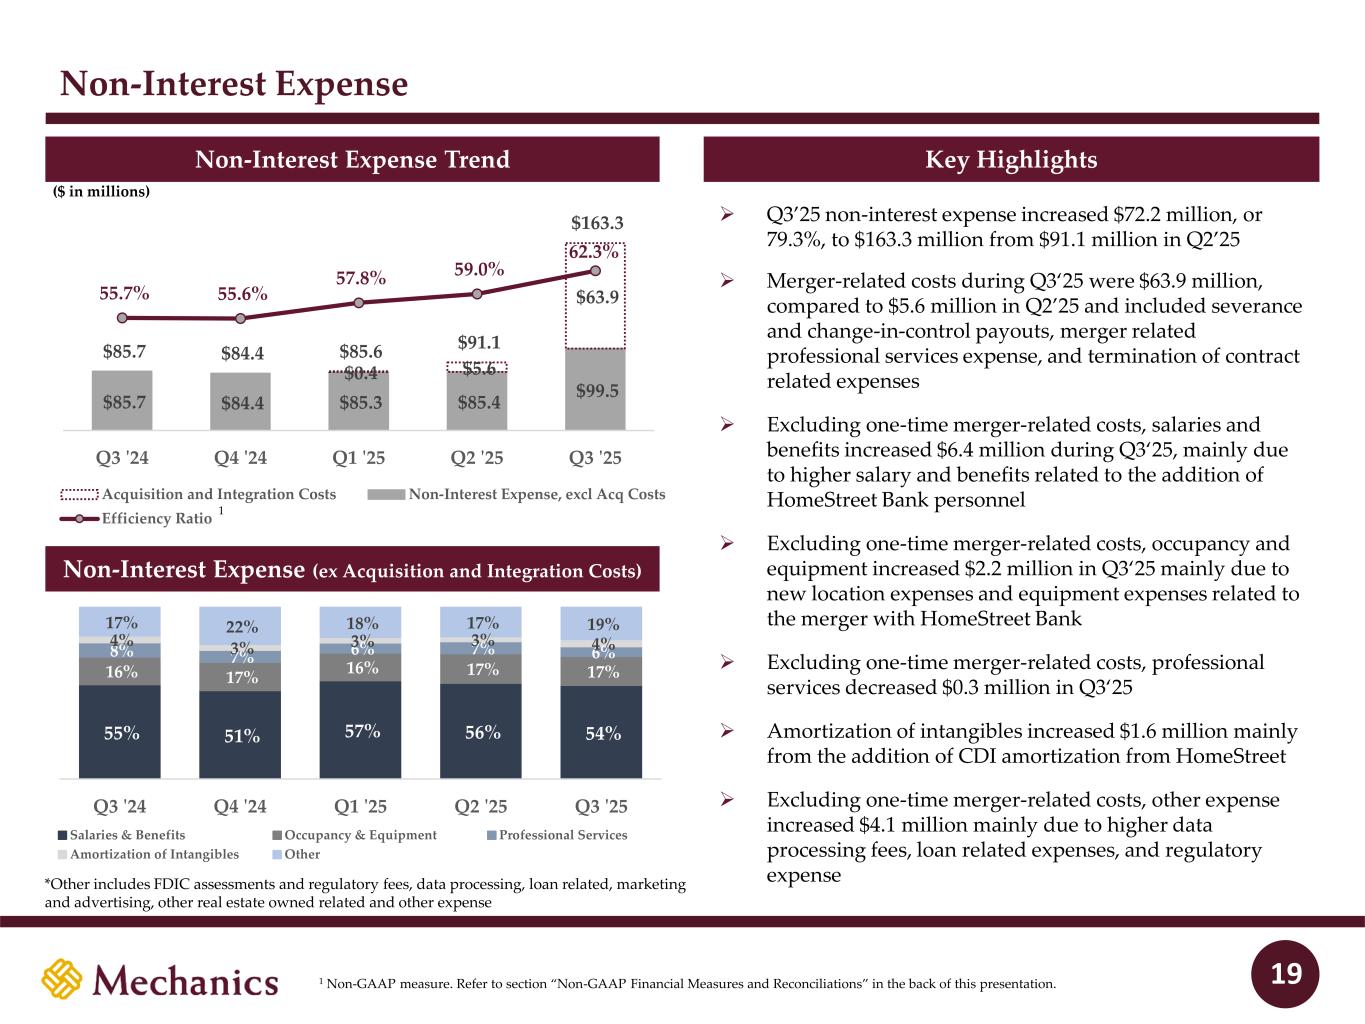
Non-Interest Expense Non-Interest Expense Trend Non-Interest Expense (ex Acquisition and Integration Costs) Key Highlights 19 ($ in millions) ➢ Q3’25 non-interest expense increased $72.2 million, or 79.3%, to $163.3 million from $91.1 million in Q2’25 ➢ Merger-related costs during Q3‘25 were $63.9 million, compared to $5.6 million in Q2’25 and included severance and change-in-control payouts, merger related professional services expense, and termination of contract related expenses ➢ Excluding one-time merger-related costs, salaries and benefits increased $6.4 million during Q3‘25, mainly due to higher salary and benefits related to the addition of HomeStreet Bank personnel ➢ Excluding one-time merger-related costs, occupancy and equipment increased $2.2 million in Q3‘25 mainly due to new location expenses and equipment expenses related to the merger with HomeStreet Bank ➢ Excluding one-time merger-related costs, professional services decreased $0.3 million in Q3‘25 ➢ Amortization of intangibles increased $1.6 million mainly from the addition of CDI amortization from HomeStreet ➢ Excluding one-time merger-related costs, other expense increased $4.1 million mainly due to higher data processing fees, loan related expenses, and regulatory expense 55% 51% 57% 56% 54% 16% 17% 16% 17% 17% 8% 7% 6% 7% 6% 4% 3% 3% 3% 4% 17% 22% 18% 17% 19% Q3 '24 Q4 '24 Q1 '25 Q2 '25 Q3 '25 Salaries & Benefits Occupancy & Equipment Professional Services Amortization of Intangibles Other *Other includes FDIC assessments and regulatory fees, data processing, loan related, marketing and advertising, other real estate owned related and other expense $85.7 $84.4 $85.3 $85.4 $99.5 $0.4 $5.6 $63.9 $85.7 $84.4 $85.6 $91.1 $163.3 55.7% 55.6% 57.8% 59.0% 62.3% Q3 '24 Q4 '24 Q1 '25 Q2 '25 Q3 '25 Acquisition and Integration Costs Non-Interest Expense, excl Acq Costs Efficiency Ratio 1 1 Non-GAAP measure. Refer to section “Non-GAAP Financial Measures and Reconciliations” in the back of this presentation.
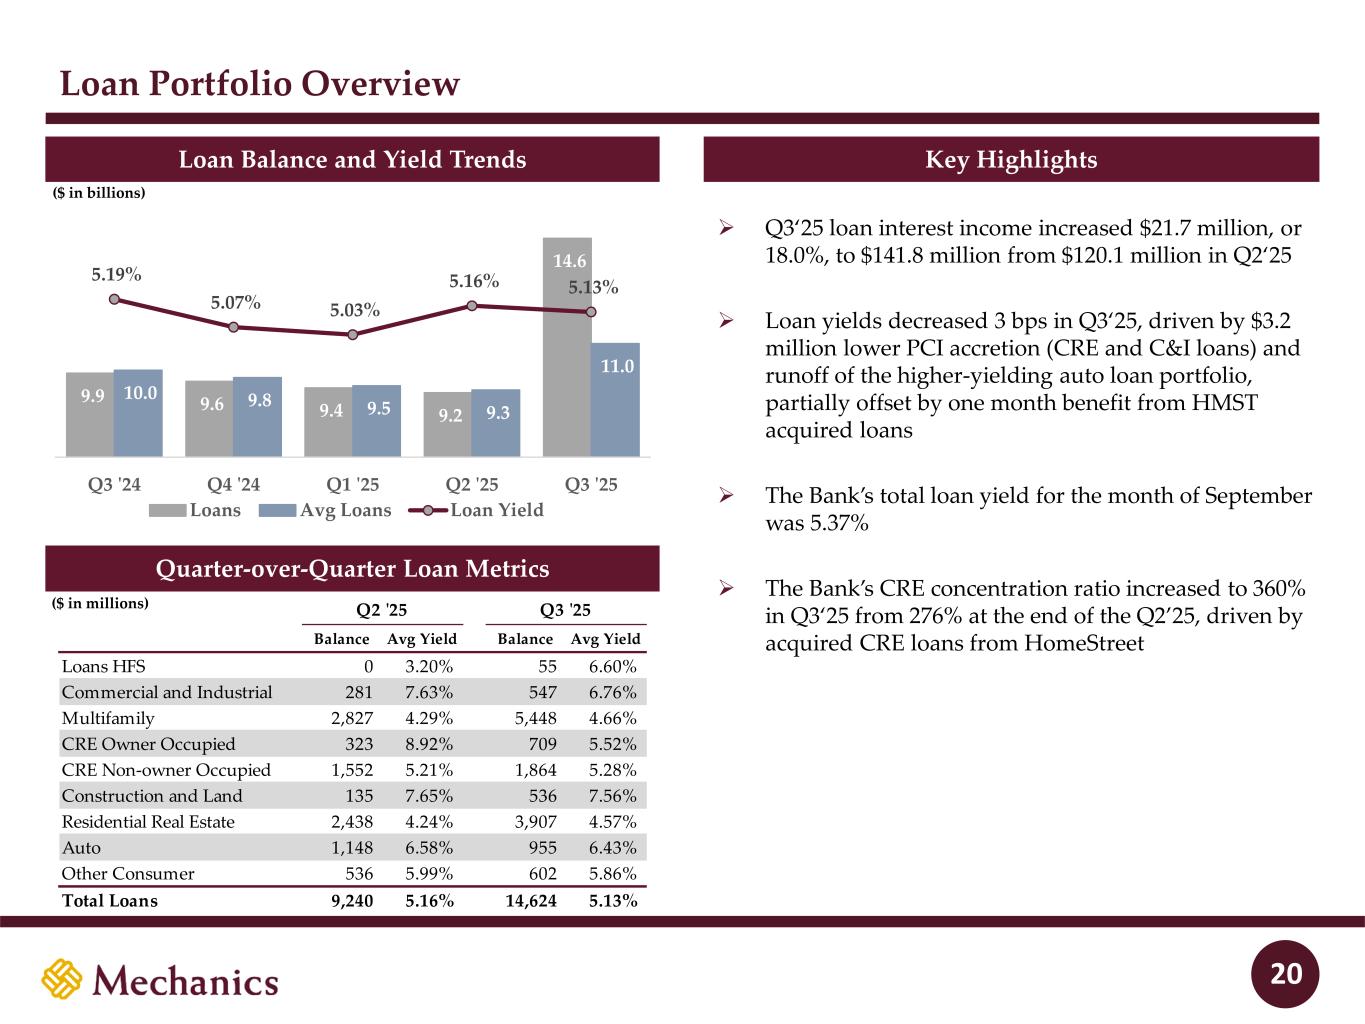
Loan Portfolio Overview Loan Balance and Yield Trends Quarter-over-Quarter Loan Metrics Key Highlights 20 9.9 9.6 9.4 9.2 14.6 10.0 9.8 9.5 9.3 11.0 5.19% 5.07% 5.03% 5.16% 5.13% Q3 '24 Q4 '24 Q1 '25 Q2 '25 Q3 '25 Loans Avg Loans Loan Yield ($ in billions) ($ in millions) ➢ Q3‘25 loan interest income increased $21.7 million, or 18.0%, to $141.8 million from $120.1 million in Q2‘25 ➢ Loan yields decreased 3 bps in Q3‘25, driven by $3.2 million lower PCI accretion (CRE and C&I loans) and runoff of the higher-yielding auto loan portfolio, partially offset by one month benefit from HMST acquired loans ➢ The Bank’s total loan yield for the month of September was 5.37% ➢ The Bank’s CRE concentration ratio increased to 360% in Q3‘25 from 276% at the end of the Q2’25, driven by acquired CRE loans from HomeStreet Q2 '25 Q3 '25 Balance Avg Yield Balance Avg Yield Loans HFS 0 3.20% 55 6.60% Commercial and Industrial 281 7.63% 547 6.76% Multifamily 2,827 4.29% 5,448 4.66% CRE Owner Occupied 323 8.92% 709 5.52% CRE Non-owner Occupied 1,552 5.21% 1,864 5.28% Construction and Land 135 7.65% 536 7.56% Residential Real Estate 2,438 4.24% 3,907 4.57% Auto 1,148 6.58% 955 6.43% Other Consumer 536 5.99% 602 5.86% Total Loans 9,240 5.16% 14,624 5.13%
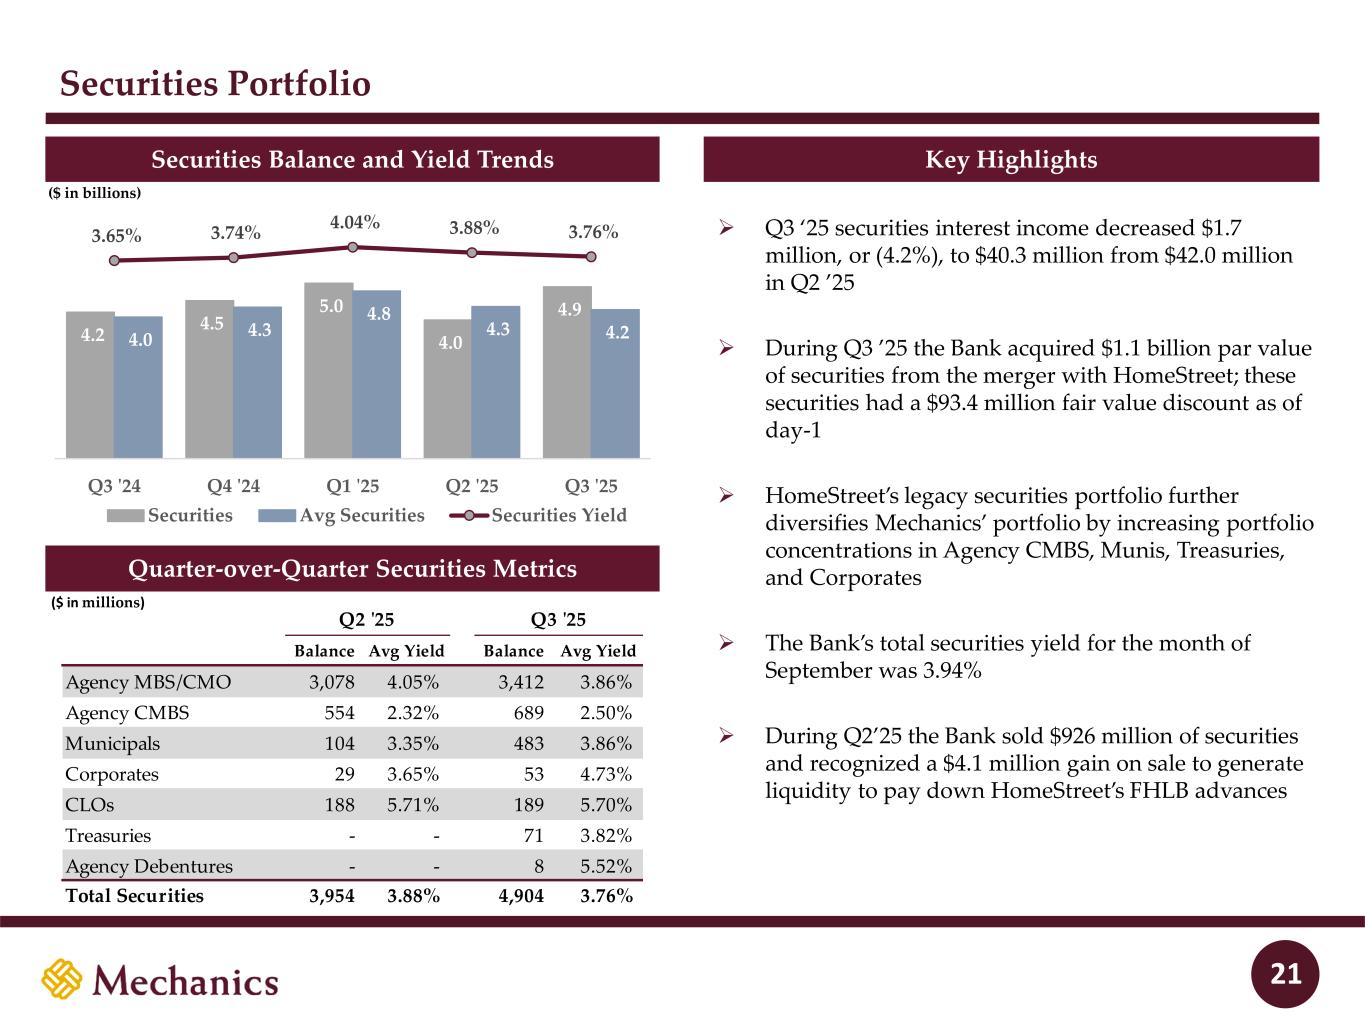
Securities Portfolio Securities Balance and Yield Trends Quarter-over-Quarter Loan Metrics Key Highlights Quarte -over-Quarte Securities Metrics 21 4.2 4.5 5.0 4.0 4.9 4.0 4.3 4.8 4.3 4.2 3.65% 3.74% 4.04% 3.88% 3.76% Q3 '24 Q4 '24 Q1 '25 Q2 '25 Q3 '25 Securities Avg Securities Securities Yield ($ in billions) ($ in millions) Q2 '25 Q3 '25 Balance Avg Yield Balance Avg Yield Agency MBS/CMO 3,078 4.05% 3,412 3.86% Agency CMBS 554 2.32% 689 2.50% Municipals 104 3.35% 483 3.86% Corporates 29 3.65% 53 4.73% CLOs 188 5.71% 189 5.70% Treasuries - - 71 3.82% Agency Debentures - - 8 5.52% Total Securities 3,954 3.88% 4,904 3.76% ➢ Q3 ‘25 securities interest income decreased $1.7 million, or (4.2%), to $40.3 million from $42.0 million in Q2 ’25 ➢ During Q3 ’25 the Bank acquired $1.1 billion par value of securities from the merger with HomeStreet; these securities had a $93.4 million fair value discount as of day-1 ➢ HomeStreet’s legacy securities portfolio further diversifies Mechanics’ portfolio by increasing portfolio concentrations in Agency CMBS, Munis, Treasuries, and Corporates ➢ The Bank’s total securities yield for the month of September was 3.94% ➢ During Q2’25 the Bank sold $926 million of securities and recognized a $4.1 million gain on sale to generate liquidity to pay down HomeStreet’s FHLB advances
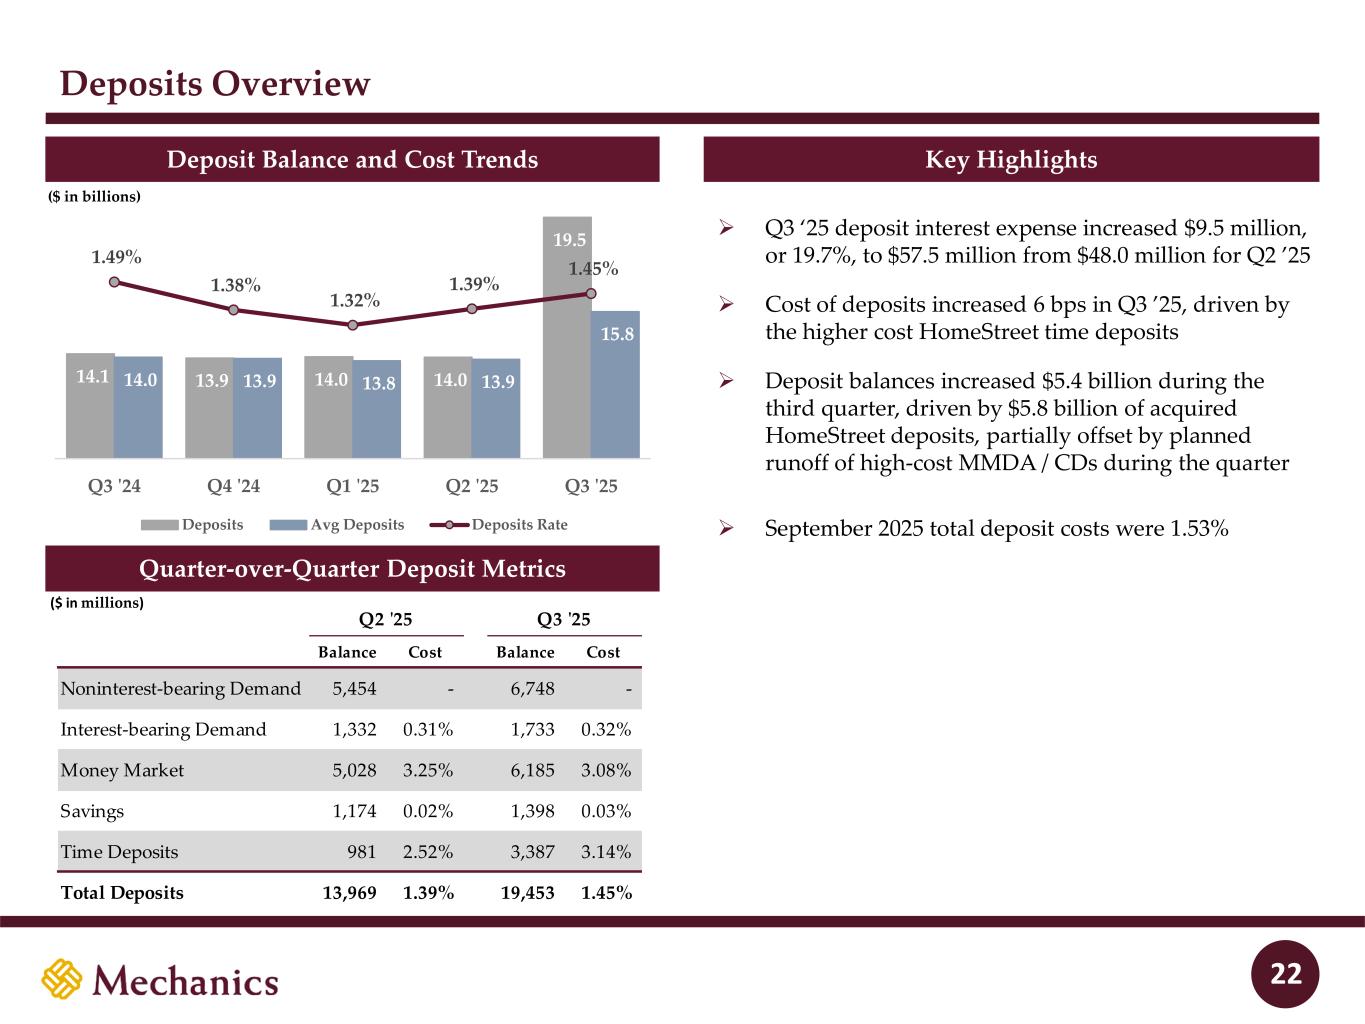
Deposits Overview Deposit Balance and Cost Trends Quarter-over-Quarter Loan Metrics Key Highlights Quarter-over-Quarter Deposit Metrics 22 14.1 13.9 14.0 14.0 19.5 14.0 13.9 13.8 13.9 15.8 1.49% 1.38% 1.32% 1.39% 1.45% Q3 '24 Q4 '24 Q1 '25 Q2 '25 Q3 '25 Deposits Avg Deposits Deposits Rate ($ in billions) ($ in millions) Q2 '25 Q3 '25 Balance Cost Balance Cost Noninterest-bearing Demand 5,454 - 6,748 - Interest-bearing Demand 1,332 0.31% 1,733 0.32% Money Market 5,028 3.25% 6,185 3.08% Savings 1,174 0.02% 1,398 0.03% Time Deposits 981 2.52% 3,387 3.14% Total Deposits 13,969 1.39% 19,453 1.45% ➢ Q3 ‘25 deposit interest expense increased $9.5 million, or 19.7%, to $57.5 million from $48.0 million for Q2 ’25 ➢ Cost of deposits increased 6 bps in Q3 ’25, driven by the higher cost HomeStreet time deposits ➢ Deposit balances increased $5.4 billion during the third quarter, driven by $5.8 billion of acquired HomeStreet deposits, partially offset by planned runoff of high-cost MMDA / CDs during the quarter ➢ September 2025 total deposit costs were 1.53%
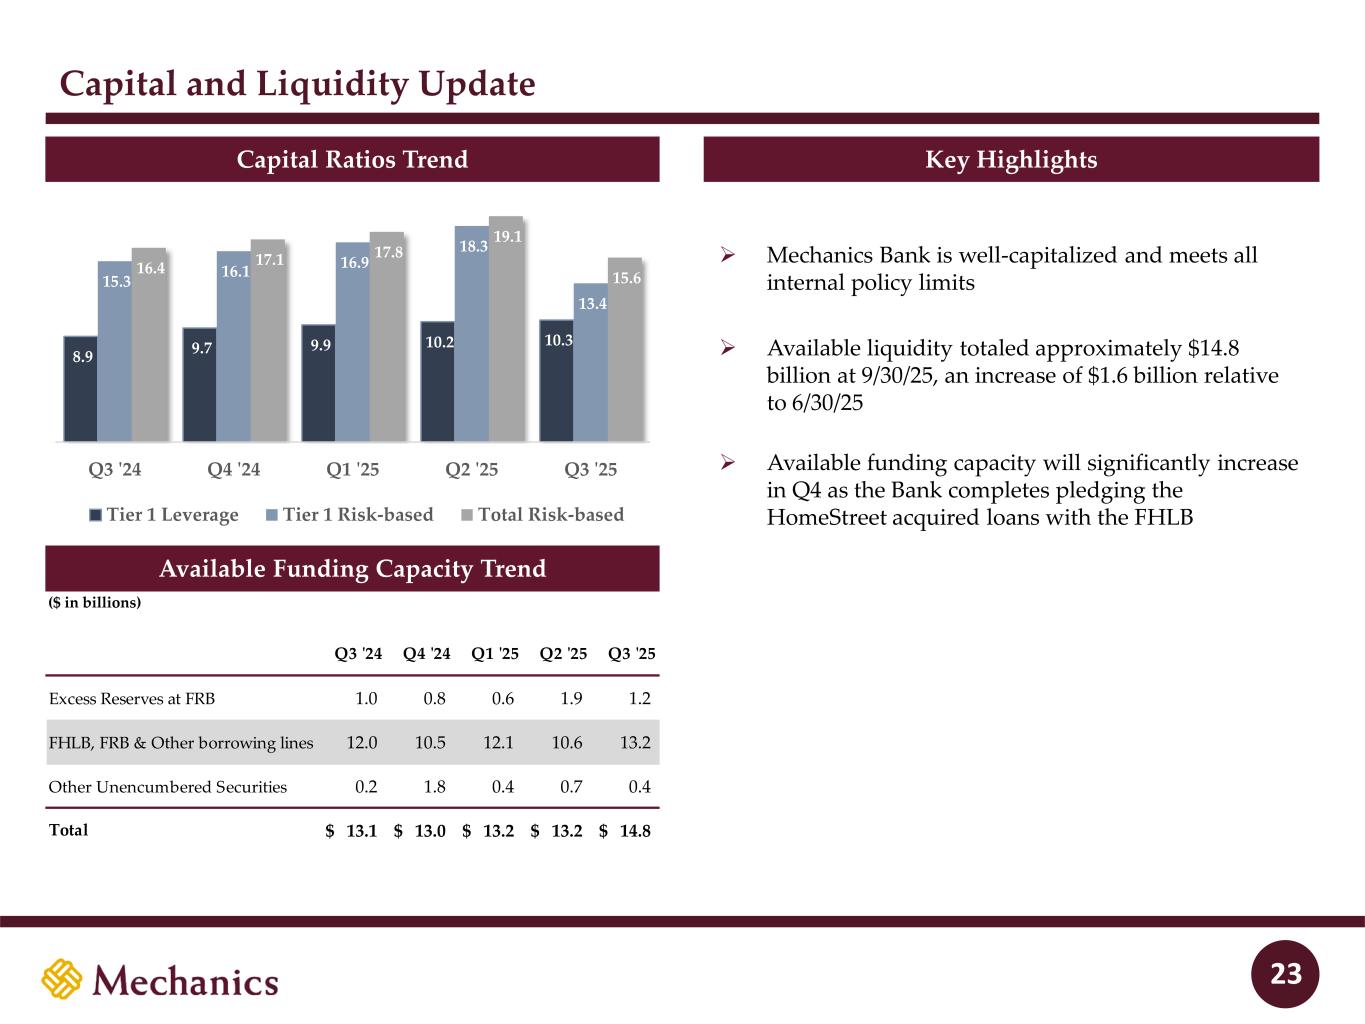
➢ Mechanics Bank is well-capitalized and meets all internal policy limits ➢ Available liquidity totaled approximately $14.8 billion at 9/30/25, an increase of $1.6 billion relative to 6/30/25 ➢ Available funding capacity will significantly increase in Q4 as the Bank completes pledging the HomeStreet acquired loans with the FHLB Capital and Liquidity Update Capital Ratios Trend Quarter-over-Quarter Loan Metrics Key Highlights Av ilable Funding Capacity Trend 23 ($ in billions) 8.9 9.7 9.9 10.2 10.3 15.3 16.1 16.9 18.3 13.4 16.4 17.1 17.8 19.1 15.6 Q3 '24 Q4 '24 Q1 '25 Q2 '25 Q3 '25 Tier 1 Leverage Tier 1 Risk-based Total Risk-based Q3 '24 Q4 '24 Q1 '25 Q2 '25 Q3 '25 Excess Reserves at FRB 1.0 0.8 0.6 1.9 1.2 FHLB, FRB & Other borrowing lines 12.0 10.5 12.1 10.6 13.2 Other Unencumbered Securities 0.2 1.8 0.4 0.7 0.4 Total 13.1$ 13.0$ 13.2$ 13.2$ 14.8$
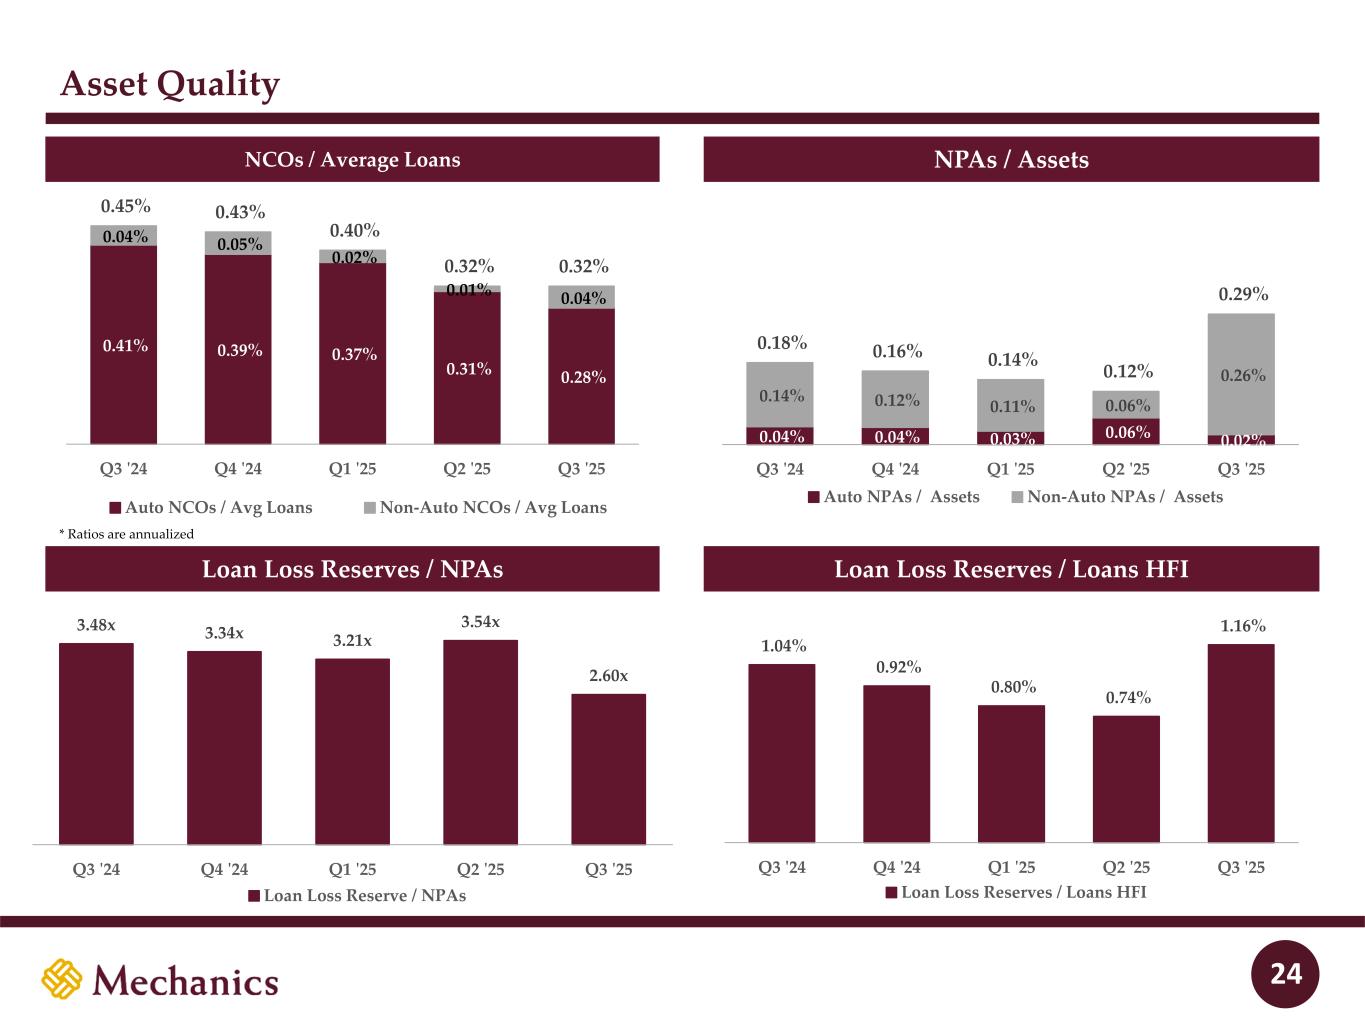
Asset Quality NCOs / Average Loans Loan Loss Reserves / NPAs NPAs / Assets Loan Loss Reserves / Loans HFI 24 0.41% 0.39% 0.37% 0.31% 0.28% 0.04% 0.05% 0.02% 0.01% 0.04% 0.45% 0.43% 0.40% 0.32% 0.32% Q3 '24 Q4 '24 Q1 '25 Q2 '25 Q3 '25 Auto NCOs / Avg Loans Non-Auto NCOs / Avg Loans 1.04% 0.92% 0.80% 0.74% 1.16% Q3 '24 Q4 '24 Q1 '25 Q2 '25 Q3 '25 Loan Loss Reserves / Loans HFI 0.04% 0.04% 0.03% 0.06% 0.02% 0.14% 0.12% 0.11% 0.06% 0.26% 0.18% 0.16% 0.14% 0.12% 0.29% Q3 '24 Q4 '24 Q1 '25 Q2 '25 Q3 '25 Auto NPAs / Assets Non-Auto NPAs / Assets 3.48x 3.34x 3.21x 3.54x 2.60x Q3 '24 Q4 '24 Q1 '25 Q2 '25 Q3 '25 Loan Loss Reserve / NPAs * Ratios are annualized
Appendix 25
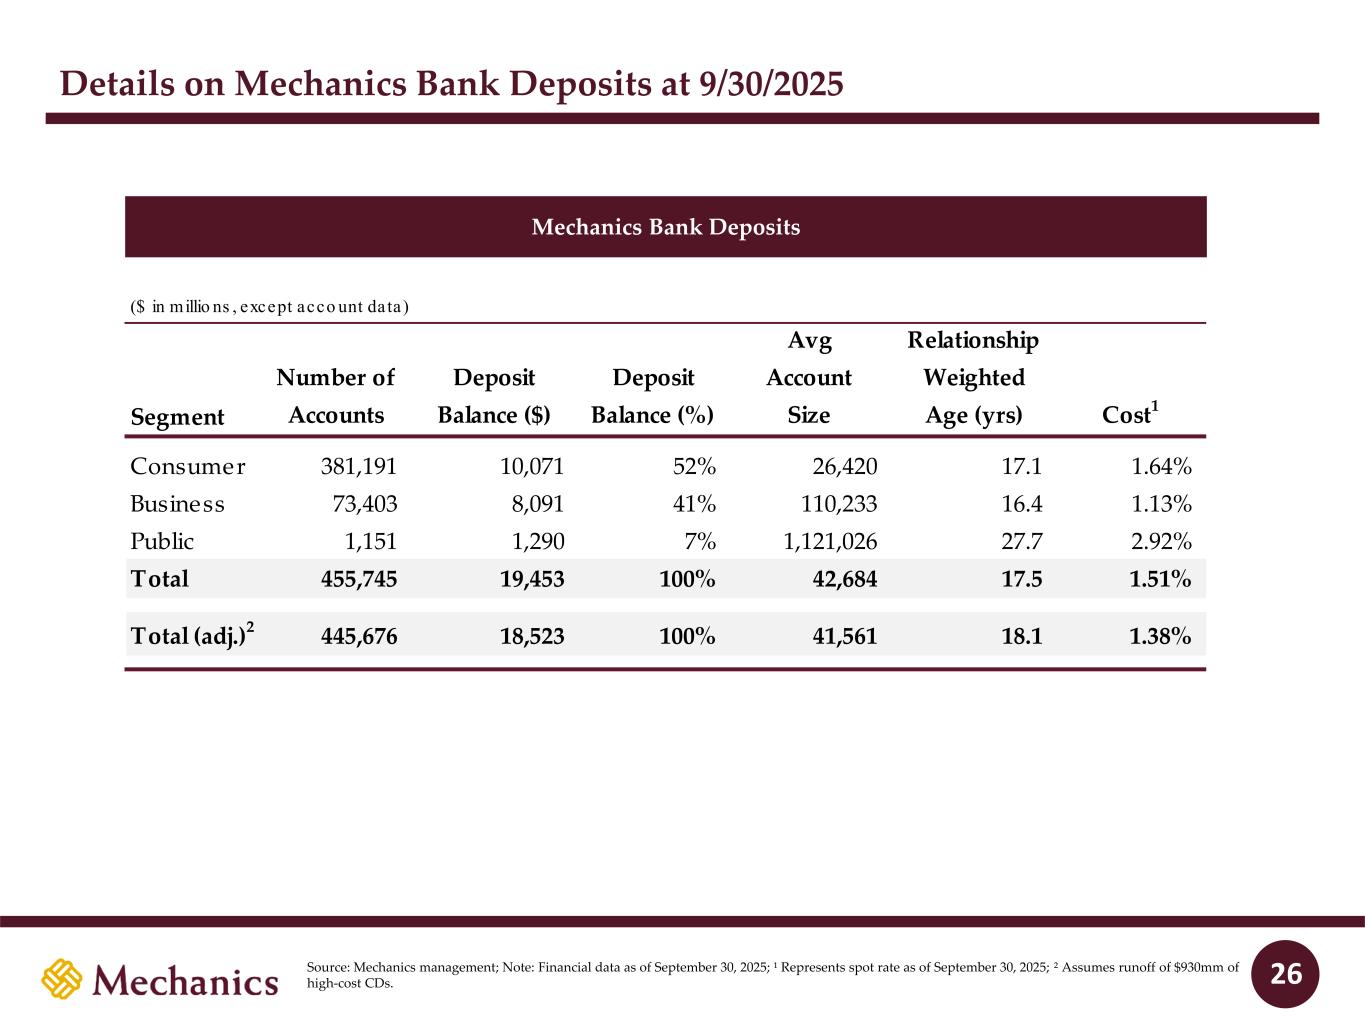
Details on Mechanics Bank Deposits at 9/30/2025 26Source: Mechanics management; Note: Financial data as of September 30, 2025; ¹ Represents spot rate as of September 30, 2025; ² Assumes runoff of $930mm of high-cost CDs. Mechanics Bank Deposits ($ in millio ns , except acco unt da ta) Segment Number of Accounts Deposit Balance ($) Deposit Balance (%) Avg Account Size Relationship Weighted Age (yrs) Cost1 Consumer 381,191 10,071 52% 26,420 17.1 1.64% Business 73,403 8,091 41% 110,233 16.4 1.13% Public 1,151 1,290 7% 1,121,026 27.7 2.92% Total 455,745 19,453 100% 42,684 17.5 1.51% Total (adj.)2 445,676 18,523 100% 41,561 18.1 1.38%
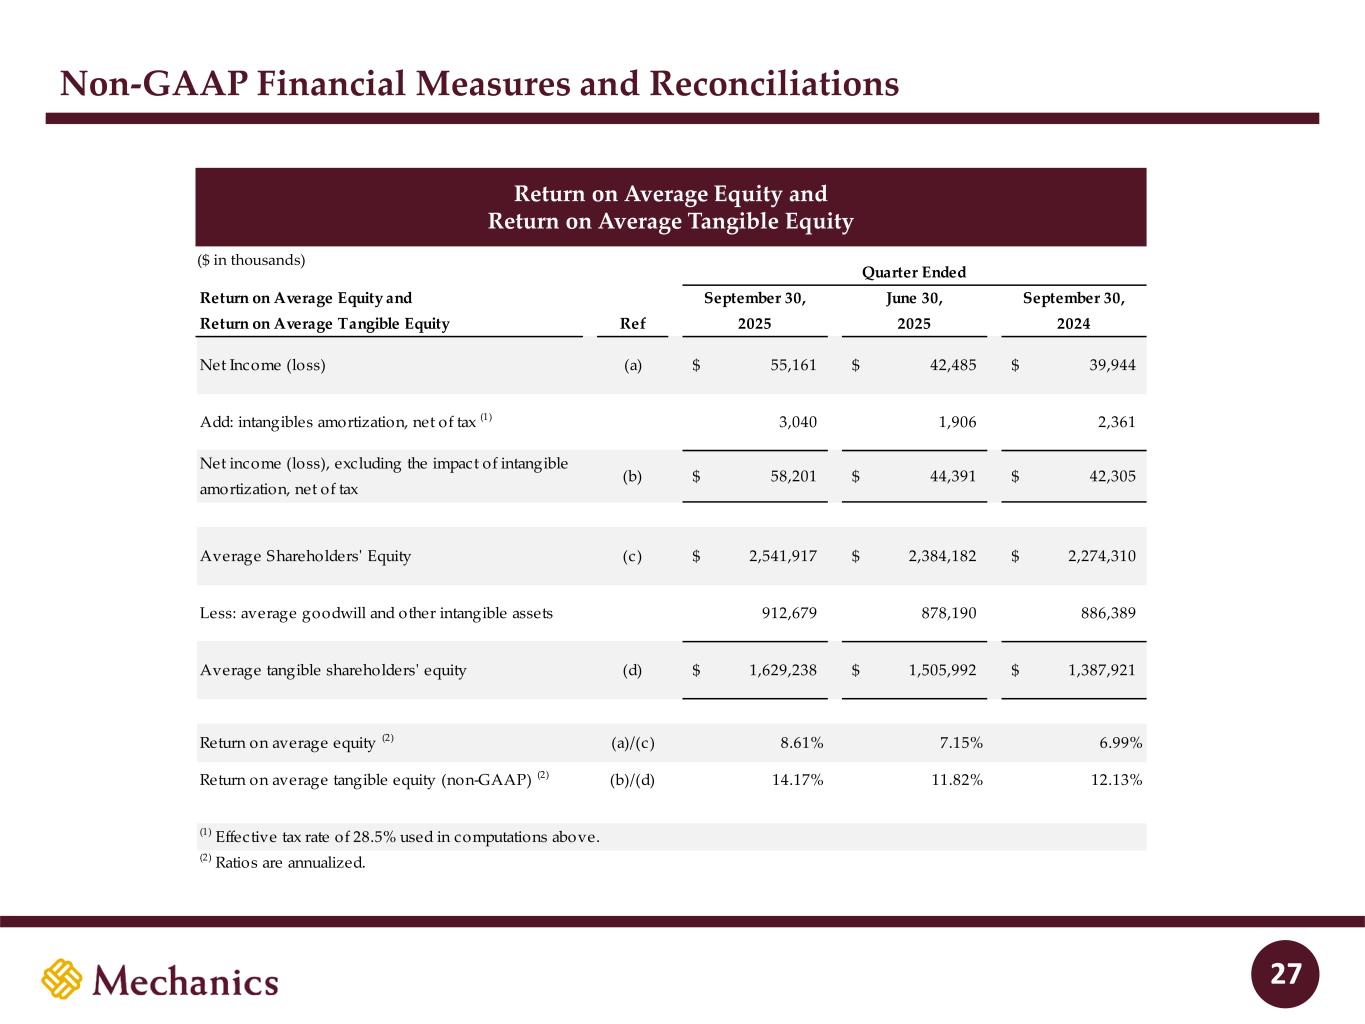
Non-GAAP Financial Measures and Reconciliations Return on Average Equity and Return on Average Tangible Equity 27 Return on Average Equity and Return on Average Tangible Equity Ref September 30, 2025 June 30, 2025 September 30, 2024 Net Income (loss) (a) 55,161$ 42,485$ 39,944$ Add: intangibles amortization, net of tax (1) 3,040 1,906 2,361 Net income (loss), excluding the impact of intangible amortization, net of tax (b) 58,201$ 44,391$ 42,305$ Average Shareholders' Equity (c) 2,541,917$ 2,384,182$ 2,274,310$ Less: average goodwill and other intangible assets 912,679 878,190 886,389 Average tangible shareholders' equity (d) 1,629,238$ 1,505,992$ 1,387,921$ Return on average equity (2) (a)/(c) 8.61% 7.15% 6.99% Return on average tangible equity (non-GAAP) (2) (b)/(d) 14.17% 11.82% 12.13% (1) Effective tax rate of 28.5% used in computations above. (2) Ratios are annualized. Quarter Ended ($ in thousands)
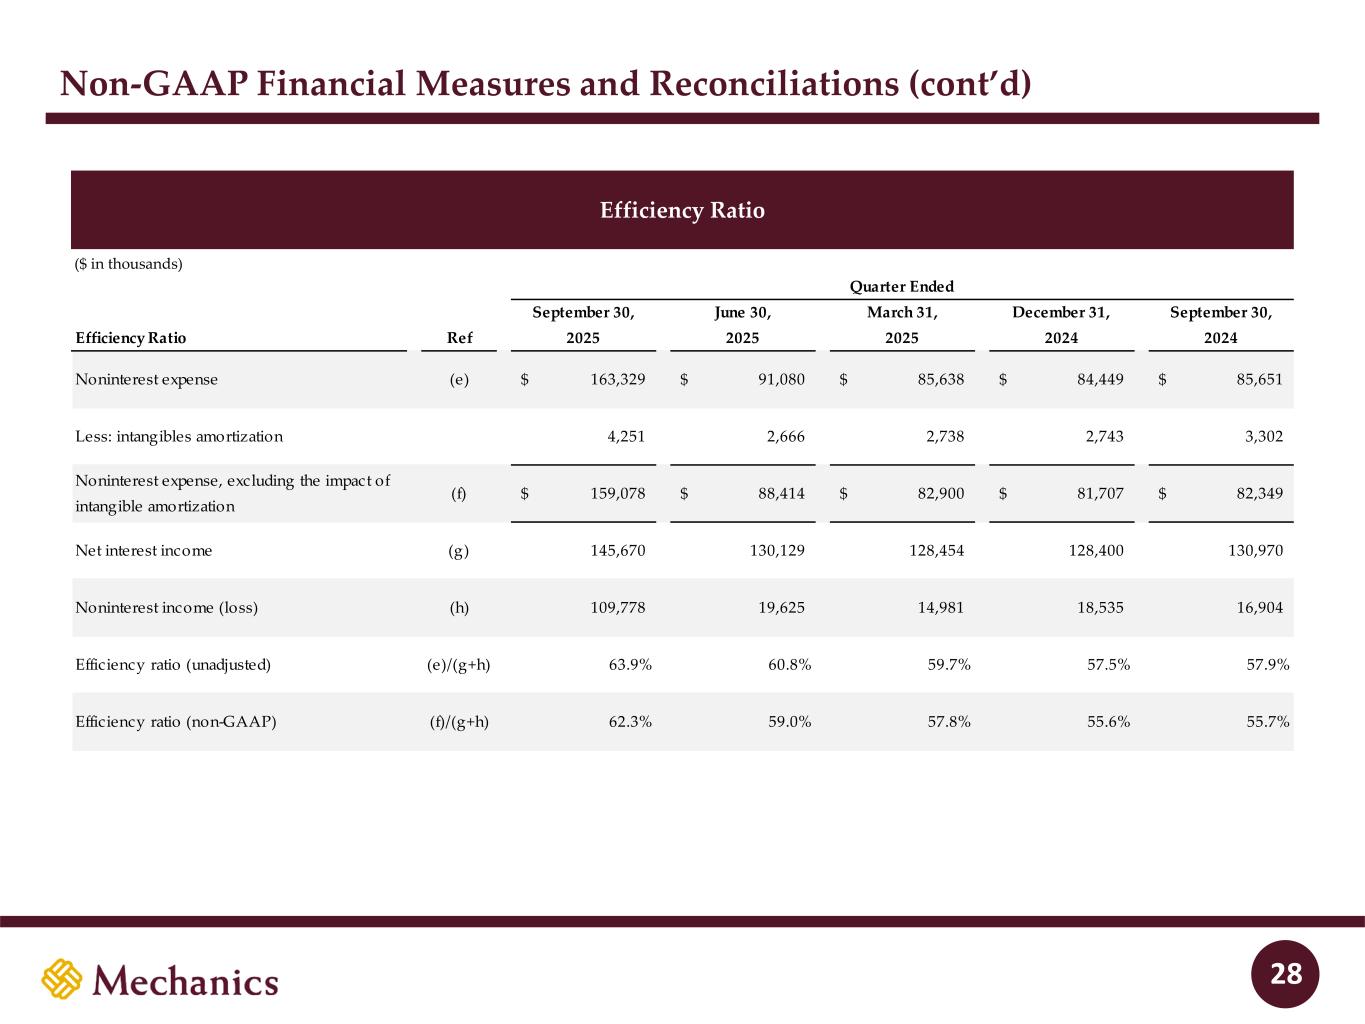
Non-GAAP Financial Measures and Reconciliations (cont’d) Efficiency Ratio 28 Efficiency Ratio Ref September 30, 2025 June 30, 2025 March 31, 2025 December 31, 2024 September 30, 2024 Noninterest expense (e) 163,329$ 91,080$ 85,638$ 84,449$ 85,651$ Less: intangibles amortization 4,251 2,666 2,738 2,743 3,302 Noninterest expense, excluding the impact of intangible amortization (f) 159,078$ 88,414$ 82,900$ 81,707$ 82,349$ Net interest income (g) 145,670 130,129 128,454 128,400 130,970 Noninterest income (loss) (h) 109,778 19,625 14,981 18,535 16,904 Efficiency ratio (unadjusted) (e)/(g+h) 63.9% 60.8% 59.7% 57.5% 57.9% Efficiency ratio (non-GAAP) (f)/(g+h) 62.3% 59.0% 57.8% 55.6% 55.7% Quarter Ended ($ in thousands)
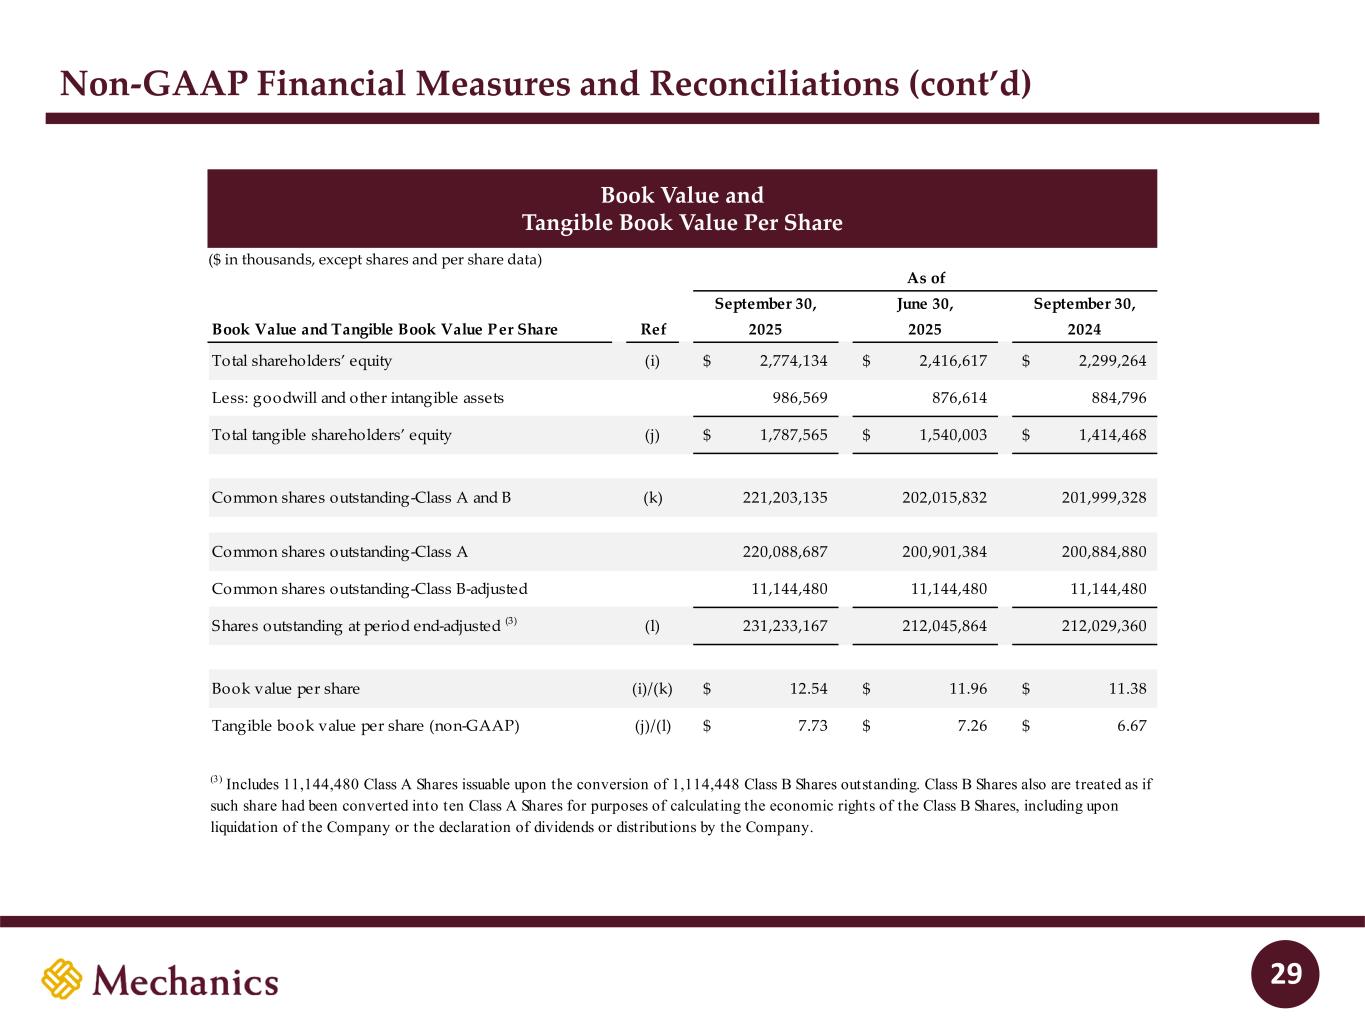
Non-GAAP Financial Measures and Reconciliations (cont’d) Book Value and Tangible Book Value Per Share 29 As of Book Value and Tangible Book Value Per Share Ref September 30, 2025 June 30, 2025 September 30, 2024 Total shareholders’ equity (i) 2,774,134$ 2,416,617$ 2,299,264$ Less: goodwill and other intangible assets 986,569 876,614 884,796 Total tangible shareholders’ equity (j) 1,787,565$ 1,540,003$ 1,414,468$ Common shares outstanding-Class A and B (k) 221,203,135 202,015,832 201,999,328 Common shares outstanding-Class A 220,088,687 200,901,384 200,884,880 Common shares outstanding-Class B-adjusted 11,144,480 11,144,480 11,144,480 Shares outstanding at period end-adjusted (3) (l) 231,233,167 212,045,864 212,029,360 Book value per share (i)/(k) 12.54$ 11.96$ 11.38$ Tangible book value per share (non-GAAP) (j)/(l) 7.73$ 7.26$ 6.67$ (3) Includes 11,144,480 Class A Shares issuable upon the conversion of 1,114,448 Class B Shares outstanding. Class B Shares also are treated as if such share had been converted into ten Class A Shares for purposes of calculating the economic rights of the Class B Shares, including upon liquidation of the Company or the declaration of dividends or distributions by the Company. ($ in thousands, except shares and per share data)
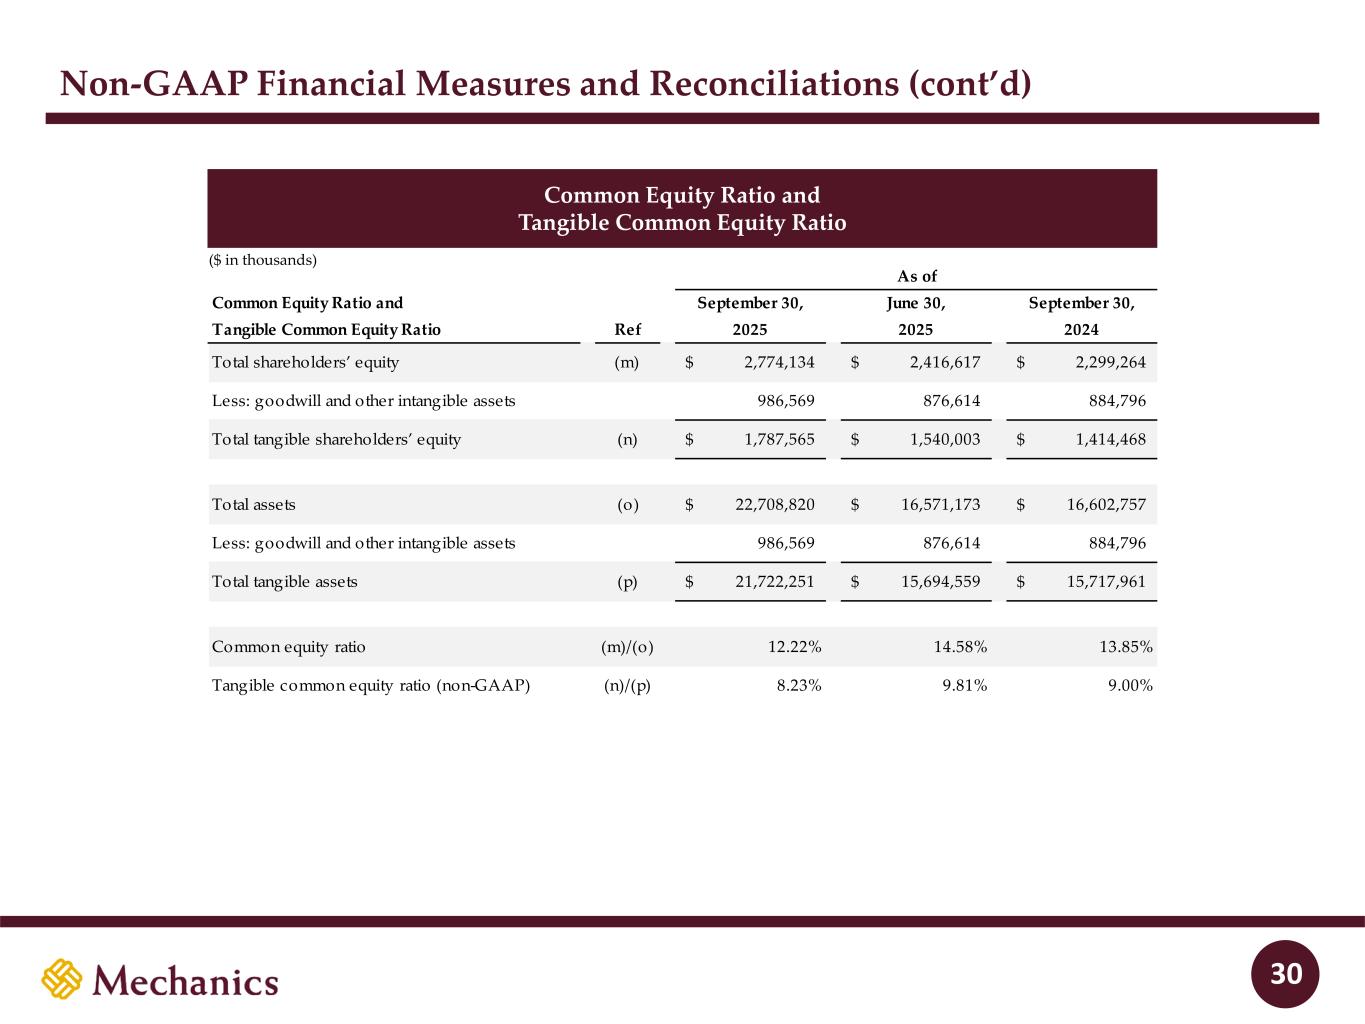
Non-GAAP Financial Measures and Reconciliations (cont’d) Common Equity Ratio and Tangible Common Equity Ratio 30 As of Common Equity Ratio and Tangible Common Equity Ratio Ref September 30, 2025 June 30, 2025 September 30, 2024 Total shareholders’ equity (m) 2,774,134$ 2,416,617$ 2,299,264$ Less: goodwill and other intangible assets 986,569 876,614 884,796 Total tangible shareholders’ equity (n) 1,787,565$ 1,540,003$ 1,414,468$ Total assets (o) 22,708,820$ 16,571,173$ 16,602,757$ Less: goodwill and other intangible assets 986,569 876,614 884,796 Total tangible assets (p) 21,722,251$ 15,694,559$ 15,717,961$ Common equity ratio (m)/(o) 12.22% 14.58% 13.85% Tangible common equity ratio (non-GAAP) (n)/(p) 8.23% 9.81% 9.00% ($ in thousands)