| Global Net Lease Third Quarter 2025 Investor Presentation Pictured: Home Depot in Lake Park, Georgia |

| Forward Looking Statements This presentation contains statements that are not historical facts and may be forward-looking statements within the meaning of the Private Securities Litigation Reform Act of 1995, including statements regarding the timing, ability to consummate and consideration related to our anticipated acquisitions and dispositions, the intent, belief or current expectations of us, our operating partnership and members of our management team, as well as the assumptions on which such statements are based, and generally are identified by the use of words such as “may,” “will,” “seeks,” “anticipates,” “believes,” “expects,” “estimates,” “projects,” “potential,” “predicts,” “plans,” “intends,” “would,” “could,” “should” or similar expressions are intended to identify forward-looking statements, although not all forward-looking statements contain these identifying words. These forward-looking statements are subject to risks, uncertainties, and other factors, many of which are outside of our control, which could cause actual results to differ materially from the results contemplated by the forward-looking statements. These risks and uncertainties include the risks that any potential future acquisition or disposition by us is subject to market conditions, capital availability and timing considerations and may not be identified or completed on favorable terms, or at all. Some of the risks and uncertainties, although not all risks and uncertainties, that could cause our actual results to differ materially from those presented in our forward-looking statements are set forth under “Risk Factors” and “Quantitative and Qualitative Disclosures about Market Risk” sections in our Annual Report on Form 10-K, our Quarterly Reports on Form 10-Q and our other filings with the U.S Securities and Exchange Commission (“SEC”) as such risks, uncertainties and other important factors may be updated from time to time in our subsequent reports. Further, forward-looking statements speak only as of the date they are made, and we undertake no obligation to update or revise any forward-looking statement to reflect changed assumptions, the occurrence of unanticipated events or changes to future operating results over time, unless required by law. Projections This presentation also includes estimated projections of future operating results. These projections are not prepared in accordance with published guidelines of the SEC or the guidelines established by the American Institute of Certified Public Accountants for preparation and presentation of financial projections. This information is not fact and should not be relied upon as being necessarily indicative of future results; the projections were prepared in good faith by management and are based on numerous assumptions that may prove to be wrong. All such statements, including but not limited to estimates of value accretion, synergies, run-rate or annualized figures and results of future operations after making adjustments to give effect to assumed future operations reflect assumptions as to certain business decisions and events that are subject to change. As a result, actual results may differ materially from those contained in the estimates. Accordingly, there can be no assurance that the estimates will be realized, or that the projections described in this presentation will be realized at all. This presentation also contains estimates and information concerning our industry and tenants, including market position, market size and growth rates of the markets in which we operate, that are based on industry publications and other third-party reports. This information involves a number of assumptions and limitations, and you are cautioned not to give undue weight to these estimates. We have not independently verified the accuracy or completeness of the data contained in these publications and reports. The industry in which we operate is subject to a high degree of uncertainty and risk due to a variety of factors, including those described in the “Risk Factors”, “Management’s Discussion and Analysis of Financial Condition and Results of Operations” and “Quantitative and Qualitative Disclosures about Market Risk” sections of the Company’s Annual Report on Form 10-K, and all of its other filings with the SEC, as such risks, uncertainties and other important factors may be updated from time to time in the Company’s subsequent reports. Credit Ratings A securities rating is not a recommendation to buy, sell or hold securities and may be subject to revision or withdrawal at any time. Each rating agency has its own methodology of assigning ratings and, accordingly, each rating should be evaluated independently of any other rating. Q3 2025 2 |
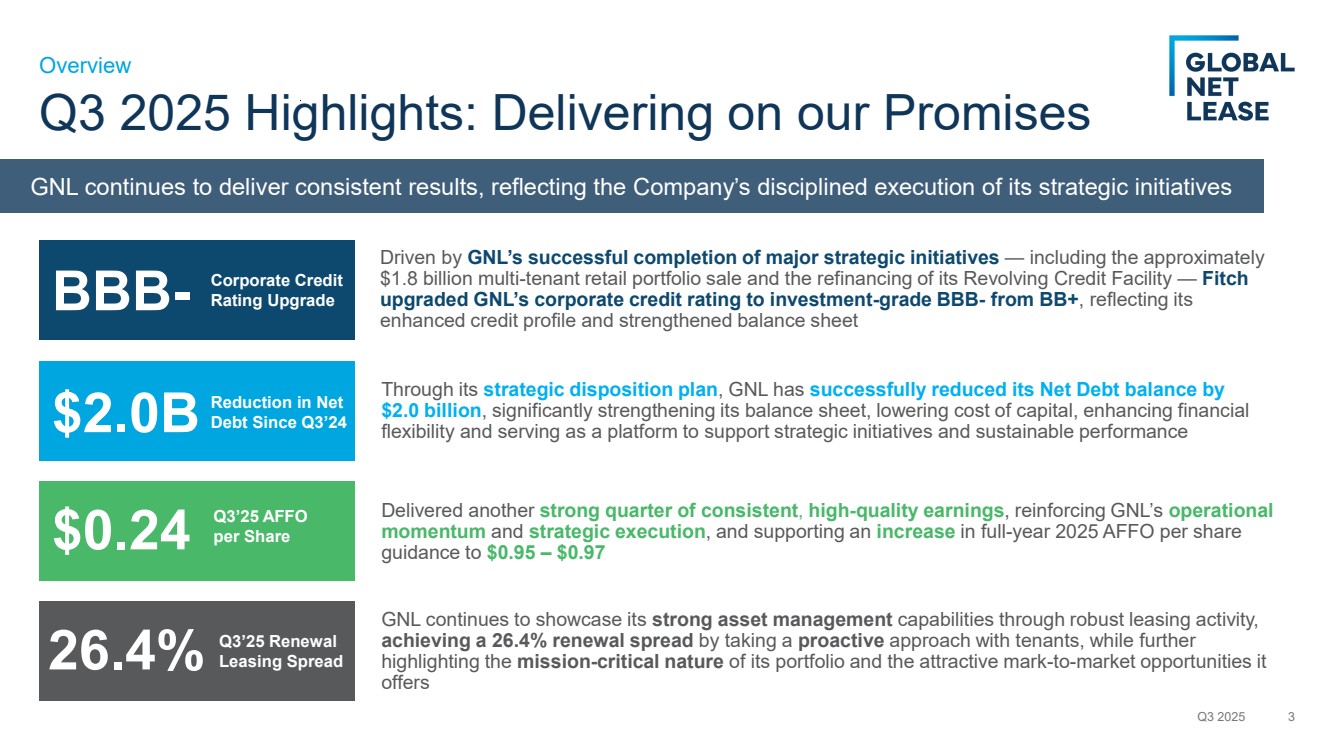
| Q3 2025 Highlights: Delivering on our Promises Driven by GNL’s successful completion of major strategic initiatives — including the approximately $1.8 billion multi-tenant retail portfolio sale and the refinancing of its Revolving Credit Facility — Fitch upgraded GNL’s corporate credit rating to investment-grade BBB- from BB+, reflecting its enhanced credit profile and strengthened balance sheet Q3 2025 3 Overview BBB-Corporate Credit Rating Upgrade $2.0B Reduction in Net Debt Since Q3’24 $0.24 Q3’25 AFFO per Share 26.4% Q3’25 Renewal Leasing Spread Through its strategic disposition plan, GNL has successfully reduced its Net Debt balance by $2.0 billion, significantly strengthening its balance sheet, lowering cost of capital, enhancing financial flexibility and serving as a platform to support strategic initiatives and sustainable performance Delivered another strong quarter of consistent, high-quality earnings, reinforcing GNL’s operational momentum and strategic execution, and supporting an increase in full-year 2025 AFFO per share guidance to $0.95 – $0.97 GNL continues to showcase its strong asset management capabilities through robust leasing activity, achieving a 26.4% renewal spread by taking a proactive approach with tenants, while further highlighting the mission-critical nature of its portfolio and the attractive mark-to-market opportunities it offers GNL continues to deliver consistent results, reflecting the Company’s disciplined execution of its strategic initiatives |
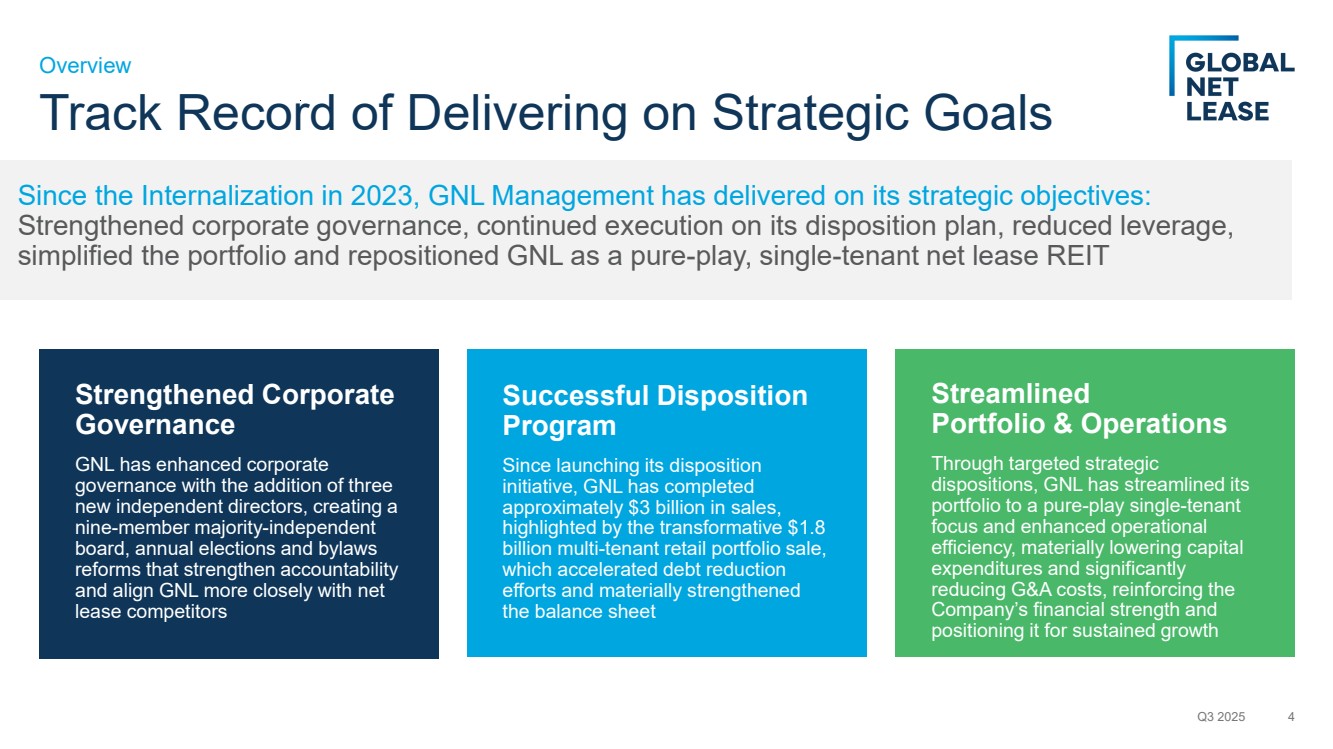
| Track Record of Delivering on Strategic Goals Q3 2025 4 Strengthened Corporate Governance GNL has enhanced corporate governance with the addition of three new independent directors, creating a nine-member majority-independent board, annual elections and bylaws reforms that strengthen accountability and align GNL more closely with net lease competitors Successful Disposition Program Since launching its disposition initiative, GNL has completed approximately $3 billion in sales, highlighted by the transformative $1.8 billion multi-tenant retail portfolio sale, which accelerated debt reduction efforts and materially strengthened the balance sheet Streamlined Portfolio & Operations Through targeted strategic dispositions, GNL has streamlined its portfolio to a pure-play single-tenant focus and enhanced operational efficiency, materially lowering capital expenditures and significantly reducing G&A costs, reinforcing the Company’s financial strength and positioning it for sustained growth Overview Since the Internalization in 2023, GNL Management has delivered on its strategic objectives: Strengthened corporate governance, continued execution on its disposition plan, reduced leverage, simplified the portfolio and repositioned GNL as a pure-play, single-tenant net lease REIT |
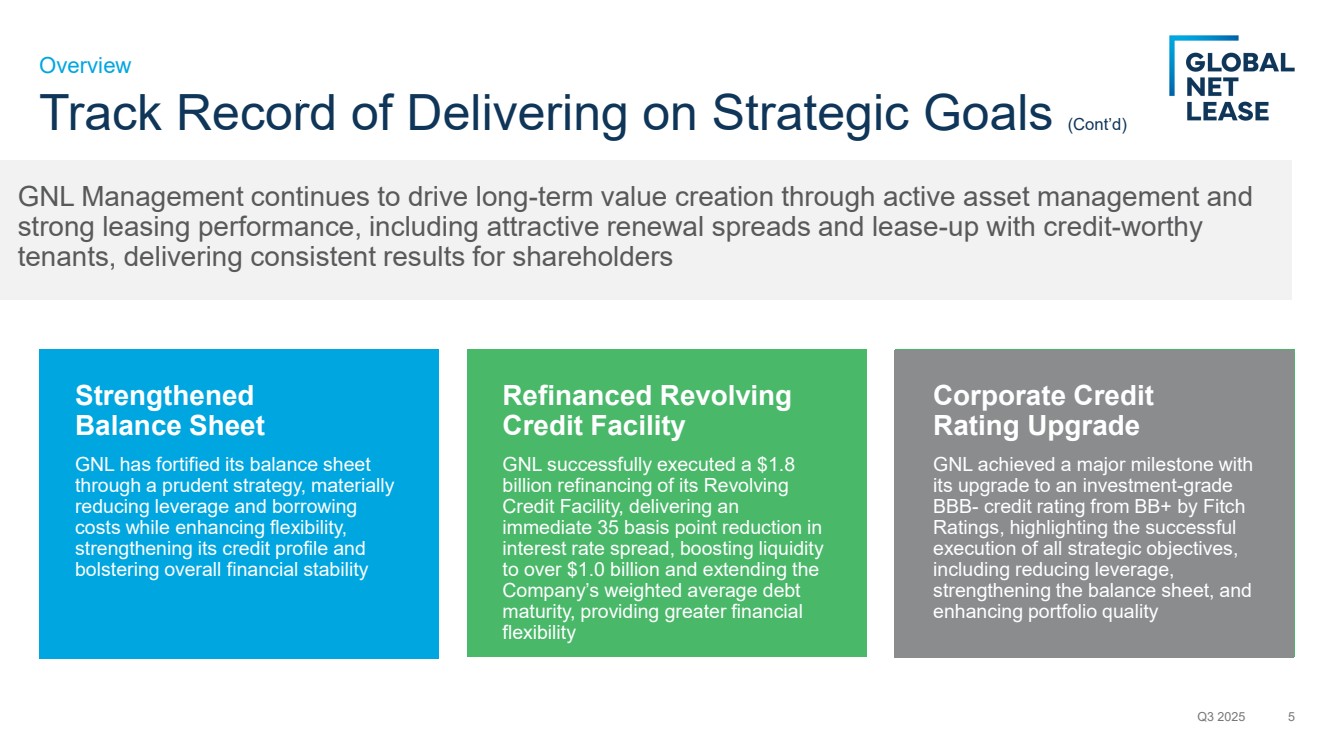
| ` Q3 2025 5 Overview Strengthened Balance Sheet GNL has fortified its balance sheet through a prudent strategy, materially reducing leverage and borrowing costs while enhancing flexibility, strengthening its credit profile and bolstering overall financial stability Refinanced Revolving Credit Facility GNL successfully executed a $1.8 billion refinancing of its Revolving Credit Facility, delivering an immediate 35 basis point reduction in interest rate spread, boosting liquidity to over $1.0 billion and extending the Company’s weighted average debt maturity, providing greater financial flexibility Corporate Credit Rating Upgrade GNL achieved a major milestone with its upgrade to an investment-grade BBB- credit rating from BB+ by Fitch Ratings, highlighting the successful execution of all strategic objectives, including reducing leverage, strengthening the balance sheet, and enhancing portfolio quality Track Record of Delivering on Strategic Goals (Cont’d) GNL Management continues to drive long-term value creation through active asset management and strong leasing performance, including attractive renewal spreads and lease-up with credit-worthy tenants, delivering consistent results for shareholders |
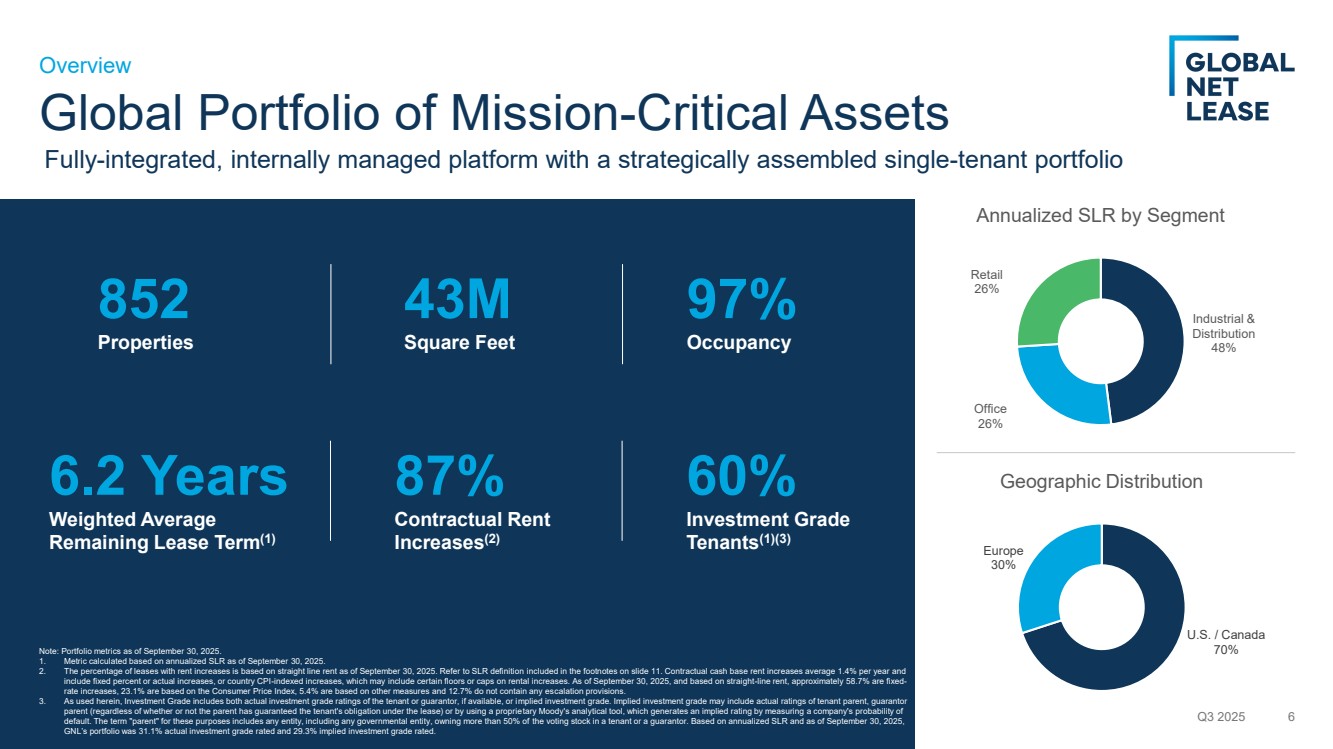
| Global Portfolio of Mission-Critical Assets Q3 2025 6 Overview 852 Properties Industrial & Distribution 48% Office 26% Retail 26% Annualized SLR by Segment U.S. / Canada 70% Europe 30% Geographic Distribution 43M Square Feet 97% Occupancy 6.2 Years Weighted Average Remaining Lease Term(1) 87% Contractual Rent Increases(2) 60% Investment Grade Tenants(1)(3) Note: Portfolio metrics as of September 30, 2025. 1. Metric calculated based on annualized SLR as of September 30, 2025. 2. The percentage of leases with rent increases is based on straight line rent as of September 30, 2025. Refer to SLR definition included in the footnotes on slide 11. Contractual cash base rent increases average 1.4% per year and include fixed percent or actual increases, or country CPI-indexed increases, which may include certain floors or caps on rental increases. As of September 30, 2025, and based on straight-line rent, approximately 58.7% are fixed-rate increases, 23.1% are based on the Consumer Price Index, 5.4% are based on other measures and 12.7% do not contain any escalation provisions. 3. As used herein, Investment Grade includes both actual investment grade ratings of the tenant or guarantor, if available, or implied investment grade. Implied investment grade may include actual ratings of tenant parent, guarantor parent (regardless of whether or not the parent has guaranteed the tenant's obligation under the lease) or by using a proprietary Moody's analytical tool, which generates an implied rating by measuring a company's probability of default. The term "parent" for these purposes includes any entity, including any governmental entity, owning more than 50% of the voting stock in a tenant or a guarantor. Based on annualized SLR and as of September 30, 2025, GNL’s portfolio was 31.1% actual investment grade rated and 29.3% implied investment grade rated. Fully-integrated, internally managed platform with a strategically assembled single-tenant portfolio |
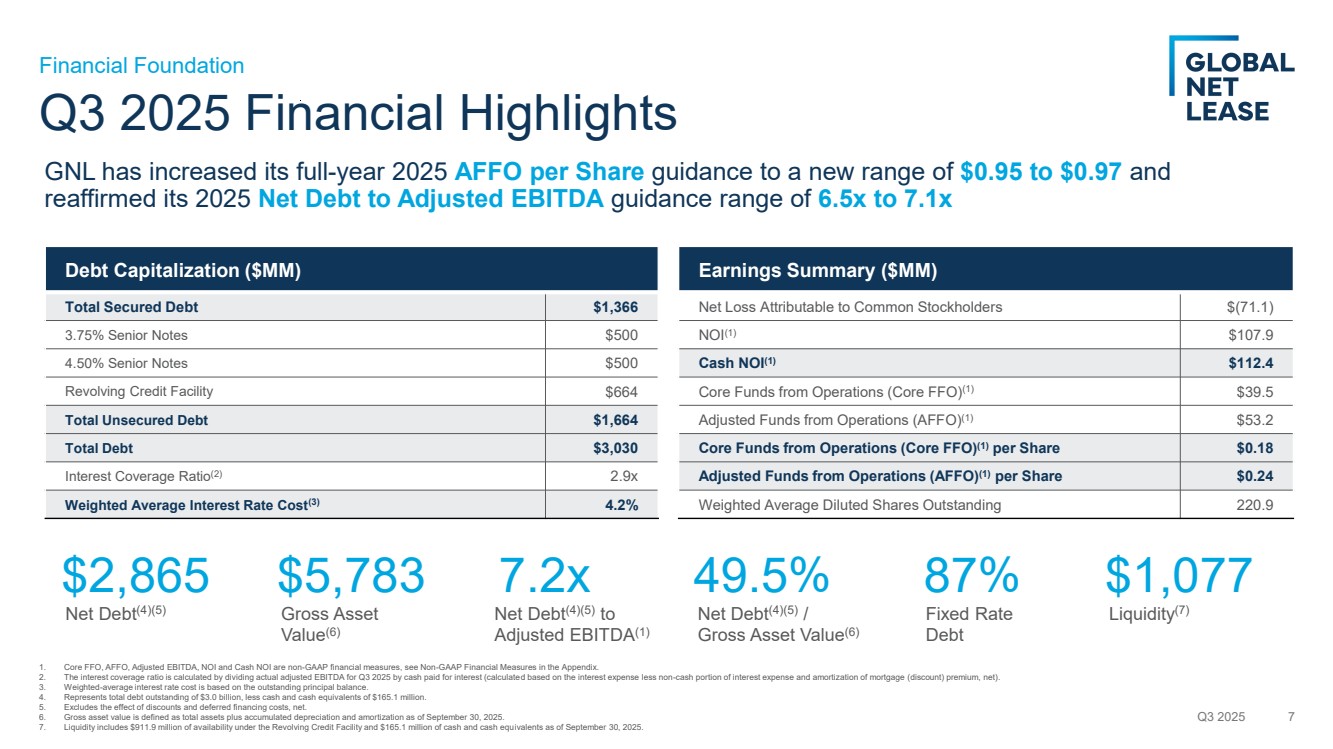
| Earnings Summary ($MM) Net Loss Attributable to Common Stockholders $(71.1) NOI(1) $107.9 Cash NOI(1) $112.4 Core Funds from Operations (Core FFO)(1) $39.5 Adjusted Funds from Operations (AFFO)(1) $53.2 Core Funds from Operations (Core FFO)(1) per Share $0.18 Adjusted Funds from Operations (AFFO)(1) per Share $0.24 Weighted Average Diluted Shares Outstanding 220.9 Debt Capitalization ($MM) Total Secured Debt $1,366 3.75% Senior Notes $500 4.50% Senior Notes $500 Revolving Credit Facility $664 Total Unsecured Debt $1,664 Total Debt $3,030 Interest Coverage Ratio(2) 2.9x Weighted Average Interest Rate Cost(3) 4.2% Q3 2025 Financial Highlights Q3 2025 7 Financial Foundation 1. Core FFO, AFFO, Adjusted EBITDA, NOI and Cash NOI are non-GAAP financial measures, see Non-GAAP Financial Measures in the Appendix. 2. The interest coverage ratio is calculated by dividing actual adjusted EBITDA for Q3 2025 by cash paid for interest (calculated based on the interest expense less non-cash portion of interest expense and amortization of mortgage (discount) premium, net). 3. Weighted-average interest rate cost is based on the outstanding principal balance. 4. Represents total debt outstanding of $3.0 billion, less cash and cash equivalents of $165.1 million. 5. Excludes the effect of discounts and deferred financing costs, net. 6. Gross asset value is defined as total assets plus accumulated depreciation and amortization as of September 30, 2025. 7. Liquidity includes $911.9 million of availability under the Revolving Credit Facility and $165.1 million of cash and cash equivalents as of September 30, 2025. GNL has increased its full-year 2025 AFFO per Share guidance to a new range of $0.95 to $0.97 and reaffirmed its 2025 Net Debt to Adjusted EBITDA guidance range of 6.5x to 7.1x $2,865 Net Debt(4)(5) $5,783 Gross Asset Value(6) 7.2x Net Debt(4)(5) to Adjusted EBITDA(1) $1,077 Liquidity(7) 49.5% Net Debt(4)(5) / Gross Asset Value(6) 87% Fixed Rate Debt |
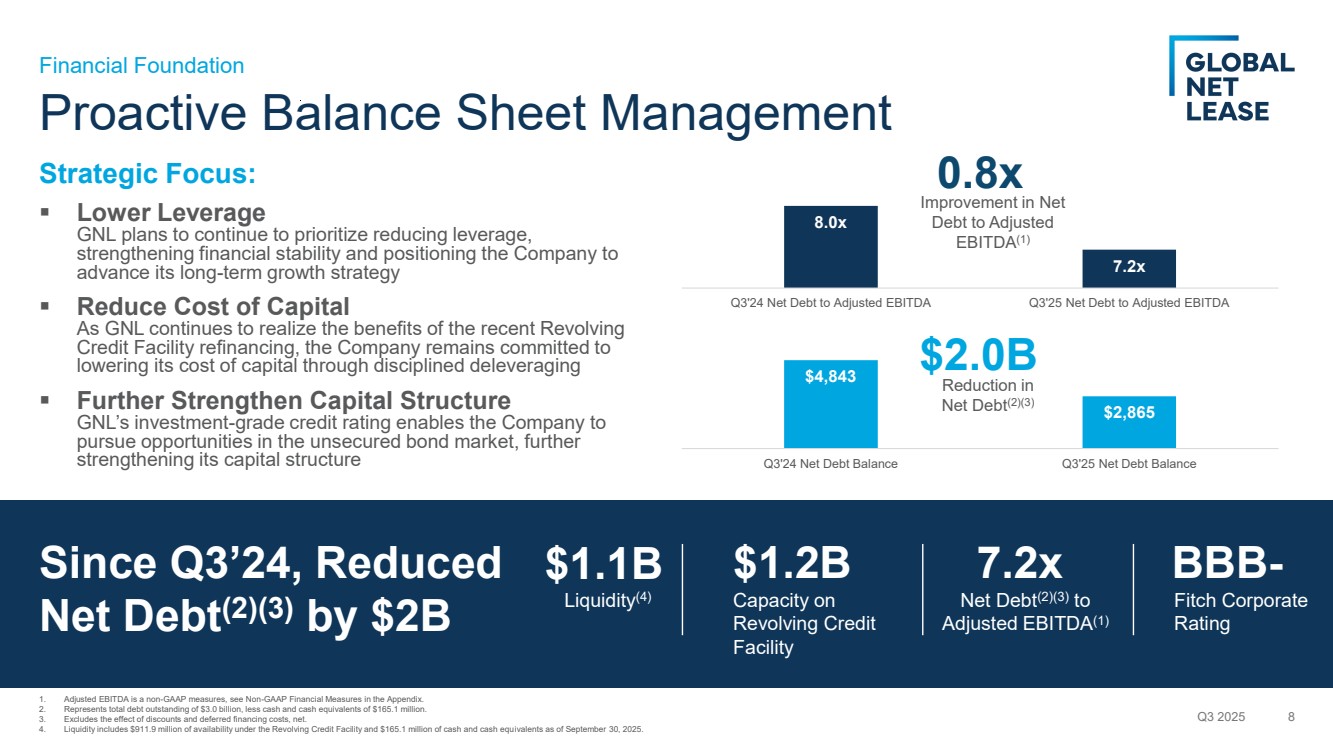
| Proactive Balance Sheet Management Strategic Focus: ▪ Lower Leverage GNL plans to continue to prioritize reducing leverage, strengthening financial stability and positioning the Company to advance its long-term growth strategy ▪ Reduce Cost of Capital As GNL continues to realize the benefits of the recent Revolving Credit Facility refinancing, the Company remains committed to lowering its cost of capital through disciplined deleveraging ▪ Further Strengthen Capital Structure GNL’s investment-grade credit rating enables the Company to pursue opportunities in the unsecured bond market, further strengthening its capital structure Q3 2025 8 Financial Foundation $1.1B Liquidity(4) $1.2B Capacity on Revolving Credit Facility 7.2x Net Debt(2)(3) to Adjusted EBITDA(1) BBB-Fitch Corporate Rating Since Q3’24, Reduced Net Debt(2)(3) by $2B 8.0x 7.2x Q3'24 Net Debt to Adjusted EBITDA Q3'25 Net Debt to Adjusted EBITDA $4,843 $2,865 Q3'24 Net Debt Balance Q3'25 Net Debt Balance 0.8x Improvement in Net Debt to Adjusted EBITDA(1) $2.0B Reduction in Net Debt(2)(3) 1. Adjusted EBITDA is a non-GAAP measures, see Non-GAAP Financial Measures in the Appendix. 2. Represents total debt outstanding of $3.0 billion, less cash and cash equivalents of $165.1 million. 3. Excludes the effect of discounts and deferred financing costs, net. 4. Liquidity includes $911.9 million of availability under the Revolving Credit Facility and $165.1 million of cash and cash equivalents as of September 30, 2025. |
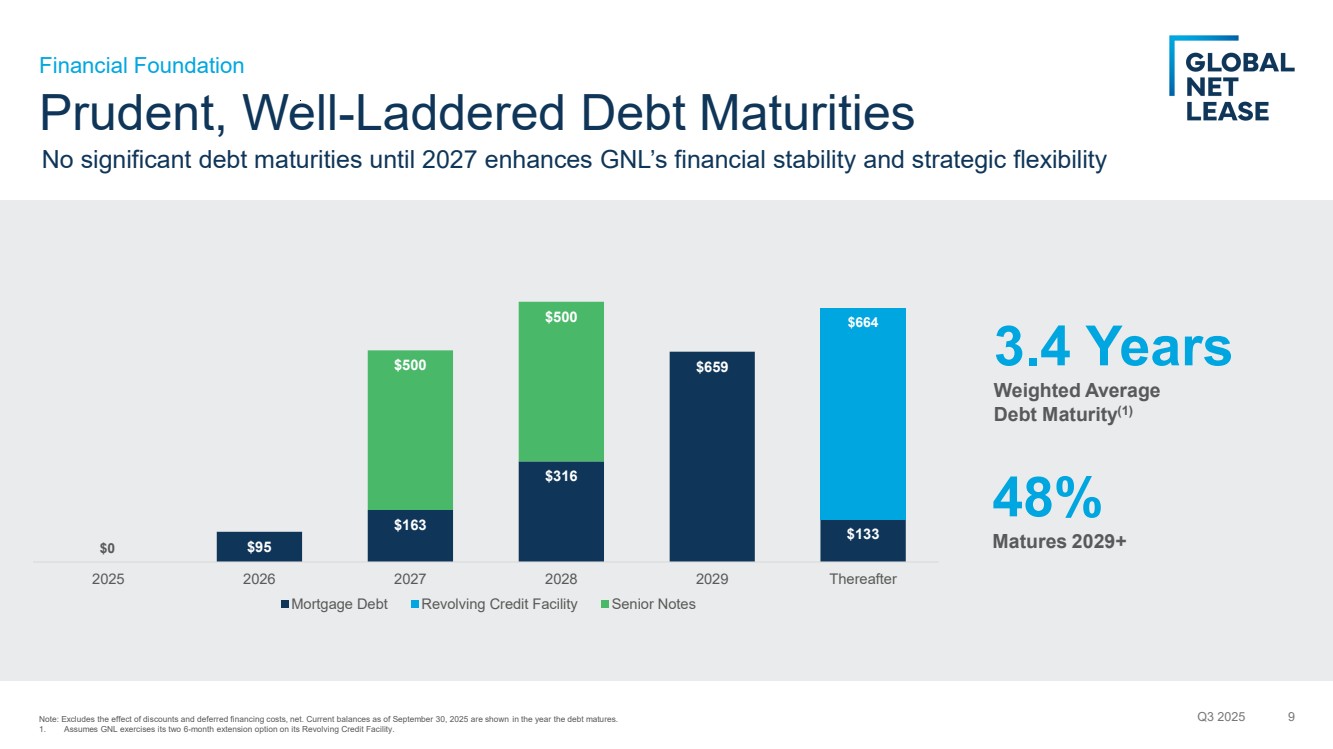
| Prudent, Well-Laddered Debt Maturities $95 $163 $316 $659 $133 $664 $500 $500 2025 2026 2027 2028 2029 Thereafter Mortgage Debt Revolving Credit Facility Senior Notes Q3 2025 9 Financial Foundation 3.4 Years Weighted Average Debt Maturity(1) 48% Matures 2029+ No significant debt maturities until 2027 enhances GNL’s financial stability and strategic flexibility Note: Excludes the effect of discounts and deferred financing costs, net. Current balances as of September 30, 2025 are shown in the year the debt matures. 1. Assumes GNL exercises its two 6-month extension option on its Revolving Credit Facility. $0 |
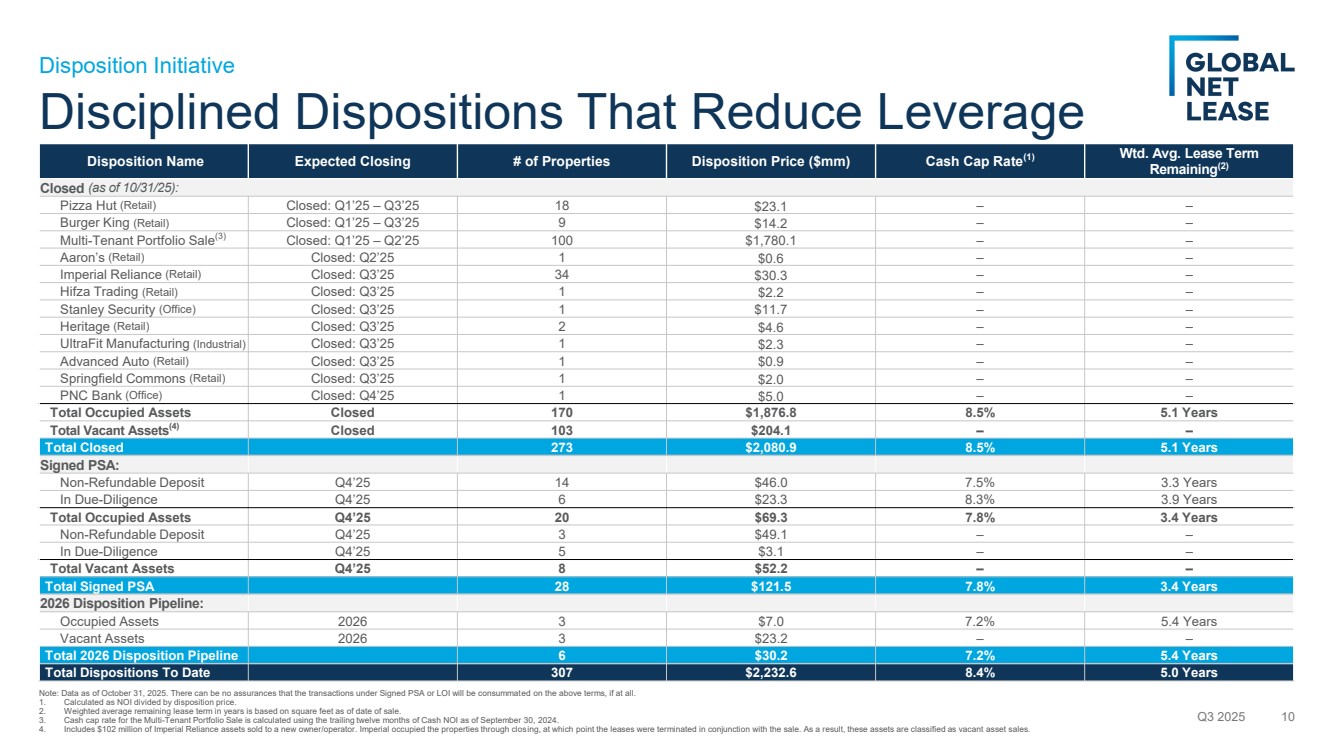
| Disciplined Dispositions That Reduce Leverage Q3 2025 10 Disposition Initiative Disposition Name Expected Closing # of Properties Disposition Price ($mm) Cash Cap Rate(1) Wtd. Avg. Lease Term Remaining(2) Closed (as of 10/31/25): Pizza Hut (Retail) Closed: Q1’25 – Q3’25 18 $23.1 – – Burger King (Retail) Closed: Q1’25 – Q3’25 9 $14.2 – – Multi-Tenant Portfolio Sale(3) Closed: Q1’25 – Q2’25 100 $1,780.1 – – Aaron’s (Retail) Closed: Q2’25 1 $0.6 – – Imperial Reliance (Retail) Closed: Q3’25 34 $30.3 – – Hifza Trading (Retail) Closed: Q3’25 1 $2.2 – – Stanley Security (Office) Closed: Q3’25 1 $11.7 – – Heritage (Retail) Closed: Q3’25 2 $4.6 – – UltraFit Manufacturing (Industrial) Closed: Q3’25 1 $2.3 – – Advanced Auto (Retail) Closed: Q3’25 1 $0.9 – – Springfield Commons (Retail) Closed: Q3’25 1 $2.0 – – PNC Bank (Office) Closed: Q4’25 1 $5.0 – – Total Occupied Assets Closed 170 $1,876.8 8.5% 5.1 Years Total Vacant Assets(4) Closed 103 $204.1 – – Total Closed 273 $2,080.9 8.5% 5.1 Years Signed PSA: Non-Refundable Deposit Q4’25 14 $46.0 7.5% 3.3 Years In Due-Diligence Q4’25 6 $23.3 8.3% 3.9 Years Total Occupied Assets Q4’25 20 $69.3 7.8% 3.4 Years Non-Refundable Deposit Q4’25 3 $49.1 – – In Due-Diligence Q4’25 5 $3.1 – – Total Vacant Assets Q4’25 8 $52.2 – – Total Signed PSA 28 $121.5 7.8% 3.4 Years 2026 Disposition Pipeline: Occupied Assets 2026 3 $7.0 7.2% 5.4 Years Vacant Assets 2026 3 $23.2 – – Total 2026 Disposition Pipeline 6 $30.2 7.2% 5.4 Years Total Dispositions To Date 307 $2,232.6 8.4% 5.0 Years Note: Data as of October 31, 2025. There can be no assurances that the transactions under Signed PSA or LOI will be consummated on the above terms, if at all. 1. Calculated as NOI divided by disposition price. 2. Weighted average remaining lease term in years is based on square feet as of date of sale. 3. Cash cap rate for the Multi-Tenant Portfolio Sale is calculated using the trailing twelve months of Cash NOI as of September 30, 2024. 4. Includes $102 million of Imperial Reliance assets sold to a new owner/operator. Imperial occupied the properties through closing, at which point the leases were terminated in conjunction with the sale. As a result, these assets are classified as vacant asset sales. |
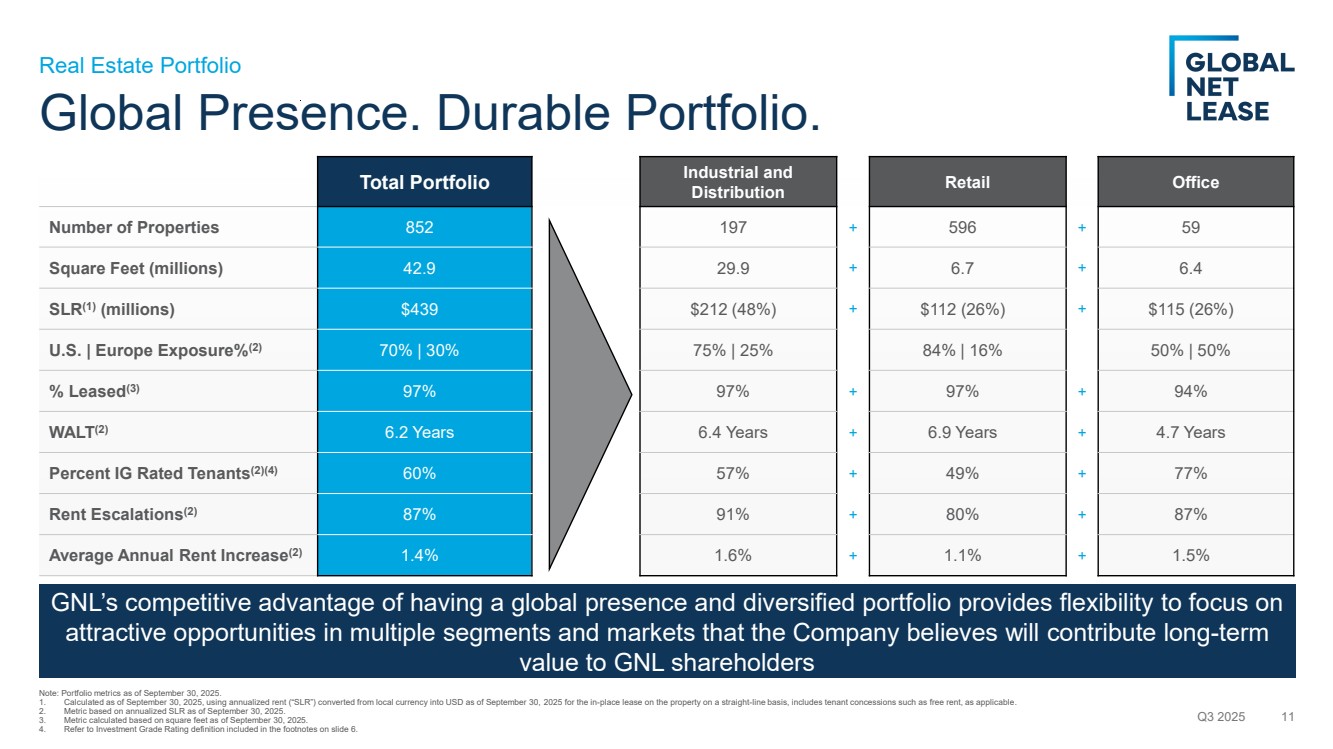
| Global Presence. Durable Portfolio. Total Portfolio Industrial and Distribution Retail Office Number of Properties 852 197 + 596 + 59 Square Feet (millions) 42.9 29.9 + 6.7 + 6.4 SLR(1) (millions) $439 $212 (48%) + $112 (26%) + $115 (26%) U.S. | Europe Exposure%(2) 70% | 30% 75% | 25% 84% | 16% 50% | 50% % Leased(3) 97% 97% + 97% + 94% WALT(2) 6.2 Years 6.4 Years + 6.9 Years + 4.7 Years Percent IG Rated Tenants(2)(4) 60% 57% + 49% + 77% Rent Escalations(2) 87% 91% + 80% + 87% Average Annual Rent Increase(2) 1.4% 1.6% + 1.1% + 1.5% Q3 2025 11 Real Estate Portfolio Note: Portfolio metrics as of September 30, 2025. 1. Calculated as of September 30, 2025, using annualized rent (“SLR”) converted from local currency into USD as of September 30, 2025 for the in-place lease on the property on a straight-line basis, includes tenant concessions such as free rent, as applicable. 2. Metric based on annualized SLR as of September 30, 2025. 3. Metric calculated based on square feet as of September 30, 2025. 4. Refer to Investment Grade Rating definition included in the footnotes on slide 6. GNL’s competitive advantage of having a global presence and diversified portfolio provides flexibility to focus on attractive opportunities in multiple segments and markets that the Company believes will contribute long-term value to GNL shareholders |
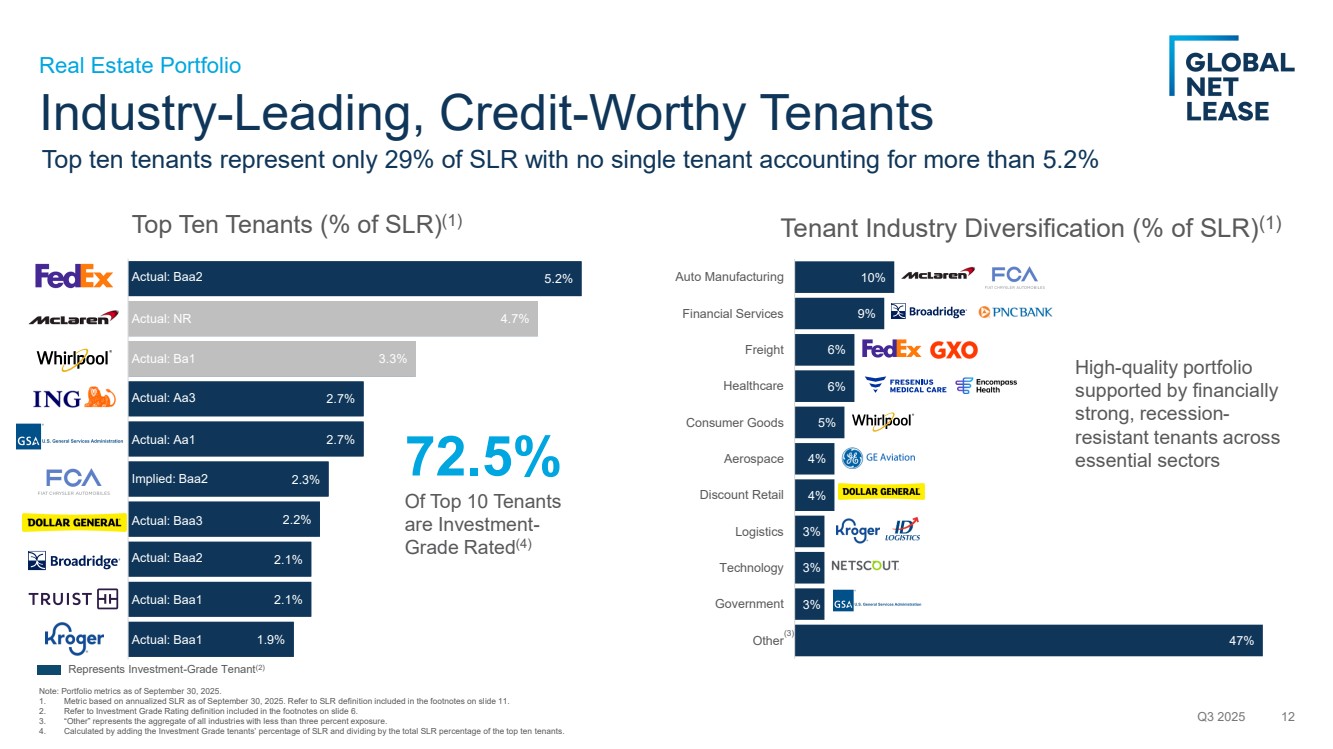
| 1.9% 2.1% 2.1% 2.2% 2.3% 2.7% 2.7% 3.3% 4.7% 5.2% Top Ten Tenants (% of SLR)(1) Industry-Leading, Credit-Worthy Tenants Q3 2025 12 Real Estate Portfolio 72.5% Of Top 10 Tenants are Investment-Grade Rated(4) Note: Portfolio metrics as of September 30, 2025. 1. Metric based on annualized SLR as of September 30, 2025. Refer to SLR definition included in the footnotes on slide 11. 2. Refer to Investment Grade Rating definition included in the footnotes on slide 6. 3. “Other” represents the aggregate of all industries with less than three percent exposure. 4. Calculated by adding the Investment Grade tenants’ percentage of SLR and dividing by the total SLR percentage of the top ten tenants. 47% 3% 3% 3% 4% 4% 5% 6% 6% 9% 10% Other Government Technology Logistics Discount Retail Aerospace Consumer Goods Healthcare Freight Financial Services Auto Manufacturing Tenant Industry Diversification (% of SLR)(1) High-quality portfolio supported by financially strong, recession-resistant tenants across essential sectors Top ten tenants represent only 29% of SLR with no single tenant accounting for more than 5.2% Actual: Baa2 Actual: Baa2 Actual: NR Implied: Baa2 Actual: Baa1 Actual: Baa1 Actual: Baa3 Actual: Aa1 Actual: Aa3 Actual: Ba1 Represents Investment-Grade Tenant(2) (3) |
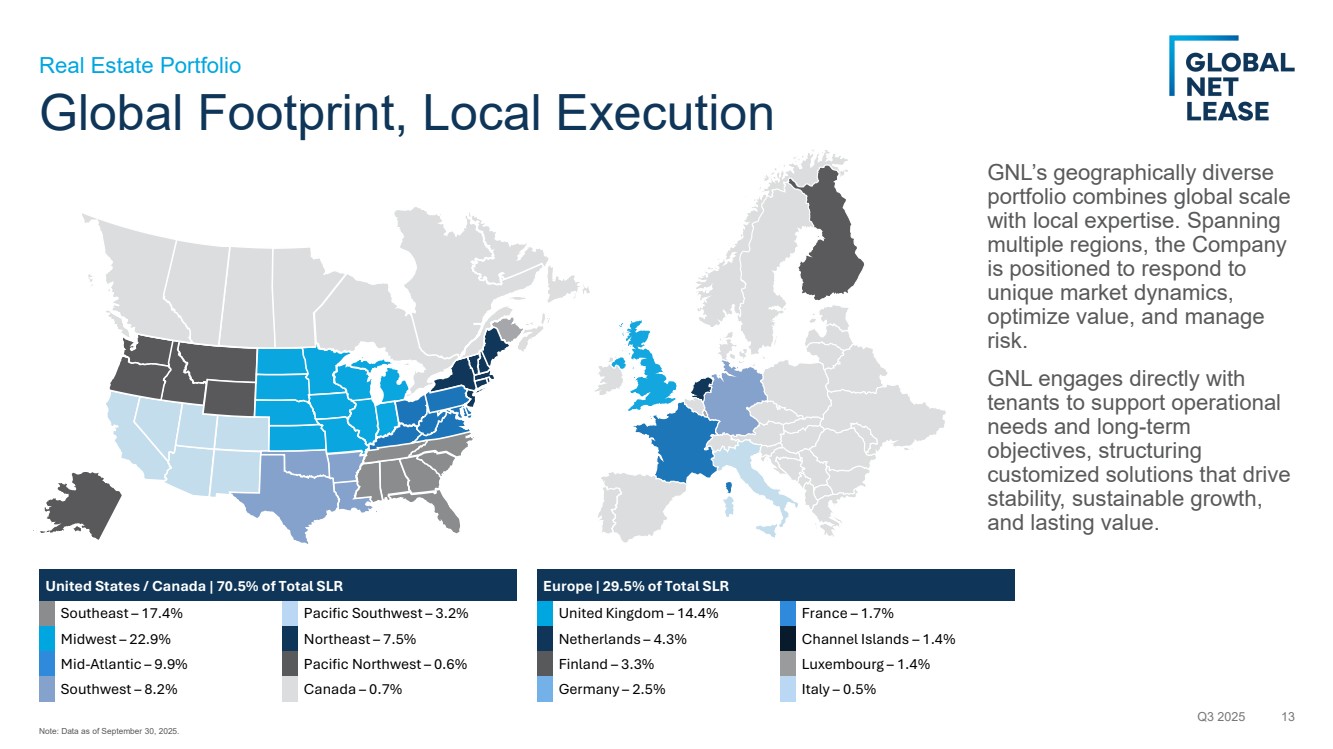
| Global Footprint, Local Execution GNL’s geographically diverse portfolio combines global scale with local expertise. Spanning multiple regions, the Company is positioned to respond to unique market dynamics, optimize value, and manage risk. GNL engages directly with tenants to support operational needs and long-term objectives, structuring customized solutions that drive stability, sustainable growth, and lasting value. Q3 2025 13 Real Estate Portfolio United States / Canada | 70.5% of Total SLR Southeast – 17.4% Pacific Southwest – 3.2% Midwest – 22.9% Northeast – 7.5% Mid-Atlantic – 9.9% Pacific Northwest – 0.6% Southwest – 8.2% Canada – 0.7% Europe | 29.5% of Total SLR United Kingdom – 14.4% France – 1.7% Netherlands – 4.3% Channel Islands – 1.4% Finland – 3.3% Luxembourg – 1.4% Germany – 2.5% Italy – 0.5% Note: Data as of September 30, 2025. |
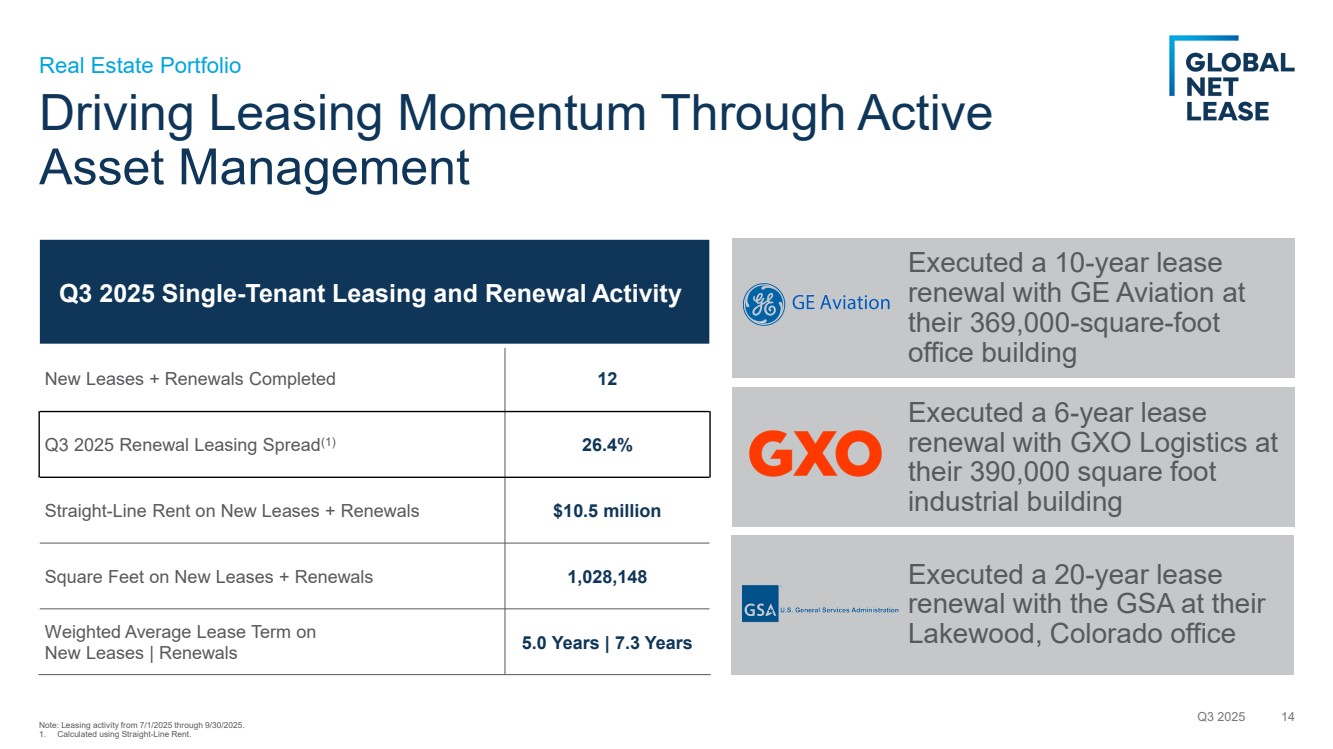
| Driving Leasing Momentum Through Active Asset Management Q3 2025 14 Real Estate Portfolio Q3 2025 Single-Tenant Leasing and Renewal Activity New Leases + Renewals Completed 12 Q3 2025 Renewal Leasing Spread(1) 26.4% Straight-Line Rent on New Leases + Renewals $10.5 million Square Feet on New Leases + Renewals 1,028,148 Weighted Average Lease Term on New Leases | Renewals 5.0 Years | 7.3 Years Executed a 10-year lease renewal with GE Aviation at their 369,000-square-foot office building Executed a 6-year lease renewal with GXO Logistics at their 390,000 square foot industrial building Executed a 20-year lease renewal with the GSA at their Lakewood, Colorado office Note: Leasing activity from 7/1/2025 through 9/30/2025. 1. Calculated using Straight-Line Rent. |
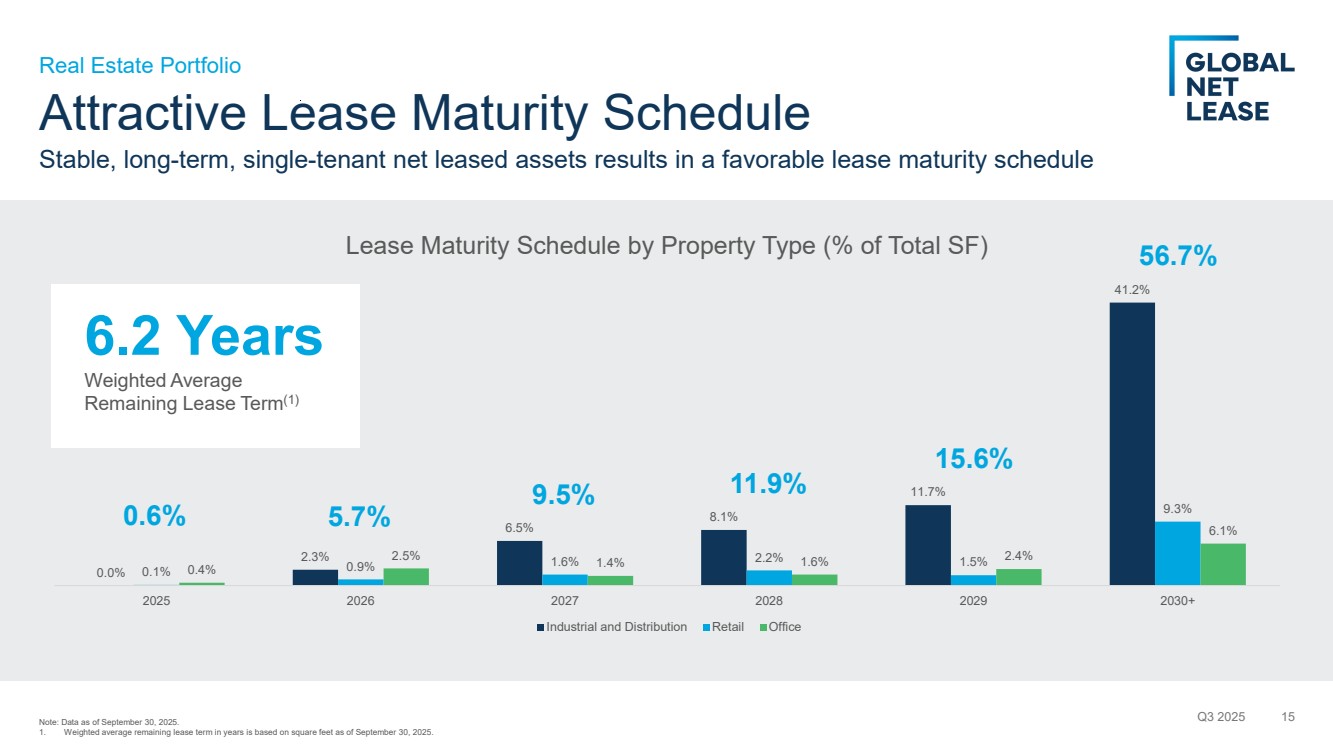
| Attractive Lease Maturity Schedule Q3 2025 15 Real Estate Portfolio Note: Data as of September 30, 2025. 1. Weighted average remaining lease term in years is based on square feet as of September 30, 2025. 6.2 Years Weighted Average Remaining Lease Term(1) 0.6% 56.7% 5.7% 9.5% 11.9% 15.6% Stable, long-term, single-tenant net leased assets results in a favorable lease maturity schedule 0.0% 2.3% 6.5% 8.1% 11.7% 41.2% 0.1% 0.9% 1.6% 2.2% 1.5% 9.3% 0.4% 2.5% 1.4% 1.6% 2.4% 6.1% 2025 2026 2027 2028 2029 2030+ Lease Maturity Schedule by Property Type (% of Total SF) Industrial and Distribution Retail Office |
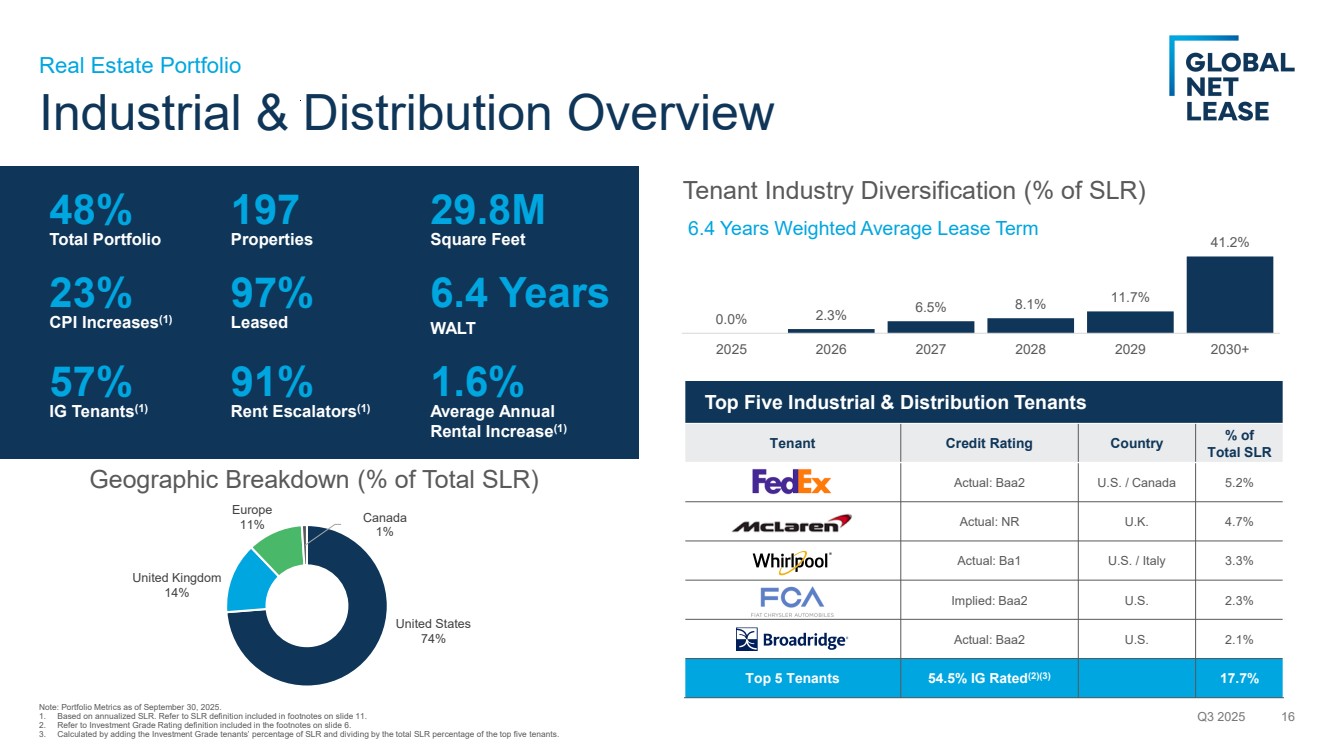
| Top Five Industrial & Distribution Tenants Tenant Credit Rating Country % of Total SLR Actual: Baa2 U.S. / Canada 5.2% Actual: NR U.K. 4.7% Actual: Ba1 U.S. / Italy 3.3% Implied: Baa2 U.S. 2.3% Actual: Baa2 U.S. 2.1% Top 5 Tenants 54.5% IG Rated(2)(3) 17.7% Industrial & Distribution Overview Q3 2025 16 Real Estate Portfolio United States 74% United Kingdom 14% Europe 11% Canada 1% Geographic Breakdown (% of Total SLR) 48% Total Portfolio 197 Properties 29.8M Square Feet 23% CPI Increases(1) 97% Leased 6.4 Years WALT 57% IG Tenants(1) 91% Rent Escalators(1) 1.6% Average Annual Rental Increase(1) 0.0% 2.3% 6.5% 8.1% 11.7% 41.2% 2025 2026 2027 2028 2029 2030+ Tenant Industry Diversification (% of SLR) 6.4 Years Weighted Average Lease Term Note: Portfolio Metrics as of September 30, 2025. 1. Based on annualized SLR. Refer to SLR definition included in footnotes on slide 11. 2. Refer to Investment Grade Rating definition included in the footnotes on slide 6. 3. Calculated by adding the Investment Grade tenants’ percentage of SLR and dividing by the total SLR percentage of the top five tenants. |
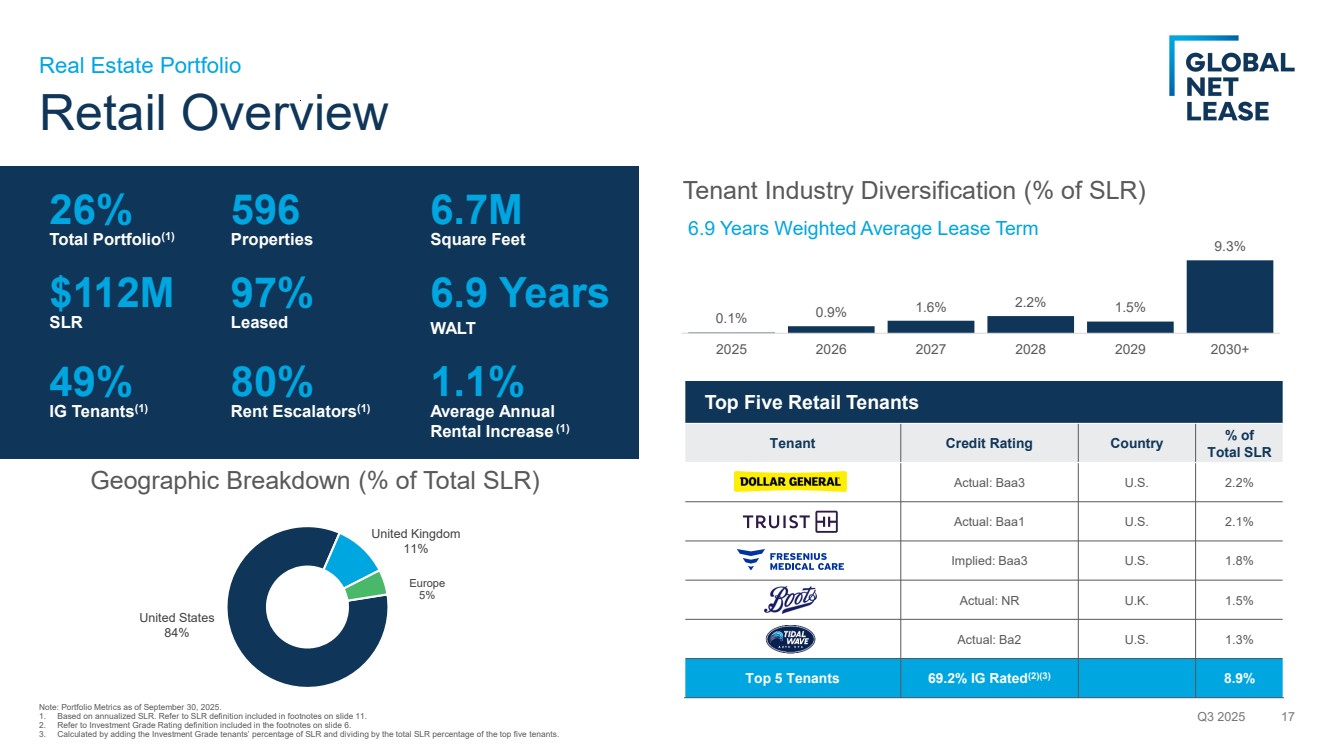
| Top Five Retail Tenants Tenant Credit Rating Country % of Total SLR Actual: Baa3 U.S. 2.2% Actual: Baa1 U.S. 2.1% Implied: Baa3 U.S. 1.8% Actual: NR U.K. 1.5% Actual: Ba2 U.S. 1.3% Top 5 Tenants 69.2% IG Rated(2)(3) 8.9% 0.1% 0.9% 1.6% 2.2% 1.5% 9.3% 2025 2026 2027 2028 2029 2030+ Tenant Industry Diversification (% of SLR) Retail Overview Q3 2025 17 Real Estate Portfolio United States 84% United Kingdom 11% Europe 5% Geographic Breakdown (% of Total SLR) 26% Total Portfolio(1) 596 Properties 6.7M Square Feet $112M SLR 97% Leased 6.9 Years WALT 49% IG Tenants(1) 80% Rent Escalators(1) 1.1% Average Annual Rental Increase (1) 6.9 Years Weighted Average Lease Term Note: Portfolio Metrics as of September 30, 2025. 1. Based on annualized SLR. Refer to SLR definition included in footnotes on slide 11. 2. Refer to Investment Grade Rating definition included in the footnotes on slide 6. 3. Calculated by adding the Investment Grade tenants’ percentage of SLR and dividing by the total SLR percentage of the top five tenants. |
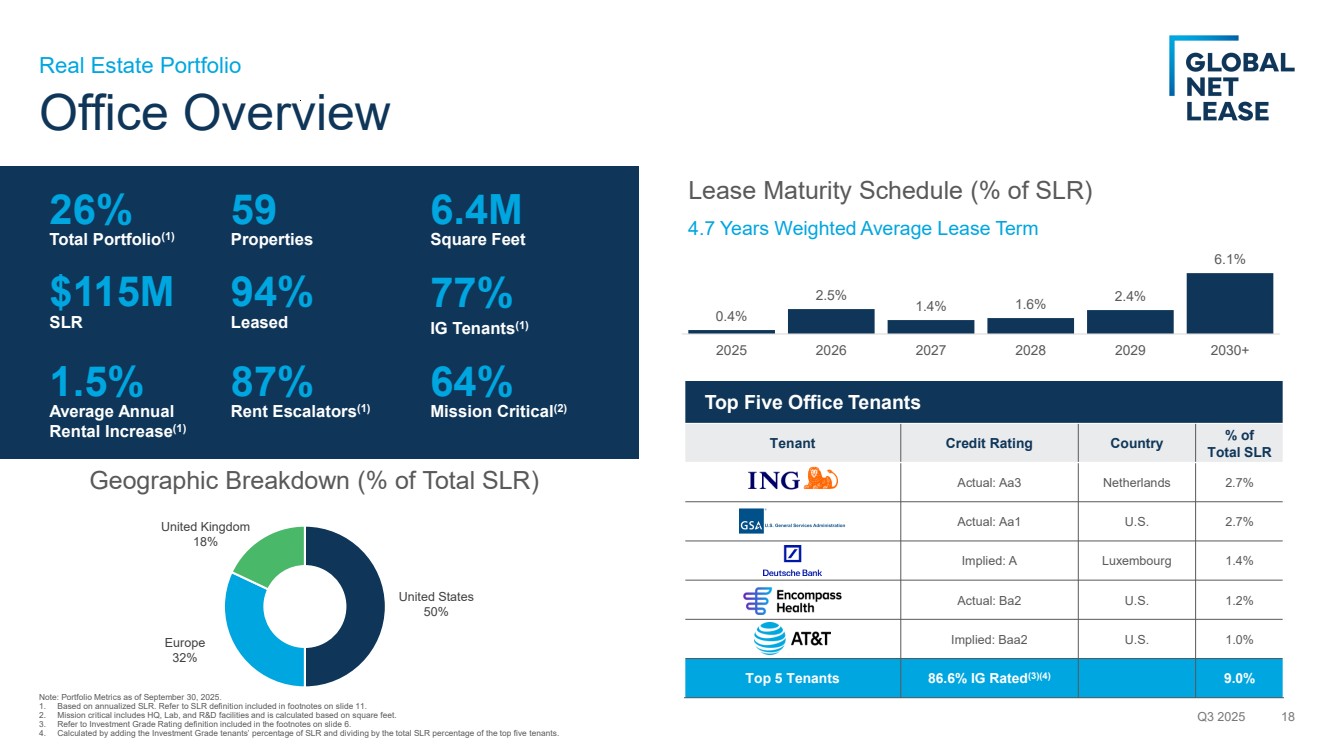
| Top Five Office Tenants Tenant Credit Rating Country % of Total SLR Actual: Aa3 Netherlands 2.7% Actual: Aa1 U.S. 2.7% Implied: A Luxembourg 1.4% Actual: Ba2 U.S. 1.2% Implied: Baa2 U.S. 1.0% Top 5 Tenants 86.6% IG Rated(3)(4) 9.0% Office Overview Q3 2025 18 Real Estate Portfolio United States 50% Europe 32% United Kingdom 18% Geographic Breakdown (% of Total SLR) 26% Total Portfolio(1) 59 Properties 6.4M Square Feet $115M SLR 94% Leased 77% IG Tenants(1) 1.5% Average Annual Rental Increase(1) 87% Rent Escalators(1) 64% Mission Critical(2) 0.4% 2.5% 1.4% 1.6% 2.4% 6.1% 2025 2026 2027 2028 2029 2030+ Lease Maturity Schedule (% of SLR) 4.7 Years Weighted Average Lease Term Note: Portfolio Metrics as of September 30, 2025. 1. Based on annualized SLR. Refer to SLR definition included in footnotes on slide 11. 2. Mission critical includes HQ, Lab, and R&D facilities and is calculated based on square feet. 3. Refer to Investment Grade Rating definition included in the footnotes on slide 6. 4. Calculated by adding the Investment Grade tenants’ percentage of SLR and dividing by the total SLR percentage of the top five tenants. |
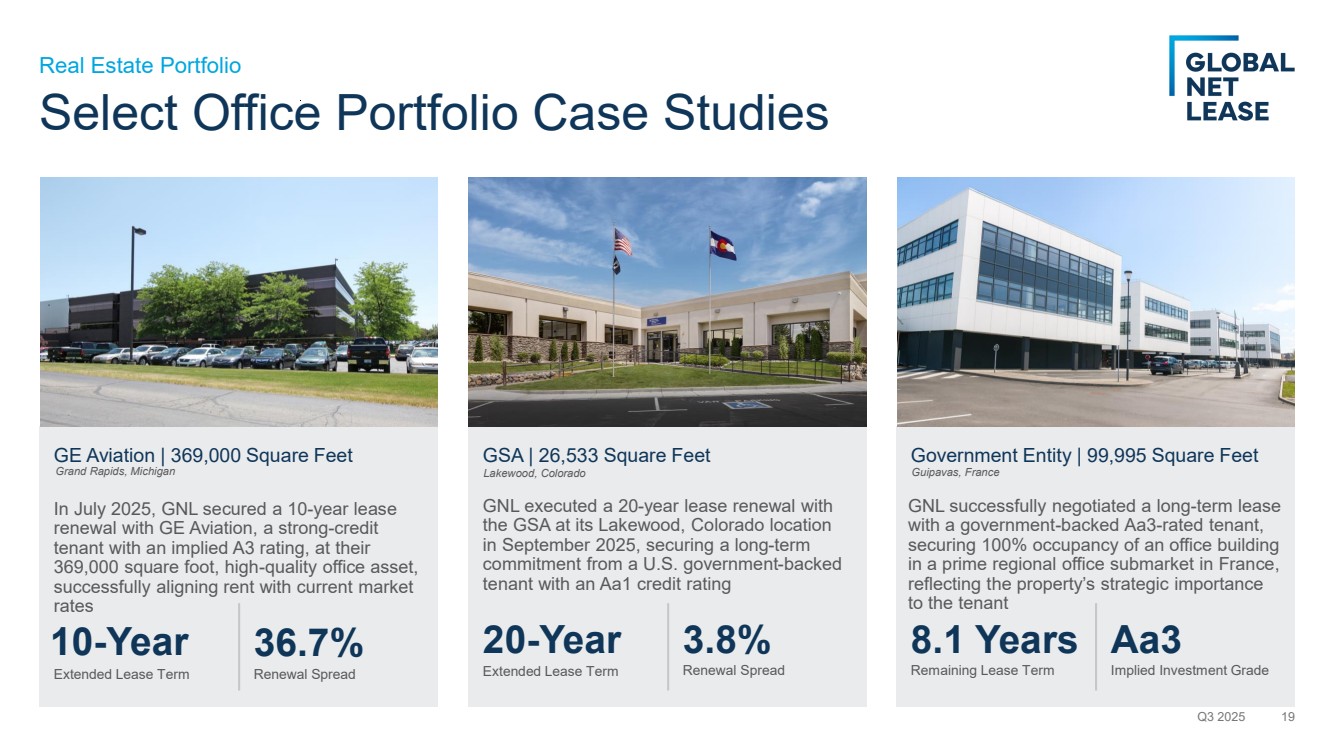
| Select Office Portfolio Case Studies GE Aviation | 369,000 Square Feet Q3 2025 19 Real Estate Portfolio In July 2025, GNL secured a 10-year lease renewal with GE Aviation, a strong-credit tenant with an implied A3 rating, at their 369,000 square foot, high-quality office asset, successfully aligning rent with current market rates 10-Year Extended Lease Term 36.7% Renewal Spread GSA | 26,533 Square Feet GNL executed a 20-year lease renewal with the GSA at its Lakewood, Colorado location in September 2025, securing a long-term commitment from a U.S. government-backed tenant with an Aa1 credit rating 20-Year Extended Lease Term 3.8% Renewal Spread Government Entity | 99,995 Square Feet 8.1 Years Remaining Lease Term Aa3 Implied Investment Grade GNL successfully negotiated a long-term lease with a government-backed Aa3-rated tenant, securing 100% occupancy of an office building in a prime regional office submarket in France, reflecting the property’s strategic importance to the tenant Grand Rapids, Michigan Lakewood, Colorado Guipavas, France |
| Executive Team: Leading With Experience. Executing With Discipline. Michael Weil Chief Executive Officer & President Over 20 years of experience leading public REITs and real estate platforms, managing nearly $30 billion across healthcare, retail, office, and industrial assets, and guiding organizations through mergers & acquisitions, IPOs, and internalizations Q3 2025 20 Leadership Chris Masterson Chief Financial Officer Over 20 years of finance and accounting experience, including senior leadership as CFO of multiple public REITs, with prior experience at Goldman Sachs and KPMG Jesse Galloway Executive Vice President & General Counsel Over 25 years of legal and executive experience representing major real estate companies and financial institutions, including 10 years as General Counsel and 15 years in private practice Ori Kravel Chief Operating Officer Over 15 years of experience in corporate development, capital markets, and operations within the public REIT sector, having executed over $15 billion in capital markets transactions and $30 billion in M&A transactions Jason Slear Executive Vice President Over 20 years of experience in acquisitions, dispositions, and leasing, with a track record of sourcing and closing more than $10 billion in single-tenant net lease transactions and over 10 million square feet of leasing activity |

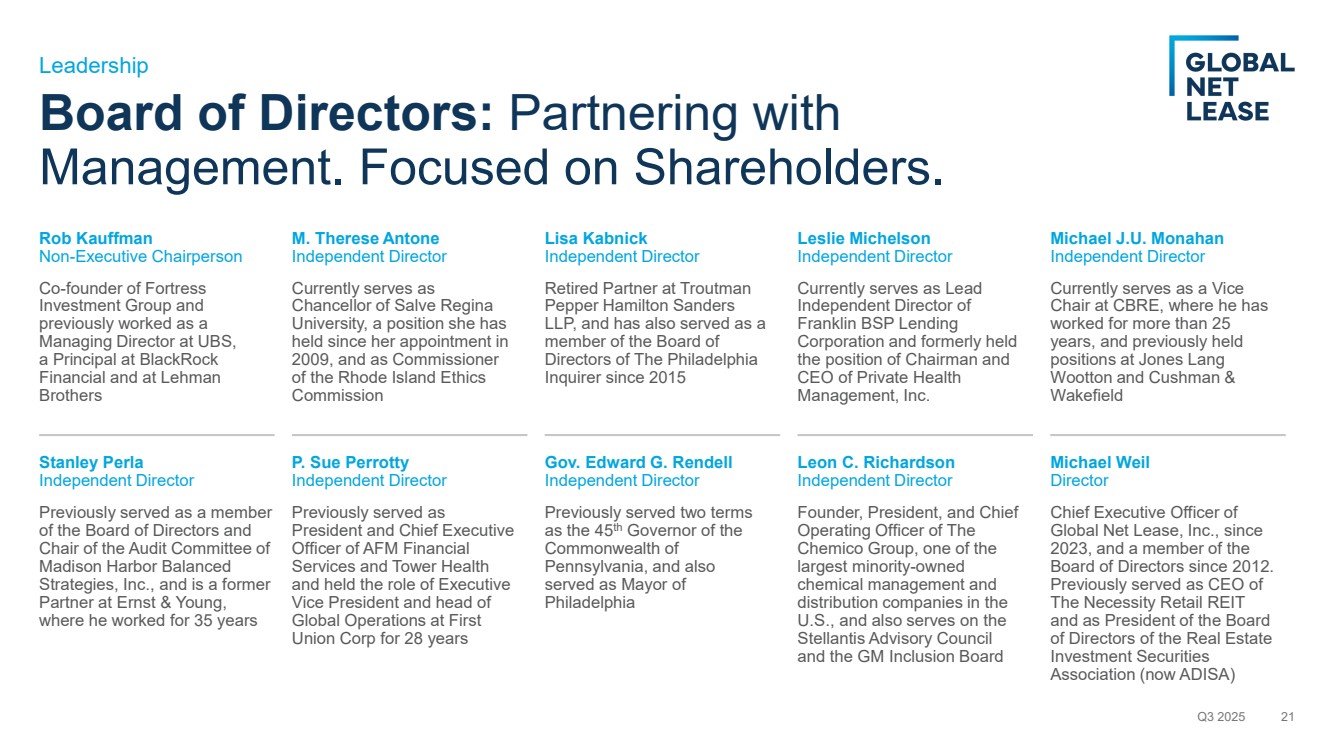
| Board of Directors: Partnering with Management. Focused on Shareholders. Q3 2025 21 Leadership Rob Kauffman Non-Executive Chairperson Co-founder of Fortress Investment Group and previously worked as a Managing Director at UBS, a Principal at BlackRock Financial and at Lehman Brothers M. Therese Antone Independent Director Currently serves as Chancellor of Salve Regina University, a position she has held since her appointment in 2009, and as Commissioner of the Rhode Island Ethics Commission Lisa Kabnick Independent Director Retired Partner at Troutman Pepper Hamilton Sanders LLP, and has also served as a member of the Board of Directors of The Philadelphia Inquirer since 2015 Leslie Michelson Independent Director Currently serves as Lead Independent Director of Franklin BSP Lending Corporation and formerly held the position of Chairman and CEO of Private Health Management, Inc. Michael J.U. Monahan Independent Director Currently serves as a Vice Chair at CBRE, where he has worked for more than 25 years, and previously held positions at Jones Lang Wootton and Cushman & Wakefield Stanley Perla Independent Director Previously served as a member of the Board of Directors and Chair of the Audit Committee of Madison Harbor Balanced Strategies, Inc., and is a former Partner at Ernst & Young, where he worked for 35 years P. Sue Perrotty Independent Director Previously served as President and Chief Executive Officer of AFM Financial Services and Tower Health and held the role of Executive Vice President and head of Global Operations at First Union Corp for 28 years Gov. Edward G. Rendell Independent Director Previously served two terms as the 45th Governor of the Commonwealth of Pennsylvania, and also served as Mayor of Philadelphia Leon C. Richardson Independent Director Founder, President, and Chief Operating Officer of The Chemico Group, one of the largest minority-owned chemical management and distribution companies in the U.S., and also serves on the Stellantis Advisory Council and the GM Inclusion Board Michael Weil Director Chief Executive Officer of Global Net Lease, Inc., since 2023, and a member of the Board of Directors since 2012. Previously served as CEO of The Necessity Retail REIT and as President of the Board of Directors of the Real Estate Investment Securities Association (now ADISA) |
| Financial Definitions Non-GAAP Financial Measures This presentation includes various performance indicators and non-GAAP financial measures that we use to help us evaluate our performance, ability to incur and service debt, financial condition and results of operations. These non-GAAP financial measures include Funds from Operations (“FFO”), Core Funds from Operations (“Core FFO”), Adjusted Funds from Operations (“AFFO”), Adjusted Earnings before Interest, Taxes, Depreciation and Amortization (“Adjusted EBITDA”), Net Operating Income (“NOI”), Cash Net Operating Income (“Cash NOI”) and Cash Paid for Interest. While NOI is a property-level measure, AFFO is based on total Company performance and therefore reflects the impact of other items not specifically associated with NOI such as, interest expense, general and administrative expenses and operating fees to related parties. Additionally, NOI does not reflect an adjustment for straight-line rent, but AFFO does include this adjustment. FFO, Core FFO, AFFO, Adjusted EBITDA, NOI and Cash NOI and pro forma presentations of the foregoing are financial measures that are calculated and presented on the basis of methodologies other than in accordance with generally accepted accounting principles in the United States of America (“GAAP”). Definitions of such non-GAAP measures can be found in the Company’s Q3 2025 earnings release for the quarter ended September 30, 2025, furnished as to the Current Report on Form 8-K filed on November 5, 2025. Reconciliations of such non-GAAP measures for Q3 2025 to their nearest comparable GAAP measures can be found in the Appendix found within, and with respect to the quarterly information regarding Q3 2024, the reconciliations can be found in the Company’s earnings release for the quarter ended September 30, 2025, furnished as to the Current Report on Form 8-K filed with the SEC on November 5, 2025. Any non-GAAP financial measures used in this presentation are in addition to, and not meant to be considered superior to, or a substitute for, the Company’s financial statements prepared in accordance with GAAP. Additional information with respect to the Company is contained in its filings with the SEC and is available at the SEC's website, www.sec.gov, and on the Company’s website, https://www.globalnetlease.com/. Caution on Use of Non-GAAP Measures FFO, Core FFO, AFFO, Adjusted EBITDA, NOI, Cash NOI and Cash Paid for Interest should not be construed to be more relevant or accurate than the current GAAP methodology in calculating net income or in its applicability in evaluating our operating performance. The method utilized to evaluate the value and performance of real estate under GAAP should be construed as a more relevant measure of operational performance and considered more prominently than the non-GAAP measures. Other REITs may not define FFO in accordance with the current National Association of Real Estate Investment Trusts (“NAREIT”) definition (as we do) or may interpret the current NAREIT definition differently than we do or may calculate Core FFO or AFFO differently than we do. Consequently, our presentation of FFO, Core FFO and AFFO may not be comparable to other similarly-titled measures presented by other REITs. We consider FFO, Core FFO and AFFO useful indicators of our performance. Because FFO, Core FFO and AFFO calculations exclude such factors as depreciation and amortization of real estate assets and gain or loss from sales of operating real estate assets (which can vary among owners of identical assets in similar conditions based on historical cost accounting and useful-life estimates), FFO, Core FFO and AFFO presentations facilitate comparisons of operating performance between periods and between other REITs in our peer group. Q3 2025 22 Appendix |
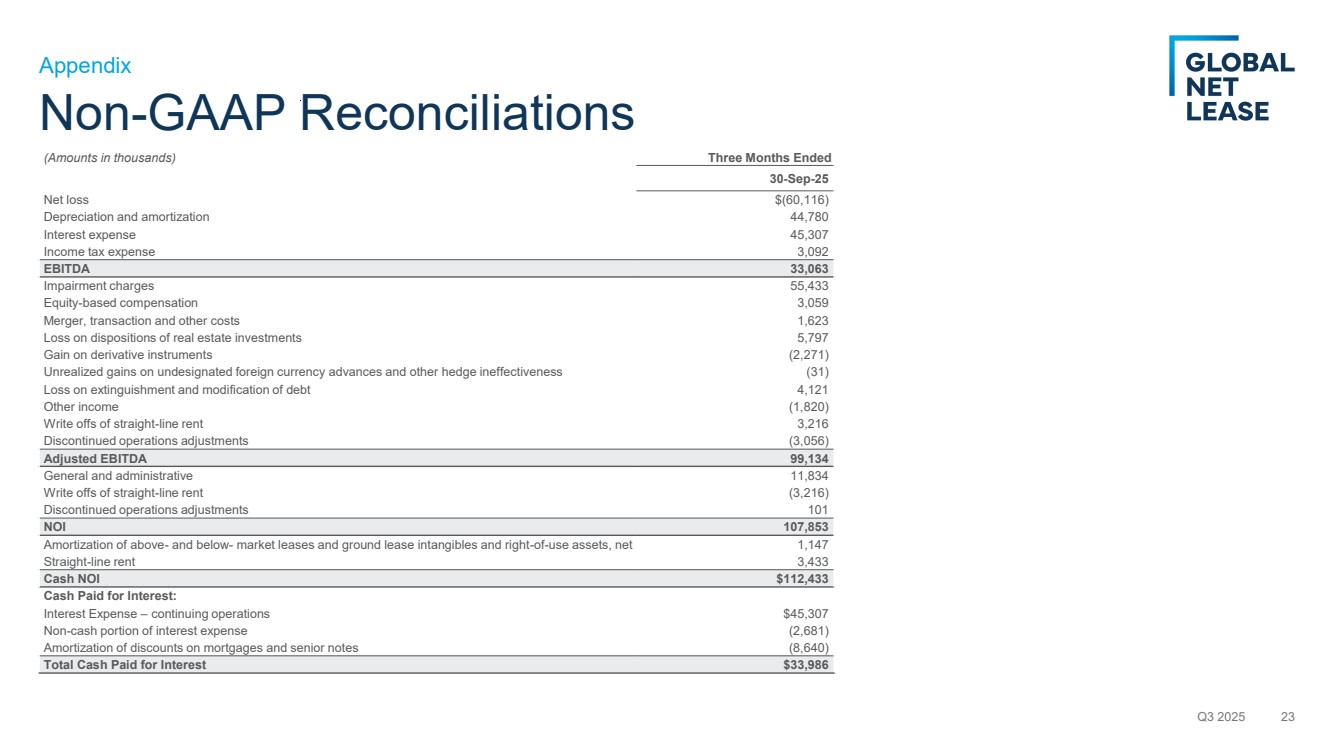
| Non-GAAP Reconciliations (Amounts in thousands) Three Months Ended 30-Sep-25 Net loss $(60,116) Depreciation and amortization 44,780 Interest expense 45,307 Income tax expense 3,092 EBITDA 33,063 Impairment charges 55,433 Equity-based compensation 3,059 Merger, transaction and other costs 1,623 Loss on dispositions of real estate investments 5,797 Gain on derivative instruments (2,271) Unrealized gains on undesignated foreign currency advances and other hedge ineffectiveness (31) Loss on extinguishment and modification of debt 4,121 Other income (1,820) Write offs of straight-line rent 3,216 Discontinued operations adjustments (3,056) Adjusted EBITDA 99,134 General and administrative 11,834 Write offs of straight-line rent (3,216) Discontinued operations adjustments 101 NOI 107,853 Amortization of above- and below- market leases and ground lease intangibles and right-of-use assets, net 1,147 Straight-line rent 3,433 Cash NOI $112,433 Cash Paid for Interest: Interest Expense – continuing operations $45,307 Non-cash portion of interest expense (2,681) Amortization of discounts on mortgages and senior notes (8,640) Total Cash Paid for Interest $33,986 Q3 2025 23 Appendix |
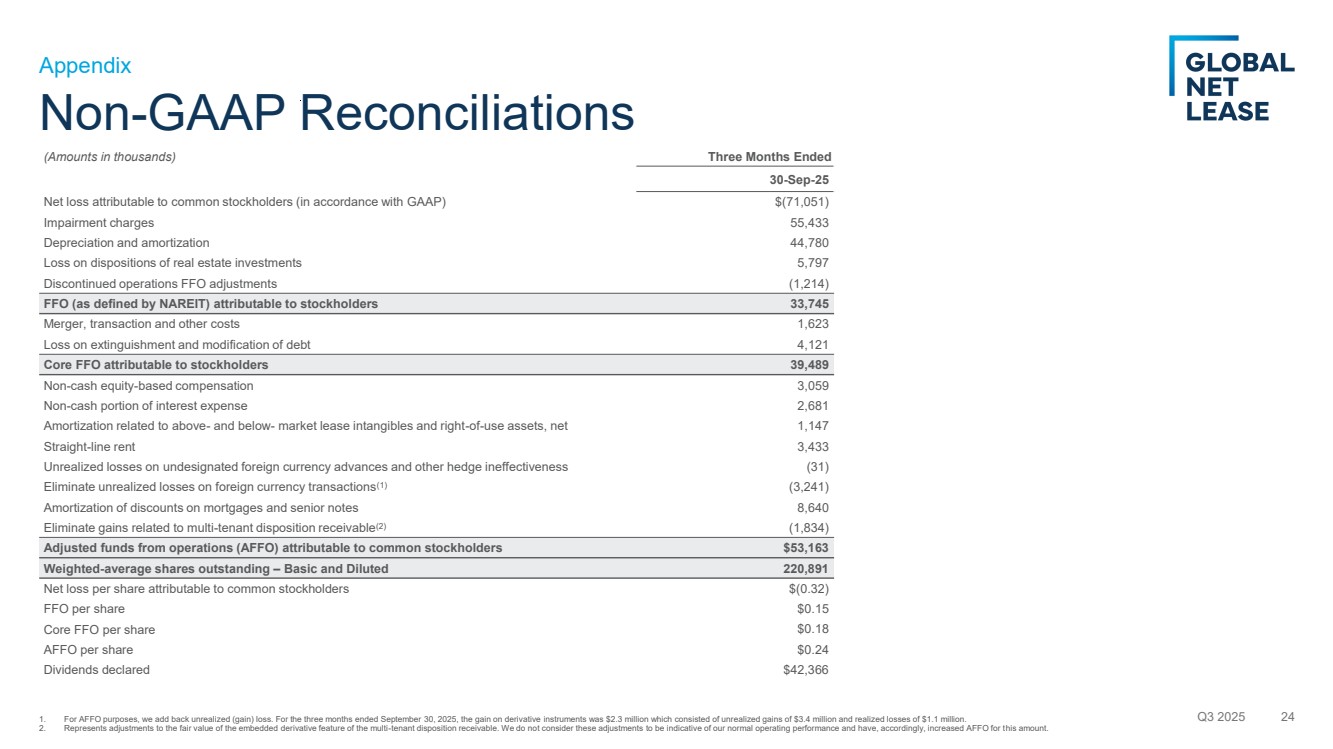
| Non-GAAP Reconciliations (Amounts in thousands) Three Months Ended 30-Sep-25 Net loss attributable to common stockholders (in accordance with GAAP) $(71,051) Impairment charges 55,433 Depreciation and amortization 44,780 Loss on dispositions of real estate investments 5,797 Discontinued operations FFO adjustments (1,214) FFO (as defined by NAREIT) attributable to stockholders 33,745 Merger, transaction and other costs 1,623 Loss on extinguishment and modification of debt 4,121 Core FFO attributable to stockholders 39,489 Non-cash equity-based compensation 3,059 Non-cash portion of interest expense 2,681 Amortization related to above- and below- market lease intangibles and right-of-use assets, net 1,147 Straight-line rent 3,433 Unrealized losses on undesignated foreign currency advances and other hedge ineffectiveness (31) Eliminate unrealized losses on foreign currency transactions(1) (3,241) Amortization of discounts on mortgages and senior notes 8,640 Eliminate gains related to multi-tenant disposition receivable(2) (1,834) Adjusted funds from operations (AFFO) attributable to common stockholders $53,163 Weighted-average shares outstanding – Basic and Diluted 220,891 Net loss per share attributable to common stockholders $(0.32) FFO per share $0.15 Core FFO per share $0.18 AFFO per share $0.24 Dividends declared $42,366 Q3 2025 24 Appendix 1. For AFFO purposes, we add back unrealized (gain) loss. For the three months ended September 30, 2025, the gain on derivative instruments was $2.3 million which consisted of unrealized gains of $3.4 million and realized losses of $1.1 million. 2. Represents adjustments to the fair value of the embedded derivative feature of the multi-tenant disposition receivable. We do not consider these adjustments to be indicative of our normal operating performance and have, accordingly, increased AFFO for this amount. |