INVESTOR PRESENTATION September 2025
2 Disclaimer These materials and any presentation of which they form a part are not intended as an offer to sell, or the solicitation of an offer to purchase, any security, the offer and/or sale of which can only be made by definitive offering documentation. Any offer or solicitation with respect to any securities that may be issued by Ready Capital Corporation (“Ready Capital,” “RC,” or the “Company”) will be made only be means of definitive offering memoranda or prospectus, which will be provided to prospective investors and will contain material information that is not set forth herein, including risk factors relating to any such investment. Neither the Company nor any of its representatives or affiliates makes any representation or warranty, express or implied, as to the accuracy or completeness of the information contained herein and Company and its representatives disclaim all liability to the Recipient relating to, or resulting from, the use of this information. Nothing contained in this document is or shall be relied upon as a promise or representation as to the past, current or future performance of Company. There is no guarantee that any of the estimates, targets or projections illustrated in these materials and any presentation of which they form a part will be achieved. Any references herein to any of the Company’s past or present investments or its past or present performance, have been provided for illustrative purposes only. It should not be assumed that these investments were or will be profitable or that any future investments by the Company will be profitable or will equal the performance of these investments. Past performance is not indicative of future results and there can be no assurance that the Company will achieve comparable results in the future. This presentation contains statements that constitute "forward-looking statements," as such term is defined in Section 27A of the Securities Act of 1933, as amended, and Section 21E of the Securities Exchange Act of 1934, as amended, and such statements are intended to be covered by the safe harbor provided by the same. These statements are based on management's current expectations and beliefs and are subject to a number of trends and uncertainties that could cause actual results to differ materially from those described in the forward-looking statements; the Company can give no assurance that its expectations will be attained. Factors that could cause actual results to differ materially from the Company's expectations include, but are not limited to, applicable regulatory changes; general volatility of the capital markets; changes in the Company’s investment objectives and business strategy; the availability of financing on acceptable terms or at all; the availability, terms and deployment of capital; the availability of suitable investment opportunities; changes in the interest rates or the general economy; increased rates of default and/or decreased recovery rates on investments; changes in interest rates, interest rate spreads, the yield curve or prepayment rates; changes in prepayments of Company’s assets; the degree and nature of competition, including competition for the Company's target assets; and other factors, including those set forth in the Risk Factors section of the Company's most recent Annual Report on Form 10-K filed with the SEC, and other reports filed by the Company with the SEC, copies of which are available on the SEC's website, www.sec.gov. The Company undertakes no obligation to update these statements for revisions or changes after the date of this release, except as required by law. This presentation also contains market statistics and industry data which are subject to uncertainty and are not necessarily reflective of market conditions. These have been derived from third party sources and have not been independently verified by the Company or its affiliates. All material presented is compiled from sources believed to be reliable and current, but accuracy cannot be guaranteed. All data is as of June 30, 2025, unless otherwise noted. This presentation includes certain non-GAAP financial measures, including Distributable Earnings. These non-GAAP financial measures should be considered only as supplemental to, and not as superior to, financial measures in accordance with GAAP. Please refer to the Supplemental Information section for the most recent GAAP information and reconciliation of Distributable Earnings to Net Income.
3 Executive Summary • Ready Capital Corporation (NYSE:RC) (“Ready Capital”, “RC” or the “Company”) is a leading real estate finance company that invests in commercial real estate and small business loans • Ready Capital is organized as a commercial mortgage REIT that is externally managed by Waterfall Asset Management, a successful and proven asset manager with a 20-year investment record and $13Bn+ of AUM • The Company invests in two markets via its ownership in directly held operating companies: – Commercial Real Estate (CRE): o Originates or acquires CRE loans secured by stabilized or transitional real estate o Generally held-for-investment o Earnings driven by net interest and servicing income – Small Business Lending: o Originates and services owner-occupied loans, guaranteed by the Small Business Administration (SBA) and the U.S. Department of Agriculture (USDA) o One of only 16 non-bank SBA license holders, and granted preferred lender status by the SBA o Earnings driven by gain on sale, servicing and interest income o Guaranteed portions sold after origination at ~10% cash gains, with unguaranteed held-for-investment

Business Overview 1
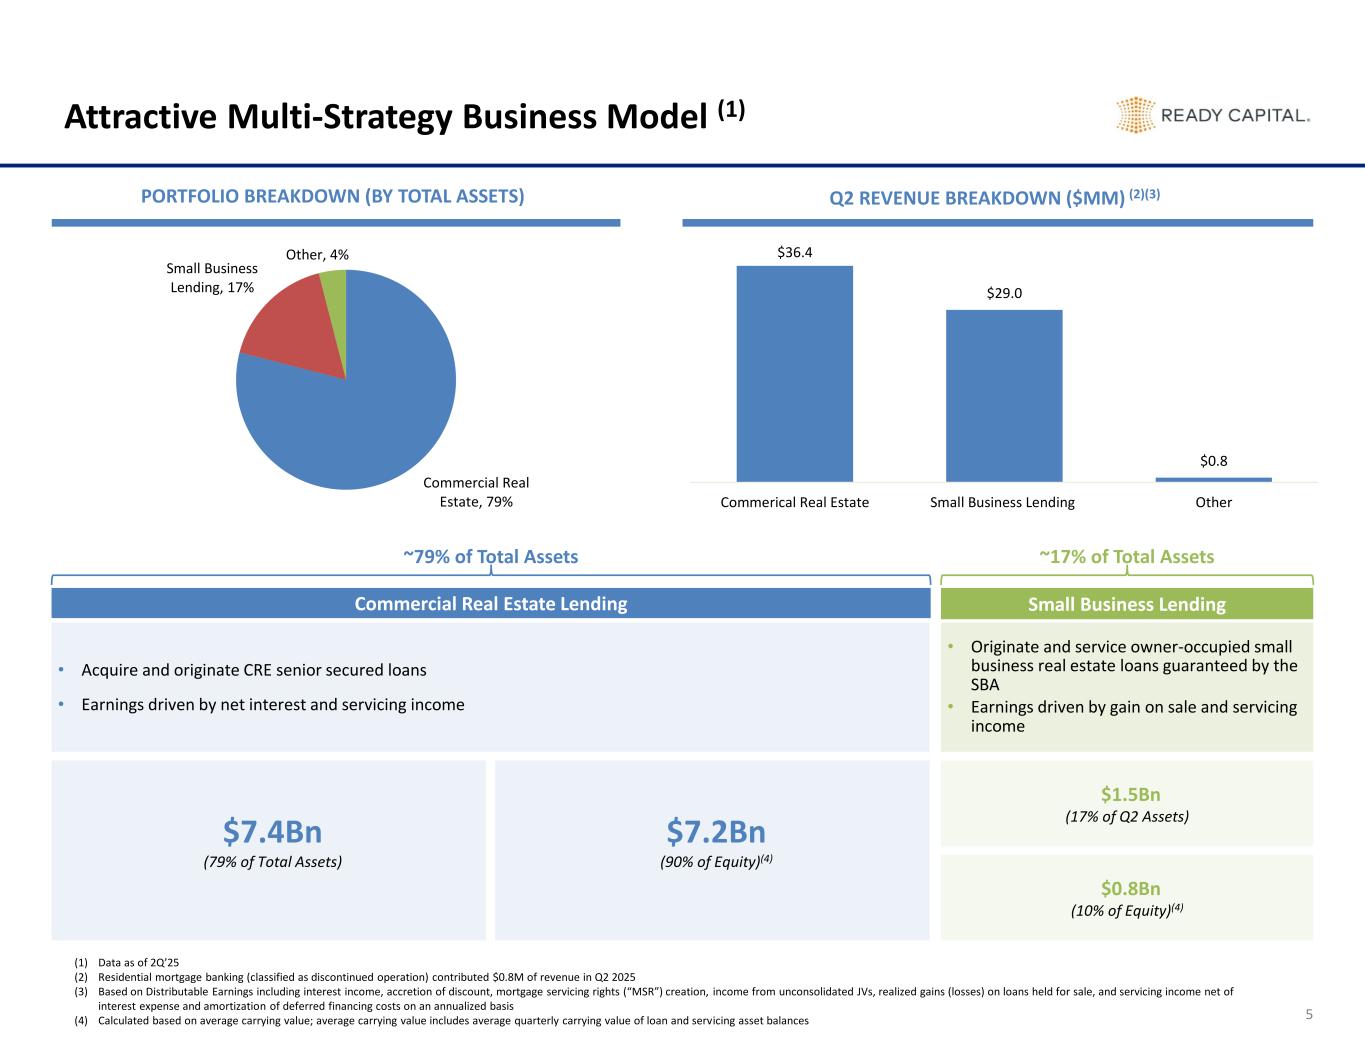
$36.4 $29.0 $0.8 Commerical Real Estate Small Business Lending Other Commercial Real Estate, 79% Small Business Lending, 17% Other, 4% Attractive Multi-Strategy Business Model (1) 5 • Acquire and originate CRE senior secured loans • Earnings driven by net interest and servicing income • Originate and service owner-occupied small business real estate loans guaranteed by the SBA • Earnings driven by gain on sale and servicing income ~79% of Total Assets ~17% of Total Assets Commercial Real Estate Lending Small Business Lending $7.4Bn (79% of Total Assets) $7.2Bn (90% of Equity)(4) $0.8Bn (10% of Equity)(4) $1.5Bn (17% of Q2 Assets) PORTFOLIO BREAKDOWN (BY TOTAL ASSETS) Q2 REVENUE BREAKDOWN ($MM) (2)(3) (1) Data as of 2Q’25 (2) Residential mortgage banking (classified as discontinued operation) contributed $0.8M of revenue in Q2 2025 (3) Based on Distributable Earnings including interest income, accretion of discount, mortgage servicing rights (“MSR”) creation, income from unconsolidated JVs, realized gains (losses) on loans held for sale, and servicing income net of interest expense and amortization of deferred financing costs on an annualized basis (4) Calculated based on average carrying value; average carrying value includes average quarterly carrying value of loan and servicing asset balances
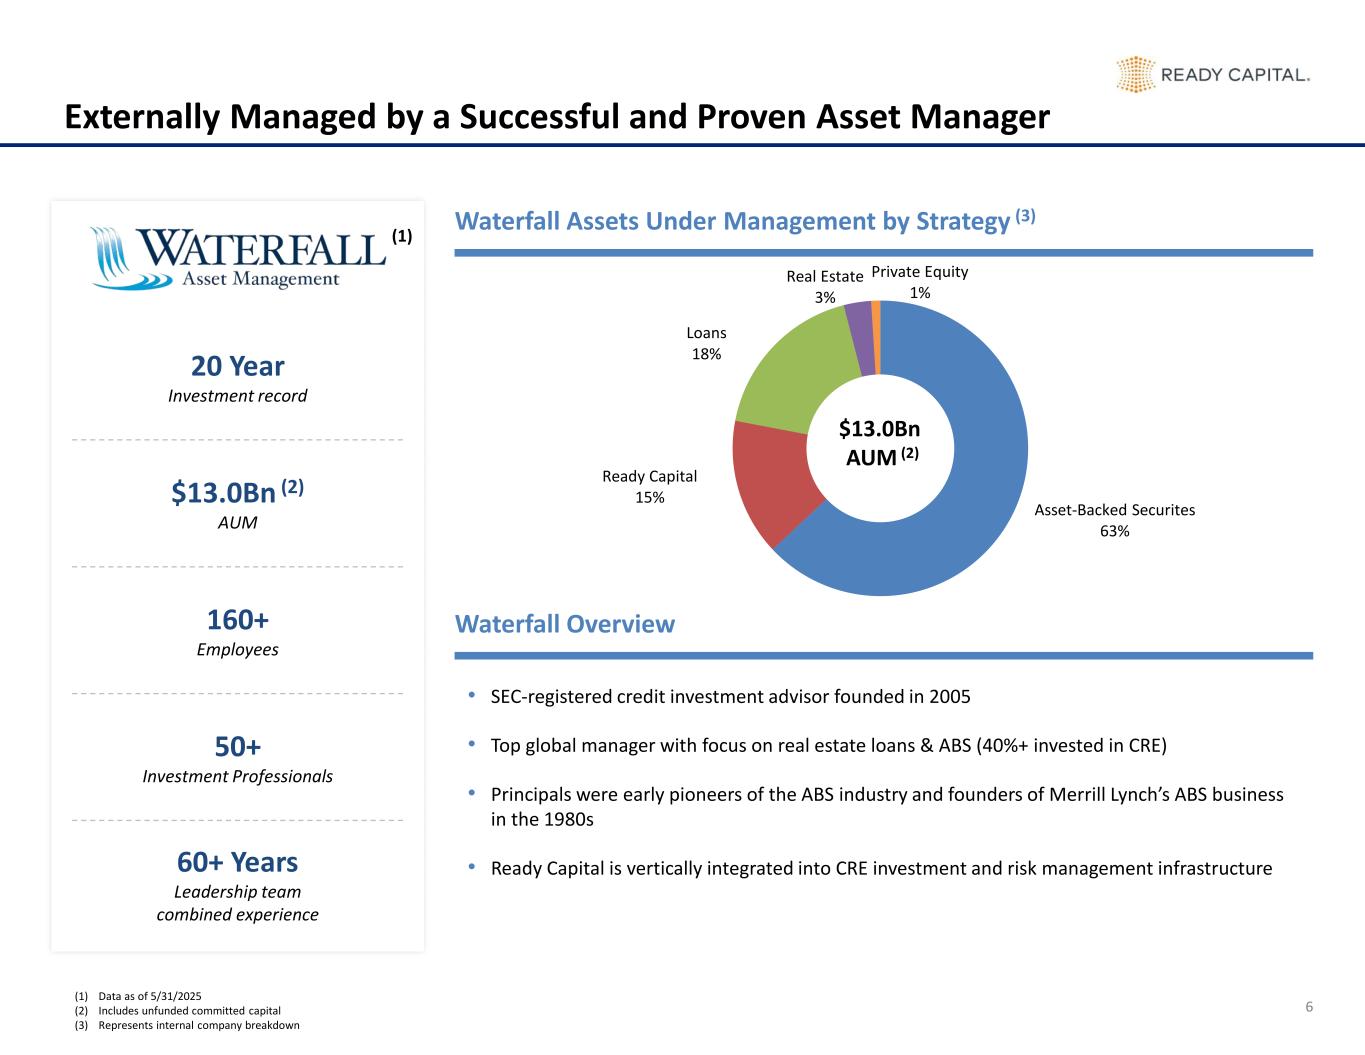
Asset-Backed Securites 63% Ready Capital 15% Loans 18% Real Estate 3% Private Equity 1% 6 Externally Managed by a Successful and Proven Asset Manager 20 Year Investment record $13.0Bn (2) AUM 160+ Employees 50+ Investment Professionals 60+ Years Leadership team combined experience • SEC-registered credit investment advisor founded in 2005 • Top global manager with focus on real estate loans & ABS (40%+ invested in CRE) • Principals were early pioneers of the ABS industry and founders of Merrill Lynch’s ABS business in the 1980s • Ready Capital is vertically integrated into CRE investment and risk management infrastructure $13.0Bn AUM (2) Waterfall Assets Under Management by Strategy (3) Waterfall Overview (1) Data as of 5/31/2025 (2) Includes unfunded committed capital (3) Represents internal company breakdown (1)
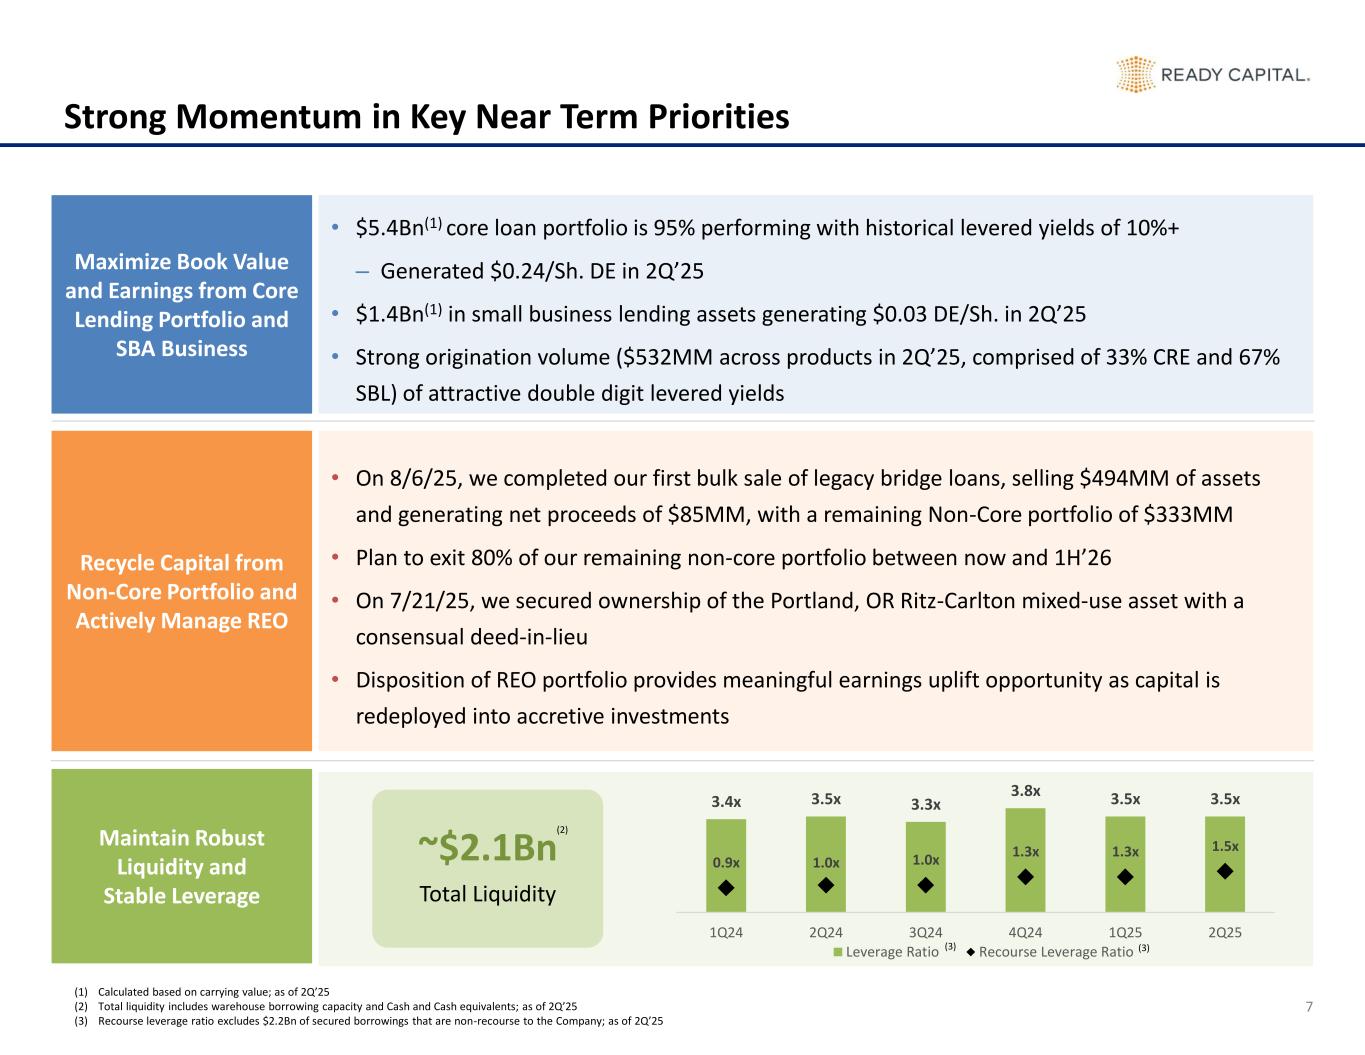
3.4x 3.5x 3.3x 3.8x 3.5x 3.5x 0.9x 1.0x 1.0x 1.3x 1.3x 1.5x 1Q24 2Q24 3Q24 4Q24 1Q25 2Q25 Leverage Ratio Recourse Leverage Ratio 7 Strong Momentum in Key Near Term Priorities • $5.4Bn(1) core loan portfolio is 95% performing with historical levered yields of 10%+ – Generated $0.24/Sh. DE in 2Q’25 • $1.4Bn(1) in small business lending assets generating $0.03 DE/Sh. in 2Q’25 • Strong origination volume ($532MM across products in 2Q’25, comprised of 33% CRE and 67% SBL) of attractive double digit levered yields • On 8/6/25, we completed our first bulk sale of legacy bridge loans, selling $494MM of assets and generating net proceeds of $85MM, with a remaining Non-Core portfolio of $333MM • Plan to exit 80% of our remaining non-core portfolio between now and 1H’26 • On 7/21/25, we secured ownership of the Portland, OR Ritz-Carlton mixed-use asset with a consensual deed-in-lieu • Disposition of REO portfolio provides meaningful earnings uplift opportunity as capital is redeployed into accretive investments Maximize Book Value and Earnings from Core Lending Portfolio and SBA Business Recycle Capital from Non-Core Portfolio and Actively Manage REO Maintain Robust Liquidity and Stable Leverage (3) (3) (1) Calculated based on carrying value; as of 2Q’25 (2) Total liquidity includes warehouse borrowing capacity and Cash and Cash equivalents; as of 2Q’25 (3) Recourse leverage ratio excludes $2.2Bn of secured borrowings that are non-recourse to the Company; as of 2Q’25 (2) ~$2.1Bn Total Liquidity

Key Credit Highlights 2
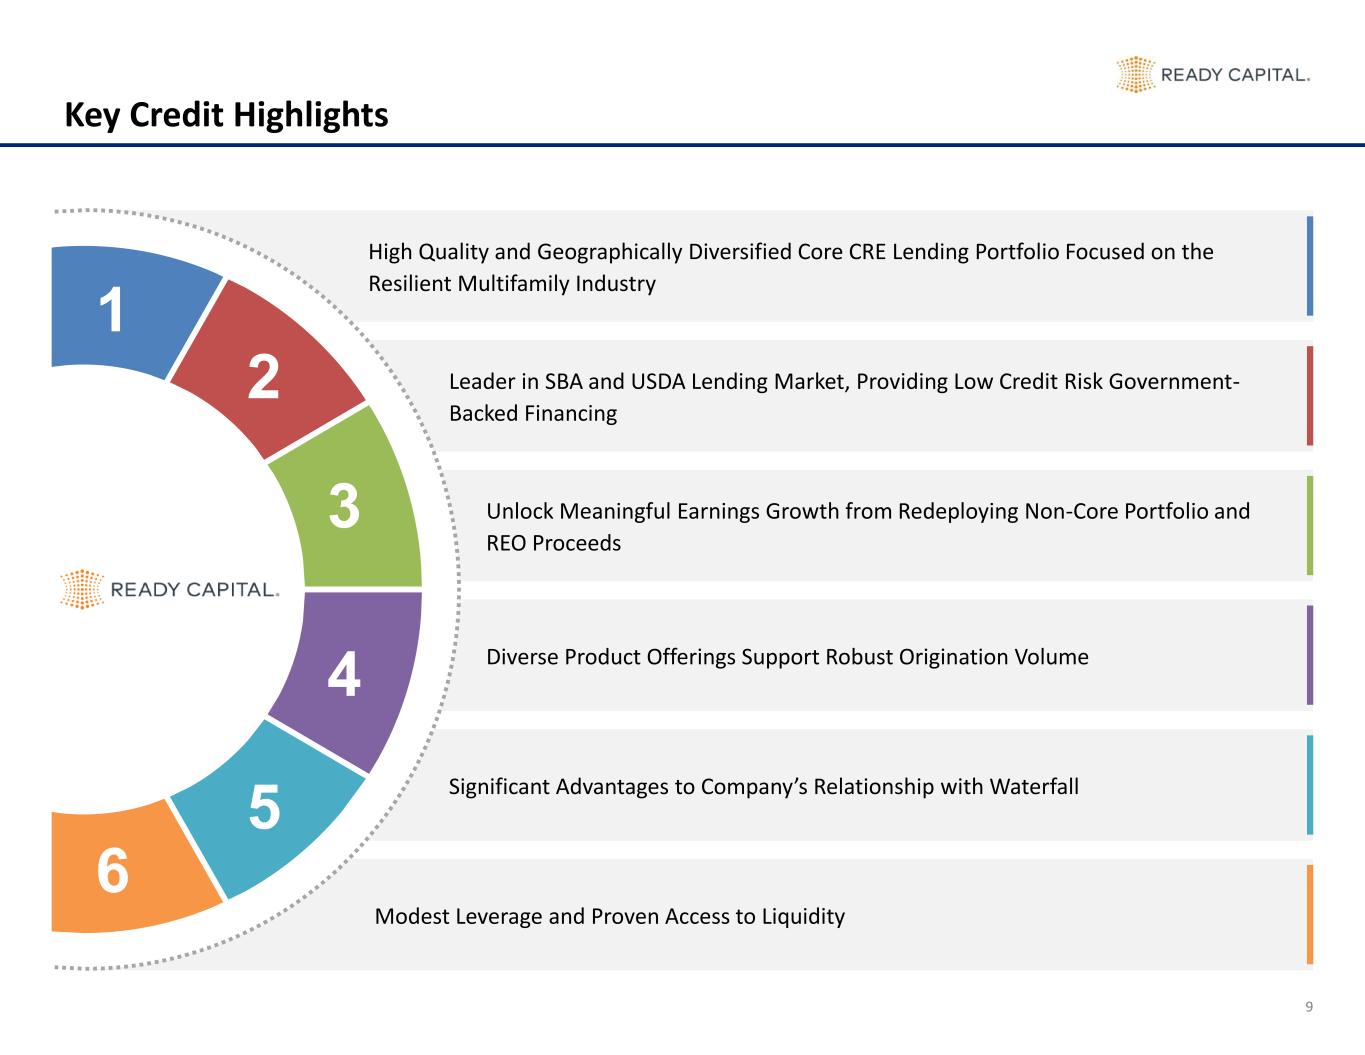
9 Key Credit Highlights High Quality and Geographically Diversified Core CRE Lending Portfolio Focused on the Resilient Multifamily Industry Leader in SBA and USDA Lending Market, Providing Low Credit Risk Government- Backed Financing Unlock Meaningful Earnings Growth from Redeploying Non-Core Portfolio and REO Proceeds Diverse Product Offerings Support Robust Origination Volume Significant Advantages to Company’s Relationship with Waterfall Modest Leverage and Proven Access to Liquidity 1 2 3 4 5 6
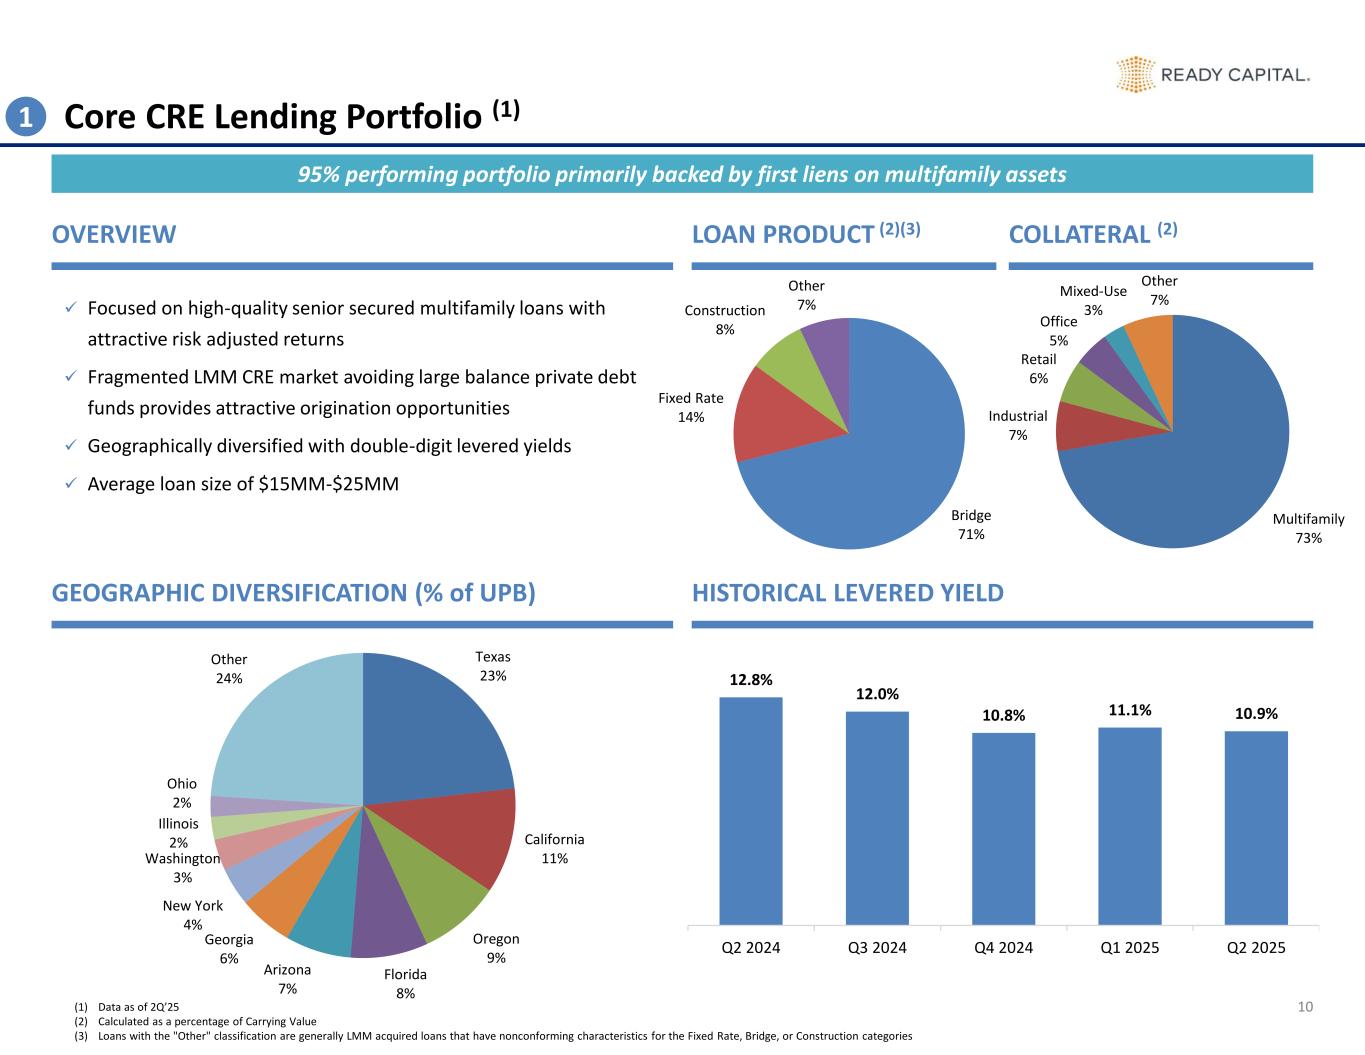
Texas 23% California 11% Oregon 9% Florida 8% Arizona 7% Georgia 6% New York 4% Washington 3% Illinois 2% Ohio 2% Other 24% Bridge 71% Fixed Rate 14% Construction 8% Other 7% Multifamily 73% Industrial 7% Retail 6% Office 5% Mixed-Use 3% Other 7% 12.8% 12.0% 10.8% 11.1% 10.9% Q2 2024 Q3 2024 Q4 2024 Q1 2025 Q2 2025 10 Core CRE Lending Portfolio (1) OVERVIEW HISTORICAL LEVERED YIELD ✓ Focused on high-quality senior secured multifamily loans with attractive risk adjusted returns ✓ Fragmented LMM CRE market avoiding large balance private debt funds provides attractive origination opportunities ✓ Geographically diversified with double-digit levered yields ✓ Average loan size of $15MM-$25MM GEOGRAPHIC DIVERSIFICATION (% of UPB) LOAN PRODUCT (2)(3) COLLATERAL (2) 1 95% performing portfolio primarily backed by first liens on multifamily assets (1) Data as of 2Q’25 (2) Calculated as a percentage of Carrying Value (3) Loans with the "Other" classification are generally LMM acquired loans that have nonconforming characteristics for the Fixed Rate, Bridge, or Construction categories
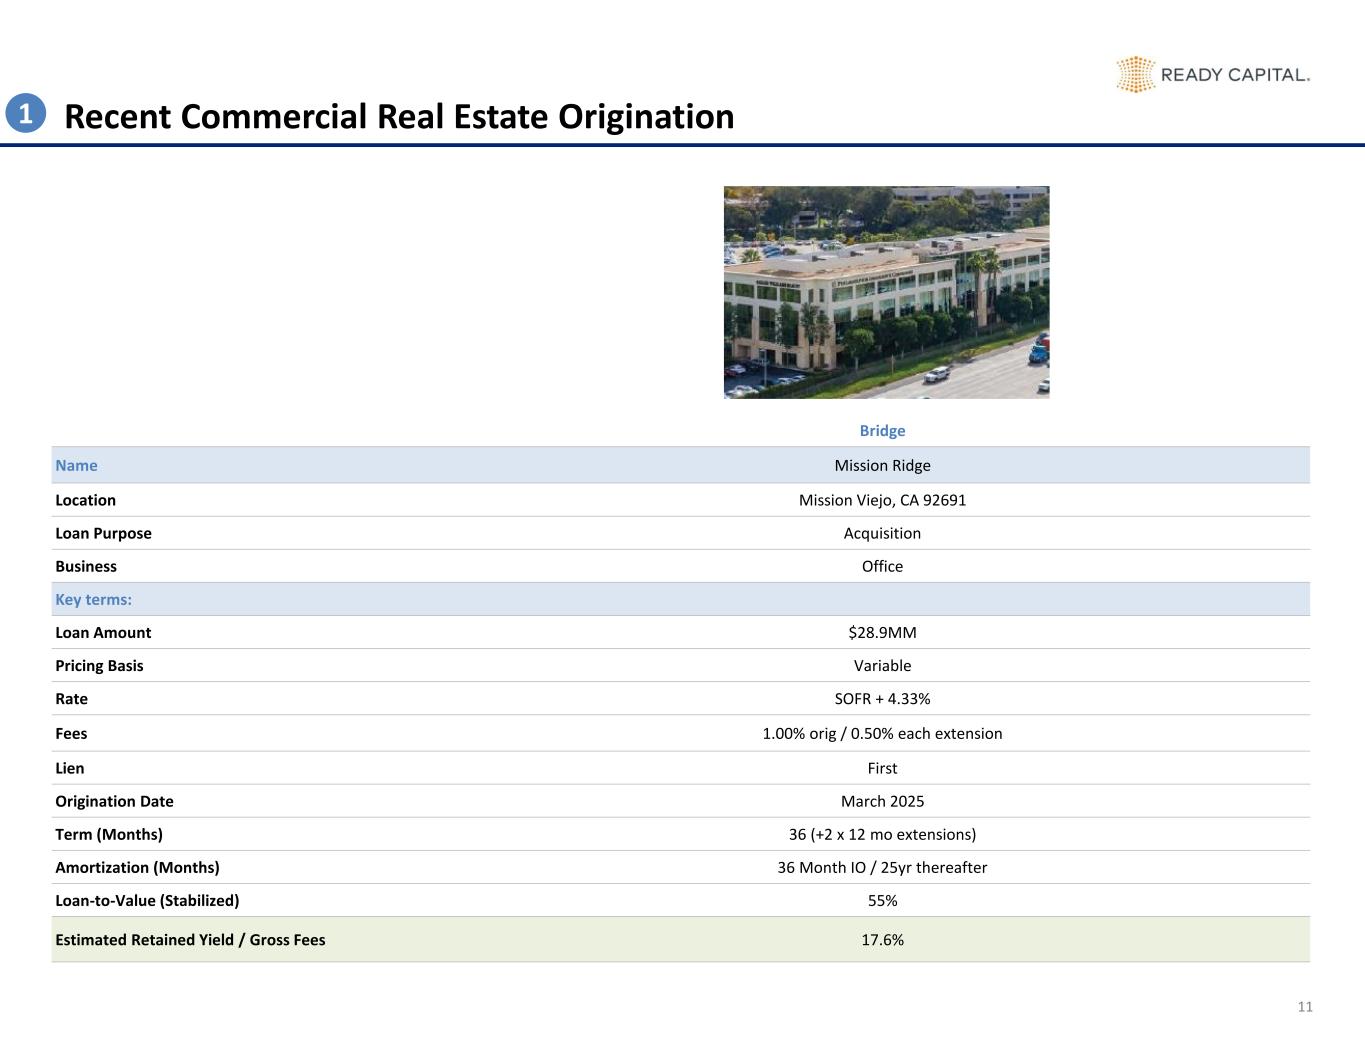
11 Recent Commercial Real Estate Origination Bridge Name Mission Ridge Location Mission Viejo, CA 92691 Loan Purpose Acquisition Business Office Key terms: Loan Amount $28.9MM Pricing Basis Variable Rate SOFR + 4.33% Fees 1.00% orig / 0.50% each extension Lien First Origination Date March 2025 Term (Months) 36 (+2 x 12 mo extensions) Amortization (Months) 36 Month IO / 25yr thereafter Loan-to-Value (Stabilized) 55% Estimated Retained Yield / Gross Fees 17.6% 1
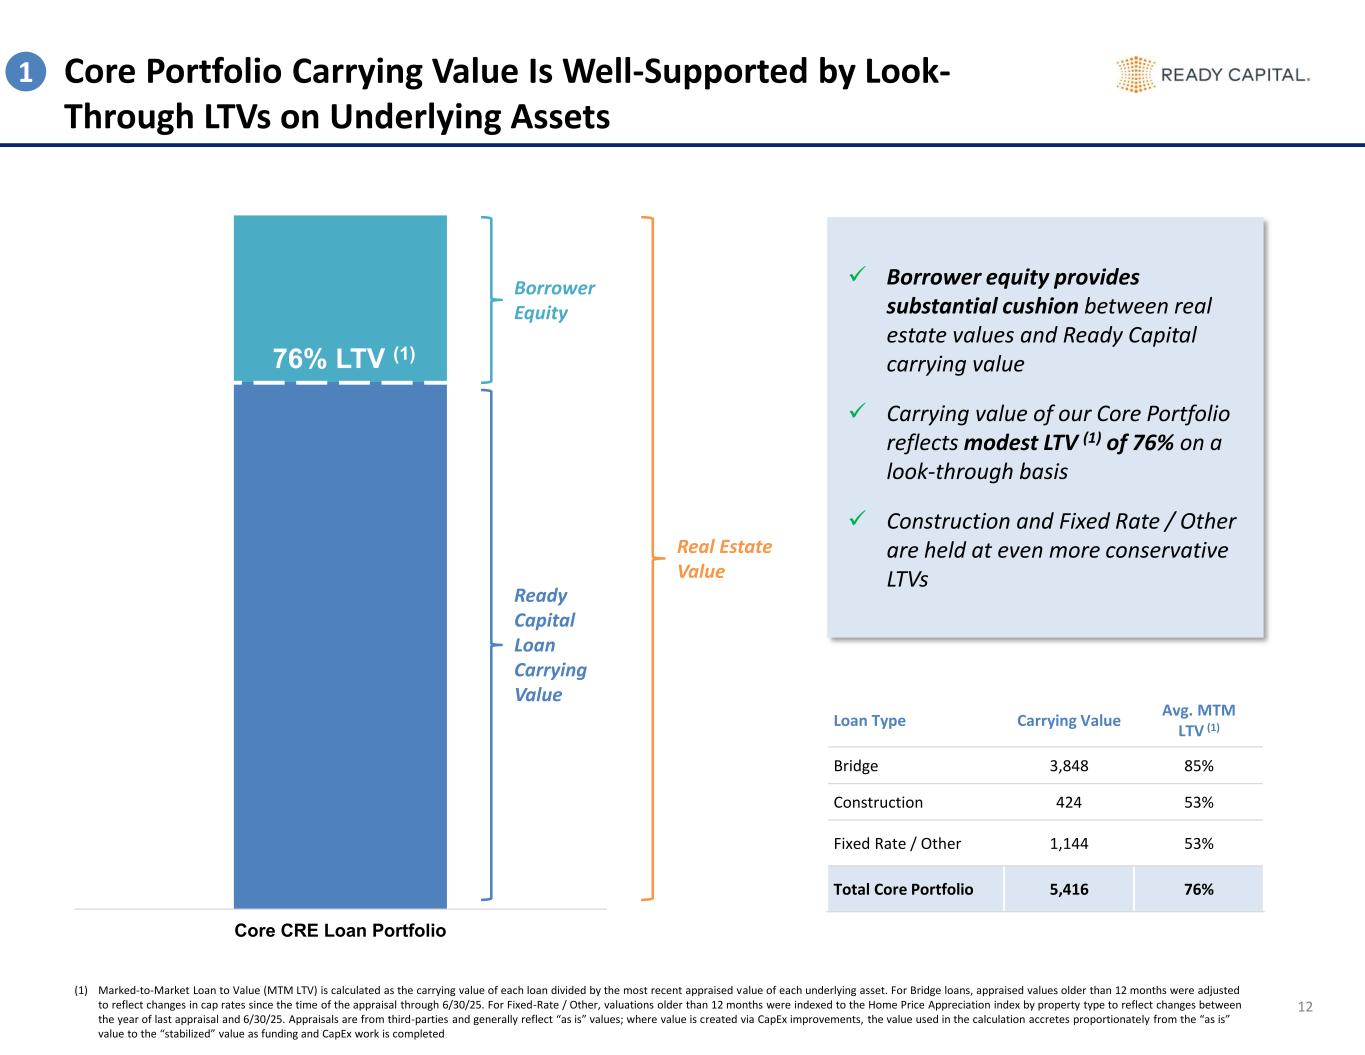
Core CRE Loan Portfolio 76% LTV (1) Core Portfolio Carrying Value Is Well-Supported by Look- Through LTVs on Underlying Assets 12 ✓ Borrower equity provides substantial cushion between real estate values and Ready Capital carrying value ✓ Carrying value of our Core Portfolio reflects modest LTV (1) of 76% on a look-through basis ✓ Construction and Fixed Rate / Other are held at even more conservative LTVs Loan Type Carrying Value Avg. MTM LTV (1) Bridge 3,848 85% Construction 424 53% Fixed Rate / Other 1,144 53% Total Core Portfolio 5,416 76% Borrower Equity Ready Capital Loan Carrying Value Real Estate Value (1) Marked-to-Market Loan to Value (MTM LTV) is calculated as the carrying value of each loan divided by the most recent appraised value of each underlying asset. For Bridge loans, appraised values older than 12 months were adjusted to reflect changes in cap rates since the time of the appraisal through 6/30/25. For Fixed-Rate / Other, valuations older than 12 months were indexed to the Home Price Appreciation index by property type to reflect changes between the year of last appraisal and 6/30/25. Appraisals are from third-parties and generally reflect “as is” values; where value is created via CapEx improvements, the value used in the calculation accretes proportionately from the “as is” value to the “stabilized” value as funding and CapEx work is completed 1
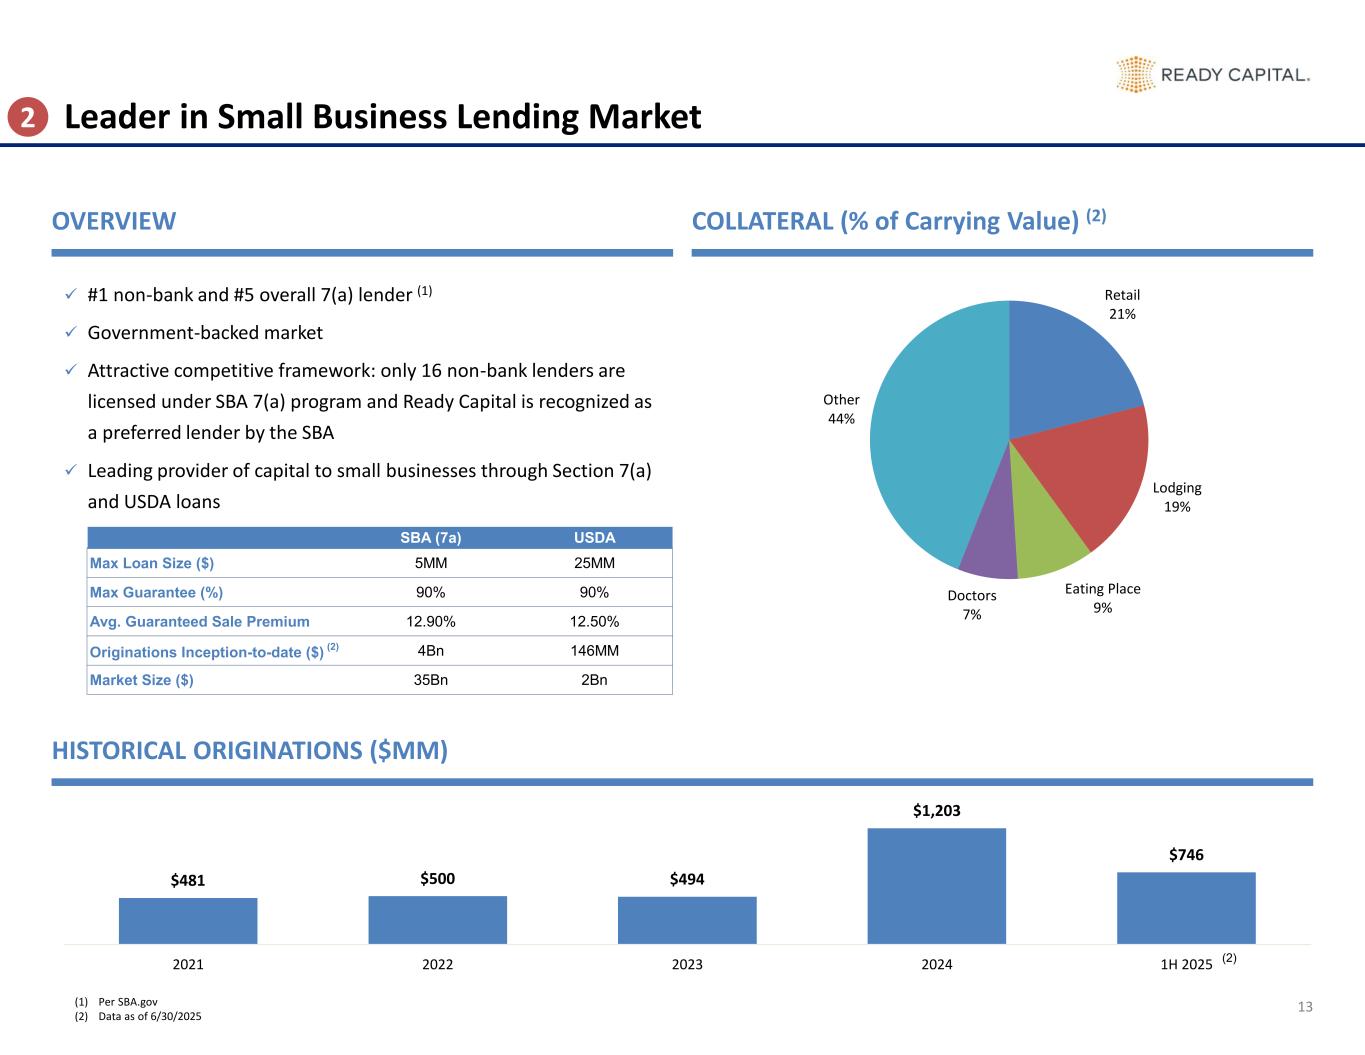
SBA (7a) USDA Max Loan Size ($) 5MM 25MM Max Guarantee (%) 90% 90% Avg. Guaranteed Sale Premium 12.90% 12.50% Originations Inception-to-date ($) (2) 4Bn 146MM Market Size ($) 35Bn 2Bn $481 $500 $494 $1,203 $746 2021 2022 2023 2024 1H 2025 (2) Retail 21% Lodging 19% Eating Place 9% Doctors 7% Other 44% 13 Leader in Small Business Lending Market HISTORICAL ORIGINATIONS ($MM) ✓ #1 non-bank and #5 overall 7(a) lender (1) ✓ Government-backed market ✓ Attractive competitive framework: only 16 non-bank lenders are licensed under SBA 7(a) program and Ready Capital is recognized as a preferred lender by the SBA ✓ Leading provider of capital to small businesses through Section 7(a) and USDA loans OVERVIEW COLLATERAL (% of Carrying Value) (2) 2 (1) Per SBA.gov (2) Data as of 6/30/2025
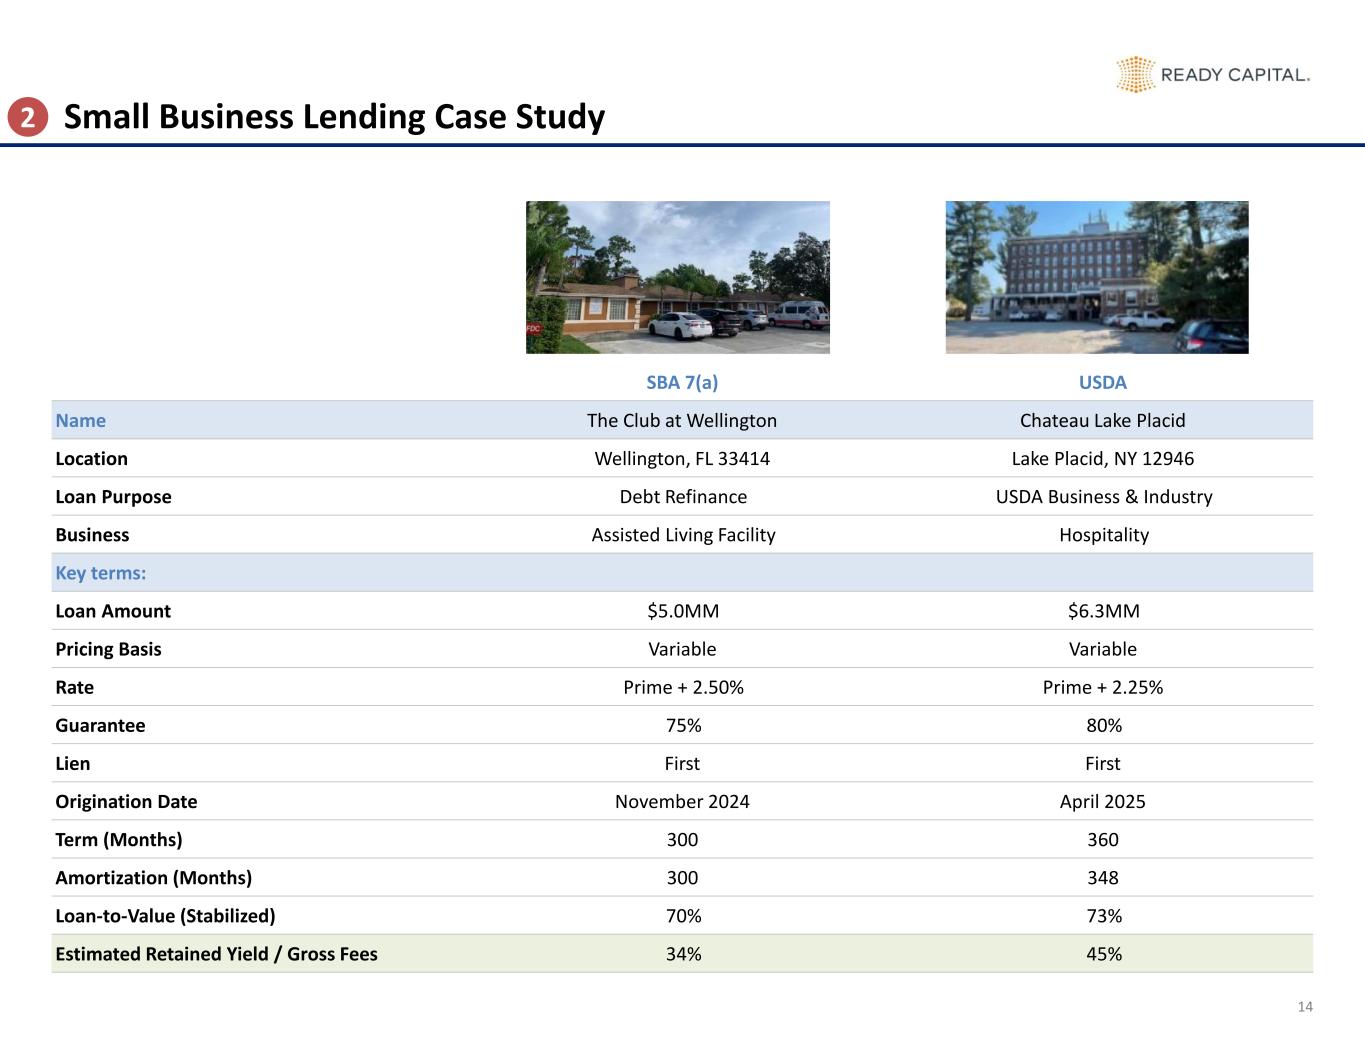
14 Small Business Lending Case Study SBA 7(a) USDA Name The Club at Wellington Chateau Lake Placid Location Wellington, FL 33414 Lake Placid, NY 12946 Loan Purpose Debt Refinance USDA Business & Industry Business Assisted Living Facility Hospitality Key terms: Loan Amount $5.0MM $6.3MM Pricing Basis Variable Variable Rate Prime + 2.50% Prime + 2.25% Guarantee 75% 80% Lien First First Origination Date November 2024 April 2025 Term (Months) 300 360 Amortization (Months) 300 348 Loan-to-Value (Stabilized) 70% 73% Estimated Retained Yield / Gross Fees 34% 45% 2
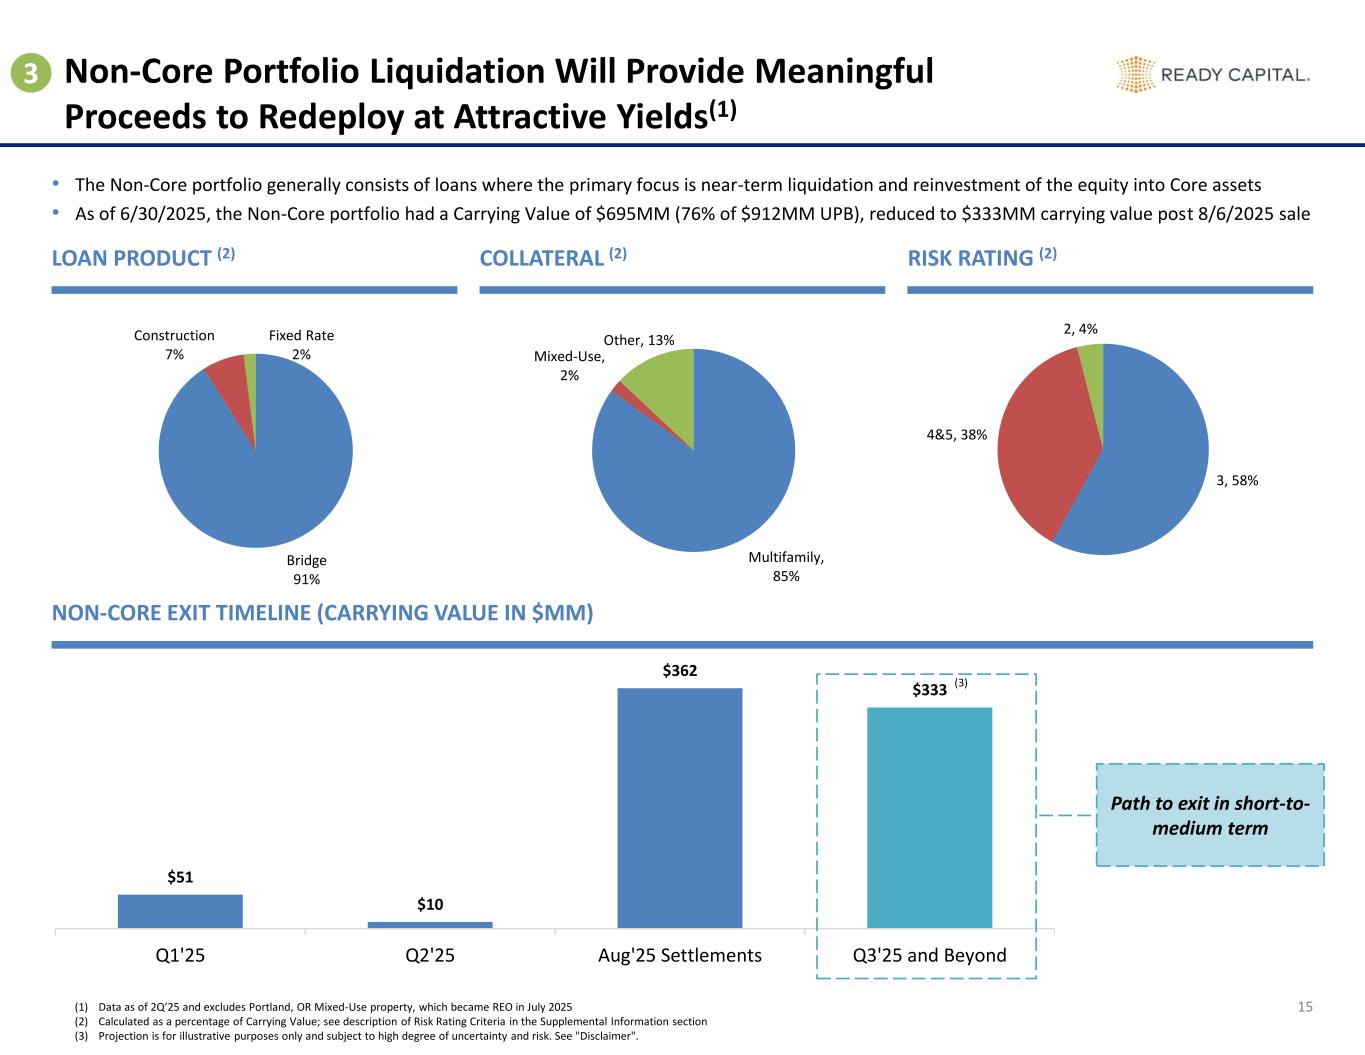
$51 $10 $362 $333 Q1'25 Q2'25 Aug'25 Settlements Q3'25 and Beyond Bridge 91% Construction 7% Fixed Rate 2% Multifamily, 85% Mixed-Use, 2% Other, 13% 3, 58% 4&5, 38% 2, 4% 15 Non-Core Portfolio Liquidation Will Provide Meaningful Proceeds to Redeploy at Attractive Yields(1) LOAN PRODUCT (2) RISK RATING (2) NON-CORE EXIT TIMELINE (CARRYING VALUE IN $MM) COLLATERAL (2) 3 (1) Data as of 2Q’25 and excludes Portland, OR Mixed-Use property, which became REO in July 2025 (2) Calculated as a percentage of Carrying Value; see description of Risk Rating Criteria in the Supplemental Information section (3) Projection is for illustrative purposes only and subject to high degree of uncertainty and risk. See "Disclaimer". • The Non-Core portfolio generally consists of loans where the primary focus is near-term liquidation and reinvestment of the equity into Core assets • As of 6/30/2025, the Non-Core portfolio had a Carrying Value of $695MM (76% of $912MM UPB), reduced to $333MM carrying value post 8/6/2025 sale Path to exit in short-to- medium term (3)
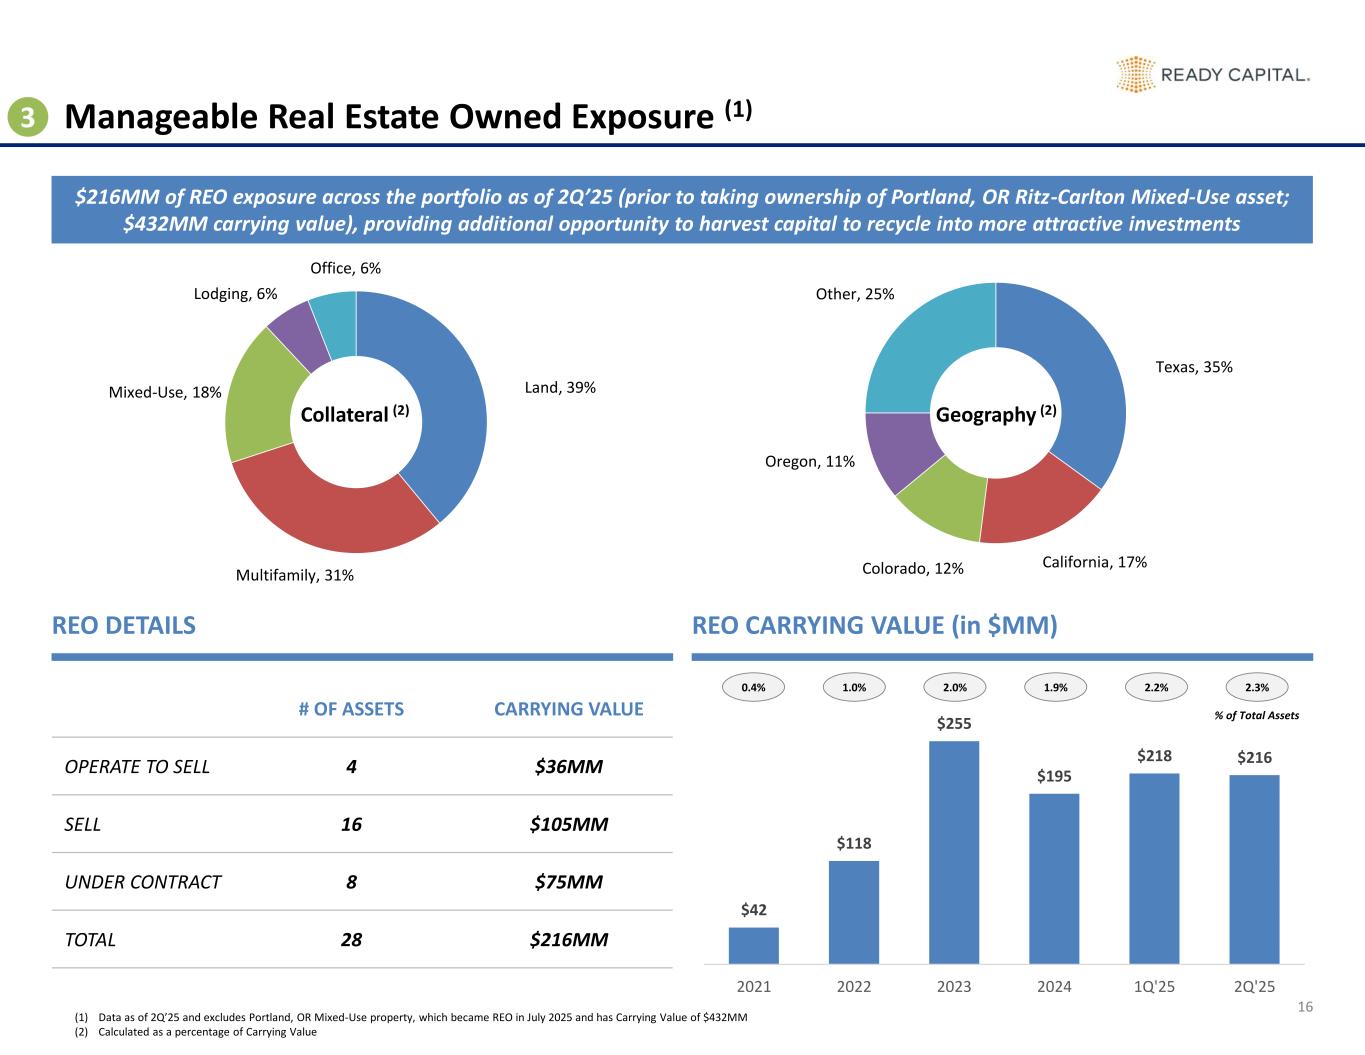
$42 $118 $255 $195 $218 $216 2021 2022 2023 2024 1Q'25 2Q'25 Land, 39% Multifamily, 31% Mixed-Use, 18% Lodging, 6% Office, 6% Texas, 35% California, 17%Colorado, 12% Oregon, 11% Other, 25% 16 Manageable Real Estate Owned Exposure (1) REO DETAILS REO CARRYING VALUE (in $MM) # OF ASSETS CARRYING VALUE OPERATE TO SELL 4 $36MM SELL 16 $105MM UNDER CONTRACT 8 $75MM TOTAL 28 $216MM Collateral (2) Geography (2) 0.4% 1.0% 2.0% 1.9% 2.2% % of Total Assets $216MM of REO exposure across the portfolio as of 2Q’25 (prior to taking ownership of Portland, OR Ritz-Carlton Mixed-Use asset; $432MM carrying value), providing additional opportunity to harvest capital to recycle into more attractive investments 3 2.3% (1) Data as of 2Q’25 and excludes Portland, OR Mixed-Use property, which became REO in July 2025 and has Carrying Value of $432MM (2) Calculated as a percentage of Carrying Value
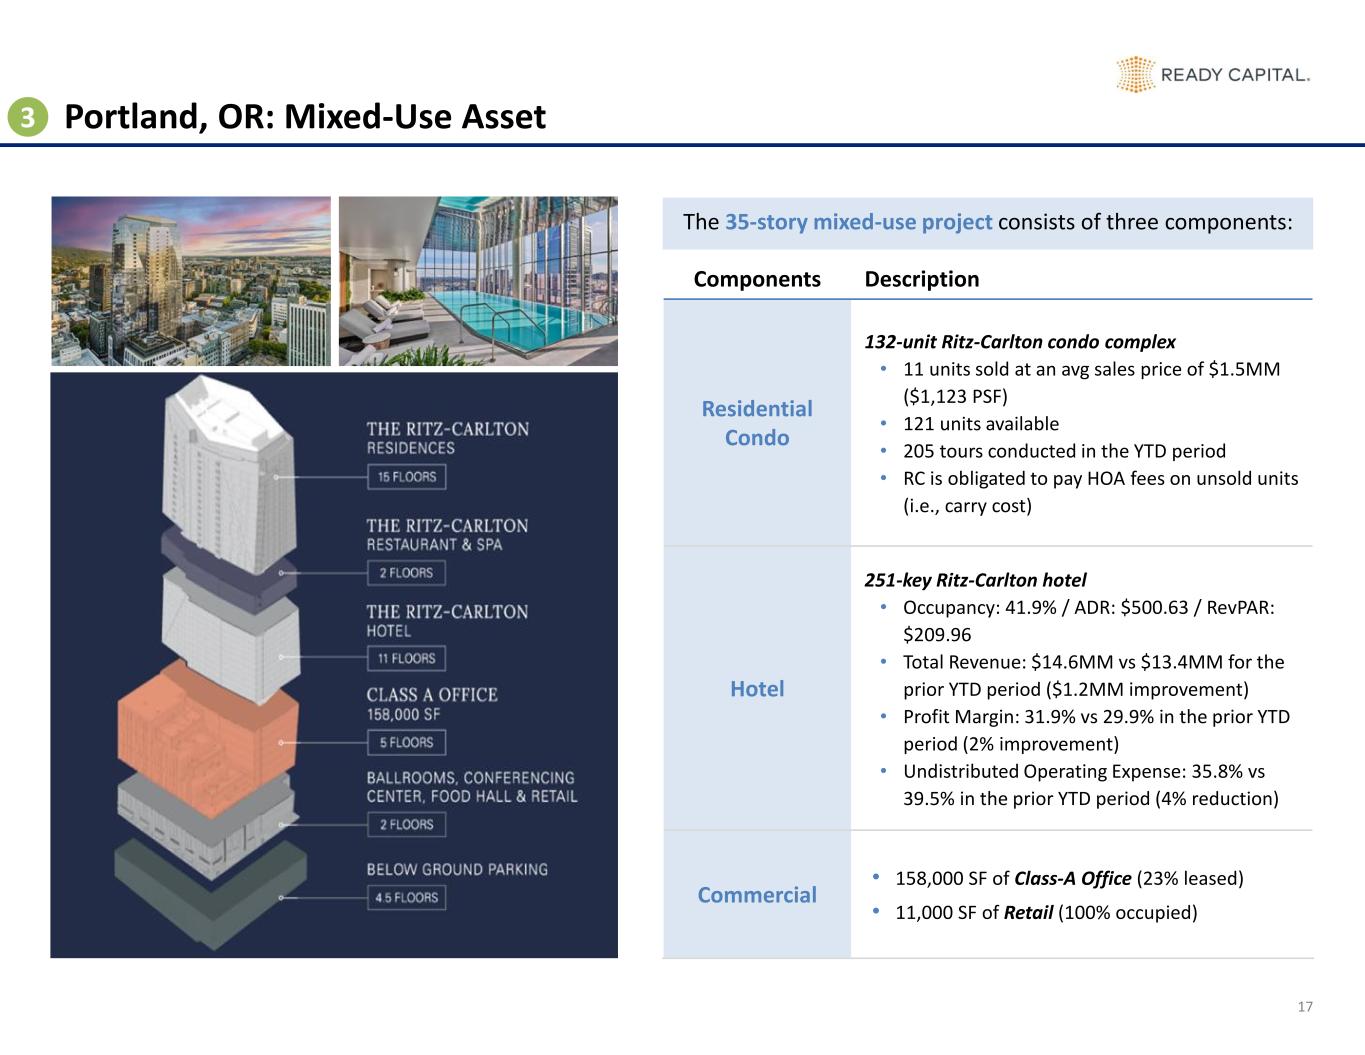
17 Portland, OR: Mixed-Use Asset3 Components Description Residential Condo 132-unit Ritz-Carlton condo complex • 11 units sold at an avg sales price of $1.5MM ($1,123 PSF) • 121 units available • 205 tours conducted in the YTD period • RC is obligated to pay HOA fees on unsold units (i.e., carry cost) Hotel 251-key Ritz-Carlton hotel • Occupancy: 41.9% / ADR: $500.63 / RevPAR: $209.96 • Total Revenue: $14.6MM vs $13.4MM for the prior YTD period ($1.2MM improvement) • Profit Margin: 31.9% vs 29.9% in the prior YTD period (2% improvement) • Undistributed Operating Expense: 35.8% vs 39.5% in the prior YTD period (4% reduction) Commercial • 158,000 SF of Class-A Office (23% leased) • 11,000 SF of Retail (100% occupied) The 35-story mixed-use project consists of three components:
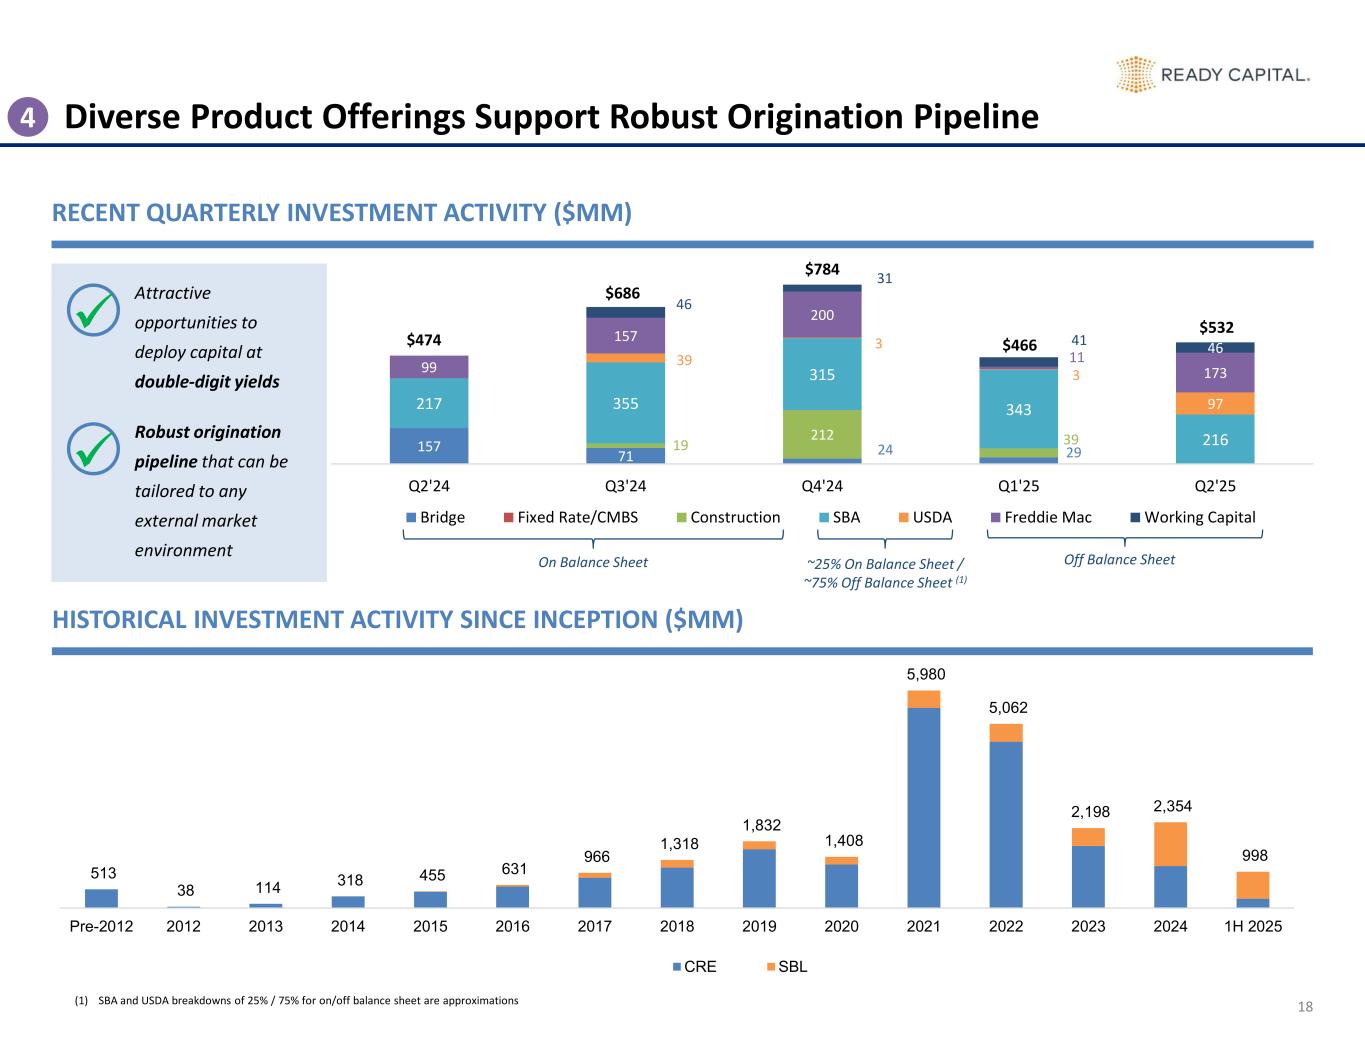
513 38 114 318 455 631 966 1,318 1,832 1,408 5,980 5,062 2,198 2,354 998 Pre-2012 2012 2013 2014 2015 2016 2017 2018 2019 2020 2021 2022 2023 2024 1H 2025 CRE SBL 18 Diverse Product Offerings Support Robust Origination Pipeline RECENT QUARTERLY INVESTMENT ACTIVITY ($MM) 4 157 71 24 2919 212 39 217 355 315 343 216 39 3 3 97 99 157 200 11 173 46 31 41 46 Q2'24 Q3'24 Q4'24 Q1'25 Q2'25 Bridge Fixed Rate/CMBS Construction SBA USDA Freddie Mac Working Capital $474 $686 $784 $466 $532 (1) SBA and USDA breakdowns of 25% / 75% for on/off balance sheet are approximations ✓ ✓ Attractive opportunities to deploy capital at double-digit yields Robust origination pipeline that can be tailored to any external market environment On Balance Sheet Off Balance Sheet~25% On Balance Sheet / ~75% Off Balance Sheet (1) HISTORICAL INVESTMENT ACTIVITY SINCE INCEPTION ($MM)
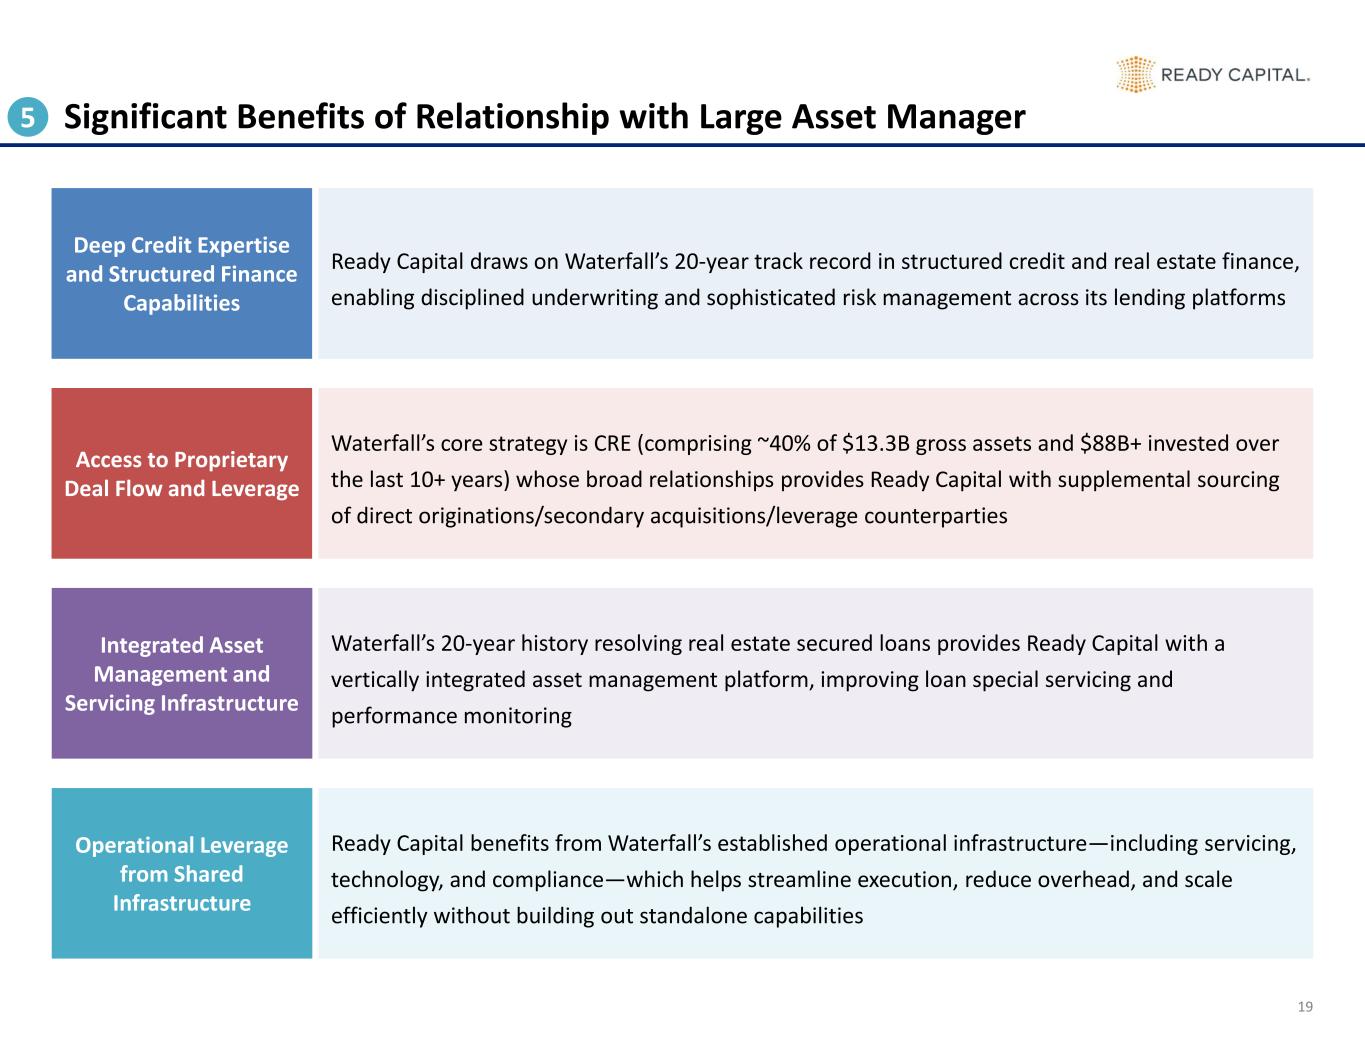
19 Significant Benefits of Relationship with Large Asset Manager5 Ready Capital draws on Waterfall’s 20-year track record in structured credit and real estate finance, enabling disciplined underwriting and sophisticated risk management across its lending platforms Deep Credit Expertise and Structured Finance Capabilities Waterfall’s core strategy is CRE (comprising ~40% of $13.3B gross assets and $88B+ invested over the last 10+ years) whose broad relationships provides Ready Capital with supplemental sourcing of direct originations/secondary acquisitions/leverage counterparties Access to Proprietary Deal Flow and Leverage Waterfall’s 20-year history resolving real estate secured loans provides Ready Capital with a vertically integrated asset management platform, improving loan special servicing and performance monitoring Integrated Asset Management and Servicing Infrastructure Ready Capital benefits from Waterfall’s established operational infrastructure—including servicing, technology, and compliance—which helps streamline execution, reduce overhead, and scale efficiently without building out standalone capabilities Operational Leverage from Shared Infrastructure
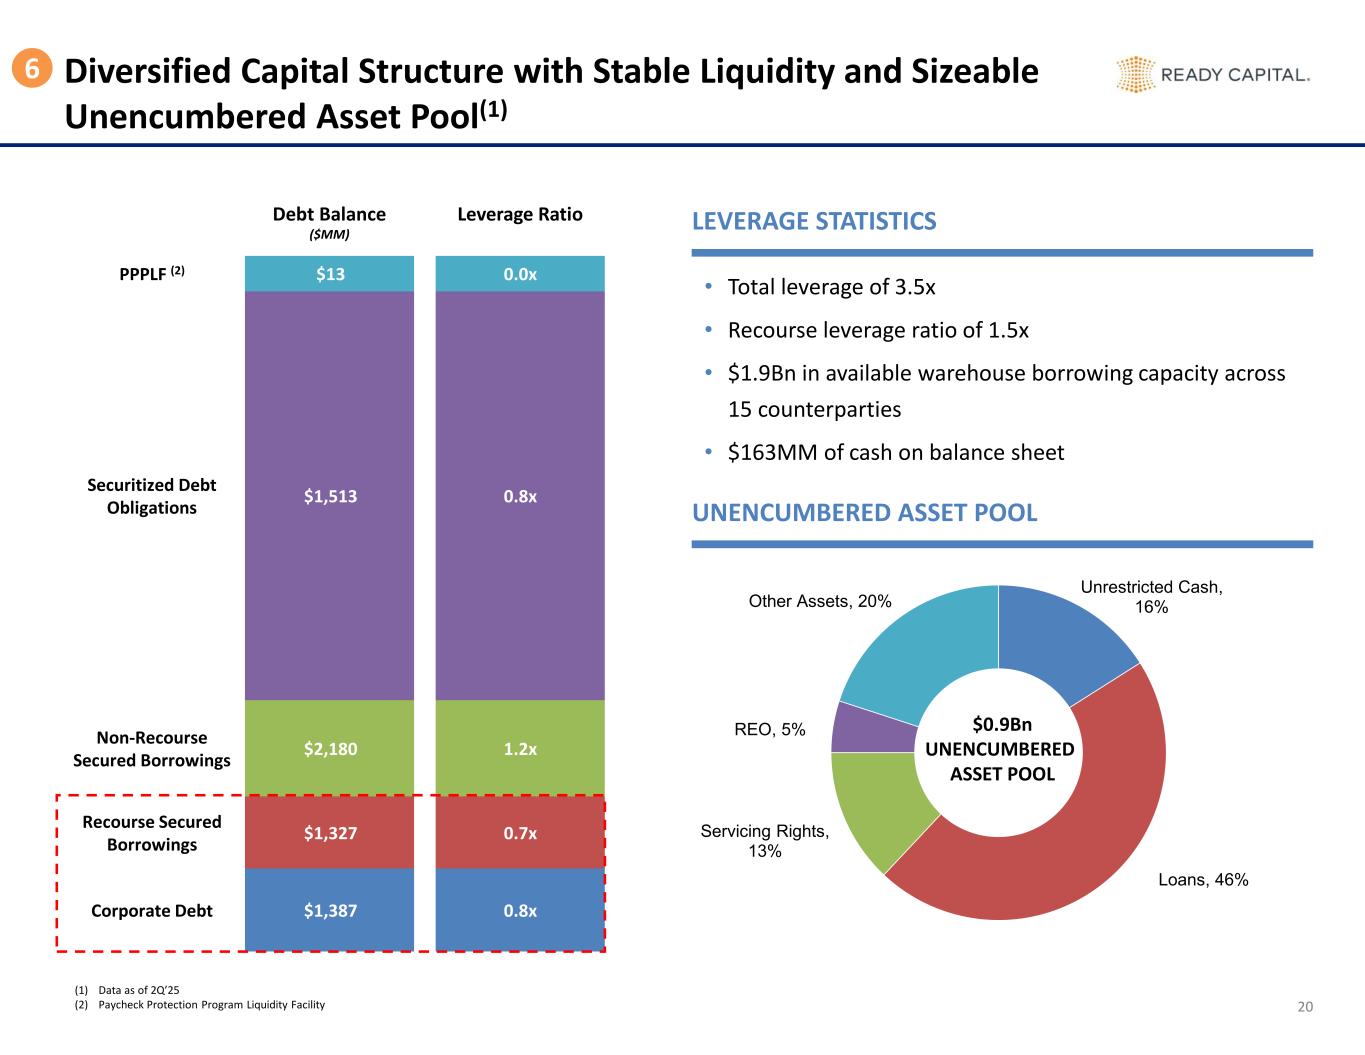
Unrestricted Cash, 16% Loans, 46% Servicing Rights, 13% REO, 5% Other Assets, 20% 20 Diversified Capital Structure with Stable Liquidity and Sizeable Unencumbered Asset Pool(1) LEVERAGE STATISTICS UNENCUMBERED ASSET POOL • Total leverage of 3.5x • Recourse leverage ratio of 1.5x • $1.9Bn in available warehouse borrowing capacity across 15 counterparties • $163MM of cash on balance sheet $0.9Bn UNENCUMBERED ASSET POOL Debt Balance ($MM) Leverage Ratio PPPLF (2) $13 0.0x Securitized Debt Obligations $1,513 0.8x Non-Recourse Secured Borrowings $2,180 1.2x Recourse Secured Borrowings $1,327 0.7x Corporate Debt $1,387 0.8x 6 (1) Data as of 2Q’25 (2) Paycheck Protection Program Liquidity Facility
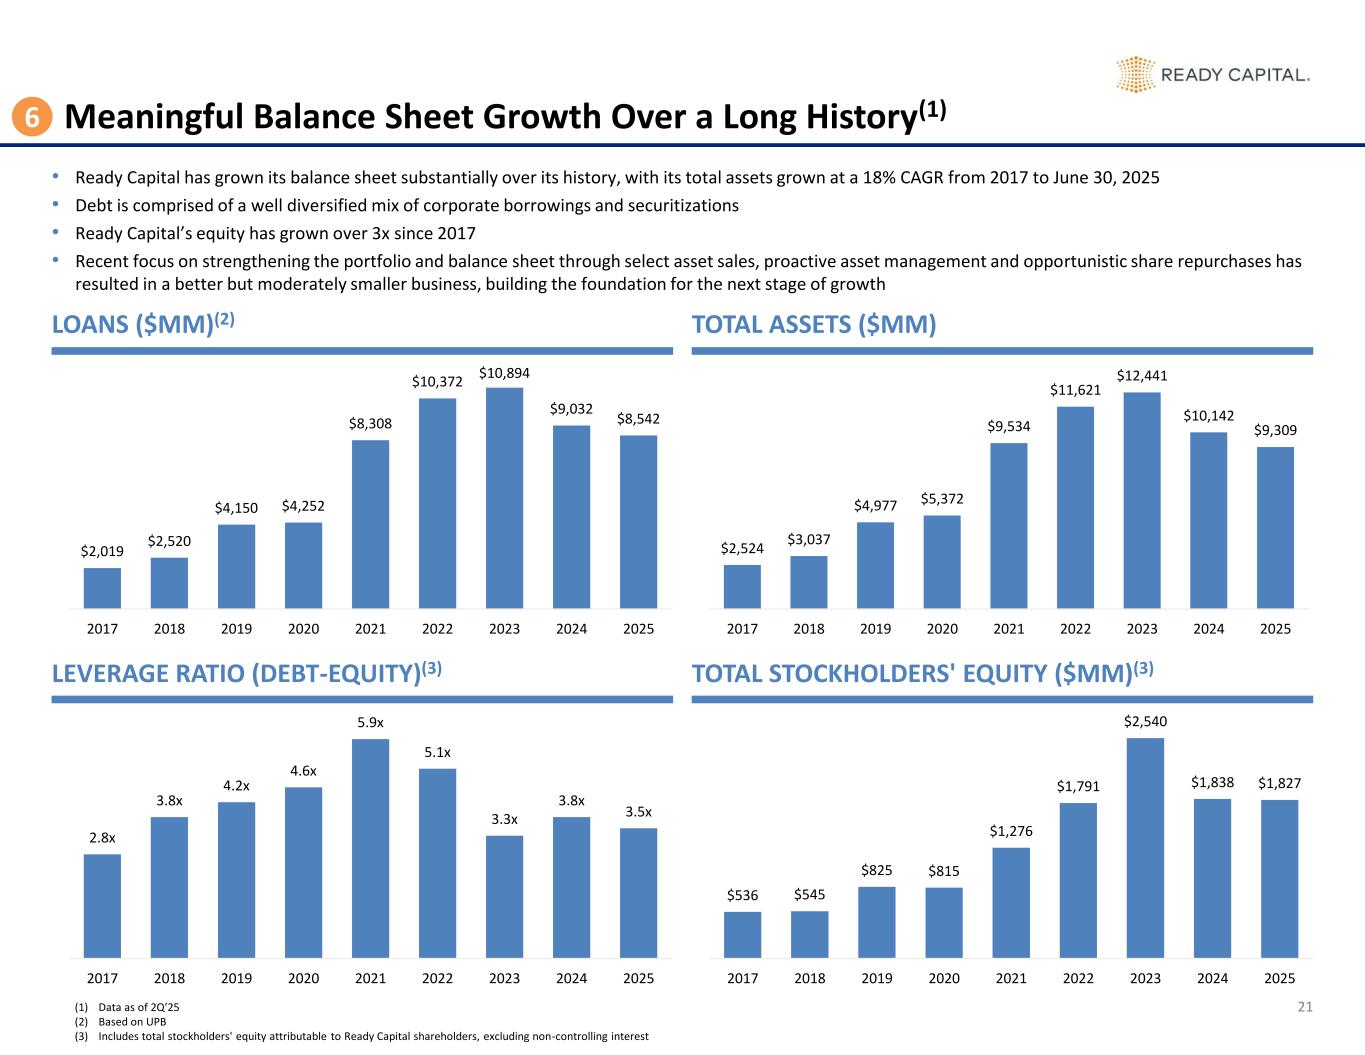
$536 $545 $825 $815 $1,276 $1,791 $2,540 $1,838 $1,827 2017 2018 2019 2020 2021 2022 2023 2024 2025 2.8x 3.8x 4.2x 4.6x 5.9x 5.1x 3.3x 3.8x 3.5x 2017 2018 2019 2020 2021 2022 2023 2024 2025 $2,524 $3,037 $4,977 $5,372 $9,534 $11,621 $12,441 $10,142 $9,309 2017 2018 2019 2020 2021 2022 2023 2024 2025 $2,019 $2,520 $4,150 $4,252 $8,308 $10,372 $10,894 $9,032 $8,542 2017 2018 2019 2020 2021 2022 2023 2024 2025 21 Meaningful Balance Sheet Growth Over a Long History(1) LEVERAGE RATIO (DEBT-EQUITY)(3) TOTAL STOCKHOLDERS' EQUITY ($MM)(3) LOANS ($MM)(2) TOTAL ASSETS ($MM) • Ready Capital has grown its balance sheet substantially over its history, with its total assets grown at a 18% CAGR from 2017 to June 30, 2025 • Debt is comprised of a well diversified mix of corporate borrowings and securitizations • Ready Capital’s equity has grown over 3x since 2017 • Recent focus on strengthening the portfolio and balance sheet through select asset sales, proactive asset management and opportunistic share repurchases has resulted in a better but moderately smaller business, building the foundation for the next stage of growth (1) Data as of 2Q’25 (2) Based on UPB (3) Includes total stockholders' equity attributable to Ready Capital shareholders, excluding non-controlling interest 6

RC Holdings, LLC Overview 4
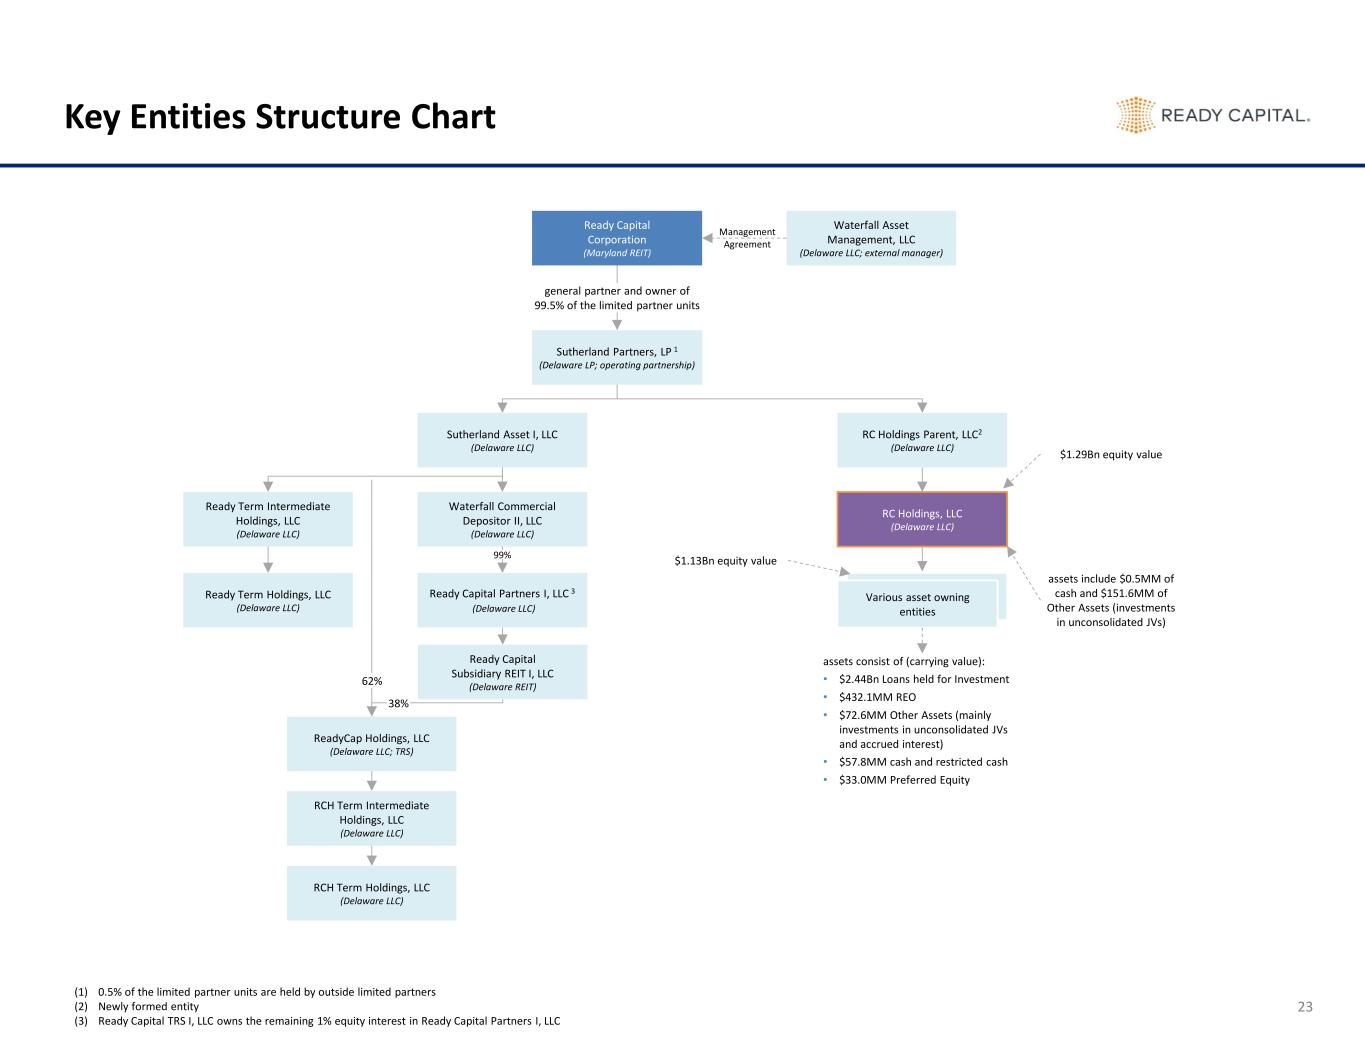
Key Entities Structure Chart 23 Management Agreement Waterfall Asset Management, LLC (Delaware LLC; external manager) Ready Capital Subsidiary REIT I, LLC (Delaware REIT) ReadyCap Holdings, LLC (Delaware LLC; TRS) RCH Term Intermediate Holdings, LLC (Delaware LLC) RCH Term Holdings, LLC (Delaware LLC) Sutherland Asset I, LLC (Delaware LLC) RC Holdings Parent, LLC2 (Delaware LLC) Ready Capital Corporation (Maryland REIT) Sutherland Partners, LP 1 (Delaware LP; operating partnership) general partner and owner of 99.5% of the limited partner units Waterfall Commercial Depositor II, LLC (Delaware LLC) Ready Term Intermediate Holdings, LLC (Delaware LLC) RC Holdings, LLC (Delaware LLC) Ready Capital Partners I, LLC 3 (Delaware LLC) Ready Term Holdings, LLC (Delaware LLC) Various asset owning entities assets include $0.5MM of cash and $151.6MM of Other Assets (investments in unconsolidated JVs) assets consist of (carrying value): • $2.44Bn Loans held for Investment • $432.1MM REO • $72.6MM Other Assets (mainly investments in unconsolidated JVs and accrued interest) • $57.8MM cash and restricted cash • $33.0MM Preferred Equity 99% 62% 38% $1.29Bn equity value $1.13Bn equity value (1) 0.5% of the limited partner units are held by outside limited partners (2) Newly formed entity (3) Ready Capital TRS I, LLC owns the remaining 1% equity interest in Ready Capital Partners I, LLC
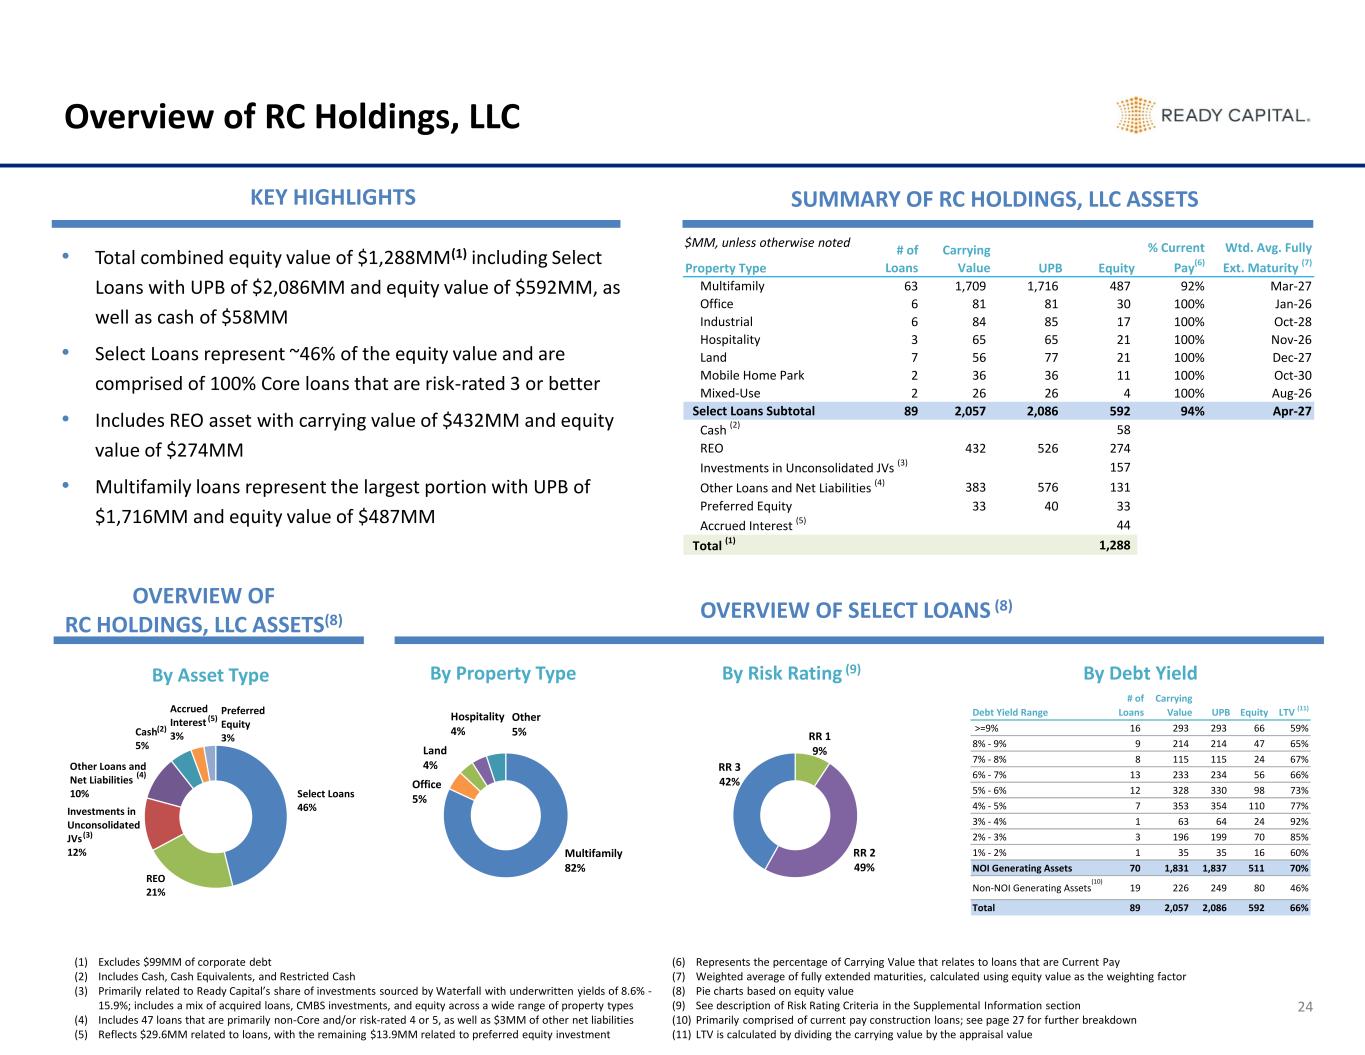
Debt Yield Range # of Loans Carrying Value UPB Equity LTV (11) >=9% 16 293 293 66 59% 8% - 9% 9 214 214 47 65% 7% - 8% 8 115 115 24 67% 6% - 7% 13 233 234 56 66% 5% - 6% 12 328 330 98 73% 4% - 5% 7 353 354 110 77% 3% - 4% 1 63 64 24 92% 2% - 3% 3 196 199 70 85% 1% - 2% 1 35 35 16 60% NOI Generating Assets 70 1,831 1,837 511 70% Non-NOI Generating Assets 19 226 249 80 46% Total 89 2,057 2,086 592 66% Property Type # of Loans Carrying Value UPB Equity % Current Pay(6) Wtd. Avg. Fully Ext. Maturity (7) Multifamily 63 1,709 1,716 487 92% Mar-27 Office 6 81 81 30 100% Jan-26 Industrial 6 84 85 17 100% Oct-28 Hospitality 3 65 65 21 100% Nov-26 Land 7 56 77 21 100% Dec-27 Mobile Home Park 2 36 36 11 100% Oct-30 Mixed-Use 2 26 26 4 100% Aug-26 Select Loans Subtotal 89 2,057 2,086 592 94% Apr-27 Cash (2) 58 REO 432 526 274 Investments in Unconsolidated JVs (3) 157 Other Loans and Net Liabilities (4) 383 576 131 Preferred Equity 33 40 33 Accrued Interest (5) 44 Total (1) 1,288 Overview of RC Holdings, LLC KEY HIGHLIGHTS SUMMARY OF RC HOLDINGS, LLC ASSETS OVERVIEW OF SELECT LOANS (8) • Total combined equity value of $1,288MM(1) including Select Loans with UPB of $2,086MM and equity value of $592MM, as well as cash of $58MM • Select Loans represent ~46% of the equity value and are comprised of 100% Core loans that are risk-rated 3 or better • Includes REO asset with carrying value of $432MM and equity value of $274MM • Multifamily loans represent the largest portion with UPB of $1,716MM and equity value of $487MM By Property Type Multifamily 82% Office 5% Land 4% Hospitality 4% Other 5% Select Loans 46% REO 21% Investments in Unconsolidated JVs 12% Other Loans and Net Liabilities 10% Cash 5% Accrued Interest 3% Preferred Equity 3% $MM, unless otherwise noted OVERVIEW OF RC HOLDINGS, LLC ASSETS(8) By Asset Type 24 By Risk Rating (9) RR 1 9% RR 2 49% RR 3 42% (4) (3) (5) (2) (1) Excludes $99MM of corporate debt (2) Includes Cash, Cash Equivalents, and Restricted Cash (3) Primarily related to Ready Capital’s share of investments sourced by Waterfall with underwritten yields of 8.6% - 15.9%; includes a mix of acquired loans, CMBS investments, and equity across a wide range of property types (4) Includes 47 loans that are primarily non-Core and/or risk-rated 4 or 5, as well as $3MM of other net liabilities (5) Reflects $29.6MM related to loans, with the remaining $13.9MM related to preferred equity investment (6) Represents the percentage of Carrying Value that relates to loans that are Current Pay (7) Weighted average of fully extended maturities, calculated using equity value as the weighting factor (8) Pie charts based on equity value (9) See description of Risk Rating Criteria in the Supplemental Information section (10) Primarily comprised of current pay construction loans; see page 27 for further breakdown (11) LTV is calculated by dividing the carrying value by the appraisal value (10) By Debt Yield
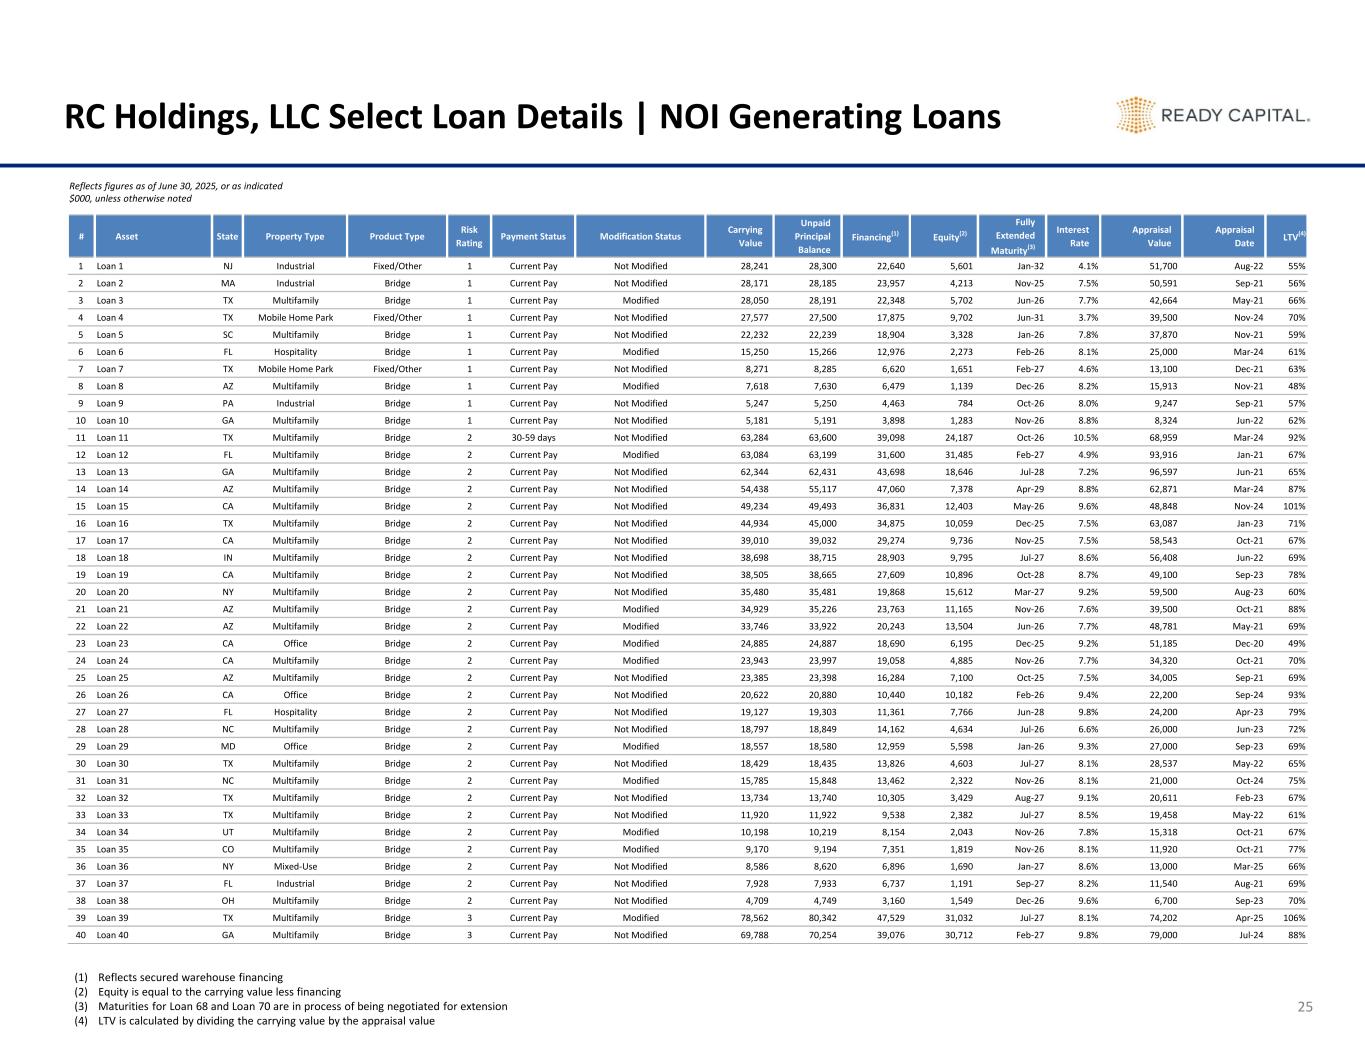
# Asset State Property Type Product Type Risk Rating Payment Status Modification Status Carrying Value Unpaid Principal Balance Financing(1) Equity(2) Fully Extended Maturity(3) Interest Rate Appraisal Value Appraisal Date LTV(4) 1 Loan 1 NJ Industrial Fixed/Other 1 Current Pay Not Modified 28,241 28,300 22,640 5,601 Jan-32 4.1% 51,700 Aug-22 55% 2 Loan 2 MA Industrial Bridge 1 Current Pay Not Modified 28,171 28,185 23,957 4,213 Nov-25 7.5% 50,591 Sep-21 56% 3 Loan 3 TX Multifamily Bridge 1 Current Pay Modified 28,050 28,191 22,348 5,702 Jun-26 7.7% 42,664 May-21 66% 4 Loan 4 TX Mobile Home Park Fixed/Other 1 Current Pay Not Modified 27,577 27,500 17,875 9,702 Jun-31 3.7% 39,500 Nov-24 70% 5 Loan 5 SC Multifamily Bridge 1 Current Pay Not Modified 22,232 22,239 18,904 3,328 Jan-26 7.8% 37,870 Nov-21 59% 6 Loan 6 FL Hospitality Bridge 1 Current Pay Modified 15,250 15,266 12,976 2,273 Feb-26 8.1% 25,000 Mar-24 61% 7 Loan 7 TX Mobile Home Park Fixed/Other 1 Current Pay Not Modified 8,271 8,285 6,620 1,651 Feb-27 4.6% 13,100 Dec-21 63% 8 Loan 8 AZ Multifamily Bridge 1 Current Pay Modified 7,618 7,630 6,479 1,139 Dec-26 8.2% 15,913 Nov-21 48% 9 Loan 9 PA Industrial Bridge 1 Current Pay Not Modified 5,247 5,250 4,463 784 Oct-26 8.0% 9,247 Sep-21 57% 10 Loan 10 GA Multifamily Bridge 1 Current Pay Not Modified 5,181 5,191 3,898 1,283 Nov-26 8.8% 8,324 Jun-22 62% 11 Loan 11 TX Multifamily Bridge 2 30-59 days Not Modified 63,284 63,600 39,098 24,187 Oct-26 10.5% 68,959 Mar-24 92% 12 Loan 12 FL Multifamily Bridge 2 Current Pay Modified 63,084 63,199 31,600 31,485 Feb-27 4.9% 93,916 Jan-21 67% 13 Loan 13 GA Multifamily Bridge 2 Current Pay Not Modified 62,344 62,431 43,698 18,646 Jul-28 7.2% 96,597 Jun-21 65% 14 Loan 14 AZ Multifamily Bridge 2 Current Pay Not Modified 54,438 55,117 47,060 7,378 Apr-29 8.8% 62,871 Mar-24 87% 15 Loan 15 CA Multifamily Bridge 2 Current Pay Not Modified 49,234 49,493 36,831 12,403 May-26 9.6% 48,848 Nov-24 101% 16 Loan 16 TX Multifamily Bridge 2 Current Pay Not Modified 44,934 45,000 34,875 10,059 Dec-25 7.5% 63,087 Jan-23 71% 17 Loan 17 CA Multifamily Bridge 2 Current Pay Not Modified 39,010 39,032 29,274 9,736 Nov-25 7.5% 58,543 Oct-21 67% 18 Loan 18 IN Multifamily Bridge 2 Current Pay Not Modified 38,698 38,715 28,903 9,795 Jul-27 8.6% 56,408 Jun-22 69% 19 Loan 19 CA Multifamily Bridge 2 Current Pay Not Modified 38,505 38,665 27,609 10,896 Oct-28 8.7% 49,100 Sep-23 78% 20 Loan 20 NY Multifamily Bridge 2 Current Pay Not Modified 35,480 35,481 19,868 15,612 Mar-27 9.2% 59,500 Aug-23 60% 21 Loan 21 AZ Multifamily Bridge 2 Current Pay Modified 34,929 35,226 23,763 11,165 Nov-26 7.6% 39,500 Oct-21 88% 22 Loan 22 AZ Multifamily Bridge 2 Current Pay Modified 33,746 33,922 20,243 13,504 Jun-26 7.7% 48,781 May-21 69% 23 Loan 23 CA Office Bridge 2 Current Pay Modified 24,885 24,887 18,690 6,195 Dec-25 9.2% 51,185 Dec-20 49% 24 Loan 24 CA Multifamily Bridge 2 Current Pay Modified 23,943 23,997 19,058 4,885 Nov-26 7.7% 34,320 Oct-21 70% 25 Loan 25 AZ Multifamily Bridge 2 Current Pay Not Modified 23,385 23,398 16,284 7,100 Oct-25 7.5% 34,005 Sep-21 69% 26 Loan 26 CA Office Bridge 2 Current Pay Not Modified 20,622 20,880 10,440 10,182 Feb-26 9.4% 22,200 Sep-24 93% 27 Loan 27 FL Hospitality Bridge 2 Current Pay Not Modified 19,127 19,303 11,361 7,766 Jun-28 9.8% 24,200 Apr-23 79% 28 Loan 28 NC Multifamily Bridge 2 Current Pay Not Modified 18,797 18,849 14,162 4,634 Jul-26 6.6% 26,000 Jun-23 72% 29 Loan 29 MD Office Bridge 2 Current Pay Modified 18,557 18,580 12,959 5,598 Jan-26 9.3% 27,000 Sep-23 69% 30 Loan 30 TX Multifamily Bridge 2 Current Pay Not Modified 18,429 18,435 13,826 4,603 Jul-27 8.1% 28,537 May-22 65% 31 Loan 31 NC Multifamily Bridge 2 Current Pay Modified 15,785 15,848 13,462 2,322 Nov-26 8.1% 21,000 Oct-24 75% 32 Loan 32 TX Multifamily Bridge 2 Current Pay Not Modified 13,734 13,740 10,305 3,429 Aug-27 9.1% 20,611 Feb-23 67% 33 Loan 33 TX Multifamily Bridge 2 Current Pay Not Modified 11,920 11,922 9,538 2,382 Jul-27 8.5% 19,458 May-22 61% 34 Loan 34 UT Multifamily Bridge 2 Current Pay Modified 10,198 10,219 8,154 2,043 Nov-26 7.8% 15,318 Oct-21 67% 35 Loan 35 CO Multifamily Bridge 2 Current Pay Modified 9,170 9,194 7,351 1,819 Nov-26 8.1% 11,920 Oct-21 77% 36 Loan 36 NY Mixed-Use Bridge 2 Current Pay Not Modified 8,586 8,620 6,896 1,690 Jan-27 8.6% 13,000 Mar-25 66% 37 Loan 37 FL Industrial Bridge 2 Current Pay Not Modified 7,928 7,933 6,737 1,191 Sep-27 8.2% 11,540 Aug-21 69% 38 Loan 38 OH Multifamily Bridge 2 Current Pay Not Modified 4,709 4,749 3,160 1,549 Dec-26 9.6% 6,700 Sep-23 70% 39 Loan 39 TX Multifamily Bridge 3 Current Pay Modified 78,562 80,342 47,529 31,032 Jul-27 8.1% 74,202 Apr-25 106% 40 Loan 40 GA Multifamily Bridge 3 Current Pay Not Modified 69,788 70,254 39,076 30,712 Feb-27 9.8% 79,000 Jul-24 88% RC Holdings, LLC Select Loan Details | NOI Generating Loans Reflects figures as of June 30, 2025, or as indicated $000, unless otherwise noted 25 (1) Reflects secured warehouse financing (2) Equity is equal to the carrying value less financing (3) Maturities for Loan 68 and Loan 70 are in process of being negotiated for extension (4) LTV is calculated by dividing the carrying value by the appraisal value
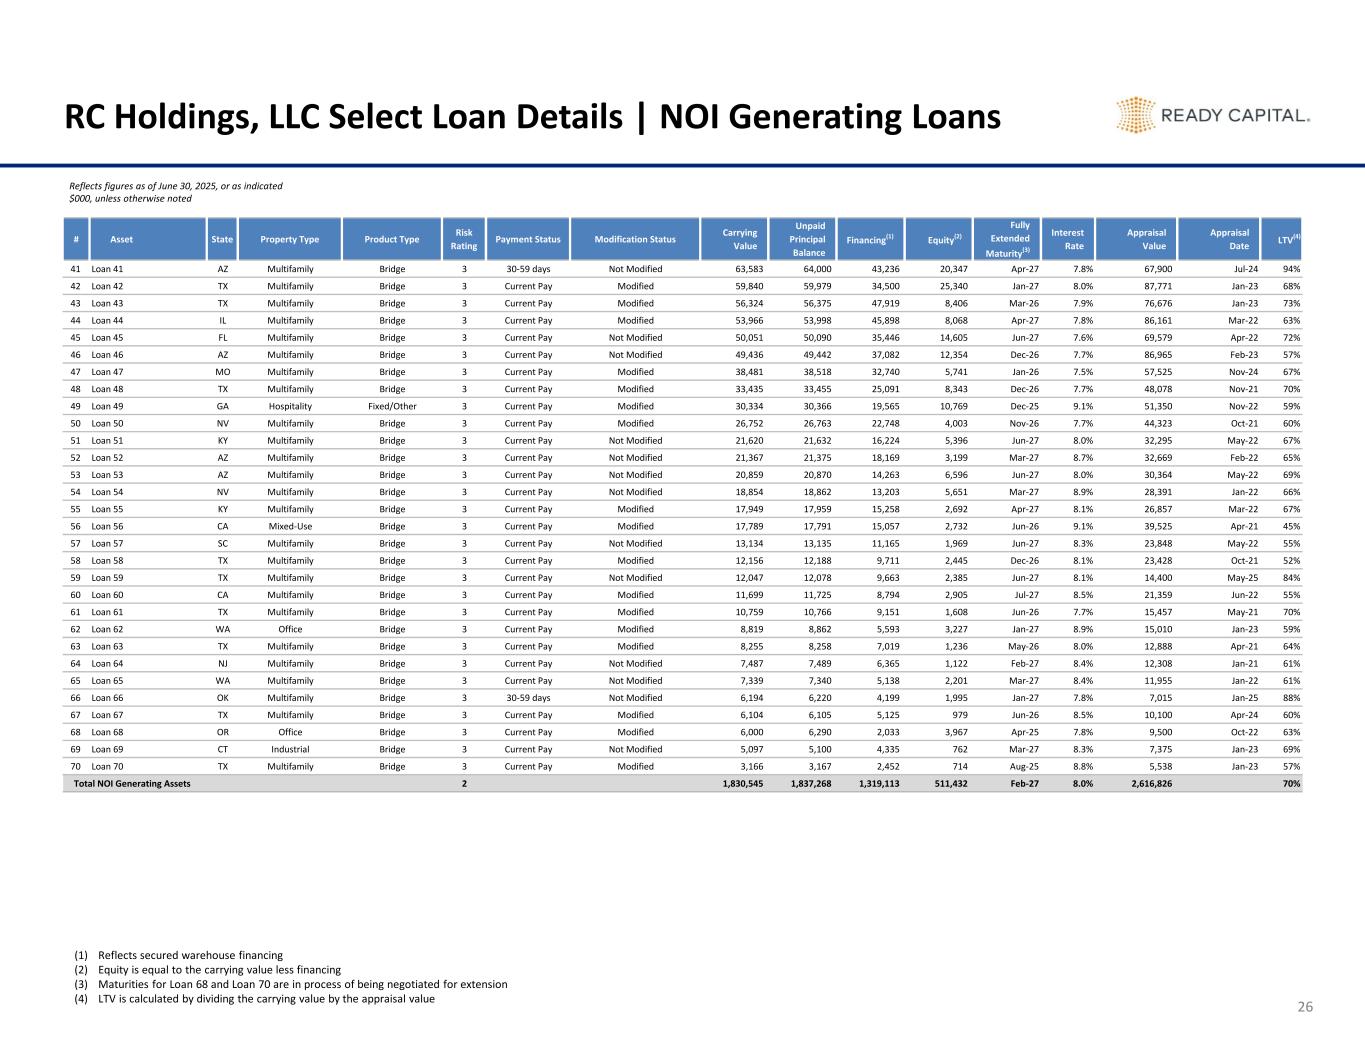
# Asset State Property Type Product Type Risk Rating Payment Status Modification Status Carrying Value Unpaid Principal Balance Financing(1) Equity(2) Fully Extended Maturity(3) Interest Rate Appraisal Value Appraisal Date LTV(4) 41 Loan 41 AZ Multifamily Bridge 3 30-59 days Not Modified 63,583 64,000 43,236 20,347 Apr-27 7.8% 67,900 Jul-24 94% 42 Loan 42 TX Multifamily Bridge 3 Current Pay Modified 59,840 59,979 34,500 25,340 Jan-27 8.0% 87,771 Jan-23 68% 43 Loan 43 TX Multifamily Bridge 3 Current Pay Modified 56,324 56,375 47,919 8,406 Mar-26 7.9% 76,676 Jan-23 73% 44 Loan 44 IL Multifamily Bridge 3 Current Pay Modified 53,966 53,998 45,898 8,068 Apr-27 7.8% 86,161 Mar-22 63% 45 Loan 45 FL Multifamily Bridge 3 Current Pay Not Modified 50,051 50,090 35,446 14,605 Jun-27 7.6% 69,579 Apr-22 72% 46 Loan 46 AZ Multifamily Bridge 3 Current Pay Not Modified 49,436 49,442 37,082 12,354 Dec-26 7.7% 86,965 Feb-23 57% 47 Loan 47 MO Multifamily Bridge 3 Current Pay Modified 38,481 38,518 32,740 5,741 Jan-26 7.5% 57,525 Nov-24 67% 48 Loan 48 TX Multifamily Bridge 3 Current Pay Modified 33,435 33,455 25,091 8,343 Dec-26 7.7% 48,078 Nov-21 70% 49 Loan 49 GA Hospitality Fixed/Other 3 Current Pay Modified 30,334 30,366 19,565 10,769 Dec-25 9.1% 51,350 Nov-22 59% 50 Loan 50 NV Multifamily Bridge 3 Current Pay Modified 26,752 26,763 22,748 4,003 Nov-26 7.7% 44,323 Oct-21 60% 51 Loan 51 KY Multifamily Bridge 3 Current Pay Not Modified 21,620 21,632 16,224 5,396 Jun-27 8.0% 32,295 May-22 67% 52 Loan 52 AZ Multifamily Bridge 3 Current Pay Not Modified 21,367 21,375 18,169 3,199 Mar-27 8.7% 32,669 Feb-22 65% 53 Loan 53 AZ Multifamily Bridge 3 Current Pay Not Modified 20,859 20,870 14,263 6,596 Jun-27 8.0% 30,364 May-22 69% 54 Loan 54 NV Multifamily Bridge 3 Current Pay Not Modified 18,854 18,862 13,203 5,651 Mar-27 8.9% 28,391 Jan-22 66% 55 Loan 55 KY Multifamily Bridge 3 Current Pay Modified 17,949 17,959 15,258 2,692 Apr-27 8.1% 26,857 Mar-22 67% 56 Loan 56 CA Mixed-Use Bridge 3 Current Pay Modified 17,789 17,791 15,057 2,732 Jun-26 9.1% 39,525 Apr-21 45% 57 Loan 57 SC Multifamily Bridge 3 Current Pay Not Modified 13,134 13,135 11,165 1,969 Jun-27 8.3% 23,848 May-22 55% 58 Loan 58 TX Multifamily Bridge 3 Current Pay Modified 12,156 12,188 9,711 2,445 Dec-26 8.1% 23,428 Oct-21 52% 59 Loan 59 TX Multifamily Bridge 3 Current Pay Not Modified 12,047 12,078 9,663 2,385 Jun-27 8.1% 14,400 May-25 84% 60 Loan 60 CA Multifamily Bridge 3 Current Pay Modified 11,699 11,725 8,794 2,905 Jul-27 8.5% 21,359 Jun-22 55% 61 Loan 61 TX Multifamily Bridge 3 Current Pay Modified 10,759 10,766 9,151 1,608 Jun-26 7.7% 15,457 May-21 70% 62 Loan 62 WA Office Bridge 3 Current Pay Modified 8,819 8,862 5,593 3,227 Jan-27 8.9% 15,010 Jan-23 59% 63 Loan 63 TX Multifamily Bridge 3 Current Pay Modified 8,255 8,258 7,019 1,236 May-26 8.0% 12,888 Apr-21 64% 64 Loan 64 NJ Multifamily Bridge 3 Current Pay Not Modified 7,487 7,489 6,365 1,122 Feb-27 8.4% 12,308 Jan-21 61% 65 Loan 65 WA Multifamily Bridge 3 Current Pay Not Modified 7,339 7,340 5,138 2,201 Mar-27 8.4% 11,955 Jan-22 61% 66 Loan 66 OK Multifamily Bridge 3 30-59 days Not Modified 6,194 6,220 4,199 1,995 Jan-27 7.8% 7,015 Jan-25 88% 67 Loan 67 TX Multifamily Bridge 3 Current Pay Modified 6,104 6,105 5,125 979 Jun-26 8.5% 10,100 Apr-24 60% 68 Loan 68 OR Office Bridge 3 Current Pay Modified 6,000 6,290 2,033 3,967 Apr-25 7.8% 9,500 Oct-22 63% 69 Loan 69 CT Industrial Bridge 3 Current Pay Not Modified 5,097 5,100 4,335 762 Mar-27 8.3% 7,375 Jan-23 69% 70 Loan 70 TX Multifamily Bridge 3 Current Pay Modified 3,166 3,167 2,452 714 Aug-25 8.8% 5,538 Jan-23 57% Total NOI Generating Assets 2 1,830,545 1,837,268 1,319,113 511,432 Feb-27 8.0% 2,616,826 70% RC Holdings, LLC Select Loan Details | NOI Generating Loans 26 Reflects figures as of June 30, 2025, or as indicated $000, unless otherwise noted (1) Reflects secured warehouse financing (2) Equity is equal to the carrying value less financing (3) Maturities for Loan 68 and Loan 70 are in process of being negotiated for extension (4) LTV is calculated by dividing the carrying value by the appraisal value
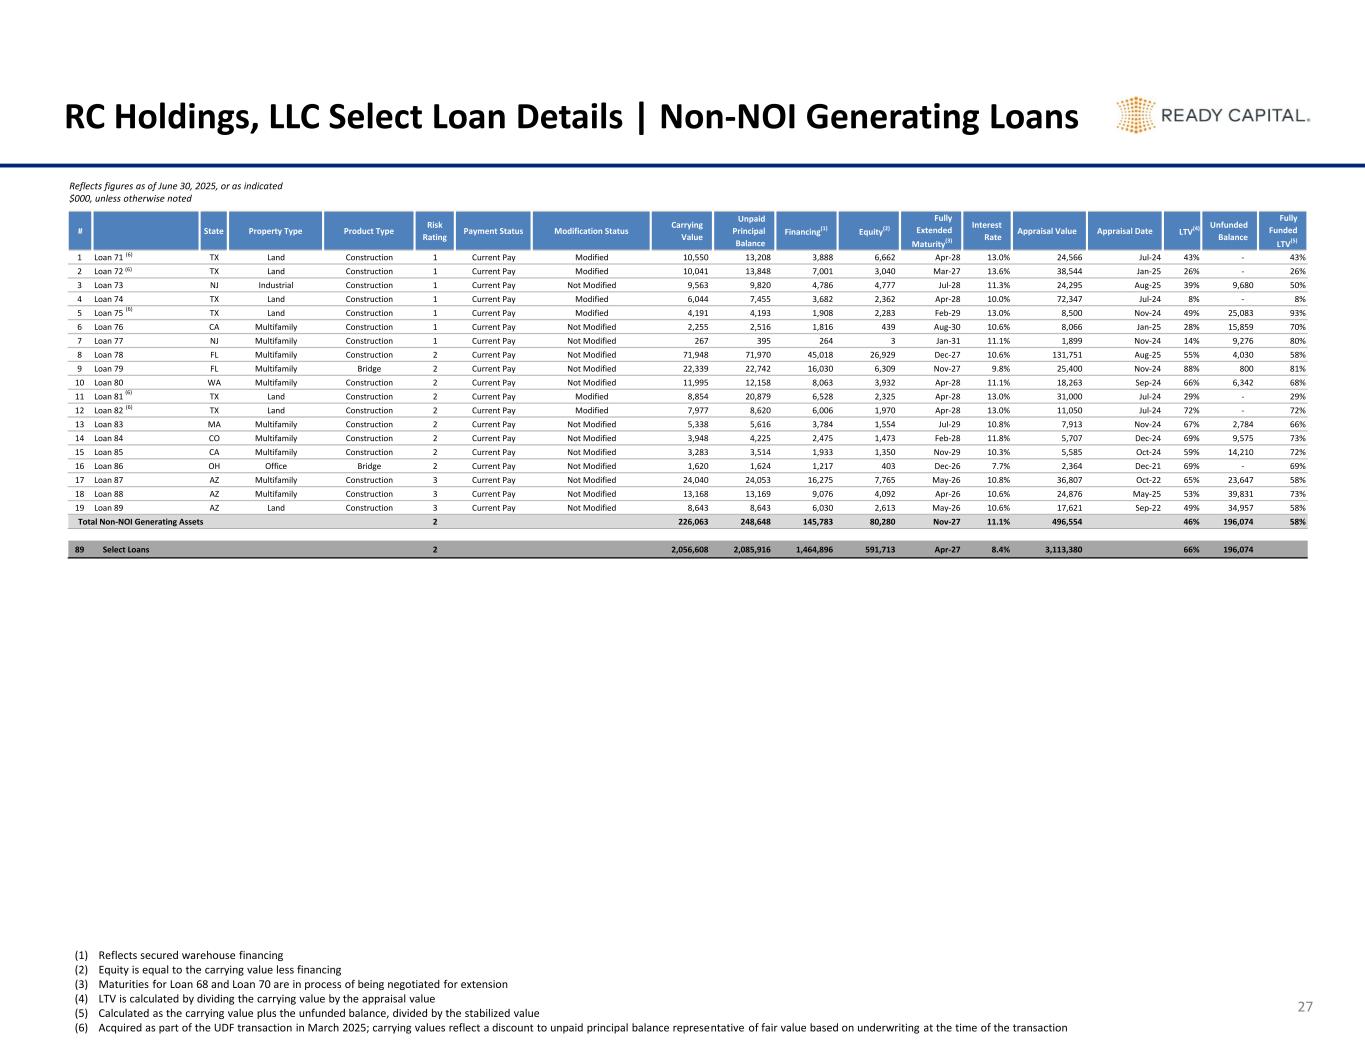
# State Property Type Product Type Risk Rating Payment Status Modification Status Carrying Value Unpaid Principal Balance Financing(1) Equity(2) Fully Extended Maturity(3) Interest Rate Appraisal Value Appraisal Date LTV(4) Unfunded Balance Fully Funded LTV(5) 1 Loan 71 TX Land Construction 1 Current Pay Modified 10,550 13,208 3,888 6,662 Apr-28 13.0% 24,566 Jul-24 43% - 43% 2 Loan 72 TX Land Construction 1 Current Pay Modified 10,041 13,848 7,001 3,040 Mar-27 13.6% 38,544 Jan-25 26% - 26% 3 Loan 73 NJ Industrial Construction 1 Current Pay Not Modified 9,563 9,820 4,786 4,777 Jul-28 11.3% 24,295 Aug-25 39% 9,680 50% 4 Loan 74 TX Land Construction 1 Current Pay Modified 6,044 7,455 3,682 2,362 Apr-28 10.0% 72,347 Jul-24 8% - 8% 5 Loan 75 TX Land Construction 1 Current Pay Modified 4,191 4,193 1,908 2,283 Feb-29 13.0% 8,500 Nov-24 49% 25,083 93% 6 Loan 76 CA Multifamily Construction 1 Current Pay Not Modified 2,255 2,516 1,816 439 Aug-30 10.6% 8,066 Jan-25 28% 15,859 70% 7 Loan 77 NJ Multifamily Construction 1 Current Pay Not Modified 267 395 264 3 Jan-31 11.1% 1,899 Nov-24 14% 9,276 80% 8 Loan 78 FL Multifamily Construction 2 Current Pay Not Modified 71,948 71,970 45,018 26,929 Dec-27 10.6% 131,751 Aug-25 55% 4,030 58% 9 Loan 79 FL Multifamily Bridge 2 Current Pay Not Modified 22,339 22,742 16,030 6,309 Nov-27 9.8% 25,400 Nov-24 88% 800 81% 10 Loan 80 WA Multifamily Construction 2 Current Pay Not Modified 11,995 12,158 8,063 3,932 Apr-28 11.1% 18,263 Sep-24 66% 6,342 68% 11 Loan 81 TX Land Construction 2 Current Pay Modified 8,854 20,879 6,528 2,325 Apr-28 13.0% 31,000 Jul-24 29% - 29% 12 Loan 82 TX Land Construction 2 Current Pay Modified 7,977 8,620 6,006 1,970 Apr-28 13.0% 11,050 Jul-24 72% - 72% 13 Loan 83 MA Multifamily Construction 2 Current Pay Not Modified 5,338 5,616 3,784 1,554 Jul-29 10.8% 7,913 Nov-24 67% 2,784 66% 14 Loan 84 CO Multifamily Construction 2 Current Pay Not Modified 3,948 4,225 2,475 1,473 Feb-28 11.8% 5,707 Dec-24 69% 9,575 73% 15 Loan 85 CA Multifamily Construction 2 Current Pay Not Modified 3,283 3,514 1,933 1,350 Nov-29 10.3% 5,585 Oct-24 59% 14,210 72% 16 Loan 86 OH Office Bridge 2 Current Pay Not Modified 1,620 1,624 1,217 403 Dec-26 7.7% 2,364 Dec-21 69% - 69% 17 Loan 87 AZ Multifamily Construction 3 Current Pay Not Modified 24,040 24,053 16,275 7,765 May-26 10.8% 36,807 Oct-22 65% 23,647 58% 18 Loan 88 AZ Multifamily Construction 3 Current Pay Not Modified 13,168 13,169 9,076 4,092 Apr-26 10.6% 24,876 May-25 53% 39,831 73% 19 Loan 89 AZ Land Construction 3 Current Pay Not Modified 8,643 8,643 6,030 2,613 May-26 10.6% 17,621 Sep-22 49% 34,957 58% Total Non-NOI Generating Assets 2 226,063 248,648 145,783 80,280 Nov-27 11.1% 496,554 46% 196,074 58% 89 Select Loans 2 2,056,608 2,085,916 1,464,896 591,713 Apr-27 8.4% 3,113,380 66% 196,074 RC Holdings, LLC Select Loan Details | Non-NOI Generating Loans 27 (1) Reflects secured warehouse financing (2) Equity is equal to the carrying value less financing (3) Maturities for Loan 68 and Loan 70 are in process of being negotiated for extension (4) LTV is calculated by dividing the carrying value by the appraisal value (5) Calculated as the carrying value plus the unfunded balance, divided by the stabilized value (6) Acquired as part of the UDF transaction in March 2025; carrying values reflect a discount to unpaid principal balance representative of fair value based on underwriting at the time of the transaction (6) (6) (6) (6) Reflects figures as of June 30, 2025, or as indicated $000, unless otherwise noted (6)
Supplemental Information 5
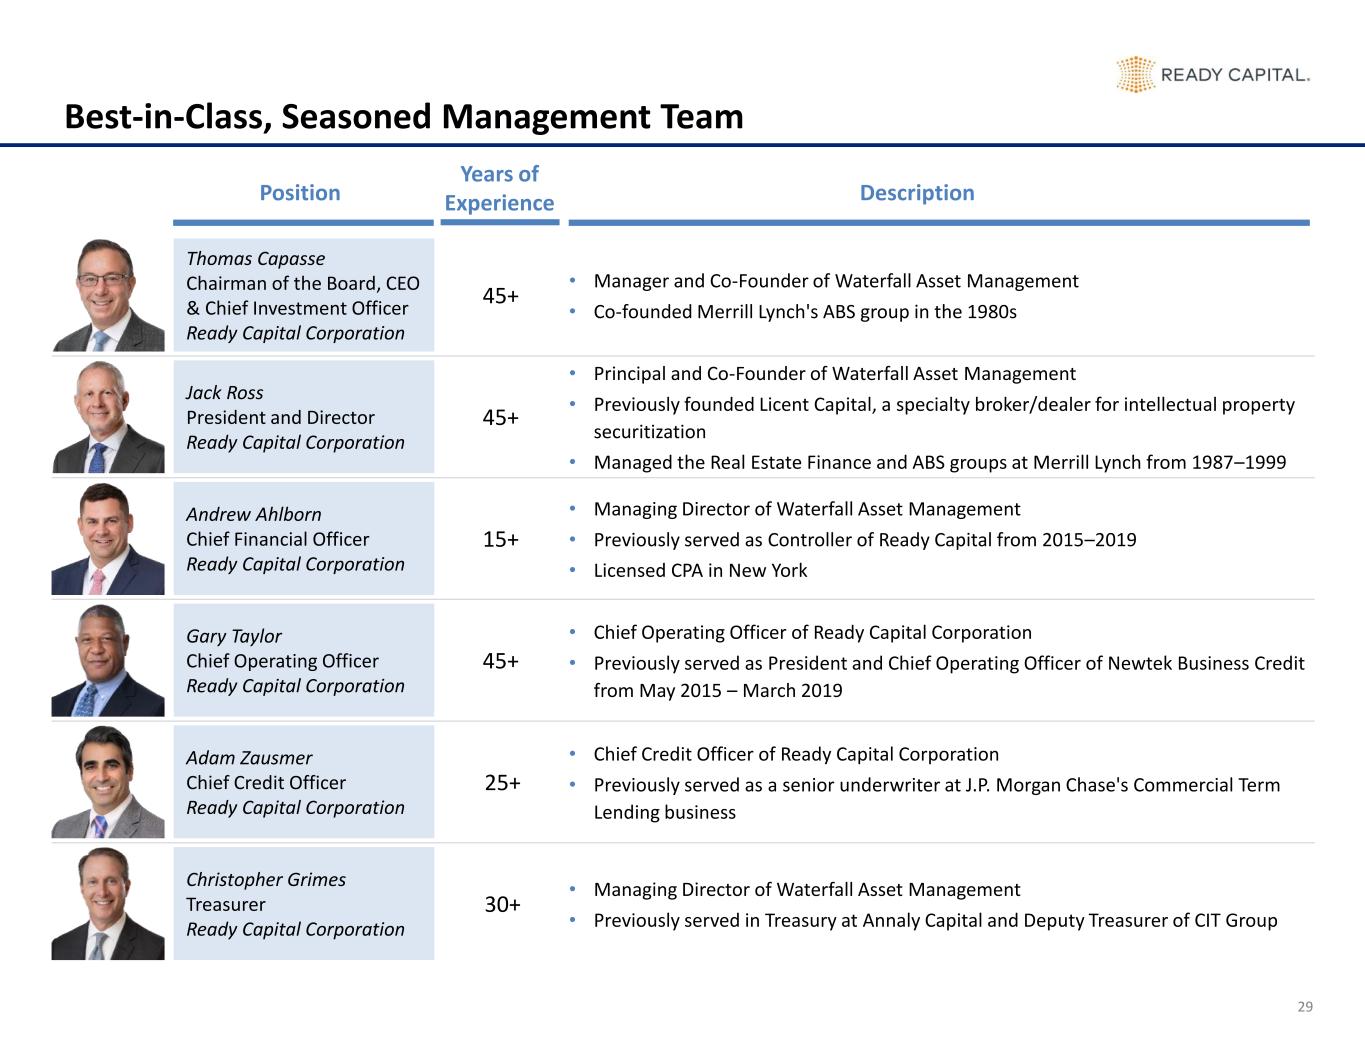
29 Best-in-Class, Seasoned Management Team • Manager and Co-Founder of Waterfall Asset Management • Co-founded Merrill Lynch's ABS group in the 1980s • Principal and Co-Founder of Waterfall Asset Management • Previously founded Licent Capital, a specialty broker/dealer for intellectual property securitization • Managed the Real Estate Finance and ABS groups at Merrill Lynch from 1987–1999 • Managing Director of Waterfall Asset Management • Previously served as Controller of Ready Capital from 2015–2019 • Licensed CPA in New York • Chief Operating Officer of Ready Capital Corporation • Previously served as President and Chief Operating Officer of Newtek Business Credit from May 2015 – March 2019 • Chief Credit Officer of Ready Capital Corporation • Previously served as a senior underwriter at J.P. Morgan Chase's Commercial Term Lending business • Managing Director of Waterfall Asset Management • Previously served in Treasury at Annaly Capital and Deputy Treasurer of CIT Group Position Description Thomas Capasse Chairman of the Board, CEO & Chief Investment Officer Ready Capital Corporation Jack Ross President and Director Ready Capital Corporation Andrew Ahlborn Chief Financial Officer Ready Capital Corporation Gary Taylor Chief Operating Officer Ready Capital Corporation Adam Zausmer Chief Credit Officer Ready Capital Corporation Christopher Grimes Treasurer Ready Capital Corporation Years of Experience 45+ 45+ 25+ 45+ 30+ 15+
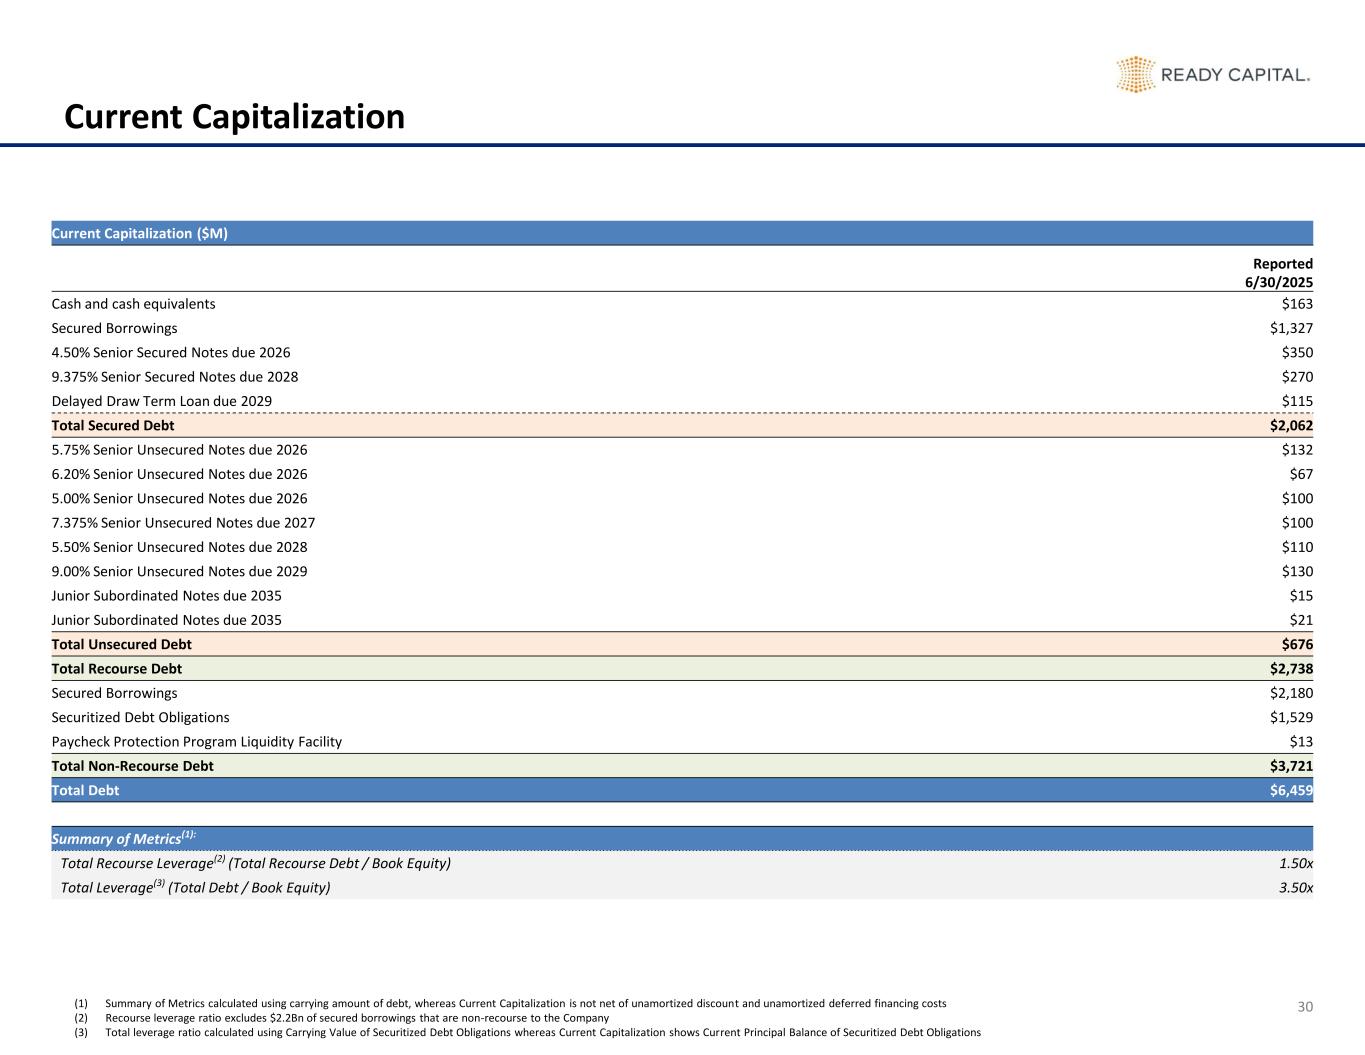
30 Current Capitalization Current Capitalization ($M) Reported 6/30/2025 Cash and cash equivalents $163 Secured Borrowings $1,327 4.50% Senior Secured Notes due 2026 $350 9.375% Senior Secured Notes due 2028 $270 Delayed Draw Term Loan due 2029 $115 Total Secured Debt $2,062 5.75% Senior Unsecured Notes due 2026 $132 6.20% Senior Unsecured Notes due 2026 $67 5.00% Senior Unsecured Notes due 2026 $100 7.375% Senior Unsecured Notes due 2027 $100 5.50% Senior Unsecured Notes due 2028 $110 9.00% Senior Unsecured Notes due 2029 $130 Junior Subordinated Notes due 2035 $15 Junior Subordinated Notes due 2035 $21 Total Unsecured Debt $676 Total Recourse Debt $2,738 Secured Borrowings $2,180 Securitized Debt Obligations $1,529 Paycheck Protection Program Liquidity Facility $13 Total Non-Recourse Debt $3,721 Total Debt $6,459 Summary of Metrics(1): Total Recourse Leverage(2) (Total Recourse Debt / Book Equity) 1.50x Total Leverage(3) (Total Debt / Book Equity) 3.50x (1) Summary of Metrics calculated using carrying amount of debt, whereas Current Capitalization is not net of unamortized discount and unamortized deferred financing costs (2) Recourse leverage ratio excludes $2.2Bn of secured borrowings that are non-recourse to the Company (3) Total leverage ratio calculated using Carrying Value of Securitized Debt Obligations whereas Current Capitalization shows Current Principal Balance of Securitized Debt Obligations
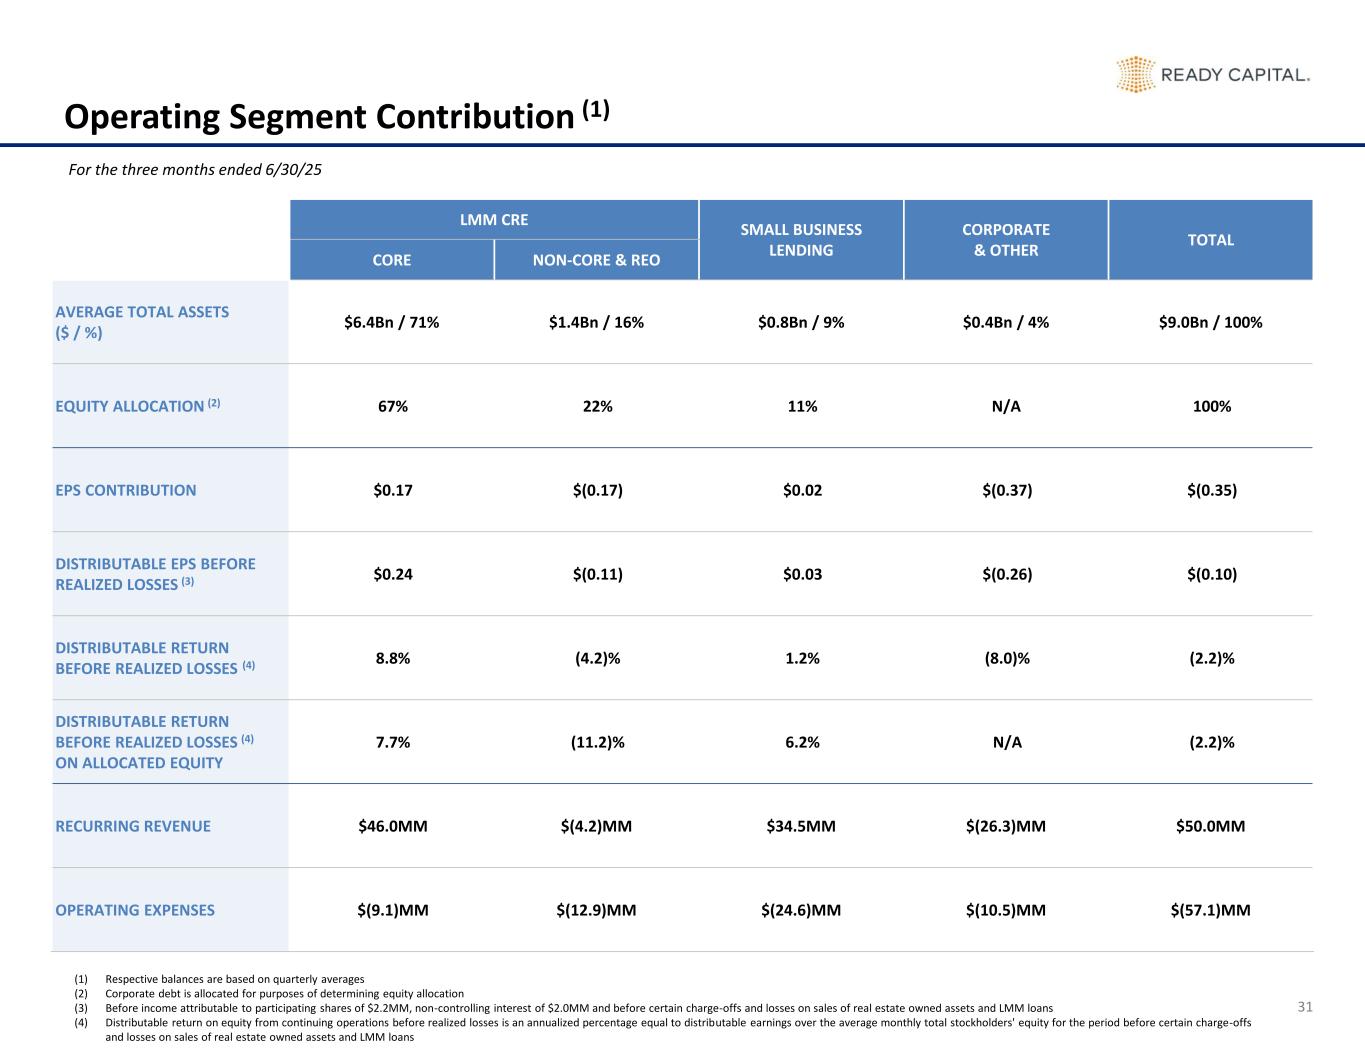
31 Operating Segment Contribution (1) LMM CRE SMALL BUSINESS LENDING CORPORATE & OTHER TOTAL CORE NON-CORE & REO AVERAGE TOTAL ASSETS ($ / %) $6.4Bn / 71% $1.4Bn / 16% $0.8Bn / 9% $0.4Bn / 4% $9.0Bn / 100% EQUITY ALLOCATION (2) 67% 22% 11% N/A 100% EPS CONTRIBUTION $0.17 $(0.17) $0.02 $(0.37) $(0.35) DISTRIBUTABLE EPS BEFORE REALIZED LOSSES (3) $0.24 $(0.11) $0.03 $(0.26) $(0.10) DISTRIBUTABLE RETURN BEFORE REALIZED LOSSES (4) 8.8% (4.2)% 1.2% (8.0)% (2.2)% DISTRIBUTABLE RETURN BEFORE REALIZED LOSSES (4) ON ALLOCATED EQUITY 7.7% (11.2)% 6.2% N/A (2.2)% RECURRING REVENUE $46.0MM $(4.2)MM $34.5MM $(26.3)MM $50.0MM OPERATING EXPENSES $(9.1)MM $(12.9)MM $(24.6)MM $(10.5)MM $(57.1)MM For the three months ended 6/30/25 (1) Respective balances are based on quarterly averages (2) Corporate debt is allocated for purposes of determining equity allocation (3) Before income attributable to participating shares of $2.2MM, non-controlling interest of $2.0MM and before certain charge-offs and losses on sales of real estate owned assets and LMM loans (4) Distributable return on equity from continuing operations before realized losses is an annualized percentage equal to distributable earnings over the average monthly total stockholders' equity for the period before certain charge-offs and losses on sales of real estate owned assets and LMM loans
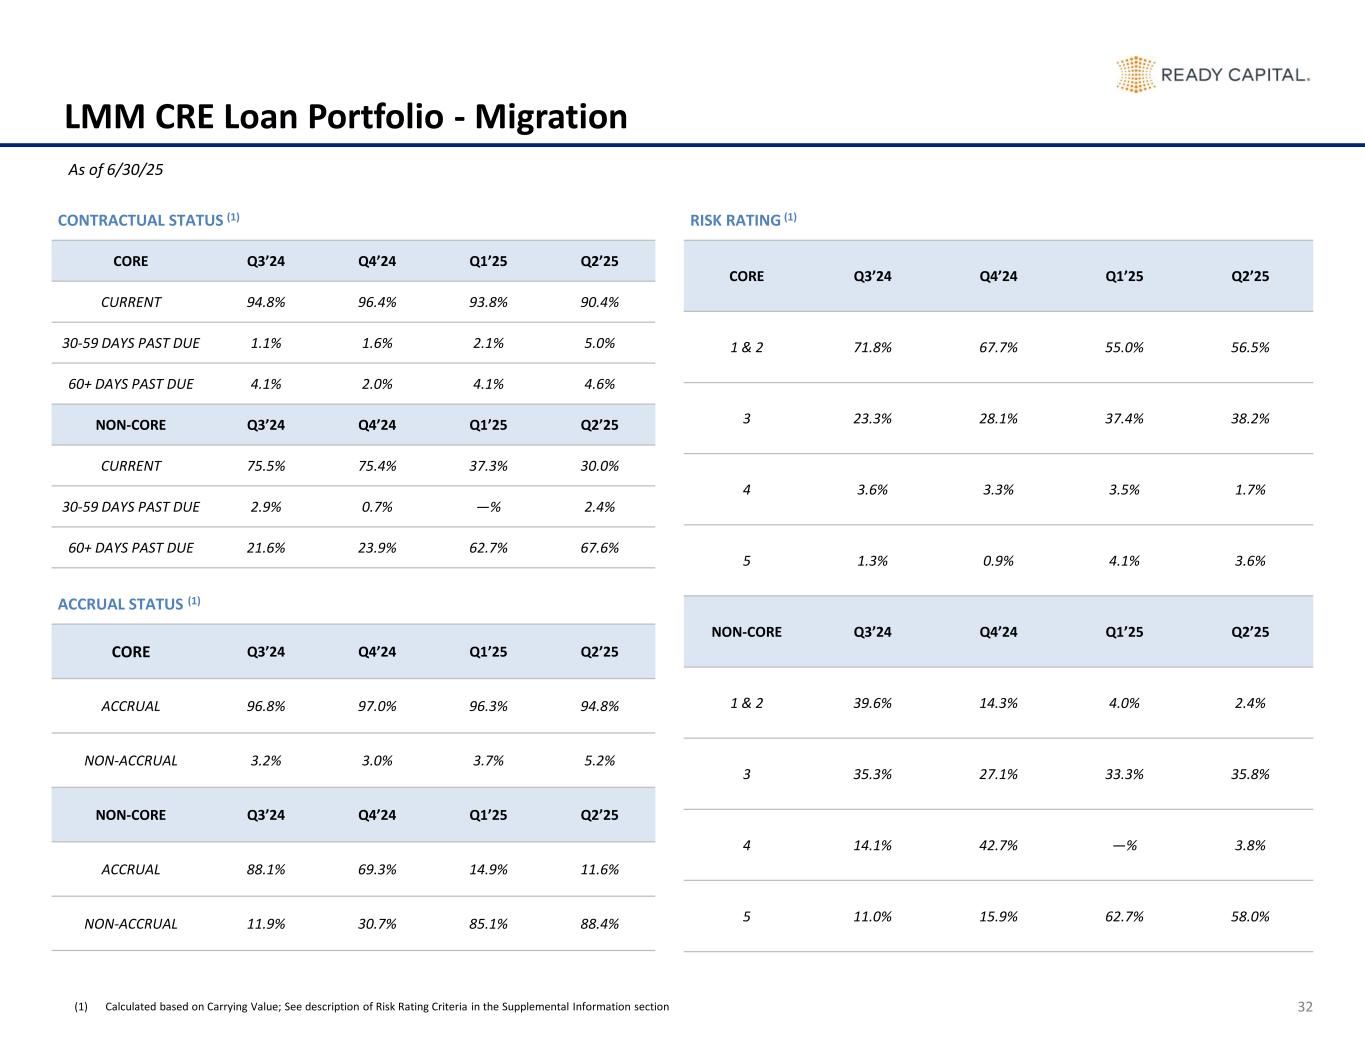
32 LMM CRE Loan Portfolio - Migration CONTRACTUAL STATUS (1) CORE Q3’24 Q4’24 Q1’25 Q2’25 CURRENT 94.8% 96.4% 93.8% 90.4% 30-59 DAYS PAST DUE 1.1% 1.6% 2.1% 5.0% 60+ DAYS PAST DUE 4.1% 2.0% 4.1% 4.6% NON-CORE Q3’24 Q4’24 Q1’25 Q2’25 CURRENT 75.5% 75.4% 37.3% 30.0% 30-59 DAYS PAST DUE 2.9% 0.7% —% 2.4% 60+ DAYS PAST DUE 21.6% 23.9% 62.7% 67.6% ACCRUAL STATUS (1) CORE Q3’24 Q4’24 Q1’25 Q2’25 ACCRUAL 96.8% 97.0% 96.3% 94.8% NON-ACCRUAL 3.2% 3.0% 3.7% 5.2% NON-CORE Q3’24 Q4’24 Q1’25 Q2’25 ACCRUAL 88.1% 69.3% 14.9% 11.6% NON-ACCRUAL 11.9% 30.7% 85.1% 88.4% RISK RATING (1) CORE Q3’24 Q4’24 Q1’25 Q2’25 1 & 2 71.8% 67.7% 55.0% 56.5% 3 23.3% 28.1% 37.4% 38.2% 4 3.6% 3.3% 3.5% 1.7% 5 1.3% 0.9% 4.1% 3.6% NON-CORE Q3’24 Q4’24 Q1’25 Q2’25 1 & 2 39.6% 14.3% 4.0% 2.4% 3 35.3% 27.1% 33.3% 35.8% 4 14.1% 42.7% —% 3.8% 5 11.0% 15.9% 62.7% 58.0% As of 6/30/25 (1) Calculated based on Carrying Value; See description of Risk Rating Criteria in the Supplemental Information section
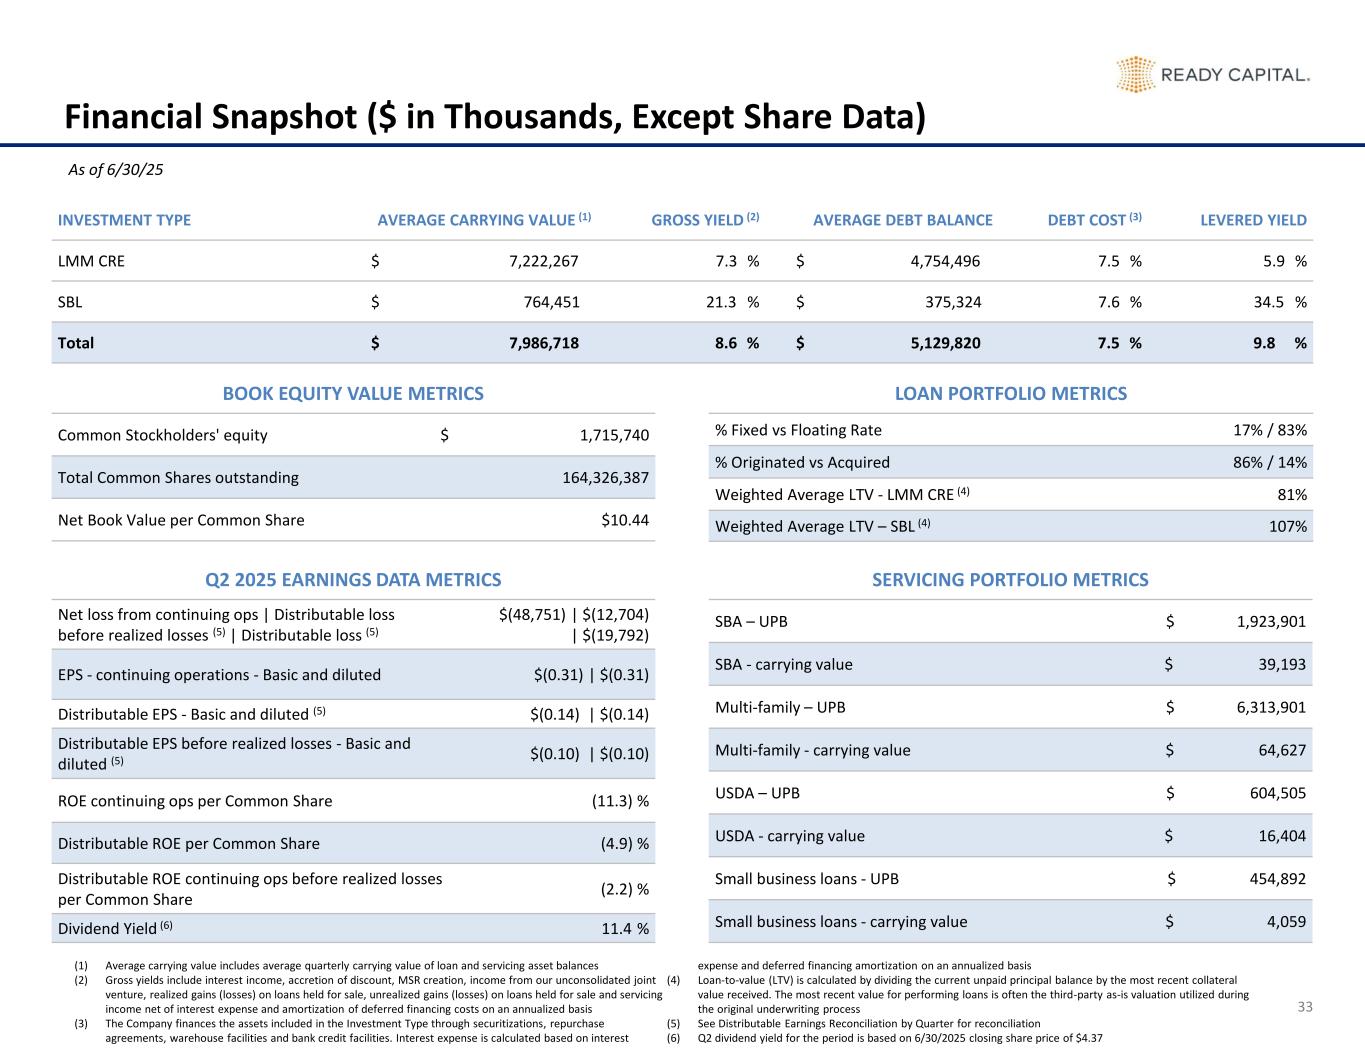
33 Financial Snapshot ($ in Thousands, Except Share Data) INVESTMENT TYPE AVERAGE CARRYING VALUE (1) GROSS YIELD (2) AVERAGE DEBT BALANCE DEBT COST (3) LEVERED YIELD LMM CRE $ 7,222,267 7.3 % $ 4,754,496 7.5 % 5.9 % SBL $ 764,451 21.3 % $ 375,324 7.6 % 34.5 % Total $ 7,986,718 8.6 % $ 5,129,820 7.5 % 9.8 % BOOK EQUITY VALUE METRICS Common Stockholders' equity $ 1,715,740 Total Common Shares outstanding 164,326,387 Net Book Value per Common Share $10.44 LOAN PORTFOLIO METRICS % Fixed vs Floating Rate 17% / 83% % Originated vs Acquired 86% / 14% Weighted Average LTV - LMM CRE (4) 81% Weighted Average LTV – SBL (4) 107% Q2 2025 EARNINGS DATA METRICS Net loss from continuing ops | Distributable loss before realized losses (5) | Distributable loss (5) $(48,751) | $(12,704) | $(19,792) EPS - continuing operations - Basic and diluted $(0.31) | $(0.31) Distributable EPS - Basic and diluted (5) $(0.14) | $(0.14) Distributable EPS before realized losses - Basic and diluted (5) $(0.10) | $(0.10) ROE continuing ops per Common Share (11.3) % Distributable ROE per Common Share (4.9) % Distributable ROE continuing ops before realized losses per Common Share (2.2) % Dividend Yield (6) 11.4 % SERVICING PORTFOLIO METRICS SBA – UPB $ 1,923,901 SBA - carrying value $ 39,193 Multi-family – UPB $ 6,313,901 Multi-family - carrying value $ 64,627 USDA – UPB $ 604,505 USDA - carrying value $ 16,404 Small business loans - UPB $ 454,892 Small business loans - carrying value $ 4,059 As of 6/30/25 (1) Average carrying value includes average quarterly carrying value of loan and servicing asset balances (2) Gross yields include interest income, accretion of discount, MSR creation, income from our unconsolidated joint venture, realized gains (losses) on loans held for sale, unrealized gains (losses) on loans held for sale and servicing income net of interest expense and amortization of deferred financing costs on an annualized basis (3) The Company finances the assets included in the Investment Type through securitizations, repurchase agreements, warehouse facilities and bank credit facilities. Interest expense is calculated based on interest expense and deferred financing amortization on an annualized basis (4) Loan-to-value (LTV) is calculated by dividing the current unpaid principal balance by the most recent collateral value received. The most recent value for performing loans is often the third-party as-is valuation utilized during the original underwriting process (5) See Distributable Earnings Reconciliation by Quarter for reconciliation (6) Q2 dividend yield for the period is based on 6/30/2025 closing share price of $4.37
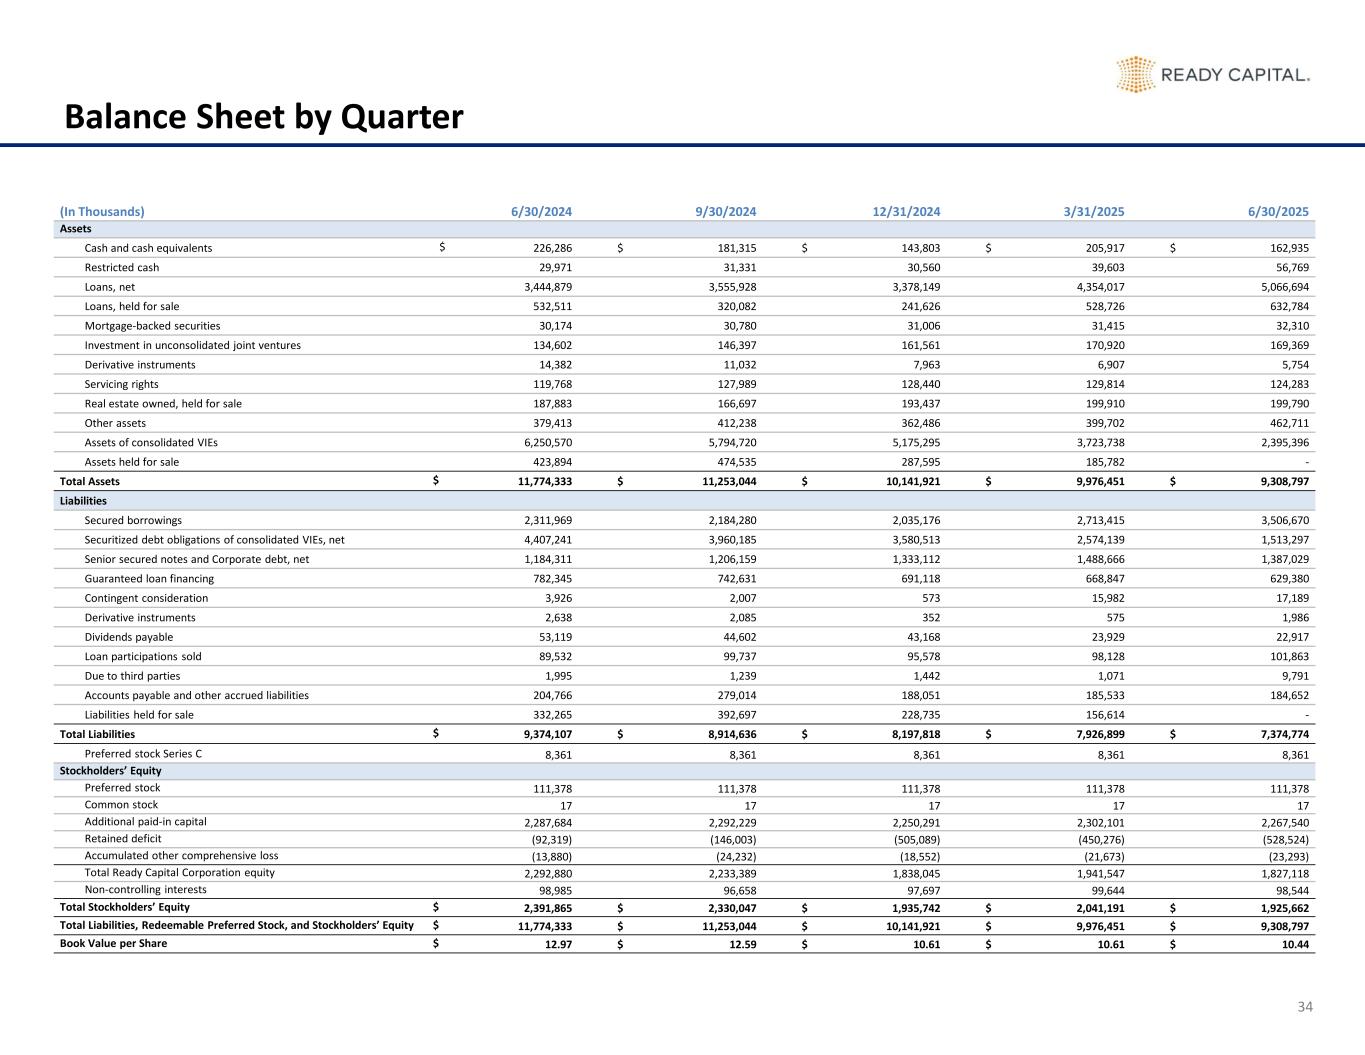
34 Balance Sheet by Quarter (In Thousands) 6/30/2024 9/30/2024 12/31/2024 3/31/2025 6/30/2025 Assets Cash and cash equivalents $ 226,286 $ 181,315 $ 143,803 $ 205,917 $ 162,935 Restricted cash 29,971 31,331 30,560 39,603 56,769 Loans, net 3,444,879 3,555,928 3,378,149 4,354,017 5,066,694 Loans, held for sale 532,511 320,082 241,626 528,726 632,784 Mortgage-backed securities 30,174 30,780 31,006 31,415 32,310 Investment in unconsolidated joint ventures 134,602 146,397 161,561 170,920 169,369 Derivative instruments 14,382 11,032 7,963 6,907 5,754 Servicing rights 119,768 127,989 128,440 129,814 124,283 Real estate owned, held for sale 187,883 166,697 193,437 199,910 199,790 Other assets 379,413 412,238 362,486 399,702 462,711 Assets of consolidated VIEs 6,250,570 5,794,720 5,175,295 3,723,738 2,395,396 Assets held for sale 423,894 474,535 287,595 185,782 - Total Assets $ 11,774,333 $ 11,253,044 $ 10,141,921 $ 9,976,451 $ 9,308,797 Liabilities Secured borrowings 2,311,969 2,184,280 2,035,176 2,713,415 3,506,670 Securitized debt obligations of consolidated VIEs, net 4,407,241 3,960,185 3,580,513 2,574,139 1,513,297 Senior secured notes and Corporate debt, net 1,184,311 1,206,159 1,333,112 1,488,666 1,387,029 Guaranteed loan financing 782,345 742,631 691,118 668,847 629,380 Contingent consideration 3,926 2,007 573 15,982 17,189 Derivative instruments 2,638 2,085 352 575 1,986 Dividends payable 53,119 44,602 43,168 23,929 22,917 Loan participations sold 89,532 99,737 95,578 98,128 101,863 Due to third parties 1,995 1,239 1,442 1,071 9,791 Accounts payable and other accrued liabilities 204,766 279,014 188,051 185,533 184,652 Liabilities held for sale 332,265 392,697 228,735 156,614 - Total Liabilities $ 9,374,107 $ 8,914,636 $ 8,197,818 $ 7,926,899 $ 7,374,774 Preferred stock Series C 8,361 8,361 8,361 8,361 8,361 Stockholders’ Equity Preferred stock 111,378 111,378 111,378 111,378 111,378 Common stock 17 17 17 17 17 Additional paid-in capital 2,287,684 2,292,229 2,250,291 2,302,101 2,267,540 Retained deficit (92,319) (146,003) (505,089) (450,276) (528,524) Accumulated other comprehensive loss (13,880) (24,232) (18,552) (21,673) (23,293) Total Ready Capital Corporation equity 2,292,880 2,233,389 1,838,045 1,941,547 1,827,118 Non-controlling interests 98,985 96,658 97,697 99,644 98,544 Total Stockholders’ Equity $ 2,391,865 $ 2,330,047 $ 1,935,742 $ 2,041,191 $ 1,925,662 Total Liabilities, Redeemable Preferred Stock, and Stockholders’ Equity $ 11,774,333 $ 11,253,044 $ 10,141,921 $ 9,976,451 $ 9,308,797 Book Value per Share $ 12.97 $ 12.59 $ 10.61 $ 10.61 $ 10.44
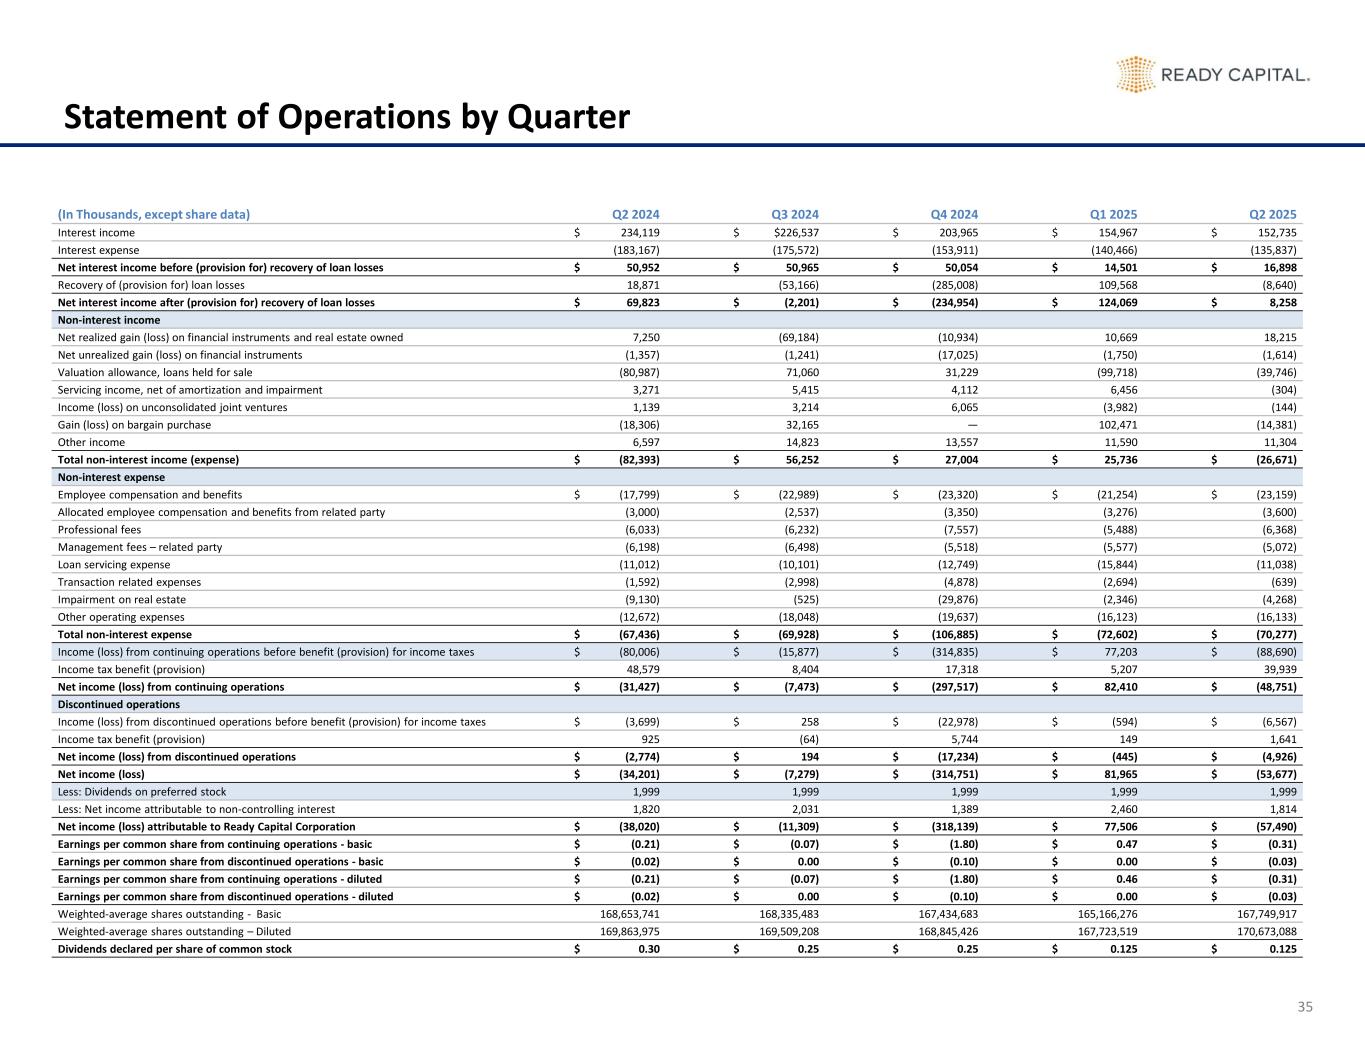
35 Statement of Operations by Quarter (In Thousands, except share data) Q2 2024 Q3 2024 Q4 2024 Q1 2025 Q2 2025 Interest income $ 234,119 $ $226,537 $ 203,965 $ 154,967 $ 152,735 Interest expense (183,167) (175,572) (153,911) (140,466) (135,837) Net interest income before (provision for) recovery of loan losses $ 50,952 $ 50,965 $ 50,054 $ 14,501 $ 16,898 Recovery of (provision for) loan losses 18,871 (53,166) (285,008) 109,568 (8,640) Net interest income after (provision for) recovery of loan losses $ 69,823 $ (2,201) $ (234,954) $ 124,069 $ 8,258 Non-interest income Net realized gain (loss) on financial instruments and real estate owned 7,250 (69,184) (10,934) 10,669 18,215 Net unrealized gain (loss) on financial instruments (1,357) (1,241) (17,025) (1,750) (1,614) Valuation allowance, loans held for sale (80,987) 71,060 31,229 (99,718) (39,746) Servicing income, net of amortization and impairment 3,271 5,415 4,112 6,456 (304) Income (loss) on unconsolidated joint ventures 1,139 3,214 6,065 (3,982) (144) Gain (loss) on bargain purchase (18,306) 32,165 — 102,471 (14,381) Other income 6,597 14,823 13,557 11,590 11,304 Total non-interest income (expense) $ (82,393) $ 56,252 $ 27,004 $ 25,736 $ (26,671) Non-interest expense Employee compensation and benefits $ (17,799) $ (22,989) $ (23,320) $ (21,254) $ (23,159) Allocated employee compensation and benefits from related party (3,000) (2,537) (3,350) (3,276) (3,600) Professional fees (6,033) (6,232) (7,557) (5,488) (6,368) Management fees – related party (6,198) (6,498) (5,518) (5,577) (5,072) Loan servicing expense (11,012) (10,101) (12,749) (15,844) (11,038) Transaction related expenses (1,592) (2,998) (4,878) (2,694) (639) Impairment on real estate (9,130) (525) (29,876) (2,346) (4,268) Other operating expenses (12,672) (18,048) (19,637) (16,123) (16,133) Total non-interest expense $ (67,436) $ (69,928) $ (106,885) $ (72,602) $ (70,277) Income (loss) from continuing operations before benefit (provision) for income taxes $ (80,006) $ (15,877) $ (314,835) $ 77,203 $ (88,690) Income tax benefit (provision) 48,579 8,404 17,318 5,207 39,939 Net income (loss) from continuing operations $ (31,427) $ (7,473) $ (297,517) $ 82,410 $ (48,751) Discontinued operations Income (loss) from discontinued operations before benefit (provision) for income taxes $ (3,699) $ 258 $ (22,978) $ (594) $ (6,567) Income tax benefit (provision) 925 (64) 5,744 149 1,641 Net income (loss) from discontinued operations $ (2,774) $ 194 $ (17,234) $ (445) $ (4,926) Net income (loss) $ (34,201) $ (7,279) $ (314,751) $ 81,965 $ (53,677) Less: Dividends on preferred stock 1,999 1,999 1,999 1,999 1,999 Less: Net income attributable to non-controlling interest 1,820 2,031 1,389 2,460 1,814 Net income (loss) attributable to Ready Capital Corporation $ (38,020) $ (11,309) $ (318,139) $ 77,506 $ (57,490) Earnings per common share from continuing operations - basic $ (0.21) $ (0.07) $ (1.80) $ 0.47 $ (0.31) Earnings per common share from discontinued operations - basic $ (0.02) $ 0.00 $ (0.10) $ 0.00 $ (0.03) Earnings per common share from continuing operations - diluted $ (0.21) $ (0.07) $ (1.80) $ 0.46 $ (0.31) Earnings per common share from discontinued operations - diluted $ (0.02) $ 0.00 $ (0.10) $ 0.00 $ (0.03) Weighted-average shares outstanding - Basic 168,653,741 168,335,483 167,434,683 165,166,276 167,749,917 Weighted-average shares outstanding – Diluted 169,863,975 169,509,208 168,845,426 167,723,519 170,673,088 Dividends declared per share of common stock $ 0.30 $ 0.25 $ 0.25 $ 0.125 $ 0.125
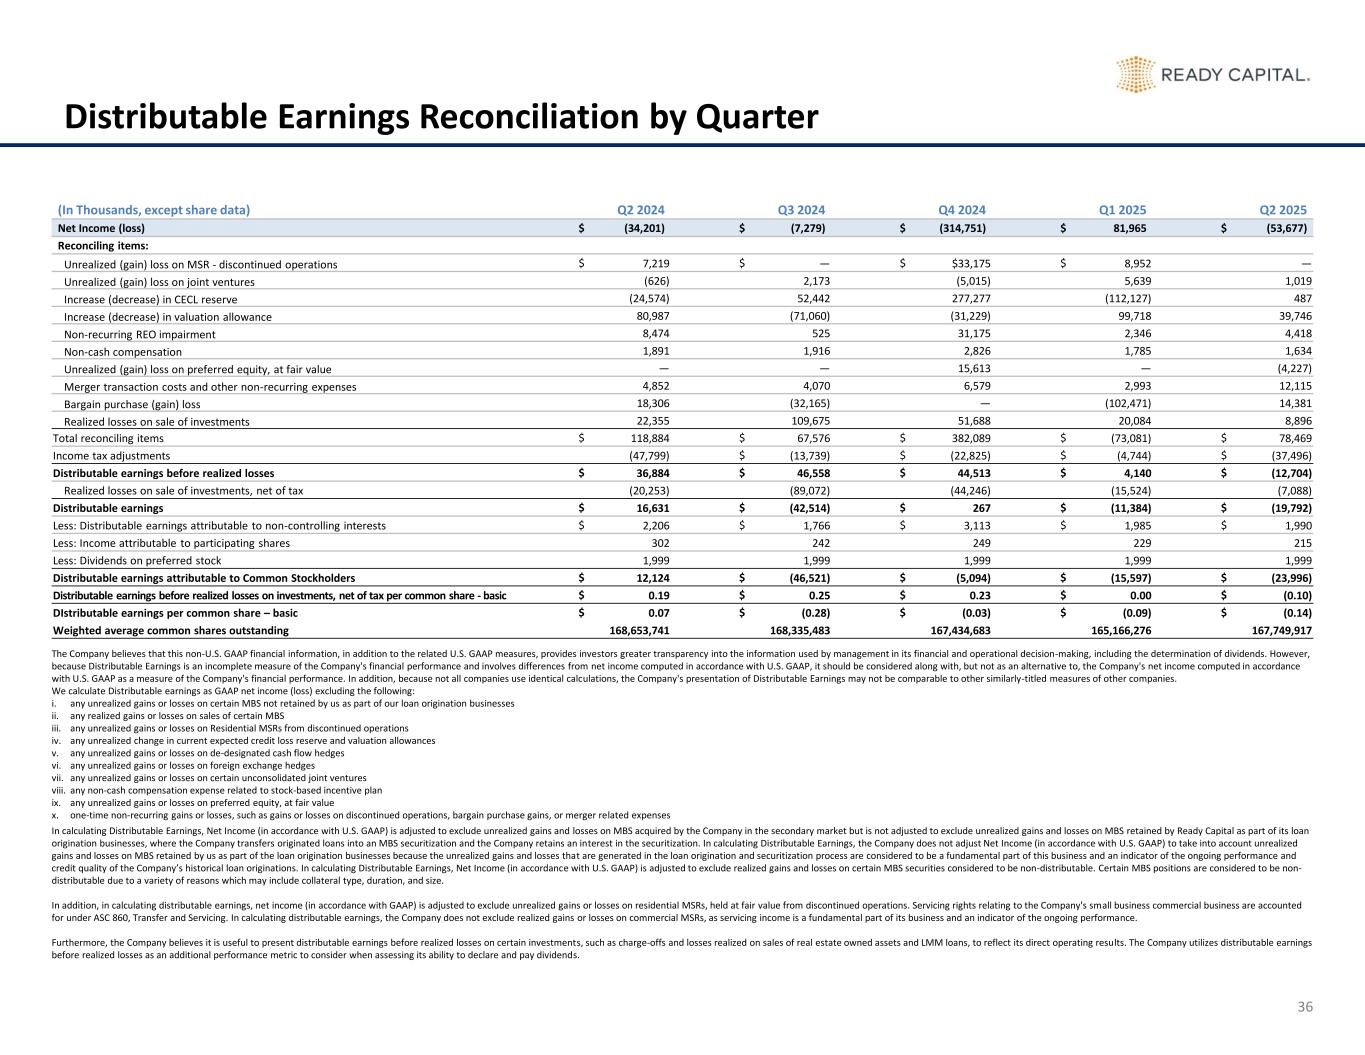
36 Distributable Earnings Reconciliation by Quarter (In Thousands, except share data) Q2 2024 Q3 2024 Q4 2024 Q1 2025 Q2 2025 Net Income (loss) $ (34,201) $ (7,279) $ (314,751) $ 81,965 $ (53,677) Reconciling items: Unrealized (gain) loss on MSR - discontinued operations $ 7,219 $ — $ $33,175 $ 8,952 — Unrealized (gain) loss on joint ventures (626) 2,173 (5,015) 5,639 1,019 Increase (decrease) in CECL reserve (24,574) 52,442 277,277 (112,127) 487 Increase (decrease) in valuation allowance 80,987 (71,060) (31,229) 99,718 39,746 Non-recurring REO impairment 8,474 525 31,175 2,346 4,418 Non-cash compensation 1,891 1,916 2,826 1,785 1,634 Unrealized (gain) loss on preferred equity, at fair value — — 15,613 — (4,227) Merger transaction costs and other non-recurring expenses 4,852 4,070 6,579 2,993 12,115 Bargain purchase (gain) loss 18,306 (32,165) — (102,471) 14,381 Realized losses on sale of investments 22,355 109,675 51,688 20,084 8,896 Total reconciling items $ 118,884 $ 67,576 $ 382,089 $ (73,081) $ 78,469 Income tax adjustments (47,799) $ (13,739) $ (22,825) $ (4,744) $ (37,496) Distributable earnings before realized losses $ 36,884 $ 46,558 $ 44,513 $ 4,140 $ (12,704) Realized losses on sale of investments, net of tax (20,253) (89,072) (44,246) (15,524) (7,088) Distributable earnings $ 16,631 $ (42,514) $ 267 $ (11,384) $ (19,792) Less: Distributable earnings attributable to non-controlling interests $ 2,206 $ 1,766 $ 3,113 $ 1,985 $ 1,990 Less: Income attributable to participating shares 302 242 249 229 215 Less: Dividends on preferred stock 1,999 1,999 1,999 1,999 1,999 Distributable earnings attributable to Common Stockholders $ 12,124 $ (46,521) $ (5,094) $ (15,597) $ (23,996) Distributable earnings before realized losses on investments, net of tax per common share - basic $ 0.19 $ 0.25 $ 0.23 $ 0.00 $ (0.10) DIstributable earnings per common share – basic $ 0.07 $ (0.28) $ (0.03) $ (0.09) $ (0.14) Weighted average common shares outstanding 168,653,741 168,335,483 167,434,683 165,166,276 167,749,917 The Company believes that this non-U.S. GAAP financial information, in addition to the related U.S. GAAP measures, provides investors greater transparency into the information used by management in its financial and operational decision-making, including the determination of dividends. However, because Distributable Earnings is an incomplete measure of the Company's financial performance and involves differences from net income computed in accordance with U.S. GAAP, it should be considered along with, but not as an alternative to, the Company's net income computed in accordance with U.S. GAAP as a measure of the Company's financial performance. In addition, because not all companies use identical calculations, the Company's presentation of Distributable Earnings may not be comparable to other similarly-titled measures of other companies. We calculate Distributable earnings as GAAP net income (loss) excluding the following: i. any unrealized gains or losses on certain MBS not retained by us as part of our loan origination businesses ii. any realized gains or losses on sales of certain MBS iii. any unrealized gains or losses on Residential MSRs from discontinued operations iv. any unrealized change in current expected credit loss reserve and valuation allowances v. any unrealized gains or losses on de-designated cash flow hedges vi. any unrealized gains or losses on foreign exchange hedges vii. any unrealized gains or losses on certain unconsolidated joint ventures viii. any non-cash compensation expense related to stock-based incentive plan ix. any unrealized gains or losses on preferred equity, at fair value x. one-time non-recurring gains or losses, such as gains or losses on discontinued operations, bargain purchase gains, or merger related expenses In calculating Distributable Earnings, Net Income (in accordance with U.S. GAAP) is adjusted to exclude unrealized gains and losses on MBS acquired by the Company in the secondary market but is not adjusted to exclude unrealized gains and losses on MBS retained by Ready Capital as part of its loan origination businesses, where the Company transfers originated loans into an MBS securitization and the Company retains an interest in the securitization. In calculating Distributable Earnings, the Company does not adjust Net Income (in accordance with U.S. GAAP) to take into account unrealized gains and losses on MBS retained by us as part of the loan origination businesses because the unrealized gains and losses that are generated in the loan origination and securitization process are considered to be a fundamental part of this business and an indicator of the ongoing performance and credit quality of the Company’s historical loan originations. In calculating Distributable Earnings, Net Income (in accordance with U.S. GAAP) is adjusted to exclude realized gains and losses on certain MBS securities considered to be non-distributable. Certain MBS positions are considered to be non- distributable due to a variety of reasons which may include collateral type, duration, and size. In addition, in calculating distributable earnings, net income (in accordance with GAAP) is adjusted to exclude unrealized gains or losses on residential MSRs, held at fair value from discontinued operations. Servicing rights relating to the Company's small business commercial business are accounted for under ASC 860, Transfer and Servicing. In calculating distributable earnings, the Company does not exclude realized gains or losses on commercial MSRs, as servicing income is a fundamental part of its business and an indicator of the ongoing performance. Furthermore, the Company believes it is useful to present distributable earnings before realized losses on certain investments, such as charge-offs and losses realized on sales of real estate owned assets and LMM loans, to reflect its direct operating results. The Company utilizes distributable earnings before realized losses as an additional performance metric to consider when assessing its ability to declare and pay dividends.
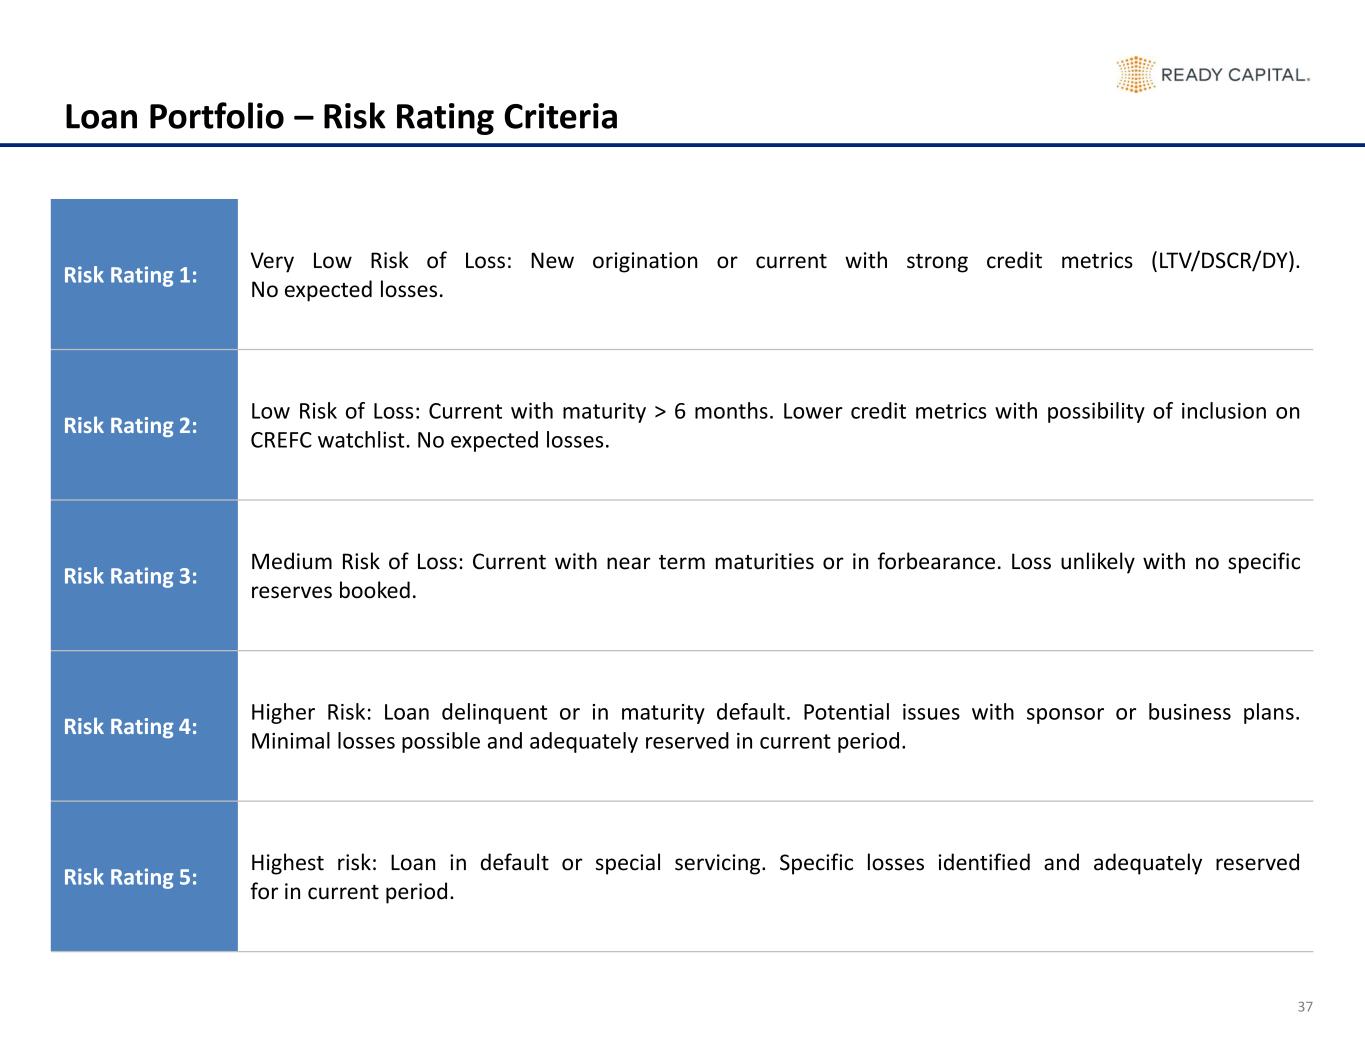
37 Loan Portfolio – Risk Rating Criteria Risk Rating 1: Very Low Risk of Loss: New origination or current with strong credit metrics (LTV/DSCR/DY). No expected losses. Risk Rating 2: Low Risk of Loss: Current with maturity > 6 months. Lower credit metrics with possibility of inclusion on CREFC watchlist. No expected losses. Risk Rating 3: Medium Risk of Loss: Current with near term maturities or in forbearance. Loss unlikely with no specific reserves booked. Risk Rating 4: Higher Risk: Loan delinquent or in maturity default. Potential issues with sponsor or business plans. Minimal losses possible and adequately reserved in current period. Risk Rating 5: Highest risk: Loan in default or special servicing. Specific losses identified and adequately reserved for in current period.
