–Preliminary Draft: For Discussion Purposes Only – Exhibit (c)(4) Project Aviary Presentation to the Board of Directors February 2, 2026
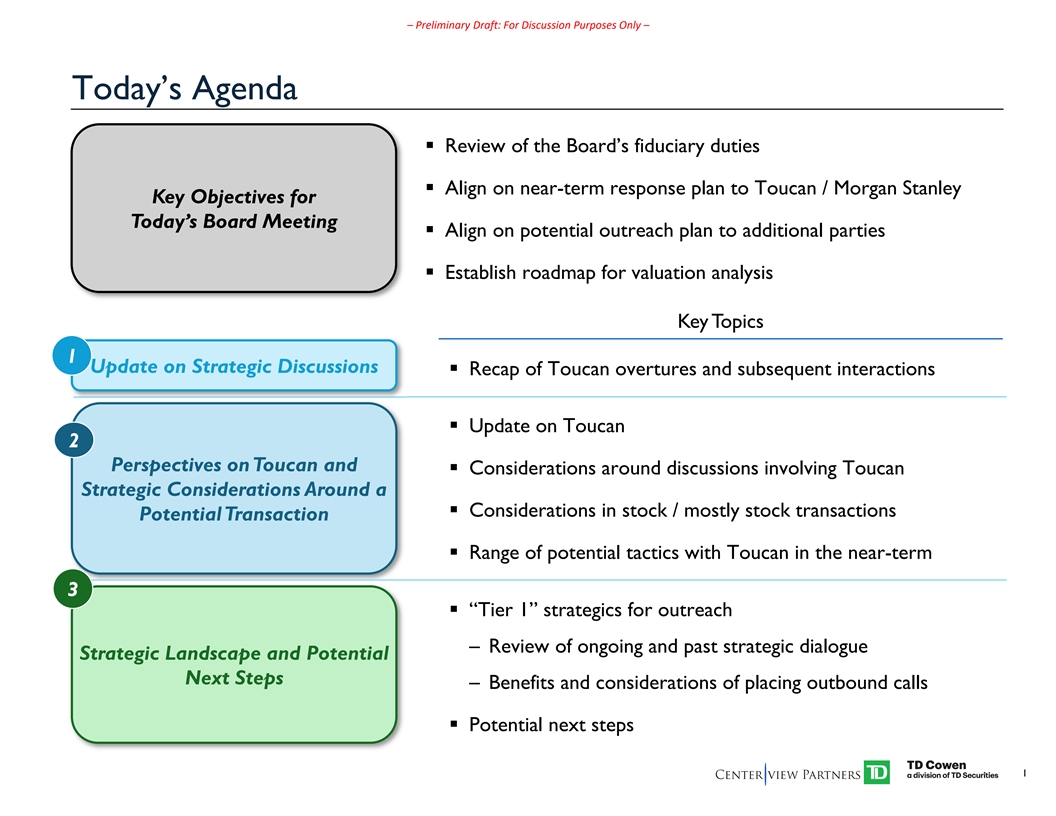
–Preliminary Draft: For Discussion Purposes Only – Today’s Agenda § Review of the Board’s fiduciary duties § Align on near-term response plan to Toucan / Morgan Stanley Key Objectives for Today’s Board Meeting § Align on potential outreach plan to additional parties § Establish roadmap for valuation analysis Key T opics 1 Update on Strategic Discussions § Recap of Toucan overtures and subsequent interactions § Update on Toucan 2 Perspectives on Toucan and § Considerations around discussions involving Toucan Strategic Considerations Around a § Considerations in stock / mostly stock transactions Potential Transaction § Range of potential tactics with Toucan in the near-term 3 § “Tier 1” strategics for outreach – Review of ongoing and past strategic dialogue Strategic Landscape and Potential Next Steps – Benefits and considerations of placing outbound calls § Potential next steps 1
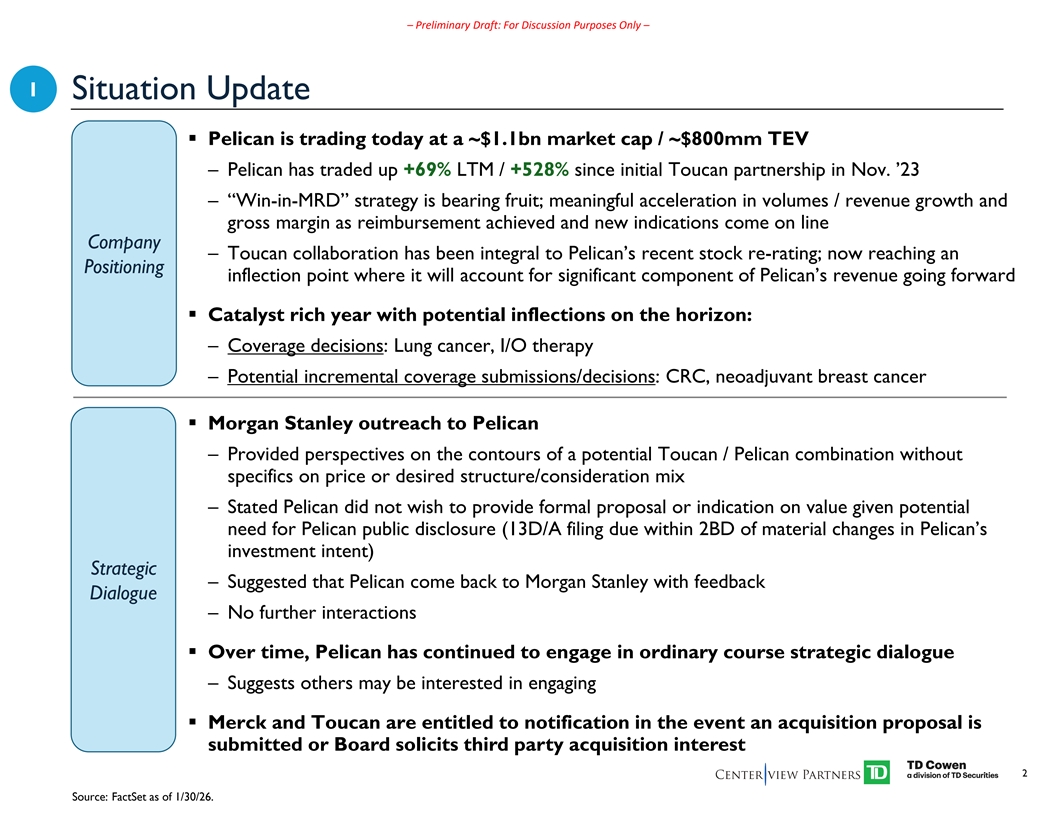
–Preliminary Draft: For Discussion Purposes Only – 1 Situation Update § Pelican is trading today at a ~$1.1bn market cap / ~$800mm TEV – Pelican has traded up +69% LTM / +528% since initial Toucan partnership in Nov. ’23 – “Win-in-MRD” strategy is bearing fruit; meaningful acceleration in volumes / revenue growth and gross margin as reimbursement achieved and new indications come on line Company – Toucan collaboration has been integral to Pelican’s recent stock re-rating; now reaching an Positioning inflection point where it will account for significant component of Pelican’s revenue going forward § Catalyst rich year with potential inflections on the horizon: – Coverage decisions: Lung cancer, I/O therapy – Potential incremental coverage submissions/decisions: CRC, neoadjuvant breast cancer § Morgan Stanley outreach to Pelican – Provided perspectives on the contours of a potential Toucan / Pelican combination without specifics on price or desired structure/consideration mix – Stated Pelican did not wish to provide formal proposal or indication on value given potential need for Pelican public disclosure (13D/A filing due within 2BD of material changes in Pelican’s investment intent) Strategic – Suggested that Pelican come back to Morgan Stanley with feedback Dialogue – No further interactions § Over time, Pelican has continued to engage in ordinary course strategic dialogue – Suggests others may be interested in engaging § Merck and Toucan are entitled to notification in the event an acquisition proposal is submitted or Board solicits third party acquisition interest 2 Source: FactSet as of 1/30/26.
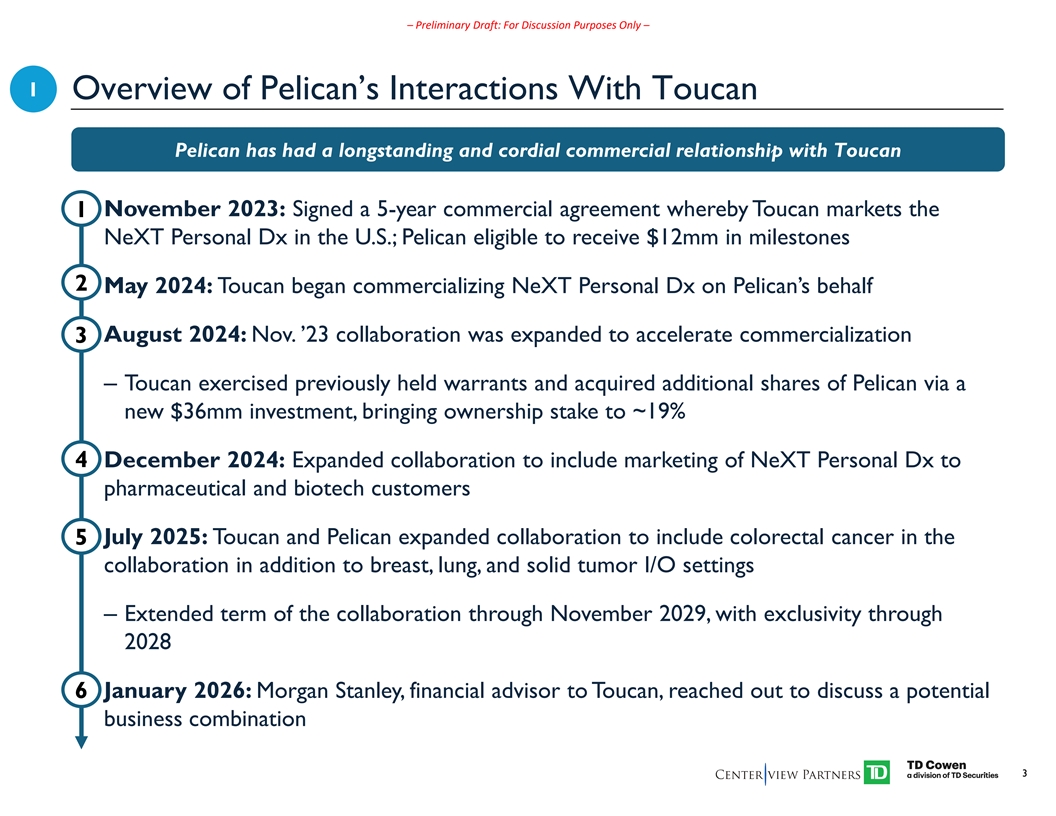
–Preliminary Draft: For Discussion Purposes Only – 1 Overview of Pelican’s Interactions With Toucan Pelican has had a longstanding and cordial commercial relationship with Toucan § November 2023: Signed a 5-year commercial agreement whereby Toucan markets the 1 NeXT Personal Dx in the U.S.; Pelican eligible to receive $12mm in milestones 2 § May 2024: Toucan began commercializing NeXT Personal Dx on Pelican’s behalf 3§ August 2024: Nov. ’23 collaboration was expanded to accelerate commercialization – Toucan exercised previously held warrants and acquired additional shares of Pelican via a new $36mm investment, bringing ownership stake to ~19% 4§ December 2024: Expanded collaboration to include marketing of NeXT Personal Dx to pharmaceutical and biotech customers § July 2025: Toucan and Pelican expanded collaboration to include colorectal cancer in the 5 collaboration in addition to breast, lung, and solid tumor I/O settings – Extended term of the collaboration through November 2029, with exclusivity through 2028 6§ January 2026: Morgan Stanley, financial advisor to Toucan, reached out to discuss a potential business combination 3
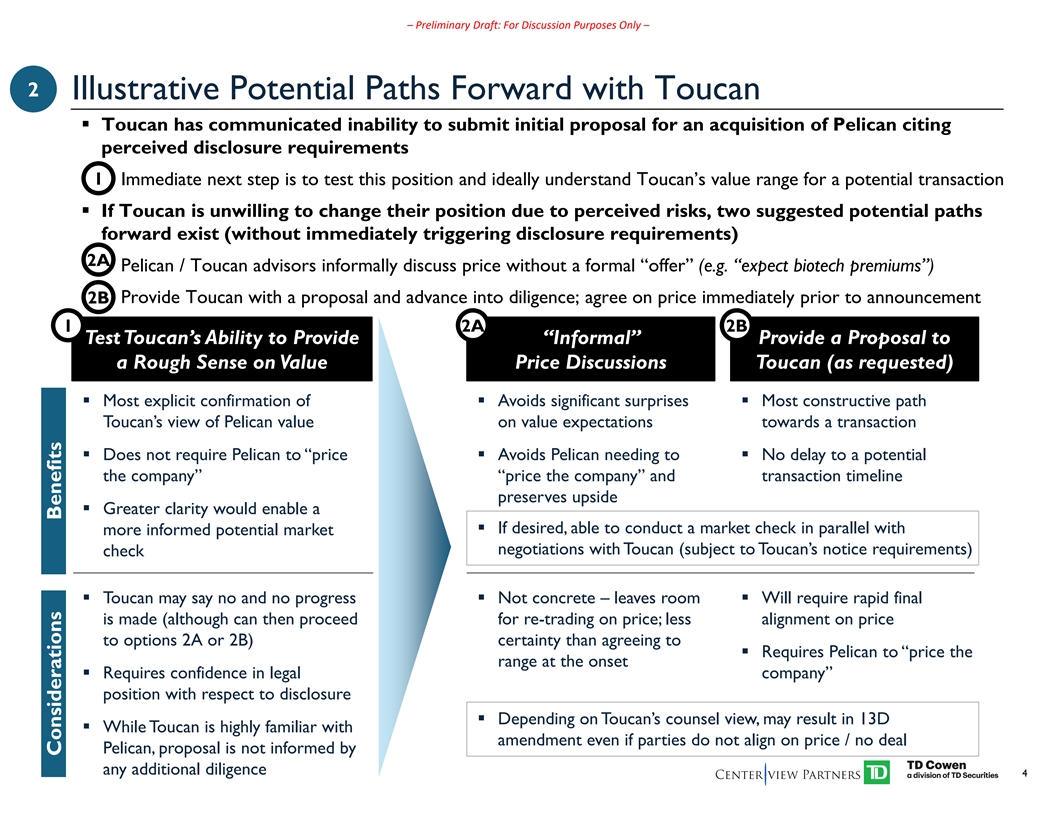
–Preliminary Draft: For Discussion Purposes Only – 2 Illustrative Potential Paths Forward with Toucan § Toucan has communicated inability to submit initial proposal for an acquisition of Pelican citing perceived disclosure requirements 1– Immediate next step is to test this position and ideally understand Toucan’s value range for a potential transaction § If Toucan is unwilling to change their position due to perceived risks, two suggested potential paths forward exist (without immediately triggering disclosure requirements) 2A – Pelican / Toucan advisors informally discuss price without a formal “offer” (e.g. “expect biotech premiums”) 2B – Provide Toucan with a proposal and advance into diligence; agree on price immediately prior to announcement 1 2A 2B Test Toucan’s Ability to Provide “Informal” Provide a Proposal to a Rough Sense on Value Price Discussions Toucan (as requested) § Most explicit confirmation of § Avoids significant surprises § Most constructive path Toucan’s view of Pelican value on value expectations towards a transaction § Does not require Pelican to “price § Avoids Pelican needing to § No delay to a potential the company” “price the company” and transaction timeline preserves upside § Greater clarity would enable a § If desired, able to conduct a market check in parallel with more informed potential market negotiations with Toucan (subject to Toucan’s notice requirements) check § Toucan may say no and no progress § Not concrete – leaves room § Will require rapid final is made (although can then proceed for re-trading on price; less alignment on price to options 2A or 2B) certainty than agreeing to § Requires Pelican to “price the range at the onset § Requires confidence in legal company” position with respect to disclosure § Depending on Toucan’s counsel view, may result in 13D § While Toucan is highly familiar with amendment even if parties do not align on price / no deal Pelican, proposal is not informed by any additional diligence 4 Considerations Benefits
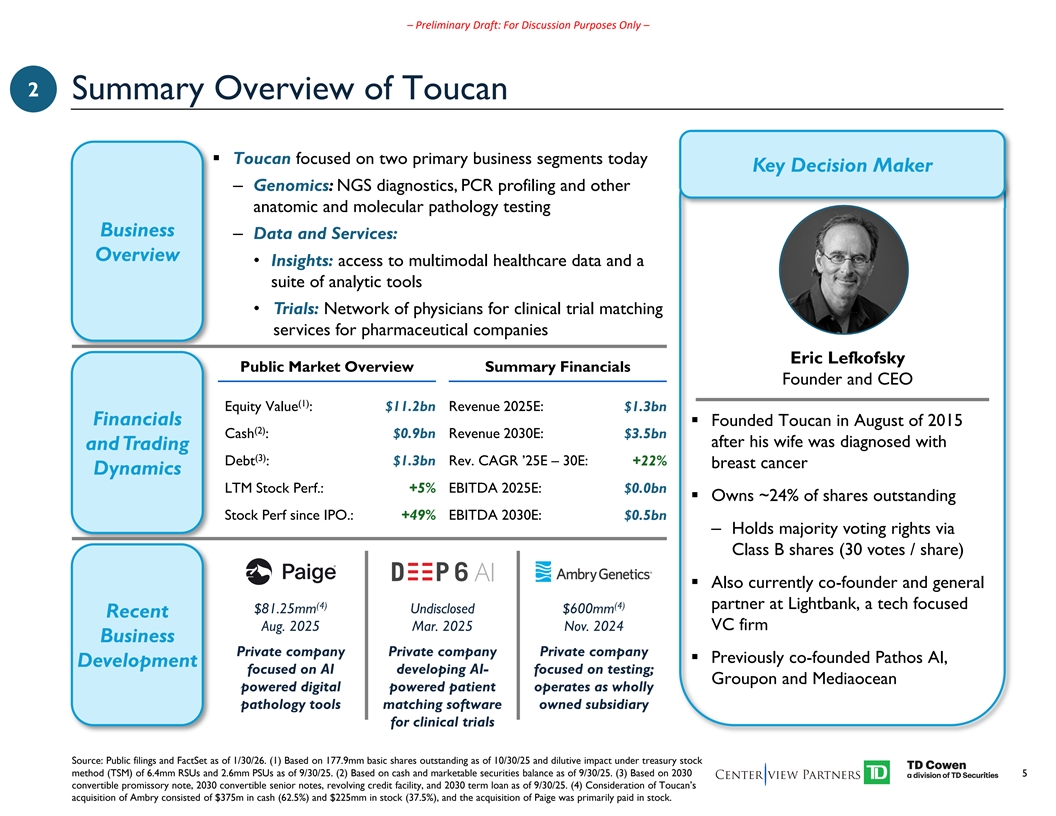
–Preliminary Draft: For Discussion Purposes Only – 2 Summary Overview of Toucan § Toucan focused on two primary business segments today Key Decision Maker – Genomics: NGS diagnostics, PCR profiling and other anatomic and molecular pathology testing Business – Data and Services: Overview • Insights: access to multimodal healthcare data and a suite of analytic tools • Trials: Network of physicians for clinical trial matching services for pharmaceutical companies Eric Lefkofsky Public Market Overview Summary Financials Founder and CEO (1) Equity Value : $11.2bn Revenue 2025E: $1.3bn Financials § Founded Toucan in August of 2015 (2) Cash : $0.9bn Revenue 2030E: $3.5bn after his wife was diagnosed with and Trading (3) Debt : $1.3bn Rev. CAGR ’25E – 30E: +22% breast cancer Dynamics LTM Stock Perf.: +5% EBITDA 2025E: $0.0bn § Owns ~24% of shares outstanding Stock Perf since IPO.: +49% EBITDA 2030E: $0.5bn – Holds majority voting rights via Class B shares (30 votes / share) § Also currently co-founder and general (4) (4) partner at Lightbank, a tech focused $81.25mm Undisclosed $600mm Recent Aug. 2025 Mar. 2025 Nov. 2024 VC firm Business Private company Private company Private company § Previously co-founded Pathos AI, Development focused on AI developing AI- focused on testing; Groupon and Mediaocean powered digital powered patient operates as wholly pathology tools matching software owned subsidiary for clinical trials Source: Public filings and FactSet as of 1/30/26. (1) Based on 177.9mm basic shares outstanding as of 10/30/25 and dilutive impact under treasury stock method (TSM) of 6.4mm RSUs and 2.6mm PSUs as of 9/30/25. (2) Based on cash and marketable securities balance as of 9/30/25. (3) Based on 2030 5 convertible promissory note, 2030 convertible senior notes, revolving credit facility, and 2030 term loan as of 9/30/25. (4) Consideration of Toucan’s acquisition of Ambry consisted of $375m in cash (62.5%) and $225mm in stock (37.5%), and the acquisition of Paige was primarily paid in stock.
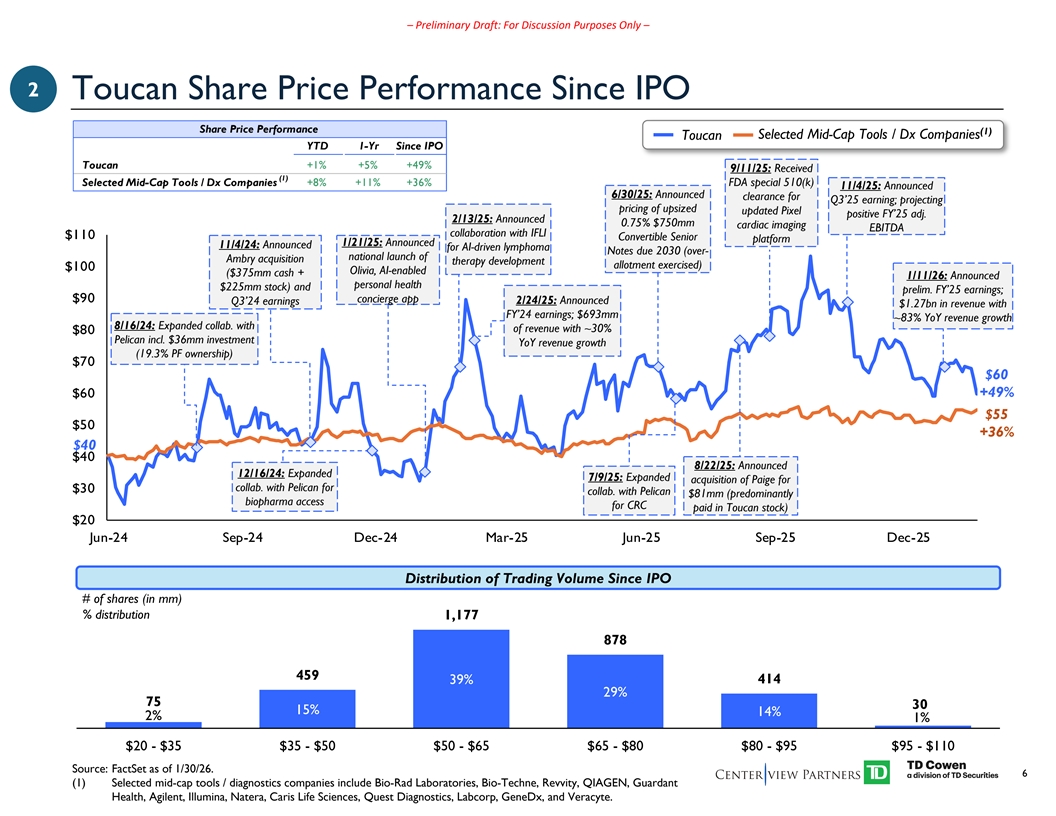
–Preliminary Draft: For Discussion Purposes Only – 2 Toucan Share Price Performance Since IPO Share Price Performance (1) Selected Mid-Cap Tools / Dx Companies Toucan YTD 1-Yr Since IPO Toucan +1% +5% +49% 9/11/25: Received (1) Selected Mid-Cap Tools / Dx Companies +8% +11% +36% FDA special 510(k) 11/4/25: Announced 6/30/25: Announced clearance for Q3’25 earning; projecting pricing of upsized updated Pixel positive FY’25 adj. 2/13/25: Announced 0.75% $750mm cardiac imaging EBITDA collaboration with IFLI $110 Convertible Senior platform 1/21/25: Announced 11/4/24: Announced for AI-driven lymphoma Notes due 2030 (over- national launch of Ambry acquisition therapy development allotment exercised) $100 Olivia, AI-enabled ($375mm cash + 1/11/26: Announced personal health $225mm stock) and prelim. FY’25 earnings; $90 concierge app 2/24/25: Announced Q3’24 earnings $1.27bn in revenue with FY’24 earnings; $693mm ~83% YoY revenue growth 8/16/24: Expanded collab. with of revenue with ~30% $80 Pelican incl. $36mm investment YoY revenue growth (19.3% PF ownership) $70 $60 $60 +49% $55 $50 +36% $40 $40 8/22/25: Announced 12/16/24: Expanded 7/9/25: Expanded acquisition of Paige for collab. with Pelican for $30 collab. with Pelican $81mm (predominantly biopharma access for CRC paid in Toucan stock) $20 Jun-24 Sep-24 Dec-24 Mar-25 Jun-25 Sep-25 Dec-25 Distribution of Trading Volume Since IPO # of shares (in mm) % distribution 1,177 878 459 39% 414 29% 75 30 15% 14% 2% 1% $20 - $35 $35 - $50 $50 - $65 $65 - $80 $80 - $95 $95 - $110 Source: FactSet as of 1/30/26. 6 (1) Selected mid-cap tools / diagnostics companies include Bio-Rad Laboratories, Bio-Techne, Revvity, QIAGEN, Guardant Health, Agilent, Illumina, Natera, Caris Life Sciences, Quest Diagnostics, Labcorp, GeneDx, and Veracyte.
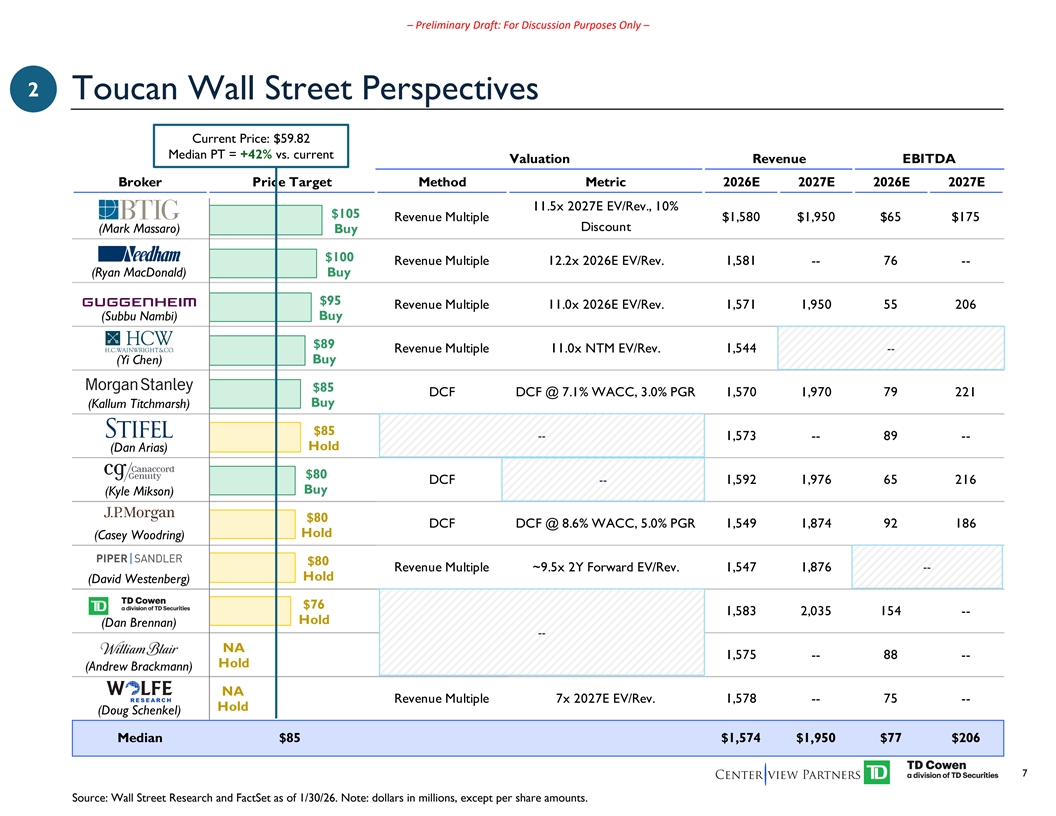
–Preliminary Draft: For Discussion Purposes Only – 2 Toucan Wall Street Perspectives Current Price: $59.82 Median PT = +42% vs. current Valuation Revenue EBITDA Broker Price Target Method Metric 2026E 2027E 2026E 2027E 11.5x 2027E EV/Rev., 10% $105 Revenue Multiple $1,580 $1,950 $65 $175 Discount (Mark Massaro) Buy $100 Revenue Multiple 12.2x 2026E EV/Rev. 1,581 -- 76 -- (Ryan MacDonald) Buy $95 Revenue Multiple 11.0x 2026E EV/Rev. 1,571 1,950 55 206 (Subbu Nambi) Buy $89 -- Revenue Multiple 11.0x NTM EV/Rev. 1,544 -- -- -- (Yi Chen) Buy $85 DCF DCF @ 7.1% WACC, 3.0% PGR 1,570 1,970 79 221 Buy (Kallum Titchmarsh) $85 -- 1,573 -- 89 -- Hold (Dan Arias) $80 DCF -- 1,592 1,976 65 216 Buy (Kyle Mikson) $80 DCF DCF @ 8.6% WACC, 5.0% PGR 1,549 1,874 92 186 Hold (Casey Woodring) $80 -- Revenue Multiple ~9.5x 2Y Forward EV/Rev. 1,547 1,876 -- -- Hold (David Westenberg) $76 1,583 2,035 154 -- Hold (Dan Brennan) -- NA 1,575 -- 88 -- Hold (Andrew Brackmann) NA Revenue Multiple 7x 2027E EV/Rev. 1,578 -- 75 -- Hold (Doug Schenkel) Median $85 $1,574 $1,950 $77 $206 7 Source: Wall Street Research and FactSet as of 1/30/26. Note: dollars in millions, except per share amounts.
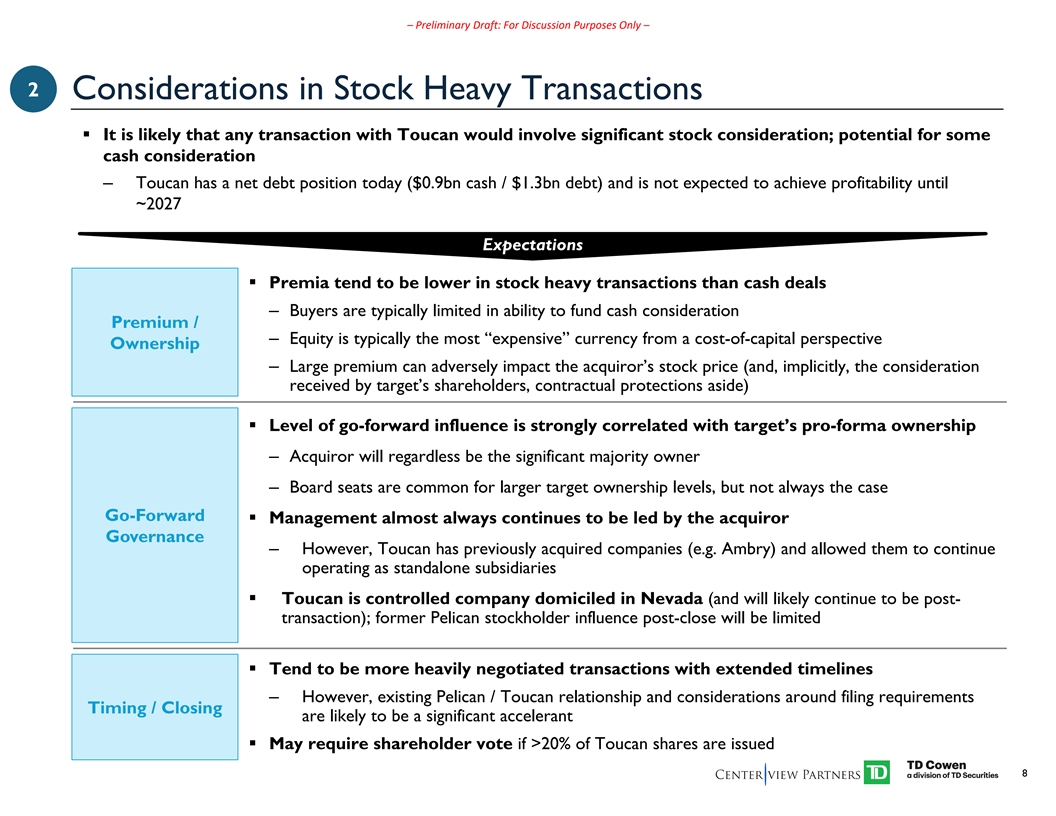
–Preliminary Draft: For Discussion Purposes Only – 2 Considerations in Stock Heavy Transactions § It is likely that any transaction with Toucan would involve significant stock consideration; potential for some cash consideration – Toucan has a net debt position today ($0.9bn cash / $1.3bn debt) and is not expected to achieve profitability until ~2027 Expectations § Premia tend to be lower in stock heavy transactions than cash deals – Buyers are typically limited in ability to fund cash consideration Premium / – Equity is typically the most “expensive” currency from a cost-of-capital perspective Ownership – Large premium can adversely impact the acquiror’s stock price (and, implicitly, the consideration received by target’s shareholders, contractual protections aside) § Level of go-forward influence is strongly correlated with target’s pro-forma ownership – Acquiror will regardless be the significant majority owner – Board seats are common for larger target ownership levels, but not always the case Go-Forward § Management almost always continues to be led by the acquiror Governance – However, Toucan has previously acquired companies (e.g. Ambry) and allowed them to continue operating as standalone subsidiaries § Toucan is controlled company domiciled in Nevada (and will likely continue to be post- transaction); former Pelican stockholder influence post-close will be limited § Tend to be more heavily negotiated transactions with extended timelines – However, existing Pelican / Toucan relationship and considerations around filing requirements Timing / Closing are likely to be a significant accelerant § May require shareholder vote if >20% of Toucan shares are issued 8
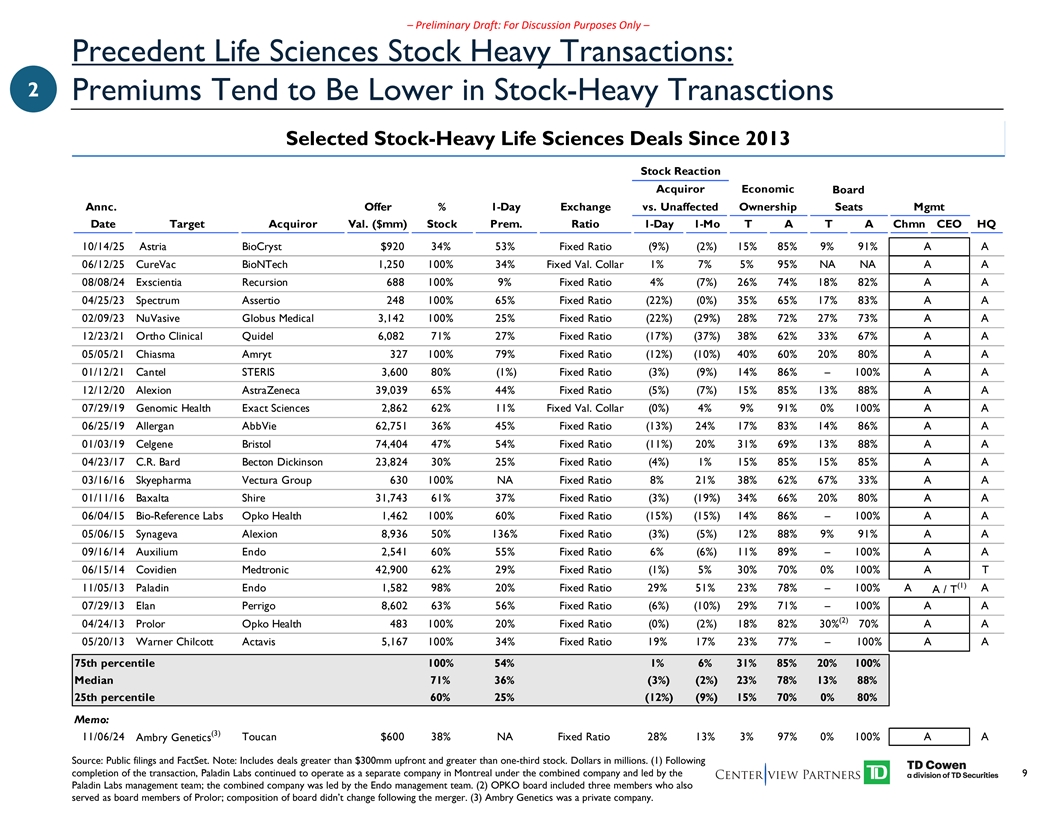
–Preliminary Draft: For Discussion Purposes Only – Precedent Life Sciences Stock Heavy Transactions: 2 Premiums Tend to Be Lower in Stock-Heavy Tranasctions Selected Stock-Heavy Life Sciences Deals Since 2013 Stock Reaction Acquiror Economic Board Annc. Offer%1-DayExchangevs. Unaffected OwnershipSeatsMgmt Date Target Acquiror Val. ($mm) Stock Prem. Ratio 1-Day 1-Mo T A T A Chmn CEO HQ 10/14/25 Astria BioCryst $920 34% 53% Fixed Ratio (9%) (2%) 15% 85% 9% 91% A A 06/12/25 CureVac BioNTech 1,250 100% 34% Fixed Val. Collar 1% 7% 5% 95% NA NA A A 08/08/24 Exscientia Recursion 688 100% 9% Fixed Ratio 4% (7%) 26% 74% 18% 82% A A 04/25/23 Spectrum Assertio 248 100% 65% Fixed Ratio (22%) (0%) 35% 65% 17% 83% A A 02/09/23 NuVasive Globus Medical 3,142 100% 25% Fixed Ratio (22%) (29%) 28% 72% 27% 73% A A 12/23/21 Ortho Clinical Quidel 6,082 71% 27% Fixed Ratio (17%) (37%) 38% 62% 33% 67% A A 05/05/21 Chiasma Amryt 327 100% 79% Fixed Ratio (12%) (10%) 40% 60% 20% 80% A A 01/12/21Cantel STERIS 3,600 80% (1%) Fixed Ratio (3%) (9%) 14% 86% – 100% A A 12/12/20Alexion AstraZeneca 39,039 65% 44% Fixed Ratio (5%) (7%) 15% 85% 13% 88% A A 07/29/19 Genomic Health Exact Sciences 2,862 62% 11% Fixed Val. Collar (0%) 4% 9% 91% 0% 100% A A 06/25/19Allergan AbbVie 62,751 36% 45% Fixed Ratio (13%) 24% 17% 83% 14% 86% A A 01/03/19Celgene Bristol 74,404 47% 54% Fixed Ratio (11%) 20% 31% 69% 13% 88% A A 04/23/17 C.R. Bard Becton Dickinson 23,824 30% 25% Fixed Ratio (4%) 1% 15% 85% 15% 85% A A 03/16/16 Skyepharma Vectura Group 630 100% NA Fixed Ratio 8% 21% 38% 62% 67% 33% A A 01/11/16Baxalta Shire 31,743 61% 37% Fixed Ratio (3%) (19%) 34% 66% 20% 80% A A 06/04/15 Bio-Reference Labs Opko Health 1,462 100% 60% Fixed Ratio (15%) (15%) 14% 86% – 100% A A 05/06/15Synageva Alexion 8,936 50% 136% Fixed Ratio (3%) (5%) 12% 88% 9% 91% A A 09/16/14Auxilium Endo 2,541 60% 55% Fixed Ratio 6% (6%) 11% 89% – 100% A A 06/15/14Covidien Medtronic 42,900 62% 29% Fixed Ratio (1%) 5% 30% 70% 0% 100% A T (1) 11/05/13Paladin Endo 1,582 98% 20% Fixed Ratio 29% 51% 23% 78% – 100% A A A / T 07/29/13Elan Perrigo 8,602 63% 56% Fixed Ratio (6%) (10%) 29% 71% – 100% A A (2) 04/24/13 Prolor Opko Health 483 100% 20% Fixed Ratio (0%) (2%) 18% 82% 30% 70% A A 05/20/13 Warner Chilcott Actavis 5,167 100% 34% Fixed Ratio 19% 17% 23% 77% – 100% A A 75th percentile 100% 54% 1% 6% 31% 85% 20% 100% Median 71% 36% (3%) (2%) 23% 78% 13% 88% 25th percentile 60% 25% (12%) (9%) 15% 70% 0% 80% Memo: (3) 11/06/24 Toucan $600 38% NA Fixed Ratio 28% 13% 3% 97% 0% 100% A A Ambry Genetics Source: Public filings and FactSet. Note: Includes deals greater than $300mm upfront and greater than one-third stock. Dollars in millions. (1) Following completion of the transaction, Paladin Labs continued to operate as a separate company in Montreal under the combined company and led by the 9 Paladin Labs management team; the combined company was led by the Endo management team. (2) OPKO board included three members who also served as board members of Prolor; composition of board didn’t change following the merger. (3) Ambry Genetics was a private company.
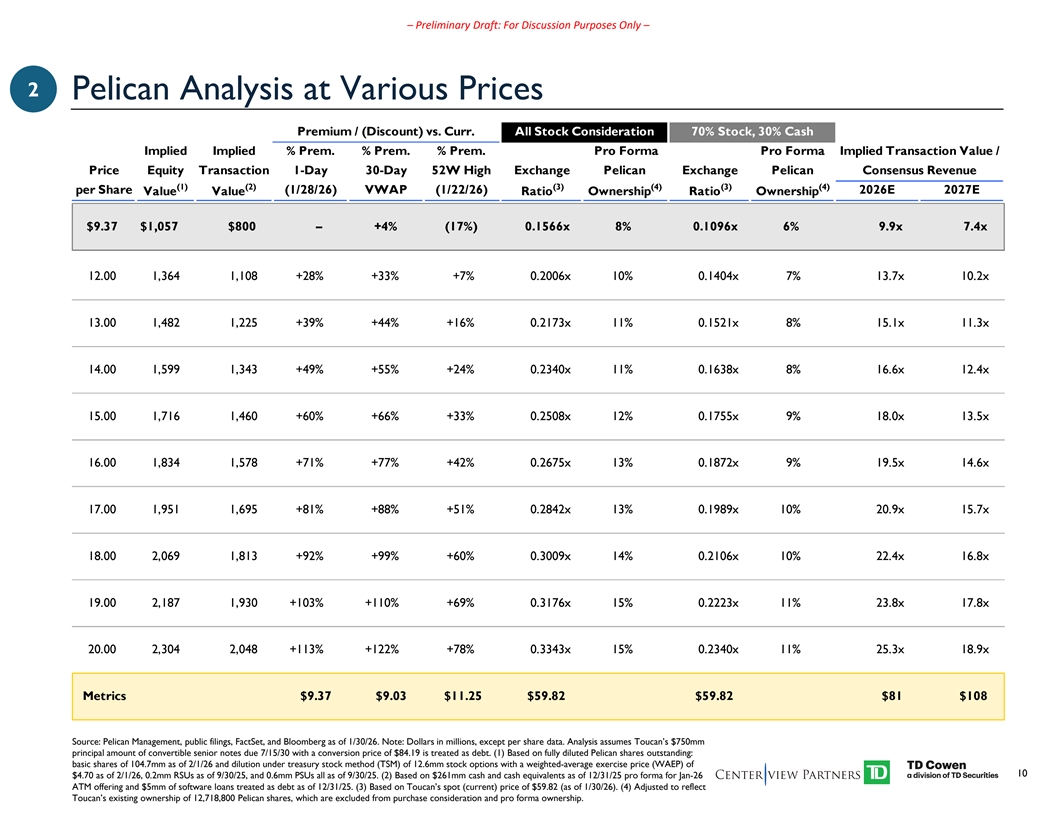
–Preliminary Draft: For Discussion Purposes Only – 2 Pelican Analysis at Various Prices Premium / (Discount) vs. Curr. All Stock Consideration 70% Stock, 30% Cash Implied Implied % Prem. % Prem. % Prem. Pro Forma Pro Forma Implied Transaction Value / Price Equity Transaction 1-Day 30-Day 52W High Exchange Pelican Exchange Pelican Consensus Revenue (1) (2) (3) (4) (3) (4) per Share (1/28/26) VWAP (1/22/26) 2026E 2027E Value Value Ratio Ownership Ratio Ownership $9.37 $1,057 $800 – +4% (17%) 0.1566x 8% 0.1096x 6% 9.9x 7.4x 12.00 1,364 1,108 +28% +33% +7% 0.2006x 10% 0.1404x 7% 13.7x 10.2x 13.00 1,482 1,225 +39% +44% +16% 0.2173x 11% 0.1521x 8% 15.1x 11.3x 14.00 1,599 1,343 +49% +55% +24% 0.2340x 11% 0.1638x 8% 16.6x 12.4x 15.00 1,716 1,460 +60% +66% +33% 0.2508x 12% 0.1755x 9% 18.0x 13.5x 16.00 1,834 1,578 +71% +77% +42% 0.2675x 13% 0.1872x 9% 19.5x 14.6x 17.00 1,951 1,695 +81% +88% +51% 0.2842x 13% 0.1989x 10% 20.9x 15.7x 18.00 2,069 1,813 +92% +99% +60% 0.3009x 14% 0.2106x 10% 22.4x 16.8x 19.00 2,187 1,930 +103% +110% +69% 0.3176x 15% 0.2223x 11% 23.8x 17.8x 20.00 2,304 2,048 +113% +122% +78% 0.3343x 15% 0.2340x 11% 25.3x 18.9x Metrics $9.37 $9.03 $11.25 $59.82 $59.82 $81 $108 Source: Pelican Management, public filings, FactSet, and Bloomberg as of 1/30/26. Note: Dollars in millions, except per share data. Analysis assumes Toucan’s $750mm principal amount of convertible senior notes due 7/15/30 with a conversion price of $84.19 is treated as debt. (1) Based on fully diluted Pelican shares outstanding: basic shares of 104.7mm as of 2/1/26 and dilution under treasury stock method (TSM) of 12.6mm stock options with a weighted-average exercise price (WAEP) of 10 $4.70 as of 2/1/26, 0.2mm RSUs as of 9/30/25, and 0.6mm PSUs all as of 9/30/25. (2) Based on $261mm cash and cash equivalents as of 12/31/25 pro forma for Jan-26 ATM offering and $5mm of software loans treated as debt as of 12/31/25. (3) Based on Toucan’s spot (current) price of $59.82 (as of 1/30/26). (4) Adjusted to reflect Toucan’s existing ownership of 12,718,800 Pelican shares, which are excluded from purchase consideration and pro forma ownership.
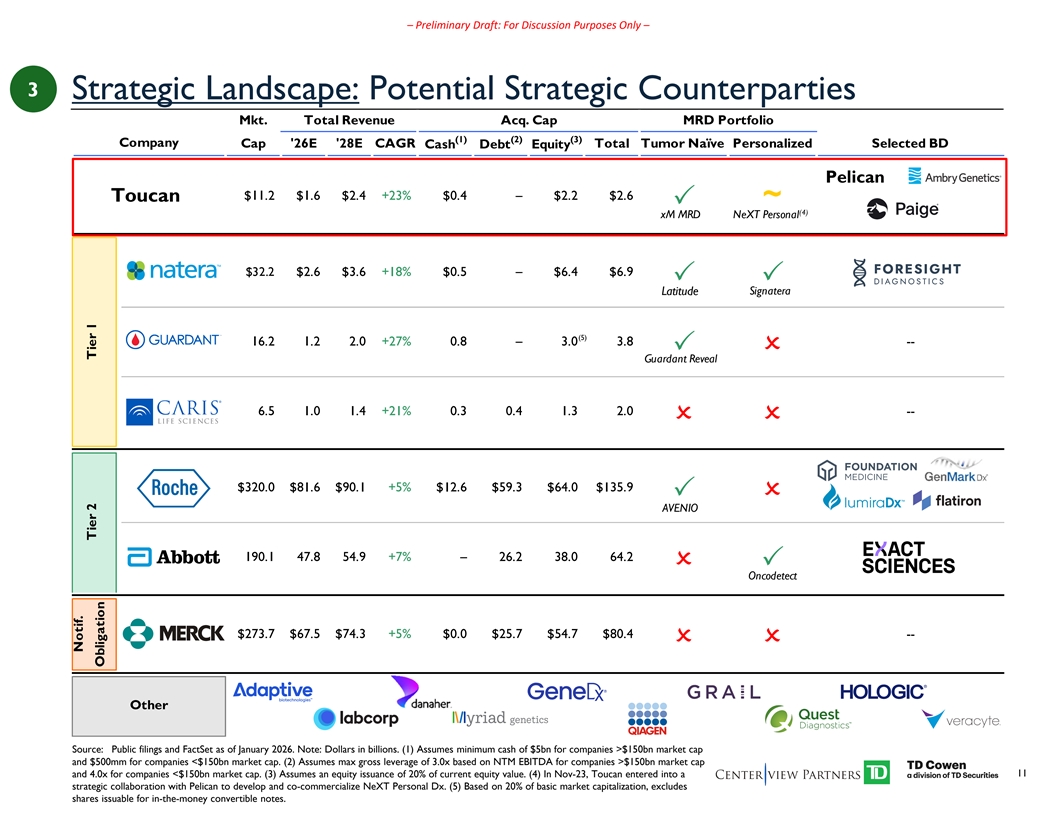
–Preliminary Draft: For Discussion Purposes Only – 3 Strategic Landscape: Potential Strategic Counterparties Mkt. Total Revenue Acq. Cap MRD Portfolio (1) (2) (3) Company Cap '26E '28E CAGR Total Tumor Naïve Personalized Selected BD Cash Debt Equity Pelican $11.2 $1.6 $2.4 +23% $0.4 –$2.2$2.6 Toucan ~ P (4) xM MRD NeXT Personal $32.2 $2.6 $3.6 +18% $0.5 –$6.4$6.9 PP Latitude Signatera (5) 16.2 1.2 2.0 +27% 0.8 – 3.0 3.8 -- PO Guardant Reveal 6.5 1.0 1.4 +21% 0.3 0.4 1.3 2.0 -- OO $320.0 $81.6 $90.1 +5% $12.6 $59.3 $64.0 $135.9 PO AVENIO 190.1 47.8 54.9 +7% – 26.2 38.0 64.2 OP Oncodetect $273.7 $67.5 $74.3 +5% $0.0 $25.7 $54.7 $80.4 -- OO Other Source: Public filings and FactSet as of January 2026. Note: Dollars in billions. (1) Assumes minimum cash of $5bn for companies >$150bn market cap and $500mm for companies <$150bn market cap. (2) Assumes max gross leverage of 3.0x based on NTM EBITDA for companies >$150bn market cap and 4.0x for companies <$150bn market cap. (3) Assumes an equity issuance of 20% of current equity value. (4) In Nov-23, Toucan entered into a 11 strategic collaboration with Pelican to develop and co-commercialize NeXT Personal Dx. (5) Based on 20% of basic market capitalization, excludes shares issuable for in-the-money convertible notes. Notif. Tier 2 Tier 1 Obligation
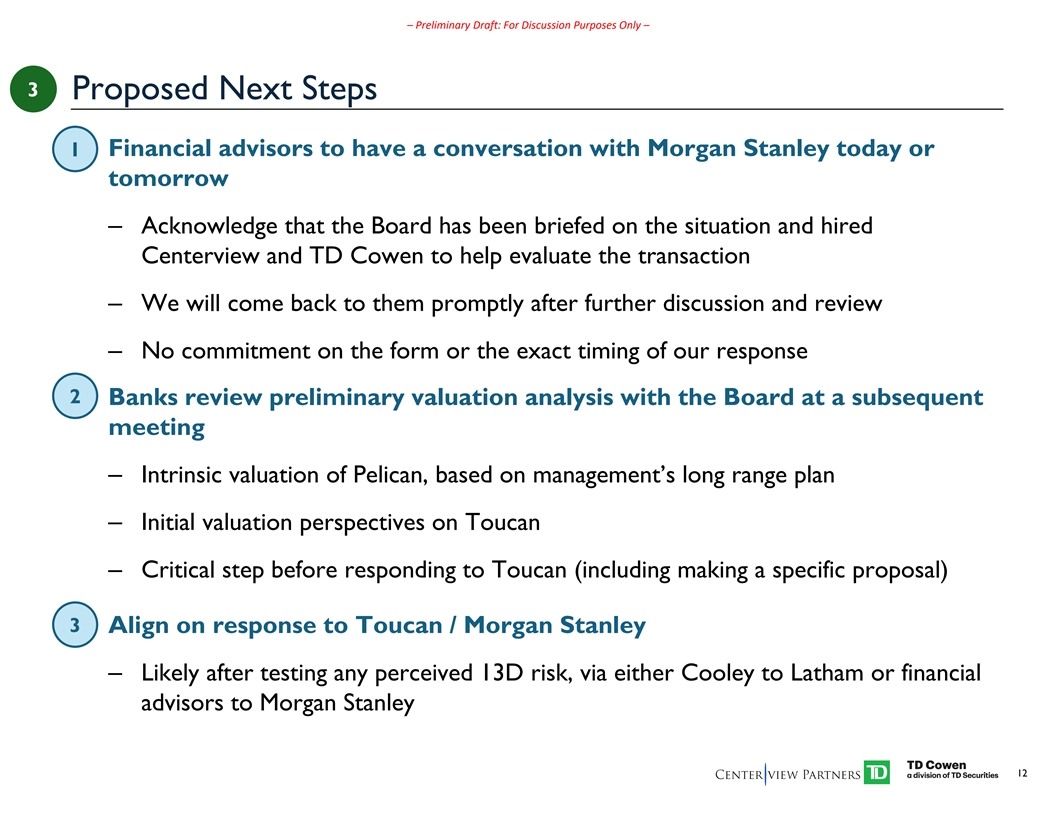
–Preliminary Draft: For Discussion Purposes Only – 3 Proposed Next Steps § Financial advisors to have a conversation with Morgan Stanley today or 1 tomorrow – Acknowledge that the Board has been briefed on the situation and hired Centerview and TD Cowen to help evaluate the transaction – We will come back to them promptly after further discussion and review – No commitment on the form or the exact timing of our response 2 § Banks review preliminary valuation analysis with the Board at a subsequent meeting – Intrinsic valuation of Pelican, based on management’s long range plan – Initial valuation perspectives on Toucan – Critical step before responding to Toucan (including making a specific proposal) 3 § Align on response to Toucan / Morgan Stanley – Likely after testing any perceived 13D risk, via either Cooley to Latham or financial advisors to Morgan Stanley 12
Appendix
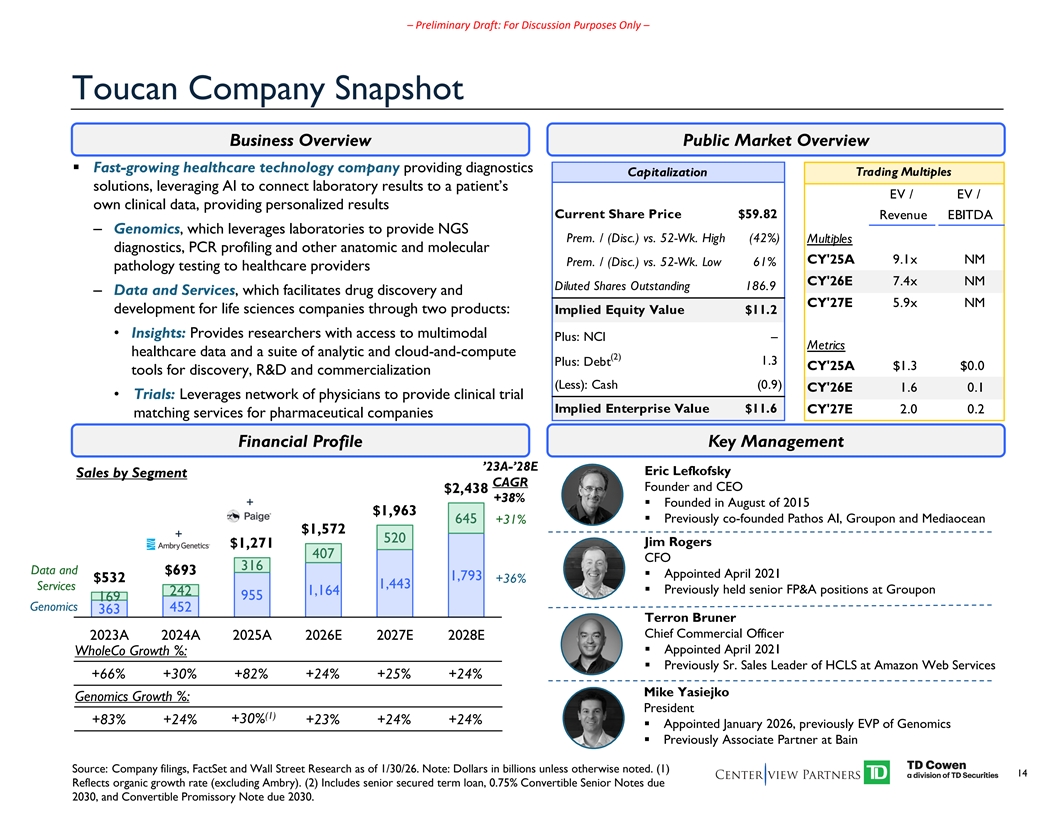
–Preliminary Draft: For Discussion Purposes Only – Toucan Company Snapshot Business Overview Public Market Overview § Fast-growing healthcare technology company providing diagnostics Capitalization Trading Multiples solutions, leveraging AI to connect laboratory results to a patient’s EV / EV / own clinical data, providing personalized results Current Share Price $59.82 Revenue EBITDA – Genomics, which leverages laboratories to provide NGS Prem. / (Disc.) vs. 52-Wk. High (42%) Multiples diagnostics, PCR profiling and other anatomic and molecular CY'25A 9.1x NM Prem. / (Disc.) vs. 52-Wk. Low 61% pathology testing to healthcare providers CY'26E 7.4x NM Diluted Shares Outstanding 186.9 – Data and Services, which facilitates drug discovery and CY'27E 5.9x NM development for life sciences companies through two products: Implied Equity Value $11.2 • Insights: Provides researchers with access to multimodal Plus: NCI – Metrics healthcare data and a suite of analytic and cloud-and-compute (2) 1.3 Plus: Debt CY'25A $1.3 $0.0 tools for discovery, R&D and commercialization (Less): Cash (0.9) CY'26E 1.6 0.1 • Trials: Leverages network of physicians to provide clinical trial Implied Enterprise Value $11.6 CY'27E 2.0 0.2 matching services for pharmaceutical companies Financial Profile Key Management ’23A-’28E Eric Lefkofsky Sales by Segment CAGR Founder and CEO $2,438 +38% +§ Founded in August of 2015 $1,963 § Previously co-founded Pathos AI, Groupon and Mediaocean 645 +31% $1,572 + 520 Jim Rogers $1,271 407 CFO 316 Data and $693 § Appointed April 2021 1,793 $532 +36% 1,443 Services § Previously held senior FP&A positions at Groupon 1,164 242 955 169 Genomics 452 363 Terron Bruner Chief Commercial Officer 2023A 2024A 2025A 2026E 2027E 2028E § Appointed April 2021 WholeCo Growth %: § Previously Sr. Sales Leader of HCLS at Amazon Web Services +66% +30% +82% +24% +25% +24% Mike Yasiejko Genomics Growth %: President (1) +83% +24% +30% +23% +24% +24% § Appointed January 2026, previously EVP of Genomics § Previously Associate Partner at Bain Source: Company filings, FactSet and Wall Street Research as of 1/30/26. Note: Dollars in billions unless otherwise noted. (1) 14 Reflects organic growth rate (excluding Ambry). (2) Includes senior secured term loan, 0.75% Convertible Senior Notes due 2030, and Convertible Promissory Note due 2030.
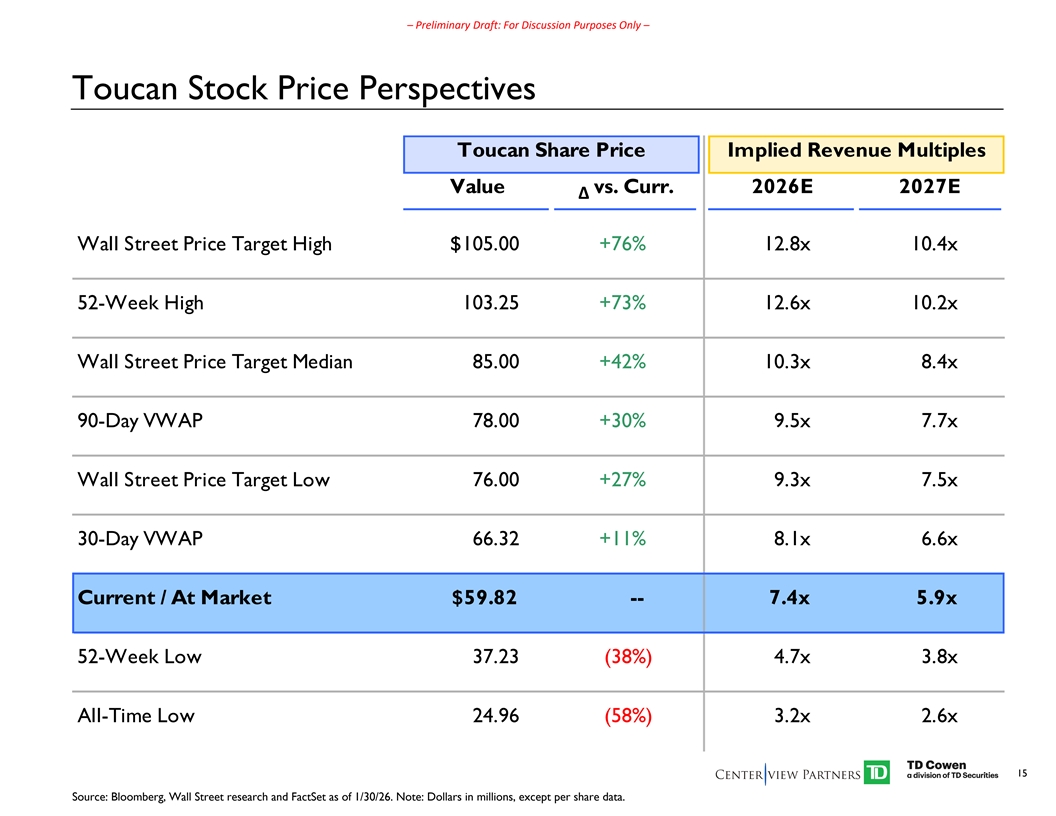
–Preliminary Draft: For Discussion Purposes Only – Toucan Stock Price Perspectives Toucan Share Price Implied Revenue Multiples Value vs. Curr. 2026E 2027E Δ Wall Street Price Target High $105.00 +76% 12.8x 10.4x 52-Week High 103.25 +73% 12.6x 10.2x Wall Street Price Target Median 85.00 +42% 10.3x 8.4x 90-Day VWAP 78.00 +30% 9.5x 7.7x Wall Street Price Target Low 76.00 +27% 9.3x 7.5x 30-Day VWAP 66.32 +11% 8.1x 6.6x Current / At Market $59.82 -- 7.4x 5.9x 52-Week Low 37.23 (38%) 4.7x 3.8x All-Time Low 24.96 (58%) 3.2x 2.6x 15 Source: Bloomberg, Wall Street research and FactSet as of 1/30/26. Note: Dollars in millions, except per share data.
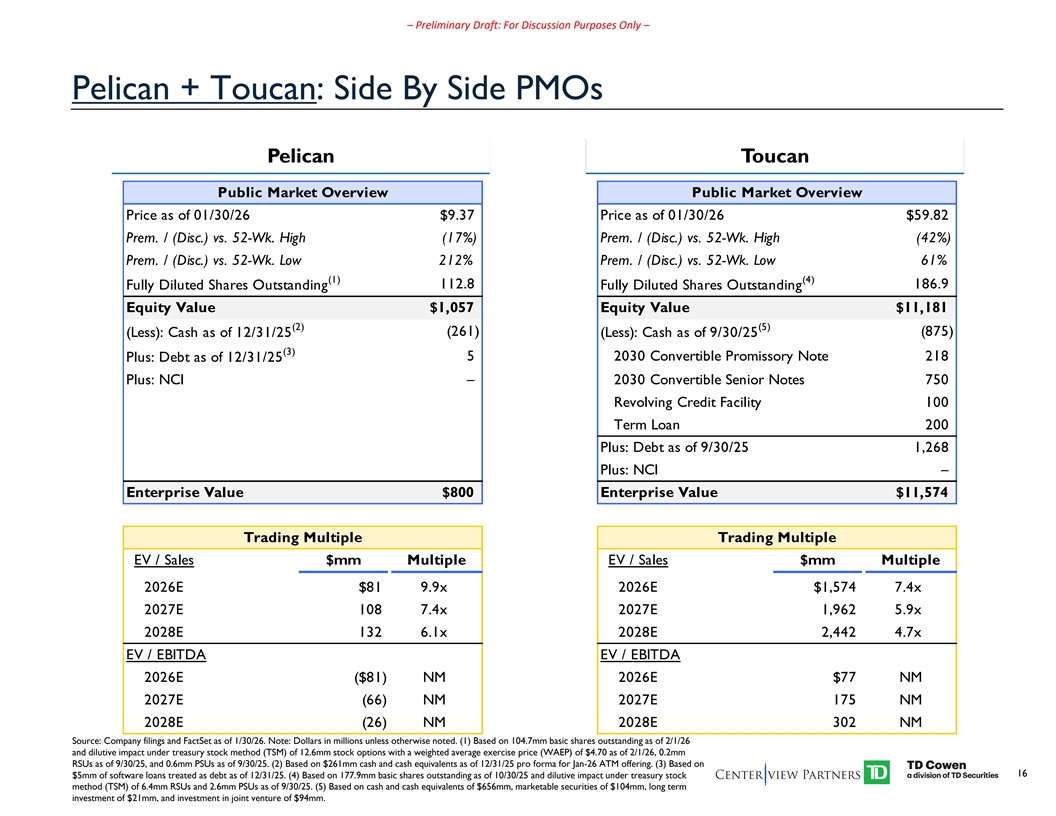
–Preliminary Draft: For Discussion Purposes Only – Pelican + Toucan: Side By Side PMOs Pelican Toucan Public Market Overview Public Market Overview Price as of 01/30/26 $9.37 Price as of 01/30/26 $59.82 Prem. / (Disc.) vs. 52-Wk. High (17%) Prem. / (Disc.) vs. 52-Wk. High (42%) Prem. / (Disc.) vs. 52-Wk. Low 212% Prem. / (Disc.) vs. 52-Wk. Low 61% (1) (4) Fully Diluted Shares Outstanding 112.8 Fully Diluted Shares Outstanding 186.9 Equity Value $1,057 Equity Value $11,181 (2) (5) (261) (875) (Less): Cash as of 12/31/25 (Less): Cash as of 9/30/25 (3) 5 2030 Convertible Promissory Note 218 Plus: Debt as of 12/31/25 Plus: NCI – 2030 Convertible Senior Notes 750 Revolving Credit Facility 100 Term Loan 200 Plus: Debt as of 9/30/25 1,268 Plus: NCI – Enterprise Value $800 Enterprise Value $11,574 Trading Multiple Trading Multiple EV / Sales $mm Multiple EV / Sales $mm Multiple 2026E $81 9.9x 2026E $1,574 7.4x 2027E 108 7.4x 2027E 1,962 5.9x 2028E 132 6.1x 2028E 2,442 4.7x EV / EBITDA EV / EBITDA 2026E ($81) NM 2026E $77 NM 2027E (66) NM 2027E 175 NM 2028E (26) NM 2028E 302 NM Source: Company filings and FactSet as of 1/30/26. Note: Dollars in millions unless otherwise noted. (1) Based on 104.7mm basic shares outstanding as of 2/1/26 and dilutive impact under treasury stock method (TSM) of 12.6mm stock options with a weighted average exercise price (WAEP) of $4.70 as of 2/1/26, 0.2mm RSUs as of 9/30/25, and 0.6mm PSUs as of 9/30/25. (2) Based on $261mm cash and cash equivalents as of 12/31/25 pro forma for Jan-26 ATM offering. (3) Based on 16 $5mm of software loans treated as debt as of 12/31/25. (4) Based on 177.9mm basic shares outstanding as of 10/30/25 and dilutive impact under treasury stock method (TSM) of 6.4mm RSUs and 2.6mm PSUs as of 9/30/25. (5) Based on cash and cash equivalents of $656mm, marketable securities of $104mm, long term investment of $21mm, and investment in joint venture of $94mm.
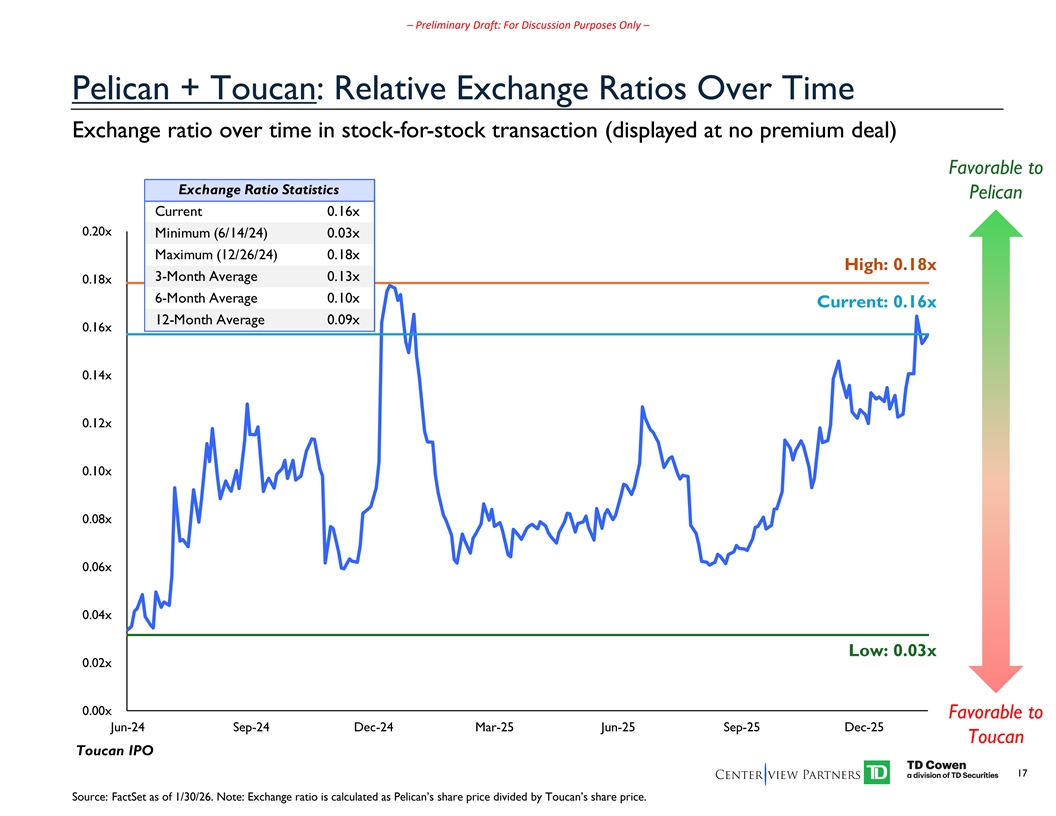
–Preliminary Draft: For Discussion Purposes Only – Pelican + Toucan: Relative Exchange Ratios Over Time Exchange ratio Exchange ratio o ov ver er time in stock-f time in stock-fo or r- -stoc stock transaction k transaction (displa (display yed at no pr ed at no premium deal) emium deal) Favorable to Exchange Ratio Statistics Pelican Current 0.16x 0.20x Minimum (6/14/24) 0.03x Maximum (12/26/24) 0.18x High: 0.18x 3-Month Average 0.13x 0.18x 6-Month Average 0.10x Current: 0.16x 12-Month Average 0.09x 0.16x 0.14x 0.12x 0.10x 0.08x 0.06x 0.04x Low: 0.03x 0.02x 0.00x Favorable to Jun-24 Sep-24 Dec-24 Mar-25 Jun-25 Sep-25 Dec-25 Toucan Toucan IPO 17 Source: FactSet as of 1/30/26. Note: Exchange ratio is calculated as Pelican’s share price divided by Toucan’s share price.
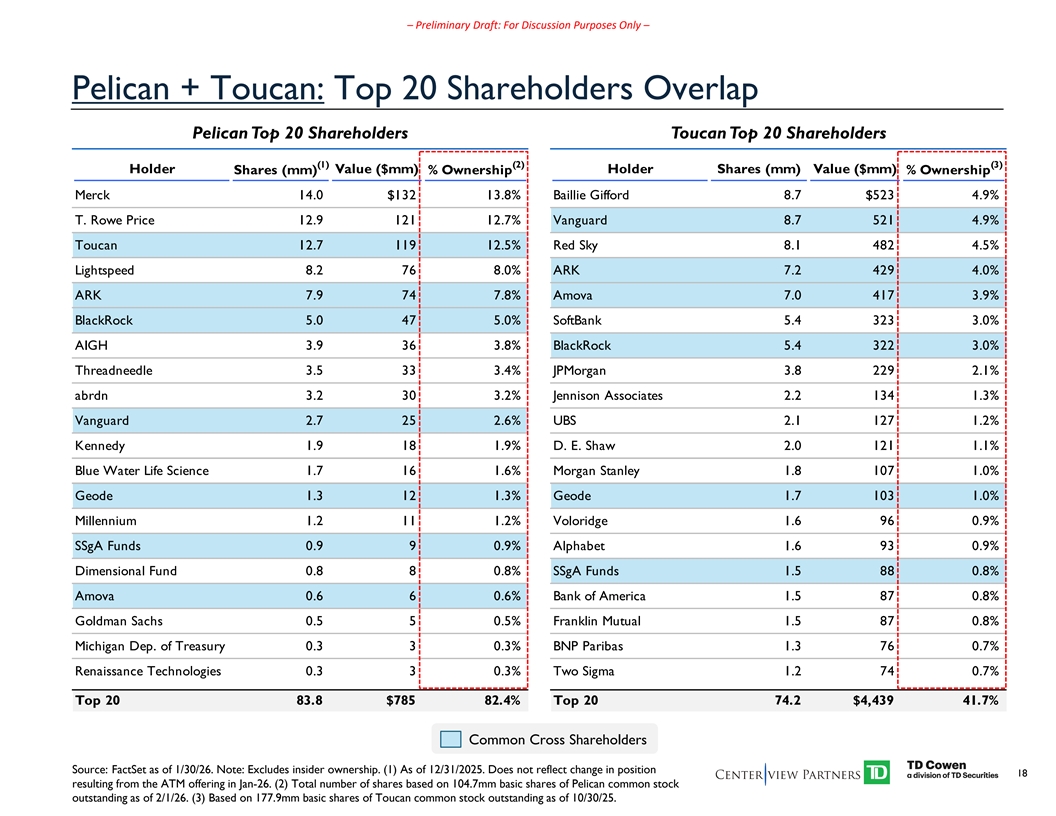
–Preliminary Draft: For Discussion Purposes Only – Pelican + Toucan: Top 20 Shareholders Overlap Pelican Top 20 Shareholders Toucan Top 20 Shareholders (1) (2) (3) Holder Value ($mm) Holder Shares (mm) Value ($mm) Shares (mm) % Ownership % Ownership Merck 14.0 $132 13.8% Baillie Gifford 8.7 $523 4.9% T. Rowe Price 12.9 121 12.7% Vanguard 8.7 521 4.9% Toucan 12.7 119 12.5% Red Sky 8.1 482 4.5% Lightspeed 8.2 76 8.0% ARK 7.2 429 4.0% ARK 7.9 74 7.8% Amova 7.0 417 3.9% BlackRock 5.0 47 5.0% SoftBank 5.4 323 3.0% AIGH 3.9 36 3.8% BlackRock 5.4 322 3.0% Threadneedle 3.5 33 3.4% JPMorgan 3.8 229 2.1% abrdn 3.2 30 3.2% Jennison Associates 2.2 134 1.3% Vanguard 2.7 25 2.6% UBS 2.1 127 1.2% Kennedy 1.9181.9% D. E. Shaw 2.0 121 1.1% Blue Water Life Science 1.7 16 1.6% Morgan Stanley 1.8 107 1.0% Geode 1.3121.3% Geode 1.7 103 1.0% Millennium 1.2 11 1.2% Voloridge 1.6 96 0.9% SSgA Funds 0.9 9 0.9% Alphabet 1.6 93 0.9% Dimensional Fund 0.8 8 0.8% SSgA Funds 1.5 88 0.8% Amova 0.6 6 0.6% Bank of America 1.5 87 0.8% Goldman Sachs 0.5 5 0.5% Franklin Mutual 1.5 87 0.8% Michigan Dep. of Treasury 0.3 3 0.3% BNP Paribas 1.3 76 0.7% Renaissance Technologies 0.3 3 0.3% Two Sigma 1.2 74 0.7% Top 20 83.8 $785 82.4% Top 20 74.2 $4,439 41.7% Common Cross Shareholders Source: FactSet as of 1/30/26. Note: Excludes insider ownership. (1) As of 12/31/2025. Does not reflect change in position 18 resulting from the ATM offering in Jan-26. (2) Total number of shares based on 104.7mm basic shares of Pelican common stock outstanding as of 2/1/26. (3) Based on 177.9mm basic shares of Toucan common stock outstanding as of 10/30/25.