Exhibit (c)(7) Project Aviary Presentation to the Board of Directors May 29, 2026
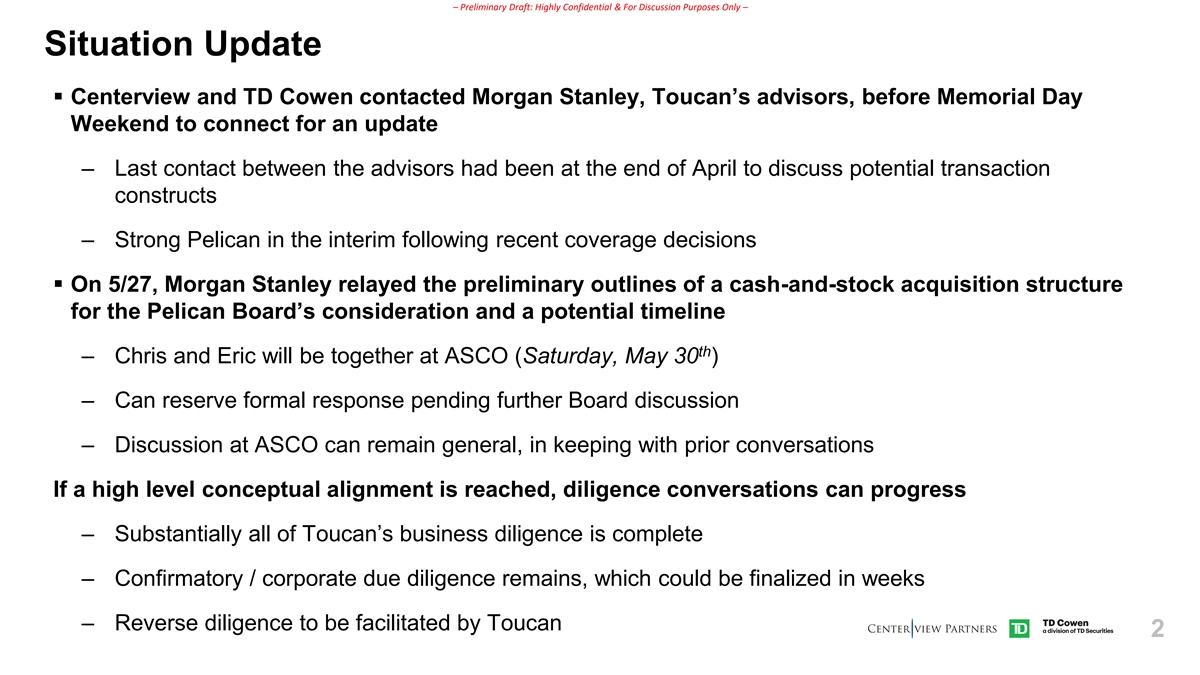
– Preliminary Draft: Highly Confidential & For Discussion Purposes Only – Situation Update ▪ Centerview and TD Cowen contacted Morgan Stanley, Toucan’s advisors, before Memorial Day Weekend to connect for an update – Last contact between the advisors had been at the end of April to discuss potential transaction constructs – Strong Pelican in the interim following recent coverage decisions ▪ On 5/27, Morgan Stanley relayed the preliminary outlines of a cash-and-stock acquisition structure for the Pelican Board’s consideration and a potential timeline th – Chris and Eric will be together at ASCO (Saturday, May 30 ) – Can reserve formal response pending further Board discussion – Discussion at ASCO can remain general, in keeping with prior conversations If a high level conceptual alignment is reached, diligence conversations can progress – Substantially all of Toucan’s business diligence is complete – Confirmatory / corporate due diligence remains, which could be finalized in weeks – Reverse diligence to be facilitated by Toucan 2
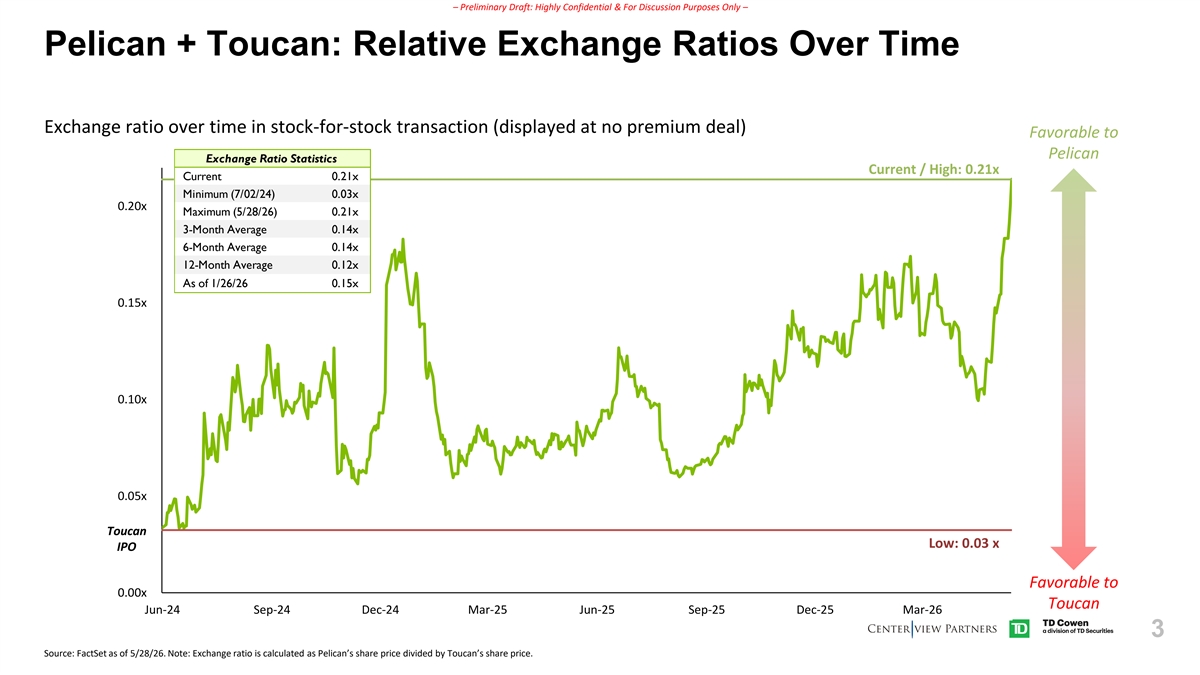
– Preliminary Draft: Highly Confidential & For Discussion Purposes Only – Pelican + Toucan: Relative Exchange Ratios Over Time Exchange ratio over time in stock-for-stock transaction (displayed at no premium deal) Favorable to Pelican Exchange Ratio Statistics Current / High: 0.21x Current 0.21x Minimum (7/02/24) 0.03x 0.20x Maximum (5/28/26) 0.21x 3-Month Average 0.14x 6-Month Average 0.14x 12-Month Average 0.12x As of 1/26/26 0.15x 0.15x 0.10x 0.05x Toucan Low: 0.03 x IPO Favorable to 0.00x Toucan Jun-24 Sep-24 Dec-24 Mar-25 Jun-25 Sep-25 Dec-25 Mar-26 3 Source: FactSet as of 5/28/26. Note: Exchange ratio is calculated as Pelican’s share price divided by Toucan’s share price.
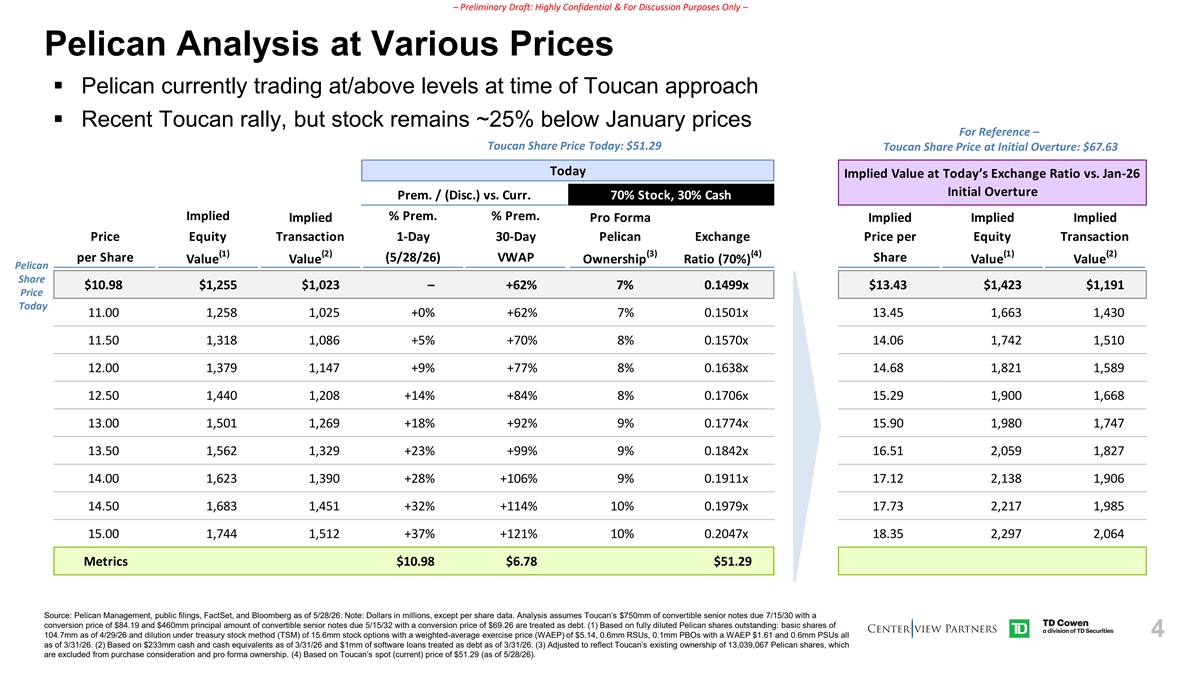
– Preliminary Draft: Highly Confidential & For Discussion Purposes Only – Pelican Analysis at Various Prices ▪ Pelican currently trading at/above levels at time of Toucan approach ▪ Recent Toucan rally, but stock remains ~25% below January prices For Reference – Toucan Share Price Today: $51.29 Toucan Share Price at Initial Overture: $67.63 Today Implied Value at Today’s Exchange Ratio vs. Jan-26 Initial Overture Prem. / (Disc.) vs. Curr. 70% Stock, 30% Cash Implied % Prem. % Prem. Implied Pro Forma Implied Implied Implied Price Equity Transaction 1-Day 30-Day Pelican Exchange Price per Equity Transaction (1) (2) (3) (4) (1) (2) per Share (5/28/26) VWAP Share Value Value Ownership Ratio (70%) Value Value Pelican Share $10.98 $1,255 $1,023 – +62% 7% 0.1499x $13.43 $1,423 $1,191 Price Today 11.00 1,258 1,025 +0% +62% 7% 0.1501x 13.45 1,663 1,430 11.50 1,318 1,086 +5% +70% 8% 0.1570x 14.06 1,742 1,510 12.00 1,379 1,147 +9% +77% 8% 0.1638x 14.68 1,821 1,589 12.50 1,440 1,208 +14% +84% 8% 0.1706x 15.29 1,900 1,668 13.00 1,501 1,269 +18% +92% 9% 0.1774x 15.90 1,980 1,747 13.50 1,562 1,329 +23% +99% 9% 0.1842x 16.51 2,059 1,827 14.00 1,623 1,390 +28% +106% 9% 0.1911x 17.12 2,138 1,906 14.50 1,683 1,451 +32% +114% 10% 0.1979x 17.73 2,217 1,985 15.00 1,744 1,512 +37% +121% 10% 0.2047x 18.35 2,297 2,064 Metrics $10.98 $6.78 $51.29 Source: Pelican Management, public filings, FactSet, and Bloomberg as of 5/28/26. Note: Dollars in millions, except per share data. Analysis assumes Toucan’s $750mm of convertible senior notes due 7/15/30 with a conversion price of $84.19 and $460mm principal amount of convertible senior notes due 5/15/32 with a conversion price of $69.26 are treated as debt. (1) Based on fully diluted Pelican shares outstanding: basic shares of 104.7mm as of 4/29/26 and dilution under treasury stock method (TSM) of 15.6mm stock options with a weighted-average exercise price (WAEP) of $5.14, 0.6mm RSUs, 0.1mm PBOs with a WAEP $1.61 and 0.6mm PSUs all 4 as of 3/31/26. (2) Based on $233mm cash and cash equivalents as of 3/31/26 and $1mm of software loans treated as debt as of 3/31/26. (3) Adjusted to reflect Toucan’s existing ownership of 13,039,067 Pelican shares, which are excluded from purchase consideration and pro forma ownership. (4) Based on Toucan’s spot (current) price of $51.29 (as of 5/28/26).
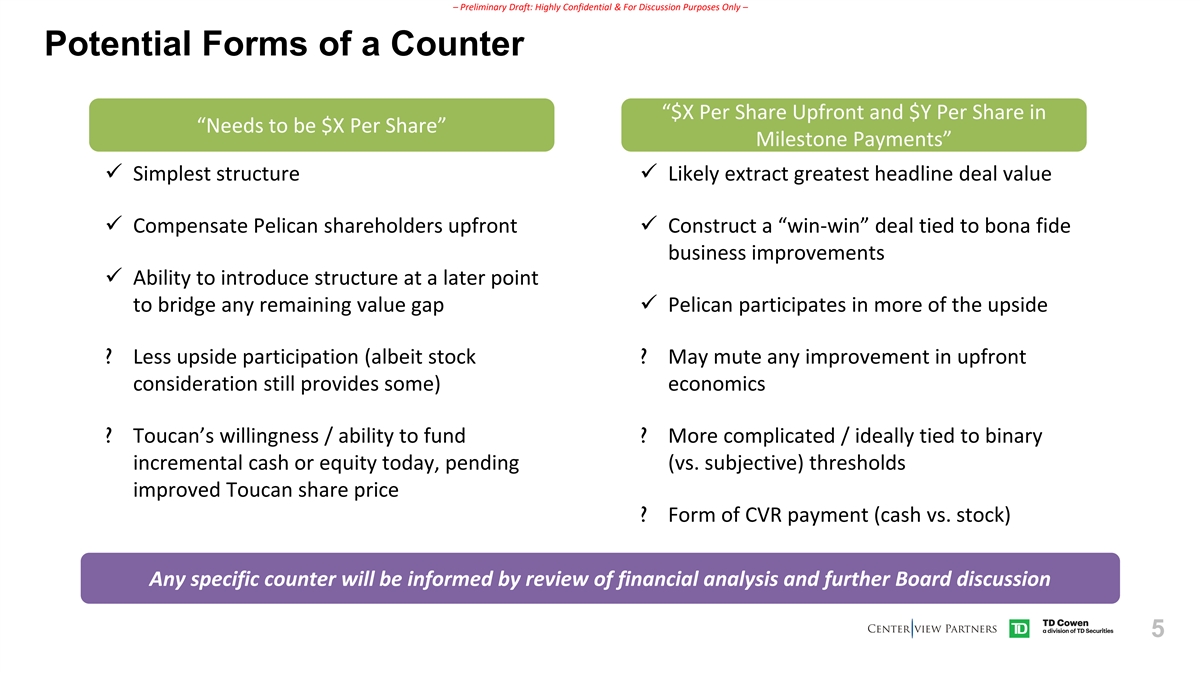
– Preliminary Draft: Highly Confidential & For Discussion Purposes Only – Potential Forms of a Counter “$X Per Share Upfront and $Y Per Share in “Needs to be $X Per Share” Milestone Payments” ✓ Simplest structure ✓ Likely extract greatest headline deal value ✓ Compensate Pelican shareholders upfront ✓ Construct a “win-win” deal tied to bona fide business improvements ✓ Ability to introduce structure at a later point to bridge any remaining value gap ✓ Pelican participates in more of the upside ? Less upside participation (albeit stock ? May mute any improvement in upfront consideration still provides some) economics ? Toucan’s willingness / ability to fund ? More complicated / ideally tied to binary incremental cash or equity today, pending (vs. subjective) thresholds improved Toucan share price ? Form of CVR payment (cash vs. stock) Any specific counter will be informed by review of financial analysis and further Board discussion 5
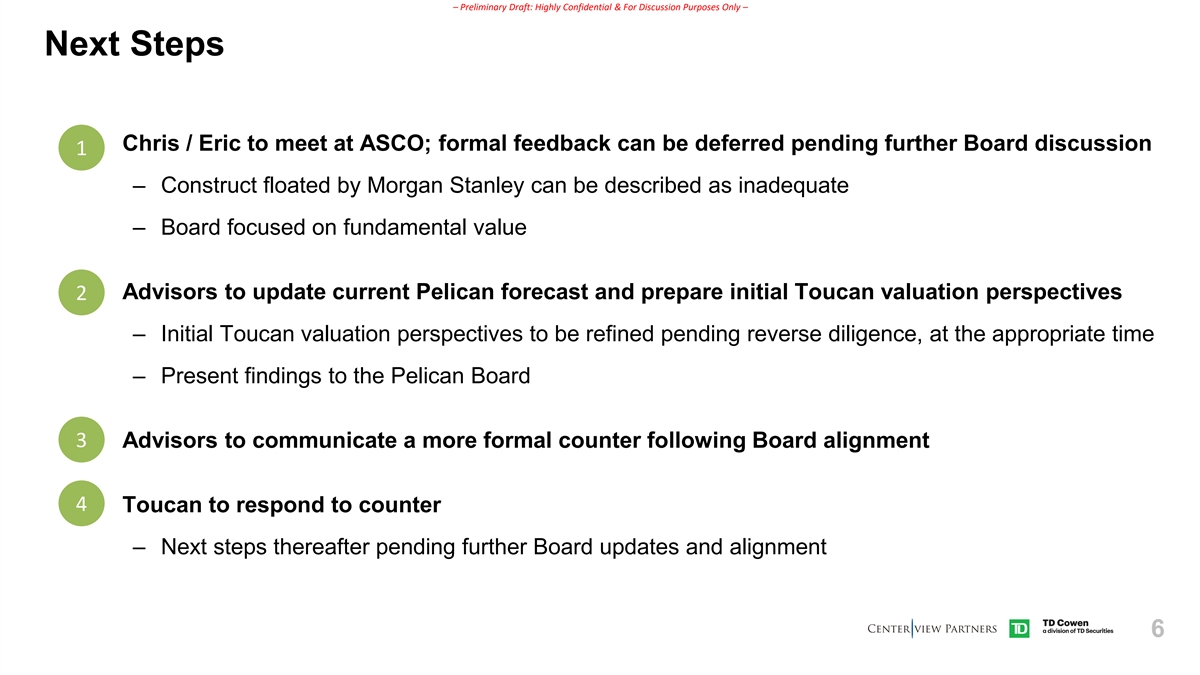
– Preliminary Draft: Highly Confidential & For Discussion Purposes Only – Next Steps ▪ Chris / Eric to meet at ASCO; formal feedback can be deferred pending further Board discussion 1 – Construct floated by Morgan Stanley can be described as inadequate – Board focused on fundamental value 2▪ Advisors to update current Pelican forecast and prepare initial Toucan valuation perspectives – Initial Toucan valuation perspectives to be refined pending reverse diligence, at the appropriate time – Present findings to the Pelican Board 3▪ Advisors to communicate a more formal counter following Board alignment 4 ▪ Toucan to respond to counter – Next steps thereafter pending further Board updates and alignment 6

– Preliminary Draft: Highly Confidential & For Discussion Purposes Only – Appendix 7
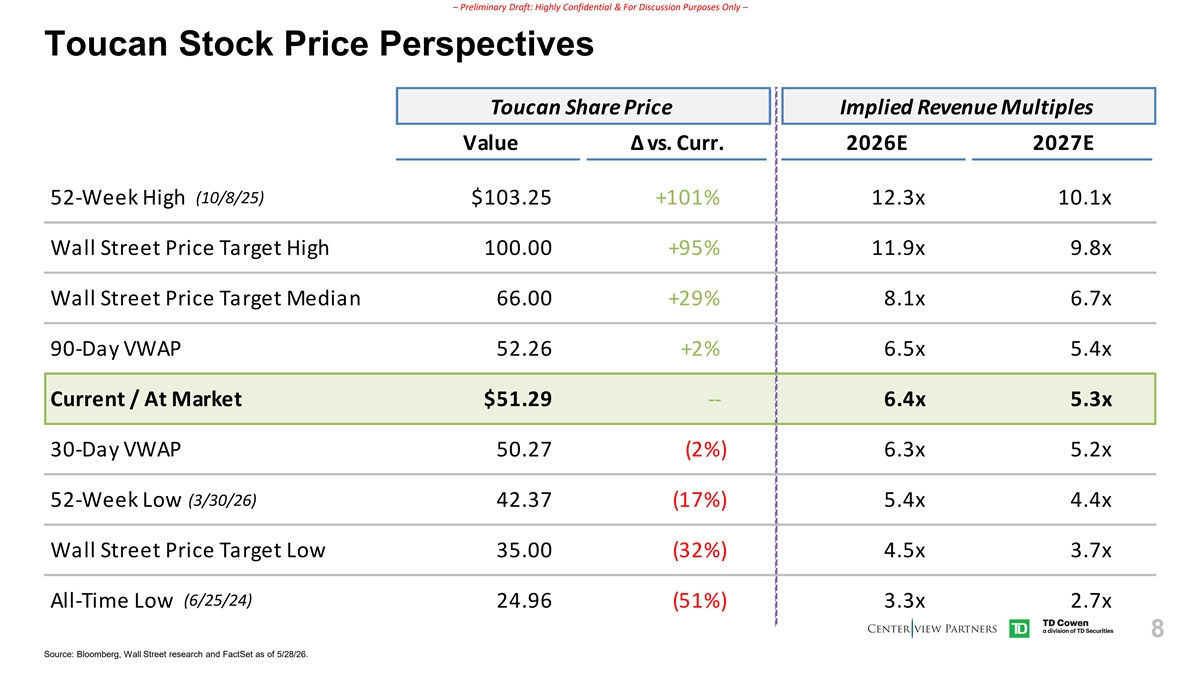
– Preliminary Draft: Highly Confidential & For Discussion Purposes Only – Toucan Stock Price Perspectives Toucan Share Price Implied Revenue Multiples Value Δ vs. Curr. 2026E 2027E (10/8/25) 52-Week High $103.25 +101% 12.3x 10.1x Wall Street Price Target High 100.00 +95% 11.9x 9.8x Wall Street Price Target Median 66.00 +29% 8.1x 6.7x 90-Day VWAP 52.26 +2% 6.5x 5.4x Current / At Market $51.29 -- 6.4x 5.3x 30-Day VWAP 50.27 (2%) 6.3x 5.2x (3/30/26) 52-Week Low 42.37 (17%) 5.4x 4.4x Wall Street Price Target Low 35.00 (32%) 4.5x 3.7x (6/25/24) All-Time Low 24.96 (51%) 3.3x 2.7x 8 Source: Bloomberg, Wall Street research and FactSet as of 5/28/26.
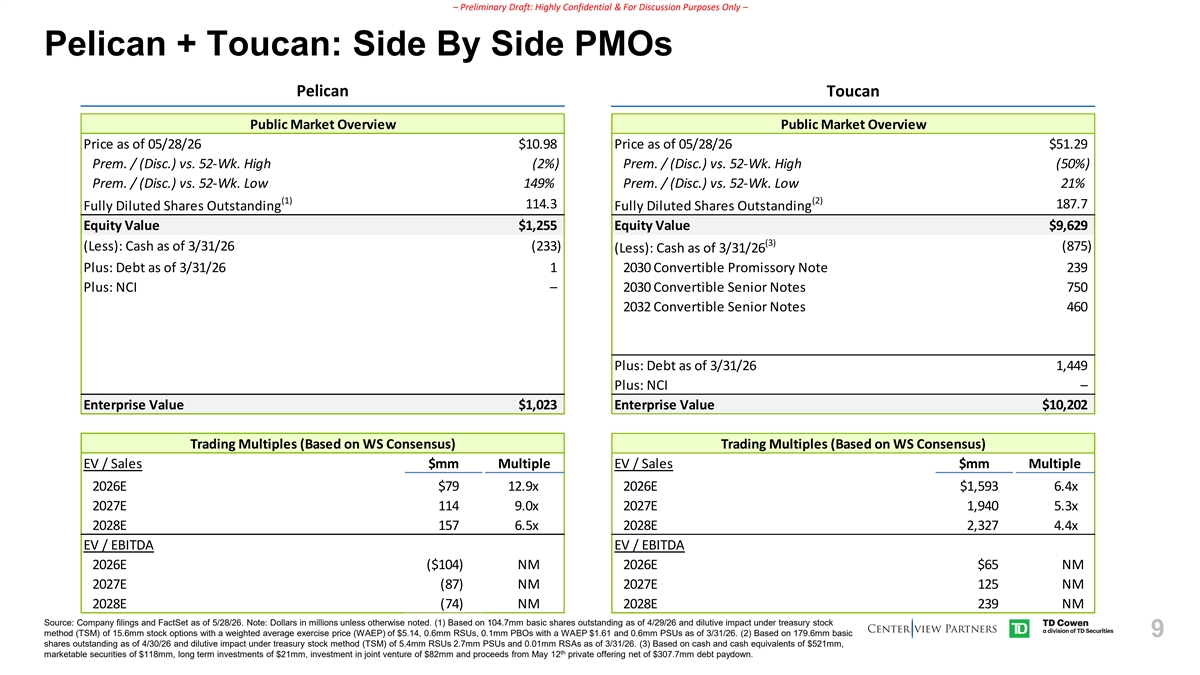
– Preliminary Draft: Highly Confidential & For Discussion Purposes Only – Pelican + Toucan: Side By Side PMOs Pelican Toucan Public Market Overview Public Market Overview Public Market Overview Price as of 05/28/26 $10.98 Price as of 05/28/26 $51.29 Prem. / (Disc.) vs. 52-Wk. High (2%) Prem. / (Disc.) vs. 52-Wk. High (50%) Prem. / (Disc.) vs. 52-Wk. Low 149% Prem. / (Disc.) vs. 52-Wk. Low 21% (1) (2) 114.3 187.7 Fully Diluted Shares Outstanding Fully Diluted Shares Outstanding Equity Value $1,255 Equity Value $9,629 (3) (Less): Cash as of 3/31/26 (233) (875) (Less): Cash as of 3/31/26 Plus: Debt as of 3/31/26 1 2030 Convertible Promissory Note 239 Plus: NCI – 2030 Convertible Senior Notes 750 2032 Convertible Senior Notes 460 Plus: Debt as of 3/31/26 1,449 Plus: NCI – Enterprise Value $1,023 Enterprise Value $10,202 Trading Multiples (Based on WS Consensus) Trading Multiples (Based on WS Consensus) Trading Multiples (Based on WS Consensus) EV / Sales $mm Multiple EV / Sales $mm Multiple 2026E $79 12.9x 2026E $1,593 6.4x 2027E 114 9.0x 2027E 1,940 5.3x 2028E 157 6.5x 2028E 2,327 4.4x EV / EBITDA EV / EBITDA 2026E ($104) NM 2026E $65 NM 2027E (87) NM 2027E 125 NM 2028E (74) NM 2028E 239 NM Source: Company filings and FactSet as of 5/28/26. Note: Dollars in millions unless otherwise noted. (1) Based on 104.7mm basic shares outstanding as of 4/29/26 and dilutive impact under treasury stock method (TSM) of 15.6mm stock options with a weighted average exercise price (WAEP) of $5.14, 0.6mm RSUs, 0.1mm PBOs with a WAEP $1.61 and 0.6mm PSUs as of 3/31/26. (2) Based on 179.6mm basic 9 shares outstanding as of 4/30/26 and dilutive impact under treasury stock method (TSM) of 5.4mm RSUs 2.7mm PSUs and 0.01mm RSAs as of 3/31/26. (3) Based on cash and cash equivalents of $521mm, th marketable securities of $118mm, long term investments of $21mm, investment in joint venture of $82mm and proceeds from May 12 private offering net of $307.7mm debt paydown.
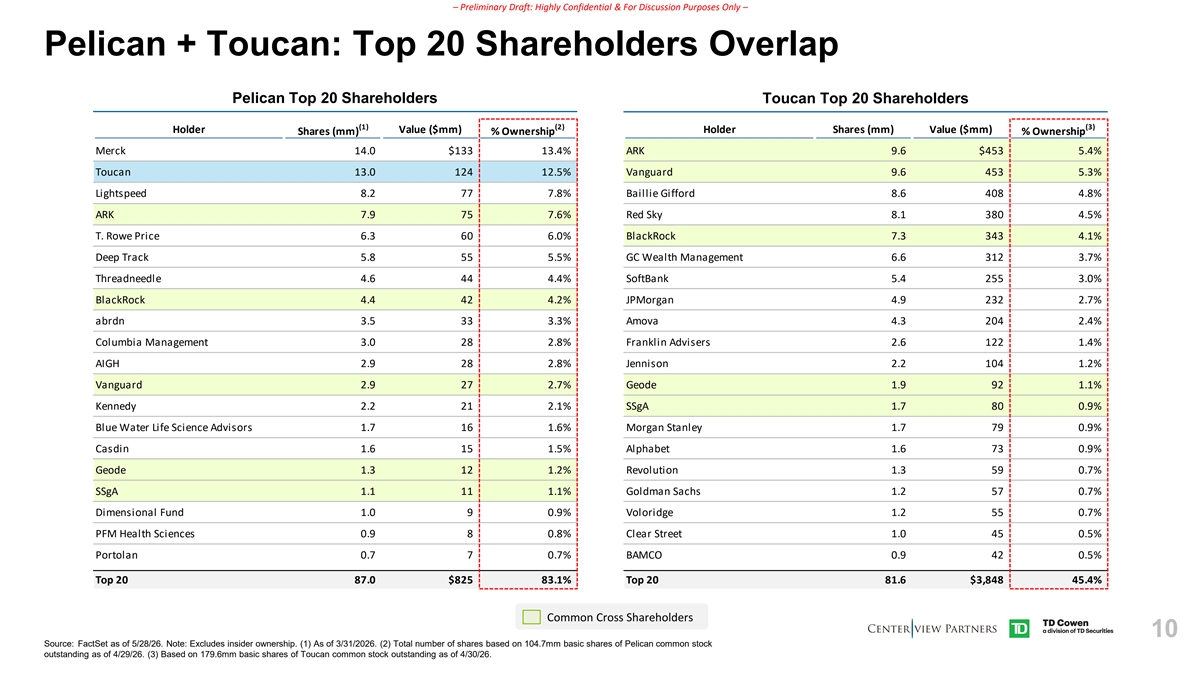
– Preliminary Draft: Highly Confidential & For Discussion Purposes Only – Pelican + Toucan: Top 20 Shareholders Overlap Pelican Top 20 Shareholders Toucan Top 20 Shareholders (1) (2) (3) Holder Value ($mm) Holder Shares (mm) Value ($mm) Shares (mm) % Ownership % Ownership Merck 14.0 $133 13.4% ARK 9.6 $453 5.4% Toucan 13.0 124 12.5% Vanguard 9.6 453 5.3% Lightspeed 8.2 77 7.8% Baillie Gifford 8.6 408 4.8% ARK 7.9 75 7.6% Red Sky 8.1 380 4.5% T. Rowe Price 6.3 60 6.0% BlackRock 7.3 343 4.1% Deep Track 5.8 55 5.5% GC Wealth Management 6.6 312 3.7% Threadneedle 4.6 44 4.4% SoftBank 5.4 255 3.0% BlackRock 4.4 42 4.2% JPMorgan 4.9 232 2.7% abrdn 3.5 33 3.3% Amova 4.3 204 2.4% Columbia Management 3.0 28 2.8% Franklin Advisers 2.6 122 1.4% AIGH 2.9 28 2.8% Jennison 2.2 104 1.2% Vanguard 2.9 27 2.7% Geode 1.9 92 1.1% Kennedy 2.2 21 2.1% SSgA 1.7 80 0.9% Blue Water Life Science Advisors 1.7 16 1.6% Morgan Stanley 1.7 79 0.9% Casdin 1.6 15 1.5% Alphabet 1.6 73 0.9% Geode 1.3 12 1.2% Revolution 1.3 59 0.7% SSgA 1.1 11 1.1% Goldman Sachs 1.2 57 0.7% Dimensional Fund 1.0 9 0.9% Voloridge 1.2 55 0.7% PFM Health Sciences 0.9 8 0.8% Clear Street 1.0 45 0.5% Portolan 0.7 7 0.7% BAMCO 0.9 42 0.5% Top 20 87.0 $825 83.1% Top 20 81.6 $3,848 45.4% Common Cross Shareholders 10 Source: FactSet as of 5/28/26. Note: Excludes insider ownership. (1) As of 3/31/2026. (2) Total number of shares based on 104.7mm basic shares of Pelican common stock outstanding as of 4/29/26. (3) Based on 179.6mm basic shares of Toucan common stock outstanding as of 4/30/26.