.3
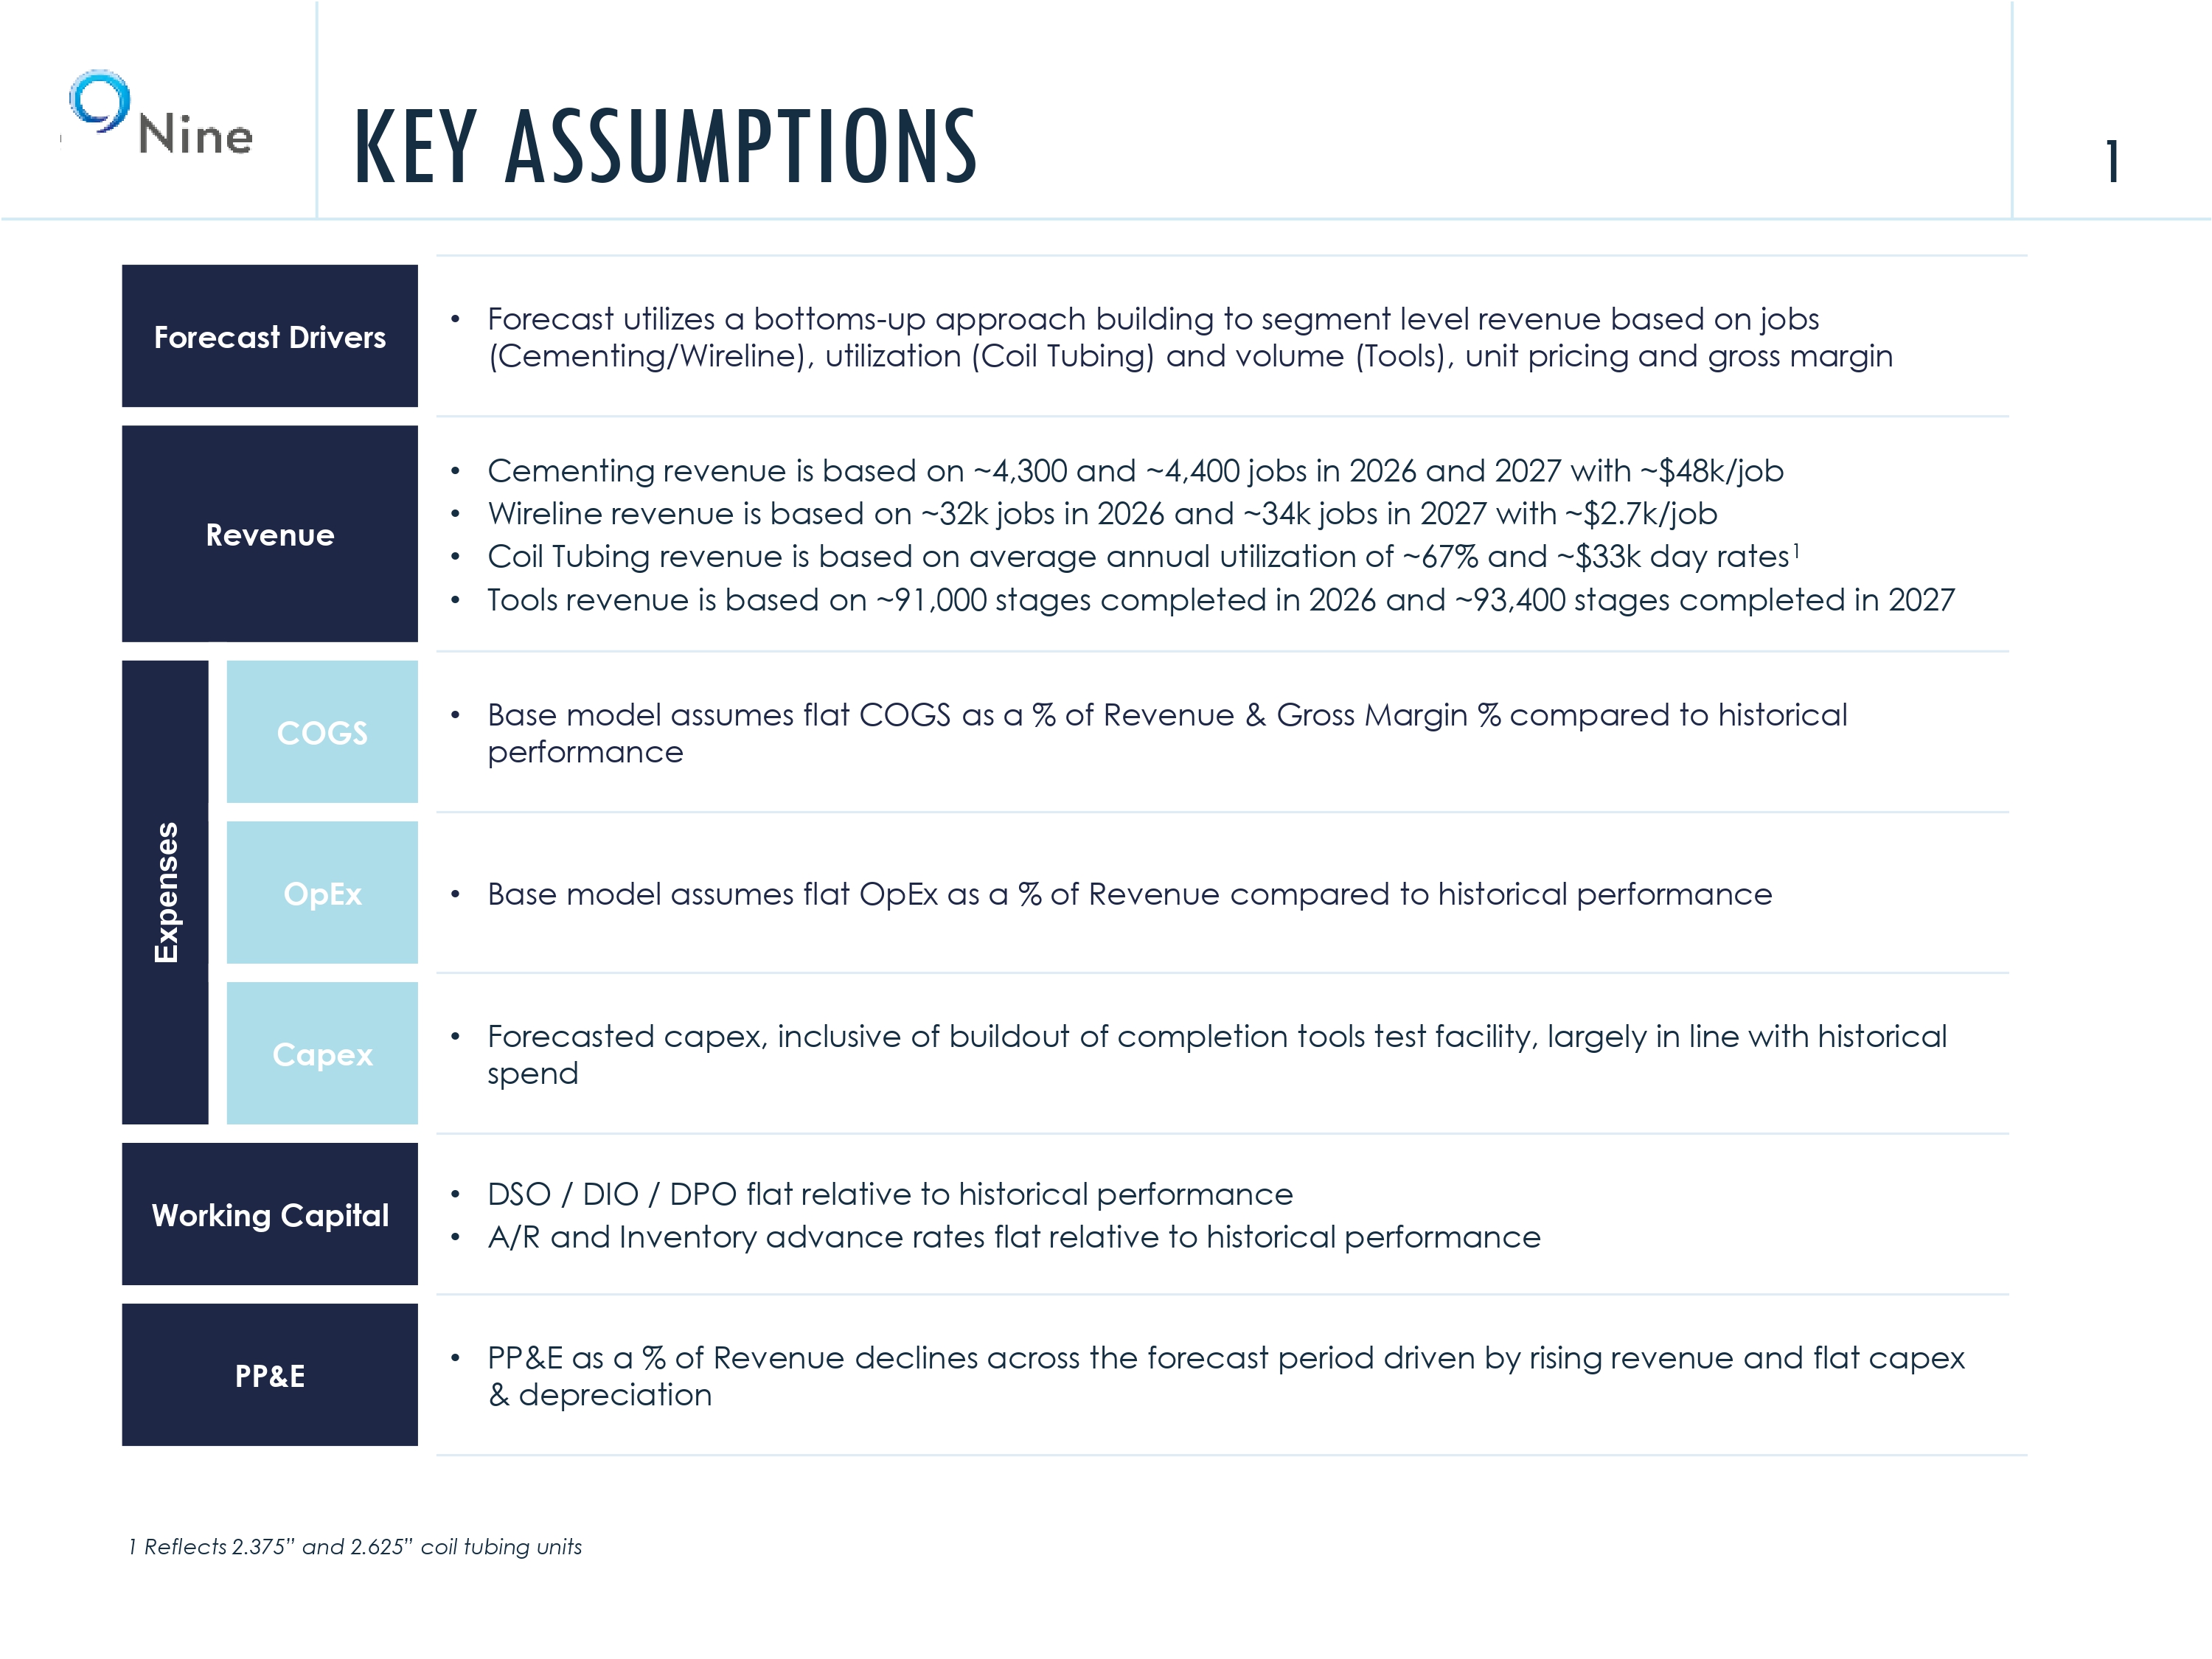
KEY ASSUMPTIONS 1 • Forecast utilizes a bottoms - up approach building to segment level revenue based on jobs (Cementing/Wireline), utilization (Coil Tubing) and volume (Tools), unit pricing and gross margin Forecast Drivers • Cementing revenue is based on ~4,300 and ~4,400 jobs in 2026 and 2027 with ~$48k/job • Wireline revenue is based on ~32k jobs in 2026 and ~34k jobs in 2027 with ~$2.7k/job • Coil Tubing revenue is based on average annual utilization of ~67% and ~$33k day rates 1 • Tools revenue is based on ~91,000 stages completed in 2026 and ~93,400 stages completed in 2027 Revenue • Base model assumes flat COGS as a % of Revenue & Gross Margin % compared to historical performance COGS Expenses • Base model assumes flat OpEx as a % of Revenue compared to historical performance OpEx • Forecasted capex, inclusive of buildout of completion tools test facility, largely in line with historical spend Capex • DSO / DIO / DPO flat relative to historical performance • A/R and Inventory advance rates flat relative to historical performance Working Capital • PP&E as a % of Revenue declines across the forecast period driven by rising revenue and flat capex & depreciation PP&E 1 Reflects 2.375” and 2.625” coil tubing units
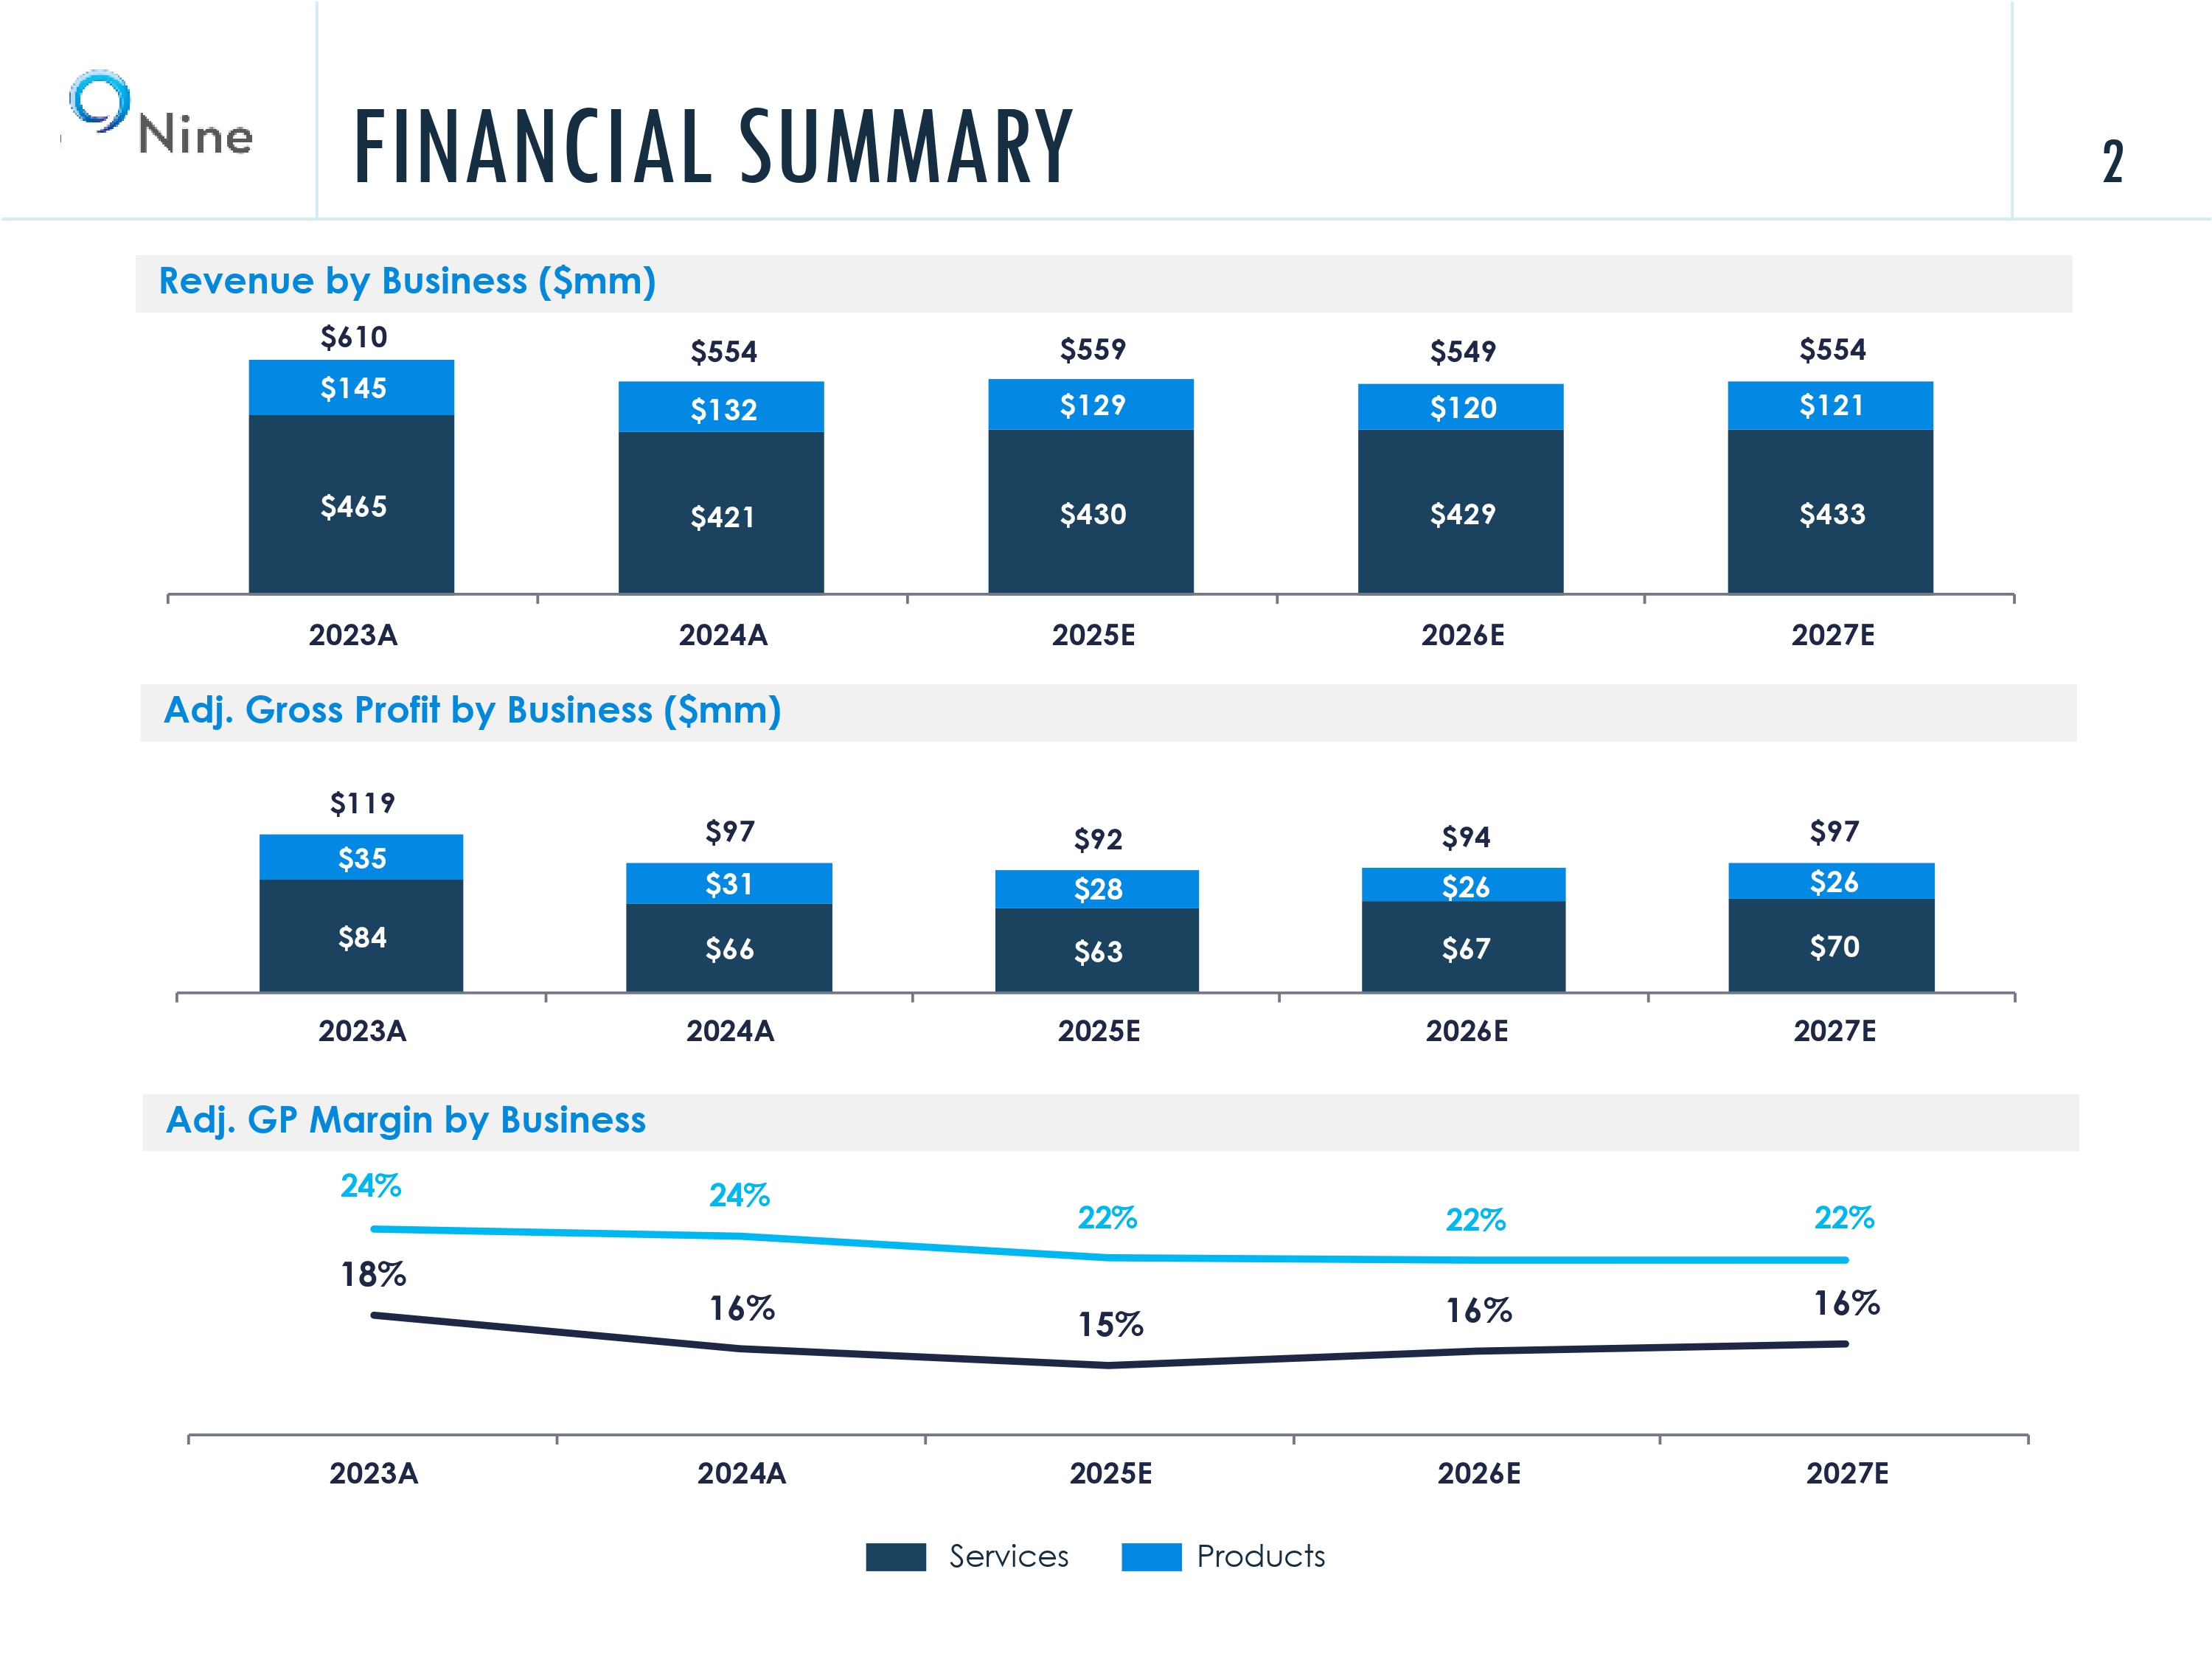
FINANCIAL SUMMARY 2 $84 $66 $63 $67 $70 $35 $31 $28 $26 $26 $119 $97 $92 $94 $97 2023A 2024A 2025E 2026E 2027E $465 $421 $430 $429 $433 $145 $132 $129 $120 $121 $610 $554 $559 $549 $554 2023A 2024A 2025E 2026E 2027E 18% 16% 15% 16% 16% 24% 24% 22% 22% 22% 2023A 2024A 2025E 2026E 2027E Revenue by Business ($mm) Adj. Gross Profit by Business ($mm) Adj. GP Margin by Business Products Services
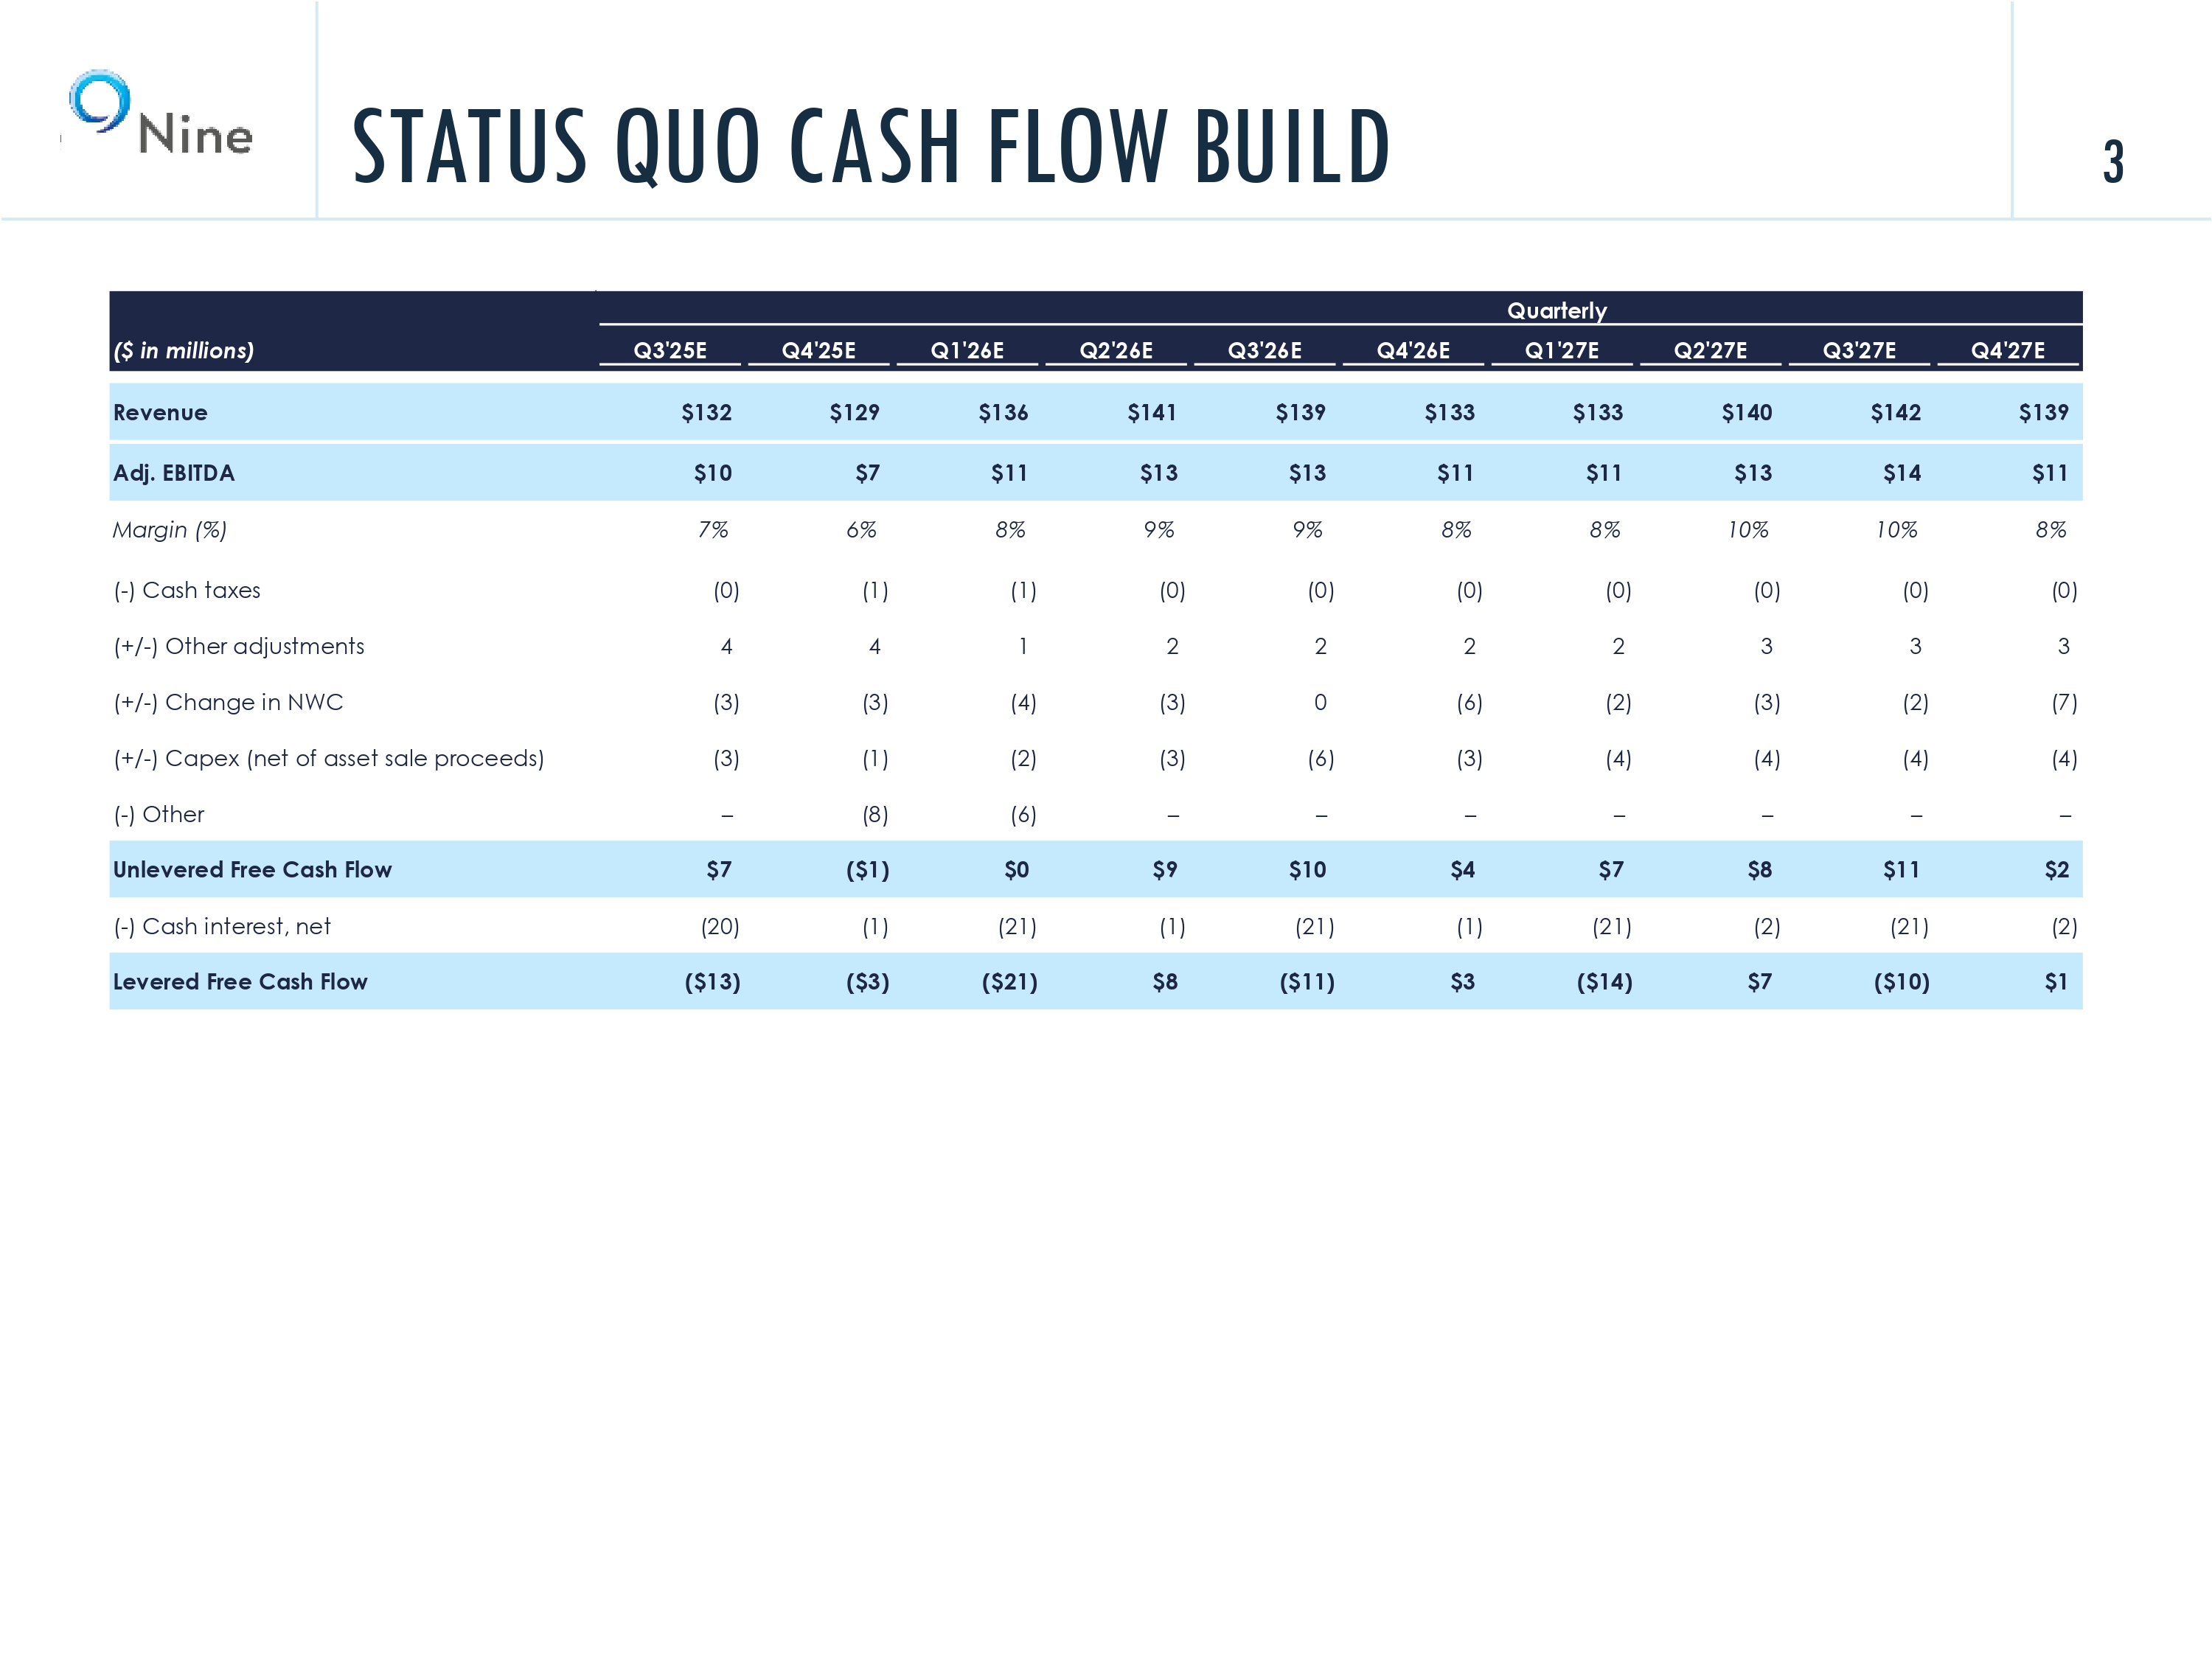
STATUS QUO CASH FLOW BUILD 3 Quarterly Q4'27E Q3'27E Q2'27E Q1'27E Q4'26E Q3'26E Q2'26E Q1'26E Q4'25E Q3'25E ($ in millions) $139 $142 $140 $133 $133 $139 $141 $136 $129 $132 Revenue $11 $14 $13 $11 $11 $13 $13 $11 $7 $10 Adj. EBITDA 8% 10% 10% 8% 8% 9% 9% 8% 6% 7% Margin (%) (0) (0) (0) (0) (0) (0) (0) (1) (1) (0) ( - ) Cash taxes 3 3 3 2 2 2 2 1 4 4 (+/ - ) Other adjustments (7) (2) (3) (2) (6) 0 (3) (4) (3) (3) (+/ - ) Change in NWC (4) (4) (4) (4) (3) (6) (3) (2) (1) (3) (+/ - ) Capex (net of asset sale proceeds) – – – – – – – (6) (8) – ( - ) Other $2 $11 $8 $7 $4 $10 $9 $0 ($1) $7 Unlevered Free Cash Flow (2) (21) (2) (21) (1) (21) (1) (21) (1) (20) ( - ) Cash interest, net $1 ($10) $7 ($14) $3 ($11) $8 ($21) ($3) ($13) Levered Free Cash Flow