| Q4 2025 Earnings Supplemental December 31, 2025 |
| About Chiron 3 Quarterly Highlights 4 Consolidated Balance Sheets 5 Consolidated Statements of Operations 6 Reconciliations of Non-GAAP Measures Funds From Operations, Core FFO, and Funds Available for Distribution 7 Net Operating Income, Cash Net Operating Income, and Adjusted EBITDAre 8 Capitalization Summary 9 Leverage Statistics and Selected Debt Covenant Performance 10 Portfolio Information Portfolio Overview 11 Same Property Performance and Reconciliations 12 Lease Expiration Schedule and Leasing Rollforward 13 Portfolio Concentrations 14 Investment Activity and Capital Expenditures 15 Components of Net Asset Value 16 Definitions 17-19 *All per share , per share and unit, and weighted average share and unit amounts have been adjusted to reflect the impact of the Reverse Stock Split. Table of Contents Fourth Quarter 2025 Supplemental Reporting 2 Certain statements contained herein may be considered “forward-looking statements” within the meaning of the Private Securities Litigation Reform Act of 1995, and it is the Company’s intent that any such statements be protected by the safe harbor created thereby. These forward-looking statements are identified by their use of terms and phrases such as “anticipate,” “believe,” “could,” “estimate,” “expect,” “intend,” “may,” “should,” “plan,” “predict,” “project,” “will,” “continue” and other similar terms and phrases, including references to assumptions and forecasts of future results. Except for historical information, the statements set forth herein including, but not limited to, any statements regarding our earnings, our liquidity, our tenants’ ability to pay rent to us, our ability to refinance our indebtedness, expected financial performance (including future cash flows associated with our joint venture, new tenants or the expansion of current properties), 2026 Core FFO guidance, future dividends, interest rates or other financial items; any other statements concerning our plans, strategies, objectives and expectations for future operations and future portfolio occupancy rates, our pipeline of acquisition opportunities and expected acquisition activity, including the timing and/or successful completion of any acquisitions and expected rent receipts on these properties, our expected disposition activity, including the timing and/or successful completion of any dispositions and the expected use of proceeds therefrom; and any statements regarding future economic conditions or performance are forward-looking statements. These forward-looking statements are based on our current expectations, estimates and assumptions and are subject to certain risks and uncertainties. Although the Company believes that the expectations, estimates and assumptions reflected in its forward-looking statements are reasonable, actual results could differ materially from those projected or assumed in any of the Company’s forward-looking statements. Additional information concerning us and our business, including additional factors that could materially and adversely affect our financial results, include, without limitation, the risks described under Part I, Item 1A - Risk Factors, in our Annual Report on Form 10-K, our Quarterly Reports on Form 10-Q, and in our other filings with the SEC. You are cautioned not to place undue reliance on forward-looking statements. The Company does not intend, and undertakes no obligation, to update any forward-looking statement. FORWARD-LOOKING STATEMENTS |
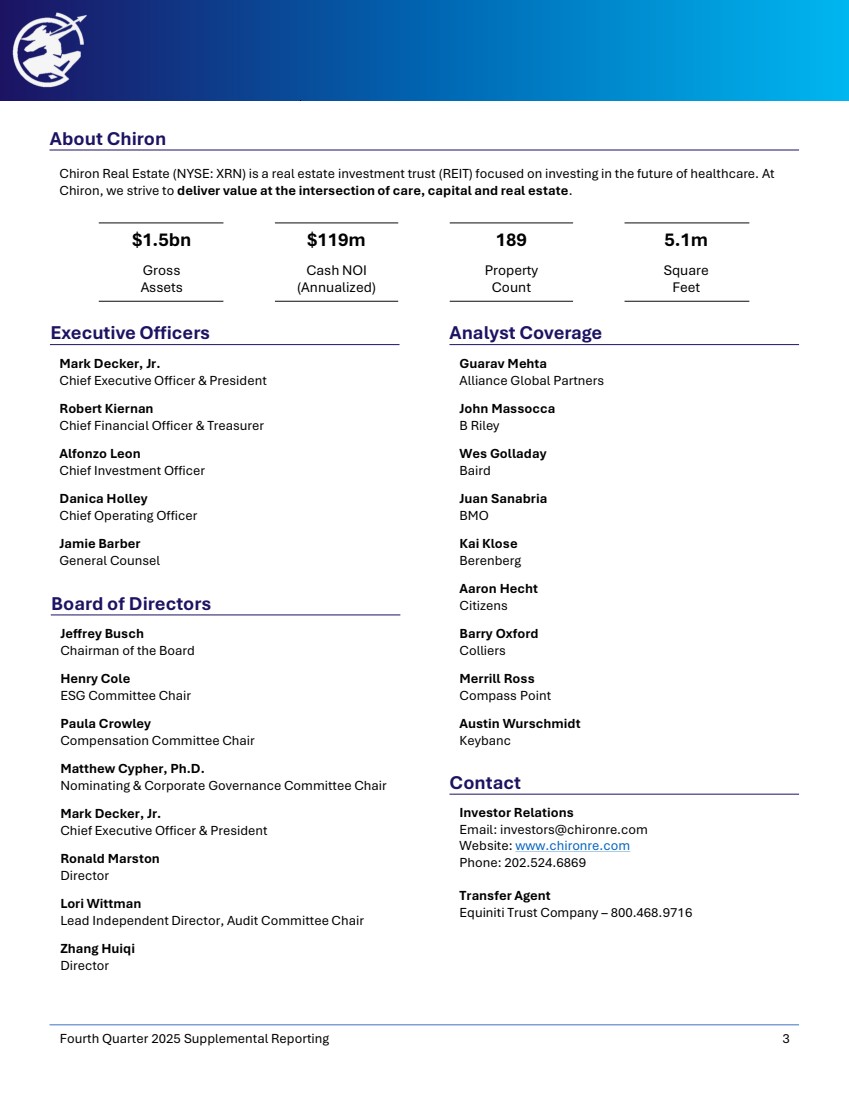
| About Chiron Fourth Quarter 2025 Supplemental Reporting 3 Chiron Real Estate (NYSE: XRN) is a real estate investment trust (REIT) focused on investing in the future of healthcare. At Chiron, we strive to deliver value at the intersection of care, capital and real estate. $1.5bn $119m 189 5.1m Gross Assets Cash NOI (Annualized) Property Count Square Feet Mark Decker, Jr. Chief Executive Officer & President Robert Kiernan Chief Financial Officer & Treasurer Alfonzo Leon Chief Investment Officer Danica Holley Chief Operating Officer Jamie Barber General Counsel Executive Officers Guarav Mehta Alliance Global Partners John Massocca B Riley Wes Golladay Baird Juan Sanabria BMO Kai Klose Berenberg Aaron Hecht Citizens Barry Oxford Colliers Merrill Ross Compass Point Austin Wurschmidt Keybanc Analyst Coverage Jeffrey Busch Chairman of the Board Henry Cole ESG Committee Chair Paula Crowley Compensation Committee Chair Matthew Cypher, Ph.D. Nominating & Corporate Governance Committee Chair Mark Decker, Jr. Chief Executive Officer & President Ronald Marston Director Lori Wittman Lead Independent Director, Audit Committee Chair Zhang Huiqi Director Board of Directors Contact Investor Relations Email: investors@chironre.com Website: www.chironre.com Phone: 202.524.6869 Transfer Agent Equiniti Trust Company – 800.468.9716 |
| Quarterly Highlights Fourth Quarter 2025 Supplemental Reporting 4 Company Announcements • The Company changed its name to Chiron Real Estate Inc. and adopt the new ticker symbol XRN effective February 23, 2026, rebranding with a refreshed mission and values: to deliver value at the intersection of care, capital and real estate. • Published an investor presentation outlining Chiron’s recent actions and 2026 Strategic Objectives. • Beginning with its next dividend, Chiron’s common dividend will be paid on a monthly cadence. The annualized dividend rate of $3.00 per share is unchanged. Operating Highlights • Reported quarterly net loss attributable to common stockholders of $7.4 million, or $0.55 per diluted share, as compared to net income of $1.4 million, or $0.10 per diluted share, in the comparable prior year period. • Reported quarterly funds from operations attributable to common stockholders and noncontrolling interest (“FFO”) of $0.97 per share and unit, as compared to $0.77 per share and unit in the comparable prior year period, representing a 26% year-over-year increase. • Reported core funds from operations attributable to common stockholders and noncontrolling interest (“Core FFO”) of $1.16 per share and unit, as compared to $1.09 per share and unit, in the comparable prior year period, representing a 6.4% year-over-year increase. • Fourth quarter same-property cash net operating income (“Same-Property Cash NOI”) growth was 5.4% on a year-over-year basis. • Year-end portfolio leased occupancy was 96.0%. Fourth Quarter Capital Markets and Debt Activity • Repurchased 175,634 common shares at an average price of $34.16 per share and an aggregate purchase price of $6.0 million. • Amended and restated its credit facility to, among other things, extend the maturities of its revolver and Term Loan A components. • Completed a public offering of 2,050,000 shares of its 8.00% Series B Cumulative Redeemable Preferred Stock (liquidation preference of $25 per share) (the “Series B Preferred Stock”) for gross proceeds of $51.3 million. Fourth Quarter Investment Highlights • During the fourth quarter, the Company completed the disposition of two facilities, receiving aggregate gross proceeds of $11.3 million, resulting in an aggregate loss of $0.4 million. Prior to completion of the sale of its facility in Melbourne, FL, the Company recognized an impairment charge of $6.7 million. *All per share , per share and unit, and weighted average share and unit amounts have been adjusted to reflect the impact of the Reverse Stock Split. |
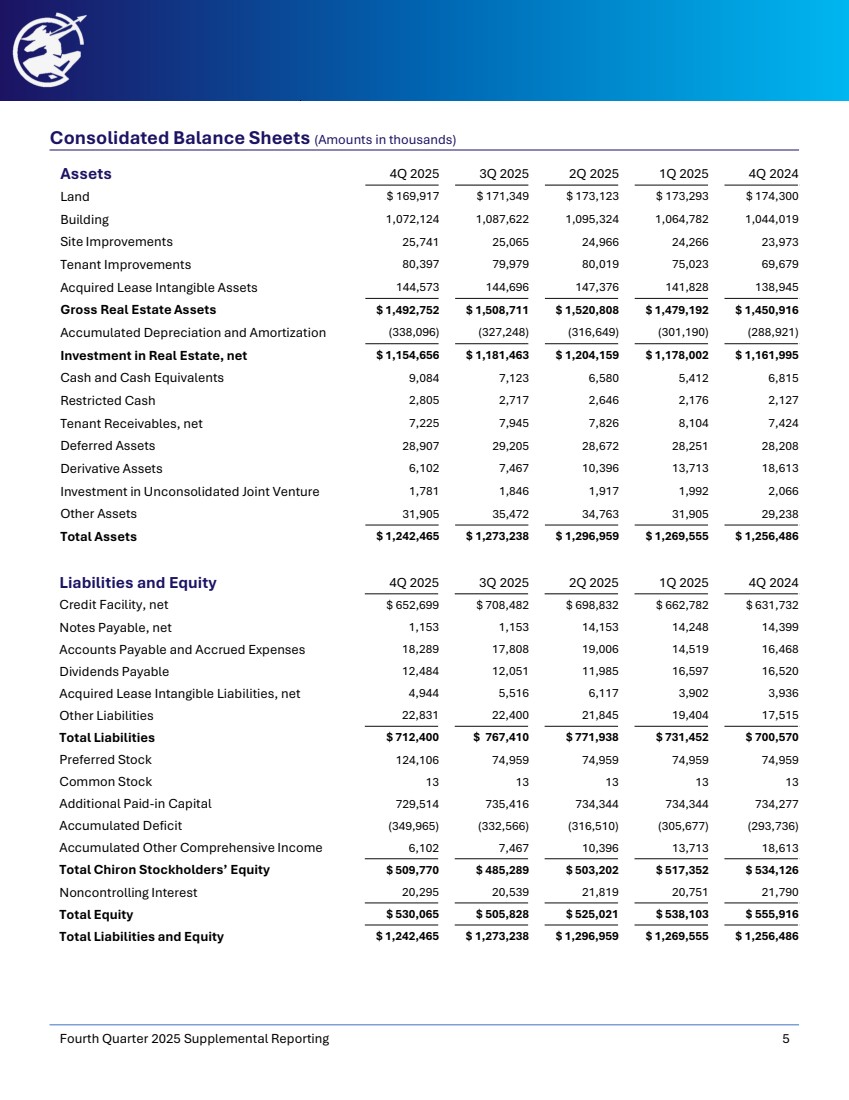
| Liabilities and Equity 4Q 2025 3Q 2025 2Q 2025 1Q 2025 4Q 2024 Credit Facility, net $ 652,699 $ 708,482 $ 698,832 $ 662,782 $ 631,732 Notes Payable, net 1,153 1,153 14,153 14,248 14,399 Accounts Payable and Accrued Expenses 18,289 17,808 19,006 14,519 16,468 Dividends Payable 12,484 12,051 11,985 16,597 16,520 Acquired Lease Intangible Liabilities, net 4,944 5,516 6,117 3,902 3,936 Other Liabilities 22,831 22,400 21,845 19,404 17,515 Total Liabilities $ 712,400 $ 767,410 $ 771,938 $ 731,452 $ 700,570 Preferred Stock 124,106 74,959 74,959 74,959 74,959 Common Stock 13 13 13 13 13 Additional Paid-in Capital 729,514 735,416 734,344 734,344 734,277 Accumulated Deficit (349,965) (332,566) (316,510) (305,677) (293,736) Accumulated Other Comprehensive Income 6,102 7,467 10,396 13,713 18,613 Total Chiron Stockholders’ Equity $ 509,770 $ 485,289 $ 503,202 $ 517,352 $ 534,126 Noncontrolling Interest 20,295 20,539 21,819 20,751 21,790 Total Equity $ 530,065 $ 505,828 $ 525,021 $ 538,103 $ 555,916 Total Liabilities and Equity $ 1,242,465 $ 1,273,238 $ 1,296,959 $ 1,269,555 $ 1,256,486 Assets 4Q 2025 3Q 2025 2Q 2025 1Q 2025 4Q 2024 Land $ 169,917 $ 171,349 $ 173,123 $ 173,293 $ 174,300 Building 1,072,124 1,087,622 1,095,324 1,064,782 1,044,019 Site Improvements 25,741 25,065 24,966 24,266 23,973 Tenant Improvements 80,397 79,979 80,019 75,023 69,679 Acquired Lease Intangible Assets 144,573 144,696 147,376 141,828 138,945 Gross Real Estate Assets $ 1,492,752 $ 1,508,711 $ 1,520,808 $ 1,479,192 $ 1,450,916 Accumulated Depreciation and Amortization (338,096) (327,248) (316,649) (301,190) (288,921) Investment in Real Estate, net $ 1,154,656 $ 1,181,463 $ 1,204,159 $ 1,178,002 $ 1,161,995 Cash and Cash Equivalents 9,084 7,123 6,580 5,412 6,815 Restricted Cash 2,805 2,717 2,646 2,176 2,127 Tenant Receivables, net 7,225 7,945 7,826 8,104 7,424 Deferred Assets 28,907 29,205 28,672 28,251 28,208 Derivative Assets 6,102 7,467 10,396 13,713 18,613 Investment in Unconsolidated Joint Venture 1,781 1,846 1,917 1,992 2,066 Other Assets 31,905 35,472 34,763 31,905 29,238 Total Assets $ 1,242,465 $ 1,273,238 $ 1,296,959 $ 1,269,555 $ 1,256,486 Consolidated Balance Sheets (Amounts in thousands) Fourth Quarter 2025 Supplemental Reporting 5 |
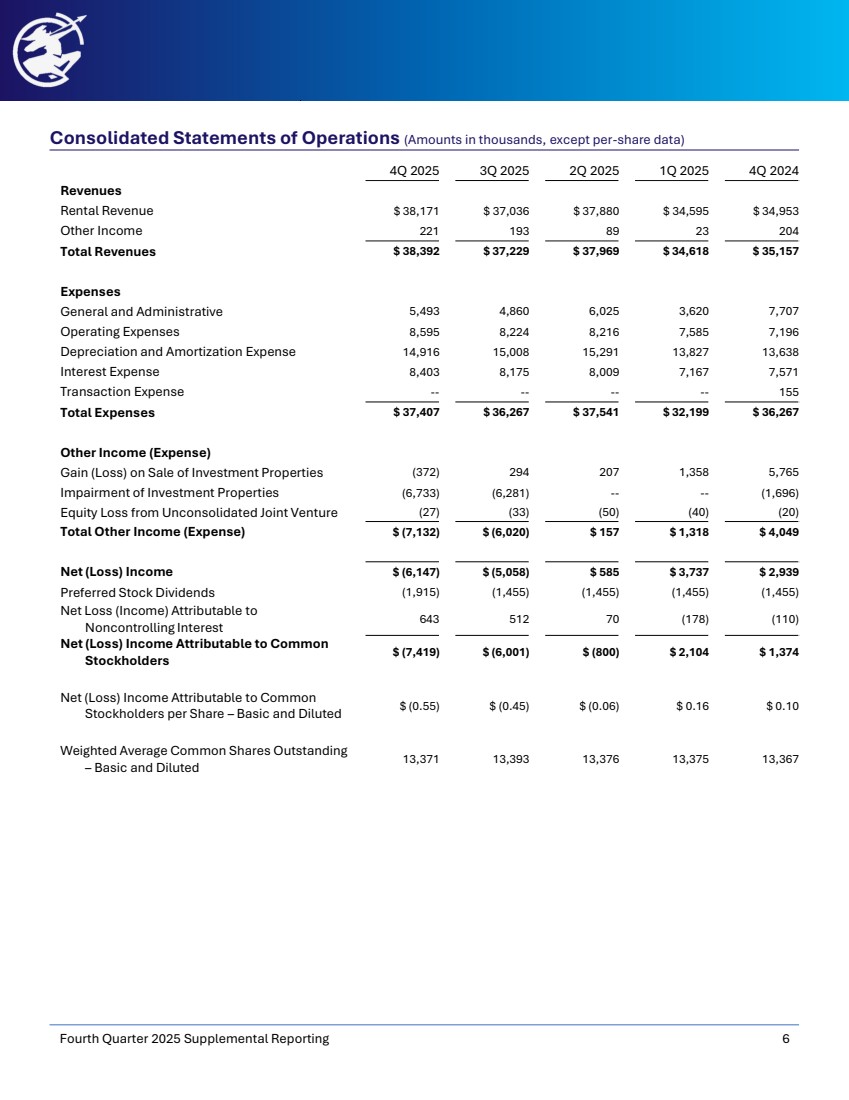
| Consolidated Statements of Operations (Amounts in thousands, except per-share data) Fourth Quarter 2025 Supplemental Reporting 6 4Q 2025 3Q 2025 2Q 2025 1Q 2025 4Q 2024 Revenues Rental Revenue $ 38,171 $ 37,036 $ 37,880 $ 34,595 $ 34,953 Other Income 221 193 89 23 204 Total Revenues $ 38,392 $ 37,229 $ 37,969 $ 34,618 $ 35,157 Expenses General and Administrative 5,493 4,860 6,025 3,620 7,707 Operating Expenses 8,595 8,224 8,216 7,585 7,196 Depreciation and Amortization Expense 14,916 15,008 15,291 13,827 13,638 Interest Expense 8,403 8,175 8,009 7,167 7,571 Transaction Expense -- -- -- -- 155 Total Expenses $ 37,407 $ 36,267 $ 37,541 $ 32,199 $ 36,267 Other Income (Expense) Gain (Loss) on Sale of Investment Properties (372) 294 207 1,358 5,765 Impairment of Investment Properties (6,733) (6,281) -- -- (1,696) Equity Loss from Unconsolidated Joint Venture (27) (33) (50) (40) (20) Total Other Income (Expense) $ (7,132) $ (6,020) $ 157 $ 1,318 $ 4,049 Net (Loss) Income $ (6,147) $ (5,058) $ 585 $ 3,737 $ 2,939 Preferred Stock Dividends (1,915) (1,455) (1,455) (1,455) (1,455) Net Loss (Income) Attributable to Noncontrolling Interest 643 512 70 (178) (110) Net (Loss) Income Attributable to Common Stockholders $ (7,419) $ (6,001) $ (800) $ 2,104 $ 1,374 Net (Loss) Income Attributable to Common Stockholders per Share – Basic and Diluted $ (0.55) $ (0.45) $ (0.06) $ 0.16 $ 0.10 Weighted Average Common Shares Outstanding – Basic and Diluted 13,371 13,393 13,376 13,375 13,367 |
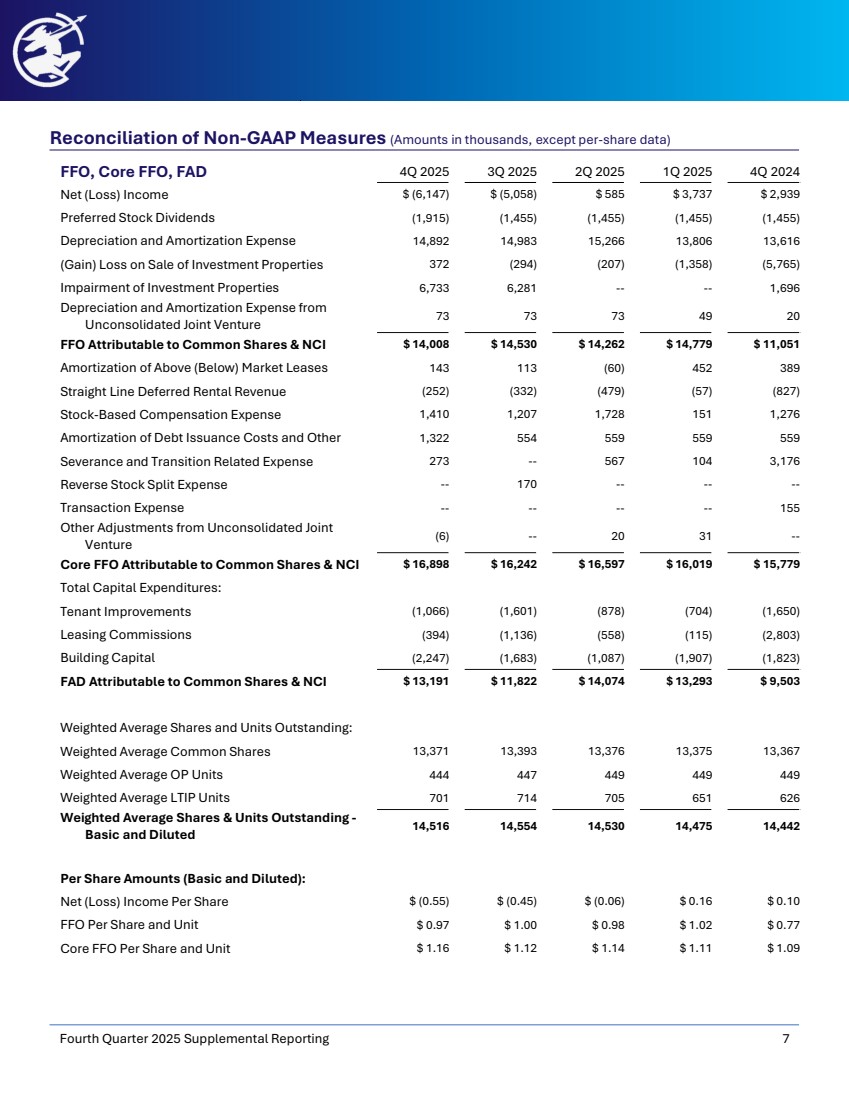
| FFO, Core FFO, FAD 4Q 2025 3Q 2025 2Q 2025 1Q 2025 4Q 2024 Net (Loss) Income $ (6,147) $ (5,058) $ 585 $ 3,737 $ 2,939 Preferred Stock Dividends (1,915) (1,455) (1,455) (1,455) (1,455) Depreciation and Amortization Expense 14,892 14,983 15,266 13,806 13,616 (Gain) Loss on Sale of Investment Properties 372 (294) (207) (1,358) (5,765) Impairment of Investment Properties 6,733 6,281 -- -- 1,696 Depreciation and Amortization Expense from Unconsolidated Joint Venture 73 73 73 49 20 FFO Attributable to Common Shares & NCI $ 14,008 $ 14,530 $ 14,262 $ 14,779 $ 11,051 Amortization of Above (Below) Market Leases 143 113 (60) 452 389 Straight Line Deferred Rental Revenue (252) (332) (479) (57) (827) Stock-Based Compensation Expense 1,410 1,207 1,728 151 1,276 Amortization of Debt Issuance Costs and Other 1,322 554 559 559 559 Severance and Transition Related Expense 273 -- 567 104 3,176 Reverse Stock Split Expense -- 170 -- -- -- Transaction Expense -- -- -- -- 155 Other Adjustments from Unconsolidated Joint Venture (6) -- 20 31 -- Core FFO Attributable to Common Shares & NCI $ 16,898 $ 16,242 $ 16,597 $ 16,019 $ 15,779 Total Capital Expenditures: Tenant Improvements (1,066) (1,601) (878) (704) (1,650) Leasing Commissions (394) (1,136) (558) (115) (2,803) Building Capital (2,247) (1,683) (1,087) (1,907) (1,823) FAD Attributable to Common Shares & NCI $ 13,191 $ 11,822 $ 14,074 $ 13,293 $ 9,503 Weighted Average Shares and Units Outstanding: Weighted Average Common Shares 13,371 13,393 13,376 13,375 13,367 Weighted Average OP Units 444 447 449 449 449 Weighted Average LTIP Units 701 714 705 651 626 Weighted Average Shares & Units Outstanding - Basic and Diluted 14,516 14,554 14,530 14,475 14,442 Per Share Amounts (Basic and Diluted): Net (Loss) Income Per Share $ (0.55) $ (0.45) $ (0.06) $ 0.16 $ 0.10 FFO Per Share and Unit $ 0.97 $ 1.00 $ 0.98 $ 1.02 $ 0.77 Core FFO Per Share and Unit $ 1.16 $ 1.12 $ 1.14 $ 1.11 $ 1.09 Reconciliation of Non-GAAP Measures (Amounts in thousands, except per-share data) Fourth Quarter 2025 Supplemental Reporting 7 |
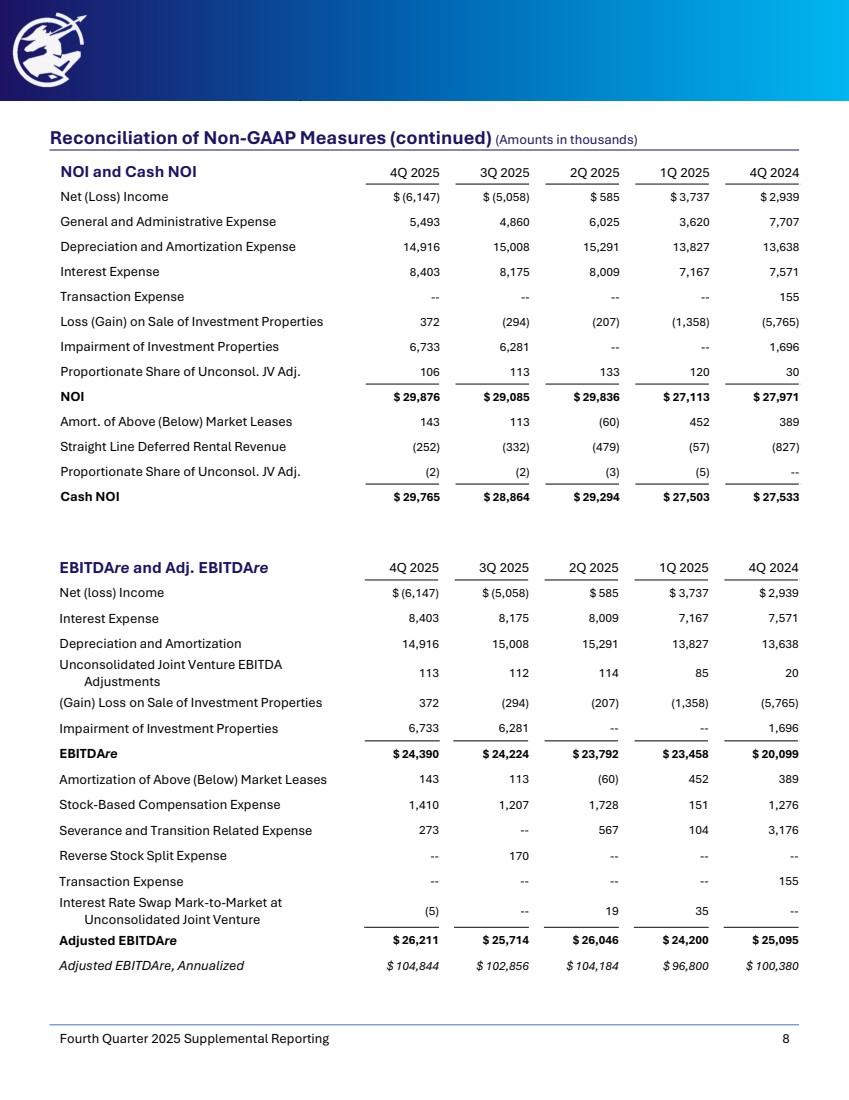
| EBITDAre and Adj. EBITDAre 4Q 2025 3Q 2025 2Q 2025 1Q 2025 4Q 2024 Net (loss) Income $ (6,147) $ (5,058) $ 585 $ 3,737 $ 2,939 Interest Expense 8,403 8,175 8,009 7,167 7,571 Depreciation and Amortization 14,916 15,008 15,291 13,827 13,638 Unconsolidated Joint Venture EBITDA Adjustments 113 112 114 85 20 (Gain) Loss on Sale of Investment Properties 372 (294) (207) (1,358) (5,765) Impairment of Investment Properties 6,733 6,281 -- -- 1,696 EBITDAre $ 24,390 $ 24,224 $ 23,792 $ 23,458 $ 20,099 Amortization of Above (Below) Market Leases 143 113 (60) 452 389 Stock-Based Compensation Expense 1,410 1,207 1,728 151 1,276 Severance and Transition Related Expense 273 -- 567 104 3,176 Reverse Stock Split Expense -- 170 -- -- -- Transaction Expense -- -- -- -- 155 Interest Rate Swap Mark-to-Market at Unconsolidated Joint Venture (5) -- 19 35 -- Adjusted EBITDAre $ 26,211 $ 25,714 $ 26,046 $ 24,200 $ 25,095 Adjusted EBITDAre, Annualized $ 104,844 $ 102,856 $ 104,184 $ 96,800 $ 100,380 NOI and Cash NOI 4Q 2025 3Q 2025 2Q 2025 1Q 2025 4Q 2024 Net (Loss) Income $ (6,147) $ (5,058) $ 585 $ 3,737 $ 2,939 General and Administrative Expense 5,493 4,860 6,025 3,620 7,707 Depreciation and Amortization Expense 14,916 15,008 15,291 13,827 13,638 Interest Expense 8,403 8,175 8,009 7,167 7,571 Transaction Expense -- -- -- -- 155 Loss (Gain) on Sale of Investment Properties 372 (294) (207) (1,358) (5,765) Impairment of Investment Properties 6,733 6,281 -- -- 1,696 Proportionate Share of Unconsol. JV Adj. 106 113 133 120 30 NOI $ 29,876 $ 29,085 $ 29,836 $ 27,113 $ 27,971 Amort. of Above (Below) Market Leases 143 113 (60) 452 389 Straight Line Deferred Rental Revenue (252) (332) (479) (57) (827) Proportionate Share of Unconsol. JV Adj. (2) (2) (3) (5) -- Cash NOI $ 29,765 $ 28,864 $ 29,294 $ 27,503 $ 27,533 Reconciliation of Non-GAAP Measures (continued) (Amounts in thousands) Fourth Quarter 2025 Supplemental Reporting 8 |
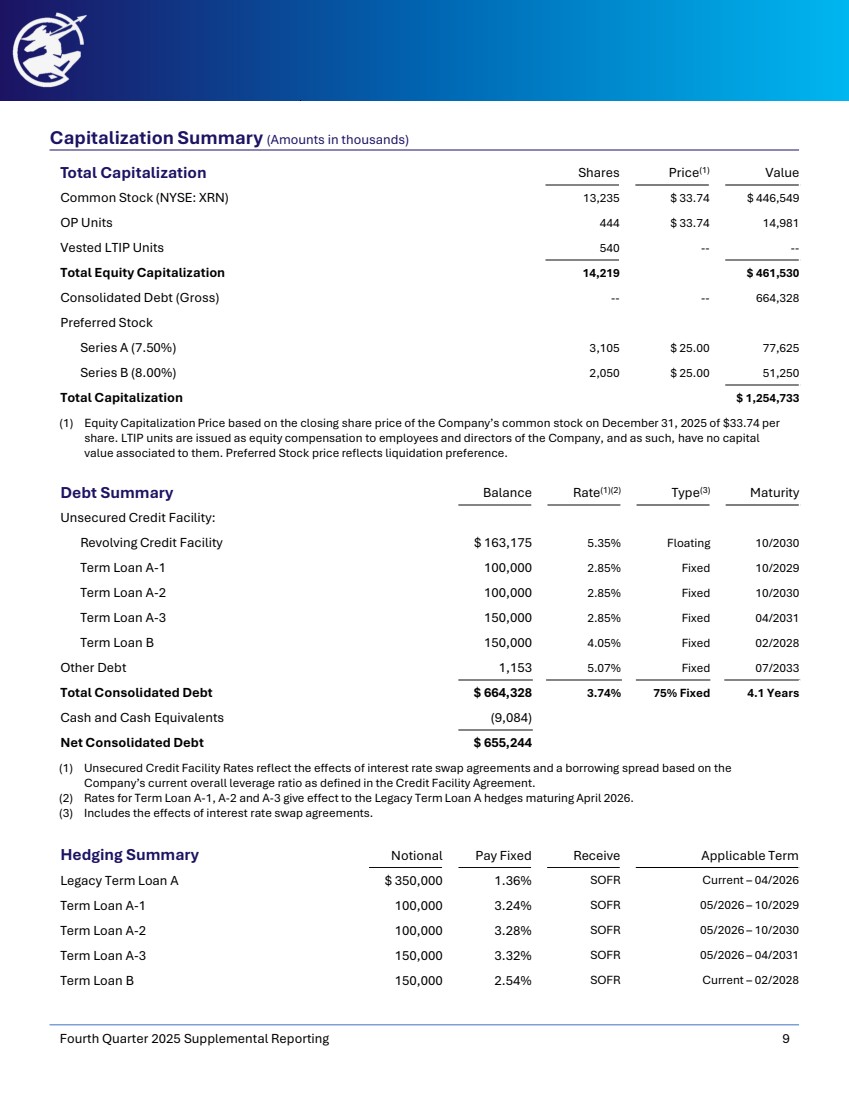
| Capitalization Summary (Amounts in thousands) Fourth Quarter 2025 Supplemental Reporting 9 Total Capitalization Shares Price(1) Value Common Stock (NYSE: XRN) 13,235 $ 33.74 $ 446,549 OP Units 444 $ 33.74 14,981 Vested LTIP Units 540 -- -- Total Equity Capitalization 14,219 $ 461,530 Consolidated Debt (Gross) -- -- 664,328 Preferred Stock Series A (7.50%) 3,105 $ 25.00 77,625 Series B (8.00%) 2,050 $ 25.00 51,250 Total Capitalization $ 1,254,733 (1) Equity Capitalization Price based on the closing share price of the Company’s common stock on December 31, 2025 of $33.74 per share. LTIP units are issued as equity compensation to employees and directors of the Company, and as such, have no capital value associated to them. Preferred Stock price reflects liquidation preference. Debt Summary Balance Rate(1)(2) Type(3) Maturity Unsecured Credit Facility: Revolving Credit Facility $ 163,175 5.35% Floating 10/2030 Term Loan A-1 100,000 2.85% Fixed 10/2029 Term Loan A-2 100,000 2.85% Fixed 10/2030 Term Loan A-3 150,000 2.85% Fixed 04/2031 Term Loan B 150,000 4.05% Fixed 02/2028 Other Debt 1,153 5.07% Fixed 07/2033 Total Consolidated Debt $ 664,328 3.74% 75% Fixed 4.1 Years Cash and Cash Equivalents (9,084) Net Consolidated Debt $ 655,244 (1) Unsecured Credit Facility Rates reflect the effects of interest rate swap agreements and a borrowing spread based on the Company’s current overall leverage ratio as defined in the Credit Facility Agreement. (2) Rates for Term Loan A-1, A-2 and A-3 give effect to the Legacy Term Loan A hedges maturing April 2026. (3) Includes the effects of interest rate swap agreements. Hedging Summary Notional Pay Fixed Receive Applicable Term Legacy Term Loan A $ 350,000 1.36% SOFR Current – 04/2026 Term Loan A-1 100,000 3.24% SOFR 05/2026 – 10/2029 Term Loan A-2 100,000 3.28% SOFR 05/2026 – 10/2030 Term Loan A-3 150,000 3.32% SOFR 05/2026 – 04/2031 Term Loan B 150,000 2.54% SOFR Current – 02/2028 |
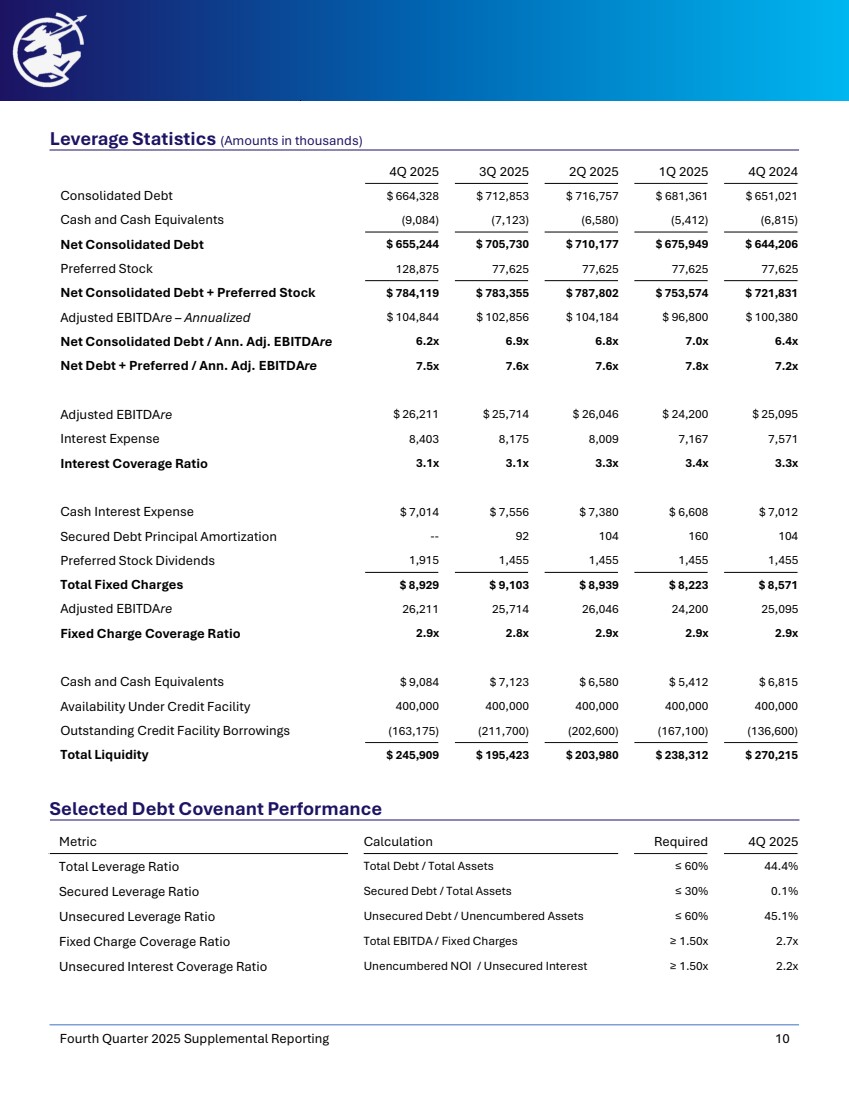
| Leverage Statistics (Amounts in thousands) Fourth Quarter 2025 Supplemental Reporting 10 4Q 2025 3Q 2025 2Q 2025 1Q 2025 4Q 2024 Consolidated Debt $ 664,328 $ 712,853 $ 716,757 $ 681,361 $ 651,021 Cash and Cash Equivalents (9,084) (7,123) (6,580) (5,412) (6,815) Net Consolidated Debt $ 655,244 $ 705,730 $ 710,177 $ 675,949 $ 644,206 Preferred Stock 128,875 77,625 77,625 77,625 77,625 Net Consolidated Debt + Preferred Stock $ 784,119 $ 783,355 $ 787,802 $ 753,574 $ 721,831 Adjusted EBITDAre – Annualized $ 104,844 $ 102,856 $ 104,184 $ 96,800 $ 100,380 Net Consolidated Debt / Ann. Adj. EBITDAre 6.2x 6.9x 6.8x 7.0x 6.4x Net Debt + Preferred / Ann. Adj. EBITDAre 7.5x 7.6x 7.6x 7.8x 7.2x Adjusted EBITDAre $ 26,211 $ 25,714 $ 26,046 $ 24,200 $ 25,095 Interest Expense 8,403 8,175 8,009 7,167 7,571 Interest Coverage Ratio 3.1x 3.1x 3.3x 3.4x 3.3x Cash Interest Expense $ 7,014 $ 7,556 $ 7,380 $ 6,608 $ 7,012 Secured Debt Principal Amortization -- 92 104 160 104 Preferred Stock Dividends 1,915 1,455 1,455 1,455 1,455 Total Fixed Charges $ 8,929 $ 9,103 $ 8,939 $ 8,223 $ 8,571 Adjusted EBITDAre 26,211 25,714 26,046 24,200 25,095 Fixed Charge Coverage Ratio 2.9x 2.8x 2.9x 2.9x 2.9x Cash and Cash Equivalents $ 9,084 $ 7,123 $ 6,580 $ 5,412 $ 6,815 Availability Under Credit Facility 400,000 400,000 400,000 400,000 400,000 Outstanding Credit Facility Borrowings (163,175) (211,700) (202,600) (167,100) (136,600) Total Liquidity $ 245,909 $ 195,423 $ 203,980 $ 238,312 $ 270,215 Selected Debt Covenant Performance Metric Calculation Required 4Q 2025 Total Leverage Ratio Total Debt / Total Assets ≤ 60% 44.4% Secured Leverage Ratio Secured Debt / Total Assets ≤ 30% 0.1% Unsecured Leverage Ratio Unsecured Debt / Unencumbered Assets ≤ 60% 45.1% Fixed Charge Coverage Ratio Total EBITDA / Fixed Charges ≥ 1.50x 2.7x Unsecured Interest Coverage Ratio Unencumbered NOI / Unsecured Interest ≥ 1.50x 2.2x |
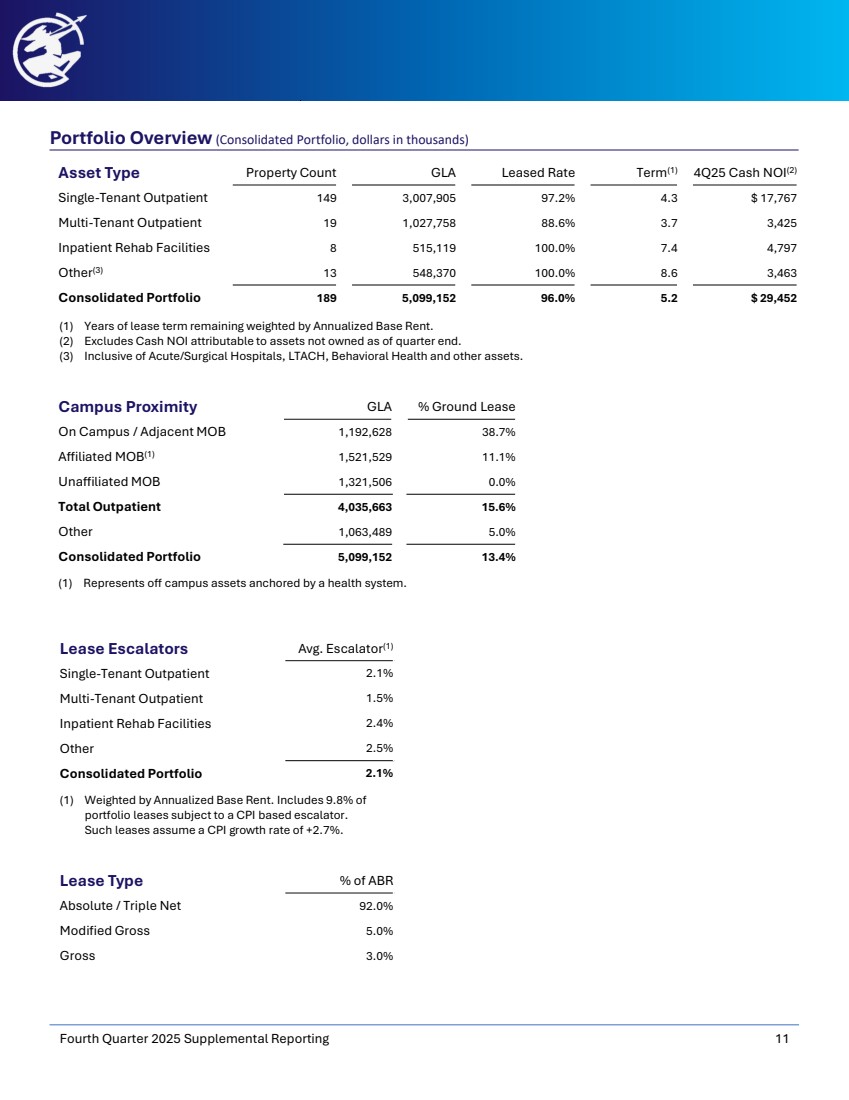
| Portfolio Overview (Consolidated Portfolio, dollars in thousands) Fourth Quarter 2025 Supplemental Reporting 11 Asset Type Property Count GLA Leased Rate Term(1) 4Q25 Cash NOI(2) Single-Tenant Outpatient 149 3,007,905 97.2% 4.3 $ 17,767 Multi-Tenant Outpatient 19 1,027,758 88.6% 3.7 3,425 Inpatient Rehab Facilities 8 515,119 100.0% 7.4 4,797 Other(3) 13 548,370 100.0% 8.6 3,463 Consolidated Portfolio 189 5,099,152 96.0% 5.2 $ 29,452 Campus Proximity GLA % Ground Lease On Campus / Adjacent MOB 1,192,628 38.7% Affiliated MOB(1) 1,521,529 11.1% Unaffiliated MOB 1,321,506 0.0% Total Outpatient 4,035,663 15.6% Other 1,063,489 5.0% Consolidated Portfolio 5,099,152 13.4% Lease Escalators Avg. Escalator(1) Single-Tenant Outpatient 2.1% Multi-Tenant Outpatient 1.5% Inpatient Rehab Facilities 2.4% Other 2.5% Consolidated Portfolio 2.1% (1) Represents off campus assets anchored by a health system. (1) Years of lease term remaining weighted by Annualized Base Rent. (2) Excludes Cash NOI attributable to assets not owned as of quarter end. (3) Inclusive of Acute/Surgical Hospitals, LTACH, Behavioral Health and other assets. (1) Weighted by Annualized Base Rent. Includes 9.8% of portfolio leases subject to a CPI based escalator. Such leases assume a CPI growth rate of +2.7%. Lease Type % of ABR Absolute / Triple Net 92.0% Modified Gross 5.0% Gross 3.0% |
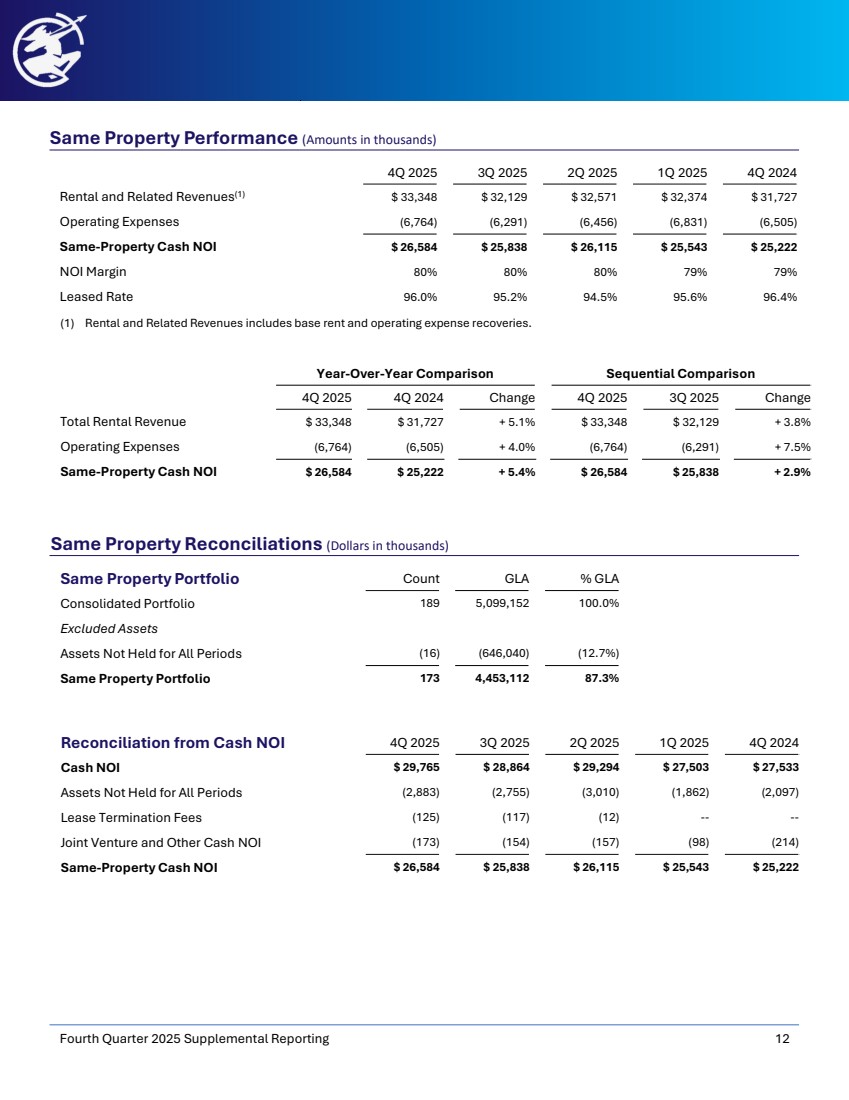
| 4Q 2025 3Q 2025 2Q 2025 1Q 2025 4Q 2024 Rental and Related Revenues(1) $ 33,348 $ 32,129 $ 32,571 $ 32,374 $ 31,727 Operating Expenses (6,764) (6,291) (6,456) (6,831) (6,505) Same-Property Cash NOI $ 26,584 $ 25,838 $ 26,115 $ 25,543 $ 25,222 NOI Margin 80% 80% 80% 79% 79% Leased Rate 96.0% 95.2% 94.5% 95.6% 96.4% Same Property Performance (Amounts in thousands) Fourth Quarter 2025 Supplemental Reporting 12 Same Property Portfolio Count GLA % GLA Consolidated Portfolio 189 5,099,152 100.0% Excluded Assets Assets Not Held for All Periods (16) (646,040) (12.7%) Same Property Portfolio 173 4,453,112 87.3% Reconciliation from Cash NOI 4Q 2025 3Q 2025 2Q 2025 1Q 2025 4Q 2024 Cash NOI $ 29,765 $ 28,864 $ 29,294 $ 27,503 $ 27,533 Assets Not Held for All Periods (2,883) (2,755) (3,010) (1,862) (2,097) Lease Termination Fees (125) (117) (12) -- -- Joint Venture and Other Cash NOI (173) (154) (157) (98) (214) Same-Property Cash NOI $ 26,584 $ 25,838 $ 26,115 $ 25,543 $ 25,222 Same Property Reconciliations (Dollars in thousands) Year-Over-Year Comparison Sequential Comparison 4Q 2025 4Q 2024 Change 4Q 2025 3Q 2025 Change Total Rental Revenue $ 33,348 $ 31,727 + 5.1% $ 33,348 $ 32,129 + 3.8% Operating Expenses (6,764) (6,505) + 4.0% (6,764) (6,291) + 7.5% Same-Property Cash NOI $ 26,584 $ 25,222 + 5.4% $ 26,584 $ 25,838 + 2.9% (1) Rental and Related Revenues includes base rent and operating expense recoveries. |
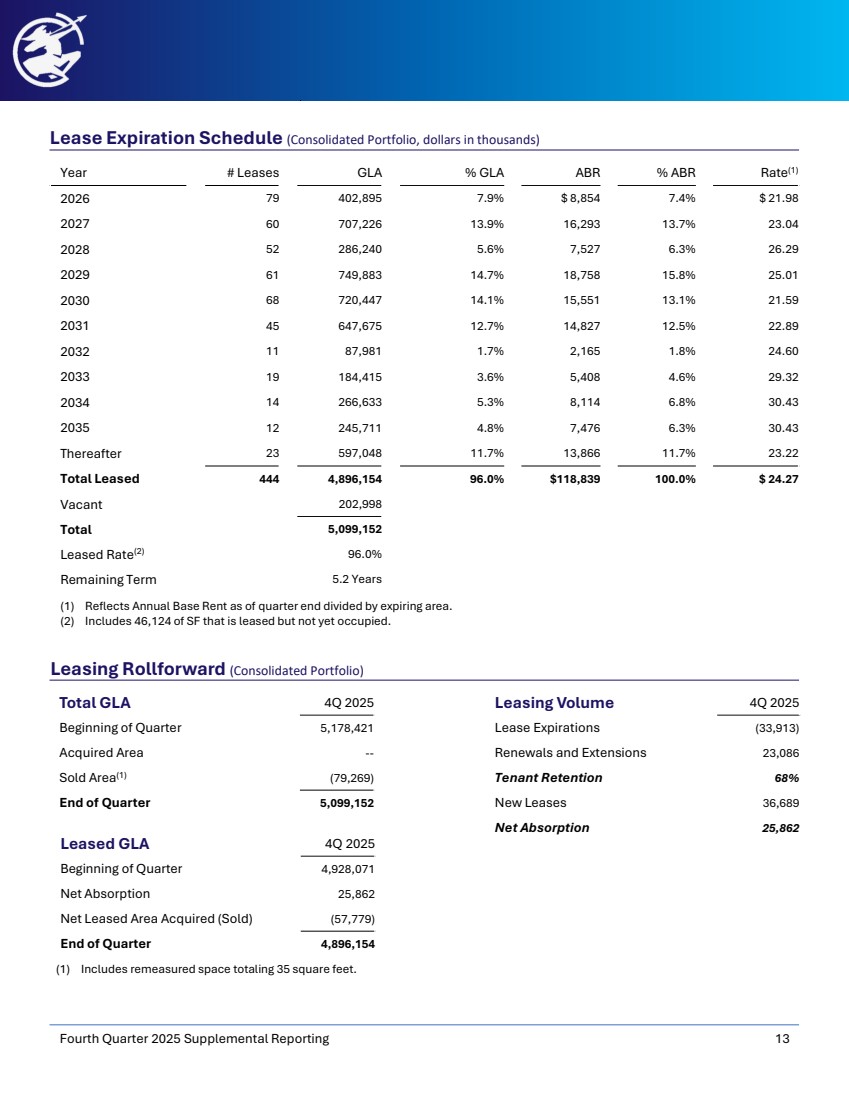
| Lease Expiration Schedule (Consolidated Portfolio, dollars in thousands) Fourth Quarter 2025 Supplemental Reporting 13 Year # Leases GLA % GLA ABR % ABR Rate(1) 2026 79 402,895 7.9% $ 8,854 7.4% $ 21.98 2027 60 707,226 13.9% 16,293 13.7% 23.04 2028 52 286,240 5.6% 7,527 6.3% 26.29 2029 61 749,883 14.7% 18,758 15.8% 25.01 2030 68 720,447 14.1% 15,551 13.1% 21.59 2031 45 647,675 12.7% 14,827 12.5% 22.89 2032 11 87,981 1.7% 2,165 1.8% 24.60 2033 19 184,415 3.6% 5,408 4.6% 29.32 2034 14 266,633 5.3% 8,114 6.8% 30.43 2035 12 245,711 4.8% 7,476 6.3% 30.43 Thereafter 23 597,048 11.7% 13,866 11.7% 23.22 Total Leased 444 4,896,154 96.0% $118,839 100.0% $ 24.27 Vacant 202,998 Total 5,099,152 Leased Rate(2) 96.0% Remaining Term 5.2 Years Leasing Rollforward (Consolidated Portfolio) (1) Reflects Annual Base Rent as of quarter end divided by expiring area. (2) Includes 46,124 of SF that is leased but not yet occupied. Total GLA 4Q 2025 Beginning of Quarter 5,178,421 Acquired Area -- Sold Area(1) (79,269) End of Quarter 5,099,152 Leasing Volume 4Q 2025 Lease Expirations (33,913) Renewals and Extensions 23,086 Tenant Retention 68% New Leases 36,689 Net Absorption 25,862 Leased GLA 4Q 2025 Beginning of Quarter 4,928,071 Net Absorption 25,862 Net Leased Area Acquired (Sold) (57,779) End of Quarter 4,896,154 (1) Includes remeasured space totaling 35 square feet. |
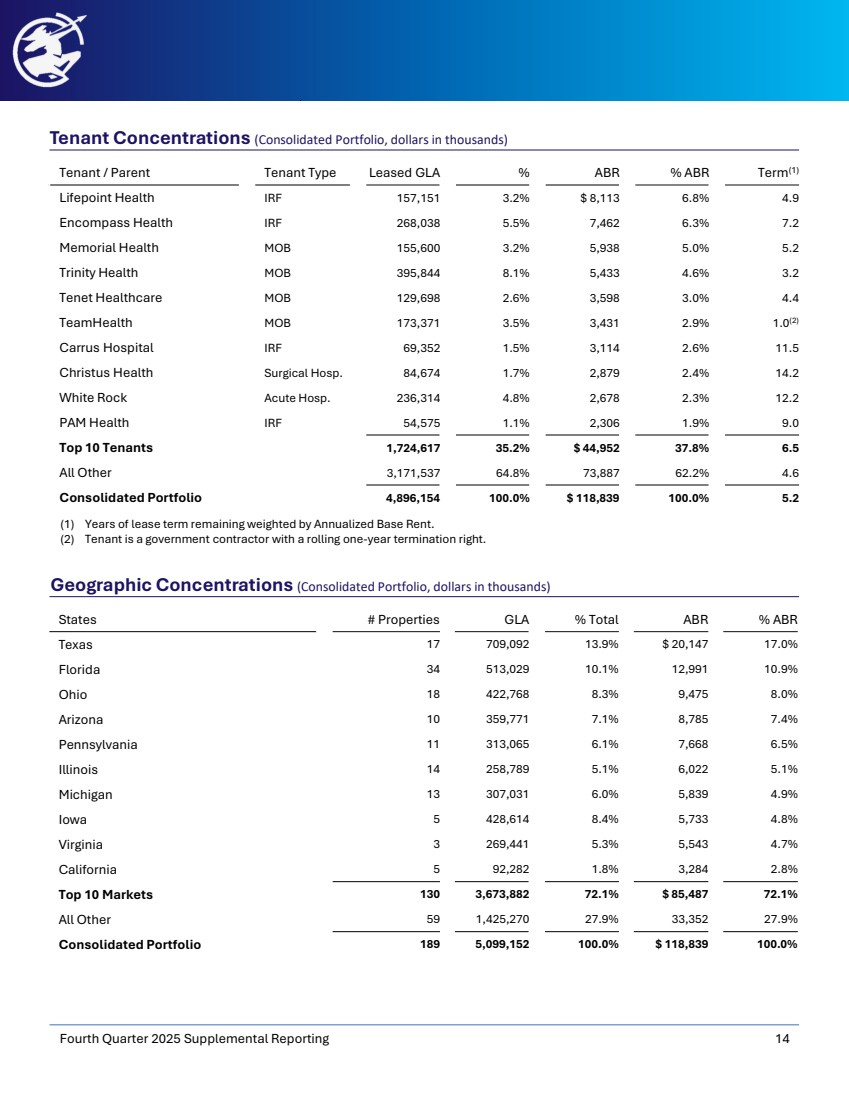
| Tenant Concentrations (Consolidated Portfolio, dollars in thousands) Fourth Quarter 2025 Supplemental Reporting 14 Geographic Concentrations (Consolidated Portfolio, dollars in thousands) States # Properties GLA % Total ABR % ABR Texas 17 709,092 13.9% $ 20,147 17.0% Florida 34 513,029 10.1% 12,991 10.9% Ohio 18 422,768 8.3% 9,475 8.0% Arizona 10 359,771 7.1% 8,785 7.4% Pennsylvania 11 313,065 6.1% 7,668 6.5% Illinois 14 258,789 5.1% 6,022 5.1% Michigan 13 307,031 6.0% 5,839 4.9% Iowa 5 428,614 8.4% 5,733 4.8% Virginia 3 269,441 5.3% 5,543 4.7% California 5 92,282 1.8% 3,284 2.8% Top 10 Markets 130 3,673,882 72.1% $ 85,487 72.1% All Other 59 1,425,270 27.9% 33,352 27.9% Consolidated Portfolio 189 5,099,152 100.0% $ 118,839 100.0% Tenant / Parent Tenant Type Leased GLA % ABR % ABR Term(1) Lifepoint Health IRF 157,151 3.2% $ 8,113 6.8% 4.9 Encompass Health IRF 268,038 5.5% 7,462 6.3% 7.2 Memorial Health MOB 155,600 3.2% 5,938 5.0% 5.2 Trinity Health MOB 395,844 8.1% 5,433 4.6% 3.2 Tenet Healthcare MOB 129,698 2.6% 3,598 3.0% 4.4 TeamHealth MOB 173,371 3.5% 3,431 2.9% 1.0(2) Carrus Hospital IRF 69,352 1.5% 3,114 2.6% 11.5 Christus Health Surgical Hosp. 84,674 1.7% 2,879 2.4% 14.2 White Rock Acute Hosp. 236,314 4.8% 2,678 2.3% 12.2 PAM Health IRF 54,575 1.1% 2,306 1.9% 9.0 Top 10 Tenants 1,724,617 35.2% $ 44,952 37.8% 6.5 All Other 3,171,537 64.8% 73,887 62.2% 4.6 Consolidated Portfolio 4,896,154 100.0% $ 118,839 100.0% 5.2 (1) Years of lease term remaining weighted by Annualized Base Rent. (2) Tenant is a government contractor with a rolling one-year termination right. |
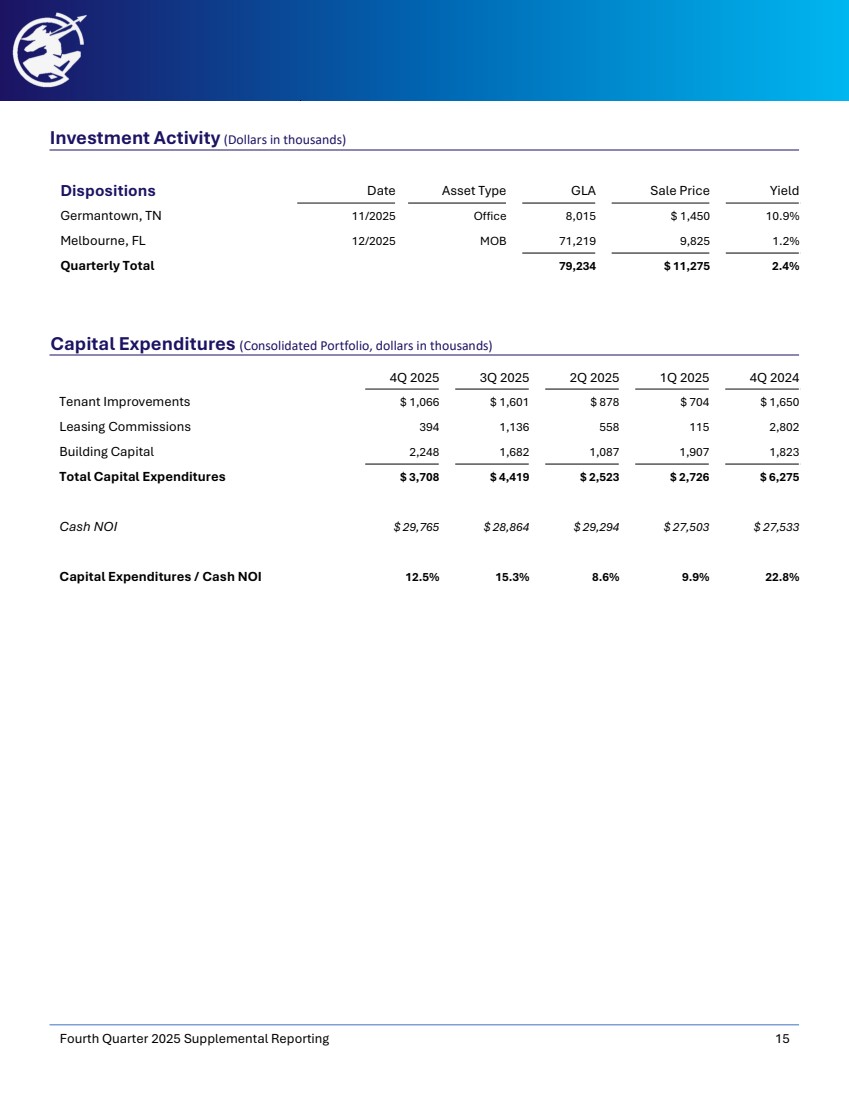
| Investment Activity (Dollars in thousands) Fourth Quarter 2025 Supplemental Reporting 15 Capital Expenditures (Consolidated Portfolio, dollars in thousands) 4Q 2025 3Q 2025 2Q 2025 1Q 2025 4Q 2024 Tenant Improvements $ 1,066 $ 1,601 $ 878 $ 704 $ 1,650 Leasing Commissions 394 1,136 558 115 2,802 Building Capital 2,248 1,682 1,087 1,907 1,823 Total Capital Expenditures $ 3,708 $ 4,419 $ 2,523 $ 2,726 $ 6,275 Cash NOI $ 29,765 $ 28,864 $ 29,294 $ 27,503 $ 27,533 Capital Expenditures / Cash NOI 12.5% 15.3% 8.6% 9.9% 22.8% Dispositions Date Asset Type GLA Sale Price Yield Germantown, TN 11/2025 Office 8,015 $ 1,450 10.9% Melbourne, FL 12/2025 MOB 71,219 9,825 1.2% Quarterly Total 79,234 $ 11,275 2.4% |
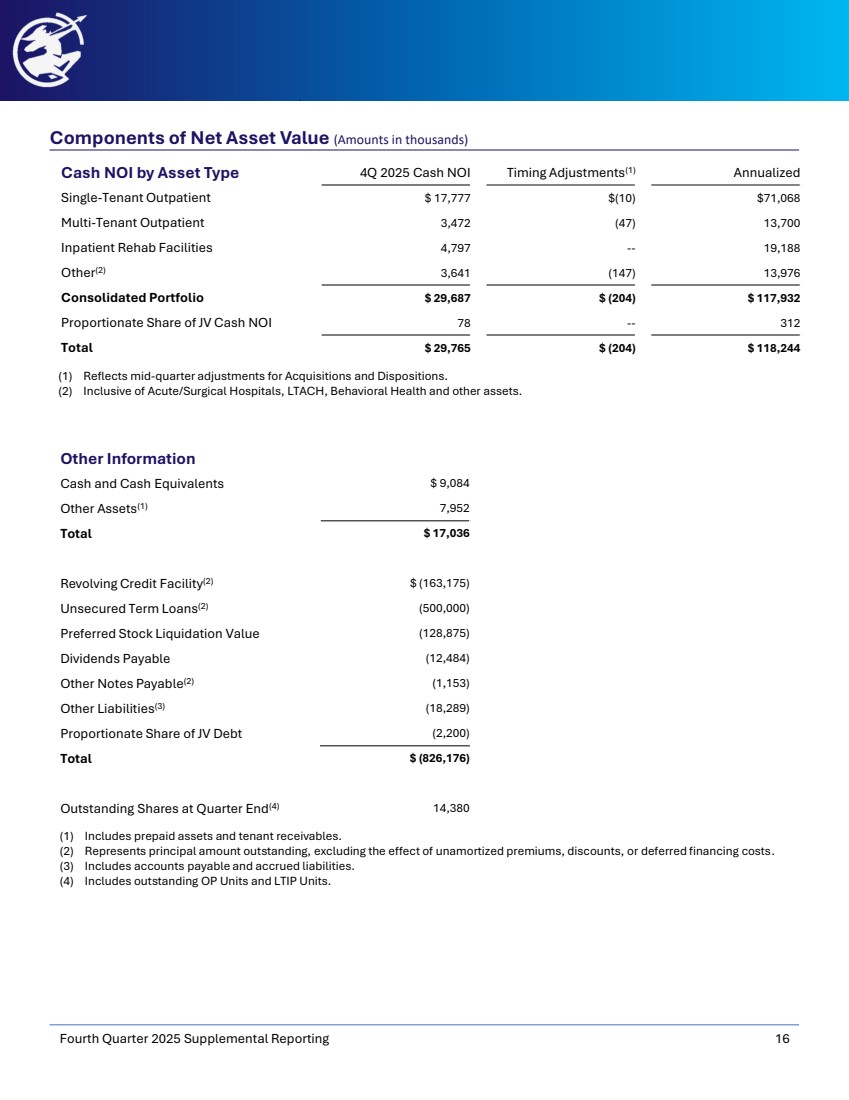
| Components of Net Asset Value (Amounts in thousands) Fourth Quarter 2025 Supplemental Reporting 16 Cash NOI by Asset Type 4Q 2025 Cash NOI Timing Adjustments(1) Annualized Single-Tenant Outpatient $ 17,777 $(10) $71,068 Multi-Tenant Outpatient 3,472 (47) 13,700 Inpatient Rehab Facilities 4,797 -- 19,188 Other(2) 3,641 (147) 13,976 Consolidated Portfolio $ 29,687 $ (204) $ 117,932 Proportionate Share of JV Cash NOI 78 -- 312 Total $ 29,765 $ (204) $ 118,244 (1) Reflects mid-quarter adjustments for Acquisitions and Dispositions. (2) Inclusive of Acute/Surgical Hospitals, LTACH, Behavioral Health and other assets. Other Information Cash and Cash Equivalents $ 9,084 Other Assets(1) 7,952 Total $ 17,036 Revolving Credit Facility(2) $ (163,175) Unsecured Term Loans(2) (500,000) Preferred Stock Liquidation Value (128,875) Dividends Payable (12,484) Other Notes Payable(2) (1,153) Other Liabilities(3) (18,289) Proportionate Share of JV Debt (2,200) Total $ (826,176) Outstanding Shares at Quarter End(4) 14,380 (1) Includes prepaid assets and tenant receivables. (2) Represents principal amount outstanding, excluding the effect of unamortized premiums, discounts, or deferred financing costs. (3) Includes accounts payable and accrued liabilities. (4) Includes outstanding OP Units and LTIP Units. |
| Reporting Definitions and Other Disclosures Fourth Quarter 2025 Supplemental Reporting 17 Annualized Base Rent: Annualized base rent represents monthly base rent for December 2025 (or, for recent acquisitions, monthly base rent for the month of acquisition), multiplied by 12 (or base rent net of annualized expenses for properties with gross leases). Accordingly, this methodology produces an annualized amount as of a point in time but does not take into account future (i) contractual rental rate increases, (ii) leasing activity or (iii) lease expirations. Additionally, leases that are accounted for on a cash-collected basis, or that are in a free rent period, are not included in annualized base rent. Capitalization Rate: The capitalization rate (“Cap Rate”) for an acquisition is calculated by dividing current Annualized Base Rent by contractual purchase price. For the portfolio cap rate, certain adjustments, including for subsequent capital invested, are made to the contractual purchase price. Funds from Operations Attributable to Common Stockholders and Noncontrolling Interest and Core Funds from Operations Attributable to Common Stockholders and Noncontrolling Interest: Funds from operations attributable to common stockholders and noncontrolling interest (“FFO”) and core funds from operations attributable to common stockholders and noncontrolling interest (“Core FFO”), formerly referred to as “Adjusted funds from operations attributable to common stockholders and noncontrolling interest, or (AFFO)” are non-GAAP financial measures within the meaning of the rules of the SEC. The Company considers FFO and Core FFO to be important supplemental measures of its operating performance and believes FFO is frequently used by securities analysts, investors, and other interested parties in the evaluation of REITs, many of which present FFO when reporting their results. In accordance with the National Association of Real Estate Investment Trusts’ (“NAREIT”) definition, FFO means net income or loss computed in accordance with GAAP before noncontrolling interests of holders of OP units and LTIP units, excluding gains (or losses) from sales of property and extraordinary items, property impairment losses, less preferred stock dividends, plus real estate-related depreciation and amortization (excluding amortization of debt issuance costs and the amortization of above and below market leases), and after adjustments for unconsolidated partnerships and joint ventures calculated to reflect FFO on the same basis. Because FFO excludes real estate-related depreciation and amortization (other than amortization of debt issuance costs and above and below market lease amortization expense), the Company believes FFO provides a complete picture of its performance that is more informative than GAAP net income or loss. FFO provides perspective on trends in occupancy rates, rental rates, operating costs, development activities and interest costs, and helps the Company more immediately compare the most recent GAAP measurement, net income or loss. Core FFO, formerly referred to as “Adjusted funds from operations attributable to common stockholders and noncontrolling interest, or (AFFO)”, is a non-GAAP measure used by many investors and analysts to measure a real estate company’s operating performance by removing nonrecurring and non-cash items that do not reflect ongoing operations. Management calculates Core FFO by modifying the NAREIT definition of FFO by (i) removing certain non-recurring expenses, as well as other certain non-cash and non-recurring IT costs, (ii) removing amortization related to capitalized leasing and acquisition costs, (iii) removing amortization of above and below market leases and amounts associated with the write-off of above and below market leases for certain early lease terminations (iv) adding back straight-line rent adjustments, (v) recurring amortization of debt issuance costs, (vi) severance and executive transition costs, (vii) share-based compensation expense and (viii) other items related to unconsolidated partnerships and joint ventures. Management believes that reporting Core FFO in addition to FFO is a useful supplemental measure for the investment community when evaluating the operating performance of the Company on a comparative basis. Funds Available for Distribution Attributable to Common Stockholders and Noncontrolling Interest: We calculate funds available for distribution attributable to common stockholders and noncontrolling interest (“FAD”) by deducting capital expenditures for property improvements made to maintain the condition of properties from Core FFO. The Company believes FAD is useful in analyzing the amount of cash available for distribution to stockholders and unitholders. Investors, analysts and the Company utilize FAD as an indicator of common dividend sustainability. |
| Reporting Definitions and Other Disclosures (continued) Fourth Quarter 2025 Supplemental Reporting 18 Earnings Before Interest, Taxes, Depreciation and Amortization for Real Estate (“EBITDAre” and “Adjusted EBITDAre”): We calculate EBITDAre in accordance with standards established by NAREIT and define EBITDAre as net income or loss computed in accordance with GAAP plus depreciation and amortization, interest expense, gain or loss on the sale of investment properties, property impairment losses, and adjustments for unconsolidated partnerships and joint ventures, to reflect EBITDAre on the same basis, as applicable. We define Adjusted EBITDAre as EBITDAre plus loss on extinguishment of debt, non-cash stock compensation expense, non-cash intangible amortization related to above and below market leases, severance and transition related expense, reverse stock split expense, transaction expense, adjustments related to our investment in unconsolidated joint ventures, and other normalizing items. Management considers EBITDAre and Adjusted EBITDAre important measures because they provide additional information to allow management, investors, and our current and potential creditors to evaluate and compare our core operating results and our ability to service debt. NOI, Cash NOI and Same-Property Cash NOI: We consider net operating income, or NOI, to be an appropriate supplemental measure to net income because it helps both investors and management understand the core operations of our properties. We define NOI as total net (loss) income, plus depreciation and amortization expense, general and administrative expense, transaction expense, impairments, gain or loss on sale of investment properties, interest expense, and other non-operating items. Cash NOI and Same-Property Cash NOI are key performance indicators. Management considers these to be supplemental measures that allow investors, analysts and Company management to measure improved property-level cash operating results. The Company defines Cash NOI as NOI excluding non-cash items such as above and below market lease intangibles and straight-line rent. Cash NOI is historical and not necessarily indicative of future results. Same-Property Cash NOI compares Cash NOI for stabilized properties. Stabilized properties are properties that have been included in operations for the duration of the year-over-year comparison period presented. Accordingly, stabilized properties exclude properties that were recently acquired or disposed of, properties classified as held for sale, properties undergoing redevelopment, and newly redeveloped or developed properties. Same-Property Cash NOI also excludes lease terminations fees and joint venture and other income in order to remove non-recurring items and joint venture-related income from our NOI. Other Disclosures Non-GAAP Financial Measures: Management considers certain non-GAAP financial measures to be useful supplemental measures of the Company’s operating performance. For the Company, non-GAAP measures consist of FFO attributable to common stockholders and noncontrolling interest, AFFO attributable to common stockholders and noncontrolling interest, FAD attributable to common stockholders and noncontrolling interest, EBITDAre and Adjusted EBITDAre, Net Operating Income (“NOI”), cash NOI and same-property cash NOI. A non-GAAP measure is generally defined as one that departs from traditional GAAP financial performance, financial position or cash flows, but excludes or includes amounts that would not be so adjusted in the most comparable measure determined in accordance with GAAP. The Company reports non-GAAP financial measures because these measures are observed by management and they also may be used by the predominant REIT research analysts, as well as by industry analysts to evaluate REITs. For these reasons, management deems it appropriate to disclose and discuss these non-GAAP financial measures. The non-GAAP financial measures presented herein are not necessarily identical to those presented by other real estate companies due to the fact that not all real estate companies use the same definitions. These measures should not be considered alternatives to net income as measures of the Company’s operating performance, or as alternatives to cash flow as measures of the Company’s liquidity. Moreover, these non-GAAP measures necessarily indicate why the Company utilizes these measures, they should be considered supplemental in nature and not superior to comparable GAAP measures. To facilitate a clear understanding of these non-GAAP financial measures, quantitative reconciliations of these non-GAAP measures to the most directly comparable GAAP measures of net income and cash flows from operations as presented elsewhere herein. |
| Reporting Definitions and Other Disclosures (continued) Fourth Quarter 2025 Supplemental Reporting 19 Additional Information: The information in this document should be read in conjunction with the Company’s Annual Report on Form 10-K, Quarterly Reports on Form 10-Q, Current Reports on Form 8-K, and other information filed with, or furnished to, the SEC. You can access the Company’s reports and amendments to those reports filed or furnished to the SEC pursuant to Section 13(a) or 15(d) of the Exchange Act in the “Investor Relations” section on the Company’s website (www.chironre.com) under “SEC Filings” as soon as reasonably practicable after they are filed with, or furnished to, the SEC. The information on or connected to the Company’s website is not, and shall not be deemed to be, a part of, or incorporated into, this Earnings Supplemental. You also can review these SEC filings and other information by accessing the SEC’s website at http://www.sec.gov. Certain information contained in this package, including, but not limited to, information contained in our key tenants profiles is derived from publicly-available third-party sources. The Company has not independently verified this information and there can be no assurance that such information is accurate or complete. |