| Building For The Future February 2026 |

| Chiron (KAI-ron)—the wisest of all centaurs—was the Greek mythological father of medicine and the original architect of medical education. We aspire to uphold this tradition of stewardship by living our mission of delivering value at the intersection of care, capital, and real estate. 2 Our New Identity |
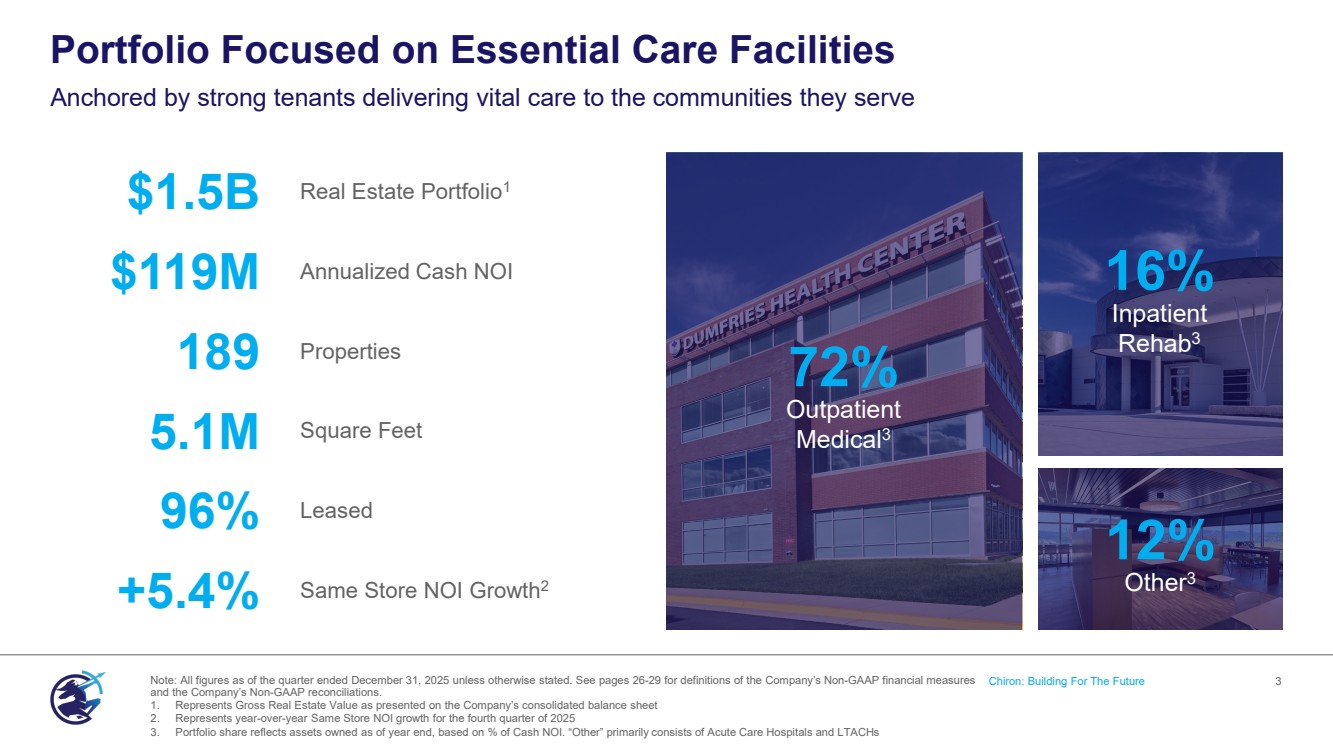
| Portfolio Focused on Essential Care Facilities Anchored by strong tenants delivering vital care to the communities they serve Note: All figures as of the quarter ended December 31, 2025 unless otherwise stated. See pages 26-29 for definitions of the Company’s Non-GAAP financial measures Chiron: Building For The Future 3 and the Company’s Non-GAAP reconciliations. 1. Represents Gross Real Estate Value as presented on the Company’s consolidated balance sheet 2. Represents year-over-year Same Store NOI growth for the fourth quarter of 2025 3. Portfolio share reflects assets owned as of year end, based on % of Cash NOI. “Other” primarily consists of Acute Care Hospitals and LTACHs $1.5B Real Estate Portfolio1 $119M Annualized Cash NOI 189 Properties 5.1M Square Feet 96% Leased +5.4% Same Store NOI Growth2 12% Other3 16% Inpatient Rehab3 72% Outpatient Medical3 |
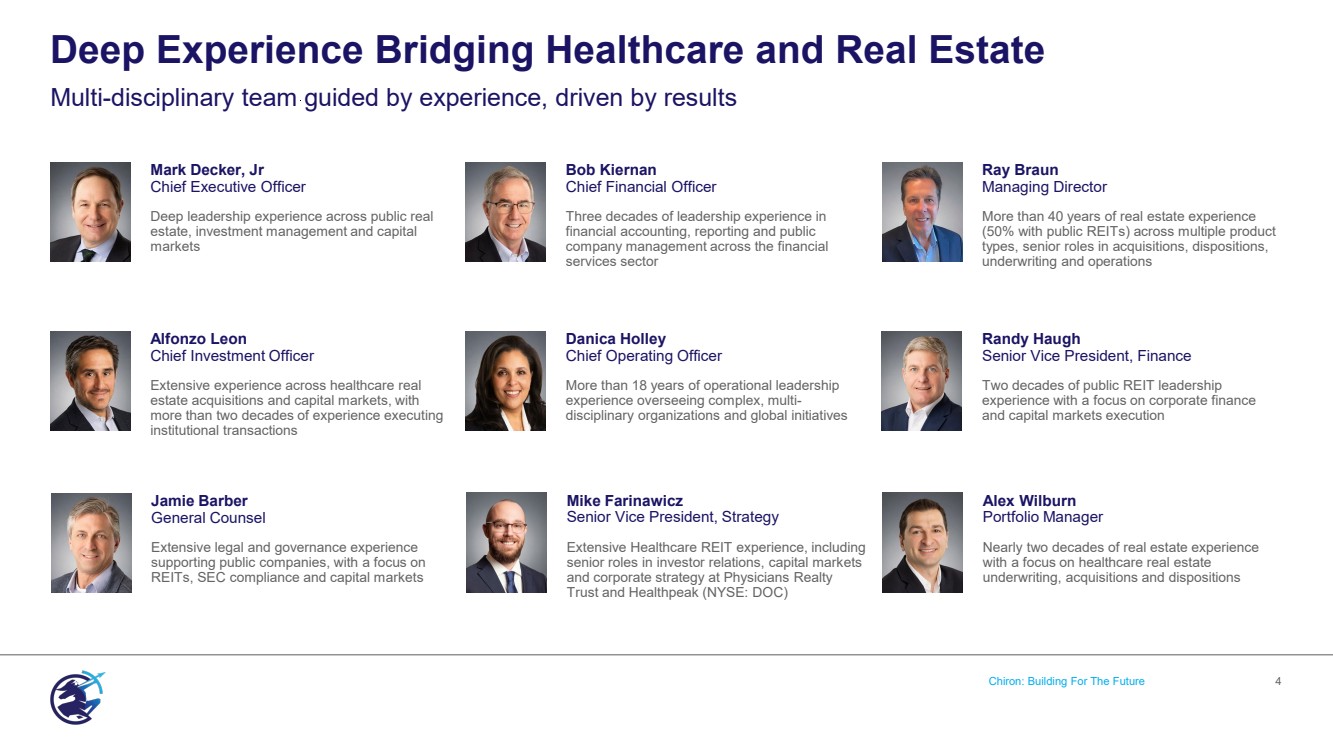
| Chiron: Building For The Future 4 Deep Experience Bridging Healthcare and Real Estate Multi-disciplinary team guided by experience, driven by results Mark Decker, Jr Chief Executive Officer Deep leadership experience across public real estate, investment management and capital markets Alfonzo Leon Chief Investment Officer Extensive experience across healthcare real estate acquisitions and capital markets, with more than two decades of experience executing institutional transactions Jamie Barber General Counsel Extensive legal and governance experience supporting public companies, with a focus on REITs, SEC compliance and capital markets Ray Braun Managing Director More than 40 years of real estate experience (50% with public REITs) across multiple product types, senior roles in acquisitions, dispositions, underwriting and operations Randy Haugh Senior Vice President, Finance Two decades of public REIT leadership experience with a focus on corporate finance and capital markets execution Alex Wilburn Portfolio Manager Nearly two decades of real estate experience with a focus on healthcare real estate underwriting, acquisitions and dispositions Bob Kiernan Chief Financial Officer Three decades of leadership experience in financial accounting, reporting and public company management across the financial services sector Danica Holley Chief Operating Officer More than 18 years of operational leadership experience overseeing complex, multi-disciplinary organizations and global initiatives Mike Farinawicz Senior Vice President, Strategy Extensive Healthcare REIT experience, including senior roles in investor relations, capital markets and corporate strategy at Physicians Realty Trust and Healthpeak (NYSE: DOC) |
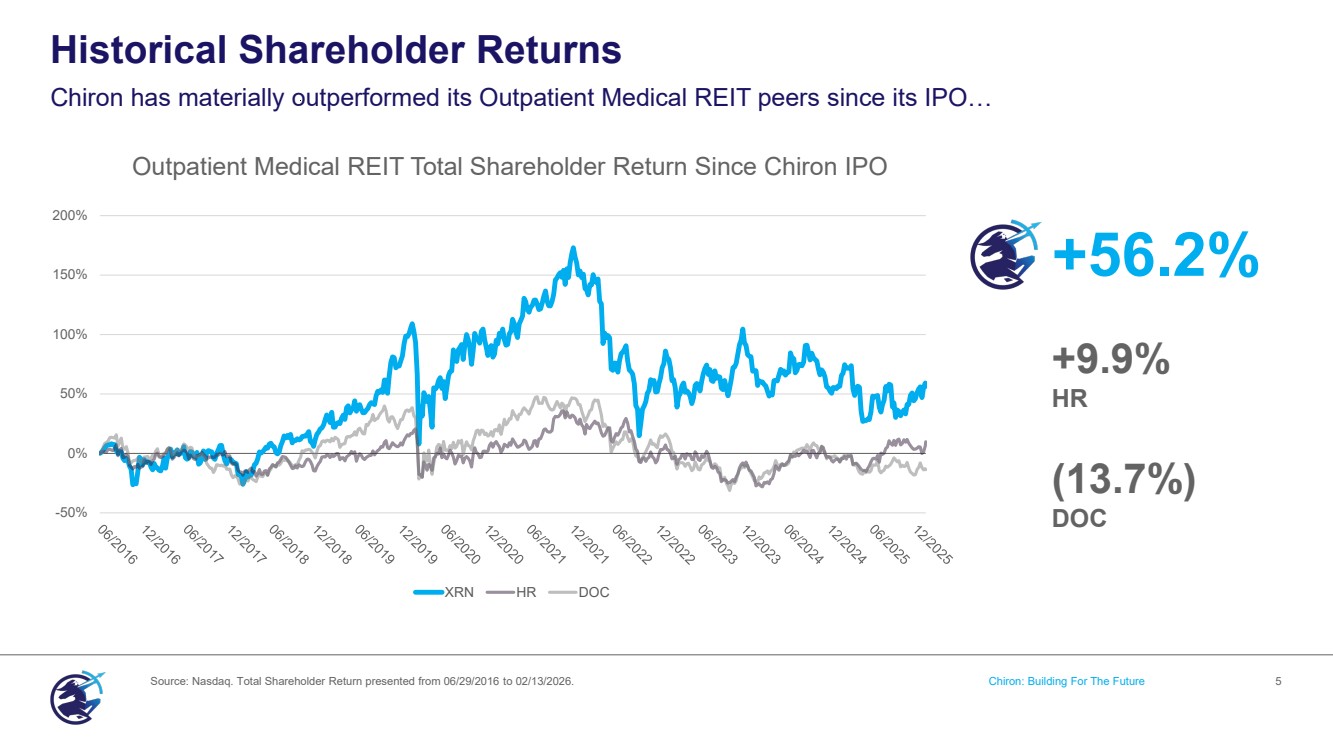
| +56.2% +9.9% HR (13.7%) DOC Historical Shareholder Returns Chiron has materially outperformed its Outpatient Medical REIT peers since its IPO… Source: Nasdaq. Total Shareholder Return presented from 06/29/2016 to 02/13/2026. Chiron: Building For The Future 5 -50% 0% 50% 100% 150% 200% XRN HR DOC Outpatient Medical REIT Total Shareholder Return Since Chiron IPO |
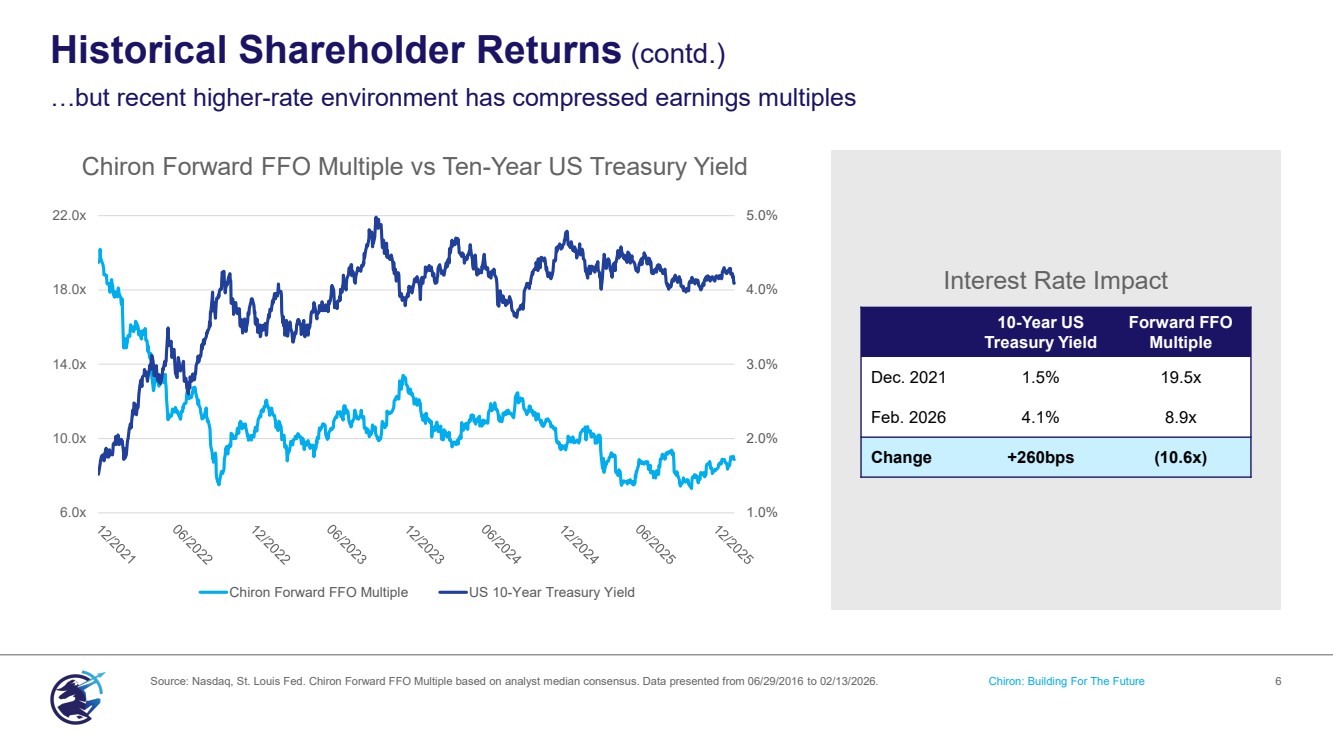
| ` Historical Shareholder Returns (contd.) …but recent higher-rate environment has compressed earnings multiples Source: Nasdaq, St. Louis Fed. Chiron Forward FFO Multiple based on analyst median consensus. Data presented from 06/29/2016 to 02/13/2026. Chiron: Building For The Future 6 1.0% 2.0% 3.0% 4.0% 5.0% 6.0x 10.0x 14.0x 18.0x 22.0x Chiron Forward FFO Multiple US 10-Year Treasury Yield Chiron Forward FFO Multiple vs Ten-Year US Treasury Yield Interest Rate Impact 10-Year US Treasury Yield Forward FFO Multiple Dec. 2021 1.5% 19.5x Feb. 2026 4.1% 8.9x Change +260bps (10.6x) |
| Where We Stand Chiron: Building For The Future 7 PAM Rehabilitation Hospital Surprise, Arizona |
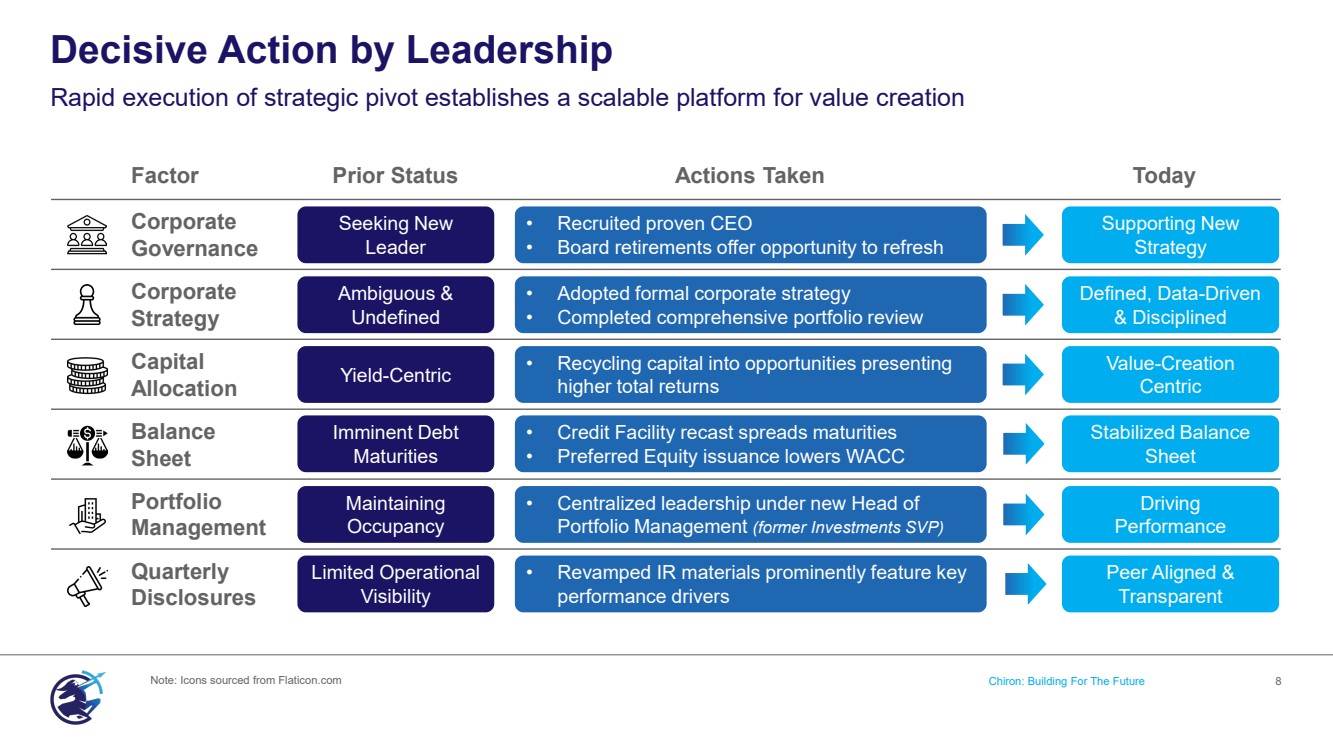
| Decisive Action by Leadership Rapid execution of strategic pivot establishes a scalable platform for value creation Note: Icons sourced from Flaticon.com Chiron: Building For The Future 8 Factor Prior Status Actions Taken Today Corporate Governance Corporate Strategy Capital Allocation Balance Sheet Portfolio Management Quarterly Disclosures Ambiguous & Undefined Yield-Centric Imminent Debt Maturities Maintaining Occupancy Limited Operational Visibility Defined, Data-Driven & Disciplined Value-Creation Centric Stabilized Balance Sheet Driving Performance Peer Aligned & Transparent • Adopted formal corporate strategy • Completed comprehensive portfolio review • Recycling capital into opportunities presenting higher total returns • Credit Facility recast spreads maturities • Preferred Equity issuance lowers WACC • Centralized leadership under new Head of Portfolio Management (former Investments SVP) • Revamped IR materials prominently feature key performance drivers Seeking New Leader Supporting New Strategy • Recruited proven CEO • Board retirements offer opportunity to refresh |
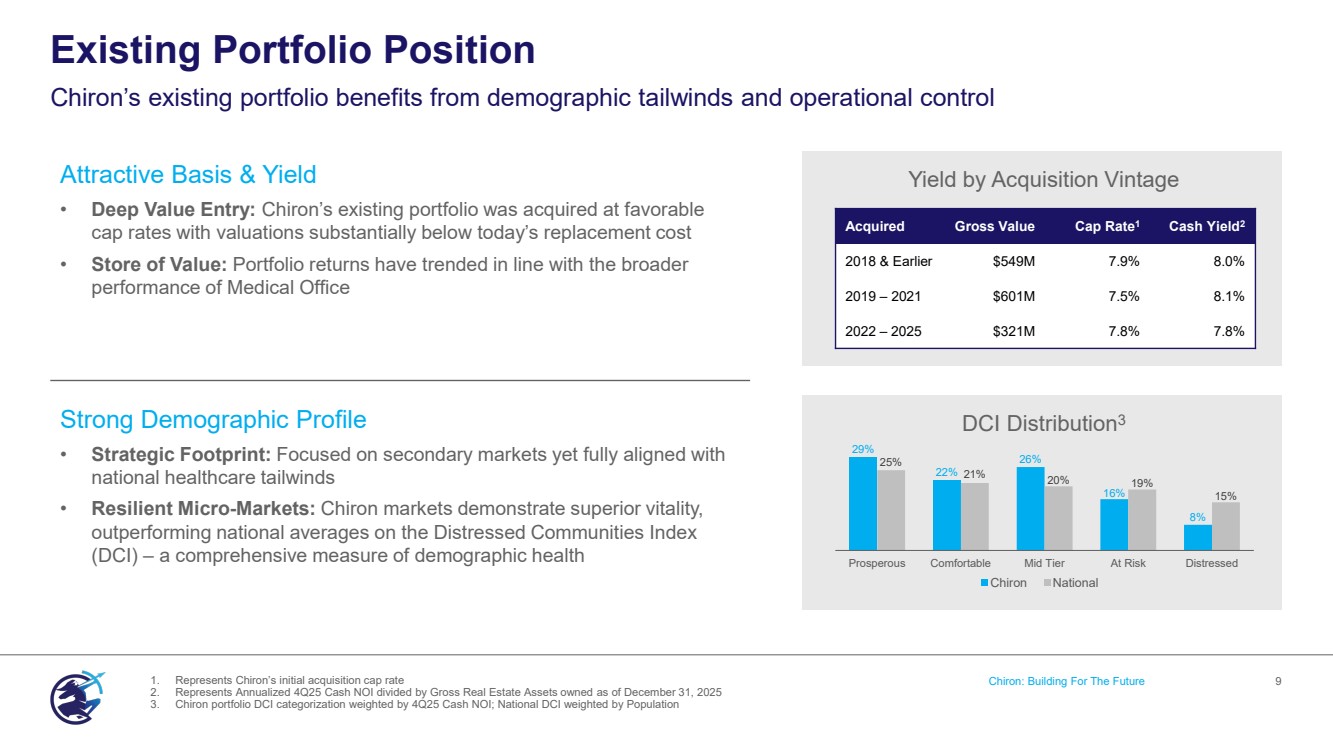
| ` ` Attractive Basis & Yield • Deep Value Entry: Chiron’s existing portfolio was acquired at favorable cap rates with valuations substantially below today’s replacement cost • Store of Value: Portfolio returns have trended in line with the broader performance of Medical Office Strong Demographic Profile • Strategic Footprint: Focused on secondary markets yet fully aligned with national healthcare tailwinds • Resilient Micro-Markets: Chiron markets demonstrate superior vitality, outperforming national averages on the Distressed Communities Index (DCI) – a comprehensive measure of demographic health Existing Portfolio Position Chiron’s existing portfolio benefits from demographic tailwinds and operational control 1. Represents Chiron’s initial acquisition cap rate Chiron: Building For The Future 9 2. Represents Annualized 4Q25 Cash NOI divided by Gross Real Estate Assets owned as of December 31, 2025 3. Chiron portfolio DCI categorization weighted by 4Q25 Cash NOI; National DCI weighted by Population Acquired Gross Value Cap Rate1 Cash Yield2 2018 & Earlier $549M 7.9% 8.0% 2019 – 2021 $601M 7.5% 8.1% 2022 – 2025 $321M 7.8% 7.8% 29% 22% 26% 16% 8% 25% 21% 20% 19% 15% Prosperous Comfortable Mid Tier At Risk Distressed Chiron National Yield by Acquisition Vintage DCI Distribution3 |
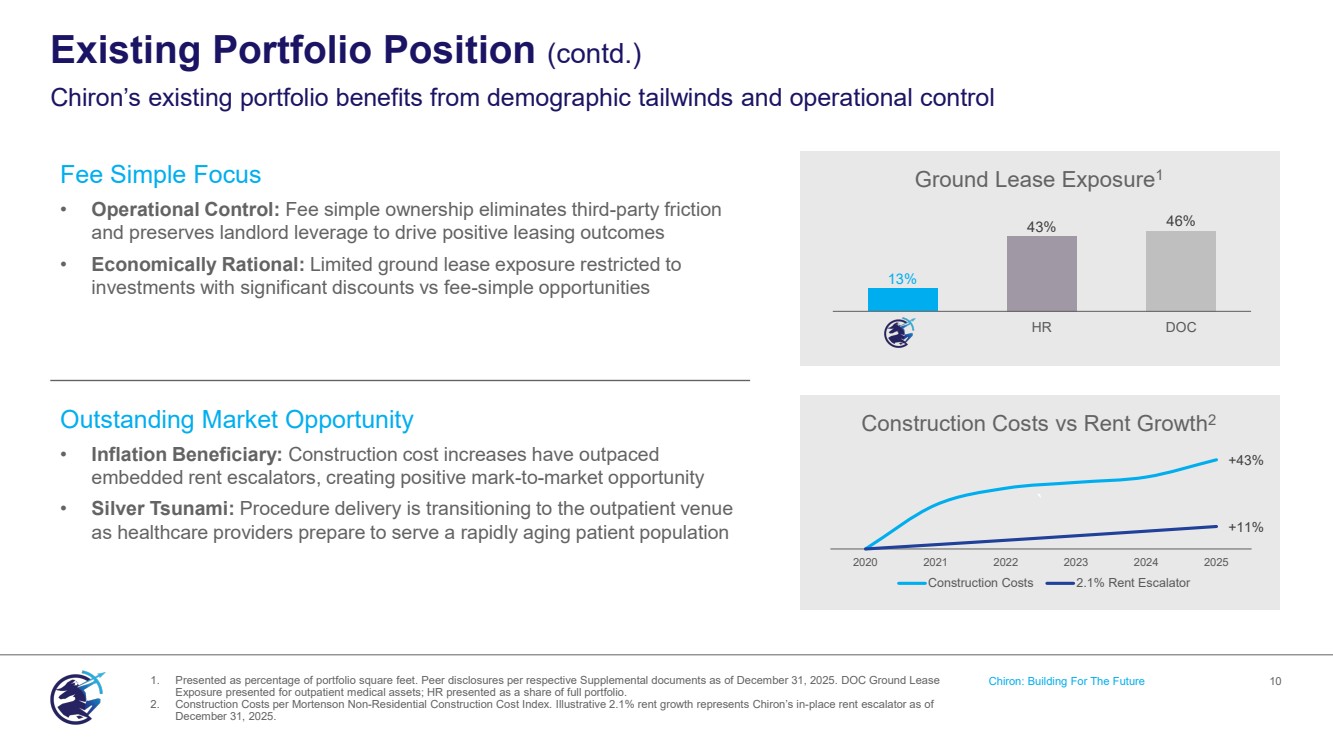
| ` 13% 43% 46% HR DOC ` Ground Lease Exposure1 Construction Costs vs Rent Growth2 Fee Simple Focus • Operational Control: Fee simple ownership eliminates third-party friction and preserves landlord leverage to drive positive leasing outcomes • Economically Rational: Limited ground lease exposure restricted to investments with significant discounts vs fee-simple opportunities Outstanding Market Opportunity • Inflation Beneficiary: Construction cost increases have outpaced embedded rent escalators, creating positive mark-to-market opportunity • Silver Tsunami: Procedure delivery is transitioning to the outpatient venue as healthcare providers prepare to serve a rapidly aging patient population +43% +11% 2020 2021 2022 2023 2024 2025 Construction Costs 2.1% Rent Escalator Existing Portfolio Position (contd.) Chiron’s existing portfolio benefits from demographic tailwinds and operational control 1. Presented as percentage of portfolio square feet. Peer disclosures per respective Supplemental documents as of December 31, 2025. DOC Ground Lease Chiron: Building For The Future 10 Exposure presented for outpatient medical assets; HR presented as a share of full portfolio. 2. Construction Costs per Mortenson Non-Residential Construction Cost Index. Illustrative 2.1% rent growth represents Chiron’s in-place rent escalator as of December 31, 2025. |
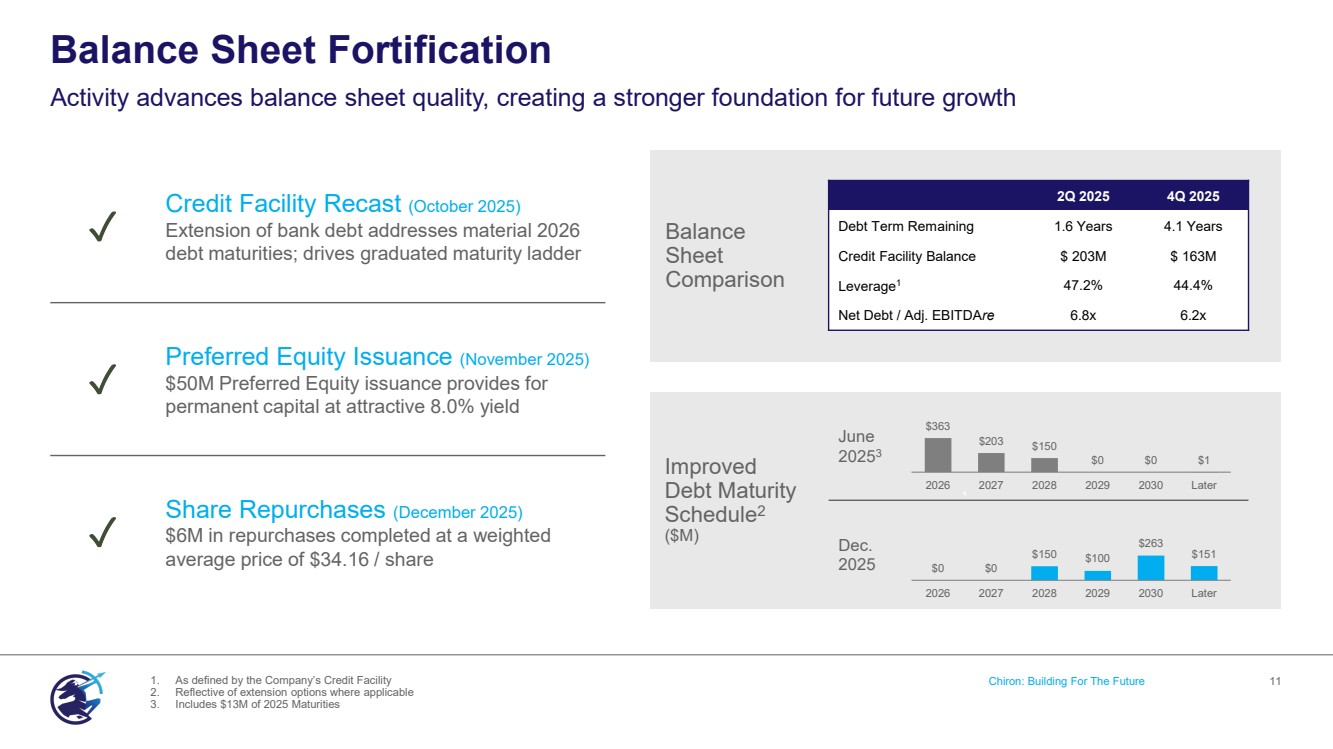
| ` June 20253 Dec. 2025 ` Balance Sheet Fortification Activity advances balance sheet quality, creating a stronger foundation for future growth 1. As defined by the Company’s Credit Facility Chiron: Building For The Future 11 2. Reflective of extension options where applicable 3. Includes $13M of 2025 Maturities ✓ Credit Facility Recast (October 2025) Extension of bank debt addresses material 2026 debt maturities; drives graduated maturity ladder ✓ Preferred Equity Issuance (November 2025) $50M Preferred Equity issuance provides for permanent capital at attractive 8.0% yield ✓ Share Repurchases (December 2025) $6M in repurchases completed at a weighted average price of $34.16 / share Balance Sheet Comparison 2Q 2025 4Q 2025 Debt Term Remaining 1.6 Years 4.1 Years Credit Facility Balance $ 203M $ 163M Leverage1 47.2% 44.4% Net Debt / Adj. EBITDAre 6.8x 6.2x Improved Debt Maturity Schedule2 ($M) $363 $203 $150 $0 $0 $1 2026 2027 2028 2029 2030 Later $0 $0 $150 $100 $263 $151 2026 2027 2028 2029 2030 Later |
| 12 The Way Forward Chiron: Building For The Future Mission Health MOB Livonia, Michigan |
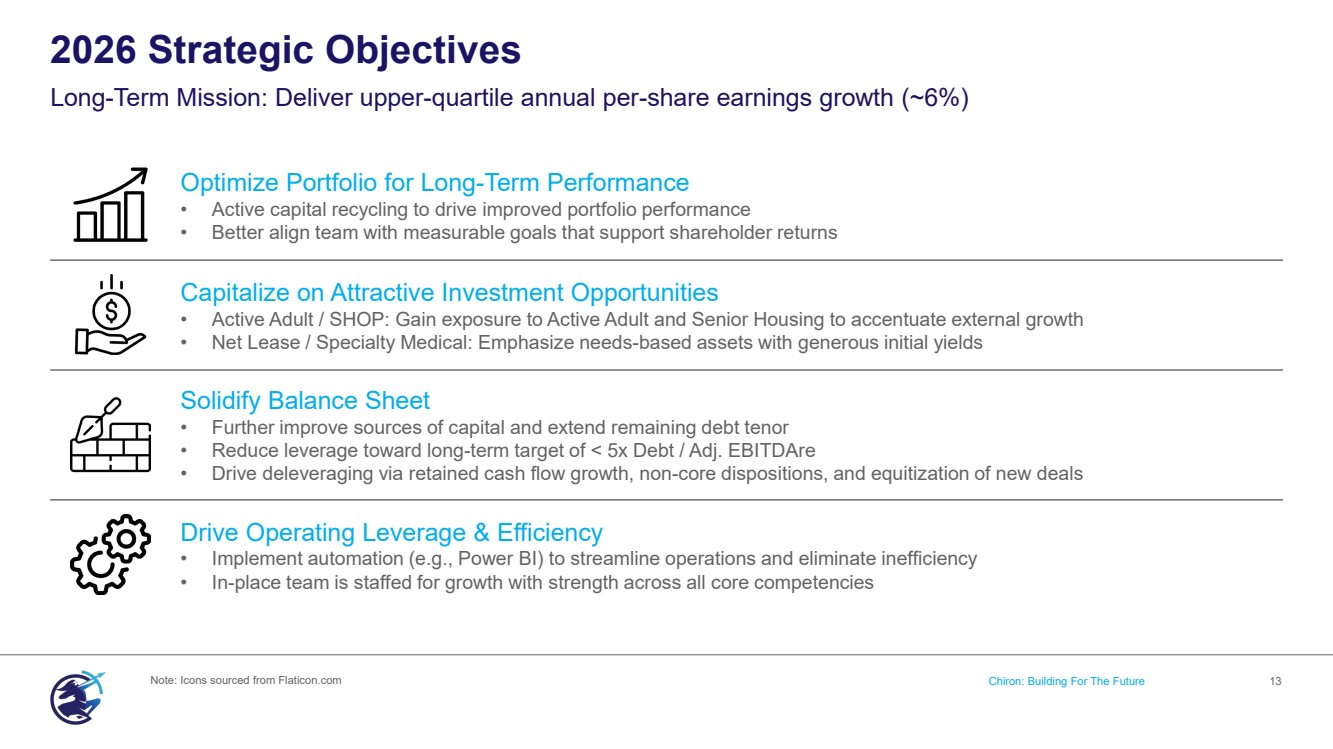
| Optimize Portfolio for Long-Term Performance • Active capital recycling to drive improved portfolio performance • Better align team with measurable goals that support shareholder returns Capitalize on Attractive Investment Opportunities • Active Adult / SHOP: Gain exposure to Active Adult and Senior Housing to accentuate external growth • Net Lease / Specialty Medical: Emphasize needs-based assets with generous initial yields Solidify Balance Sheet • Further improve sources of capital and extend remaining debt tenor • Reduce leverage toward long-term target of < 5x Debt / Adj. EBITDAre • Drive deleveraging via retained cash flow growth, non-core dispositions, and equitization of new deals Drive Operating Leverage & Efficiency • Implement automation (e.g., Power BI) to streamline operations and eliminate inefficiency • In-place team is staffed for growth with strength across all core competencies 2026 Strategic Objectives Long-Term Mission: Deliver upper-quartile annual per-share earnings growth (~6%) Note: Icons sourced from Flaticon.com Chiron: Building For The Future 13 |
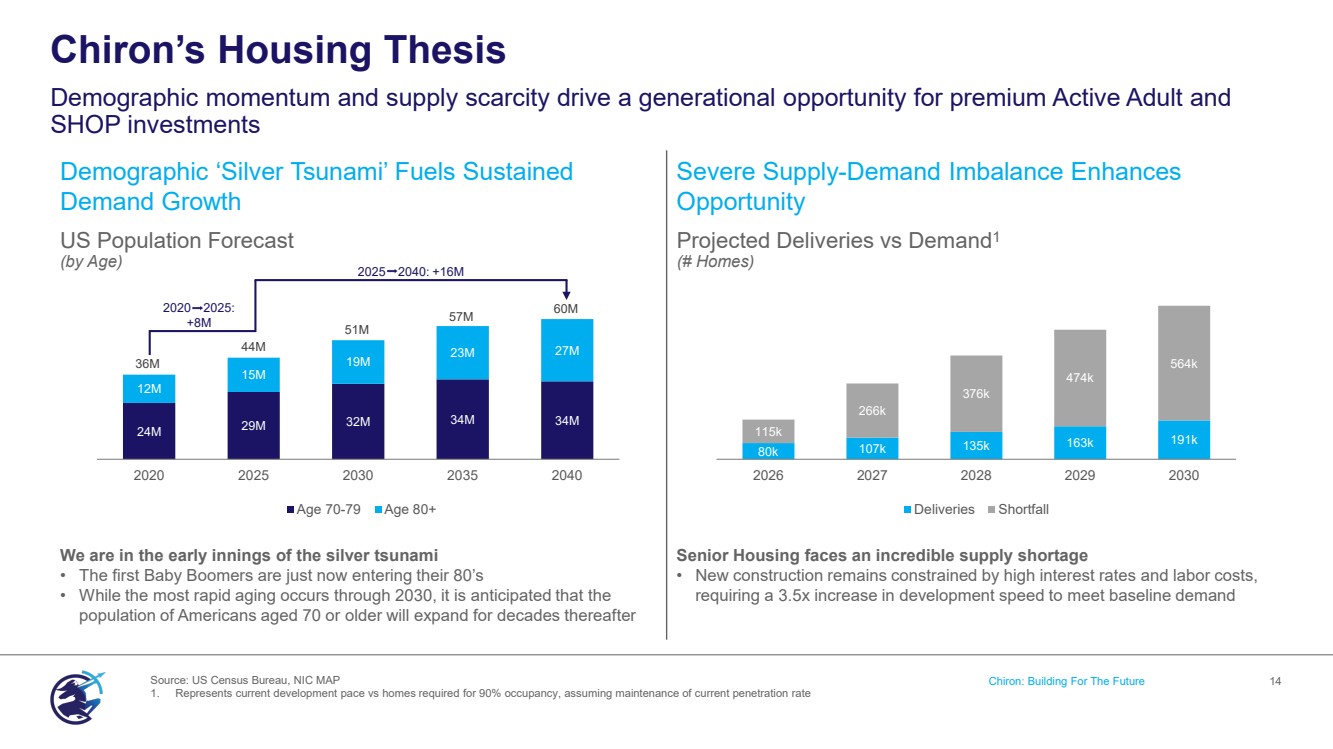
| Demographic ‘Silver Tsunami’ Fuels Sustained Demand Growth Severe Supply-Demand Imbalance Enhances Opportunity We are in the early innings of the silver tsunami • The first Baby Boomers are just now entering their 80’s • While the most rapid aging occurs through 2030, it is anticipated that the population of Americans aged 70 or older will expand for decades thereafter Senior Housing faces an incredible supply shortage • New construction remains constrained by high interest rates and labor costs, requiring a 3.5x increase in development speed to meet baseline demand 24M 29M 32M 34M 34M 12M 15M 19M 23M 27M 36M 44M 51M 57M 60M 2020 2025 2030 2035 2040 Age 70-79 Age 80+ Chiron’s Housing Thesis Demographic momentum and supply scarcity drive a generational opportunity for premium Active Adult and SHOP investments Chiron: Building For The Future 14 US Population Forecast (by Age) Projected Deliveries vs Demand1 (# Homes) 80k 107k 135k 163k 191k 115k 266k 376k 474k 564k 2026 2027 2028 2029 2030 Deliveries Shortfall Source: US Census Bureau, NIC MAP 1. Represents current development pace vs homes required for 90% occupancy, assuming maintenance of current penetration rate 2020 2025: +8M 2025 2040: +16M |
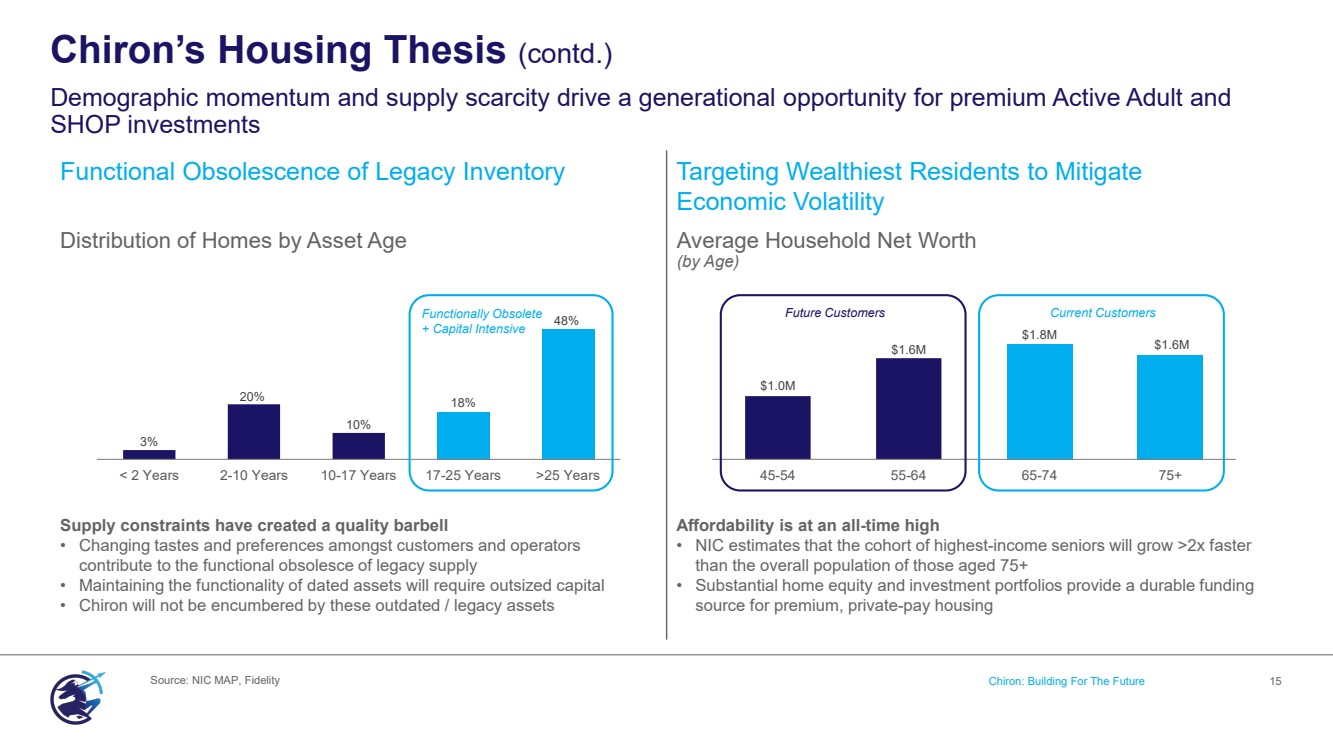
| Functional Obsolescence of Legacy Inventory Targeting Wealthiest Residents to Mitigate Economic Volatility Supply constraints have created a quality barbell • Changing tastes and preferences amongst customers and operators contribute to the functional obsolesce of legacy supply • Maintaining the functionality of dated assets will require outsized capital • Chiron will not be encumbered by these outdated / legacy assets Affordability is at an all-time high • NIC estimates that the cohort of highest-income seniors will grow >2x faster than the overall population of those aged 75+ • Substantial home equity and investment portfolios provide a durable funding source for premium, private-pay housing Chiron’s Housing Thesis (contd.) Demographic momentum and supply scarcity drive a generational opportunity for premium Active Adult and SHOP investments Chiron: Building For The Future 15 Distribution of Homes by Asset Age (by Age) Average Household Net Worth (by Age) Source: NIC MAP, Fidelity $1.0M $1.6M $1.8M $1.6M 45-54 55-64 65-74 75+ Future Customers Current Customers 3% 20% 10% 18% 48% < 2 Years 2-10 Years 10-17 Years 17-25 Years >25 Years Functionally Obsolete + Capital Intensive |
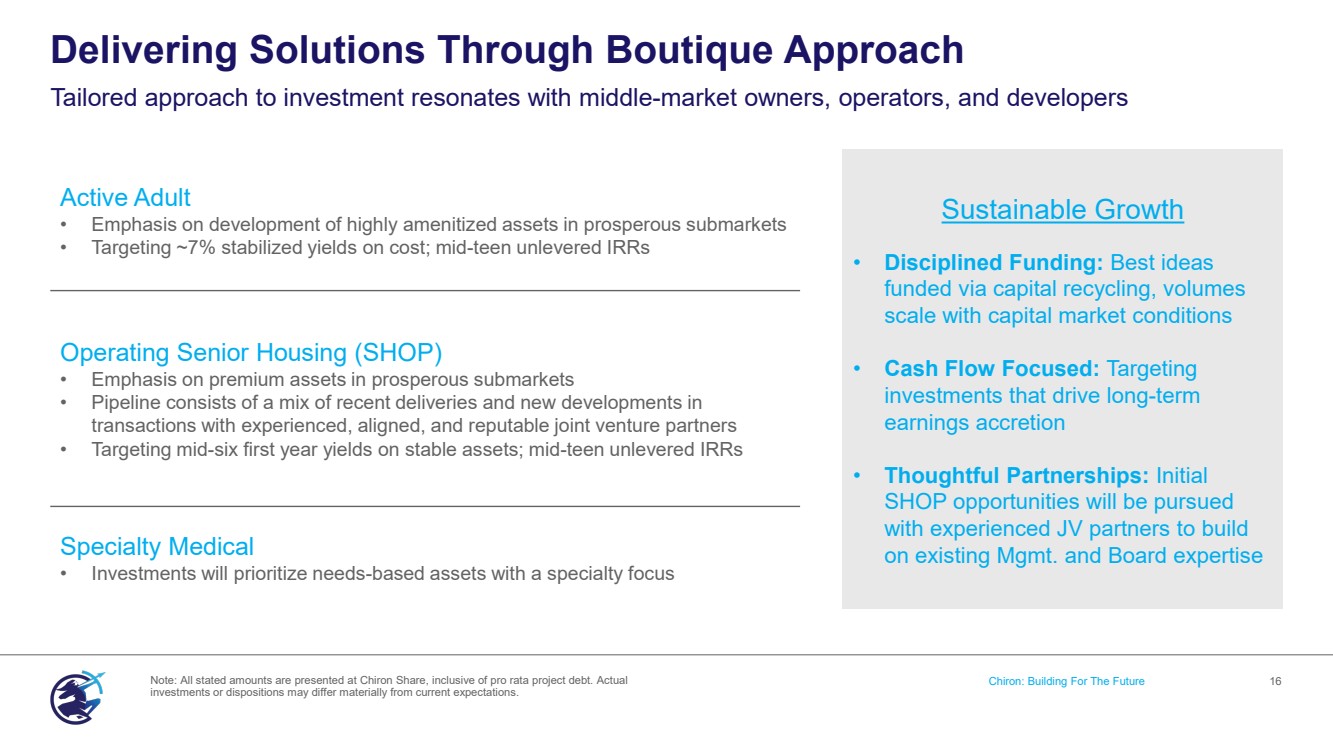
| ` Sustainable Growth • Disciplined Funding: Best ideas funded via capital recycling, volumes scale with capital market conditions • Cash Flow Focused: Targeting investments that drive long-term earnings accretion • Thoughtful Partnerships: Initial SHOP opportunities will be pursued with experienced JV partners to build on existing Mgmt. and Board expertise Delivering Solutions Through Boutique Approach Tailored approach to investment resonates with middle-market owners, operators, and developers Note: All stated amounts are presented at Chiron Share, inclusive of pro rata project debt. Actual Chiron: Building For The Future 16 investments or dispositions may differ materially from current expectations. Active Adult • Emphasis on development of highly amenitized assets in prosperous submarkets • Targeting ~7% stabilized yields on cost; mid-teen unlevered IRRs Operating Senior Housing (SHOP) • Emphasis on premium assets in prosperous submarkets • Pipeline consists of a mix of recent deliveries and new developments in transactions with experienced, aligned, and reputable joint venture partners • Targeting mid-six first year yields on stable assets; mid-teen unlevered IRRs Specialty Medical • Investments will prioritize needs-based assets with a specialty focus |
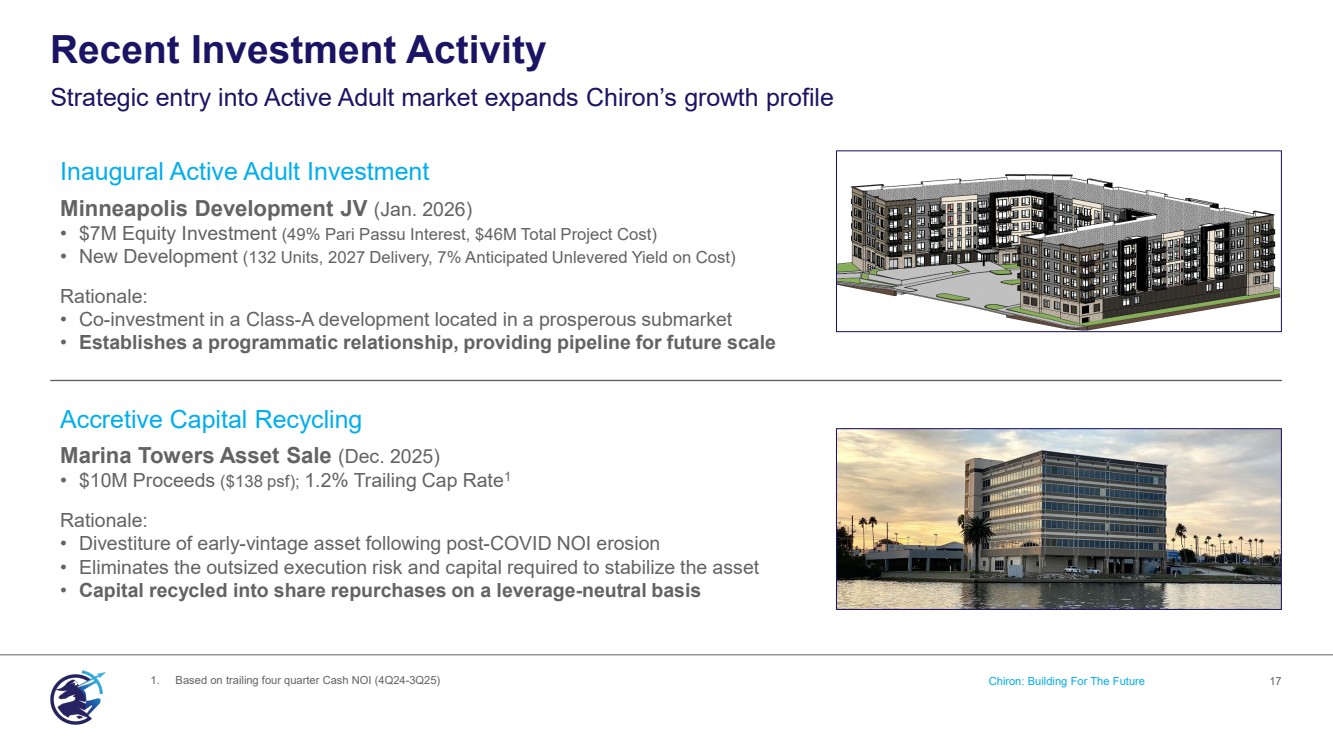
| Inaugural Active Adult Investment Minneapolis Development JV (Jan. 2026) • $7M Equity Investment (49% Pari Passu Interest, $46M Total Project Cost) • New Development (132 Units, 2027 Delivery, 7% Anticipated Unlevered Yield on Cost) Rationale: • Co-investment in a Class-A development located in a prosperous submarket • Establishes a programmatic relationship, providing pipeline for future scale Accretive Capital Recycling Marina Towers Asset Sale (Dec. 2025) • $10M Proceeds ($138 psf); 1.2% Trailing Cap Rate1 Rationale: • Divestiture of early-vintage asset following post-COVID NOI erosion • Eliminates the outsized execution risk and capital required to stabilize the asset • Capital recycled into share repurchases on a leverage-neutral basis Recent Investment Activity Strategic entry into Active Adult market expands Chiron’s growth profile 1. Based on trailing four quarter Cash NOI (4Q24-3Q25) Chiron: Building For The Future 17 |
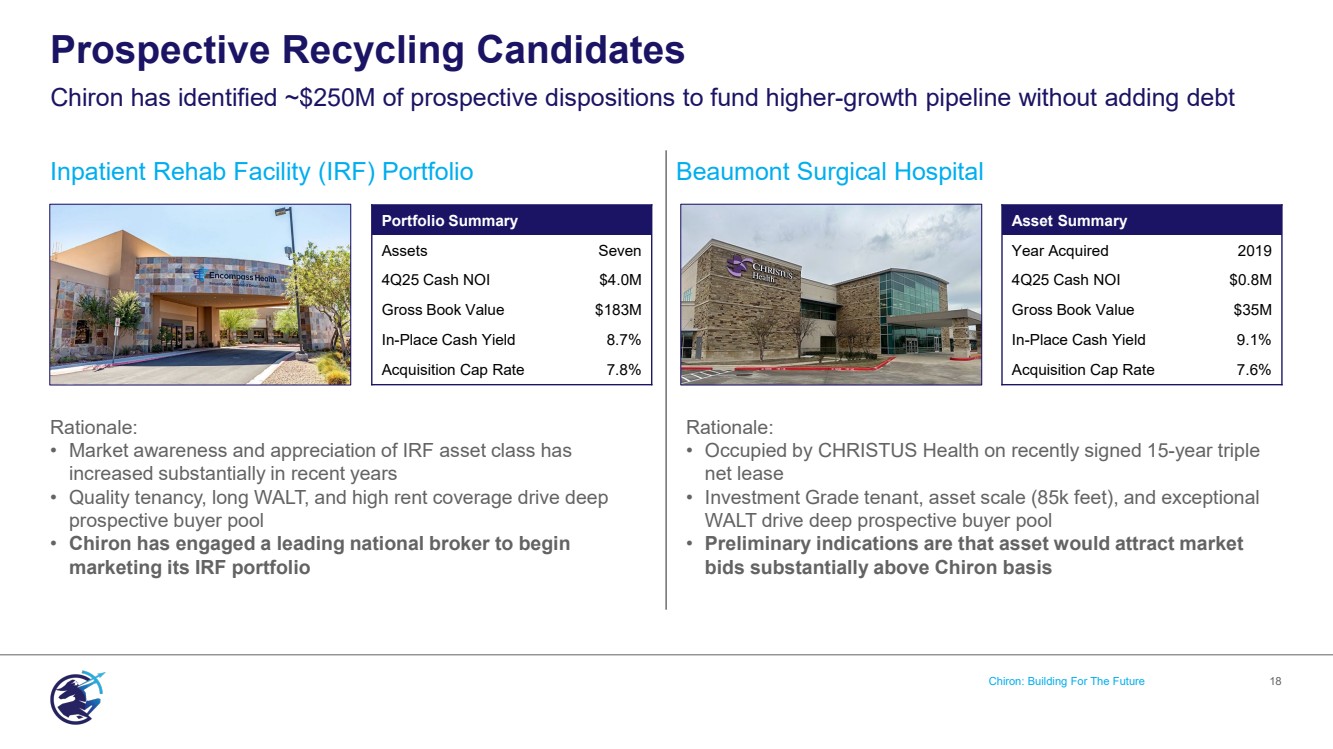
| Inpatient Rehab Facility (IRF) Portfolio Beaumont Surgical Hospital Rationale: • Market awareness and appreciation of IRF asset class has increased substantially in recent years • Quality tenancy, long WALT, and high rent coverage drive deep prospective buyer pool • Chiron has engaged a leading national broker to begin marketing its IRF portfolio Rationale: • Occupied by CHRISTUS Health on recently signed 15-year triple net lease • Investment Grade tenant, asset scale (85k feet), and exceptional WALT drive deep prospective buyer pool • Preliminary indications are that asset would attract market bids substantially above Chiron basis Prospective Recycling Candidates Chiron has identified ~$250M of prospective dispositions to fund higher-growth pipeline without adding debt Chiron: Building For The Future 18 Portfolio Summary Assets Seven 4Q25 Cash NOI $4.0M Gross Book Value $183M In-Place Cash Yield 8.7% Acquisition Cap Rate 7.8% Asset Summary Year Acquired 2019 4Q25 Cash NOI $0.8M Gross Book Value $35M In-Place Cash Yield 9.1% Acquisition Cap Rate 7.6% |
| Chiron: Building For The Future 19 Conclusion Dumfries Health Center Dumfries, VA |
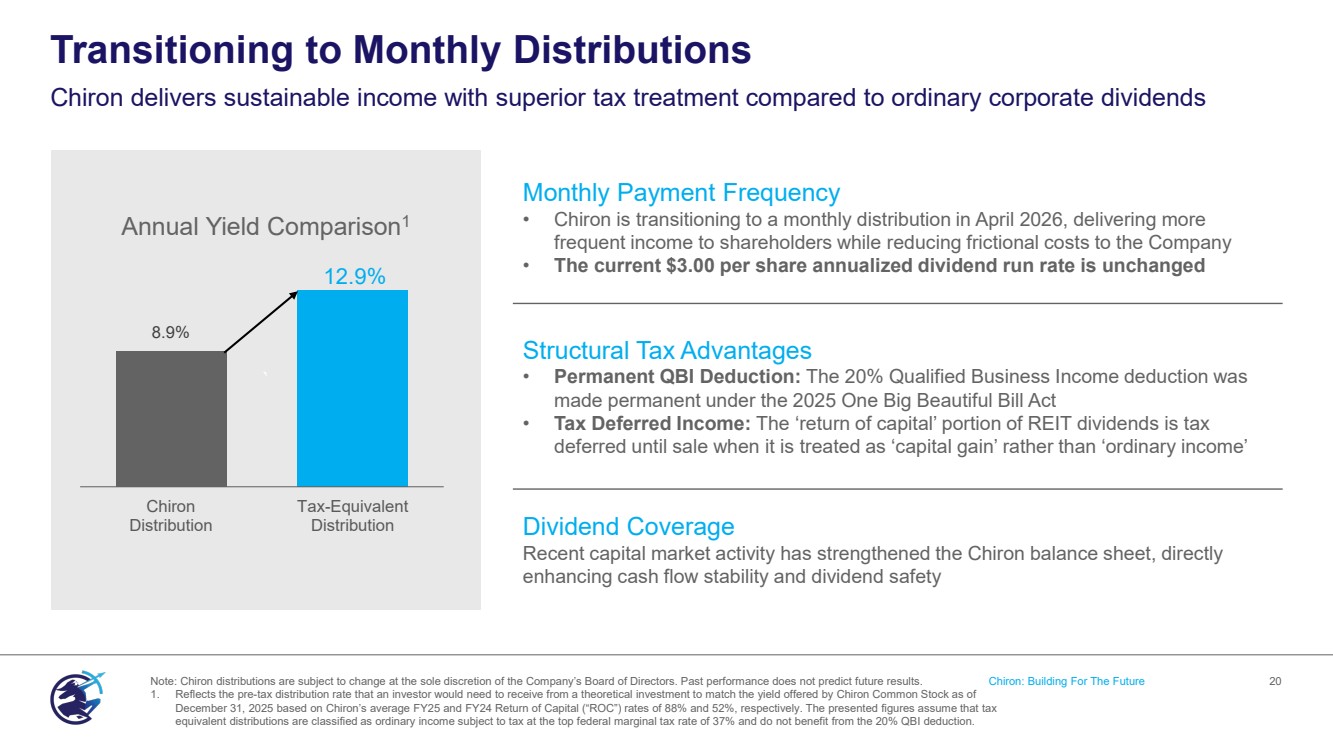
| ` Transitioning to Monthly Distributions Chiron delivers sustainable income with superior tax treatment compared to ordinary corporate dividends Note: Chiron distributions are subject to change at the sole discretion of the Company’s Board of Directors. Past performance does not predict future results. Chiron: Building For The Future 20 1. Reflects the pre-tax distribution rate that an investor would need to receive from a theoretical investment to match the yield offered by Chiron Common Stock as of December 31, 2025 based on Chiron’s average FY25 and FY24 Return of Capital (“ROC”) rates of 88% and 52%, respectively. The presented figures assume that tax equivalent distributions are classified as ordinary income subject to tax at the top federal marginal tax rate of 37% and do not benefit from the 20% QBI deduction. 8.9% 12.9% Chiron Distribution Tax-Equivalent Distribution Annual Yield Comparison1 Monthly Payment Frequency • Chiron is transitioning to a monthly distribution in April 2026, delivering more frequent income to shareholders while reducing frictional costs to the Company • The current $3.00 per share annualized dividend run rate is unchanged Structural Tax Advantages • Permanent QBI Deduction: The 20% Qualified Business Income deduction was made permanent under the 2025 One Big Beautiful Bill Act • Tax Deferred Income: The ‘return of capital’ portion of REIT dividends is tax deferred until sale when it is treated as ‘capital gain’ rather than ‘ordinary income’ Dividend Coverage Recent capital market activity has strengthened the Chiron balance sheet, directly enhancing cash flow stability and dividend safety |
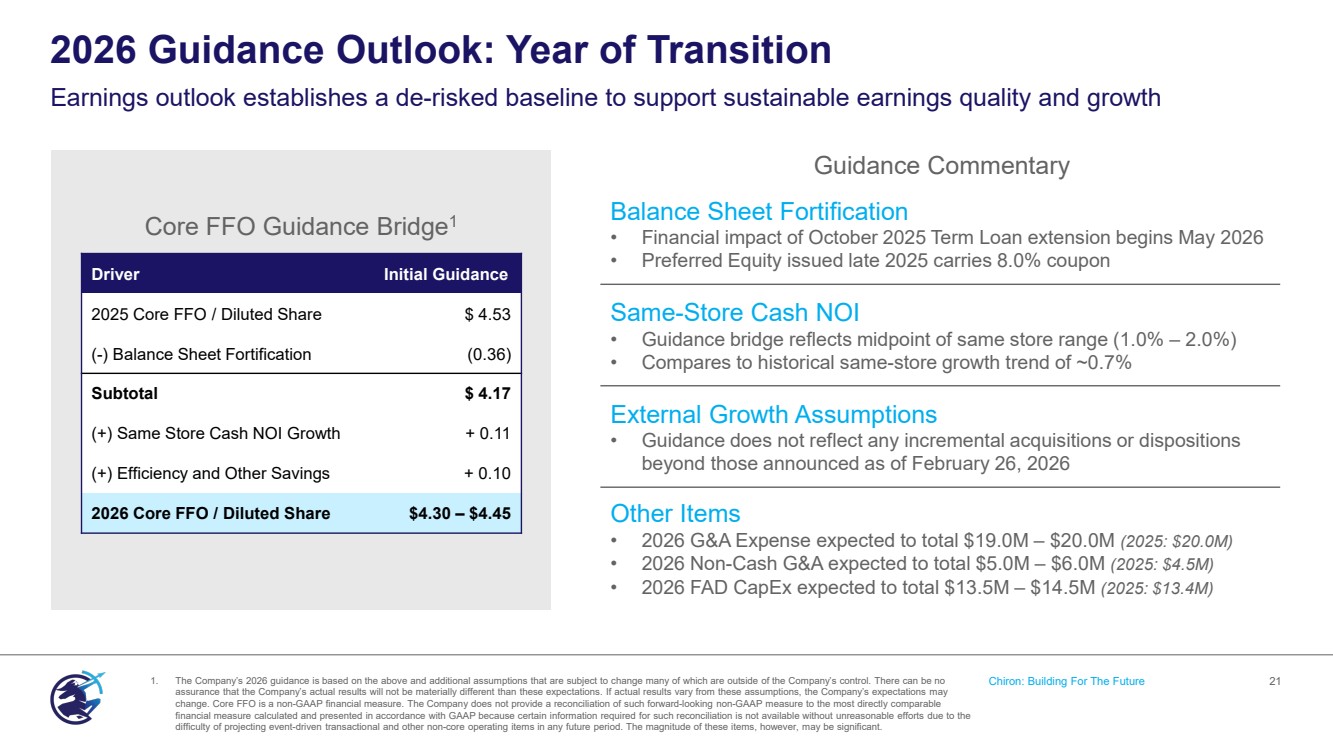
| ` 2026 Guidance Outlook: Year of Transition Chiron: Building For The Future 21 Earnings outlook establishes a de-risked baseline to support sustainable earnings quality and growth Balance Sheet Fortification • Financial impact of October 2025 Term Loan extension begins May 2026 • Preferred Equity issued late 2025 carries 8.0% coupon Same-Store Cash NOI • Guidance bridge reflects midpoint of same store range (1.0% – 2.0%) • Compares to historical same-store growth trend of ~0.7% External Growth Assumptions • Guidance does not reflect any incremental acquisitions or dispositions beyond those announced as of February 26, 2026 Other Items • 2026 G&A Expense expected to total $19.0M – $20.0M (2025: $20.0M) • 2026 Non-Cash G&A expected to total $5.0M – $6.0M (2025: $4.5M) • 2026 FAD CapEx expected to total $13.5M – $14.5M (2025: $13.4M) Guidance Commentary Driver Initial Guidance 2025 Core FFO / Diluted Share $ 4.53 (-) Balance Sheet Fortification (0.36) Subtotal $ 4.17 (+) Same Store Cash NOI Growth + 0.11 (+) Efficiency and Other Savings + 0.10 2026 Core FFO / Diluted Share $4.30 – $4.45 Core FFO Guidance Bridge1 1. The Company’s 2026 guidance is based on the above and additional assumptions that are subject to change many of which are outside of the Company’s control. There can be no assurance that the Company’s actual results will not be materially different than these expectations. If actual results vary from these assumptions, the Company’s expectations may change. Core FFO is a non-GAAP financial measure. The Company does not provide a reconciliation of such forward-looking non-GAAP measure to the most directly comparable financial measure calculated and presented in accordance with GAAP because certain information required for such reconciliation is not available without unreasonable efforts due to the difficulty of projecting event-driven transactional and other non-core operating items in any future period. The magnitude of these items, however, may be significant. |
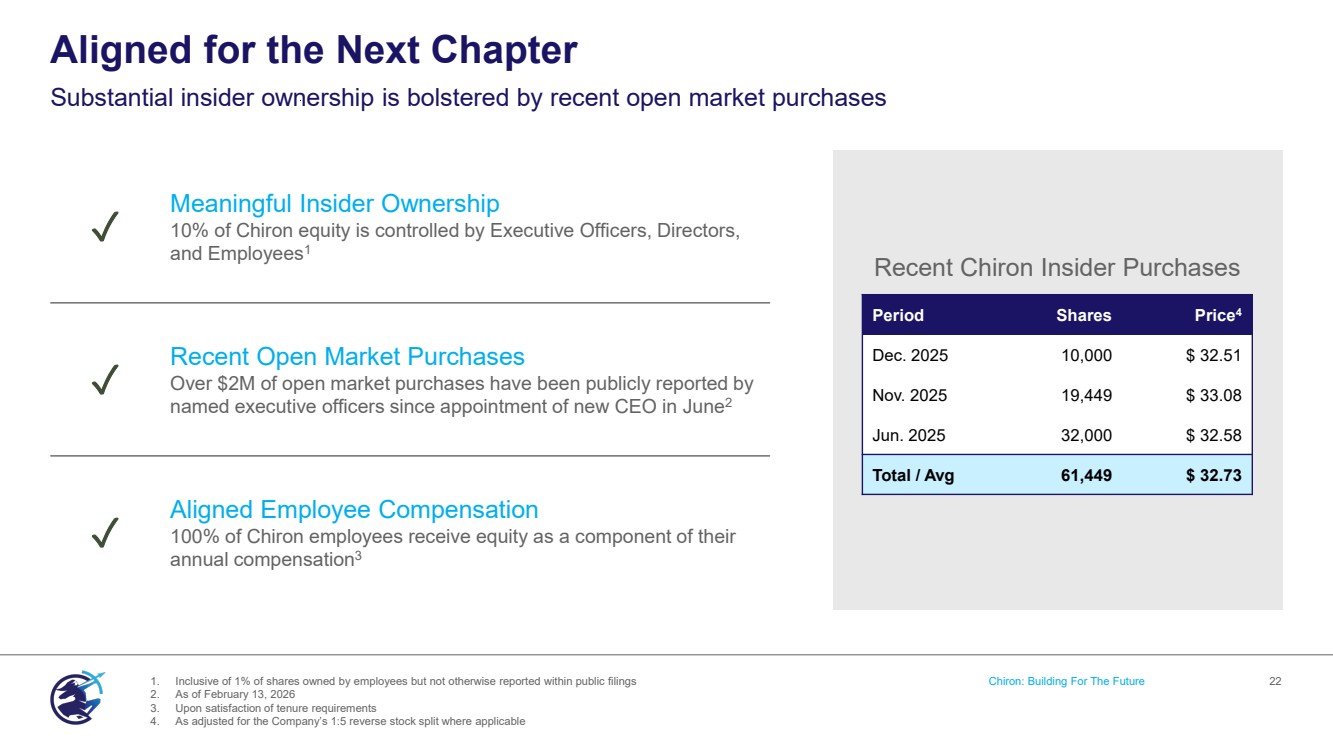
| Aligned for the Next Chapter Substantial insider ownership is bolstered by recent open market purchases 1. Inclusive of 1% of shares owned by employees but not otherwise reported within public filings Chiron: Building For The Future 22 2. As of February 13, 2026 3. Upon satisfaction of tenure requirements 4. As adjusted for the Company’s 1:5 reverse stock split where applicable ✓ Meaningful Insider Ownership 10% of Chiron equity is controlled by Executive Officers, Directors, and Employees1 ✓ Recent Open Market Purchases Over $2M of open market purchases have been publicly reported by named executive officers since appointment of new CEO in June2 ✓ Aligned Employee Compensation 100% of Chiron employees receive equity as a component of their annual compensation3 ` Recent Chiron Insider Purchases Period Shares Price4 Dec. 2025 10,000 $ 32.51 Nov. 2025 19,449 $ 33.08 Jun. 2025 32,000 $ 32.58 Total / Avg 61,449 $ 32.73 |
| Reconciliations & Legal |

| Certain statements contained in this presentation may be considered "forward-looking statements" within the meaning of the Private Securities Litigation Reform Act of 1995 and are intended to be protected by the safe harbor provisions thereof. Forward-looking statements are generally identifiable by the use of words such as ‘anticipate,’ ‘believe,’ ‘could,’ ‘estimate,’ ‘expect,’ ‘intend,’ ‘may,’ ‘plan,’ ‘project,’ ‘should,’ ‘will,’ or similar expressions. These statements include, without limitation, statements regarding future financial performance, cash flows, dividends, portfolio performance, capital allocation, acquisitions and dispositions, balance sheet strategy, investment pipeline, and strategic initiatives. Forward-looking statements are based on current expectations, estimates, and assumptions and are subject to risks and uncertainties that could cause actual results to differ materially. These risks include those described in the Company’s filings with the Securities and Exchange Commission. Readers are cautioned not to place undue reliance on forward-looking statements, which speak only as of the date of this presentation. The Company undertakes no obligation to update or revise any forward-looking statements. Forward-Looking Statements 24 |
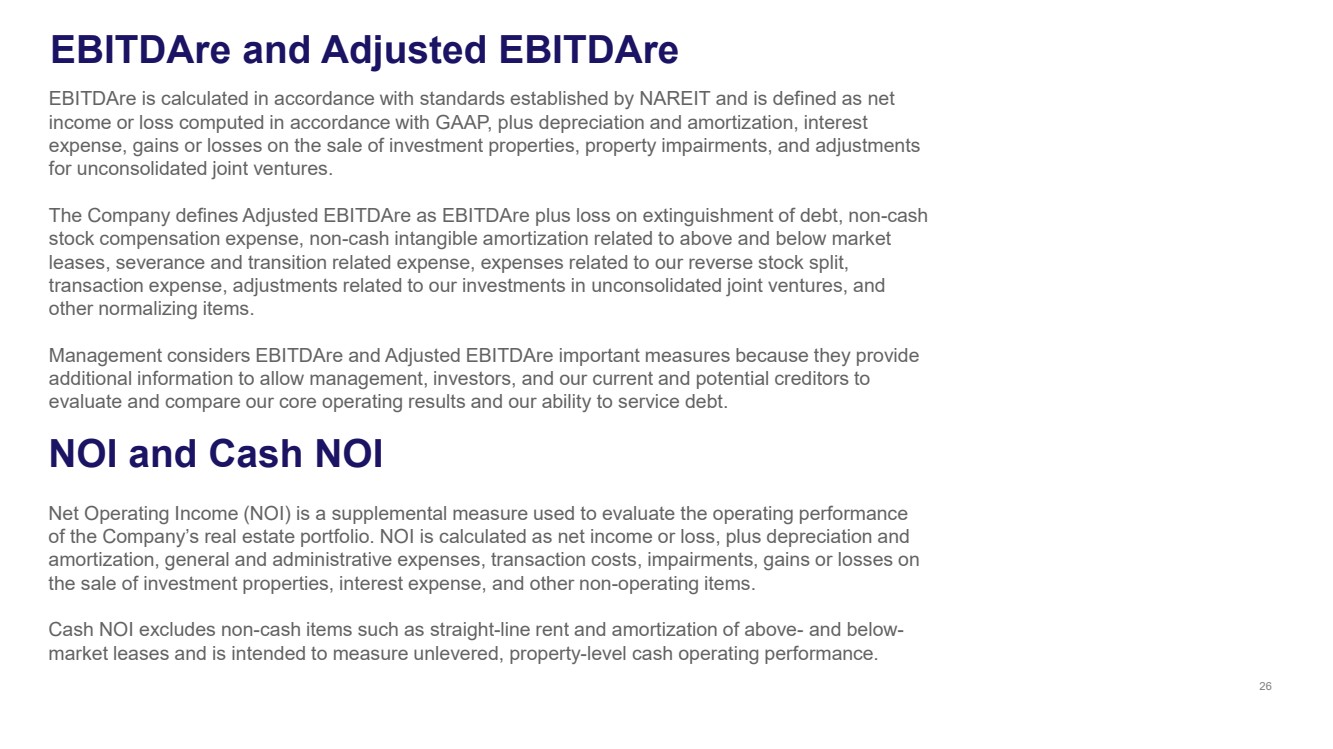
| Management believes certain non-GAAP financial measures provide useful supplemental information regarding the Company’s operating performance and financial condition. These measures are commonly used by management, investors, and industry analysts to evaluate REIT performance and facilitate period-over-period and peer comparisons. Chiron’s non-GAAP financial measures included in this presentation are EBITDAre, Adjusted EBITDAre, Net Operating Income (NOI) and Cash NOI. Non-GAAP financial measures are not intended to be alternatives to net income, cash flows from operating activities, or other measures prepared in accordance with GAAP. These measures may not be comparable to similarly titled measures reported by other companies and should be evaluated in conjunction with the Company’s consolidated financial statements. Non-GAAP Financial Measures 25 |
| EBITDAre is calculated in accordance with standards established by NAREIT and is defined as net income or loss computed in accordance with GAAP, plus depreciation and amortization, interest expense, gains or losses on the sale of investment properties, property impairments, and adjustments for unconsolidated joint ventures. The Company defines Adjusted EBITDAre as EBITDAre plus loss on extinguishment of debt, non-cash stock compensation expense, non-cash intangible amortization related to above and below market leases, severance and transition related expense, expenses related to our reverse stock split, transaction expense, adjustments related to our investments in unconsolidated joint ventures, and other normalizing items. Management considers EBITDAre and Adjusted EBITDAre important measures because they provide additional information to allow management, investors, and our current and potential creditors to evaluate and compare our core operating results and our ability to service debt. NOI and Cash NOI Net Operating Income (NOI) is a supplemental measure used to evaluate the operating performance of the Company’s real estate portfolio. NOI is calculated as net income or loss, plus depreciation and amortization, general and administrative expenses, transaction costs, impairments, gains or losses on the sale of investment properties, interest expense, and other non-operating items. Cash NOI excludes non-cash items such as straight-line rent and amortization of above- and below-market leases and is intended to measure unlevered, property-level cash operating performance. EBITDAre and Adjusted EBITDAre 26 |
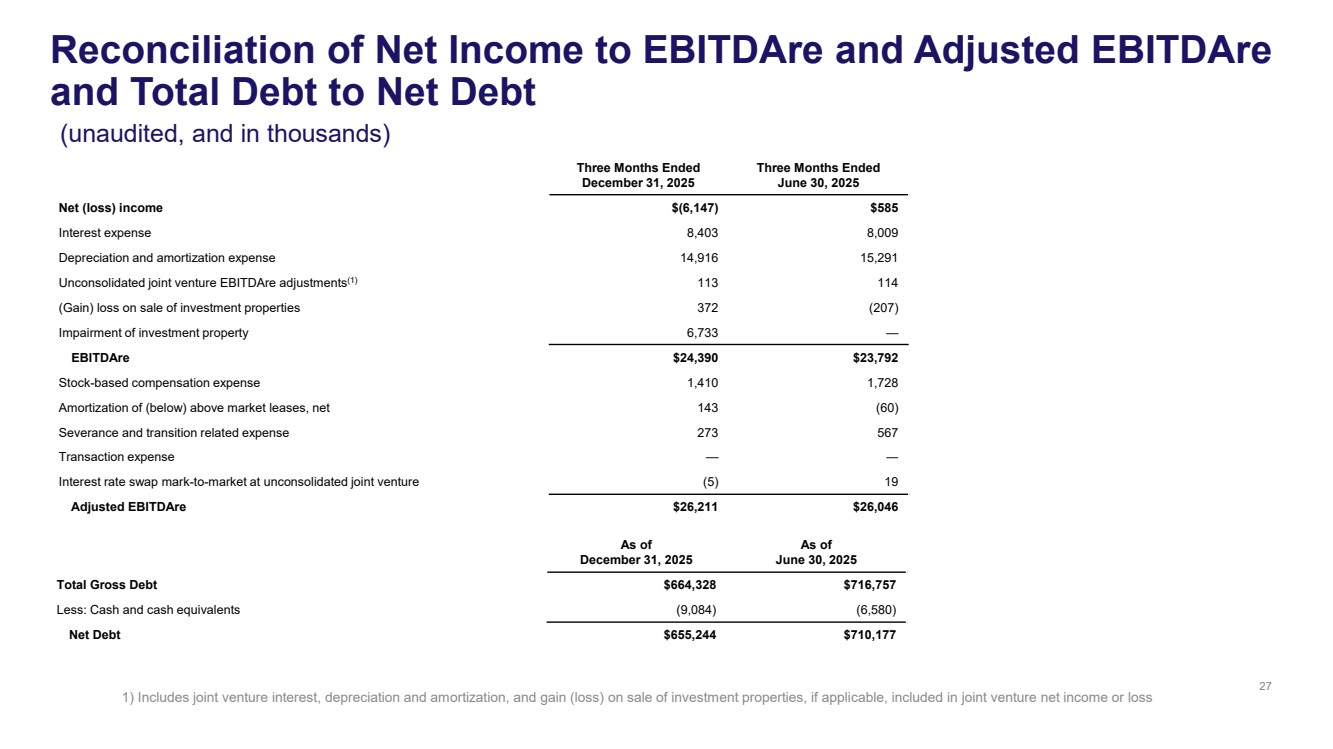
| Three Months Ended December 31, 2025 Three Months Ended June 30, 2025 Net (loss) income $(6,147) $585 Interest expense 8,403 8,009 Depreciation and amortization expense 14,916 15,291 Unconsolidated joint venture EBITDAre adjustments(1) 113 114 (Gain) loss on sale of investment properties 372 (207) Impairment of investment property 6,733 — EBITDAre $24,390 $23,792 Stock-based compensation expense 1,410 1,728 Amortization of (below) above market leases, net 143 (60) Severance and transition related expense 273 567 Transaction expense — ― Interest rate swap mark-to-market at unconsolidated joint venture (5) 19 Adjusted EBITDAre $26,211 $26,046 1) Includes joint venture interest, depreciation and amortization, and gain (loss) on sale of investment properties, if applicable, included in joint venture net income or loss As of December 31, 2025 As of June 30, 2025 Total Gross Debt $664,328 $716,757 Less: Cash and cash equivalents (9,084) (6,580) Net Debt $655,244 $710,177 Reconciliation of Net Income to EBITDAre and Adjusted EBITDAre and Total Debt to Net Debt (unaudited, and in thousands) 27 |
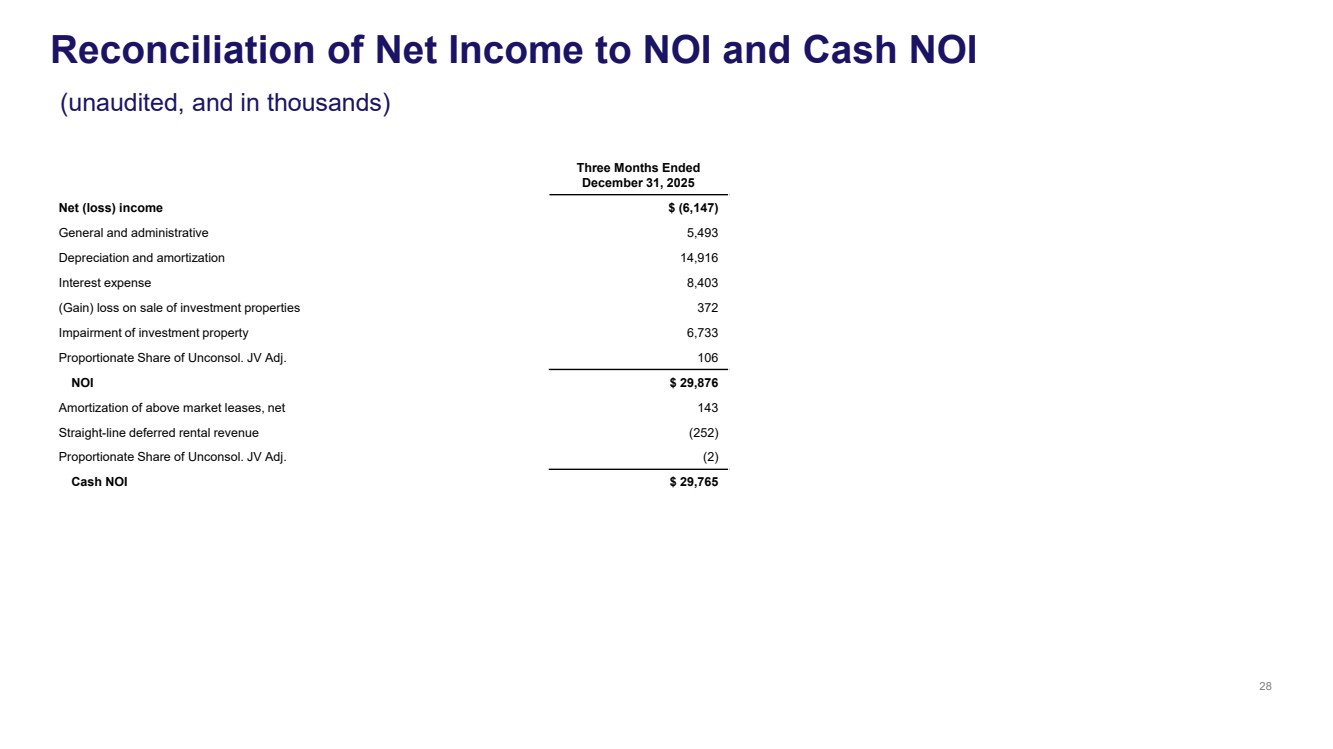
| Three Months Ended December 31, 2025 Net (loss) income $ (6,147) General and administrative 5,493 Depreciation and amortization 14,916 Interest expense 8,403 (Gain) loss on sale of investment properties 372 Impairment of investment property 6,733 Proportionate Share of Unconsol. JV Adj. 106 NOI $ 29,876 Amortization of above market leases, net 143 Straight-line deferred rental revenue (252) Proportionate Share of Unconsol. JV Adj. (2) Cash NOI $ 29,765 28 Reconciliation of Net Income to NOI and Cash NOI (unaudited, and in thousands) |
| NYSE: XRN 7373 Wisconsin Avenue Suite 800 Bethesda, MD 20814 |