
Company Update July 2026
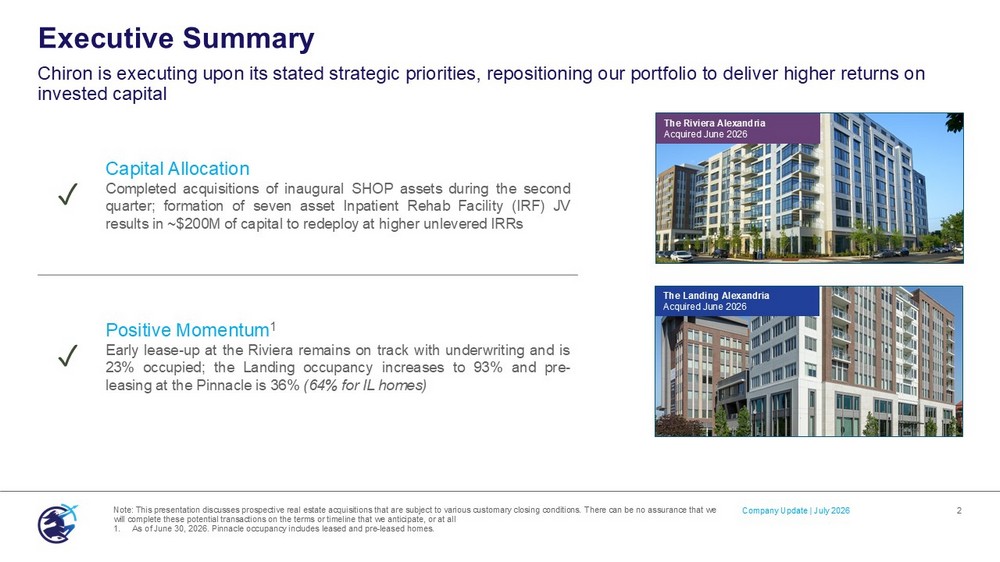
Executive Summary Chiron is executing upon its stated strategic priorities, repositioning our portfolio to deliver higher returns on invested capital Company Update | July 2026 2 Note: This presentation discusses prospective real estate acquisitions that are subject to various customary closing conditio ns. There can be no assurance that we will complete these potential transactions on the terms or timeline that we anticipate, or at all 1. As of June 30, 2026. Pinnacle occupancy includes leased and pre - leased homes. Capital Allocation Completed acquisitions of inaugural SHOP assets during the second quarter ; formation of seven asset Inpatient Rehab Facility (IRF) JV results in ~ $ 200 M of capital to redeploy at higher unlevered IRRs ✓ Positive Momentum 1 Early lease - up at the Riviera remains on track with underwriting and is 23 % occupied ; the Landing occupancy increases to 93 % and pre - leasing at the Pinnacle is 36 % ( 64 % for IL homes) ✓ The Landing Alexandria Acquired June 2026 The Riviera Alexandria Acquired June 2026
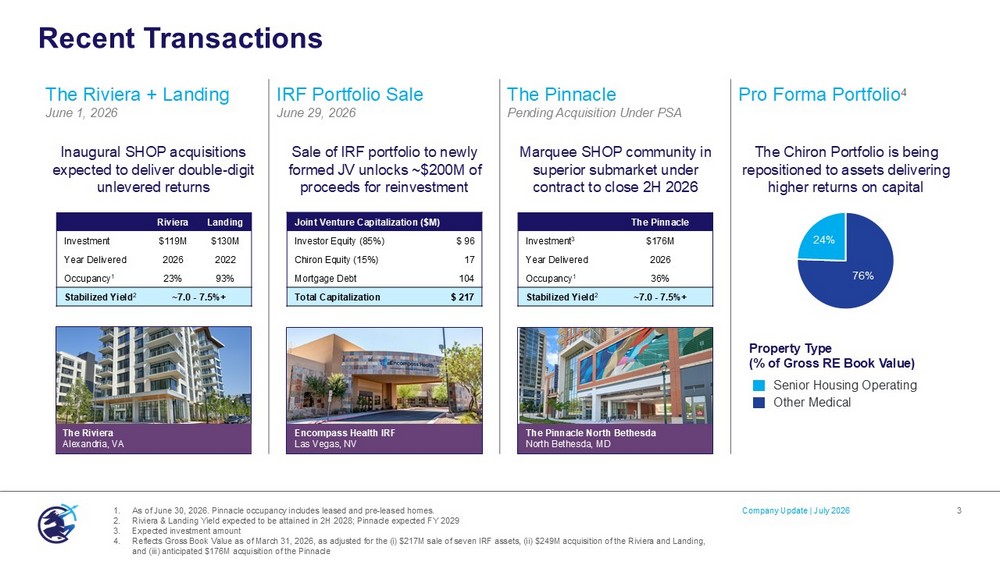
Pro Forma Portfolio 4 The Pinnacle Pending Acquisition Under PSA IRF Portfolio Sale June 29, 2026 The Riviera + Landing June 1, 2026 The Chiron Portfolio is being repositioned to assets delivering higher returns on capital Marquee SHOP community in superior submarket under contract to close 2H 2026 Sale of IRF portfolio to newly formed JV unlocks ~$200M of proceeds for reinvestment Inaugural SHOP acquisitions expected to deliver double - digit unlevered returns Recent Transactions 3 Company Update | July 2026 1. As of June 30, 2026. Pinnacle occupancy includes leased and pre - leased homes. 2. Riviera & Landing Yield expected to be attained in 2H 2028; Pinnacle expected FY 2029 3. Expected investment amount 4. Reflects Gross Book Value as of March 31, 2026, as adjusted for the ( i ) $217M sale of seven IRF assets, (ii) $249M acquisition of the Riviera and Landing, and (iii) anticipated $176M acquisition of the Pinnacle Joint Venture Capitalization ($M) $ 96 Investor Equity (85%) 17 Chiron Equity (15%) 104 Mortgage Debt $ 217 Total Capitalization Landing Riviera $130M $119M Investment 2022 2026 Year Delivered 93% 23% Occupancy 1 ~7.0 - 7.5%+ Stabilized Yield 2 Encompass Health IRF Las Vegas, NV Property Type (% of Gross RE Book Value) Senior Housing Operating Other Medical 76% 24% The Pinnacle $176M Investment 3 2026 Year Delivered 36% Occupancy 1 ~7.0 - 7.5%+ Stabilized Yield 2 The Riviera Alexandria, VA The Pinnacle North Bethesda North Bethesda, MD
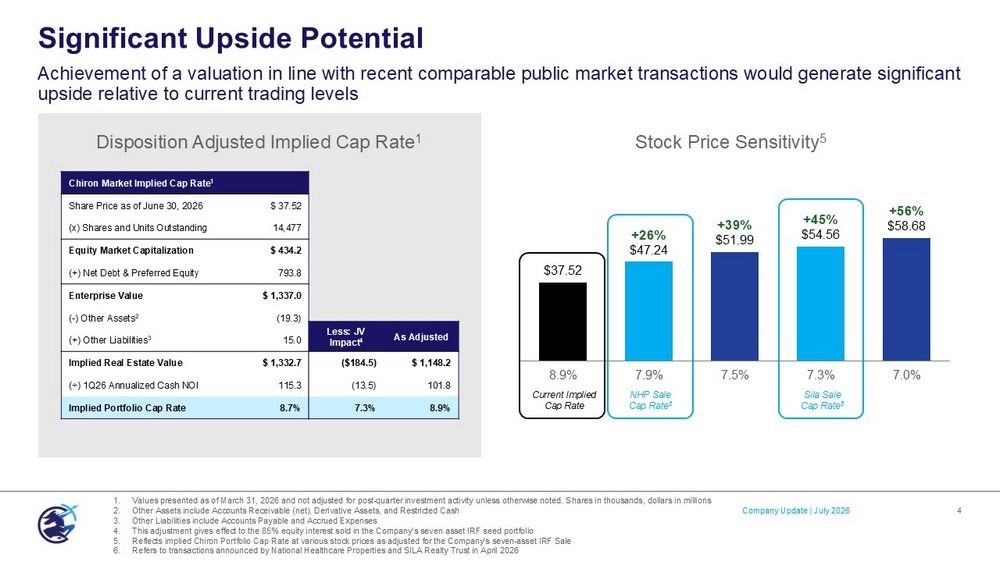
Significant Upside Potential 4 Achievement of a valuation in line with recent comparable public market transactions would generate significant upside relative to current trading levels 1. Values presented as of March 31, 2026 and not adjusted for post - quarter investment activity unless otherwise noted. Shares in th ousands, dollars in millions 2. Other Assets include Accounts Receivable (net), Derivative Assets, and Restricted Cash 3. Other Liabilities include Accounts Payable and Accrued Expenses 4. This adjustment gives effect to the 85% equity interest sold in the Company’s seven asset IRF seed portfolio 5. Reflects implied Chiron Portfolio Cap Rate at various stock prices as adjusted for the Company’s seven - asset IRF Sale 6. Refers to transactions announced by National Healthcare Properties and SILA Realty Trust in April 2026 ` $37.52 +26% $47.24 +39% $51.99 +45% $54.56 +56% $58.68 8.9% 7.9% 7.5% 7.3% 7.0% Stock Price Sensitivity 5 NHP Sale Cap Rate 6 Sila Sale Cap Rate 6 Current Implied Cap Rate Company Update | July 2026 Chiron Market Implied Cap Rate 1 $ 37.52 Share Price as of June 30, 2026 14,477 (x) Shares and Units Outstanding $ 434.2 Equity Market Capitalization 793.8 (+) Net Debt & Preferred Equity $ 1,337.0 Enterprise Value (19.3) ( - ) Other Assets 2 15.0 (+) Other Liabilities 3 $ 1,332.7 Implied Real Estate Value 115.3 ( ÷ ) 1Q26 Annualized Cash NOI 8.7% Implied Portfolio Cap Rate Disposition Adjusted Implied Cap Rate 1 As Adjusted Less: JV Impact 4 $ 1,148.2 ($184.5) 101.8 (13.5) 8.9% 7.3%

5 Reconciliations & Legal The Riviera Alexandria, VA Company Update | July 2026
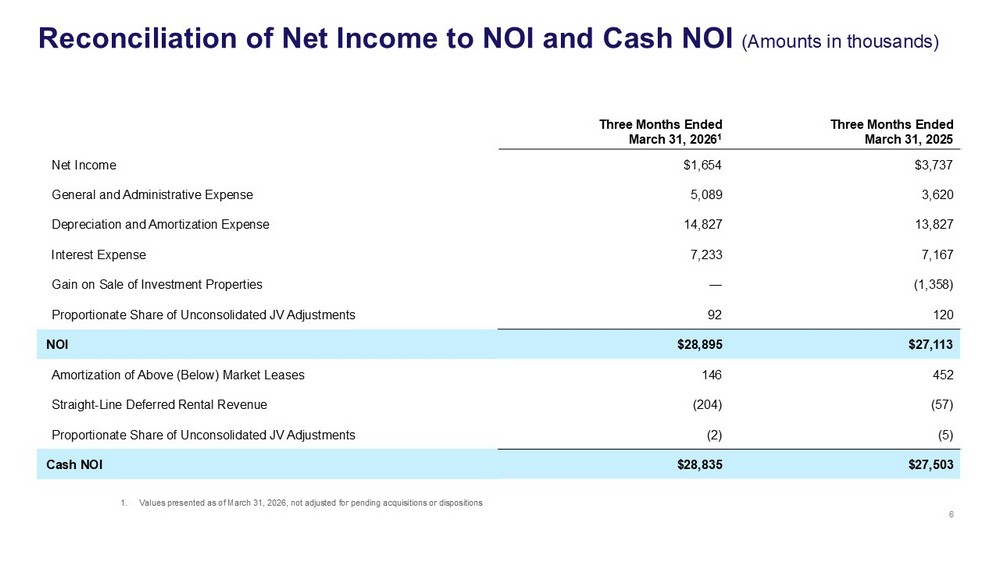
Three Months Ended March 3 1 , 202 5 Three Months Ended March 3 1 , 202 6 1 $3,737 $1, 6 54 Net Income 3 , 620 5, 089 General and A dministrative Expense 13 , 827 14, 827 Depreciation and A mortization Expense 7 , 167 7 , 233 Interest E xpense (1,358) — Gain on S ale of I nvestment P roperties 120 92 Proportionate Share of Unconsolidated JV Adjustments $27 , 113 $28 , 895 NOI 452 14 6 Amortization of A bove (Below) M arket L eases ( 57 ) (2 04 ) Straight - L ine D eferred R ental R evenue ( 5 ) ( 2 ) Proportionate Share of Unconsolidated JV Adjustments $ 2 7 , 503 $ 2 8 , 835 Cash NOI 6 Reconciliation of Net Income to NOI and Cash NOI (Amounts in thousands) 1. Values presented as of March 31, 2026, not adjusted for pending acquisitions or dispositions
Certain statements contained in this presentation may be considered "forward - looking statements" within the meaning of the Private Securities Litigation Reform Act of 1995 and are intended to be protected by the safe harbor provisions thereof. Forward - looking statements are generally identifiable by the use of words such as ‘anticipate,’ ‘believe,’ ‘could,’ ‘estimate,’ ‘expect,’ ‘intend,’ ‘may,’ ‘plan,’ ‘project,’ ‘should,’ ‘will,’ or similar expressions. These statements include, without limitation, statements regarding future financial performance, cash flows, dividends, portfolio performance, capital allocation, pending acquisitions and dispositions , the expected performance of pending acquisitions , balance sheet strategy, investment pipeline, and strategic initiatives. Forward - looking statements are based on current expectations, estimates, and assumptions and are subject to risks and uncertainties that could cause actual results to differ materially. These risks include those described in the Company’s filings with the Securities and Exchange Commission. Readers are cautioned not to place undue reliance on forward - looking statements, which speak only as of the date of this presentation. The Company undertakes no obligation to update or revise any forward - looking statements. Forward - Looking Statements 7
Management believes certain non - GAAP financial measures provide useful supplemental information regarding the Company’s operating performance and financial condition. These measures are commonly used by management, investors, and industry analysts to evaluate REIT performance and facilitate period - over - period and peer comparisons. Chiron’s non - GAAP financial measures included in this presentation are EBITDAre , Adjusted EBITDAre , Net Operating Income (NOI) and Cash NOI. Non - GAAP financial measures are not intended to be alternatives to net income, cash flows from operating activities, or other measures prepared in accordance with GAAP. These measures may not be comparable to similarly titled measures reported by other companies and should be evaluated in conjunction with the Company’s consolidated financial statements. Non - GAAP Financial Measures 8
Net Operating Income (NOI) is a supplemental measure used to evaluate the operating performance of the Company’s real estate portfolio. NOI is calculated as net income or loss, plus depreciation and amortization, general and administrative expenses, transaction costs, impairments, gains or losses on the sale of investment properties, interest expense, and other non - operating items. Cash NOI excludes non - cash items such as straight - line rent and amortization of above - and below - market leases and is intended to measure unlevered, property - level cash operating performance. NOI and Cash NOI 9

NYSE: XRN 7373 Wisconsin Avenue Suite 800 Bethesda, MD 20814