Tecogen Q2 2025 NYSE American: TGEN August 13th 2025
SAFE HARBOR STATEMENT This presentation and accompanying documents contain “forward-looking statements” which may describe strategies, goals, outlooks or other non-historical matters, or projected revenues, Income, returns or other financial measures, that may include words such as "believe," "expect," "anticipate," "intend," "plan," "estimate," "project," "target," "potential," "will," "should," "could," "likely," or "may" and similar expressions intended to identify forward-looking statements. These statements are only predictions and involve known and unknown risks, uncertainties, and other factors that may cause our actual results to differ materially from those expressed or implied by such forward-looking statements. Given these uncertainties, you should not place undue reliance on these forward-looking statements. Forward-looking statements speak only as of the date on which they are made, and we undertake no obligation to update or revise any forward-looking statements. In addition to those factors described in our Annual Report on Form 10-K and our Quarterly Reports on Form 10-Q under “Risk Factors”, among the factors that could cause actual results to differ materially from past and projected future results are the following: fluctuations in demand for our products and services, competing technological developments, issues relating to research and development, the availability of incentives, rebates, and tax benefits relating to our products and services, changes in the regulatory environment relating to our products and services, integration of acquired business operations, and the ability to obtain financing on favorable terms to fund existing operations and anticipated growth. In addition to GAAP financial measures, this presentation includes certain non-GAAP financial measures, including adjusted EBITDA which excludes certain expenses as described in the presentation. We use Adjusted EBITDA as an internal measure of business operating performance and believe that the presentation of non-GAAP financial measures provides a meaningful perspective of the underlying operating performance of our current business and enables investors to better understand and evaluate our historical and prospective operating performance by eliminating items that vary from period to period without correlation to our core operating performance and highlights trends in our business that may not otherwise be apparent when relying solely on GAAP financial measures. 2
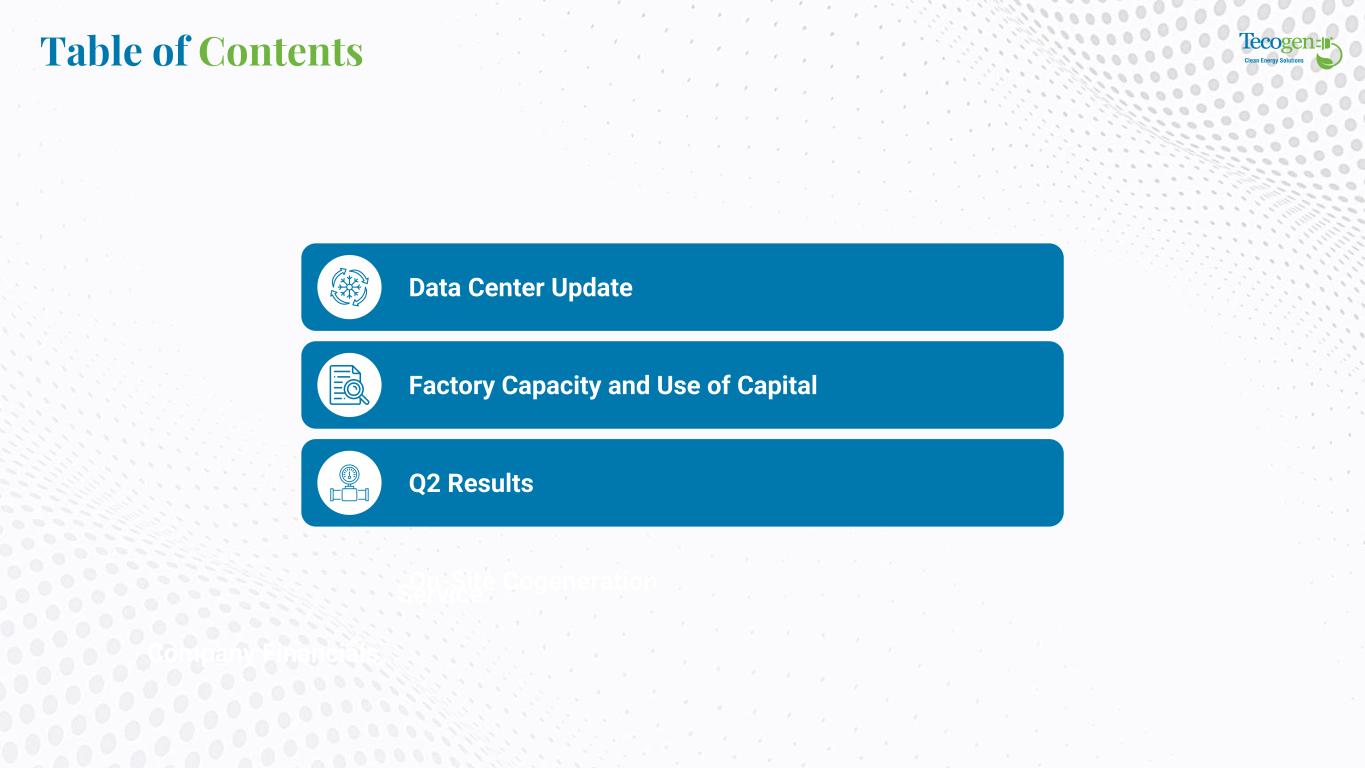
Table of Contents Data Center Update Factory Capacity and Use of Capital Q2 Results On-Site CogenerationService Company Financials
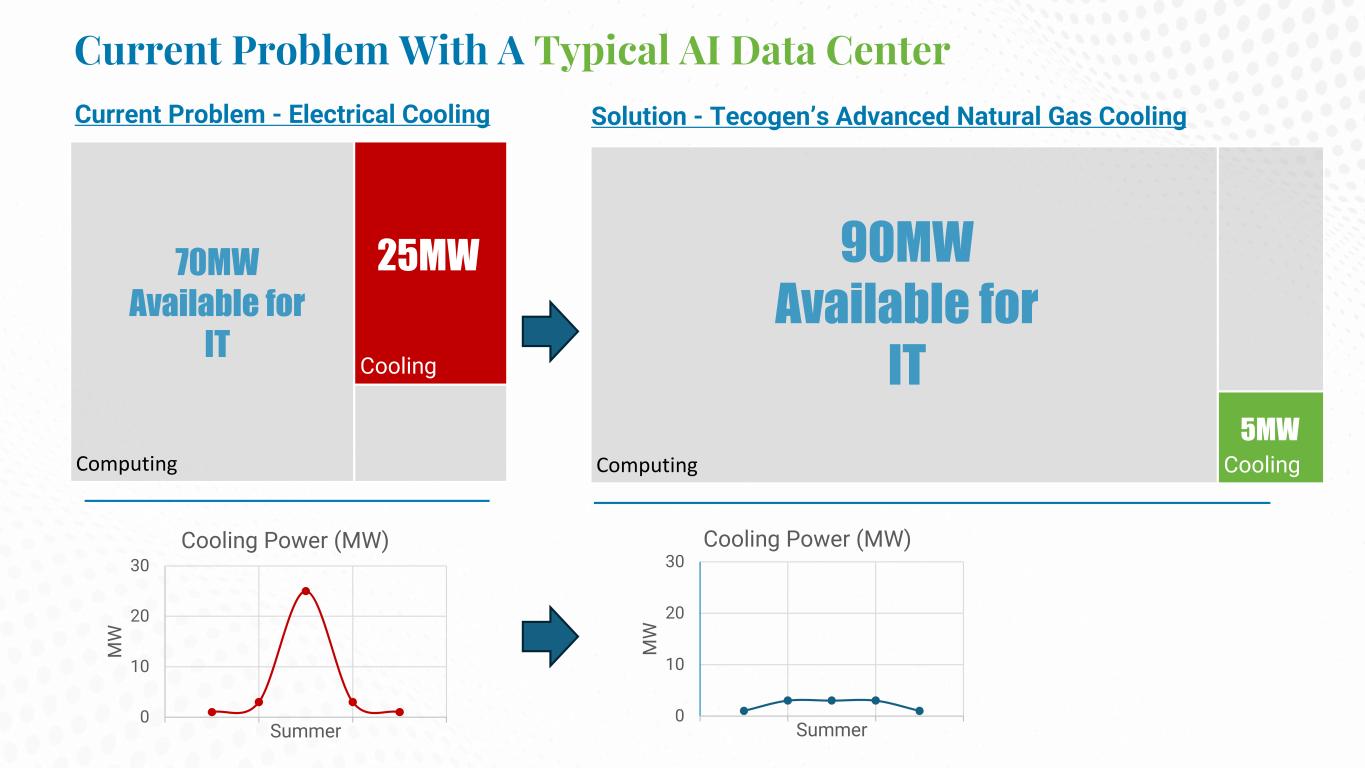
Solution - Tecogen’s Advanced Natural Gas Cooling CoolingComputing 90MW Available for IT 0 10 20 30 M W Summer Cooling Power (MW) 0 10 20 30 M W Summer Cooling Power (MW) Cooling Computing 25MW70MW Available for IT 5MW Current Problem - Electrical Cooling Current Problem With A Typical AI Data Center
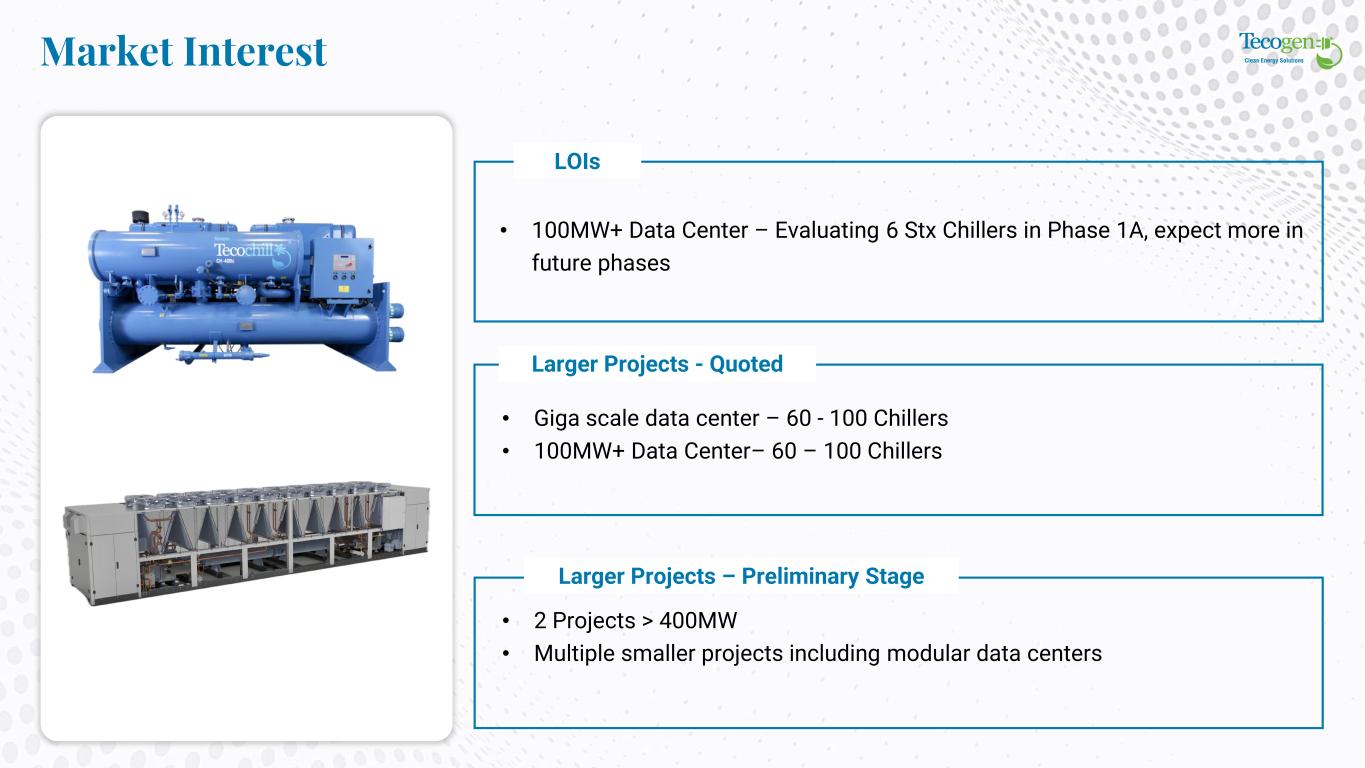
Market Interest • 100MW+ Data Center – Evaluating 6 Stx Chillers in Phase 1A, expect more in future phases LOIs • Giga scale data center – 60 - 100 Chillers • 100MW+ Data Center– 60 – 100 Chillers Larger Projects - Quoted • 2 Projects > 400MW • Multiple smaller projects including modular data centers Larger Projects – Preliminary Stage
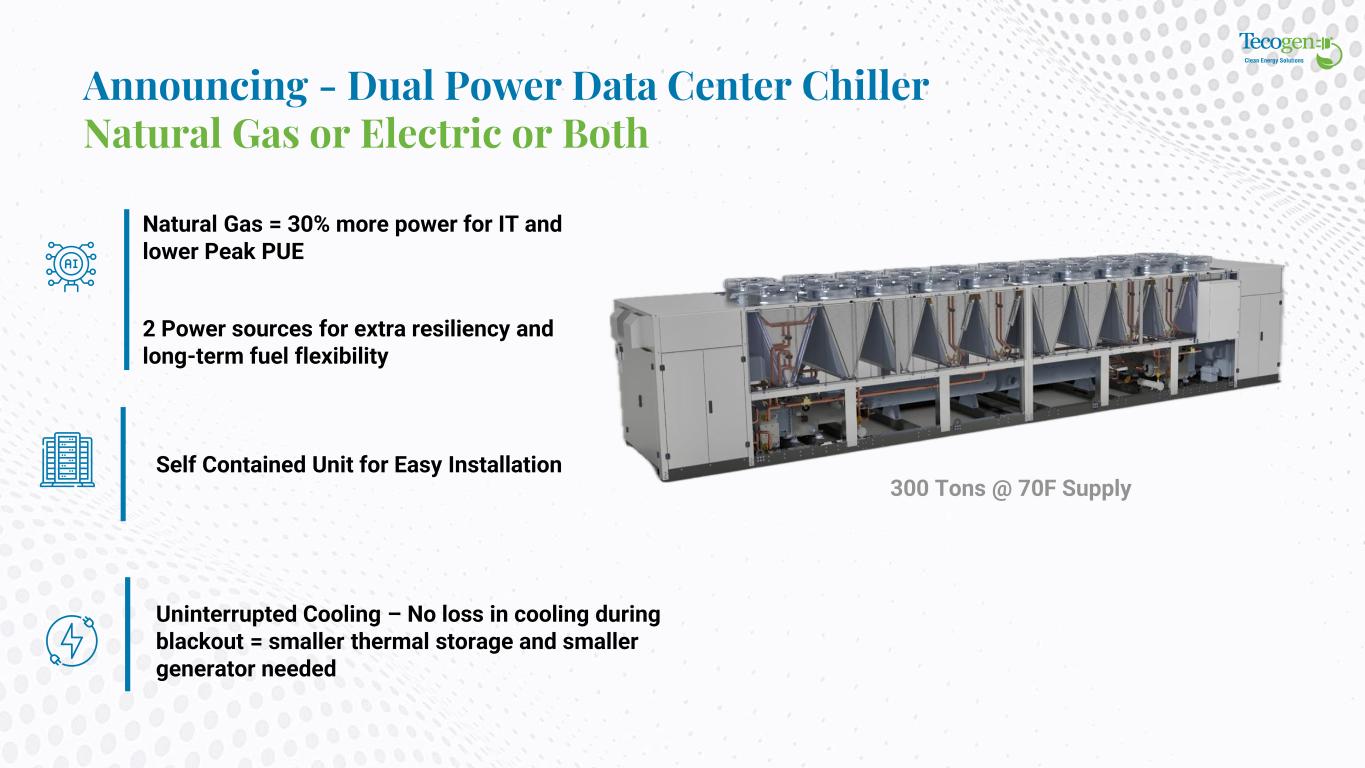
Announcing - Dual Power Data Center Chiller Natural Gas or Electric or Both Self Contained Unit for Easy Installation Natural Gas = 30% more power for IT and lower Peak PUE 2 Power sources for extra resiliency and long-term fuel flexibility Uninterrupted Cooling – No loss in cooling during blackout = smaller thermal storage and smaller generator needed 300 Tons @ 70F Supply
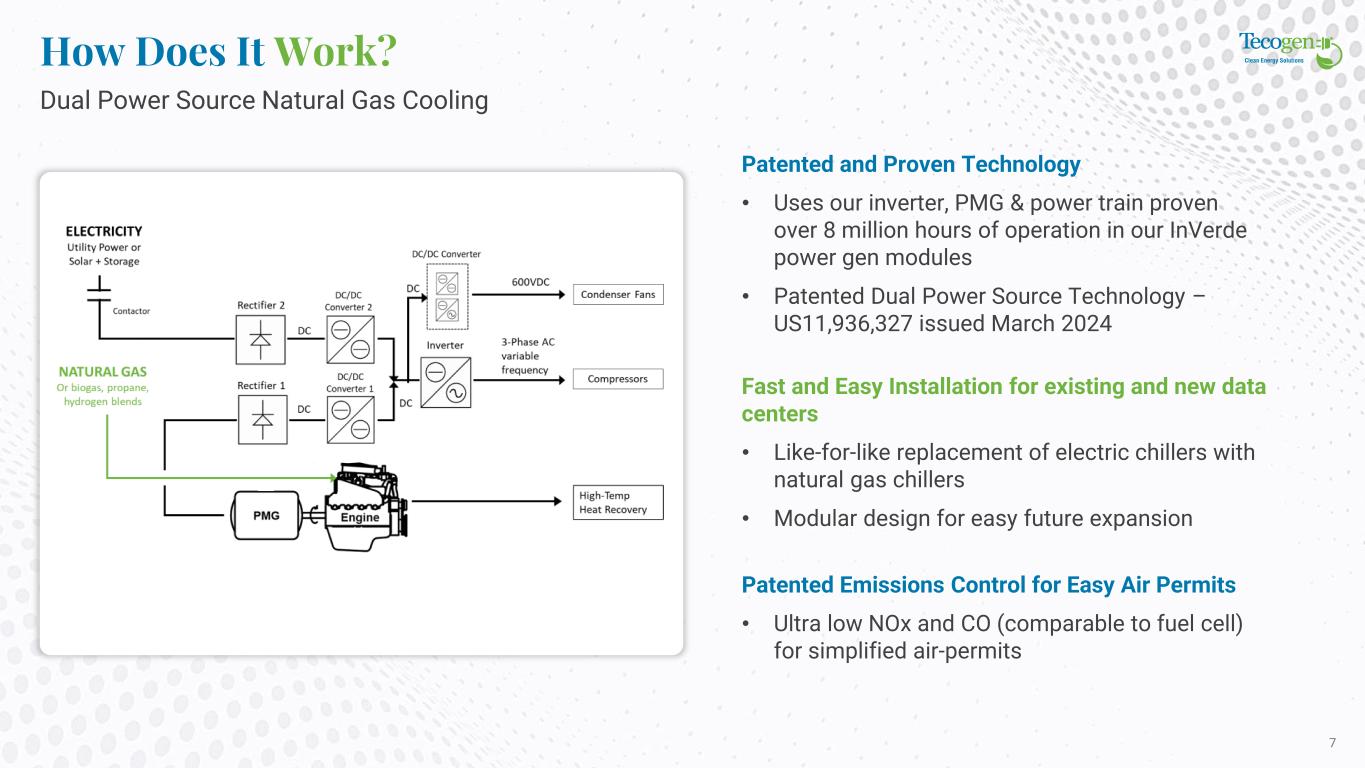
How Does It Work? Dual Power Source Natural Gas Cooling 7 Patented and Proven Technology • Uses our inverter, PMG & power train proven over 8 million hours of operation in our InVerde power gen modules • Patented Dual Power Source Technology – US11,936,327 issued March 2024 Fast and Easy Installation for existing and new data centers • Like-for-like replacement of electric chillers with natural gas chillers • Modular design for easy future expansion Patented Emissions Control for Easy Air Permits • Ultra low NOx and CO (comparable to fuel cell) for simplified air-permits
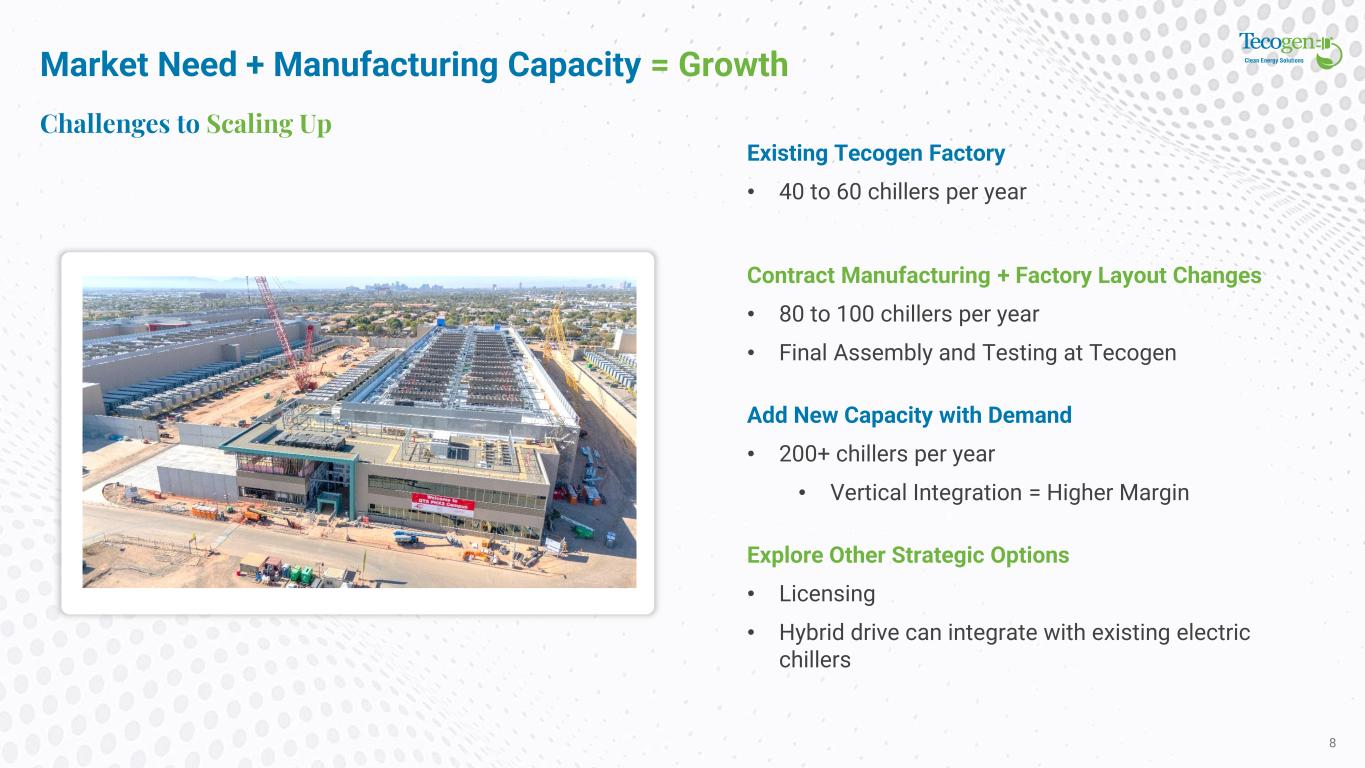
Challenges to Scaling Up Market Need + Manufacturing Capacity = Growth 8 Existing Tecogen Factory • 40 to 60 chillers per year Contract Manufacturing + Factory Layout Changes • 80 to 100 chillers per year • Final Assembly and Testing at Tecogen Add New Capacity with Demand • 200+ chillers per year • Vertical Integration = Higher Margin Explore Other Strategic Options • Licensing • Hybrid drive can integrate with existing electric chillers
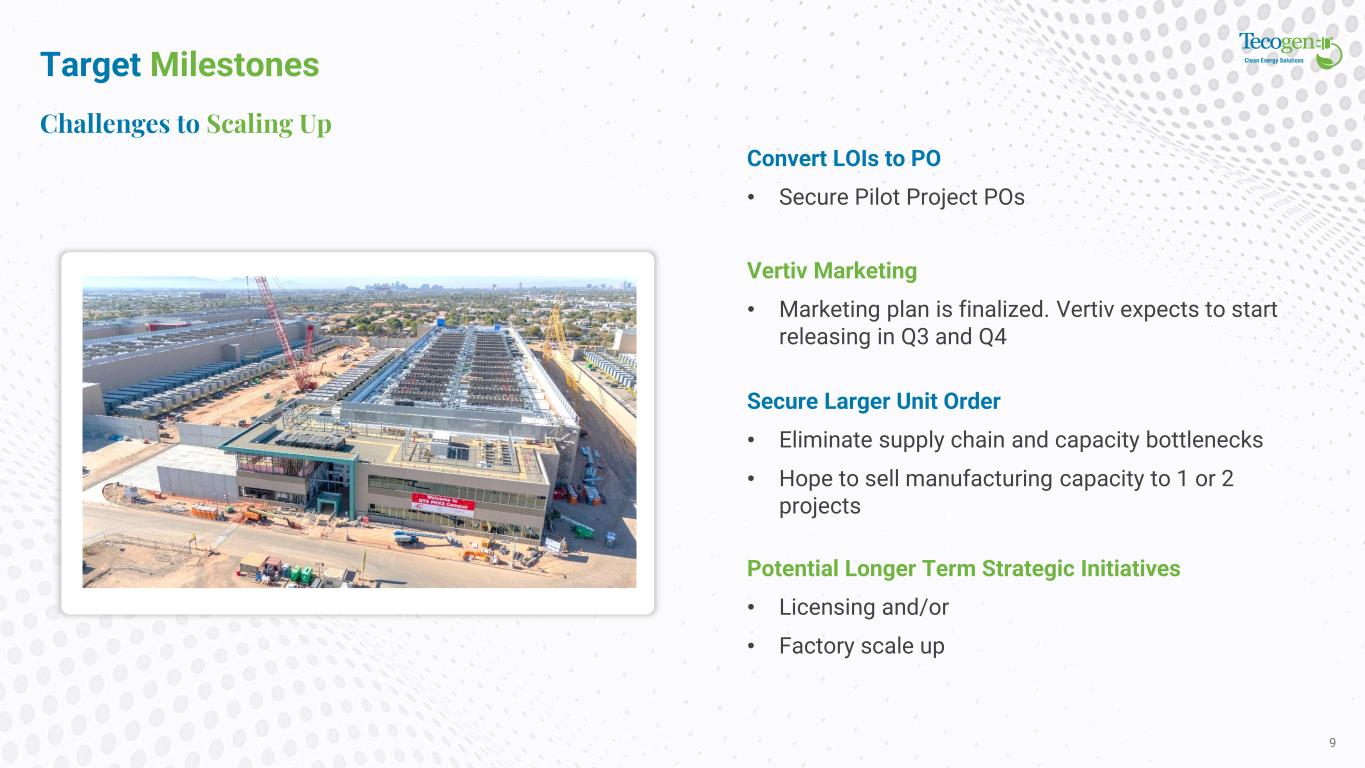
Challenges to Scaling Up Target Milestones 9 Convert LOIs to PO • Secure Pilot Project POs Vertiv Marketing • Marketing plan is finalized. Vertiv expects to start releasing in Q3 and Q4 Potential Longer Term Strategic Initiatives • Licensing and/or • Factory scale up Secure Larger Unit Order • Eliminate supply chain and capacity bottlenecks • Hope to sell manufacturing capacity to 1 or 2 projects
Backlog & Cash 10 Cash • $18.6m post capital raise Backlog • $4.7m (not including LOI for data center customer) • $2.5m to $3.5m of cannabis projects expected to close Q3/Q4 (delayed from Q2) Related Party Loan • May repay note early so company has no debt and clean balance sheet
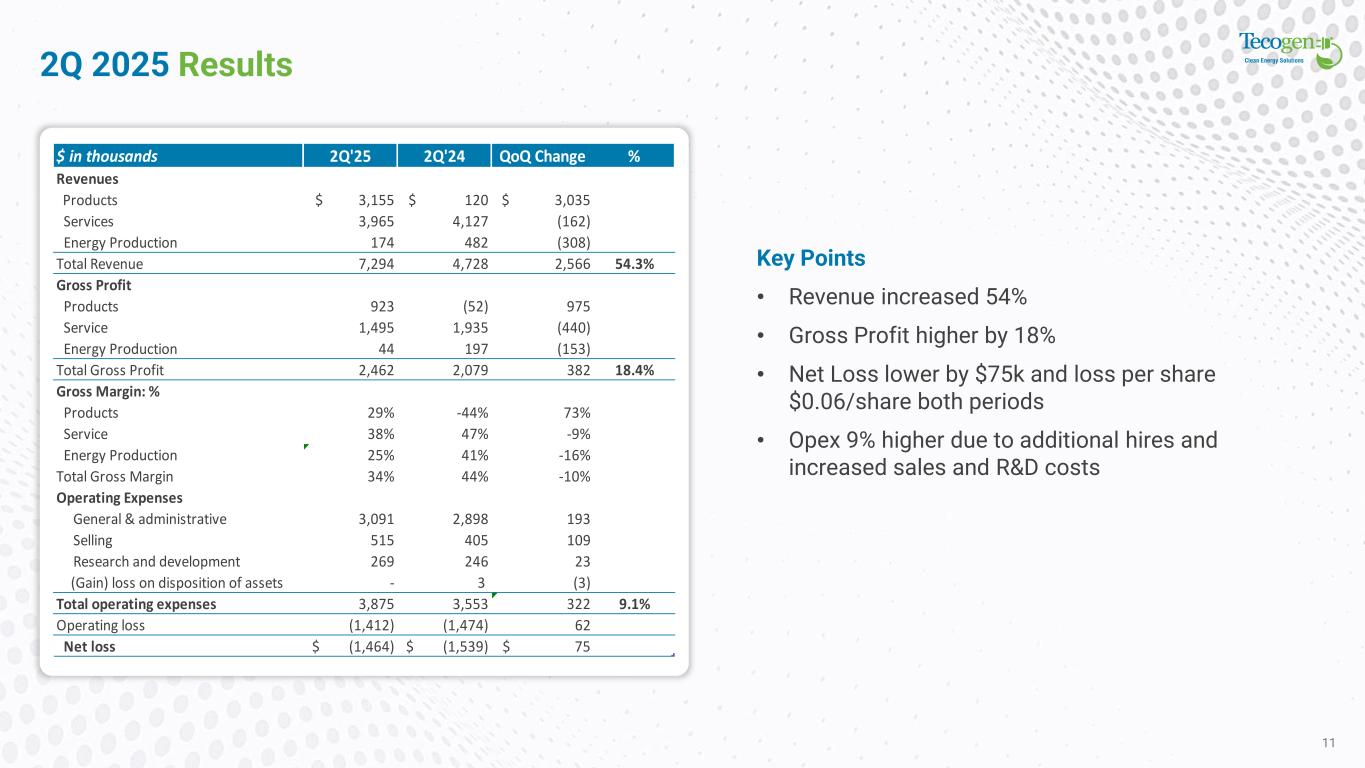
2Q 2025 Results 11 Key Points • Revenue increased 54% • Gross Profit higher by 18% • Net Loss lower by $75k and loss per share $0.06/share both periods • Opex 9% higher due to additional hires and increased sales and R&D costs $ in thousands 2Q'25 2Q'24 QoQ Change % Revenues Products $ 3,155 $ 120 $ 3,035 Services 3,965 4,127 (162) Energy Production 174 482 (308) Total Revenue 7,294 4,728 2,566 54.3% Gross Profit Products 923 (52) 975 Service 1,495 1,935 (440) Energy Production 44 197 (153) Total Gross Profit 2,462 2,079 382 18.4% Gross Margin: % Products 29% -44% 73% Service 38% 47% -9% Energy Production 25% 41% -16% Total Gross Margin 34% 44% -10% Operating Expenses General & administrative 3,091 2,898 193 Selling 515 405 109 Research and development 269 246 23 (Gain) loss on disposition of assets - 3 (3) Total operating expenses 3,875 3,553 322 9.1% Operating loss (1,412) (1,474) 62 -4.2% Net loss $ (1,464) $ (1,539) $ 75 -4.9%
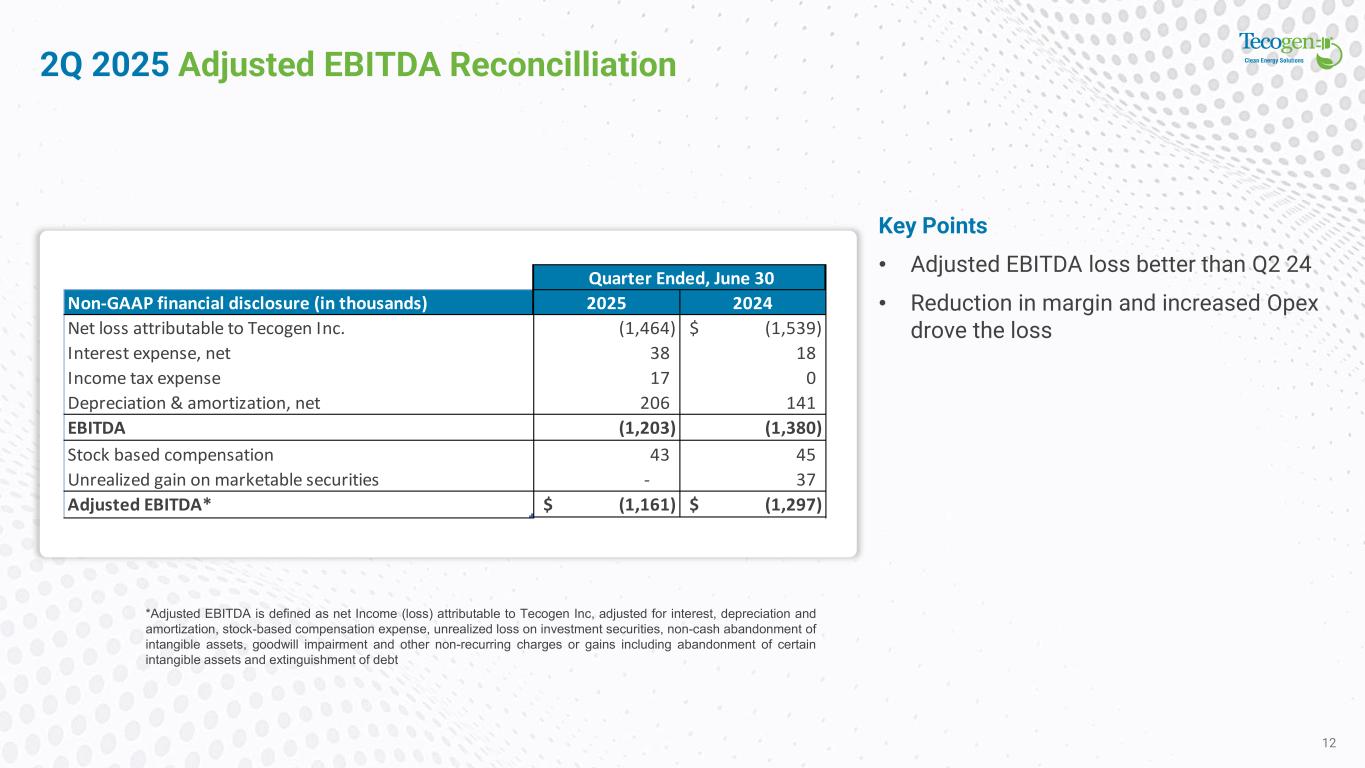
2Q 2025 Adjusted EBITDA Reconcilliation 12 Key Points • Adjusted EBITDA loss better than Q2 24 • Reduction in margin and increased Opex drove the loss Non-GAAP financial disclosure (in thousands) 2025 2024 Net loss attributable to Tecogen Inc. (1,464) (1,539)$ Interest expense, net 38 18 Income tax expense 17 0 Depreciation & amortization, net 206 141 EBITDA (1,203) (1,380) Stock based compensation 43 45 Unrealized gain on marketable securities - 37 Adjusted EBITDA* (1,161)$ (1,297)$ Quarter Ended, June 30 *Adjusted EBITDA is defined as net Income (loss) attributable to Tecogen Inc, adjusted for interest, depreciation and amortization, stock-based compensation expense, unrealized loss on investment securities, non-cash abandonment of intangible assets, goodwill impairment and other non-recurring charges or gains including abandonment of certain intangible assets and extinguishment of debt
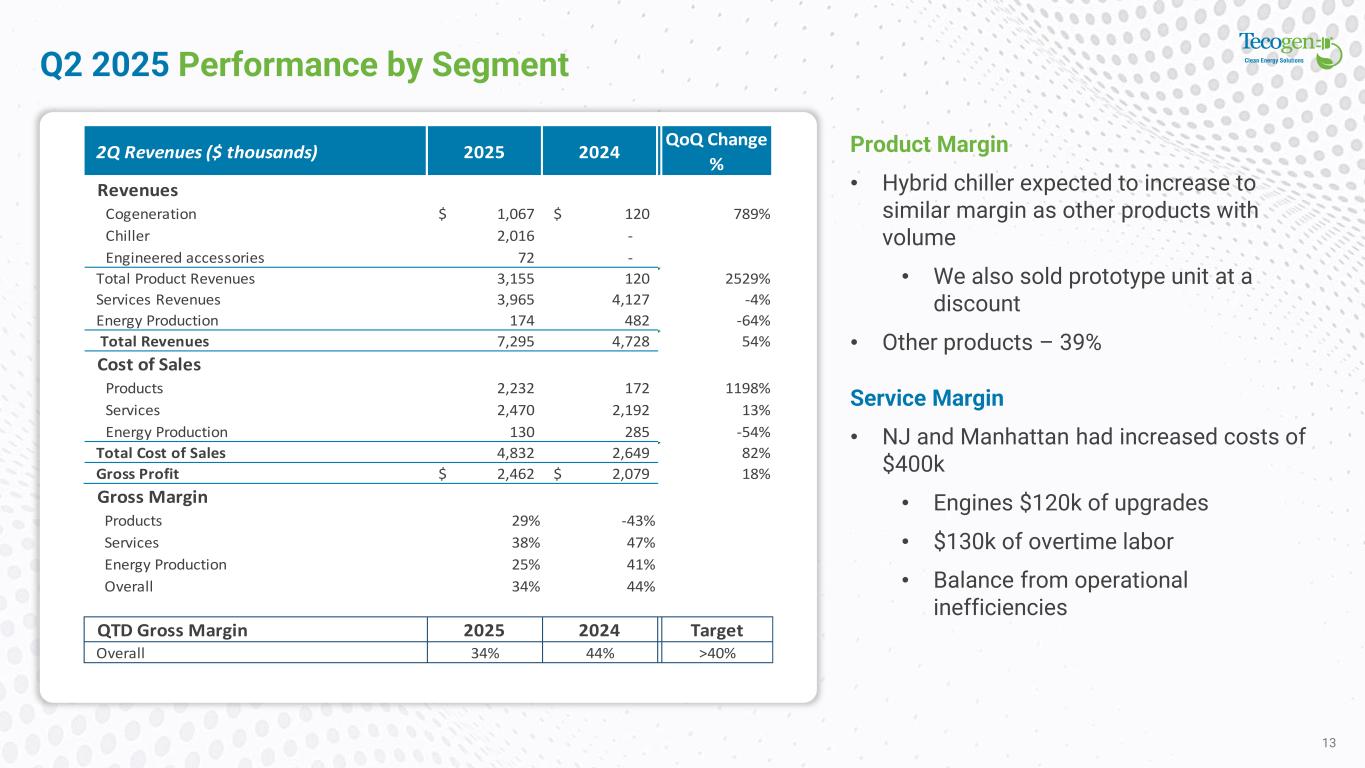
Q2 2025 Performance by Segment 13 Service Margin • NJ and Manhattan had increased costs of $400k • Engines $120k of upgrades • $130k of overtime labor • Balance from operational inefficiencies Product Margin • Hybrid chiller expected to increase to similar margin as other products with volume • We also sold prototype unit at a discount • Other products – 39% 2Q Revenues ($ thousands) 2025 2024 QoQ Change % Revenues Cogeneration 1,067$ 120$ 789% Chiller 2,016 - Engineered accessories 72 - Total Product Revenues 3,155 120 2529% Services Revenues 3,965 4,127 -4% Energy Production 174 482 -64% Total Revenues 7,295 4,728 54% Cost of Sales Products 2,232 172 1198% Services 2,470 2,192 13% Energy Production 130 285 -54% Total Cost of Sales 4,832 2,649 82% Gross Profit 2,462$ 2,079$ 18% Gross Margin Products 29% -43% Services 38% 47% Energy Production 25% 41% Overall 34% 44% QTD Gross Margin 2025 2024 Target Overall 34% 44% >40%
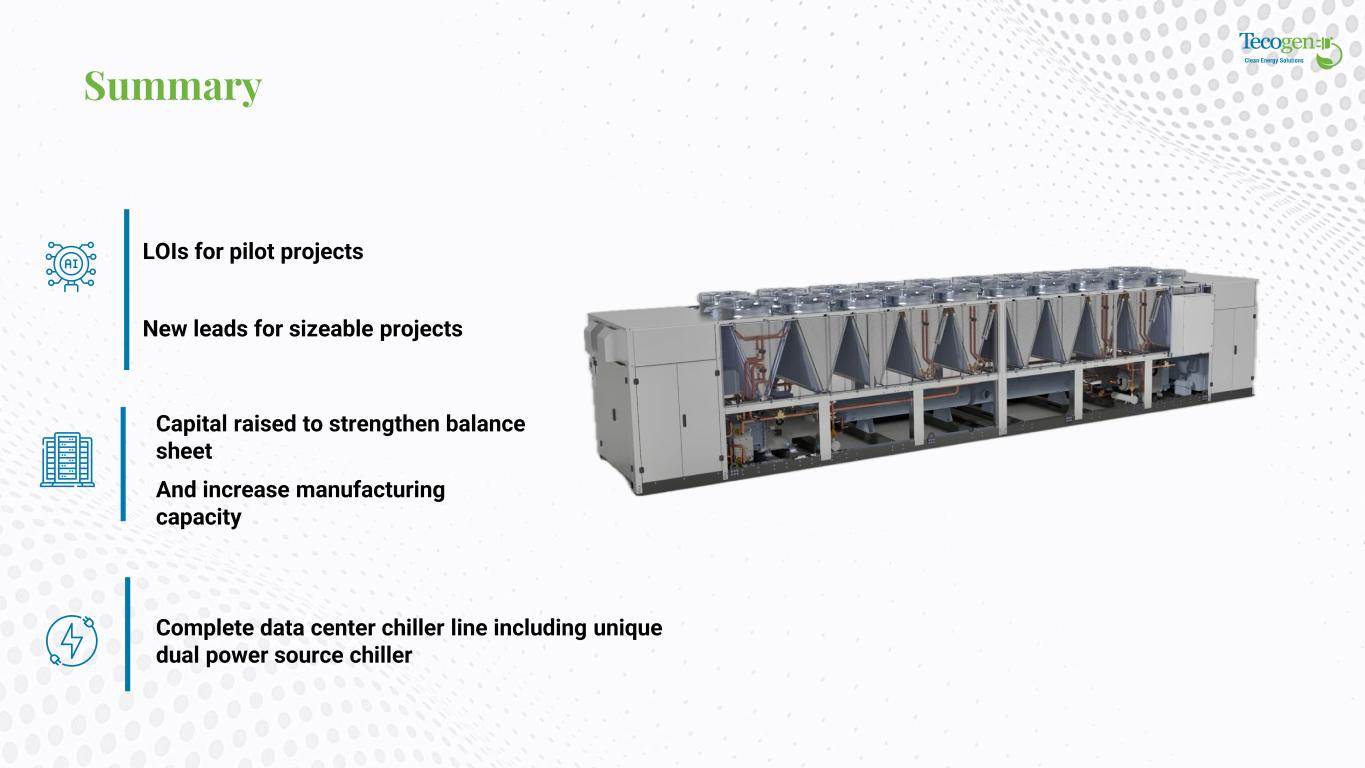
Summary Capital raised to strengthen balance sheet And increase manufacturing capacity LOIs for pilot projects New leads for sizeable projects Complete data center chiller line including unique dual power source chiller