Please wait
0001539337falseThe maximum sales charge for offerings made at-the-market is 1.00%. If the Common Shares are sold to or through underwriters in an offering that is not made at-the-market, the applicable Prospectus Supplement will set forth any other applicable sales load. Additionally, the applicable Prospectus Supplement will set forth the offering expenses (if any) borne by Fund common shareholders.You will be charged a $2.50 service charge and pay brokerage charges if you direct Computershare Inc. and Computershare Trust Company, N.A., as agent for the common shareholders, to sell your Common Shares held in a dividend reinvestment account.Stated as percentages of average net assets attributable to Common Shares for the fiscal year ended December 31, 2025.Interest and Other Related Expenses reflect actual expenses and fees for leverage incurred by a Fund for the fiscal year ended December 31, 2025. The types of leverage used by the Fund during the fiscal year ended December 31, 2025 are described in the Fund Leverage and the Notes to Financial Statements sections of this annual report. Actual Interest and Other Related Expenses incurred in the future may be higher or lower. If short-term market interest rates rise in the future, and if the Fund continues to maintain leverage, the cost of which is tied to short-term interest rates, the Fund’s interest expenses on its short-term borrowings can be expected to rise in tandem. The Fund’s use of leverage will increase the amount of management fees paid to the Fund’s adviser and sub-advisor(s).Other Expenses are based on estimated amounts for the current fiscal year. Expenses attributable to the Fund’s investments, if any, in other investment companies are currently estimated not to exceed 0.01%.Aggregate Amount Outstanding: Aggregate amount outstanding represents the principal amount outstanding or liquidation preference, if applicable, as of the end of the relevant fiscal year.Asset Coverage Per $1,000: Asset coverage per $1,000 is calculated by subtracting the Fund’s liabilities and indebtedness not represented by senior securities from the Fund’s total assets, dividing the result by the aggregate amount of Fund’s borrowings (excluding temporary borrowings) then outstanding and multiplying the result by 1,000. For purpose of asset coverage above, senior securities consist of preferred shares or borrowings of a Fund and does not include derivative transactions and other investments that have the economic effect of leverage such as reverse repurchase agreements and tender option bonds. If the leverage effects of such investments were included, the asset coverage amounts presented would be lower. 0001539337 2025-01-01 2025-12-31 0001539337 2025-12-31 0001539337 2024-12-31 0001539337 2023-12-31 0001539337 2022-12-31 0001539337 2021-12-31 0001539337 2020-12-31 0001539337 2019-12-31 0001539337 2018-12-31 0001539337 2017-12-31 0001539337 2016-12-31 0001539337 cik0001539337:ConvertibleSecuritiesRiskMember 2025-01-01 2025-12-31 0001539337 cik0001539337:CreditSpreadRiskMember 2025-01-01 2025-12-31 0001539337 cik0001539337:DebtSecuritiesRiskMember 2025-01-01 2025-12-31 0001539337 cik0001539337:DeflationRiskMember 2025-01-01 2025-12-31 0001539337 cik0001539337:DerivativesRiskMember 2025-01-01 2025-12-31 0001539337 cik0001539337:DividendpayingSecuritiesRiskMember 2025-01-01 2025-12-31 0001539337 cik0001539337:HedgingRiskMember 2025-01-01 2025-12-31 0001539337 cik0001539337:IncomeRiskMember 2025-01-01 2025-12-31 0001539337 cik0001539337:InflationRiskMember 2025-01-01 2025-12-31 0001539337 cik0001539337:InfrastructureRelatedSecuritiesRiskMember 2025-01-01 2025-12-31 0001539337 cik0001539337:CounterpartyRiskMember 2025-01-01 2025-12-31 0001539337 cik0001539337:CreditsRiskMember 2025-01-01 2025-12-31 0001539337 cik0001539337:FrequentTradingRiskMember 2025-01-01 2025-12-31 0001539337 cik0001539337:ForwardCurrencyContractsRiskMember 2025-01-01 2025-12-31 0001539337 cik0001539337:BelowInvestmentGradeRiskMember 2025-01-01 2025-12-31 0001539337 cik0001539337:CallRiskMember 2025-01-01 2025-12-31 0001539337 cik0001539337:CallOptionRiskMember 2025-01-01 2025-12-31 0001539337 cik0001539337:CommonStockRiskMember 2025-01-01 2025-12-31 0001539337 cik0001539337:DurationRiskMember 2025-01-01 2025-12-31 0001539337 cik0001539337:ExchangeTradedNotesETNsRiskMember 2025-01-01 2025-12-31 0001539337 cik0001539337:FinancialFuturesAndOptionsTransactionsRiskMember 2025-01-01 2025-12-31 0001539337 cik0001539337:ForeignCurrencyRiskMember 2025-01-01 2025-12-31 0001539337 cik0001539337:ForeignDebtInvestmentRiskMember 2025-01-01 2025-12-31 0001539337 cik0001539337:ForeignemergingMarketsIssuerRiskMember 2025-01-01 2025-12-31 0001539337 cik0001539337:SeniorLoanAgentRiskMember 2025-01-01 2025-12-31 0001539337 cik0001539337:SmallandMidCapCompanyRiskMember 2025-01-01 2025-12-31 0001539337 cik0001539337:SwapTransactionsRiskMember 2025-01-01 2025-12-31 0001539337 cik0001539337:UnseasonedCompanyRiskMember 2025-01-01 2025-12-31 0001539337 cik0001539337:ValuationRiskMember 2025-01-01 2025-12-31 0001539337 cik0001539337:WhenIssuedandDelayedDeliveryTransactionsRiskMember 2025-01-01 2025-12-31 0001539337 cik0001539337:OptionsStrategyRiskMember 2025-01-01 2025-12-31 0001539337 cik0001539337:UnratedSecuritiesRiskMember 2025-01-01 2025-12-31 0001539337 cik0001539337:RestrictedAndIlliquidInvestmentsRiskMember 2025-01-01 2025-12-31 0001539337 cik0001539337:RightsAndWarrantsRiskMember 2025-01-01 2025-12-31 0001539337 cik0001539337:SeniorLoanRiskMember 2025-01-01 2025-12-31 0001539337 cik0001539337:MasterLimitedPartnershipsMLPsRiskMember 2025-01-01 2025-12-31 0001539337 cik0001539337:MortgageBackedSecuritiesMBSandAssetBackedSecuritiesABSRiskMember 2025-01-01 2025-12-31 0001539337 cik0001539337:NaturalResourceRelatedSecuritiesRiskMember 2025-01-01 2025-12-31 0001539337 us-gaap:InterestRateRiskMember 2025-01-01 2025-12-31 0001539337 cik0001539337:LargeCapCompanyRiskMember 2025-01-01 2025-12-31 0001539337 cik0001539337:OtherInvestmentCompaniesRiskMember 2025-01-01 2025-12-31 0001539337 cik0001539337:PreferredSecuritiesRiskMember 2025-01-01 2025-12-31 0001539337 cik0001539337:RealEstateRelatedSecuritiesRiskMember 2025-01-01 2025-12-31 0001539337 cik0001539337:ReinvestmentRiskMember 2025-01-01 2025-12-31 0001539337 cik0001539337:LegislationAndRegulatoryRiskMember 2025-01-01 2025-12-31 0001539337 cik0001539337:LeverageRiskMember 2025-01-01 2025-12-31 0001539337 cik0001539337:MarketDiscountFromNetAssetValueMember 2025-01-01 2025-12-31 0001539337 cik0001539337:RecentMarketConditionsMember 2025-01-01 2025-12-31 0001539337 cik0001539337:ReverseRepurchaseAgreementRiskMember 2025-01-01 2025-12-31 0001539337 cik0001539337:FundTaxRiskMember 2025-01-01 2025-12-31 0001539337 cik0001539337:WholeLoansLoanParticipationsAndOtherMortgagerelatedInterestsRiskMember 2025-01-01 2025-12-31 0001539337 cik0001539337:ZeroCouponorPayInKindSecuritiesRiskMember 2025-01-01 2025-12-31 0001539337 cik0001539337:AntiTakeoverProvisionsMember 2025-01-01 2025-12-31 0001539337 cik0001539337:BorrowingRiskMember 2025-01-01 2025-12-31 0001539337 cik0001539337:CybersecurityRiskMember 2025-01-01 2025-12-31 0001539337 cik0001539337:DistributionRiskMember 2025-01-01 2025-12-31 0001539337 cik0001539337:GlobalEconomicRiskMember 2025-01-01 2025-12-31 0001539337 cik0001539337:InvestmentAndMarketRiskMember 2025-01-01 2025-12-31 0001539337 cik0001539337:CommonSharesMember 2025-01-01 2025-12-31 0001539337 cik0001539337:CommonSharesMember 2025-10-01 2025-12-31 0001539337 cik0001539337:CommonSharesMember 2025-07-01 2025-09-30 0001539337 cik0001539337:CommonSharesMember 2025-04-01 2025-06-30 0001539337 cik0001539337:CommonSharesMember 2025-01-01 2025-03-31 0001539337 cik0001539337:CommonSharesMember 2024-10-01 2024-12-31 0001539337 cik0001539337:CommonSharesMember 2024-07-01 2024-09-30 0001539337 cik0001539337:CommonSharesMember 2024-04-01 2024-06-30 0001539337 cik0001539337:CommonSharesMember 2024-01-01 2024-03-31 0001539337 cik0001539337:CommonSharesMember 2025-12-31 xbrli:pure iso4217:USD xbrli:shares iso4217:USD xbrli:shares
UNITED STATES
SECURITIES AND EXCHANGE COMMISSION
Washington, D.C. 20549
FORM
N-CSR
CERTIFIED SHAREHOLDER REPORT OF REGISTERED
MANAGEMENT INVESTMENT COMPANIES
Investment Company Act file number 
811-22658                                
Nuveen Real Asset Income and Growth Fund
 
(Exact name of registrant as specified in charter)
Nuveen Investments
333 West Wacker Drive
Chicago, Illinois 60606
 
(Address of principal executive offices) (Zip code)
Mark L. Winget
Vice President and Secretary
333 West Wacker Drive
Chicago, Illinois 60606
 
(Name and address of agent for service)
Registrant’s telephone number, including area code: (
800)
257-8787
Date of fiscal year end:
December
 31
Date of reporting period:
December
 31, 2025

Item 1.
Reports to Stockholders.

 
LOGO
 
Closed-End Funds  
   
December 31, 2025   
Nuveen
Closed-End Funds
 
   
Nuveen Multi-Asset Income Fund
  
NMAI
Nuveen Real Asset Income and Growth Fund
  
JRI
Nuveen Real Estate Income Fund
  
JRS
 
 
Annual
Report

IMPORTANT DISTRIBUTION NOTICE
for Shareholders of the Nuveen Real Estate Income Fund (JRS)
Annual Shareholder Report for the period ending December 31, 2025
The Nuveen Real Estate Income Fund (JRS) seek to offer attractive cash flow to its shareholders, by converting the expected long-term total return potential of the Fund’s investments in REITs into regular quarterly distributions. Following is a discussion of the Managed Distribution Policy the Fund uses to achieve this.
The Fund pays quarterly common share distributions that seek to convert the Fund’s expected long-term total return potential into regular cash flow. As a result, the Fund’s regular common share distributions (presently $0.1700 per share) may be derived from a variety of sources, including:
 
   
distributions from portfolio companies (REITs),
 
   
realized capital gains or,
 
   
Possibly, returns of capital representing in certain cases unrealized capital appreciation.
Such distributions are sometimes referred to as “managed distributions.” The Fund seeks to establish a distribution rate that roughly corresponds to the Adviser’s projections of the total return that could reasonably be expected to be generated by the Fund over an extended period of time. The Adviser may consider many factors when making such projections, including, but not limited to, long-term historical returns for the asset classes in which the Fund invests. As portfolio and market conditions change, the distribution amount and distribution rate on the Common Shares under the Fund’s Managed Distribution Policy could change.
When it pays a distribution, the Fund provides holders of its Common Shares a notice of the estimated sources of the Fund’s distributions (i.e., what percentage of the distributions is estimated to constitute ordinary income, short-term capital gains, long-term capital gains, and/or a non-taxable return of capital) on a year-to-date basis. It does this by posting the notice on its website (www.nuveen.com/cef), and by sending it in written form.
You should not draw any conclusions about the Fund’s investment performance from the amount of this distribution or from the terms of the Fund’s Managed Distribution Policy. The Fund’s actual financial performance will likely vary from month-to-month and from year-to-year, and there may be extended periods when the distribution rate will exceed the Fund’s actual total returns. The Managed Distribution Policy provides that the Board may amend or terminate the Policy at any time without prior notice to Fund shareholders. There are presently no reasonably foreseeable circumstances that might cause the Fund to terminate its Managed Distribution Policy.
 
2
 

Table
of Contents


4


5


10


13


14


22


23


71


72


73


75


78


81


97


135


137


138


139


3

Important Notices
NMAI - Portfolio manager updates:
Effective January 7, 2026, Mark Zheng, CFA, James Kim and John Tribolet were added as portfolio managers of the Fund and Nathan Shetty and Anurag Dugar were removed as portfolio manager of the Fund.
JRI - Portfolio manager updates:
Effective February 11, 2025, James Kim has been added as a portfolio manager of the Fund. Effective April 1, 2025, Jean Lin retired and is no longer a portfolio manager of the Fund.
JRI – Rights Offering:
On January 15, 2026, the Board approved the terms of the issuance of Rights to the holders of the Fund’s Common Shares as of February 6, 2026 (the “Record Date”). Holders of Rights will be entitled to subscribe for additional Common shares (the “Offer”) at a discount to the market price of the Common Shares.
After considering a number of factors, including potential benefits and costs, the Board and the Adviser, determined that the Offer will benefit both the Fund and its common shareholders and increase the assets of the Fund available to take advantage of existing investment opportunities, consistent with the Fund’s investment objective of providing shareholders with a high level of current income and long-term capital appreciation.
Certain key terms of the Offer include:
• Holders of Common Shares on the Record Date (“Record Date Shareholders”) will receive one Right for each outstanding Common Share owned on the Record Date. The Rights entitle the holders to purchase one new Common Share for every four Rights held (1-for-4).
• The subscription price per Common Share (the “Subscription Price”) will be determined based upon a formula equal to 95% of the average of the last reported sales price of the Common Shares on the NYSE on the Expiration Date and each of the four preceding trading days (the “Formula Price”). If, however, the Formula Price is less than 90% of the net asset value per Common Share at the close of trading on the NYSE on the Expiration Date, then the Subscription Price will be 90% of the Fund’s net asset value per Common Share at the close of trading on the NYSE on the Expiration Date. The Rights offering will expire at 5:00 p.m., Eastern time, on March 9, 2026 (the “Expiration Date”).
• Record Date Shareholders who fully exercise all Rights issued to them can subscribe, subject to certain limitations and allotment, for any additional Common Shares which were not subscribed for by other holders of Rights at the Subscription Price, subject to the right of the Board to eliminate this over-subscription privilege. Investors who are not Record Date Shareholders but who otherwise acquire Rights in the secondary market are not entitled to participate in the over-subscription privilege. If these requests exceed available Common Shares, they will be allocated pro rata among those fully exercising Record Date Shareholders who over-subscribe based on the number of Rights originally issued to them by the Fund.
• Rights are transferable and were admitted for trading on the NYSE under the symbol “JRI RTWI” initially trading “when-issued” on February 5, 2026. The Rights then began trading with regular settlement under the symbol “JRI RT” on February 10, 2026, and will cease trading at the close on March 6, 2026, one day before the Offer’s Expiration Date. During this time, Record Date Shareholders may also choose to sell their Rights.
More details about the Fund’s rights offering are available on www.nuveen.com/cef.
 
4
 

Discussion of Fund Performance
Nuveen Multi-Asset Income Fund (NMAI)
Nuveen Real Asset Income and Growth Fund (JRI)
Nuveen Real Estate Income Fund (JRS)
The Nuveen Multi-Asset Income Fund (NMAI) features features portfolio management by Nuveen Asset Management, LLC (NAM), Teachers Advisors, LLC (TAL) and Winslow Capital Management LLC (Winslow). NAM, TAL and Winslow each serve as a sub-adviser to the Fund and are each an affiliate of Nuveen Fund Advisors, LLC, the Fund’s investment adviser. Subsequent to the close of the reporting period, effective January 7, 2026, the Fund’s portfolio managers are Mark Zheng, CFA, FRM, James Kim and John Tribolet.
The Nuveen Real Asset Income and Growth Fund (JRI) features portfolio management by Nuveen Asset Management, LLC (NAM), an affiliate of Nuveen Fund Advisors, LLC, the Fund’s investment adviser. The Fund’s portfolio managers are Tryg Sarsland, Brenda Langenfeld, CFA, Benjamin Kerl, Noah Hauser, CFA and James Kim.
The Nuveen Real Estate Income Fund (JRS) features portfolio management by a team of real estate investment professionals at Security Capital Research & Management Incorporated (Security Capital), a wholly owned subsidiary of JPMorgan Chase & Company. Anthony Manno Jr., Kevin Bedell and Nathan Gear, CFA, lead the investment and portfolio management team.
Below is a discussion of Fund performance and the factors that contributed and detracted during the 12-month reporting period ended December 31, 2025. For more information on each Fund’s investment objectives and policies, please refer to the Shareholder Update section at the end of the report.
Nuveen Multi-Asset Income Fund (NMAI)
What factors affected markets during the reporting period?
 
   
Global equities posted healthy gains in 2025, led by non-U.S. developed markets, with emerging markets performing nearly as well. Both topped U.S. shares, as measured by the S&P 500 Index, by double digits for the first time since 2006, driven partly by a weaker U.S. dollar. In the U.S., large-cap growth stocks outperformed large-cap value.
 
   
U.S. Treasury yields broadly fell and the yield curve steepened during the reporting period. Intermediate-duration fixed income assets generally outperformed shorter-duration assets of similar credit rating, while very long-dated fixed income instruments underperformed. Additionally, the anticipation and announcements of tariffs by the U.S. on its trading partners contributed to volatility in April 2025 and weakened the U.S. dollar.
 
   
Credit spreads tightened during the reporting period. High-yield bonds, emerging markets debt, and preferred securities outperformed investment-grade bonds, while senior loans lagged.
What key strategies were used to manage the Fund during the reporting period?
 
   
The Fund seeks to provide attractive total return through high current income and capital appreciation. The Fund dynamically invests in a portfolio of equity and debt securities of issuers located around the world.
 
   
During the first quarter 2025, the Fund reduced its interest rates exposure by trimming the allocations to emerging markets debt and TIPS (Treasury inflation-protected securities), while increasing exposure to floating-rate loans. Additionally, after having reduced the equity exposure around mid-February 2025 via real assets and international developed stocks, the Fund added back some equity exposure in March 2025 via U.S. large-cap value and dividend growth stocks.
 
   
Early in the second quarter 2025, the Fund increased exposure to U.S. dividend growth stocks to take advantage of the April sell-off and began to wind down the Fund’s call overwriting overlay. Later in the quarter, the Fund reduced exposure to public real assets – both U.S. real estate investment trusts (REITs) and global infrastructure stocks – and to emerging markets equities, while increasing exposure to core U.S. and international developed market equities. In fixed income, the Fund reduced the floating-rate loans, preferred securities and mortgage-backed securities (MBS) allocations and increased the core bond and high yield bond allocations.
 
 
5

Discussion of Fund Performance (continued)
 
   
After September’s strong interest rate rally, the Fund reduced exposure to MBS and added an allocation to energy infrastructure master limited partnerships (MLPs), which helped lower the Fund’s interest rate sensitivity while enhancing the expected portfolio yield.
 
   
In the fourth quarter 2025, the Fund reduced exposure to floating-rate senior loans and increased allocation to equities as the Federal Reserve cut interest rates.
How did the Fund perform and what factors affected relative performance?
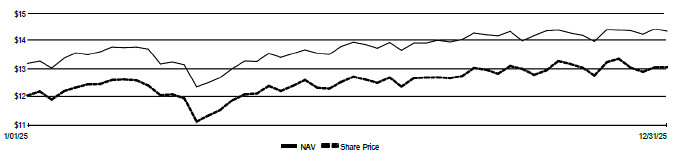
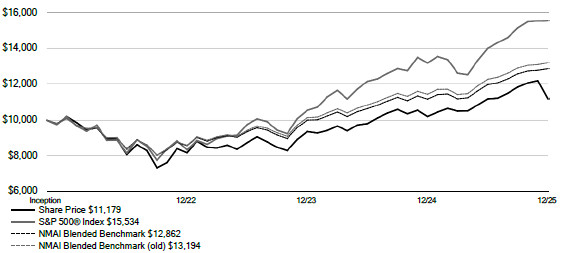
For the 12-month reporting period ended December 31, 2025, NMAI returned 19.23%. The Fund outperformed the returns of the NMAI Blended Benchmark, which returned 15.16%. The NMAI Blended Benchmark, effective June 17, 2025, consists of 1) 50% MSCI ACWI Index (Net), 2) 35% Bloomberg U.S. Corporate high Yield Bond Index and 3) 15% Bloomberg U.S. Aggregate Bond Index. Prior to June 17, 2025, the NMAI Blended Benchmark consisted of 1) 50% MSCI ACWI (Net), and 2) 50% Bloomberg U.S. Corporate high Yield Bond Index.
Top contributors to relative performance
 
   
The Fund’s use of leverage through bank borrowings and reverse repurchase agreements.
 
   
Within equities, an overweight allocation to international equities.
 
   
Within fixed income, an out-of-benchmark allocation to preferred securities.
Top detractors from relative performance
 
   
Within equities, an overweight allocation to U.S. equities.
 
   
Within fixed income, an overweight allocation to U.S. investment-grade bonds
Nuveen Real Asset Income and Growth Fund (JRI)
What factors affected markets during the reporting period?
 
   
The U.S. economy continued to expand, and pricing pressures generally eased, but inflation remained higher than the central bank’s 2% target. The labor market began to show signs of weakening toward the end of the reporting period.
 
   
Most global central banks continued to ease monetary policy. After holding steady throughout the first eight months of 2025, the Federal Reserve lowered rates by 25 basis points in September, October and December, bringing the federal funds rate to a range of 3.50%-3.75%.
 
   
In the United States, rates fell across all but the longest 30-year segment of the Treasury yield curve, but more so at the short end, causing the yield curve to steepen. The 10-year U.S. Treasury yield ended the reporting period 40 basis points lower at 4.18%.
 
   
Of the five segments within the JRI Blended Benchmark, global infrastructure common equities performed best during the reporting period, followed by the real estate common equity segment.
 
   
High yield bonds also rallied throughout the reporting period due to stronger-than-expected U.S. economic growth and consumer spending that supported credit spreads.
 
   
Despite looser monetary policy, the rate-sensitive real estate preferred securities sector within the JRI Blended Benchmark underperformed during the reporting period.
 
6
 

What key strategies were used to manage the Fund during the reporting period?
 
   
The Fund generally maintained a more defensive posture throughout its portfolio given ongoing geopolitical risks, along with uncertainty surrounding global growth, inflation and interest rates. The portfolio management team favored sectors that tend to have more resilient business models and greater earnings visibility, while also maintaining some cyclical exposure.
 
   
In the equity portion of the Fund, global infrastructure common shares represented the Fund’s largest overweight. Exposure increased in the more defensive and essential electric utilities sector because of these companies’ more visible cash flows and earnings, and importance in fulfilling the increased demand for power to develop generative artificial intelligence (AI).
 
   
Real estate common equity exposure also remained a modest overweight. Much of this sector continued to be attractive from a valuation standpoint relative to the broader equity market after underperforming due to higher interest rates.
 
   
The debt portion of the Fund remained an overweight at the end of the reporting period because of the potential for continued stock market volatility following three straight years of strong equity market advances. Additionally, the debt segment of the capital structure continued to offer attractive yields and pricing.
 
   
Within the debt portfolio, the portfolio management team made some opportunistic additions in commercial mortgage-backed securities (CMBS), largely due to relatively attractive spreads in the sector. While the majority of the Fund’s debt exposure remained in high yield bonds, the portfolio management team maintained modest exposure to higher-quality, investment-grade credits to allow for broader sector diversification than what was available in the high yield market.
 
   
The Fund maintained underweight exposures to preferred securities throughout the reporting period. Real estate preferreds remained the Fund’s largest underweight due to much lighter issuance and tight spreads in the sector. Global infrastructure preferreds also remained an underweight, with purchases focused on $1000 par institutional securities and hybrid structures within the group.
 
   
The portfolio management team maintained the Fund’s overweight to U.S. versus non-U.S. exposure throughout the reporting period because it found incrementally more attractive opportunities in the United States.
How did the Fund perform and what factors affected relative performance?
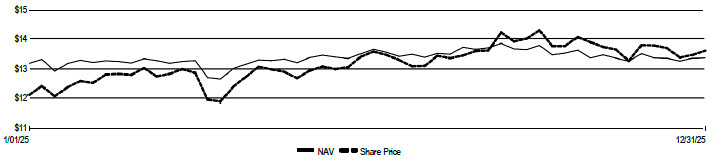
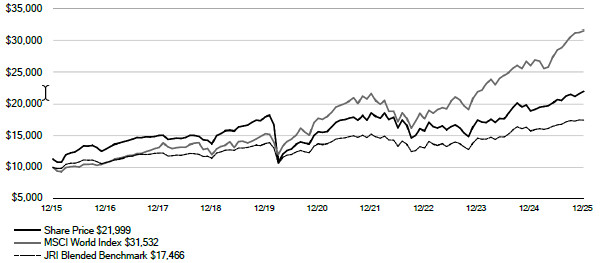
For the 12-month reporting period ended December 31, 2025, JRI returned 14.15%. The Fund outperformed the returns of the JRI Blended Benchmark, which returned 10.82%. The JRI Blended Benchmark consists of 1) 25% FTSE EPRA Nareit Developed Index (Net), 2) 22% S&P Global Infrastructure Index (Net), 3) 20% ICE Hybrid & Preferred Infrastructure 7% Issuer Constrained Custom Index, 4) 13% FTSE Nareit Preferred Stock Index and 5) 20% Bloomberg U.S. Corporate High Yield Bond Index.
Top contributors to relative performance
 
   
Security selection in real estate common equity, led by industrial companies, including an overweight position in LXP Industrial Trust.
 
   
Security selection in the gas utilities sector within the global infrastructure common equity segment, led by an out-of-benchmark position in Snam S.p.A.
 
   
An overweight to the electric transmission sector within the global infrastructure common equity segment, led by an overweight to National Grid.
 
   
An underweight to real estate preferred securities, including an underweight to hotel real estate investment trust (REIT) preferreds.
 
 
7

Discussion of Fund Performance (continued)
 
   
The Fund’s use of leverage through bank borrowings. In addition, the Fund’s use of leverage was accretive to overall common share income.
Top detractors from relative performance
 
   
An underweight to the airport sector within the global infrastructure common equity segment.
 
   
Security selection and an overweight position in real asset debt, including overweights to the rail, pipeline and technology infrastructure sectors.
Nuveen Real Estate Income Fund (JRS)
What factors affected markets during the reporting period?
 
   
The U.S. economy continued to expand, and pricing pressures generally eased, but inflation remained higher than the central bank’s 2% target. The labor market began to show signs of weakening toward the end of the reporting period.
 
   
Most global central banks continued to ease monetary policy. After holding rates steady throughout the first eight months of 2025, the Federal Reserve lowered rates three times between September and December, bringing the federal funds rate to a range of 3.50%-3.75%.
 
   
In the United States, rates fell across all but the longest 30-year segment of the Treasury yield curve, but more so at the short end, causing the curve to steepen over the reporting period. The 10-year U.S. Treasury yield ended the year 40 basis points lower at 4.18%.
 
   
Despite looser monetary policy, the real estate sector underperformed broader equity markets in 2025. Economic uncertainty and still-elevated interest rates hampered new real estate development, while investors favored technology-focused companies more closely tied to artificial intelligence (AI) spending throughout the reporting period.
What key strategies were used to manage the Fund during the reporting period?
 
   
The portfolio management team sought to maintain significant property type and geographic diversification while considering company credit quality and security type allocations.
 
   
Investment decisions were based on a multi-layered analysis of the company, the real estate it owns, its management and the relative price of the security.
 
   
The portfolio management team used fundamental security research to identify securities that it believed would be best positioned to generate sustainable income and potential price appreciation.
 
   
To manage risk at the portfolio level during the reporting period, the team continued to adjust the Fund’s exposures in common equity versus preferred securities, senior unsecured bonds, and cash. In general, during times of strong economic growth, the portfolio management team increased the Fund’s allocation to common equity. In less certain times, the portfolio management team tended to increase the Fund’s allocation toward preferred securities.
How did the Fund perform and what factors affected relative performance?
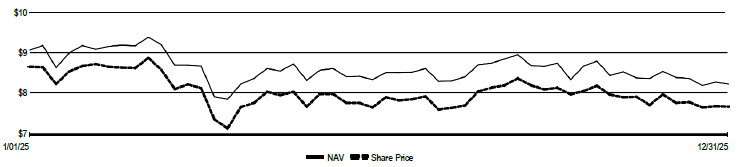
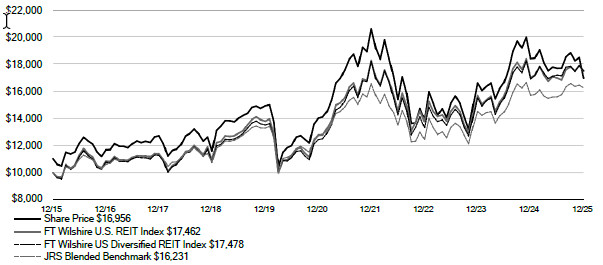
For the 12-month reporting period ended December 31, 2025, JRS returned -1.70%. The Fund underperformed the returns of the JRS Blended Benchmark, which returned 3.44%. The JRS Blended Benchmark consists of 1) 60% FT Wilshire U.S. REIT Index and 2) 40% FTSE Nareit Preferred Stock Index.
 
8
 

Top contributors to relative performance
 
   
An overweight to health care company Ventas Inc.
 
   
An overweight to industrial company First Industrial Realty Trust.
Top detractors from relative performance
 
   
An underweight to health care REIT Welltower Inc.
 
   
An overweight to Alexandria Real Estate Equities Inc.
 
   
An overweight to Healthpeak Properties Inc.
 
   
The Fund’s use of leverage through bank borrowings.


This material is not intended to be a recommendation or investment advice, does not constitute a solicitation to buy, sell or hold a security or an investment strategy, and is not provided in a fiduciary capacity. The information provided does not take into account the specific objectives or circumstances of any particular investor, or suggest any specific course of action. Investment decisions should be made based on an investor’s objectives and circumstances and in consultation with his or her advisors.
Certain statements in this report are forward-looking statements. Discussions of specific investments are for illustration only and are not intended as recommendations of individual investments. The forward-looking statements and other views expressed herein are those of the portfolio managers as of the date of this report. Actual future results or occurrences may differ significantly from those anticipated in any forward-looking statements, and the views expressed herein are subject to change at any time, due to numerous market and other factors. The Funds disclaim any obligation to update publicly or revise any forward-looking statements or views expressed herein.
Each Fund uses credit quality ratings for its portfolio securities provided by Moody’s Investors Service, Inc. (Moody’s), Standard & Poor’s (S&P) and Fitch, Inc. (Fitch). For NMAI, if all three of Moody’s, S&P, and Fitch provide a rating for a security, the middle rating is used; if two of the three agencies rate a security, the lower rating is used; and if only one rating agency rates a security, that rating is used. For JRI and JRS, the highest rating given by Moody’s, S&P and Fitch is used. This treatment of split-rated securities may differ from that used for other purposes, such as for Fund investment policies. AAA, AA, A, and BBB are investment grade ratings; BB, B, CCC/CC/C and D are below-investment grade ratings. Holdings designated N/R are not rated by these national rating agencies.
Refer to the Glossary of Terms Used in this Report for further definition of the terms used within this section.
 
 
9

Common Share Information
NMAI and JRI DISTRIBUTION INFORMATION
The following information regarding the distributions for NMAI and JRI are as of December 31, 2025, the Funds’ fiscal and tax year end, and may differ from previously issued distribution notices.
Each Fund’s distribution policy, which may be changed by the Board, is to make regular monthly cash distributions to holders of its common shares (stated in terms of a fixed cents per common share dividend distribution rate which may be set from time to time). Each Fund intends to distribute all or substantially all of its net investment income each year through its regular monthly distribution and to distribute realized capital gains at least annually. In addition, in any monthly period, to maintain its declared per common share distribution amount, Each Fund may distribute more or less than its net investment income during the period. In the event a Fund distributes more than its net investment income during any yearly period, such distributions may also include realized gains and/or a return of capital. To the extent that a distribution includes a return of capital the NAV per share may erode. The practice of maintaining a stable distribution level had no material effect on the Fund’s investment strategy during the most recent fiscal period and is not expected to have such an effect in future periods, however, distributions in excess of Fund returns will cause its NAV per share to erode. For additional information, refer to the distribution information section below and in the Notes to Financial Statements herein.
The following table provides the sources of distributions and may include amounts attributed to realized gains and/or returns of capital. A return of capital may occur, for example, when some or all of the money that you invested in a Fund is paid back to you. A return of capital distribution does not necessarily reflect a Fund’s investment performance and should not be confused with “yield” or “income.” The Funds attribute these estimates equally to each regular distribution throughout the year.
The amounts and sources of distributions reported in this notice are for financial reporting purposes and are not being provided for tax reporting purposes. The actual amounts and character of the distributions for tax reporting purposes will be reported to shareholders on Form 1099-DIV, which will be sent to shareholders shortly after calendar year-end. Because distribution source estimates are updated throughout the current fiscal year based on the Fund’s performance, those estimates may differ from both the tax information reported to you in your Fund’s 1099 statement, as well as the ultimate economic sources of distributions over the life of your investment. The figures in the table below provide the sources of distributions and may include amounts attributed to realized gains and/or returns of capital. More details about the Fund’s distributions are available on www.nuveen.com/en-us/closed-end-funds.
Data as of December 31, 2025
 
           
Per Share Sources of Distribution
    
Percentage of Distributions
 
     
Per Share
Distribution
    
Net
Investment
Income
    
Long-Term
Gains
    
Short-Term
Gains
    
Return of
Capital
    
Net
Investment
Income
   
Long-Term
Gains
   
Short-Term
Gains
   
Return of
Capital
 
NMAI (FYE 12/31)
                       
Current Distribution
  
$
0.1160
 
  
$
0.0357
 
  
$
0.0000
 
  
$
0.0000
 
  
$
0.0803


30.80
 
 
0.00
 
 
0.00
 
 
69.20
Fiscal YTD
  
$
1.2895
 
  
$
0.3973
 
  
$
0.0000
 
  
$
0.0000
 
  
$
0.8922


30.80
 
 
0.00
 
 
0.00
 
 
69.20
JRI (FYE 12/31)
                       
Current Distribution
  
$
0.1335
 
  
$
0.0681
 
  
$
0.0000
 
  
$
0.0000
 
  
$
0.0654


51.00
 
 
0.00
 
 
0.00
 
 
49.00
Fiscal YTD
  
$
1.6020
 
  
$
0.8166
 
  
$
0.0000
 
  
$
0.0000
 
  
$
0.7854


51.00
 
 
0.00
 
 
0.00
 
 
49.00
JRS DISTRIBUTION INFORMATION
The following 19(a) Notice presents JRS’s most current distribution information as of December 31, 2025 as required by certain exempted regulatory relief the Fund has received.
Because the ultimate tax character of your distributions depends on the Fund’s performance for its entire fiscal year (which is the calendar year for the Fund) as well as certain fiscal year-end (FYE) tax adjustments, estimated distribution source information you receive with each distribution may differ from the tax information reported to you on your Fund’s IRS Form 1099 statement.
 
10
 

JRS makes regular cash distributions to shareholders of a stated dollar amount per share. Subject to approval and oversight by the Board of Trustees, the Fund seeks to maintain a stable distribution level designed to deliver the long-term return potential of the Fund’s investment strategy through regular distributions (a “Managed Distribution Program”). The practice of maintaining a stable distribution level had no material effect on the Fund’s investment strategy during the most recent fiscal period and is not expected to have such an effect in future periods, however, distributions in excess of Fund returns will cause its NAV per share to erode. For additional information, refer to the distribution information section below and in the Notes to Financial Statements herein.
DISTRIBUTION INFORMATION - AS OF November 30, 2025
This notice provides shareholders with information regarding fund distributions, as required by current securities laws. You should not draw any conclusions about the Fund’s investment performance from the amount of this distribution or from the terms of the Fund’s Managed Distribution Policy.
The following table provides estimates of the Fund’s distribution sources, reflecting year-to-date cumulative experience through the month-end prior to the latest distribution. The Fund attributes these estimates equally to each regular distribution throughout the year. Consequently, the estimated information as of the specified month-end shown below is for the current distribution, and also represents an updated estimate for all prior months in the year. It is estimated that the Fund has distributed more than its income and net realized capital gains; therefore, a portion of the distributions may be (and is shown below as being estimated to be) a return of capital. A return of capital may occur, for example, when some or all of the money that you invested in the Fund is paid back to you. A return of capital distribution does not necessarily reflect the Fund’s investment performance and should not be confused with “yield” or “income.”
The amounts and sources of distributions reported in this notice are only estimates and are not being provided for tax reporting purposes. The actual amounts and sources of the amounts for tax reporting purposes will depend upon the Fund’s investment experience during the remainder of its fiscal year and may be subject to changes based on tax regulations. The Fund will send you a Form 1099-DIV for the calendar year that will tell you how to report these distributions for federal income tax purposes. More details about the Fund’s distributions and the basis for these estimates are available on www.nuveen.com/cef.
Data as of November 30, 2025
 
    
Per Share Estimated Sources of Distribution
1
    
Estimated Percentage of Distributions
1
 
JRS (FYE 12/31)
  
Per Share
Distribution
    
Net
Investment
Income
    
Long-Term
Gains
    
Short-Term
Gains
    
Return of
Capital
    
Net
Investment
Income
   
Long-Term
Gains
   
Short-Term
Gains
   
Return of
Capital
 
Current Quarter
  
$
0.1700
 
  
$
0.0369
 
  
$
0.0000
 
  
$
0.0000
 
  
$
0.1331


21.70
 
 
0.00
 
 
0.00
 
 
78.30
Fiscal YTD
  
$
0.6800
 
  
$
0.1477
 
  
$
0.0000
 
  
$
0.0000
 
  
$
0.5323


21.70
 
 
0.00
 
 
0.00
 
 
78.30
1
Net investment income (NII) is a projection through the end of the current calendar quarter using actual data through the stated month-end date above. Capital gain amounts are as of the stated date above. JRS owns REIT securities which attribute their distributions to various sources including NII, gains, and return of capital. The estimated per share sources above include an allocation of the NII based on prior year attributions which can be expected to differ from the actual final attributions for the current year.
The following table provides information regarding the JRS’s distributions and total return performance over various time periods. This information is intended to help you better understand whether returns for the specified time periods were sufficient to meet its distributions.
Data as of November 30, 2025
 
                         
   Annualized
         
Cumulative   
 
JRS (FYE 12/31)
Inception Date
  
Quarterly
Distribution
    
Fiscal YTD
Distribution
    
Net Asset
Value (NAV)
    
5-Year
Return
on NAV
   
Fiscal YTD
Dist Rate on
NAV
1
   
Fiscal YTD
Return
on NAV
   
Fiscal YTD
Dist Rate on
NAV
1
 
Nov 2001
  
$
0.1700
 
  
$
0.6800
 
  
$
8.52


5.62
 
 
7.98
 
 
(0.06
)% 
 
 
7.98
1
As a percentage of 11/ 30/25 NAV.
DISTRIBUTION INFORMATION - AS OF December 31, 2025
The following tables provide information regarding the Fund’s common share distributions and total return performance for the fiscal year ended December 31, 2025. This information is intended to help you better understand whether the Fund’s returns for the specified time period were sufficient to meet its distributions.
 
 
11

Common Share Information (continued)
 
Data as of December 31, 2025
 
    
Per Share Sources of Distribution
    
Percentage of Distributions
 
JRS (FYE 12/31)
  
Per Share
Distribution
    
Net
Investment
Income
    
Long-Term
Gains
    
Short-Term
Gains
    
Return of
Capital1
    
Net
Investment
Income
   
Long-Term
Gains
   
Short-Term
Gains
   
Return of
Capital
1
 
Fiscal YTD
  
 
$0.6800


$0.2097


$0.0000


$0.0000


$0.4703


30.80
 
 
0.00
 
 
0.00
 
 
69.20
1
Net investment income (NII) is a projection through the end of the current calendar quarter using actual data through the stated month-end date above. Capital gain amounts are as of the stated date above. JRS owns REIT securities which attribute their distributions to various sources including NII, gains, and return of capital. The estimated per share sources above include an allocation of the NII based on prior year attributions which can be expected to differ from the actual final attributions for the current year.
Data as of December 31, 2025
 
    
Annualized
JRS (FYE 12/31)
Inception Date
  
Net Asset Value
(NAV)
    
1-Year
Return
on NAV
   
5-Year
Return
on NAV
   
Fiscal YTD
Dist Rate on
NAV
Nov 2001
  
 
$8.21


(1.70
)% 
 
 
4.68
 
8.28%
NUVEEN CLOSED-END FUND DISTRIBUTION AMOUNTS
The Nuveen Closed-End Funds’ monthly and quarterly periodic distributions to shareholders are posted on www.nuveen.com and can be found on Nuveen’s enhanced closed-end fund resource page, which is at https://www.nuveen.com/resource-center-closedend funds, along with other Nuveen closed-end fund product updates. To ensure timely access to the latest information, shareholders may use a subscribe function, which can be activated at this web page (https://www.nuveen.com/subscriptions).
COMMON SHARE REPURCHASES
The Funds’ Board of Trustees authorized an open-market share repurchase program, allowing each Fund to repurchase and retire an aggregate of up to approximately 10% of its outstanding common shares.
During the current reporting period, the Funds did not repurchase any of their outstanding common shares. As of December 31, 2025 (and since the inception of the Funds’ repurchase programs), each Fund has cumulatively repurchased and retired common shares as shown in the accompanying table.
 
     
NMAI
    
JRI
    
JRS
 
Common shares cumulatively repurchased and retired
  
 
0


243,500


0
 
Common shares authorized for repurchase
  
 
3,340,000


2,740,000


2,885,000
 
 
12
 

About the Funds’ Benchmarks
Bloomberg Global Capital Securities Index:
An index designed to measure the performance of fixed-rate, investment grade capital securities denominated in USD, EUR and GBP. Index returns assume reinvestment of distributions, but do not reflect any applicable sales charges or management fees.
Bloomberg U.S. Aggregate Bond Index:
An index designed to measure the performance of the USD-denominated, fixed-rate, U.S. investment grade taxable bond market. The index includes Treasuries, government-related and corporate securities, mortgage-backed securities (MBS), asset-backed securities (ABS) and commercial mortgage-backed securities (CMBS). Index returns assume reinvestment of distributions, but do not reflect any applicable sales charges or management fees.
Bloomberg U.S. Corporate High Yield Bond Index:
An index designed to measure the performance of the USD-denominated, fixed rate corporate high yield bond market. Index returns assume reinvestment of distributions, but do not reflect any applicable sales charges or management fees.
FTSE EPRA Nareit (Financial Times Stock Exchange – European Public Real Estate Association/National Association of Real Estate Investment Trusts) Developed Index (Net):
An index designed to measure the performance of listed real estate companies and REITs worldwide. Index returns assume reinvestment of distributions, but do not reflect any applicable sales charges or management fees.
FTSE Nareit (Financial Times Stock Exchange National Association of Real Estate Investment Trusts) Preferred Stock Index:
An index designed to measure the performance of U.S. publicly traded REITs preferred stocks. Index returns assume reinvestment of distributions, but do not reflect any applicable sales charges or management fees.
FT Wilshire U.S. Diversified REIT Index:
An index designed to measure the performance of U.S. publicly traded real estate securities. Index returns assume reinvestment of distributions, but do not reflect any applicable sales charges or management fees.
FT Wilshire U.S. REIT Index:
An index designed to measure the performance of the mainstream US REIT investment universe. Index returns assume reinvestment of distributions, but do not reflect any applicable sales charges or management fees.
ICE Hybrid & Preferred Infrastructure 7% Issuer Constrained Custom Index:
An index designed to measure the performance of the energy and utilities subgroups of the ICE BofA U.S. All Capital Securities Index. Index returns assume reinvestment of distributions, but do not reflect any applicable sales charges or management fees.
MSCI ACWI Index (Net):
An index designed to measure the performance of large and mid-cap stocks across 23 developed and 24 emerging markets. Index returns assume reinvestment of distributions, but do not reflect any applicable sales charges or management fees.
S&P 500
®
Index:
An index generally considered representative of the U.S. equity market. The index includes 500 leading companies and covers approximately 80% of available market capitalization. Index returns assume reinvestment of distributions, but do not reflect any applicable sales charges or management fees.
S&P Global Infrastructure Index (Net):
An index designed to measure the performance of listed infrastructure companies from around the world. To create diversified exposure across the global listed infrastructure market, the index has balanced weights across three distinct infrastructure clusters: utilities, transportation, and energy. Index returns assume reinvestment of distributions, but do not reflect any applicable sales charges or management fees.
Wells Fargo Hybrid & Preferred Securities REIT Index (discontinued on April 1, 2021):
An index designed to measure the performance of preferred securities issued in the U.S. market by REITs (index was discontinued on April 1, 2021). Index returns assume reinvestment of distributions, but do not reflect any applicable sales charges or management fees.
Wilshire U.S. Real Estate Securities Index (WILRESI) (discontinued on January 1, 2025):
An index designed to measure the performance of U.S. publicly-traded real estate securities. Index returns assume reinvestment of distributions, but do not reflect any applicable sales charges or management fees.
 
 
13

Fund Performance, Leverage and Holdings Summaries
The Fund Performance, Leverage and Holding Summaries for each Fund are shown below within this section of the report.
Fund Performance
Performance data for each Fund shown below represents past performance and does not predict or guarantee future results.
Current performance may be higher or lower than the data shown. Returns do not reflect the deduction of taxes that shareholders may have to pay on Fund distributions or upon the sale of Fund shares. Returns at NAV are net of Fund expenses, and assume reinvestment of distributions. Comparative index return information is provided for the Fund’s shares at NAV only. Indexes are not available for direct investment.
Total returns for a period of less than one year are not annualized (i.e. cumulative returns). Since inception returns are shown for share classes that have less than 10-years of performance. For performance, current to the most recent month-end visit Nuveen.com or call (800) 257-8787.
Impact of Leverage
One important factor impacting the returns of the Funds’ common shares relative to their comparative benchmarks was the Funds’ use of leverage through bank borrowings and reverse repurchase agreements. The Funds use leverage because our research has shown that, over time, leveraging provides opportunities for additional income. The opportunity arises when short-term rates that a Fund pays on its leveraging instruments are lower than the interest the Fund earns on its portfolio of long-term bonds that it has bought with the proceeds of that leverage.
However, use of leverage can expose Fund common shares to additional price volatility. When a Fund uses leverage, the Fund’s common shares will experience a greater increase in their net asset value if the securities acquired through the use of leverage increase in value, but will also experience a correspondingly larger decline in their net asset value if the securities acquired through leverage decline in value. All this will make the shares’ total return performance more variable over time.
In addition, common share income in levered funds will typically decrease in comparison to unlevered funds when short-term interest rates increase and increase when short-term interest rates decrease. In recent quarters, fund leverage expenses have generally tracked the overall movement of short-term interest rates. While fund leverage expenses are higher than their prior year lows, leverage nevertheless continues to provide the opportunity for incremental common share income, particularly over longer-term periods.
Leverage Ratios
Each Fund’s Effective Leverage and Regulatory Leverage Ratios are set forth below. “Effective Leverage” is a Fund’s effective economic leverage, and includes both regulatory leverage and the leverage effects of certain derivative and other investments in a Fund’s portfolio that increase the Fund’s investment exposure. “Regulatory Leverage” consists of preferred shares or borrowings of a Fund. Regulatory Leverage is a part of a Fund’s capital structure. Regulatory leverage is subject to asset coverage limits set forth in the Investment Company Act of 1940. A Fund, however, may from time to time borrow for temporary purposes, typically on a transient basis in connection with its day-to-day operations, primarily in connection with the need to settle portfolio trades. Such temporary borrowings are excluded from the calculation of a Fund’s Effective Leverage and Regulatory Leverage ratios.
Holding Summaries
The Holdings Summaries data relates to the securities held in each Fund’s portfolio of investments as of the end of this reporting period. It should not be construed as a measure of performance for the Fund itself. Holdings are subject to change. Refer to the Fund’s Portfolio of Investments for individual security information.
For financial reporting purposes NMAI uses credit quality ratings for its portfolio securities provided by Standard & Poor’s Group, Moody’s Investors Service, Inc. and Fitch, Inc. If all three provide a rating for a security, the middle is used; if two of the three agencies rate a security, the lower rating is used; and if only one rating agency rates a security, that rating is used. This treatment of split-rated securities may differ from that used for other purposes, such as for Fund investment policies. Credit ratings are subject to change. AAA, AA, A and BBB are investment grade ratings; BB, B, CCC, CC, C and D are below-investment grade ratings. Holdings designated N/R are not rated by these national rating agencies.
 
14
 

For financial reporting purposes JRI and JRS use the highest rating given by one of the following national rating agencies: Standard & Poor’s, Moody’s Investors Service, Inc. or Fitch, Inc. This treatment of split-rated securities may differ from that used for other purposes, such as for Fund investment policies. Credit ratings are subject to change. AAA, AA, A and BBB are investment grade ratings; BB, B, CCC, CC, C and D are below investment grade ratings. Holdings designated N/R are not rated by these national rating agencies.
 
 
15

NMAI
  
Nuveen Multi-Asset Income Fund
  
Fund Performance, Leverage and Holdings Summaries December 31, 2025
Performance*


Total Returns as of

December 31, 2025
 
           
 Average Annual 
 
     
Inception
Date
    
   1-Year
    
Since
Inception
 
NMAI at Common Share NAV      11/22/21        19.23%        3.57%  
NMAI at Common Share Price      11/22/21        19.86%        2.75%  
S&P 500
®
Index
            17.88%        11.32%  
NMAI Blended Benchmark             15.16%        6.32%  
NMAI Blended Benchmark (old)             15.35%        6.98%  
*For purposes of Fund performance, relative results are measured against the NMAI Blended Benchmark. The Fund’s Blended Benchmark consists of: 1) 50% MSCI ACWI Index (Net), 2) 35% Bloomberg U.S. Corporate High Yield Bond Index, and 3) 15% Bloomberg U.S. Aggregate Bond Index. Previously, the NMAI Blended Benchmark (old) consisted of: 1) 50% MSCI ACWI Index (Net) and 2) 50% Bloomberg U.S. Corporate High Yield Bond Index. The Fund’s investment adviser believes the new NMAI Blended Benchmark better reflects the securities in which the Fund primarily invests as well as the principal investment strategies employed by the Fund.
Daily Common Share NAV and Share Price
 
LOGO
 
Common
Share
NAV
      
Common
Share Price
      
Premium/(Discount)
to NAV
      
Average
Premium/(Discount)
to NAV
$14.31


$13.04


(8.87)%


(8.73)%
Growth of an Assumed $10,000 Investment as of December 31, 2025 - Common Share Price
 
LOGO
 
16
 

Leverage and Holdings
Leverage
     
Effective Leverage    30.48%
Regulatory Leverage    26.76%
 
Fund Allocation
(% of net assets)
     
Common Stocks
  
70.0%
Corporate Bonds
  
19.3%
Emerging Market Debt and
  
Foreign Corporate Bonds
  
14.7%
Mortgage-Backed Securities
  
12.3%
Variable Rate Senior Loan Interests
  
10.5%
Exchange-Traded Funds
  
7.6%
U.S. Government and Agency Obligations
  
5.8%
Preferred Stock
  
1.1%
Asset-Backed Securities
  
0.5%
Investment Companies
  
0.0%
Repurchase Agreements
  
2.2%
Other Assets & Liabilities, Net
  
(0.2)%
Reverse Repurchase
  
 
Agreements, including accrued interest
  
(7.3)%
Borrowings
  
(36.5)%
Net Assets
  
100%
 
Portfolio Credit Quality
(% of total investments)
     
AAA
  
2.0%
AA
  
10.7%
A
  
0.8%
BBB
  
7.8%
BB or Lower
  
22.3%
N/R (not rated)
  
0.9%
N/A (not applicable)
  
55.5%
Total
  
100%
 
Portfolio Composition
1
(% of total investments)
     
Banks
  
7.6%
Capital Goods
  
6.8%
Exchange-Traded Funds
  
5.3%
Semiconductors & Semiconductor Equipment
  
4.7%
Financial Services
  
4.6%
Utilities
  
4.1%
Energy
  
4.1%
Software & Services
  
4.1%
Media & Entertainment
  
3.9%
Materials
  
3.5%
Technology Hardware & Equipment
  
3.2%
Pharmaceuticals, Biotechnology & Life Sciences
  
3.2%
Consumer Discretionary Distribution & Retail
  
2.8%
Health Care Equipment & Services
  
2.6%
Food, Beverage & Tobacco
  
2.3%
Insurance
  
2.3%
Consumer Durables & Apparel
  
1.8%
Consumer Services
  
1.6%
Transportation
  
1.3%
Consumer Staples Distribution & Retail
  
1.2%
Other
  
4.4%
Emerging Market Debt and Foreign Corporate Bonds
  
10.2%
Mortgage-Backed Securities
  
8.6%
U.S. Government and Agency Obligations
  
4.0%
Asset-Backed Securities
  
0.3%
Investment Companies
  
0.0%
Repurchase Agreements
  
1.5%
Total
  
100%
 
Country Allocation
2
(% of total investments)
     
United States
  
73.6%
Japan
  
3.4%
United Kingdom
  
3.1%
France
  
2.4%
Germany
  
2.0%
Spain
  
1.9%
Switzerland
  
1.5%
Canada
  
1.2%
Netherlands
  
1.1%
Mexico
  
1.1%
Other
  
8.7%
Total
  
100%


1
See the Portfolio of Investments for the remaining industries/sectors comprising “Other” and not listed in the table above.
2
Includes 7
.7% (as -a percentage of total investments) in emerging market countries.
 
 
17

JRI 
  
Nuveen Real Asset Income and Growth Fund
Fund Performance, Leverage & Holdings Summaries December 31, 2025
Performance*
 
           
Total Returns as of

December 31, 2025
           
Average Annual 
     
Inception
Date
    
   1-Year
    
  5-Year
    
 10-Year
JRI at Common Share NAV
  
 
4/25/12


14.15%


5.77%
 
  
5.70%
JRI at Common Share Price
  
 
4/25/12


26.60%


10.58%
 
  
8.20%
MSCI World Index (Net)


21.09%


12.15%
 
  
12.17%
JRI Blended Benchmark


10.82%


4.93%
 
  
5.74%
* For purposes of Fund performance, relative results are measured against the JRI Blended Benchmark. Effective April 1, 2021, the JRI Blended benchmark consists of: 1) 25% FTSE EPRA Nareit Developed Index (Net), 2) 22% S&P Global Infrastructure Index (Net), 3) 20% ICE Hybrid & Preferred Infrastructure 7% Issuer Constrained Custom Index, 4) 13% FTSE Nareit Preferred Stock Index and 5) 20% Bloomberg U.S. Corporate High Yield Bond Index. Through March 31, 2021, the JRI Blended Benchmark consisted of 1) 21% FTSE EPRA Nareit Developed Index (Net), 2) 28% S&P Global Infrastructure Index (Net), 3) 15% Bloomberg Global Capital Securities Index, 4) 18% Wells Fargo Hybrid & Preferred Securities REIT Index, and 5) 18% Bloomberg U.S. Corporate High Yield Index.
Daily Common Share NAV and Share Price
 
LOGO
 
Common
  Share
  NAV
      
  Common
Share Price
      
Premium/(Discount)
      to NAV
      
Average
Premium/(Discount)
to NAV
 $13.37


  $13.61


     1.80%


(1.43)%
Growth of an Assumed $10,000 Investment as of December 31, 2025 -
Common Share Price
 
LOGO
 
18
 

Leverage and Holdings
 
Leverage
     
Effective Leverage
  
31.78%
Regulatory Leverage
  
31.78%
Fund Allocation
(% of net assets)
     
Common Stocks
  
70.5%
Corporate Bonds
  
47.4%
Preferred Stock
  
15.4%
Variable Rate Senior Loan Interests
  
3.6%
Convertible Preferred Securities
  
3.3%
Mortgage-Backed Securities
  
3.0%
Investment Companies
  
0.8%
Repurchase Agreements
  
2.5%
Other Assets & Liabilities, Net
  
0.1%
Borrowings
  
(46.6)%
Net Assets
  
100%
Portfolio Credit Quality
(% of total investments)
  
 
AA
  
0.3%
A
  
2.4%
BBB
  
22.1%
BB or Lower
  
20.2%
N/R (not rated)
  
4.6%
N/A (not applicable)
  
50.4%
Total
  
100%
Portfolio Composition
(% of total investments)
  
 
Utilities
  
27.6%
Common Stocks
  
24.0%
Energy
  
16.4%
Equity Real Estate Investment Trusts (REITs)
  
11.0%
Transportation
  
3.5%
Telecommunication Services
  
2.9%
Mortgage-Backed Securities
  
2.1%
Real Estate Management & Development
  
1.8%
Consumer Services
  
1.7%
Capital Goods
  
1.6%
Health Care Equipment & Services
  
1.3%
Financial Services
  
1.0%
Media & Entertainment
  
1.0%
Investment Companies
  
0.5%
Consumer Discretionary Distribution & Retail
  
0.5%
Preferred Stock
  
0.5%
Commercial & Professional Services
  
0.4%
Materials
  
0.2%
Automobiles & Components
  
0.2%
Technology Hardware & Equipment
  
0.1%
Repurchase Agreements
  
1.7%
Total
  
100%
Country Allocation
1
(% of total investments)
  
 
United States
  
69.1%
Canada
  
10.0%
United Kingdom
  
5.2%
France
  
2.5%
Italy
  
2.5%
Singapore
  
1.7%
Australia
  
1.6%
Japan
  
1.5%
Mexico
  
1.2%
Hong Kong
  
1.1%
Other
  
3.6%
Total
  
100%


1 Includes 2.0% (as a percentage of total investments) in emerging market countries
 
 
19

JRS 
 
Nuveen Real Estate Income Fund
Fund Performance, Leverage & Holdings Summaries December 31, 2025
Performance*
 
           
 Total Returns as of  

 December 31, 2025  
           
  Average Annual  
     
Inception
Date
    
1-Year
    
5-Year
    
10-Year
JRS at Common Share NAV
  
 
11/15/01


(1.70)%


4.68%
 
  
4.48%
JRS at Common Share Price
  
 
11/15/01


(3.39)%


6.70%
 
  
5.42%
FT Wilshire U.S. REIT Index


2.71%


6.49%
 
  
5.73%
FT Wilshire US Diversified REIT Index


3.47%


7.04%
 
  
5.74%
JRS Blended Benchmark


3.44%


4.87%
 
  
4.96%
* For purposes of Fund performance, relative results are measured against the JRS Blended Benchmark. Effective January 1, 2025, the JRS Blended Benchmark consisted of: 1) 60% FT Wilshire U.S. REIT Index and 2) 40% FTSE Nareit Preferred Stock Index. Through December 31, 2024, the JRS Blended Benchmark consisted of: 1) 60% Wilshire U.S. Real Estate Securities Index and 2) 40% FTSE Nareit Preferred Stock Index. Through March 31, 2021, the JRS Blended Benchmark consisted of 1) 60% Wilshire U.S. Real Estate Securities Index and 2) 40% Wells Fargo Hybrid & Preferred Securities REIT Index.
Daily Common Share NAV and Share Price
 
LOGO
 
Common
  Share
  NAV
      
  Common
Share Price
      
Premium/(Discount)
      to NAV
      
Average
Premium/(Discount)
to NAV
 $8.21


   $7.66


      (6.70)%


(6.74)%
Growth of an Assumed $10,000 Investment as of December 31, 2025 - Common Share Price
 
LOGO
 
20
 

Leverage and Holdings
 
Leverage
     
Effective Leverage
  
30.15%
Regulatory Leverage
  
30.15%
Fund Allocation
(% of net assets)
     
Common Stocks
  
103.5%
Preferred Stock
  
38.0%
Convertible Preferred Securities
  
0.7%
Repurchase Agreements
  
2.6%
Other Assets & Liabilities, Net
  
(1.6)%
Borrowings
  
(43.2)%
Net Assets
  
100%
Portfolio Credit Quality
(% of total investments)
     
A
  
3.1%
BBB
  
13.1%
BB or Lower
  
4.8%
N/R (not rated)
  
5.7%
N/A (not applicable)
  
73.3%
Total
  
100%
Portfolio Composition
1
(% of total investments)
     
Retail REITs
  
19.3%
Office REITs
  
12.5%
Industrial REITs
  
11.8%
Health Care REITs
  
11.0%
Data Center REITs
  
10.3%
Multi-Family Residential REITs
  
9.6%
Self-Storage REITs
  
8.3%
Hotel & Resort REITs
  
4.9%
Single-Family Residential REITs
  
4.9%
Other Specialized REITs
  
2.0%
Other
  
3.6%
Repurchase Agreements
  
1.8%
Total
  
100%


1
See the Portfolio of Investments for the remaining industries/sectors comprising “Other” and not listed in the table above.
 
 
21

Report of Independent Registered
Public Accounting Firm
To the Board of Trustees and Shareholders of Nuveen Multi-Asset Income Fund, Nuveen Real Asset Income and Growth Fund and Nuveen Real Estate Income Fund
Opinions on the Financial Statements
We have audited the accompanying statements of assets and liabilities, including the portfolios of investments, of Nuveen Multi-Asset Income Fund, Nuveen Real Asset Income and Growth Fund and Nuveen Real Estate Income Fund (hereafter collectively referred to as the “Funds”), as of December 31, 2025, the related statements of operations, changes in net assets, and cash flows, including the related notes, and the financial highlights for the year ended December 31, 2025 (collectively referred to as the “financial statements”). In our opinion, the financial statements present fairly, in all material respects, the financial position of each of the Funds as of December 31, 2025, and the results of each of their operations, changes in each of their net assets, each of their cash flows and each of the financial highlights for the year ended December 31, 2025 in conformity with accounting principles generally accepted in the United States of America.
The financial statements of the Funds as of and for the year ended December 31, 2024 and the financial highlights for each of the periods ended on or prior to December 31, 2024 (not presented herein, other than the statement of changes in net assets and the financial highlights) were audited by other auditors whose report dated February 28, 2025 expressed an unqualified opinion on those financial statements and financial highlights.
Basis for Opinions
These financial statements are the responsibility of the Funds’ management. Our responsibility is to express an opinion on the Funds’ financial statements based on our audits. We are a public accounting firm registered with the Public Company Accounting Oversight Board (United States) (PCAOB) and are required to be independent with respect to the Funds in accordance with the U.S. federal securities laws and the applicable rules and regulations of the Securities and Exchange Commission and the PCAOB.
We conducted our audits of these financial statements in accordance with the standards of the PCAOB. Those standards require that we plan and perform the audit to obtain reasonable assurance about whether the financial statements are free of material misstatement, whether due to error or fraud.
Our audits included performing procedures to assess the risks of material misstatement of the financial statements, whether due to error or fraud, and performing procedures that respond to those risks. Such procedures included examining, on a test basis, evidence regarding the amounts and disclosures in the financial statements. Our audits also included evaluating the accounting principles used and significant estimates made by management, as well as evaluating the overall presentation of the financial statements. Our procedures included confirmation of securities owned as of December 31, 2025 by correspondence with the custodian, transfer agent, agent banks and brokers; when replies were not received from agent banks or brokers, we performed other auditing procedures. We believe that our audits provide a reasonable basis for our opinions.
/s/ PricewaterhouseCoopers LLP
Chicago, Illinois
February 27, 2026
We have served as the auditor of one or more investment companies in Nuveen Funds since 2002.

Portfolio of Investments December 31, 2025
NMAI
‘ 
 
     PRINCIPAL
        
DESCRIPTION
  
RATE
    
MATURITY
    
VALUE


LONG-TERM INVESTMENTS - 141.8% (98.5% of Total Investments)
        
    
ASSET-BACKED SECURITIES - 0.5% (0.3% of Total Investments)
        
$
300,000
 
  
(a)
 
Avis Budget Rental Car Funding AESOP LLC, Series 2021 2A
  
 
1.660%


02/20/28
 
  
$
     293,201
 
 
284,250
 
  
(a)
 
Domino’s Pizza Master Issuer LLC, Series 2018 1A
  
 
4.328


07/25/48


283,417
 
 
306,000
 
    
Ford Credit Auto Owner Trust, Series 2024 D
  
 
4.610


08/15/29


309,367
 
 
250,000
 
  
(a)
 
Hertz Vehicle Financing III LLC, Series 2023 3A
  
 
5.940


02/25/28


253,741
 
 
238,999
 
  
(a),(b)
 
Industrial DPR Funding Ltd, Series 2022 1A
  
 
5.380


04/15/34


217,130
 
 
107,511
 
  
(a)
 
MVW LLC, Series 2020 1A
  
 
1.740


10/20/37


105,912
 
 
39,846
 
  
(a)
 
OneMain Financial Issuance Trust, Series 2022 2A
  
 
4.890


10/14/34


39,877
 
 
117,187
 
  
(a)
 
PenFed Auto Receivables Owner Trust, Series 2022 A
  
 
4.600


12/15/28


117,220
 
 
300,000
 
  
(a)
 
PFS Financing Corp, Series 2025 B
  
 
4.850


02/15/30


305,371
 
 
244,239
 
  
(a)
 
Sierra Timeshare Receivables Funding LLC, Series 2024 3A
  
 
4.830


08/20/41


246,363


TOTAL ASSET-BACKED SECURITIES
(Cost $2,170,748)
        
 
2,171,599


SHARES
         
DESCRIPTION
                  
VALUE
 
    
COMMON STOCKS - 70.0% (48.7% of Total Investments)
        
    
AUTOMOBILES & COMPONENTS - 0.3%
        
 
2,474
 
  
(c),(d)
 
Tesla Inc
        
 
1,112,607
 
 
23,400
 
    
Toyota Motor Corp
        
 
502,564


TOTAL AUTOMOBILES & COMPONENTS
        
 
1,615,171


BANKS - 8.1%
        
 
156,948
 
    
Banco Bilbao Vizcaya Argentaria SA
        
 
3,681,560
 
 
309,244
 
    
Banco Santander SA
        
 
3,639,953
 
 
21,667
 
  
(c)
 
Bank of America Corp
        
 
1,191,685
 
 
502,000
 
    
Bank Rakyat Indonesia Persero Tbk PT
        
 
109,941
 
 
453,393
 
    
Barclays PLC
        
 
2,902,227
 
 
5,200
 
    
Citigroup Inc
        
 
606,788
 
 
9,044
 
    
Commonwealth Bank of Australia
        
 
965,348
 
 
7,918
 
    
Fifth Third Bancorp
        
 
370,642
 
 
68,000
 
    
Grupo Financiero Banorte SAB de CV
        
 
630,400
 
 
18,530
 
    
HDFC Bank Ltd, ADR
        
 
677,086
 
 
68,395
 
    
ING Groep NV
        
 
1,922,462
 
 
196,544
 
    
Itau Unibanco Holding SA
        
 
1,404,673
 
 
24,239
 
    
JPMorgan Chase & Co
        
 
7,810,291
 
 
3,150
 
    
M&T Bank Corp
        
 
634,662
 
 
199,200
 
    
Mitsubishi UFJ Financial Group Inc
        
 
3,161,517
 
 
43,288
 
    
Nordea Bank Abp
        
 
814,431
 
 
3,070
 
  
(c)
 
PNC Financial Services Group Inc/The
        
 
640,801
 
 
95,800
 
    
Sumitomo Mitsui Financial Group Inc
        
 
3,081,063
 
 
3,557
 
    
UniCredit SpA
        
 
294,615
 
 
52,646
 
  
(c),(e)
 
Wells Fargo & Co
        
 
4,906,607


TOTAL BANKS
        
 
39,446,752


CAPITAL GOODS - 7.9%
        
 
22,403
 
    
ABB Ltd
        
 
1,651,493
 
 
16,247
 
    
Airbus SE
        
 
3,772,940
 
 
3,853
 
  
(c),(d)
 
Boeing Co/The
        
 
836,563
 
 
3,715
 
    
Caterpillar Inc
        
 
2,128,212
 
 
10,485
 
    
Cie de Saint-Gobain SA
        
 
1,066,239
 
 
832
 
    
Deere & Co
        
 
387,354
 
 
3,257
 
    
Dover Corp
        
 
635,897
 
 
9,043
 
  
(c)
 
Eaton Corp PLC
        
 
2,880,286
 
 
9,088
 
  
(c)
 
Emerson Electric Co
        
 
1,206,159
 
 
586
 
    
Ferrovial SE
        
 
37,967
 
 
131,400
 
    
Hitachi Ltd
        
 
4,120,909
 
 
11,354
 
    
Honeywell International Inc
        
 
2,215,052
 
 
3,550
 
  
(c)
 
Howmet Aerospace Inc
        
 
727,821
 
 
4,780
 
    
Masco Corp
        
 
303,339
 
 
88,100
 
    
Mitsubishi Electric Corp
        
 
2,568,718
 
 
1,735
 
    
Northrop Grumman Corp
        
 
989,314
 
 
See Notes to Financial Statements
 
23

Portfolio of Investments December 31, 2025
(continued)
NMAI
 
 
     SHARES
 
    
DESCRIPTION


VALUE


CAPITAL GOODS
(continued)
        
 
1,734
 
  
(c)
 
Parker-Hannifin Corp
        
$
1,524,117
 
 
1,689
 
    
Rheinmetall AG
        
 
3,081,401
 
 
9,392
 
    
RTX Corp
        
 
1,722,493
 
 
9,241
 
    
Siemens AG
        
 
2,588,186
 
 
3,314
 
    
Trane Technologies PLC
        
 
1,289,809
 
 
883
 
    
United Rentals Inc
        
 
714,630
 
 
4,817
 
    
Vinci SA
        
 
677,670
 
 
2,700
 
    
Westinghouse Air Brake Technologies Corp
        
 
576,315


TOTAL CAPITAL GOODS
        
 
37,702,884


COMMERCIAL & PROFESSIONAL SERVICES - 0.6%
        
 
971
 
  
(d)
 
Casella Waste Systems Inc, Class A
        
 
95,100
 
 
22,727
 
    
Cleanaway Waste Management Ltd
        
 
39,182
 
 
9,000
 
  
(d)
 
Copart Inc
        
 
352,350
 
 
2,344
 
  
(c)
 
GFL Environmental Inc
        
 
100,675
 
 
3,458
 
    
Republic Services Inc
        
 
732,854
 
 
5,400
 
    
Veralto Corp
        
 
538,812
 
 
886
 
    
Waste Connections Inc
        
 
155,369
 
 
3,131
 
    
Waste Management Inc
        
 
687,912


TOTAL COMMERCIAL & PROFESSIONAL SERVICES
        
 
2,702,254


CONSUMER DISCRETIONARY DISTRIBUTION & RETAIL - 3.0%
        
 
6,142
 
  
(c)
 
Alibaba Group Holding Ltd, Sponsored ADR
        
 
900,294
 
 
31,402
 
  
(c),(d),(e)
 
Amazon.com Inc
        
 
7,248,210
 
 
1
 
  
(b),(d)
 
Belk Inc
        
 
8
 
 
6,010
 
  
(c)
 
Home Depot Inc/The
        
 
2,068,041
 
 
2,415
 
    
Lowe’s Cos Inc
        
 
582,401
 
 
22,132
 
  
(c),(d)
 
O’Reilly Automotive Inc
        
 
2,018,660
 
 
8,839
 
  
(c)
 
TJX Cos Inc/The
        
 
1,357,759


TOTAL CONSUMER DISCRETIONARY DISTRIBUTION & RETAIL
        
 
14,175,373


CONSUMER DURABLES & APPAREL - 2.0%
        
 
8,376
 
    
Cie Financiere Richemont SA
        
 
1,806,292
 
 
2,432
 
    
Kering SA
        
 
849,832
 
 
2,731
 
    
LVMH Moet Hennessy Louis Vuitton SE
        
 
2,058,452
 
 
8,038
 
    
Moncler SpA
        
 
513,790
 
 
11,348
 
    
NIKE Inc, Class B
        
 
722,981
 
 
73
 
  
(d)
 
NVR Inc
        
 
532,372
 
 
116,500
 
    
Sony Group Corp
        
 
2,988,339


TOTAL CONSUMER DURABLES & APPAREL
        
 
9,472,058


CONSUMER SERVICES - 0.8%
        
 
364,675(d)
 
    
24 Hour Fitness Worldwide Inc
        
 
2,553
 
 
105
 
    
Booking Holdings Inc
        
 
562,310
 
 
17,332
 
  
(d)
 
Crown Finance US Inc
        
 
324,975
 
 
3,567
 
    
Hilton Worldwide Holdings Inc
        
 
1,024,621
 
 
2,481
 
    
McDonald’s Corp
        
 
758,268
 
 
15,198(c)
 
    
Starbucks Corp
        
 
1,279,823


TOTAL CONSUMER SERVICES
        
 
3,952,550


CONSUMER STAPLES DISTRIBUTION & RETAIL - 1.6%
        
 
825
 
    
Casey’s General Stores Inc
        
 
455,986
 
 
3,175
 
    
Costco Wholesale Corp
        
 
2,737,930
 
 
39,621
 
  
(c)
 
Walmart Inc


4,414,175
 
    
TOTAL CONSUMER STAPLES DISTRIBUTION & RETAIL
        
 
7,608,091


ENERGY - 3.6%
        
 
95,975
 
    
BP PLC
        
 
559,723
 
 
4,283
 
  
(c)
 
Cheniere Energy Inc
        
 
832,572
 
 
7,444
 
    
Chevron Corp
        
 
1,134,540
 
 
17,294
 
  
(c)
 
ConocoPhillips
        
 
1,618,891
 
 
595
 
    
DT Midstream Inc
        
 
71,210
 
 
10,315
 
    
Enbridge Inc
        
 
493,366
 
 
13,309
 
    
Energy Transfer LP
        
 
219,465
 
 
4,094
 
  
(c)
 
EOG Resources Inc
        
 
429,911
 
 
34,397
 
  
(c)
 
Exxon Mobil Corp
        
 
4,139,336
 
 
10,355
 
  
(c),(e)
 
Kinder Morgan Inc
        
 
284,659
 
 
24
 
See Notes to Financial Statements

 
     SHARES
        
DESCRIPTION


VALUE


ENERGY
(continued)
        
  4,924      (c)   ONEOK Inc          $ 361,914  
  6,136        Pembina Pipeline Corp            233,763  
  8,158      (a)   Reliance Industries Ltd, Sponsored GDR            571,060  
  3,430      (a)   Reliance Industries Ltd, Sponsored GDR            240,162  
  1,101        Rockpoint Gas Storage Inc, Class A            22,460  
  78,048        Shell PLC            2,876,245  
  1,047        Targa Resources Corp            193,172  
  3,763        TC Energy Corp            207,211  
  9,415      (c)   Valero Energy Corp            1,532,668  
  16,049      (c)   Williams Cos Inc/The            964,705  


     TOTAL ENERGY            16,987,033  


EQUITY REAL ESTATE INVESTMENT TRUSTS (REITS) - 0.7%
        
  3,076        American Tower Corp            540,053  
  2,318        Crown Castle Inc            206,001  
  507        Digital Realty Trust Inc            78,438  
  132,713      (d)   NTT DC REIT            135,237  
  15,140      (c)   Prologis Inc            1,932,773  
  2,039        Simon Property Group Inc            377,439  


     TOTAL EQUITY REAL ESTATE INVESTMENT TRUSTS (REITS)            3,269,941  


FINANCIAL SERVICES - 3.2%
        
  6,941        American Express Co            2,567,823  
  800        Ameriprise Financial Inc            392,272  
  3,882        Ares Management Corp, Class A            627,448  
  2,482      (c),(d)   Berkshire Hathaway Inc, Class B            1,247,577  
  663        Blackrock Inc            709,635  
  5,891        Charles Schwab Corp/The            588,570  
  950      (d)   Corpay Inc            285,884  
  1,071      (c)   Goldman Sachs Group Inc/The            941,409  
  14,358        Infratil Ltd            91,621  
  4,088      (c)   Intercontinental Exchange Inc            662,092  
  7,218        KKR & Co Inc            920,151  
  3,823        Mastercard Inc, Class A            2,182,474  
  11,613        Nasdaq Inc            1,127,971  
  13,500        ORIX Corp            394,838  
  2,146        S&P Global Inc            1,121,478  
  7,400        SBI Holdings Inc            159,470  
  4,347      (c)   Visa Inc, Class A            1,524,536  


     TOTAL FINANCIAL SERVICES            15,545,249  


FOOD, BEVERAGE & TOBACCO - 2.3%
        
  36,717        British American Tobacco PLC            2,081,512  
  26,044      (c)   Coca-Cola Co/The            1,820,736  
  7,005        Fomento Economico Mexicano SAB de CV, Sponsored ADR            707,995  
  6,362        Heineken NV            524,909  
  2,897      (d)   Magnum Ice Cream Co NV/The            45,982  
  14,982        Mondelez International Inc, Class A            806,481  
  14,435      (c),(d)   Monster Beverage Corp            1,106,731  
  3,132        Nestle SA            310,880  
  2,521        PepsiCo Inc            361,814  
  19,362      (c)   Philip Morris International Inc            3,105,664  


     TOTAL FOOD, BEVERAGE & TOBACCO            10,872,704  


HEALTH CARE EQUIPMENT & SERVICES - 2.0%
        
  12,656      (c)   Abbott Laboratories            1,585,670  
  23,338      (c),(d)   Boston Scientific Corp            2,225,279  
  2,957        Cigna Group/The            813,855  
  2,959      (c)   Elevance Health Inc            1,037,277  
  2,367        EssilorLuxottica SA            748,440  
  960        HCA Healthcare Inc            448,186  
  4,421      (e)   Stryker Corp            1,553,849  
  2,256        UnitedHealth Group Inc            744,728  
  1,300      (d)   Veeva Systems Inc, Class A            290,199  


     TOTAL HEALTH CARE EQUIPMENT & SERVICES            9,447,483  


See Notes to Financial Statements
 
25

Portfolio of Investments December 31, 2025
(continued)
NMAI
 
     SHARES
        
DESCRIPTION


VALUE


HOUSEHOLD & PERSONAL PRODUCTS - 0.6%
        
  11,497      (c)   Procter & Gamble Co/The          $    1,647,635  
  1,908        Reckitt Benckiser Group PLC            154,394  
  12,877        Unilever PLC            841,347  


     TOTAL HOUSEHOLD & PERSONAL PRODUCTS            2,643,376  


INSURANCE - 0.7%
        
  7,099      (c)   American International Group Inc            607,319  
  1,699        Chubb Ltd            530,292  
  6,116      (c)   Marsh & McLennan Cos Inc            1,134,641  
  1,222        Zurich Insurance Group AG            924,690  


     TOTAL INSURANCE            3,196,942  


MATERIALS - 4.2%
        
  3,230        Air Liquide SA            607,091  
  32,504        Anglo American PLC            1,344,447  
  23,310        BHP Group Ltd            703,475  
  27,564      (c)   CRH PLC            3,439,987  
  6,961        DuPont de Nemours Inc            279,832  
  36,143      (c)   Freeport-McMoRan Inc            1,835,703  
  300,202        Glencore PLC            1,641,102  
  10,694        Heidelberg Materials AG            2,772,492  
  10,358      (c)   Linde PLC            4,416,549  
  1,176        Reliance Inc            339,711  
  74,845      (c)   Smurfit WestRock PLC            2,894,256  


     TOTAL MATERIALS            20,274,645  


MEDIA & ENTERTAINMENT - 3.7%
        
  15,810      (c),(e)   Alphabet Inc, Class A            4,948,530  
  16,011      (c)   Alphabet Inc, Class C            5,024,252  
  13,918        Comcast Corp, Class A            416,009  
  96(d)        Crown Finance US Inc            1,800  
  5,315      (c)   Meta Platforms Inc            3,508,378  
  7,250      (d)   Netflix Inc            679,760  
  26,010        Nintendo Co Ltd            1,756,053  
  13,685      (c)   Walt Disney Co/The            1,556,942  


     TOTAL MEDIA & ENTERTAINMENT            17,891,724  


PHARMACEUTICALS, BIOTECHNOLOGY & LIFE SCIENCES - 4.0%
        
  5,824      (c)   AbbVie Inc            1,330,726  
  14,030        AstraZeneca PLC            2,596,382  
  48,200        Daiichi Sankyo Co Ltd            1,023,505  
  5,576        Danaher Corp            1,276,458  
  2,855        Eli Lilly & Co            3,068,210  
  4,200        Gilead Sciences Inc            515,508  
  404,270        Haleon PLC            2,042,931  
  6,568        Johnson & Johnson            1,359,248  
  2,145        Lonza Group AG            1,446,201  
  2,247        Novartis AG            309,627  
  14,542        Novo Nordisk A/S, Class B            737,548  
  1,587        Regeneron Pharmaceuticals Inc            1,224,958  
  3,156        Roche Holding AG            1,303,334  
  925      (d)   United Therapeutics Corp            450,706  
  3,445        Zoetis Inc            433,450  


     TOTAL PHARMACEUTICALS, BIOTECHNOLOGY & LIFE SCIENCES            19,118,792  


SEMICONDUCTORS & SEMICONDUCTOR EQUIPMENT - 7.0%
        
  23,200        Advantest Corp            2,933,589  
  2,102        Analog Devices Inc            570,062  
  2,722        Applied Materials Inc            699,527  
  1,407        ASML Holding NV            1,516,071  
  4,217      (d)   Bright Bidco BV            1,476  
  3,087      (d)   Bright Bidco BV            1,081  
  23,944      (c)   Broadcom Inc            8,287,019  
  58,948      (c),(d)   Intel Corp            2,175,181  
  6,413        Lam Research Corp            1,097,777  
  1,706        Micron Technology Inc            486,909  
 
26
 
See Notes to Financial Statements

 
     SHARES
        
DESCRIPTION


VALUE


SEMICONDUCTORS & SEMICONDUCTOR EQUIPMENT
(continued)
        
 
51,412
 
  
(c)
 
NVIDIA Corp
        
$
   9,588,339
 
 
1,758
 
    
NXP Semiconductors NV
        
 
381,591
 
 
2,951
 
    
Qnity Electronics Inc
        
 
240,949
 
 
17,819
 
  
(c)
 
Taiwan Semiconductor Manufacturing Co Ltd, Sponsored ADR
        
 
5,415,016


TOTAL SEMICONDUCTORS & SEMICONDUCTOR EQUIPMENT
        
 
33,394,587


SOFTWARE & SERVICES - 3.8%
        
 
4,622
 
  
(c)
 
Accenture PLC, Class A
        
 
1,240,083
 
 
21,300
 
    
Fujitsu Ltd
        
 
585,386
 
 
2,275
 
    
International Business Machines Corp
        
 
673,878
 
 
26,623
 
  
(c)
 
Microsoft Corp
        
 
12,875,414
 
 
3,816
 
  
(d)
 
NEXTDC Ltd
        
 
31,772
 
 
3,450
 
  
(d)
 
Palo Alto Networks Inc
        
 
635,490
 
 
2,310
 
    
SAP SE
        
 
561,257
 
 
8,225
 
  
(d)
 
ServiceNow Inc
        
 
1,259,988
 
 
1,000
 
  
(d)
 
Synopsys Inc
        
 
469,720


TOTAL SOFTWARE & SERVICES
        
 
18,332,988


TECHNOLOGY HARDWARE & EQUIPMENT - 4.1%
        
 
8,528
 
  
(c)
 
Amphenol Corp, Class A
        
 
1,152,474
 
 
44,299
 
  
(c),(e)
 
Apple Inc
        
 
12,043,126
 
 
15,125
 
    
Cisco Systems Inc
        
 
1,165,079
 
 
312
 
  
(d)
 
MLN US Holdco LLC
        
 
3
 
 
1,984
 
    
Motorola Solutions Inc
        
 
760,507
 
 
4,136
 
  
(d)
 
Riverbed Technology LLC/US
        
 
41
 
 
48,420
 
    
Samsung Electronics Co Ltd
        
 
4,058,317
 
 
2,631
 
    
TE Connectivity PLC
        
 
598,579


TOTAL TECHNOLOGY HARDWARE & EQUIPMENT
        
 
19,778,126


TELECOMMUNICATION SERVICES - 0.2%
        
 
2,856
 
  
(d)
 
Altice France Lux 3
        
 
50,299
 
 
5,029
 
  
(a)
 
Cellnex Telecom SA
        
 
161,942
 
 
5,142
 
  
(a)
 
Infrastrutture Wireless Italiane SpA
        
 
47,585
 
 
125,119
 
    
Koninklijke KPN NV
        
 
584,645
 
 
1,599
 
    
T-Mobile US Inc
        
 
324,661


TOTAL TELECOMMUNICATION SERVICES
        
 
1,169,132


TRANSPORTATION - 1.5%
        
 
26,442
 
  
(a)
 
Aena SME SA
        
 
738,812
 
 
1,101
 
    
Aeroports de Paris SA
        
 
143,676
 
 
35,309
 
    
Atlas Arteria Ltd
        
 
114,844
 
 
64,469
 
    
Auckland International Airport Ltd
        
 
309,193
 
 
586
 
    
Canadian Pacific Kansas City Ltd
        
 
43,147
 
 
6,877
 
    
CSX Corp
        
 
249,291
 
 
22,813
 
    
Dalrymple Bay Infrastructure Ltd
        
 
76,184
 
 
4,022
 
    
DSV A/S
        
 
1,012,966
 
 
950
 
    
FedEx Corp
        
 
274,417
 
 
3,512
 
  
(d)
 
Fraport AG Frankfurt Airport Services Worldwide
        
 
287,185
 
 
12,786
 
    
Getlink SE
        
 
236,017
 
 
1,198
 
    
Grupo Aeroportuario del Centro Norte SAB de CV, ADR
        
 
130,306
 
 
1,246
 
    
Grupo Aeroportuario del Pacifico SAB de CV, ADR
        
 
328,483
 
 
1,458
 
    
Grupo Aeroportuario del Sureste SAB de CV, ADR
        
 
471,517
 
 
14,316
 
    
International Container Terminal Services Inc
        
 
137,380
 
 
455
 
    
Norfolk Southern Corp
        
 
131,368
 
 
107,020
 
    
Qube Holdings Ltd
        
 
339,522
 
 
7,476
 
    
Tokyo Metro Co Ltd
        
 
76,101
 
 
50,243
 
    
Transurban Group
        
 
475,479
 
 
6,166
 
    
Union Pacific Corp
        
 
1,426,320


TOTAL TRANSPORTATION
        
 
7,002,208


UTILITIES - 4.1%
        
 
8,013
 
    
Alliant Energy Corp
        
 
520,925
 
 
5,245
 
    
AltaGas Ltd
        
 
159,924
 
 
9,577
 
  
(c)
 
Ameren Corp
        
 
956,359
 
 
13,063
 
  
(c)
 
American Electric Power Co Inc
        
 
1,506,295
 
 
239
 
    
American Water Works Co Inc
        
 
31,190
 
 
See Notes to Financial Statements
 
27

Portfolio of Investments December 31, 2025
(continued)
NMAI
 
     SHARES
        
DESCRIPTION


VALUE


UTILITIES
(continued)
        
 
12,778
 
  
(c)
 
CenterPoint Energy Inc
        
$
   489,909
 
 
1,413
 
    
CMS Energy Corp
        
 
98,811
 
 
311
 
    
Constellation Energy Corp
        
 
109,867
 
 
6,371
 
    
Duke Energy Corp
        
 
746,745
 
 
50,143
 
    
E.ON SE
        
 
949,454
 
 
1,557
 
    
Elia Group SA/NV
        
 
200,359
 
 
46,191
 
    
Enel SpA
        
 
480,263
 
 
5,332
 
    
Engie SA
        
 
140,068
 
 
11,653
 
  
(c)
 
Entergy Corp
        
 
1,077,087
 
 
4,114
 
    
Evergy Inc
        
 
298,224
 
 
98,161
 
    
Iberdrola SA
        
 
2,125,518
 
 
659
 
    
IDACORP Inc
        
 
83,403
 
 
52,982
 
    
National Grid PLC
        
 
812,663
 
 
30,266
 
  
(c)
 
NextEra Energy Inc
        
 
2,429,753
 
 
15,469
 
  
(e)
 
NiSource Inc
        
 
645,985
 
 
1,413
 
    
NRG Energy Inc
        
 
225,006
 
 
12,156
 
    
Pennon Group PLC
        
 
86,156
 
 
11,366
 
    
PG&E Corp
        
 
182,652
 
 
5,103
 
    
Redeia Corp SA
        
 
90,970
 
 
28,725
 
    
RWE AG
        
 
1,522,047
 
 
27,807
 
    
Sembcorp Industries Ltd
        
 
129,987
 
 
9,702
 
    
Sempra
        
 
856,590
 
 
4,449
 
    
Severn Trent PLC
        
 
167,065
 
 
2,242
 
    
Southern Co/The
        
 
195,502
 
 
6,324
 
    
SSE PLC
        
 
185,406
 
 
7,130
 
    
Terna - Rete Elettrica Nazionale
        
 
75,854
 
 
2,602
 
    
United Utilities Group PLC
        
 
41,805
 
 
5,310
 
    
Veolia Environnement SA
        
 
184,775
 
 
2,746
 
    
Vistra Corp
        
 
443,012
 
 
5,743
 
    
WEC Energy Group Inc
        
 
605,657
 
 
13,419
 
  
(c)
 
Xcel Energy Inc
        
 
991,127


TOTAL UTILITIES
        
 
19,846,413


TOTAL COMMON STOCKS
(Cost $248,204,989)
        
 
335,446,476


PRINCIPAL
        
DESCRIPTION
  
RATE
    
MATURITY
    
VALUE


CORPORATE BONDS - 19.3% (13.4% of Total Investments) (f)
        
    
AUTOMOBILES & COMPONENTS - 0.3%
        
$
105,000
 
  
(a)
 
Clarios Global LP / Clarios US Finance Co
  
 
6.750%


02/15/30


109,600
 
 
295,000
 
  
(g),(h)
 
General Motors Financial Co Inc
  
 
5.750


N/A


291,329
 
 
177,000
 
  
(g),(h)
 
General Motors Financial Co Inc
  
 
5.700


N/A


177,722
 
 
375,000
 
    
Goodyear Tire & Rubber Co/The
  
 
5.000


07/15/29


370,521
 
 
165,000
 
  
(a)
 
Phinia Inc
  
 
6.750


04/15/29


170,772
 
 
255,000
 
  
(a)
 
Phinia Inc
  
 
6.625


10/15/32


264,038


TOTAL AUTOMOBILES & COMPONENTS
        
 
1,383,982


BANKS - 2.7%
        
 
92,000
 
  
(g),(h)
 
Bank of America Corp
  
 
4.375


N/A


91,004
 
 
266,000
 
  
(g),(h)
 
Bank of America Corp
  
 
6.125


N/A


269,961
 
 
1,163,000
 
  
(c),(g),(h)
 
Bank of America Corp
  
 
6.625


N/A


1,211,788
 
 
294,000
 
  
(g),(h)
 
Bank of America Corp
  
 
6.250


N/A


298,618
 
 
147,000
 
  
(g),(h)
 
Citigroup Inc
  
 
6.250


N/A


147,139
 
 
260,000
 
  
(g),(h)
 
Citigroup Inc
  
 
7.375


N/A


272,773
 
 
794,000
 
  
(g),(h)
 
Citigroup Inc
  
 
7.625


N/A


832,524
 
 
378,000
 
  
(g),(h)
 
Citigroup Inc
  
 
7.125


N/A


389,706
 
 
314,000
 
  
(g),(h)
 
Citigroup Inc
  
 
7.000


N/A


331,166
 
 
90,000
 
    
Citigroup Inc
  
 
4.503


09/11/31


90,279
 
 
80,000
 
    
Citigroup Inc
  
 
5.174


09/11/36


80,748
 
 
141,000
 
  
(g),(h)
 
Citigroup Inc
  
 
6.625


N/A


143,294
 
 
169,000
 
  
(g),(h)
 
Citigroup Inc
  
 
6.875


N/A


175,609
 
 
125,000
 
  
(g),(h),(i)
 
Citizens Financial Group Inc (TSFR3M + 3.419%)
  
 
7.353


N/A


124,531
 
 
335,000
 
  
(g),(h)
 
Citizens Financial Group Inc
  
 
4.000


N/A


333,232
 
 
28
 
See Notes to Financial Statements

 
     PRINCIPAL
        
DESCRIPTION
  
RATE
    
MATURITY
    
VALUE


BANKS
(continued)
        
  $229,000      (g),(h),(i)   Fifth Third Bancorp (TSFR3M + 3.295%)      6.967%        N/A      $    229,453  
  163,000      (g),(h)   First Citizens BancShares Inc/NC      7.000        N/A        166,664  
  242,000      (g),(h),(i)   First Citizens BancShares Inc/NC (TSFR3M + 4.234%)      7.957        N/A        245,051  
  431,000      (g),(h)   Huntington Bancshares Inc/OH      5.625        N/A        438,595  
  268,000      (g),(h)   Huntington Bancshares Inc/OH      6.250        N/A        268,226  
  351,000      (g),(h)   JPMorgan Chase & Co      6.500        N/A        364,728  
  1,103,000      (c),(g),(h)   JPMorgan Chase & Co      6.875        N/A        1,169,748  
  270,000      (g),(h)   M&T Bank Corp      5.125        N/A        269,526  
  135,000        Morgan Stanley Private Bank NA      4.204        11/17/28        135,422  
  905,000        Morgan Stanley Private Bank NA      4.465        11/19/31        907,369  
  325,000      (g),(h)   PNC Financial Services Group Inc/The      6.000        N/A        328,508  
  253,000      (g),(h)   PNC Financial Services Group Inc/The      3.400        N/A        248,026  
  529,000      (g),(h)   PNC Financial Services Group Inc/The      6.250        N/A        546,132  
  715,000      (g),(h)   Truist Financial Corp      6.669        N/A        716,956  
  152,000      (g),(h)   Truist Financial Corp      5.100        N/A        153,044  
  120,000      (h)   Webster Financial Corp      5.784        09/11/35        119,928  
  160,000        Wells Fargo & Co      5.150        04/23/31        165,153  
  950,000      (g),(h)   Wells Fargo & Co      7.625        N/A        1,013,277  
  308,000      (g),(h)   Wells Fargo & Co      3.900        N/A        307,042  
  110,000        Wells Fargo & Co      5.605        04/23/36        115,292  
  497,000      (g),(h)   Wells Fargo & Co      6.850        N/A        519,372  


     TOTAL BANKS            13,219,884  


CAPITAL GOODS. - 0.9%
        
  220,000      (a)   AECOM      6.000        08/01/33        225,469  
  93,000      (g),(h)   Air Lease Corp      4.125        N/A        90,785  
  241,000      (g),(h)   Air Lease Corp      6.000        N/A        229,872  
  300,000      (a)   Alta Equipment Group Inc      9.000        06/01/29        270,929  
  255,000        Boeing Co/The      5.805        05/01/50        250,817  
  175,000        Boeing Co/The      6.528        05/01/34        193,613  
  150,000      (a)   Camelot Return Merger Sub Inc      8.750        08/01/28        116,234  
  100,000      (a)   Carpenter Technology Corp      5.625        03/01/34        101,573  
  75,000      (a)   Gates Corp/DE      6.875        07/01/29        77,886  
  195,000      (a)   Herc Holdings Inc      6.625        06/15/29        202,429  
  315,000      (a)   Herc Holdings Inc      7.000        06/15/30        331,515  
  75,000      (a)   Herc Holdings Inc      5.750        03/15/31        76,113  
  95,000      (a)   Herc Holdings Inc      6.000        03/15/34        96,266  
  45,000        Honeywell International Inc      5.250        03/01/54        42,529  
  180,000      (a)   Masterbrand Inc      7.000        07/15/32        186,485  
  250,000      (a)   Quikrete Holdings Inc      6.375        03/01/32        260,220  
  245,000        Regal Rexnord Corp      6.050        04/15/28        253,443  
  120,000      (a)   Standard Building Solutions Inc      6.250        08/01/33        122,584  
  450,000      (a)   TransDigm Inc      6.375        03/01/29        464,072  
  300,000      (a)   TransDigm Inc      6.375        05/31/33        307,838  
  375,000      (a)   TransDigm Inc      6.875        12/15/30        392,441  
  200,000      (a)   Windsor Holdings III LLC      8.500        06/15/30        211,272  


     TOTAL CAPITAL GOODS            4,504,385  


COMMERCIAL & PROFESSIONAL SERVICES - 0.4%
        
  300,000      (a)   AMN Healthcare Inc      6.500        01/15/31        300,056  
  240,000      (a)   ASGN Inc      4.625        05/15/28        235,825  
  75,000      (a)   Boost Newco Borrower LLC      7.500        01/15/31        79,714  
  105,000      (a)   Clean Harbors Inc      5.750        10/15/33        107,709  
  270,000      (a)   Neptune Bidco US Inc      9.290        04/15/29        270,461  
  54,000      (a)   Prime Security Services Borrower LLC / Prime Finance Inc      5.750        04/15/26        54,019  
  200,000      (a)   Prime Security Services Borrower LLC / Prime Finance Inc      3.375        08/31/27        196,091  
  400,000      (a)   RR Donnelley & Sons Co      9.500        08/01/29        412,201  
  110,000        Waste Management Inc      4.950        03/15/35        111,720  


     TOTAL COMMERCIAL & PROFESSIONAL SERVICES            1,767,796  


CONSUMER DISCRETIONARY DISTRIBUTION & RETAIL - 0.6%
        
  240,000      (a)   Academy Ltd      6.000        11/15/27        240,177  
  225,000      (a)   Bath & Body Works Inc      6.625        10/01/30        230,039  
  310,000        Kohl’s Corp      5.125        05/01/31        272,684  
 
See Notes to Financial Statements
 
29

Portfolio of Investments December 31, 2025
(continued)
NMAI
 
     PRINCIPAL
         
DESCRIPTION
  
RATE
   
MATURITY
    
VALUE


CONSUMER DISCRETIONARY DISTRIBUTION & RETAIL
(continued)
       
  $240,000      (a)    LCM Investments Holdings II LLC      4.875     05/01/29      $    236,451  
  50,000      (a)    Macy’s Retail Holdings LLC      6.125       03/15/32        50,606  
  525,000      (a)    Michaels Cos Inc/The      5.250       05/01/28        504,712  
  300,000      (a)    Michaels Cos Inc/The      7.875       05/01/29        276,929  
  200,000      (a)    Park River Holdings Inc      8.000       03/15/31        206,199  
  70,000      (a)    PetSmart Inc / PetSmart Finance Corp      7.500       09/15/32        71,238  
  270,000      (a)    QXO Building Products Inc      6.750       04/30/32        281,993  
  300,000      (a)    Staples Inc      10.750       09/01/29        298,254  
  50,000         Veritiv Operating Co      10.500       11/30/30        53,761  
  150,000      (a)    Wayfair LLC      7.250       10/31/29        156,551  


      TOTAL CONSUMER DISCRETIONARY DISTRIBUTION & RETAIL           2,879,594  


CONSUMER DURABLES & APPAREL - 0.3%
       
  380,000      (a)    CD&R Smokey Buyer Inc / Radio Systems Corp      9.500       10/15/29        309,930  
  60,000      (a)    Champ Acquisition Corp      8.375       12/01/31        64,806  
  240,000         Newell Brands Inc      6.625       09/15/29        239,126  
  360,000      (a)    S&S Holdings LLC      8.375       10/01/31        344,963  
  60,000      (a)    TopBuild Corp      5.625       01/31/34        60,695  
  345,000      (a)    Wolverine World Wide Inc      4.000       08/15/29        318,901  


      TOTAL CONSUMER DURABLES & APPAREL           1,338,421  


CONSUMER SERVICES - 0.7%
       
  225,000      (a)    Caesars Entertainment Inc      6.000       10/15/32        218,801  
  360,000      (a)    Carnival Corp      5.875       06/15/31        371,845  
  460,000      (a)    Churchill Downs Inc      5.750       04/01/30        464,481  
  285,000      (a)    Cinemark USA Inc      7.000       08/01/32        295,745  
  345,000      (a)    Fertitta Entertainment LLC / Fertitta Entertainment Finance Co Inc      4.625       01/15/29        335,075  
  175,000      (a)    Hilton Domestic Operating Co Inc      5.500       03/31/34        176,202  
  40,000         Hyatt Hotels Corp      5.400       12/15/35        40,083  
  120,000      (a)    Life Time Inc      6.000       11/15/31        122,941  
  150,000      (a)    Light & Wonder International Inc      6.250       10/01/33        151,860  
  240,000      (a)    Marriott Ownership Resorts Inc      6.500       10/01/33        230,233  
  185,000         MGM Resorts International      6.125       09/15/29        190,119  
  102,350      (a)    Muvico LLC, (cash 9.000%, PIK 6.000%)      9.000       02/19/29        111,019  
  60,000      (a)    NCL Corp Ltd      5.875       01/15/31        59,773  
  95,000      (a)    NCL Corp Ltd      6.250       09/15/33        94,960  
  150,000      (a)    Six Flags Entertainment Corp / Six Flags Theme Parks Inc      6.625       05/01/32        151,262  
  150,000      (a)    Wynn Resorts Finance LLC / Wynn Resorts Capital Corp      6.250       03/15/33        153,371  


      TOTAL CONSUMER SERVICES           3,167,770  


CONSUMER STAPLES DISTRIBUTION & RETAIL - 0.1%
       
  250,000      (a)    Albertsons Cos Inc / Safeway Inc / New Albertsons LP / Albertsons LLC      6.250       03/15/33        256,995  
  115,000      (a)    Albertsons Cos Inc / Safeway Inc / New Albertsons LP / Albertsons LLC      5.750       03/31/34        115,465  
  200,000      (a)    Albertsons Cos Inc / Safeway Inc / New Albertsons LP / Albertsons LLC      5.875       02/15/28        200,767  


      TOTAL CONSUMER STAPLES DISTRIBUTION & RETAIL           573,227  


ENERGY - 2.1%
       
  225,000      (a)    Antero Midstream Partners LP / Antero Midstream Finance Corp      5.750       10/15/33        226,359  
  195,000      (a)    Archrock Partners LP / Archrock Partners Finance Corp      6.250       04/01/28        196,119  
  250,000      (a)    Archrock Partners LP / Archrock Partners Finance Corp      6.625       09/01/32        257,839  
  325,000      (a)    Ascent Resources Utica Holdings LLC / ARU Finance Corp      6.625       10/15/32        335,599  
  240,000      (a)    Buckeye Partners LP      6.750       02/01/30        251,940  
  85,000      (a)    Chord Energy Corp      6.000       10/01/30        86,042  
  300,000      (a)    Chord Energy Corp      6.750       03/15/33        310,235  
  295,000      (a)    Civitas Resources Inc      8.750       07/01/31        306,033  
  165,000      (a)    Civitas Resources Inc      8.375       07/01/28        170,015  
  280,000      (a)    CNX Resources Corp      7.250       03/01/32        292,292  
  95,000      (a)    Delek Logistics Partners LP / Delek Logistics Finance Corp      7.375       06/30/33        96,943  
  273,000      (h)    Energy Transfer LP      6.750       02/15/56        274,042  
  95,000      (h)    Energy Transfer LP      8.000       05/15/54        101,408  
 
30
 
See Notes to Financial Statements

 
     PRINCIPAL
        
DESCRIPTION
  
RATE
    
MATURITY
    
VALUE


ENERGY
(continued)
        
$ 358,000      (g),(h)   Energy Transfer LP      7.125%        N/A      $    366,575  
  49,000      (g),(h)   Energy Transfer LP      6.625        N/A        48,752  
  91,000      (g),(h)   Energy Transfer LP      6.500        N/A        91,401  
  150,000        Genesis Energy LP / Genesis Energy Finance Corp      7.875        05/15/32        156,362  
  160,000      (a)   Global Partners LP / GLP Finance Corp      8.250        01/15/32        168,524  
  400,000      (a)   Harvest Midstream I LP      7.500        05/15/32        416,953  
  495,000      (a)   Hilcorp Energy I LP / Hilcorp Finance Co      5.750        02/01/29        489,738  
  100,000      (a)   Hilcorp Energy I LP / Hilcorp Finance Co      6.250        04/15/32        94,138  
  130,000      (a)   Hilcorp Energy I LP / Hilcorp Finance Co      8.375        11/01/33        132,737  
  345,000      (a)   Kinetik Holdings LP      5.875        06/15/30        348,091  
  150,000      (a)   Kodiak Gas Services LLC      7.250        02/15/29        156,053  
  50,000      (a)   Kodiak Gas Services LLC      6.500        10/01/33        51,061  
  75,000      (a)   Kodiak Gas Services LLC      6.750        10/01/35        77,116  
  220,000      (a)   Matador Resources Co      6.250        04/15/33        220,293  
  295,000      (a)   Noble Finance II LLC      8.000        04/15/30        306,480  
  105,000        ONEOK Inc      5.050        11/01/34        104,062  
  400,000      (a)   PBF Holding Co LLC / PBF Finance Corp      7.875        09/15/30        385,215  
  70,000      (a)   PBF Holding Co LLC / PBF Finance Corp      9.875        03/15/30        72,012  
  150,000      (a)   Rockies Express Pipeline LLC      6.750        03/15/33        158,298  
  300,000      (a)   Sunoco LP      6.250        07/01/33        307,295  
  225,000      (a),(g),(h)   Sunoco LP      7.875        N/A        231,137  
  150,000      (a)   Sunoco LP      5.625        03/31/31        151,099  
  150,000      (a)   Sunoco LP      5.875        03/15/34        149,987  
  150,000      (a)   Talos Production Inc      9.000        02/01/29        155,796  
  100,000        Targa Resources Corp      5.550        08/15/35        102,351  
  126,538      (a)   Transocean Aquila Ltd      8.000        09/30/28        129,612  
  85,000      (a)   Transocean International Ltd      7.875        10/15/32        88,774  
  101,250      (a)   Transocean International Ltd      8.750        02/15/30        105,797  
  85,000      (a)   Transocean Titan Financing Ltd      8.375        02/01/28        86,809  
  400,000      (a)   USA Compression Partners LP / USA Compression Finance Corp      7.125        03/15/29        414,045  
  60,000      (a)   USA Compression Partners LP / USA Compression Finance Corp      6.250        10/01/33        60,719  
  680,000      (a)   Venture Global LNG Inc      7.000        01/15/30        654,451  
  235,000      (a)   Venture Global LNG Inc      8.125        06/01/28        238,032  
  254,000      (a),(g),(h)   Venture Global LNG Inc      9.000        N/A        200,592  
  65,000      (a)   Venture Global Plaquemines LNG LLC      6.500        01/15/34        66,576  
  75,000      (a)   Venture Global Plaquemines LNG LLC      6.125        12/15/30        76,376  
  185,000      (a)   Weatherford International Ltd      6.750        10/15/33        189,461  


     TOTAL ENERGY            10,157,636  


EQUITY REAL ESTATE INVESTMENT TRUSTS (REITS) - 0.4%
        
  35,000        Healthcare Realty Holdings LP      3.500        08/01/26        34,811  
  295,000        Healthcare Realty Holdings LP      3.750        07/01/27        292,987  
  245,000        Healthcare Realty Holdings LP      2.400        03/15/30        222,671  
  400,000      (a)   Iron Mountain Inc      7.000        02/15/29        410,885  
  195,000        MPT Operating Partnership LP / MPT Finance Corp      5.000        10/15/27        188,249  
  250,000      (a)   RLJ Lodging Trust LP      3.750        07/01/26        248,609  
  350,000      (a)   Uniti Group LP / Uniti Group Finance 2019 Inc / CSL Capital LLC      4.750        04/15/28        347,848  


     TOTAL EQUITY REAL ESTATE INVESTMENT TRUSTS (REITS)            1,746,060  


EQUITY REAL ESTATE INVESTMENT TRUSTS (REITS) - 0.2%
        
  105,000      (a)   Millrose Properties Inc      6.375        08/01/30        107,439  
  190,000      (a)   Millrose Properties Inc      6.250        09/15/32        191,707  
  105,000      (a)   MPT Operating Partnership LP / MPT Finance Corp      8.500        02/15/32        112,133  
  430,000      (c)   Piedmont Operating Partnership LP      9.250        07/20/28        475,119  
  160,000        Ventas Realty LP      5.000        01/15/35        160,196  


     TOTAL EQUITY REAL ESTATE INVEaSTMENT TRUSTS (REITS)            1,046,594  


FINANCIAL SERVICES - 2.6%
        
  144,600      (g),(h)   Ally Financial Inc      4.700        N/A        143,130  
  203,000      (g),(h)   Ally Financial Inc      4.700        N/A        193,016  
  305,000      (a),(g),(h)   American AgCredit Corp      5.250        N/A        298,900  
  750,000      (a)   Azorra FinanceLtd      7.750        04/15/30        52,796  
 
See Notes to Financial Statements
 
31

Portfolio of Investments December 31, 2025
(continued)
NMAI
 
     PRINCIPAL
        
DESCRIPTION
  
RATE
    
MATURITY
    
VALUE


FINANCIAL SERVICES
(continued)
        
 
$150,000
 
  
(a)
 
Azorra Finance Ltd
  
 
7.250%


01/15/31
 
  
$
157,175
 
 
250,000
 
    
Block Inc
  
 
6.500


05/15/32


259,965
 
 
200,000
 
  
(a)
 
Burford Capital Global Finance LLC
  
 
7.500


07/15/33


190,852
 
 
130,000
 
  
(g),(h)
 
Capital One Financial Corp
  
 
5.500


N/A


130,433
 
 
200,000
 
  
(g),(h)
 
Capital One Financial Corp
  
 
3.950


N/A


197,596
 
 
307,000
 
  
(g),(h)
 
Charles Schwab Corp/The
  
 
4.000


N/A


305,124
 
 
411,748
 
  
(a)
 
Compass Group Diversified Holdings LLC
  
 
5.250


04/15/29


381,910
 
 
250,000
 
  
(a),(g),(h)
 
Compeer Financial ACA
  
 
7.875


N/A


255,387
 
 
162,000
 
  
(g),(h)
 
Corebridge Financial Inc
  
 
6.875


N/A


166,483
 
 
380,000
 
  
(a)
 
Encore Capital Group Inc
  
 
8.500


05/15/30


408,479
 
 
180,000
 
  
(a)
 
Encore Capital Group Inc
  
 
6.625


04/15/31


180,899
 
 
285,000
 
  
(a)
 
FirstCash Inc
  
 
6.875


03/01/32


296,457
 
 
330,000
 
  
(a)
 
Freedom Mortgage Holdings LLC
  
 
8.375


04/01/32


347,379
 
 
150,000
 
  
(a)
 
Freedom Mortgage Holdings LLC
  
 
7.875


04/01/33


155,334
 
 
150,000
 
  
(a)
 
Freedom Mortgage Holdings LLC
  
 
6.875


05/01/31


150,090
 
 
105,000
 
    
Global Payments Inc
  
 
4.875


11/15/30


105,117
 
 
505,000
 
  
(g),(h)
 
Goldman Sachs Group Inc/The
  
 
6.850


N/A


525,157
 
 
179,000
 
  
(g),(h)
 
Goldman Sachs Group Inc/The
  
 
5.300


N/A


179,348
 
 
305,000
 
  
(g),(h)
 
Goldman Sachs Group Inc/The
  
 
6.125


N/A


309,255
 
 
543,000
 
  
(g),(h)
 
Goldman Sachs Group Inc/The
  
 
7.500


N/A


574,796
 
 
294,000
 
  
(g),(h)
 
Goldman Sachs Group Inc/The
  
 
7.379


N/A


294,516
 
 
338,000
 
  
(g),(h)
 
Goldman Sachs Group Inc/The
  
 
7.500


N/A


359,865
 
 
300,000
 
  
(a)
 
Hunt Cos Inc
  
 
5.250


04/15/29


292,848
 
 
300,000
 
  
(a)
 
Icahn Enterprises LP / Icahn Enterprises Finance Corp
  
 
10.000


11/15/29


299,788
 
 
500,000
 
    
Icahn Enterprises LP / Icahn Enterprises Finance Corp
  
 
5.250


05/15/27


493,128
 
 
400,000
 
  
(a)
 
Jane Street Group / JSG Finance Inc
  
 
6.125


11/01/32


407,024
 
 
395,000
 
    
JPMorgan Chase & Co
  
 
5.103


04/22/31


407,828
 
 
375,000
 
    
JPMorgan Chase & Co
  
 
5.572


04/22/36


393,435
 
 
365,000
 
    
Morgan Stanley
  
 
5.664


04/17/36


383,128
 
 
600,000
 
    
Navient Corp
  
 
5.500


03/15/29


595,594
 
 
125,000
 
    
OneMain Finance Corp
  
 
6.750


09/15/33


126,579
 
 
115,000
 
    
OneMain Finance Corp
  
 
6.125


05/15/30


117,253
 
 
690,000
 
    
OneMain Finance Corp
  
 
6.625


05/15/29


714,662
 
 
140,000
 
  
(a)
 
Osaic Holdings Inc
  
 
6.750


08/01/32


146,247
 
 
180,000
 
  
(a)
 
PennyMac Financial Services Inc
  
 
7.875


12/15/29


191,529
 
 
300,000
 
  
(a)
 
PennyMac Financial Services Inc
  
 
7.125


11/15/30


315,369
 
 
175,000
 
  
(a)
 
Rocket Cos Inc
  
 
6.125


08/01/30


180,894
 
 
60,000
 
  
(a)
 
Starwood Property Trust Inc
  
 
6.500


07/01/30


62,586
 
 
375,000
 
  
(a)
 
Starwood Property Trust Inc
  
 
6.000


04/15/30


384,901
 
 
177,000
 
  
(g),(h)
 
State Street Corp
  
 
6.700


N/A


184,669
 
 
170,000
 
  
(a)
 
UWM Holdings LLC
  
 
6.625


02/01/30


172,138
 
 
229,000
 
  
(g),(h)
 
Voya Financial Inc
  
 
7.758


N/A


241,530
 
 
240,000
 
  
(a)
 
WEX Inc
  
 
6.500


03/15/33


245,679
 
 
90,000
 
  
(a)
 
Wynnton Funding Trust II
  
 
5.991


08/15/55


90,549


TOTAL FINANCIAL SERVICES
        
 
13,066,817


FOOD, BEVERAGE & TOBACCO - 0.7%
        
 
165,000
 
    
Constellation Brands Inc
  
 
4.800


05/01/30


167,756
 
 
345,000
 
  
(a)
 
Darling Ingredients Inc
  
 
6.000


06/15/30


350,634
 
 
45,000
 
    
Kraft Heinz Foods Co
  
 
5.200


07/15/45


41,266
 
 
145,000
 
    
Kraft Heinz Foods Co
  
 
3.875


05/15/27


144,610
 
 
75,000
 
    
Kraft Heinz Foods Co
  
 
5.500


06/01/50


70,166
 
 
1,000,000
 
  
(a),(g),(h)
 
Land O’ Lakes Inc
  
 
8.000


N/A


983,791
 
 
110,000
 
  
(a)
 
Mars Inc
  
 
4.600


03/01/28


111,507
 
 
180,000
 
  
(a)
 
Mars Inc
  
 
5.200


03/01/35


185,009
 
 
35,000
 
  
(a)
 
Mars Inc
  
 
5.650


05/01/45


35,281
 
 
220,000
 
  
(a)
 
Mars Inc
  
 
5.700


05/01/55


219,148
 
 
300,000
 
  
(a)
 
Post Holdings Inc
  
 
6.375


03/01/33


303,000
 
 
120,000
 
  
(a)
 
Post Holdings Inc
  
 
6.500


03/15/36


120,162
 
 
300,000
 
  
(a)
 
Primo Water Holdings Inc / Triton Water Holdings Inc
  
 
6.250


04/01/29


301,450
 
 
390,000
 
  
(a)
 
Viking Baked Goods Acquisition Corp
  
 
8.625


11/01/31


391,253


TOTAL FOOD, BEVERAGE & TOBACCO
        
 
3,425,033


32
 
See Notes to Financial Statements

 
     PRINCIPAL
        
DESCRIPTION
  
RATE
    
MATURITY
    
VALUE


HEALTH CARE EQUIPMENT & SERVICES - 1.0%
        
  $95,000        Baxter International Inc      4.450%        02/15/29      $    95,234  
  150,000      (a)   CHS/Community Health Systems Inc      5.250        05/15/30        140,879  
  243,000      (a)   CHS/Community Health Systems Inc      10.875        01/15/32        265,220  
  150,000      (a)   CHS/Community Health Systems Inc      9.750        01/15/34        157,549  
  175,000        CVS Health Corp      5.050        03/25/48        154,271  
  142,000      (h)   CVS Health Corp      6.750        12/10/54        148,301  
  80,000      (h)   CVS Health Corp      7.000        03/10/55        83,924  
  145,000        CVS Health Corp      5.450        09/15/35        148,424  
  285,000      (a)   DaVita Inc      4.625        06/01/30        277,131  
  300,000      (a)   DaVita Inc      6.875        09/01/32        312,290  
  85,000      (a)   Global Medical Response Inc      7.375        10/01/32        88,347  
  42,000      (a)   Heartland Dental LLC / Heartland Dental Finance Corp      10.500        04/30/28        44,038  
  180,000      (a)   IQVIA Inc      6.250        06/01/32        188,085  
  150,000      (a)   LifePoint Health Inc      8.375        02/15/32        162,820  
  150,000      (a)   LifePoint Health Inc      9.875        08/15/30        161,504  
  250,000      (a)   Medline Borrower LP      3.875        04/01/29        244,077  
  80,000      (a)   Molina Healthcare Inc      6.250        01/15/33        81,557  
  175,000      (a)   Molina Healthcare Inc      6.500        02/15/31        179,730  
  225,000      (a)   National Mentor Holdings Inc      10.500        12/15/30        226,192  
  230,000      (a)   Prime Healthcare Services Inc      9.375        09/01/29        241,500  
  375,000      (a)   Radiology Partners Inc      8.500        07/15/32        391,739  
  105,000      (a)   Surgery Center Holdings Inc      7.250        04/15/32        106,204  
  466,906      (a)   Team Health Holdings Inc, (cash 9.000%, PIK 4.500%)      9.000        06/30/28        492,586  
  195,000      (a)   Team Health Holdings Inc      8.375        06/30/28        197,350  
  175,000        Tenet Healthcare Corp      6.125        10/01/28        175,783  
  145,000        UnitedHealth Group Inc      5.050        04/15/53        130,786  
  115,000        UnitedHealth Group Inc      5.500        07/15/44        114,146  


     TOTAL HEALTH CARE EQUIPMENT & SERVICES            5,009,667  


HOUSEHOLD & PERSONAL PRODUCTS - 0.0%
        
  45,000        Haleon US Capital LLC      3.625        03/24/32        42,808  


     TOTAL HOUSEHOLD & PERSONAL PRODUCTS            42,808  


INSURANCE - 1.5%
        
  400,000      (a)   Acrisure LLC / Acrisure Finance Inc      6.750        07/01/32        412,043  
  475,000      (a)   Alliant Holdings Intermediate LLC / Alliant Holdings Co-Issuer      4.250        10/15/27        471,981  
  500,000      (a)   Alliant Holdings Intermediate LLC / Alliant Holdings Co-Issuer      6.500        10/01/31        515,343  
  214,000      (h)   American National Group Inc      7.000        12/01/55        214,230  
  50,000      (a)   APH Somerset Investor 2 LLC / APH2 Somerset Investor 2 LLC /
APH3 Somerset Inves
     7.875        11/01/29        50,499  
  393,000      (h)   Assurant Inc      7.000        03/27/48        403,505  
  135,000      (a)   Asurion, LLC      8.000        12/31/32        140,078  
  244,000      (h)   Corebridge Financial Inc      6.375        09/15/54        245,865  
  235,000      (h)   Enstar Finance LLC      5.500        01/15/42        231,447  
  184,000      (a),(h)   Enstar Group Ltd      7.500        04/01/45        192,542  
  375,000      (a)   HUB International Ltd      7.250        06/15/30        393,722  
  207,000      (h)   MetLife Inc      6.350        03/15/55        218,293  
  354,000      (a),(h)   MetLife Inc      9.250        04/08/38        424,858  
  474,000      (a)   Omnis Funding Trust      6.722        05/15/55        492,890  
  600,000      (a)   Panther Escrow Issuer LLC      7.125        06/01/31        621,749  
  50,000      (a)   Protective Life Corp      4.700        01/15/31        50,158  
  360,000      (h)   Provident Financing Trust I      7.405        03/15/38        389,102  
  210,000      (h)   Prudential Financial Inc      5.125        03/01/52        208,080  
  150,000      (h)   Prudential Financial Inc      6.500        03/15/54        158,539  
  150,000      (a)   Ryan Specialty LLC      5.875        08/01/32        153,265  
  600,000      (a),(g),(h)   SBL Holdings Inc      9.508        N/A        611,999  
  575,000      (a),(g),(h)   SBL Holdings Inc      6.500        N/A        545,495  


     TOTAL INSURANCE            7,145,683  


MATERIALS - 0.6%
        
  110,000        Amcor Group Finance PLC      5.450        05/23/29        113,711  
  200,000      (a)   Ardagh Metal Packaging Finance USA LLC / Ardagh Metal
Packaging Finance PLC
     6.250        01/30/31        204,555  
  180,000      (a)   Arsenal AIC Parent LLC      8.000        10/01/30        191,009  
 
See Notes to Financial Statements
 
33

Portfolio of Investments December 31, 2025
(continued)
NMAI
 
     PRINCIPAL
        
DESCRIPTION
  
RATE
    
MATURITY
    
VALUE


MATERIALS
(continued)
        
  $420,000      (a)   Avient Corp      6.250%        11/01/31      $    431,700  
  75,000        Ball Corp      6.000        06/15/29        77,092  
  200,000      (a)   Clydesdale Acquisition Holdings Inc      8.750        04/15/30        203,336  
  80,000      (a)   Commercial Metals Co      6.000        12/15/35        82,012  
  200,000      (a)   Compass Minerals International Inc      8.000        07/01/30        209,267  
  420,000      (a)   Olin Corp      6.625        04/01/33        416,837  
  60,000      (a)   Owens-Brockway Glass Container Inc      7.250        05/15/31        61,247  
  170,000      (a)   Qnity Electronics Inc      5.750        08/15/32        173,816  
  55,000      (a)   Qnity Electronics Inc      6.250        08/15/33        57,010  
  300,000      (a)   SK Invictus Intermediate II Sarl      5.000        10/30/29        297,059  
  50,000      (a)   Solstice Advanced Materials Inc      5.625        09/30/33        50,440  
  200,000      (a)   WR Grace Holdings LLC      6.625        08/15/32        202,554  


     TOTAL MATERIALS            2,771,645  


MEDIA & ENTERTAINMENT - 1.2%
        
  195,000      (a)   Arches Buyer Inc      4.250        06/01/28        191,376  
  575,000      (a)   CCO Holdings LLC / CCO Holdings Capital Corp      4.500        08/15/30        541,369  
  855,000      (a),(c)   CCO Holdings LLC / CCO Holdings Capital Corp      4.250        02/01/31        785,616  
  200,000        CCO Holdings LLC / CCO Holdings Capital Corp      4.500        05/01/32        179,507  
  80,000        Charter Communications Operating LLC / Charter Communications
Operating Capital
     6.550        06/01/34        84,140  
  155,000      (a)   Directv Financing LLC      8.875        02/01/30        156,828  
  360,000      (a)   Directv Financing LLC / Directv Financing Co-Obligor Inc      5.875        08/15/27        362,113  
  225,000      (a)   DISH Network Corp      11.750        11/15/27        234,176  
  152,000      (a),(g),(h)   Farm Credit Bank of Texas      7.750        N/A        159,105  
  180,000      (a)   Gray Media Inc      10.500        07/15/29        193,561  
  210,000      (a)   Gray Media Inc      7.250        08/15/33        214,584  
  200,000      (a)   Gray Media Inc      4.750        10/15/30        155,129  
  69,000      (a)   McGraw-Hill Education Inc      5.750        08/01/28        69,356  
  225,000      (a)   McGraw-Hill Education Inc      7.375        09/01/31        237,388  
  120,000        Meta Platforms Inc      5.625        11/15/55        115,173  
  125,000      (a)   Neptune Bidco US Inc      10.375        05/15/31        128,168  
  250,000      (a)   Outfront Media Capital LLC / Outfront Media Capital Corp      5.000        08/15/27        250,361  
  165,000      (a)   Scripps Escrow II Inc      3.875        01/15/29        151,823  
  150,000      (a)   Sirius XM Radio LLC      3.875        09/01/31        138,140  
  300,000      (a)   Univision Communications Inc      8.500        07/31/31        313,389  
  225,000      (a)   Univision Communications Inc      4.500        05/01/29        216,130  
  40,000      (a)   Univision Communications Inc      9.375        08/01/32        42,993  
  150,000        Warnermedia Holdings Inc      4.279        03/15/32        131,673  
  150,000        Warnermedia Holdings Inc      5.141        03/15/52        98,828  
  225,000        Warnermedia Holdings Inc      5.050        03/15/42        158,344  
  240,000      (a)   Ziff Davis Inc      4.625        10/15/30        227,941  


     TOTAL MEDIA & ENTERTAINMENT            5,537,211  


PHARMACEUTICALS, BIOTECHNOLOGY & LIFE SCIENCES - 0.2%
        
  200,000      (a)   1261229 BC Ltd      10.000        04/15/32        208,003  
  55,000        AbbVie Inc      4.950        03/15/31        56,870  
  100,000        Amgen Inc      5.650        03/02/53        97,920  
  200,000      (a)   Bausch Health Cos Inc      4.875        06/01/28        179,000  
  410,000      (a)   Organon & Co / Organon Foreign Debt Co-Issuer BV      7.875        05/15/34        333,712  
  250,000      (a)   Organon & Co / Organon Foreign Debt Co-Issuer BV      5.125        04/30/31        207,049  


     TOTAL PHARMACEUTICALS, BIOTECHNOLOGY & LIFE SCIENCES            1,082,554  


REAL ESTATE MANAGEMENT & DEVELOPMENT - 0.1%
        
  330,000      (a)   Anywhere Real Estate Group LLC / Anywhere Co-Issuer Corp      7.000        04/15/30        328,579  
  295,000        Kennedy-Wilson Inc      5.000        03/01/31        277,442  


     TOTAL REAL ESTATE MANAGEMENT & DEVELOPMENT            606,021  


SEMICONDUCTORS & SEMICONDUCTOR EQUIPMENT - 0.1%
        
  90,000        Broadcom Inc      5.200        07/15/35        92,211  
  195,000        Broadcom Inc      4.200        10/15/30        194,852  


     TOTAL SEMICONDUCTORS & SEMICONDUCTOR EQUIPMENT            287,063  


34
 
See Notes to Financial Statements

 
     PRINCIPAL
        
DESCRIPTION
  
RATE
    
MATURITY
    
VALUE


SOFTWARE & SERVICES - 0.2%
        
$ 450,000      (a)   Ahead DB Holdings LLC      6.625%        05/01/28      $      452,915  
  25,000      (a)   Amentum Holdings Inc      7.250        08/01/32        26,352  
  70,000      (a)   CoreWeave Inc      9.250        06/01/30        65,084  
  165,000      (a)   Fair Isaac Corp      6.000        05/15/33        169,479  
  105,000        Oracle Corp      5.200        09/26/35        100,598  
  25,000        Oracle Corp      5.950        09/26/55        22,150  


     TOTAL SOFTWARE & SERVICES            836,578  


TECHNOLOGY HARDWARE & EQUIPMENT - 0.1%
        
  300,000      (a)   Imola Merger Corp      4.750        05/15/29        296,106  


     TOTAL TECHNOLOGY HARDWARE & EQUIPMENT            296,106  


TELECOMMUNICATION SERVICES - 0.6%
        
  55,000        AT&T Inc      3.650        06/01/51        38,649  
  105,000        AT&T Inc      3.500        09/15/53        70,269  
  245,000        AT&T Inc      3.800        12/01/57        168,521  
  270,000      (a)   CIPHER COMPUTE LLC      7.125        11/15/30        274,990  
  90,000        EchoStar Corp, (cash 6.750%, PIK 6.750%)      6.750        11/30/30        92,202  
  104,000        EchoStar Corp      10.750        11/30/29        115,003  
  375,000      (a)   Frontier Communications Holdings LLC      5.875        10/15/27        376,211  
  275,000      (a)   Level 3 Financing Inc      4.875        06/15/29        267,438  
  300,000      (a)   Level 3 Financing Inc      6.875        06/30/33        306,983  
  130,000      (a)   Level 3 Financing Inc      8.500        01/15/36        133,118  
  75,000        T-Mobile USA Inc      5.300        05/15/35        76,899  
  195,000      (a)   Windstream Services LLC      7.500        10/15/33        199,896  
  310,000      (a)   Windstream Services LLC / Windstream Escrow Finance Corp      8.250        10/01/31        325,429  
  70,000      (a)   WULF Compute LLC      7.750        10/15/30        72,117  
  244,744      (a)   Zayo Group Holdings Inc      9.250        03/09/30        232,507  


     TOTAL TELECOMMUNICATION SERVICES            2,750,232  


TRANSPORTATION - 0.2%
        
  295,000      (a)   American Airlines Inc      7.250        02/15/28        301,579  
  195,000      (a)   Genesee & Wyoming Inc      6.250        04/15/32        201,094  
  180,000      (a)   Stonepeak Nile Parent LLC      7.250        03/15/32        190,493  
  250,000      (a)   United Airlines Inc      4.375        04/15/26        249,688  


     TOTAL TRANSPORTATION            942,854  


UTILITIES - 1.5%
        
  192,000      (h)   AES Corp/The      6.950        07/15/55        189,565  
  143,000      (h)   AES Corp/The      7.600        01/15/55        145,632  
  110,000        Atmos Energy Corp      5.200        08/15/35        113,373  
  192,000      (h)   CMS Energy Corp      6.500        06/01/55        197,428  
  110,000        Consumers Energy Co      4.500        01/15/31        111,212  
  115,000      (h)   Dominion Energy Inc      7.000        06/01/54        124,516  
  240,000        DTE Electric Co      5.200        03/01/34        247,582  
  110,000        Duke Energy Carolinas LLC      4.250        12/15/41        96,676  
  130,000        Duke Energy Carolinas LLC      5.350        01/15/53        124,712  
  300,000        Duke Energy Carolinas Nc Storm Funding II LLC      4.226        07/01/35        299,366  
  101,000      (h)   Duke Energy Corp      6.450        09/01/54        106,007  
  139,000      (h)   Edison International      8.125        06/15/53        144,632  
  314,000      (h)   Entergy Corp      7.125        12/01/54        329,685  
  193,000      (h)   EUSHI Finance Inc      7.625        12/15/54        202,891  
  550,000      (a)   Ferrellgas LP / Ferrellgas Finance Corp      5.875        04/01/29        528,498  
  100,000      (a)   Ferrellgas LP / Ferrellgas Finance Corp      9.250        01/15/31        102,994  
  65,000        Florida Power & Light Co      5.700        03/15/55        65,860  
  150,000        Interstate Power and Light Co      5.600        06/29/35        156,107  
  262,000      (h)   NextEra Energy Capital Holdings Inc      6.750        06/15/54        279,707  
  150,000      (a)   NRG Energy Inc      5.750        01/15/34        151,526  
  225,000      (a)   NRG Energy Inc      6.000        02/01/33        229,455  
  180,000      (a)   NRG Energy Inc      6.250        11/01/34        184,863  
  128,000      (h)   PG&E Corp      7.375        03/15/55        133,311  
  269,000      (h)   Sempra      6.550        04/01/55        274,202  
  121,000      (h)   Sempra      6.375        04/01/56        123,520  
  445,000      (a)   Talen Energy Supply LLC      8.625        06/01/30        471,147  
  215,000      (a)   Talen Energy Supply LLC      6.250        02/01/34        219,281  
 
See Notes to Financial Statements
 
35

Portfolio of Investments December 31, 2025
(continued)
NMAI
 
     PRINCIPAL
        
DESCRIPTION
  
RATE
    
MATURITY
    
VALUE


UTILITIES
(continued)
        
$ 190,000      (a)   Talen Energy Supply LLC      6.500%        02/01/36      $      196,477  
  390,000      (a)   TerraForm Power Operating LLC      5.000        01/31/28        389,642  
  185,000      (a),(g),(h)   Vistra Corp      8.000        N/A        189,651  
  217,000      (a),(g),(h)   Vistra Corp      8.875        N/A        239,089  
  255,000      (a)   Vistra Operations Co LLC      7.750        10/15/31        270,090  
  160,000      (a)   VoltaGrid LLC      7.375        11/01/30        158,519  
  60,000      (a)   XPLR Infrastructure Operating Partners LP      8.375        01/15/31        62,978  
  120,000      (a)   XPLR Infrastructure Operating Partners LP      8.625        03/15/33        126,242  


     TOTAL UTILITIES            6,986,436  


TOTAL CORPORATE BONDS
(Cost $91,006,470)
        
 
92,572,057


PRINCIPAL
        
DESCRIPTION
  
RATE
    
MATURITY
    
VALUE


EMERGING MARKET DEBT AND FOREIGN CORPORATE BONDS - 14.7% (10.2% of Total Investments)
        
    
ARGENTINA - 0.3%
        
  140,000      (a)   Arcor SAIC      7.600        07/31/33        141,260  
  100,000        Argentine Republic Government International Bond      0.750        07/09/30        85,000  
  475,000        Argentine Republic Government International Bond      4.125        07/09/35        353,400  
  200,000        Argentine Republic Government International Bond      5.000        01/09/38        155,200  
  298,480      (a)   Provincia de Buenos Aires/Government Bonds      6.625        09/01/37        228,764  
  150,000      (a)   Transportadora de Gas del Sur SA      7.750        11/20/35        148,179  
  250,000      (a)   YPF SA      8.250        01/17/34        255,491  


     TOTAL ARGENTINA            1,367,294  


AUSTRALIA - 0.2%
        
  200,000        AngloGold Ashanti Holdings PLC      3.750        10/01/30        191,512  
  255,000      (a)   Mineral Resources Ltd      8.000        11/01/27        260,432  
  285,000      (a)   Mineral Resources Ltd      9.250        10/01/28        299,108  
  35,000      (a)   Mineral Resources Ltd      7.000        04/01/31        36,498  


     TOTAL AUSTRALIA            787,550  


BARBADOS - 0.0%
        
  150,000      (a)   Barbados Government International Bond      8.000        06/26/35        157,650  


     TOTAL BARBADOS            157,650  


BELGIUM - 0.0%
        
  89,000        Anheuser-Busch Cos LLC / Anheuser-Busch InBev Worldwide Inc      4.900        02/01/46        82,315  


     TOTAL BELGIUM            82,315  


BENIN - 0.0%
        
  EUR 190,000      (a)   Benin Government International Bond      4.950        01/22/35        206,914  


     TOTAL BENIN            206,914  


BRAZIL - 0.6%
        
  BRL 285,000        Brazil Notas do Tesouro Nacional Serie F      10.000        01/01/27        50,361  
  BRL 1,575,000        Brazil Notas do Tesouro Nacional Serie F      10.000        01/01/31        252,292  
  340,000        Brazilian Government International Bond      6.000        10/20/33        343,571  
  200,000        Brazilian Government International Bond      7.250        01/12/56        197,820  
  200,000      (a)   Caixa Economica Federal      5.625        05/13/30        203,090  
  200,000      (a)   Corp Quiport SA      9.000        12/15/37        214,051  
  200,000      (a)   LD Celulose International GmbH      7.950        01/26/32        208,362  
  200,000      (a)   Minerva Luxembourg SA      8.875        09/13/33        218,429  
  145,000        Petrobras Global Finance BV      6.750        06/03/50        138,663  
  115,000        Petrobras Global Finance BV      5.500        06/10/51        94,668  
  200,000      (a)   Raizen Fuels Finance SA      5.700        01/17/35        153,013  
  200,000      (a)   Rede D’or Finance Sarl      6.450        09/09/35        205,700  


     TOTAL BRAZIL            2,280,020  


CANADA - 1.4%
        
  75,000      (a)   1011778 BC ULC / New Red Finance Inc      4.000        10/15/30        71,430  
  150,000      (a)   Air Canada      3.875        08/15/26        149,285  
  120,000      (a)   AltaGas Ltd      7.200        10/15/54        124,409  
  200,000        Bank of Montreal      7.700        05/26/84        212,342  
  314,000        Bank of Montreal      7.300        11/26/84        334,791  
 
36
 
See Notes to Financial Statements

 
     PRINCIPAL
        
DESCRIPTION
  
RATE
    
MATURITY
    
VALUE


CANADA
        
$
274,000
 
    
Bank of Montreal
  
 
6.875%


11/26/85
 
  
$
     281,930
 
 
200,000
 
    
Bank of Nova Scotia/The
  
 
8.000


01/27/84


214,164
 
 
200,000
 
    
Bank of Nova Scotia/The
  
 
6.875


10/27/85


205,054
 
 
278,000
 
    
Bell Telephone Co of Canada or Bell Canada
  
 
7.000


09/15/55


292,132
 
 
285,000
 
    
Canadian Imperial Bank of Commerce
  
 
6.950


01/28/85


292,439
 
 
200,000
 
    
Canadian Imperial Bank of Commerce
  
 
7.000


10/28/85


208,491
 
 
293,000
 
    
Emera Inc
  
 
6.750


06/15/76


294,341
 
 
688,000
 
    
Enbridge Inc
  
 
8.500


01/15/84


788,908
 
 
305,000
 
    
Enbridge Inc
  
 
7.625


01/15/83


331,005
 
 
175,000
 
    
Enbridge Inc
  
 
5.500


07/15/77


173,404
 
 
85,000
 
  
(a)
 
Garda World Security Corp
  
 
6.500


01/15/31


86,979
 
 
200,000
 
  
(a)
 
New Flyer Holdings Inc
  
 
9.250


07/01/30


214,964
 
 
150,000
 
  
(a)
 
Open Text Corp
  
 
3.875


12/01/29


142,355
 
 
75,000
 
  
(a)
 
Open Text Holdings Inc
  
 
4.125


12/01/31


69,968
 
 
177,000
 
    
Rogers Communications Inc
  
 
7.125


04/15/55


186,380
 
 
242,000
 
    
Royal Bank of Canada
  
 
6.750


08/24/85


251,142
 
 
144,000
 
    
South Bow Canadian Infrastructure Holdings Ltd
  
 
7.500


03/01/55


153,917
 
 
250,000
 
  
(a)
 
Superior Plus LP / Superior General Partner Inc
  
 
4.500


03/15/29


244,040
 
 
152,000
 
    
TELUS Corp
  
 
7.000


10/15/55


158,229
 
 
425,000
 
    
Toronto-Dominion Bank/The
  
 
6.350


10/31/85


430,910
 
 
200,000
 
    
Toronto-Dominion Bank/The
  
 
8.125


10/31/82


210,909
 
 
75,000
 
    
Transcanada Trust
  
 
5.875


08/15/76


75,092
 
 
219,000
 
    
Transcanada Trust
  
 
5.600


03/07/82


216,301


TOTAL CANADA
        
 
6,415,311


CHILE - 0.5%
        
 
400,000
 
  
(a)
 
AES Andes SA
  
 
8.150


06/10/55


418,556
 
 
196,896
 
  
(a)
 
Alfa Desarrollo SpA 2021 1
  
 
4.550


09/27/51


158,410
 
 
200,000
 
  
(a),(j)
 
Banco de Credito e Inversiones SA
  
 
8.750


08/08/74


216,180
 
 
200,000
 
  
(a),(j)
 
Banco del Estado de Chile
  
 
7.950


11/02/74


212,000
 
 
CLP 70,000,000
 
  
(a)
 
Bonos de la Tesoreria de la Republica en pesos, Reg S
  
 
5.000


10/01/28


78,339
 
 
CLP 110,000,000
 
  
(a)
 
Bonos de la Tesoreria de la Republica en pesos, Reg S
  
 
6.000


04/01/33


127,253
 
 
200,000
 
  
(a)
 
Celulosa Arauco y Constitucion SA
  
 
6.180


05/05/32


206,410
 
 
EUR 50,000
 
    
Chile Government International Bond
  
 
3.800


07/01/35


58,747
 
 
175,000
 
  
(a)
 
Cia Cervecerias Unidas SA
  
 
3.350


01/19/32


158,752
 
 
200,000
 
  
(a)
 
Corp Nacional del Cobre de Chile
  
 
6.440


01/26/36


216,875
 
 
200,000
 
  
(a)
 
Empresa Nacional del Petroleo
  
 
6.150


05/10/33


211,635


TOTAL CHILE
        
 
2,063,157


CHINA - 0.0%
        
 
200,000
 
  
(a)
 
Lenovo Group Ltd
  
 
3.421


11/02/30


190,237


TOTAL CHINA
        
 
190,237


COLOMBIA - 0.4%
        
 
200,000
 
  
(a),(j)
 
Banco Davivienda SA
  
 
8.125


07/02/35


209,476
 
 
200,000
 
  
(j)
 
Bancolombia SA
  
 
8.625


12/24/34


214,358
 
 
EUR 100,000
 
    
Colombia Government International Bond
  
 
5.000


09/19/32


111,759
 
 
350,000
 
    
Colombia Government International Bond
  
 
3.125


04/15/31


303,100
 
 
200,000
 
    
Colombia Government International Bond
  
 
8.000


11/14/35


213,100
 
 
COP 725,000,000
 
    
Colombian TES
  
 
7.750


09/18/30


157,248
 
 
200,000
 
    
Ecopetrol SA
  
 
4.625


11/02/31


179,162
 
 
200,000
 
    
Ecopetrol SA
  
 
5.875


11/02/51


143,657
 
 
200,000
 
  
(a)
 
Grupo Aval Ltd
  
 
4.375


02/04/30


187,411


TOTAL COLOMBIA
        
 
1,719,271


COSTA RICA - 0.0%
        
 
200,000
 
  
(a)
 
Costa Rica Government International Bond
  
 
7.000


04/04/44


219,000


TOTAL COSTA RICA
        
 
219,000


COTE D’IVOIRE - 0.1%
        
 
395,000
 
    
Ivory Coast Government International Bond, Reg S
  
 
6.125


06/15/33


394,701


TOTAL COTE D’IVOIRE
        
 
394,701


CZECH REPUBLIC - 0.0%
        
 
CZK 2,150,000
 
    
Czech Republic Government Bond
  
 
1.750


06/23/32


89,736
 
 
CZK 1,200,000
 
    
Czech Republic Government Bond, Reg S
  
 
0.950


05/15/30


51,193


TOTAL CZECH REPUBLIC
        
 
140,929


See Notes to Financial Statements
 
37

Portfolio of Investments December 31, 2025
(continued)
NMAI
 
     PRINCIPAL
        
DESCRIPTION
  
RATE
    
MATURITY
    
VALUE


DENMARK - 0.0%
        
$ 80,000      (a)   GENMAB A/S/GENMAB FIN      7.250%        12/15/33      $      84,033  


     TOTAL DENMARK            84,033  


DOMINICAN REPUBLIC - 0.1%
        
  200,000      (a)   Aeropuertos Dominicanos Siglo XXI SA      7.000        06/30/34        210,000  
  125,000        Dominican Republic International Bond, Reg S      7.450        04/30/44        137,806  
  150,000      (a)   Dominican Republic International Bond      7.050        02/03/31        160,950  
  200,000      (a)   Dominican Republic International Bond      5.875        10/28/35        200,340  


     TOTAL DOMINICAN REPUBLIC            709,096  


ECUADOR - 0.0%
        
  260,000      (a)   Ecuador Government International Bond      1.000        07/31/35        229,190  


     TOTAL ECUADOR            229,190  


EGYPT - 0.2%
        
  220,000      (a)   Egypt Government International Bond      7.300        09/30/33        226,184  
  200,000      (a)   Egypt Government International Bond      7.600        03/01/29        212,864  
  205,000      (a)   Egypt Government International Bond      8.875        05/29/50        207,469  
  225,000      (a)   Egypt Government International Bond      8.500        01/31/47        220,721  


     TOTAL EGYPT            867,238  


EL SALVADOR - 0.1%
        
  200,000      (a)   Comision Ejecutiva Hidroelectrica del Rio Lempa      8.650        01/24/33        214,500  
  150,000      (a)   El Salvador Government International Bond      0.250        04/17/30        3,938  
  150,000      (a)   El Salvador Government International Bond      9.650        11/21/54        171,375  


     TOTAL EL SALVADOR            389,813  


FINLAND - 0.1%
        
  400,000      (a),(j)   Nordea Bank Abp      6.750        11/10/74        410,704  


     TOTAL FINLAND            410,704  


FRANCE - 1.2%
        
  502,000      (a),(j)   BNP Paribas SA      7.750        02/16/71        530,202  
  200,000      (a),(j)   BNP Paribas SA      9.250        05/17/74        213,336  
  610,000      (a),(j)   BNP Paribas SA      8.500        02/14/74        647,330  
  625,000      (a),(j)   BNP Paribas SA      8.000        08/22/74        674,425  
  409,000      (a),(j)   BNP Paribas SA      7.375        03/10/74        427,181  
  200,000      (a),(j)   BNP Paribas SA      7.450        12/27/74        209,264  
  507,000      (a),(j)   Credit Agricole SA      6.700        12/23/73        516,427  
  403,000      (a),(j)   Credit Agricole SA      7.125        12/23/74        419,633  
  525,000      (a)   Holdco II SAS      8.500        04/15/31        565,031  
  454,000      (a),(j)   Societe Generale SA      9.375        05/22/74        484,943  
  205,000      (a),(j)   Societe Generale SA      8.500        09/25/74        223,899  
  495,000      (a),(j)   Societe Generale SA      10.000        05/14/74        550,188  


     TOTAL FRANCE            5,461,859  


GERMANY - 0.4%
        
  600,000      (j)   Deutsche Bank AG, Reg S      8.130        04/30/73        640,708  
  480,000      (a)   IHO Verwaltungs GmbH      8.000        11/15/32        505,584  
  450,000      (a)   ZF North America Capital Inc      6.750        04/23/30        444,677  
  150,000      (a)   ZF North America Capital Inc      7.500        03/24/31        151,614  


     TOTAL GERMANY            1,742,583  


GHANA - 0.1%
        
  118,280      (a)   Ghana Government International Bond      5.000        07/03/29        115,994  
  367,320      (a)   Ghana Government International Bond      5.000        07/03/35        335,585  
  200,000      (a)   Kosmos Energy Ltd      7.500        03/01/28        135,124  


     TOTAL GHANA            586,703  


GUATEMALA - 0.1%
        
  200,000      (a)   CT Trust      5.125        02/03/32        192,355  
  200,000      (a)   Guatemala Government Bond      3.700        10/07/33        178,700  
  200,000      (a)   Guatemala Government Bond      6.250        08/15/36        209,000  


     TOTAL GUATEMALA            580,055  


HUNGARY - 0.2%
        
  HUF 50,000,000        Hungary Government Bond      4.500        03/23/28        147,458  
  210,000      (a)   Hungary Government International Bond      5.500        03/26/36        209,439  
  200,000      (a)   Hungary Government International Bond      5.375        09/26/30        205,391  
 
38
 
See Notes to Financial Statements

 
     PRINCIPAL
        
DESCRIPTION
  
RATE
    
MATURITY
    
VALUE


HUNGARY
        
$ 200,000      (a)   Magyar Export-Import Bank Zrt      6.125%        12/04/27      $ 205,632  


     TOTAL HUNGARY            767,920  


INDIA - 0.2%
        
  200,000      (a)   Adani Ports & Special Economic Zone Ltd      3.100        02/02/31        177,258  
  200,000      (a)   Indian Railway Finance Corp Ltd      3.570        01/21/32        189,835  
  200,000      (a)   IRB Infrastructure Developers Ltd      7.110        03/11/32        206,403  
  200,000      (a)   Muthoot Finance Ltd      6.375        04/23/29        203,030  
  200,000      (a)   ReNew Wind Energy AP2 / ReNew Power Pvt Ltd other 9 Subsidiaries      4.500        07/14/28        191,881  


     TOTAL INDIA            968,407  


INDONESIA - 0.2%
        
  200,000      (a)   Indika Energy Tbk PT      8.750        05/07/29        197,892  
  IDR 2,702,000,001        Indonesia Treasury Bond      7.000        09/15/30        170,489  
  IDR 1,110,000,000        Indonesia Treasury Bond      6.625        02/15/34        68,700  
  200,000      (a)   Medco Maple Tree Pte Ltd      8.960        04/27/29        208,552  
  200,000        Perusahaan Perseroan Persero PT Perusahaan Listrik Negara, Reg S      5.250        05/15/47        182,054  
  335,000        Perusahaan Perseroan Persero PT Perusahaan Listrik Negara, Reg S      3.875        07/17/29        327,037  


     TOTAL INDONESIA            1,154,724  


IRAQ - 0.0%
        
  125,000      (a)   Iraq International Bond      5.800        01/15/28        124,496  


     TOTAL IRAQ            124,496  


IRELAND - 0.2%
        
  636,000        AerCap Ireland Capital DAC / AerCap Global Aviation Trust      6.950        03/10/55        666,424  
  450,000        AerCap Ireland Capital DAC / AerCap Global Aviation Trust      6.500        01/31/56        464,167  


     TOTAL IRELAND            1,130,591  


ISRAEL - 0.1%
        
  200,000      (a),(j)   Bank Hapoalim BM, Reg S      3.255        01/21/32        196,100  
  200,000      (a)   Israel Electric Corp Ltd, Reg S      4.250        08/14/28        197,563  


     TOTAL ISRAEL            393,663  


JAMAICA - 0.1%
        
  150,000      (a)   Digicel International Finance Ltd / Difl US LLC      8.625        08/01/32        155,617  
  225,000      (a)   Montego Bay Airport Revenue Finance Ltd      6.600        06/15/35        224,168  


     TOTAL JAMAICA            379,785  


JAPAN - 0.0%
        
  200,000      (j)   Nomura Holdings Inc      7.000        01/15/74        205,311  


     TOTAL JAPAN            205,311  


JORDAN - 0.0%
        
  200,000      (a)   Jordan Government International Bond      5.850        07/07/30        201,450  


     TOTAL JORDAN            201,450  


KAZAKHSTAN - 0.1%
        
  200,000      (a)   Baiterek National Managing Holding JSC      5.450        05/08/28        202,894  
  200,000      (a)   Development Bank of Kazakhstan JSC      5.500        04/15/27        202,429  
  200,000      (a)   KazMunayGas National Co JSC      3.500        04/14/33        180,402  


     TOTAL KAZAKHSTAN            585,725  


LUXEMBOURG - 0.1%
        
  300,000      (a)   Albion Financing 1 SARL / Aggreko Holdings Inc      7.000        05/21/30        313,113  


     TOTAL LUXEMBOURG            313,113  


MACAU - 0.0%
        
  200,000      (a)   MGM China Holdings Ltd      7.125        06/26/31        211,677  


     TOTAL MACAU            211,677  


MALAYSIA - 0.1%
        
  MYR 200,000        Malaysia Government Bond      4.762        04/07/37        54,266  
  MYR 400,000        Malaysia Government Bond      4.254        05/31/35        104,268  
  240,000      (a)   Petronas Capital Ltd      5.340        04/03/35        249,592  
  205,000      (a)   Petronas Capital Ltd      3.404        04/28/61        139,289  


     TOTAL MALAYSIA            547,415  


See Notes to Financial Statements
 
39

Portfolio of Investments December 31, 2025
(continued)
NMAI
 
     PRINCIPAL
        
DESCRIPTION
  
RATE
    
MATURITY
    
VALUE


MEXICO - 1.1%
        
$       300,000      (a),(j)   Banco Mercantil del Norte SA/Grand Cayman      7.625%        10/06/74      $      308,397  
  509,800      (a),(j)   Banco Mercantil del Norte SA/Grand Cayman      8.750        02/20/73        545,494  
  200,000      (a),(j)   Banco Mercantil del Norte SA/Grand Cayman      8.375        02/20/74        210,000  
  200,000      (a)   Banco Nacional de Comercio Exterior SNC/Cayman Islands      2.720        08/11/31        196,286  
  200,000      (a)   Banco Nacional de Comercio Exterior SNC/Cayman Islands      5.875        05/07/30        206,740  
  170,732      (a)   Borr IHC Ltd / Borr Finance LLC      10.000        11/15/28        171,529  
  298,000      (a)   Cemex SAB de CV      7.200        09/10/74        310,784  
  200,000      (a)   Comision Federal de Electricidad      6.125        06/16/45        189,595  
  198,101      (a)   FIEMEX Energia - Banco Actinver SA Institucion de Banca Multiple      7.250        01/31/41        208,211  
  200,000      (a)   Gruma SAB de CV      5.761        12/09/54        200,649  
  200,000      (a)   Grupo Aeromexico SAB de CV      8.625        11/15/31        204,186  
  MXN 5,610,000        Mexican Bonos      8.500        11/18/38        291,963  
  MXN 1,000,000        Mexican Bonos      7.750        05/29/31        53,497  
  200,000        Mexico Government International Bond      4.280        08/14/41        160,600  
  250,000        Mexico Government International Bond      6.400        05/07/54        240,125  
  250,000        Mexico Government International Bond      5.625        09/22/35        246,500  
  200,000      (a)   Nemak SAB de CV      3.625        06/28/31        173,437  
  200,000        Petroleos Mexicanos      6.750        09/21/47        164,441  
  275,000        Petroleos Mexicanos      6.840        01/23/30        279,263  
  245,000        Petroleos Mexicanos      5.950        01/28/31        237,121  
  200,000        Petroleos Mexicanos      6.950        01/28/60        162,820  
  200,000      (a)   Trust 2401      4.869        01/15/30        197,000  


     TOTAL MEXICO            4,958,638  


MOROCCO - 0.1%
        
  200,000      (a)   Morocco Government International Bond      5.500        12/11/42        190,302  
  200,000      (a)   OCP SA      5.125        06/23/51        165,250  


     TOTAL MOROCCO            355,552  


NETHERLANDS - 0.4%
        
  765,000      (j)   ING Groep NV      7.000        11/16/74        798,000  
  526,000      (j)   ING Groep NV, Reg S      7.500        05/16/72        548,313  
  450,000      (a)   Sunrise FinCo I BV      4.875        07/15/31        428,625  
  310,000      (a)   VZ Secured Financing BV      5.000        01/15/32        280,535  


     TOTAL NETHERLANDS            2,055,473  


NIGERIA - 0.2%
        
  200,000      (a)   IHS Holding Ltd      7.875        05/29/30        206,000  
  275,000      (a)   Nigeria Government International Bond      10.375        12/09/34        326,229  
  200,000      (a)   Nigeria Government International Bond      8.631        01/13/36        214,743  


     TOTAL NIGERIA            746,972  


PANAMA - 0.1%
        
  200,000      (a)   Aeropuerto Internacional de Tocumen SA      5.125        08/11/61        162,600  
  200,000      (a)   Empresa de Transmision Electrica SA      5.125        05/02/49        153,698  
  200,000        Panama Government International Bond      8.000        03/01/38        233,520  
  155,644      (a)   UEP Penonome II SA 2020 1      6.500        10/01/38        138,601  


     TOTAL PANAMA            688,419  


PARAGUAY - 0.0%
        
  200,000      (a)   Paraguay Government International Bond      6.000        02/09/36        214,298  


     TOTAL PARAGUAY            214,298  


PERU - 0.2%
        
  200,000      (a)   Auna SA      8.750        11/06/32        201,756  
  200,000      (a)   Banco Internacional del Peru SAA Interbank      6.397        04/30/35        210,000  
  PEN 250,000      (a)   Peruvian Government International Bond      5.400        08/12/34        74,073  
  150,000        Peruvian Government International Bond      3.000        01/15/34        130,478  
  165,000      (a)   Volcan Cia Minera SAA      8.500        10/28/32        169,765  


     TOTAL PERU            786,072  


PHILIPPINES - 0.0%
        
  200,000        Philippine Government International Bond      4.200        03/29/47        167,441  


     TOTAL PHILIPPINES            167,441  


40
 
See Notes to Financial Statements

 
     PRINCIPAL
        
DESCRIPTION
  
RATE
    
MATURITY
    
VALUE


POLAND - 0.2%
        
$       200,000      (a)   Bank Gospodarstwa Krajowego      5.375%        05/22/33      $      205,501  
  PLN 525,000        Republic of Poland Government Bond      2.750        10/25/29        138,441  
  PLN 375,000        Republic of Poland Government Bond      6.000        10/25/33        111,538  
  PLN 550,000        Republic of Poland Government Bond      5.000        10/25/34        152,348  
  90,000        Republic of Poland Government International Bond      5.500        04/04/53        86,365  
  100,000        Republic of Poland Government International Bond      5.375        02/12/35        103,665  


     TOTAL POLAND            797,858  


REPUBLIC OF SERBIA - 0.0%
        
  200,000      (a)   Serbia International Bond      6.500        09/26/33        213,997  


     TOTAL REPUBLIC OF SERBIA            213,997  


ROMANIA - 0.1%
        
  RON 320,000        Romania Government Bond      4.150        01/26/28        70,632  
  EUR 185,000      (a)   Romanian Government International Bond      5.250        05/30/32        221,879  
  102,000      (a)   Romanian Government International Bond      5.875        01/30/29        105,247  
  210,000      (a)   Romanian Government International Bond      5.750        03/24/35        208,069  


     TOTAL ROMANIA            605,827  


RWANDA - 0.1%
        
  300,000      (a)   Rwanda International Government Bond      5.500        08/09/31        278,121  


     TOTAL RWANDA            278,121  


SAUDI ARABIA - 0.2%
        
  200,000        Saudi Arabian Oil Co, Reg S      4.250        04/16/39        182,128  
  200,000        Saudi Awwal Bank, Reg S      5.947        09/04/35        202,863  
  385,000        Saudi Government International Bond, Reg S      3.750        01/21/55        272,045  
  200,000      (a)   Saudi Government International Bond      5.625        01/13/35        212,005  
  200,000        SNB Funding Ltd, Reg S      6.000        06/24/35        205,858  


     TOTAL SAUDI ARABIA            1,074,899  


SENEGAL - 0.0%
        
  215,000        Senegal Government International Bond, Reg S      6.750        03/13/48        115,336  
  200,000      (a)   Senegal Government International Bond      6.750        03/13/48        107,289  


     TOTAL SENEGAL            222,625  


SOUTH AFRICA - 0.3%
        
  200,000      (a)   Bidvest Group UK PLC/The      6.200        09/17/32        203,773  
  250,000      (a)   Eskom Holdings      8.450        08/10/28        268,024  
  ZAR 1,050,000        Republic of South Africa Government Bond      8.500        01/31/37        62,721  
  ZAR 3,875,000        Republic of South Africa Government Bond      8.875        02/28/35        243,205  
  200,000        Republic of South Africa Government International Bond      5.375        07/24/44        170,579  
  200,000      (a)   Republic of South Africa Government International Bond      7.100        11/19/36        214,768  
  250,000      (a)   Transnet/South Africa      8.250        02/06/28        263,898  
  200,000      (a)   Windfall Mining Group Inc / Groupe Minier Windfall Inc      5.854        05/13/32        208,882  


     TOTAL SOUTH AFRICA            1,635,850  


SPAIN - 0.7%
        
  440,000      (j)   Banco Bilbao Vizcaya Argentaria SA      6.125        02/16/74        443,425  
  473,000      (j)   Banco Bilbao Vizcaya Argentaria SA      9.375        12/19/74        527,867  
  200,000      (j)   Banco Bilbao Vizcaya Argentaria SA      7.750        04/14/74        214,122  
  800,000      (j)   Banco Santander SA      8.000        11/01/73        883,100  
  600,000      (j)   Banco Santander SA      9.625        02/21/74        722,360  


     TOTAL SPAIN            2,790,874  


SRI LANKA - 0.0%
        
  129,323      (a)   Sri Lanka Government International Bond      3.350        03/15/33        111,142  
  79,065      (a)   Sri Lanka Government International Bond      3.600        02/15/38        72,049  
  56,938      (a)   Sri Lanka Government International Bond      3.600        06/15/35        43,273  


     TOTAL SRI LANKA            226,464  


SUPRANATIONAL - 0.0%
        
  INR 12,500,000        European Bank for Reconstruction & Development      6.300        10/26/27        138,984  
  KZT 30,000,000        International Bank for Reconstruction & Development      13.750        06/11/26        58,099  


     TOTAL SUPRANATIONAL            197,083  


SWITZERLAND - 0.8%
        
  1,000,000      (b)   Credit Suisse Group AG      0.000        01/17/72        340,000  
  1,645,000      (b)   Credit Suisse Group AG      7.250        03/12/72        559,301  
  -300,000      (b)   Credit Suisse Group AG      6.380        02/21/72        102,000  
 
See Notes to Financial Statements
 
41

Portfolio of Investments December 31, 2025
(continued)
NMAI
 
     PRINCIPAL
        
DESCRIPTION
  
RATE
    
MATURITY
    
VALUE


SWITZERLAND
        
$      575,000      (b)   Credit Suisse Group AG      7.500%        06/11/72      $      195,500  
  735,000      (b)   Credit Suisse Group AG      7.500        01/17/72        249,900  
  521,000      (a),(j)   UBS Group AG      9.250        05/13/74        611,007  
  499,000      (a),(j)   UBS Group AG      9.250        05/13/74        547,527  
  484,000      (a),(j)   UBS Group AG      7.750        04/12/74        521,767  
  480,000      (a),(c)   VistaJet Malta Finance PLC / Vista Management Holding Inc      6.375        02/01/30        456,791  


     TOTAL SWITZERLAND            3,583,793  


THAILAND - 0.0%
        
  200,000      (a),(j)   Bangkok Bank PCL/Hong Kong      3.466        09/23/36        181,964  


     TOTAL THAILAND            181,964  


TOGO - 0.0%
        
  200,000      (a)   Ecobank Transnational Inc      10.125        10/15/29        212,084  


     TOTAL TOGO            212,084  


TRINIDAD AND TOBAGO - 0.0%
        
  200,000      (a)   Trinidad Generation UnLtd      7.750        06/16/33        207,250  


     TOTAL TRINIDAD AND TOBAGO            207,250  


TURKEY - 0.4%
        
  200,000      (a)   Limak Cimento Sanayi ve Ticaret AS      9.750        07/25/29        201,684  
  225,000      (a)   Turk Telekomunikasyon AS      6.950        10/07/32        229,913  
  200,000      (a)   Turkcell Iletisim Hizmetleri AS      7.650        01/24/32        212,654  
  TRY 1,800,000        Turkiye Government Bond      37.000        02/18/26        41,895  
  EUR 225,000        Turkiye Government International Bond      5.200        08/17/31        274,892  
  250,000        Turkiye Government International Bond      6.000        01/14/41        225,427  
  200,000        Turkiye Government International Bond      7.125        07/17/32        211,619  
  200,000      (a)   Ulker Biskuvi Sanayi AS      7.875        07/08/31        210,578  
  200,000      (a)   Yapi ve Kredi Bankasi AS      9.250        01/17/34        213,260  


     TOTAL TURKEY            1,821,922  


UGANDA - 0.0%
        
  UGX 353,000,000        Republic of Uganda Government Bonds      14.250        06/22/34        87,006  


     TOTAL UGANDA            87,006  


UKRAINE - 0.1%
        
  118,699      (a)   Ukraine Government International Bond      1.750        02/01/29        88,728  
  150,000      (a)   Ukraine Government International Bond      1.750        02/01/36        87,750  
  311,275      (a)   Ukraine Government International Bond      0.000        02/01/35        175,870  
  67,730      (a)   Ukraine Government International Bond      0.000        02/01/36        38,098  


     TOTAL UKRAINE            390,446  


UNITED ARAB EMIRATES - 0.2%
        
  400,000        Emirate of Dubai Government International Bonds, Reg S      3.900        09/09/50        302,155  
  235,000      (a)   Galaxy Pipeline Assets Bidco Ltd      2.625        03/31/36        207,105  
  207,931      (a)   Galaxy Pipeline Assets Bidco Ltd 2022 2022      2.940        09/30/40        176,876  
  183,220      (a)   Sweihan PV Power Co PJSC 2022 1      3.625        01/31/49        157,498  


     TOTAL UNITED ARAB EMIRATES            843,634  


UNITED KINGDOM - 2.2%
        
  450,000      (a)   Ardonagh Finco Ltd      7.750        02/15/31        471,760  
  388,000      (j)   Barclays PLC      8.000        12/15/74        413,985  
  1,092,000      (j)   Barclays PLC      9.625        03/15/73        1,237,014  
  200,000      (j)   Barclays PLC      7.625        06/15/74        213,394  
  300,000      (a)   California Buyer Ltd / Atlantica Sustainable Infrastructure PLC      6.375        02/15/32        300,495  
  300,000      (a)   ContourGlobal Power Holdings SA      6.750        02/28/30        309,333  
  200,000      (j)   HSBC Holdings PLC      6.500        09/23/73        203,915  
  453,000      (j)   HSBC Holdings PLC      8.000        09/07/74        477,412  
  394,000      (j)   HSBC Holdings PLC      6.875        03/11/74        407,377  
  695,000      (j)   HSBC Holdings PLC      6.950        03/11/74        728,917  
  275,000      (j)   HSBC Holdings PLC      6.950        08/27/74        285,446  
  221,000      (j)   Lloyds Banking Group PLC      6.750        12/27/73        228,898  
  771,000      (j)   Lloyds Banking Group PLC      8.000        06/27/74        834,087  
  300,000      (a)   Merlin Entertainments Group US Holdings Inc      7.375        02/15/31        267,233  
  300,000      (a)   Motion Finco Sarl      8.375        02/15/32        269,403  
  882,000      (j)   NatWest Group PLC      8.125        06/30/74        992,374  
 
42
 
See Notes to Financial Statements

 
     PRINCIPAL
        
DESCRIPTION
  
RATE
    
MATURITY
    
VALUE


UNITED KINGDOM
        
$       442,000      (j)   NatWest Group PLC      7.300%        12/31/73      $      468,878  
  200,000      (j)   Phoenix Group Holdings PLC, Reg S      8.500        12/12/72        213,651  
  343,000      (a),(j)   Standard Chartered PLC      7.750        02/15/74        356,366  
  550,000      (a)   Virgin Media Secured Finance PLC      5.500        05/15/29        541,836  
  120,000      (a)   Vmed O2 UK Financing I PLC      6.750        01/15/33        118,924  
  365,000        Vodafone Group PLC      7.000        04/04/79        386,649  
  233,000      (a)   Zegona Finance PLC      8.625        07/15/29        247,139  


     TOTAL UNITED KINGDOM            9,974,486  


URUGUAY - 0.1%
        
  175,000        Uruguay Government International Bond      5.442        02/14/37        181,833  
  UYU 6,200,000        Uruguay Government International Bond      8.250        05/21/31        163,112  


     TOTAL URUGUAY            344,945  


UZBEKISTAN - 0.0%
        
  200,000      (a)   Republic of Uzbekistan International Bond      6.900        02/28/32        214,951  


     TOTAL UZBEKISTAN            214,951  


ZAMBIA - 0.1%
        
  122,524      (a)   Zambia Government International Bond      5.750        06/30/33        120,646  
  197,169      (a)   Zambia Government International Bond      0.500        12/31/53        137,845  


     TOTAL ZAMBIA            258,491  


TOTAL EMERGING MARKET DEBT AND FOREIGN CORPORATE BONDS
(Cost $71,226,630)
        
 
70,207,335


SHARES
        
DESCRIPTION
                
VALUE


EXCHANGE-TRADED FUNDS - 7.6% (5.3% of Total Investments)
        
  253,147        Alerian MLP ETF            11,902,972  
  364,718      (c)   iShares Core MSCI Emerging Markets ETF            24,516,344  


TOTAL EXCHANGE-TRADED FUNDS
(Cost $28,915,761)
        
 
36,419,316


SHARES
        
DESCRIPTION
                
VALUE


INVESTMENT COMPANIES - 0.0% (0.0% of Total Investments)
        
  13,224        3i Infrastructure PLC            66,548  


TOTAL INVESTMENT COMPANIES
(Cost $51,850)
        
 
66,548


PRINCIPAL
        
DESCRIPTION
  
RATE
    
MATURITY
    
VALUE


MORTGAGE-BACKED SECURITIES - 12.3% (8.6% of Total Investments)
        
  100,000      (a),(i)   ARDN 2025-ARCP Mortgage Trust, Series 2025 ARCP, (TSFR1M + 1.750%)      5.500        06/15/35        100,325  
  420,000      (i)   BANK 2019-BNK24, Series 2019 BN24      3.283        11/15/62        395,201  
  71,242      (a),(i)   Bayview MSR Opportunity Master Fund Trust 2021-INV4, Series 2021 4      2.500        10/25/51        59,075  
  307,876      (a),(i)   BX Commercial Mortgage Trust, Series 2021 CIP, (TSFR1M + 1.035%)      4.785        12/15/38        307,993  
  130,000        CD 2017-CD5 Mortgage Trust, Series 2017 CD5      3.431        08/15/50        128,347  
  52,138      (i)   Citigroup Commercial Mortgage Trust, Series 2015 GC29      3.758        04/10/48        50,489  
  250,000      (i)   Citigroup Commercial Mortgage Trust, Series 2018 B2      4.179        03/10/51        245,789  
  935,000      (a),(i)   Connecticut Avenue Securities Trust, Series 2023 R05, (SOFR30A + 3.100%)      7.456        06/25/43        970,676  
  500,000      (a),(i)   Connecticut Avenue Securities Trust, Series 2023 R01, (SOFR30A + 3.750%)      8.106        12/25/42        522,750  
  210,000      (a),(i)   Connecticut Avenue Securities Trust, Series 2023 R06, (SOFR30A + 3.900%)      9.188        07/25/43        221,393  
  475,000      (a),(i)   Connecticut Avenue Securities Trust, Series 2022 R05, (SOFR30A + 7.000%)      10.874        04/25/42        506,455  
  105,000      (a),(i)   Connecticut Avenue Securities Trust, Series 2022 R09, (SOFR30A + 4.750%)      8.624        09/25/42        111,402  
  695,000      (a),(i)   Connecticut Avenue Securities Trust, Series 2023 R06, (SOFR30A + 2.700%)      6.574        07/25/43        714,997  
  240,766        Fannie Mae Pool, FN MA4805, Series 2022 1      4.500        11/01/52        235,928  
 
See Notes to Financial Statements
 
43

Portfolio of Investments December 31, 2025
(continued)
NMAI
 
     PRINCIPAL
        
DESCRIPTION
  
RATE
    
MATURITY
    
VALUE


MORTGAGE-BACKED SECURITIES
(continued)
        
$ 1,728,007      (k)   Fannie Mae Pool, FN MA4700, Series 2022 1      4.000%        08/01/52      $    1,640,925  
  692,904        Fannie Mae Pool, FN MA4732      4.000        09/01/52        660,149  
  2,034,464      (k)   Fannie Mae Pool, FN MA4733      4.500        09/01/52        1,994,209  
  1,540,957      (k)   Fannie Mae Pool, FN MA4737, Series 2022 1      5.000        08/01/52        1,543,329  
  1,288,594        Fannie Mae Pool, FN MA4783      4.000        10/01/52        1,227,880  
  584,724      (k)   Fannie Mae Pool, FN MA4785      5.000        10/01/52        586,529  
  913,642      (k)   Fannie Mae Pool, FN MA4918      5.000        02/01/53        914,860  
  2,397,972      (k)   Fannie Mae Pool, FN MA5165      5.500        10/01/53        2,438,013  
  655,867        Fannie Mae Pool, FN MA4942      6.000        03/01/53        675,946  
  908,748      (k)   Fannie Mae Pool, FN MA4978      5.000        04/01/53        909,866  
  736,525      (k)   Fannie Mae Pool, FN MA5039      5.500        06/01/53        749,333  
  266,025        Fannie Mae Pool, FN MA5106      5.000        08/01/53        266,147  
  108,518        Fannie Mae Pool, FN MA5107      5.500        08/01/53        110,355  
  2,369,944      (k)   Fannie Mae Pool, FN MA4655      4.000        07/01/52        2,261,766  
  1,783,466      (k)   Fannie Mae Pool, FN MA5353      5.500        05/01/54        1,809,802  
  1,173,607      (k)   Fannie Mae Pool, FN MA5497      5.500        10/01/54        1,190,518  
  360,076        Fannie Mae Pool, FN MA4919      5.500        02/01/53        365,423  
  783,356      (k)   Fannie Mae Pool, FN MA4644, Series 2022 1      4.000        05/01/52        746,664  
  202,021        Fannie Mae Pool, FN MA5247      6.000        01/01/54        207,722  
  768,936        Fannie Mae Pool, FN MA4600, Series 2022 2      3.500        05/01/52        712,625  
  237,762        Fannie Mae Pool, FN MA4578      2.500        04/01/52        202,142  
  438,224      (k)   Fannie Mae Pool, FN FS7299      3.000        05/01/52        392,499  
  1,486,589      (k)   Fannie Mae Pool, FN FS1535      3.000        04/01/52        1,330,704  
  1,110,836      (k)   Fannie Mae Pool, FN FS1533      3.000        04/01/52        995,111  
  750,059        Fannie Mae Pool, FN FS0522      2.500        02/01/52        642,842  
  1,192,842      (k)   Fannie Mae Pool, FN CB3905      3.500        06/01/52        1,105,811  
  165,197        Fannie Mae Pool, FN CB2795      3.000        02/01/52        146,430  
  1,305,503      (k)   Fannie Mae Pool, FN CB1301      2.500        08/01/51        1,124,991  
  427,802      (k)   Fannie Mae Pool, FN BW3383      4.500        07/01/52        419,204  
  4,291,819      (k)   Fannie Mae Pool, FN BW3382      4.500        07/01/52        4,209,116  
  1,236,635      (k)   Fannie Mae Pool, FN MA4626      4.000        06/01/52        1,180,189  
  91,368      (a),(i)   Flagstar Mortgage Trust 2021-10INV, Series 2021 10IN      3.498        10/25/51        76,338  
  28,524        Freddie Mac Gold Pool, FG U99084      4.500        02/01/44        28,523  
  50,778        Freddie Mac Pool, FR SD4999      5.000        08/01/53        50,841  
  177,822        Freddie Mac Pool, FR SD8329      5.000        06/01/53        177,995  
  719,516      (k)   Freddie Mac Pool, FR SD8288      5.000        01/01/53        720,512  
  1,276,618      (k)   Freddie Mac Pool, FR RA6766      2.500        02/01/52        1,097,300  
  1,478,730      (k)   Freddie Mac Pool, FR RA9629      5.500        08/01/53        1,504,218  
  818,658      (k)   Freddie Mac Pool, FR QE5382      4.500        07/01/52        802,798  
  1,258,446        Freddie Mac REMICS, Series 2021 5160      3.000        09/25/50        932,423  
  500,000      (a),(i)   Freddie Mac STACR REMIC Trust, Series 2022 DNA6, (SOFR30A + 5.750%)      9.624        09/25/42        539,065  
  285,000      (a),(i)   Freddie Mac STACR REMIC Trust, Series 2023 DNA1, (SOFR30A + 3.100%)      8.444        03/25/43        295,621  
  80,000      (a),(i)   Freddie Mac STACR REMIC Trust, Series 2022 DNA4, (SOFR30A + 3.350%)      7.224        05/25/42        82,593  
  1,056,349        Ginnie Mae II Pool, G2 MA8149      3.500        07/20/52        971,343  
  270,113      (k)   Ginnie Mae II Pool, G2 MA7419, Series 2021 MTGE      3.000        06/20/51        243,021  
  344,224      (k)   Ginnie Mae II Pool, G2 MA7768, Series 2021 1      3.000        12/20/51        309,698  
  427,601      (k)   Ginnie Mae II Pool, G2 MA7871, Series 2022 1      2.500        02/20/52        360,571  
  616,220        Ginnie Mae II Pool, G2 MA8200      4.000        08/20/52        586,189  
  587,117      (k)   Ginnie Mae II Pool, G2 MA8428      5.000        11/20/52        588,074  
  260,558        Ginnie Mae II Pool, G2 MA8724      4.500        03/20/53        255,424  
  249,815        Government National Mortgage Association, Series 2021 209      3.000        11/20/51        184,595  
  269,354        Government National Mortgage Association, Series 2022 124      4.000        07/20/52        230,300  
  428,966        Government National Mortgage Association, Series 2023 111      3.000        02/20/52        301,477  
  484,195        Government National Mortgage Association, Series 2022 174      4.500        09/20/52        453,489  
  710,914        Government National Mortgage Association, Series 2013 188      2.500        12/20/43        642,129  
  250,000        GS Mortgage Securities Trust, Series 2019 GC42      3.001        09/10/52        236,025  
  751,590      (a),(i)   GS Mortgage-Backed Securities Corp Trust, Series 2022 PJ2      3.000        06/25/52        652,066  
  445,625      (a),(i)   GS Mortgage-Backed Securities Trust, Series 2022 INV1      3.000        07/25/52        387,612  
  230,221      (a),(i)   GS Mortgage-Backed Securities Trust, Series 2023 PJ1      3.500        02/25/53        207,812  
 
44
 
See Notes to Financial Statements

 
     PRINCIPAL
        
DESCRIPTION
  
RATE
    
MATURITY
    
VALUE


MORTGAGE-BACKED SECURITIES
(continued)
        
$ 392,506      (a),(i)   GS Mortgage-Backed Securities Trust, Series 2022 GR2      3.000%        08/26/52      $ 340,796  
  278,541      (a),(i)   GS Mortgage-Backed Securities Trust, Series 2022 HP1      3.000        09/25/52        241,845  
  266,488      (a),(i)   GS Mortgage-Backed Securities Trust, Series 2021 PJ10      2.500        03/25/52        220,977  
  230,202      (a),(i)   GS Mortgage-Backed Securities Trust, Series 2022 PJ5      3.000        10/25/52        199,719  
  250,000      (a),(i)   Houston Galleria Mall Trust, Series 2025 HGLR      5.462        02/05/45        259,496  
  250,000      (a)   ICNQ 2024-MF Mortgage Trust, Series 2024 MF      5.778        12/10/34        258,257  
  250,000      (a),(i)   IP 2025-IP Mortgage Trust, Series 2025 IP      5.425        06/10/42        254,688  
  535,934      (a),(i)   J.P. Morgan Mortgage Trust, Series 2024 3      3.000        05/25/54        464,967  
  115,070      (a),(i)   J.P. Morgan Mortgage Trust, Series 2022 LTV2      3.500        09/25/52        103,724  
  628,290      (a),(i)   J.P. Morgan Mortgage Trust, Series 2022 6      3.000        11/25/52        545,516  
  1,068,748      (a),(i)   J.P. Morgan Mortgage Trust, Series 2022 2      3.000        08/25/52        927,948  
  306,873      (a),(i)   J.P. Morgan Mortgage Trust, Series 2022 4      3.000        10/25/52        266,238  
  373,400      (a),(i)   J.P. Morgan Mortgage Trust, Series 2021 15      2.500        06/25/52        309,515  
  1,384,343      (a),(i)   J.P. Morgan Mortgage Trust, Series 2022 LTV1      3.250        07/25/52           1,243,085  
  476,790      (a),(i)   J.P. Morgan Mortgage Trust, Series 2022 INV3      3.000        09/25/52        414,125  
  673,634      (a),(i)   J.P. Morgan Mortgage Trust, Series 2022 3      3.000        08/25/52        584,433  
  250,000      (a)   JP Morgan Chase Commercial Mortgage Securities Trust, Series 2025 NSLB      6.234        06/05/42        261,637  
  80,707        JPMDB Commercial Mortgage Securities Trust, Series 2018 C8      3.944        06/15/51        80,179  
  267,884      (a),(i)   OBX 2022-INV5 Trust, Series 2022 INV5      4.000        10/25/52        247,760  
  605,785      (a),(i)   RCKT Mortgage Trust 2022-2, Series 2022 2      2.500        02/25/52        502,329  
  78,624      (a),(i)   RCKT Mortgage Trust 2022-3, Series 2022 3      3.000        05/25/52        68,265  
  162,645      (a),(i)   RCKT Mortgage Trust 2022-4, Series 2022 4      3.500        06/25/52        146,812  
  109,438      (a),(i)   Sequoia Mortgage Trust 2025-S2, Series 2025 S2      4.000        11/25/55        102,586  
  150,000      (a),(i)   Verus Securitization Trust 2025-12, Series 2025 12      5.760        12/25/70        151,036  
  104,437      (a),(i)   Wells Fargo Mortgage Backed Securities 2021-2 Trust, Series 2021 2      2.500        06/25/51        86,732  
  161,932      (a),(i)   Wells Fargo Mortgage Backed Securities 2022-2 Trust, Series 2022 2      2.500        12/25/51        134,075  
  190,093      (a),(i)   Wells Fargo Mortgage Backed Securities 2022-INV1 Trust, Series 2022 INV1      3.500        03/25/52        171,692  
  114,056      (a),(i)   Wells Fargo Mortgage Backed Securities 2022-INV1 Trust, Series 2022 INV1      3.000        03/25/52        99,100  


TOTAL MORTGAGE-BACKED SECURITIES
(Cost $59,554,277)
        
 
58,937,504


SHARES
        
DESCRIPTION
  
RATE
           
VALUE


PREFERRED STOCK - 1.1% (0.7% of Total Investments)
        
    
BANKS - 0.1%
        
  6,772        Fifth Third Bancorp      7.973           173,295  
  8,825        KeyCorp      6.125           218,684  
  18,675        KeyCorp      6.200           473,971  
  2,425        KeyCorp      5.625           51,556  
  2,238        KeyCorp      5.650           47,490  
  350        Synovus Financial Corp      8.397           9,048  


     TOTAL BANKS            974,044  


FINANCIAL SERVICES - 0.5%
        
  12,675        Bank of New York Mellon Corp/The      6.150           325,113  
  7,550        Equitable Holdings Inc      5.250           152,510  
  4,206        Morgan Stanley      7.125           106,202  
  11,750        Morgan Stanley      6.625           307,028  
  11,775        Morgan Stanley      6.500           299,909  
  16,725        Morgan Stanley      6.875           419,964  
  4,923        Synchrony Financial      5.625           96,442  
  10,218        Voya Financial Inc      5.350           252,691  


     TOTAL FINANCIAL SERVICES            1,959,859  


FOOD, BEVERAGE & TOBACCO - 0.2%
        
  10,571        CHS Inc      7.100           263,324  
  12,518        CHS Inc      6.750           309,320  


     TOTAL FOOD, BEVERAGE & TOBACCO            572,644  


See Notes to Financial Statements
 
45

Portfolio of Investments December 31, 2025
(continued)
NMAI
 
      SHARES
        
DESCRIPTION
  
RATE
           
VALUE


INSURANCE - 0.3%
        
  6,075        American National Group Inc      7.375%         $ 151,936  
  8,200        Aspen Insurance Holdings Ltd      5.625           160,720  
  4,550        Aspen Insurance Holdings Ltd      7.125           112,704  
  2,875        Assurant Inc      5.250           55,919  
  19,836        Athene Holding Ltd      6.350           487,965  
  10,532        Enstar Group Ltd      7.000           248,555  
  9,837        Reinsurance Group of America Inc      5.750           244,154  
  5,959        Reinsurance Group of America Inc      7.125           151,597  


     TOTAL INSURANCE               1,613,550  


TOTAL PREFERRED STOCK
(Cost $5,261,823)
        
 
5,120,097


PRINCIPAL
        
DESCRIPTION
  
RATE
    
MATURITY
    
VALUE


U.S. GOVERNMENT AND AGENCY OBLIGATIONS - 5.8% (4.0% of Total Investments)
 
     
$ 325,000      (g)   CoBank ACB      6.250        N/A        326,170  
  445,000      (g)   CoBank ACB      6.450        N/A        446,265  
  93,000      (g)   CoBank ACB      7.250        N/A        95,550  
  152,000      (a),(g)   Farm Credit Bank of Texas      6.200        N/A        150,535  
  136,000      (g)   Farm Credit Bank of Texas      7.000        N/A        140,193  
  407,040      (l)   United States Treasury Inflation Indexed Bonds      1.250        04/15/28        405,376  
  407,364      (l)   United States Treasury Inflation Indexed Bonds      1.375        07/15/33        397,042  
  286,385      (k),(l)   United States Treasury Inflation Indexed Bonds      0.250        07/15/29        275,899  
  270,088      (l)   United States Treasury Inflation Indexed Bonds      1.750        01/15/34        268,540  
  394,725      (l)   United States Treasury Inflation Indexed Bonds      2.125        04/15/29        403,043  
  606,990      (l)   United States Treasury Inflation Indexed Bonds      1.875        07/15/34        609,377  
  398,363      (l)   United States Treasury Inflation Indexed Bonds      1.625        10/15/29        402,270  
  928,494      (k),(l)   United States Treasury Inflation Indexed Bonds      2.125        01/15/35        944,885  
  946,062      (k),(l)   United States Treasury Inflation Indexed Bonds      1.625        04/15/30        950,700  
  80,522      (l)   United States Treasury Inflation Indexed Bonds      1.125        10/15/30        79,289  
  874,400      (k),(l)   United States Treasury Inflation Indexed Bonds      1.125        01/15/33        838,952  
  404,346      (l)   United States Treasury Inflation Indexed Bonds      0.375        01/15/27        399,346  
  408,568      (l)   United States Treasury Inflation Indexed Bonds      0.750        07/15/28        403,672  
  838,101      (l)   United States Treasury Inflation Indexed Bonds      0.125        07/15/30        790,901  
  316,360      (l)   United States Treasury Inflation Indexed Bonds      0.125        01/15/30        300,034  
  399,288      (l)   United States Treasury Inflation Indexed Bonds      0.375        07/15/27        394,625  
  428,974      (l)   United States Treasury Inflation Indexed Bonds      0.500        01/15/28        421,395  
  709,176      (l)   United States Treasury Inflation Indexed Bonds      0.875        01/15/29        698,141  
  735,114      (k),(l)   United States Treasury Inflation Indexed Bonds      1.875        07/15/35        733,146  
  714,402      (k),(l)   United States Treasury Inflation Indexed Bonds      1.625        10/15/27        719,747  
  770,646      (k),(l)   United States Treasury Inflation Indexed Bonds      2.375        10/15/28        793,576  
  172,968      (l)   United States Treasury Inflation Indexed Bonds      0.125        04/15/27        169,825  
  763,432      (k),(l)   United States Treasury Inflation Indexed Bonds      0.125        01/15/32        697,535  
  503,243      (l)   United States Treasury Inflation Indexed Bonds      3.625        04/15/28        527,924  
  119,147      (l)   United States Treasury Inflation Indexed Bonds      0.125        10/15/26        118,039  
  297,072      (k),(l)   United States Treasury Inflation Indexed Bonds      3.875        04/15/29        319,963  
  366,848      (l)   United States Treasury Inflation Indexed Bonds      3.375        04/15/32        404,889  
  194,263      (l)   United States Treasury Inflation Indexed Bonds      1.750        01/15/28        195,671  
  971,800      (k),(l)   United States Treasury Inflation Indexed Bonds      0.125        07/15/31        900,364  
  1,000,559      (k),(l)   United States Treasury Inflation Indexed Bonds      0.125        01/15/31        932,615  
  454,929      (l)   United States Treasury Inflation Indexed Bonds      2.500        01/15/29        469,518  
  560,280      (l)   United States Treasury Inflation Indexed Bonds      0.625        07/15/32        525,596  
  280,000        United States Treasury Note/Bond      4.125        06/30/32        281,608  
  1,324,999        United States Treasury Note/Bond      3.750        06/30/27        1,330,125  
  370,000        United States Treasury Note/Bond      3.875        07/31/30        372,732  
  449,400        United States Treasury Note/Bond      3.875        05/15/43        403,143  
  445,700        United States Treasury Note/Bond      2.875        05/15/49        319,738  
  385,000        United States Treasury Note/Bond      3.750        10/31/32        380,729  
  210,100        United States Treasury Note/Bond      3.625        05/15/53        169,959  
  130,000        United States Treasury Note/Bond      4.000        11/15/35        128,131  
  490,000        United States Treasury Note/Bond      3.875        06/15/28        494,211  
  200,000        United States Treasury Note/Bond      4.375        11/15/39        197,305  
  280,000        United States Treasury Note/Bond      4.250        08/15/35        282,013  
 
46
 
See Notes to Financial Statements

 
     PRINCIPAL
        
DESCRIPTION
  
RATE
    
MATURITY
    
VALUE


$ 785,000        United States Treasury Note/Bond      4.000%        05/31/30      $ 794,996  
  60,000        United States Treasury Note/Bond      4.625        05/15/54        57,785  
  285,000        United States Treasury Note/Bond      4.250        05/15/35        287,360  
  105,000        United States Treasury Note/Bond      3.750        06/30/30        105,250  
  313,500        United States Treasury Note/Bond      4.125        07/31/28        318,178  
  212,700        United States Treasury Note/Bond      3.875        08/15/33        210,930  
  235,000        United States Treasury Note/Bond      4.875        10/31/30        246,860  
  106,200        United States Treasury Note/Bond      4.000        02/15/34        105,868  
  190,000        United States Treasury Note/Bond      4.625        11/15/55        183,053  
  50,000        United States Treasury Note/Bond      4.625        05/31/31        52,043  
  555,000        United States Treasury Note/Bond      4.750        08/15/45        560,377  
  215,000        United States Treasury Note/Bond      3.875        08/15/34        211,691  
  80,000        United States Treasury Note/Bond      3.750        08/31/31        79,734  
  545,000        United States Treasury Note/Bond      5.000        05/15/45        559,477  
  55,000        United States Treasury Note/Bond      4.000        12/15/27        55,533  
  465,000        United States Treasury Note/Bond      4.750        05/15/55        456,935  
  105,000        United States Treasury Note/Bond      4.000        03/31/30        106,337  
  160,000        United States Treasury Note/Bond      3.875        04/30/30        161,250  
  925,000        United States Treasury Note/Bond      4.125        05/31/32        937,141  
  175,000        United States Treasury Note/Bond      3.750        11/30/32        173,763  


TOTAL U.S. GOVERNMENT AND AGENCY OBLIGATIONS
(Cost $27,463,182)
        
 
27,674,863


PRINCIPAL
        
DESCRIPTION
  
RATE
    
MATURITY
    
VALUE


VARIABLE RATE SENIOR LOAN INTERESTS - 10.5% (7.3% of Total Investments)


AUTOMOBILES & COMPONENTS - 0.1%
        
  34,492      (i)   Adient US LLC, Term Loan B2, (TSFR1M + 2.250%)      5.966        01/29/31        34,671  
  335,261      (i)   Clarios Global LP, Term Loan B, (TSFR1M + 2.500%)      6.216        05/06/30        336,134  
  221,445      (i)   Clarios Global LP, Term Loan B, (TSFR1M + 2.750%)      6.466        01/28/32        222,863  
  68,466      (i)   DexKo Global Inc., Term Loan B, (TSFR1M + 3.750%)      7.581        10/04/28        68,103  


     TOTAL AUTOMOBILES & COMPONENTS            661,771  


CAPITAL GOODS - 0.9%
        
  209,541      (i)   ACProducts, Inc., Term Loan B, (TSFR3M + 4.250%)      8.184        05/17/28        171,841  
  2,885      (i),(m)   Air Comm Corporation, LLC, Delayed Draw Term Loan      1.000        12/11/31        2,899  
  59,174      (i)   Air Comm Corporation, LLC, Term Loan, (TSFR3M + 2.750%)      6.506        12/11/31        59,466  
  117,000      (i),(n)   Allison Transmission Inc, Term Loan, (TBD)      TBD        TBD             117,756  
  26,931      (i),(n)   Artera Services LLC, Term Loan, (TBD)      TBD        TBD        21,927  
  211,404      (i)   Barnes Group Inc, Term Loan B, (TSFR1M + 2.750%)      6.466        01/27/32        212,178  
  43,450      (i)   Bleriot US Bidco Inc., Term Loan B, (TSFR3M + 2.500%)      6.172        10/17/30        43,712  
  86,628      (i)   Brand Industrial Services Inc, Term Loan B, (TSFR3M + 4.500%)      8.354        08/01/30        79,176  
  53,900      (i)   Centuri Group, Inc, Term Loan B, (TSFR1M + 2.250%)      6.123        07/09/32        54,170  
  284,963      (i)   Chamberlain Group Inc, Term Loan B, (TSFR1M + 2.750%)      6.466        09/08/32        285,884  
  81,578      (i)   Chart Industries, Inc., Term Loan B, (TSFR3M + 2.500%)      6.476        03/18/30        82,068  
  65,434      (i),(o)   Conair Holdings, LLC, Term Loan B, (TSFR1M + 3.750%)      7.581        05/17/28        34,435  
  22,246      (i)   Core & Main LP, Term Loan B, (TSFR3M + 2.000%)      5.690        07/27/28        22,343  
  25,867      (i)   Cornerstone Building Brands, Inc., Term Loan, (TSFR1M + 5.625%)      9.375        08/01/28        20,564  
  169,163      (i)   Cornerstone Building Brands, Inc., Term Loan B, (TSFR1M + 3.250%)      7.100        04/12/28        133,385  
  140,648      (i)   CP Atlas Buyer, Inc., Term Loan, (TSFR1M + 5.250%)      8.966        07/08/30        136,428  
  109,880      (i)   Filtration Group Corporation, Term Loan, (TSFR1M + 2.750%)      6.466        10/23/28        110,601  
  96,933      (i)   Gates Global LLC, Term Loan B5, (TSFR1M + 1.750%)      5.466        06/04/31        97,286  
  38,000      (i)   Green Infrastructure Partners Inc, Term Loan B, (TSFR3M + 2.750%)      6.422        09/24/32        38,143  
  49,535      (i),(m)  
Kaman Corporation, Delayed Draw Term Loan, (N/A + TSFR3M
+ 1.750%)
     3.930        02/26/32        49,796  
  523,683      (i)   Kaman Corporation, Term Loan B, (TSFR3M + TSFR6M + 2.500%)      6.433        02/26/32        526,435  
  124,029      (i)   Madison IAQ LLC, Term Loan, (TSFR6M + 2.500%)      6.702        06/21/28        124,768  
  57,866      (i)   Madison Safety & Flow LLC, First Lien Term Loan B, (TSFR1M + 2.500%)      6.227        09/26/31        58,348  
  71,924      (i)   MI Windows and Doors, LLC, Term Loan B2, (TSFR1M + 2.750%)      6.466        03/28/31        72,082  
 
See Notes to Financial Statements
 
47

Portfolio of Investments December 31, 2025
(continued)
NMAI
 
     PRINCIPAL
        
DESCRIPTION
  
RATE
    
MATURITY
    
VALUE


CAPITAL GOODS
(continued)
        
$ 93,341      (i)   Oregon Tool, Inc., 2nd Lien Term Loan, (TSFR3M + 4.000%)      8.140%        10/15/29      $ 67,392  
  48,000      (i)   Oregon Tool, Inc., First Lien Term Loan, (TSFR3M + 5.350%)      9.228        10/15/29        49,005  
  10,484      (i),(m)   Pinnacle Buyer LLC, Delayed Draw Term Loan      1.250        10/01/32        10,536  
  54,380      (i)   Pinnacle Buyer LLC, Term Loan, (CME Term SOFR 1 Month + 2.500%)      6.485        10/01/32        54,652  
  160,785      (i)   Quikrete Holdings, Inc., Term Loan B, (TSFR1M + 2.250%)      5.966        01/31/32        161,463  
  37,490      (i)   Quikrete Holdings, Inc., Term Loan B1, (TSFR1M + 2.250%)      5.966        04/14/31        37,641  
  68,000      (i)   QXO Inc, Term Loan B, (TSFR1M + 2.000%)      5.716        04/30/32        68,321  
  104,738      (i)   Resideo Funding Inc., Incremental Term Loan, (TSFR3M + 2.000%)      5.723        08/13/32        105,130  
  514,270      (i)   TK Elevator Midco GmbH, Term Loan B, (TSFR6M + 2.750%)      6.947        04/30/30        518,053  
  154,050      (i)   TransDigm, Inc., Term Loan, (TSFR1M + 2.500%)      6.216        01/20/32        154,841  
  284,961      (i)   TransDigm, Inc., Term Loan J, (TSFR1M + 2.500%)      6.216        02/28/31        286,353  
  174,563      (i)   TransDigm, Inc., Term Loan M, (TSFR1M + 2.500%)      6.216        08/19/32        175,487  
  263,877      (i)   Victory Buyer LLC, Term Loan, (TSFR1M + 3.750%)      7.581        11/20/28        265,608  


     TOTAL CAPITAL GOODS               4,510,173  


COMMERCIAL & PROFESSIONAL SERVICES - 0.8%
        
  279,300      (i)   Allied Universal Holdco LLC, Term Loan B, (TSFR1M + 3.250%)      6.966        08/20/32        281,089  
  68,335      (i)   Amentum Government Services Holdings LLC, Term Loan B, (TSFR1M + 2.000%)      5.716        09/29/31        68,613  
  275,923      (i)   Anticimex International AB, Term Loan, (TSFR3M + 2.900%)      7.310        11/21/31        277,647  
  10,345      (i),(m)   Archkey Solutions LLC, Delayed Draw Term Loan B      4.250        11/03/31        10,474  
  88,984      (i)   Archkey Solutions LLC, Term Loan B, (TSFR3M + 4.250%)      7.922        11/03/31        90,097  
  196,505      (i)   CoreLogic, Inc., Term Loan, (TSFR1M + 3.500%)      7.331        06/02/28        196,951  
  122,235      (i)   Creative Artists Agency, LLC , Repriced Term Loan B, (TSFR1M + 2.500%)      6.216        10/01/31        122,846  
  155,930      (i)   Ensemble RCM, LLC, Term Loan B, (TSFR3M + 3.000%)      6.840        08/01/29        156,877  
  291,963      (i)   Garda World Security Corporation, Term Loan B, (TSFR1M + 3.000%)      6.750        02/01/29        293,569  
  94,763      (i)   GFL Environmental Inc., Term Loan B, (TSFR3M + 2.500%)      6.273        03/03/32        95,284  
  133,656      (i)   Medical Solutions Holdings Inc, Term Loan, (CME Term SOFR 3 Month + 3.500%)      7.440        11/01/28        96,232  
  67,824      (i)   OMNIA Partners LLC, Term Loan B, (TSFR3M + 2.750%)      6.455        07/25/30        68,175  
  61,000      (i)   Openlane Inc, Term Loan B, (TSFR3M + 2.500%)      6.365        10/08/32        61,153  
  44,505      (i)   PG Investment Company 59 S.a r.l., Repriced Term Loan B, (TSFR3M + 2.250%)      5.922        03/26/31        44,710  
  48,784      (i)   Prime Security Services Borrower, LLC, First Lien Term Loan B, (TSFR6M + 2.000%)      6.129        10/15/30        48,916  
  324,183      (i)   Prime Security Services Borrower, LLC, Incremental Term Loan B, (TSFR1M + 1.750%)      5.585        03/08/32        323,757  
  17,160      (i),(m)   Pye-Barker Fire & Safety, LLC, Delayed Draw Term Loan      1.250        12/16/32        17,287  
  114,840      (i)   Pye-Barker Fire & Safety, LLC, Term Loan, (TSFR3M + 2.500%)      6.205        12/16/32        115,689  
  19,570      (i)   Reworld Holding Corp, First Lien Term Loan C, (TSFR1M + 2.250%)      5.984        01/15/31        19,611  
  81,047      (i)   Reworld Holding Corp, Term Loan B, (TSFR1M + 2.250%)      5.984        11/30/28        81,279  
  120,430      (i)   Reworld Holding Corp, Term Loan B1, (TSFR1M + 2.250%)      5.984        01/15/31        120,681  
  30,035      (i)   Signal Parent, Inc, Term Loan B, (TSFR3M + 3.500%)      7.440        04/03/28        21,675  
  353,000      (i),(n)   United States, Term Loan, (TBD)      TBD        TBD        352,371  
  140,474      (i)   West Corporation, Term Loan B3, (TSFR3M + 4.000%)      8.090        04/12/27        45,391  
  570,693      (i)   WIN Waste Innovations Holdings, Inc., Term Loan B, (TSFR1M + 2.750%)      6.581        03/27/28        572,953  
  118,503      (i)   XPLOR T1 LLC, Term Loan, (TSFR3M + 3.500%)      7.292        12/01/32        118,799  


     TOTAL COMMERCIAL & PROFESSIONAL SERVICES            3,702,126  


CONSUMER DISCRETIONARY DISTRIBUTION & RETAIL - 0.4%
        
  118,505      (i)   Belron Finance LLC, Repriced Term Loan B, (TSFR3M + 2.250%)      6.120        10/16/31        119,319  
  249,237      (i)   CNT Holdings I Corp, Term Loan, (TSFR3M + 2.250%)      6.090        11/08/32        250,107  
  44,444      (i)   Gulfside Supply Inc, Term Loan B, (TSFR3M + 3.000%)      6.672        06/17/31        43,917  
  241,936      (i)   Johnstone Supply LLC, Term Loan B, (TSFR1M + 2.500%)      6.230        06/09/31        243,582  
  65,694      (i),(o)   LBM Acquisition LLC, Incremental Term Loan B, (TSFR1M + 3.750%)      7.584        06/06/31        61,800  
  151,118      (i)   Les Schwab Tire Centers, Term Loan B, (TSFR1M + TSFR3M + 2.500%)      6.269        04/23/31        151,508  
 
48
 
See Notes to Financial Statements

 
     PRINCIPAL
        
DESCRIPTION
  
RATE
    
MATURITY
    
VALUE


CONSUMER DISCRETIONARY DISTRIBUTION & RETAIL
(continued)
        
$ 174,784      (i)   Michaels Companies, Inc., Term Loan B, (TSFR3M + 4.250%)      8.184%        04/17/28      $ 169,425  
  56,221      (i)   Mister Car Wash Holdings, Inc., Term Loan B, (TSFR1M + 2.500%)      6.216        03/27/31        56,508  
  32,000      (i),(o)   Park River Holdings Inc, Term Loan, (TSFR3M + 4.500%)      8.485        03/17/31        32,228  
  80,000      (i)   PetSmart, Inc., Term Loan B, (TSFR1M + 4.000%)      7.734        08/18/32        79,775  
  135,517      (i)   Restoration Hardware, Inc., Term Loan B, (TSFR1M + 2.500%)      6.331        10/20/28        133,944  
  351,203      (i)   Wand NewCo 3, Inc., Repriced Term Loan B, (TSFR1M + 2.500%)      6.216        01/30/31        351,972  
  125,465      (i)   White Cap Buyer LLC, Term Loan B, (TSFR1M + 3.250%)      6.966        10/29/29        126,118  


     TOTAL CONSUMER DISCRETIONARY DISTRIBUTION & RETAIL            1,820,203  


CONSUMER DURABLES & APPAREL - 0.3%
        
  133,250      (i)   ABG Intermediate Holdings 2 LLC, First Lien Term Loan B, (TSFR1M + 2.250%)      5.966        12/21/28        133,617  
  292,048      (i)   AI Aqua Merger Sub, Inc., First Lien Term Loan B, (TSFR1M + TSFR3M + 3.000%)      6.863        07/31/28        293,020  
  121,475      (i)   Hayward Industries, Inc., Term Loan, (TSFR1M + 2.500%)      6.331        05/30/28        122,310  
  15,958      (i),(n)   MajorDrive Holdings IV LLC, Term Loan, (TBD)      TBD        TBD        14,531  
  2,911      (i)   Serta Simmons Bedding, LLC, New Term Loan, (TSFR3M + 7.500%)      11.286        06/29/28        2,753  
  96,467      (i)   Somnigroup International Inc, Term Loan B, (SOFR30A + 2.250%)      5.910        10/24/31        97,231  
  60,613      (i)   Topgolf Callaway Brands Corp., Term Loan B, (TSFR1M + 3.000%)      6.716        03/18/30        60,861  
  248,750      (i)   Varsity Brands, Inc., First Lien Term Loan, (TSFR3M + 3.000%)      6.672        08/26/31        249,955  
  215,000      (i)   Weber-Stephen Products LLC, Term Loan B, (TSFR3M + 3.750%)      7.735        10/01/32        215,591  
  104,475      (i)   WH Borrower, LLC, Term Loan B, (TSFR3M + 4.500%)      8.389        02/20/32        105,103  


     TOTAL CONSUMER DURABLES & APPAREL         1,294,972  


CONSUMER SERVICES - 0.7%
        
  51,859      (i)   101B.C. Unlimited Liability Company, Term Loan B6, (TSFR1M + 1.750%)      5.466        09/23/30        51,989  
  44,267      (i)   Allwyn Entertainment Financing US LLC, Term Loan B, (TSFR3M + 2.000%)      5.912        06/11/31        42,773  
  357,232      (i)   Alterra Mountain Company, Term Loan B8, (TSFR1M + 2.500%)      6.216        05/31/30        359,467  
  191,238      (i)   Alterra Mountain Company, Term Loan B9, (TSFR1M + 2.500%)      6.216        08/17/28        192,194  
  46,768      (i)   Caesars Entertainment Inc., Term Loan B, (TSFR1M + 2.250%)      5.966        02/06/30        46,523  
  243,144      (i)   Caesars Entertainment Inc., Term Loan B1, (TSFR1M + 2.250%)      5.966        02/06/31        241,321  
  140,125      (i)   Camelot U.S. Acquisition LLC, Term Loan B, (TSFR1M + 2.750%)      6.466        01/31/31        138,528  
  70,000      (i)   Catawba Nation Gaming Authority, Term Loan B, (TSFR1M + 4.750%)      8.466        03/29/32        71,808  
  89,608      (i)   Churchill Downs Incorporated, Incremental Term Loan B1, (TSFR1M + 1.750%)      5.466        03/17/28        89,804  
  184,250      (i)   Delta 2 (LUX) S.a.r.l., Term Loan B1, (TSFR3M + 1.750%)      5.422        09/19/31        185,125  
  55,897      (i)   Element Materials Technology Group US Holdings Inc., Term Loan, (TSFR3M + 3.675%)      7.347        06/25/29        56,455  
  173,420      (i)   Fertitta Entertainment, LLC, Term Loan B, (TSFR1M + 3.250%)      6.966        01/29/29        173,578  
  64,675      (i)   Flutter Financing B.V., Term Loan B, (TSFR3M + 2.000%)      5.672        06/04/32        64,776  
  242,874      (i)   Flutter Financing B.V., Term Loan B, (TSFR3M + 1.750%)      5.422        11/29/30        242,976  
  93,943      (i)   GBT US III LLC, Term Loan B, (TSFR3M + 2.500%)      6.358        07/28/31        94,381  
  131,651      (i)   GVC Holdings (Gibraltar) Limited, Term Loan B6 (2029), (TSFR3M + 2.250%)      5.922        10/31/29        131,044  
  64,675      (i)   Herschend Entertainment Company, LLC, Term Loan B, (TSFR1M + 3.250%)      6.966        05/27/32        65,207  
  91,467      (i)   Hilton Grand Vacations Borrower LLC, Term Loan B, (TSFR1M + 2.000%)      5.716        08/02/28        91,833  
  118,324      (i)   IRB Holding Corp, Term Loan B, (TSFR1M + 2.500%)      6.216        12/16/30        118,733  
  236,049      (i)   Light and Wonder International, Inc., Term Loan B2, (TSFR1M + 2.250%)      5.986        04/16/29        237,303  
  137,888      (i)   Scientific Games Holdings LP, Term Loan B, (TSFR3M + 3.000%)      6.934        04/04/29        135,648  
  79,025      (i)   SeaWorld Parks & Entertainment, Inc., Term Loan B3, (TSFR1M + 2.000%)      5.716        12/04/31        78,695  
  291,654      (i)   Spin Holdco Inc., Term Loan, (TSFR3M + 4.000%)      8.022        03/06/28        226,396  
 
See Notes to Financial Statements
 
49

Portfolio of Investments December 31, 2025
(continued)
NMAI
 
     PRINCIPAL
        
DESCRIPTION
  
RATE
    
MATURITY
    
VALUE


CONSUMER SERVICES
(continued)
        
$ 158,553      (i)   TKO Worldwide Holdings, LLC, Term Loan, (TSFR3M + 2.000%)      5.868%        11/21/31      $ 159,456  


     TOTAL CONSUMER SERVICES               3,296,013  


ENERGY - 0.2%
        
  150,638      (i)   EG America LLC, Repriced Term Loan, (TSFR3M + 3.500%)      7.322        02/07/28        151,407  
  511,196      (i)   Freeport LNG Investments, LLLP, Term Loan A, (TSFR3M + 3.000%)      7.146        11/16/26        513,220  
  161,000      (i),(o)   New Fortress Energy Inc, Incremental Term Loan B, (TSFR3M + 5.500%)      9.238        10/30/28        68,667  
  86,046      (i)   TransMontaigne Operating Company L.P., Term Loan B, (TSFR1M + 2.500%)      6.216        11/17/28        86,763  


     TOTAL ENERGY            820,057  


FINANCIAL SERVICES - 0.1%
        
  29,849      (i)   AAL Delaware Holdco, Inc., Term Loan, (TSFR1M + 2.750%)      6.466        07/30/31        30,041  
  68,963      (i)  
Aragorn Parent Corporation, Repriced Term Loan B, (TSFR1M
+ 3.500%)
     7.216        12/15/28        69,531  
  105,000      (i)   Beach Acquisition Bidco LLC, Term Loan B, (TSFR3M + 3.250%)      6.922        09/13/32        105,985  
  39,900      (i)   Colossus Acquireco LLC, Term Loan B, (SOFR90A + 1.750%)      5.410        07/30/32        39,918  
  61,535      (i)  
Dechra Pharmaceuticals Holdings Ltd, Term Loan B, (TSFR6M
+ 3.250%)
     7.447        01/27/32        62,064  
  167,887      (b),(i),(p)   Ditech Holding Corporation, Term Loan      0.000        06/30/27        17  
  121,466      (i)   Kestra Advisor Services Holdings A, Inc., Repriced Term Loan, (TSFR1M + 3.000%)      6.716        03/24/31        121,845  
  32,000      (i)   NCR Atleos LLC, Term Loan B, (TSFR3M + 3.000%)      6.701        04/16/29        32,180  
  56,000      (i)   Orion US Finco Inc., First Lien Term Loan, (TSFR3M + 3.500%)      7.427        10/12/32        56,328  
  71,190      (i)   Trans Union, LLC, Term Loan B8, (TSFR1M + 1.750%)      5.466        06/24/31        71,440  
  91,309      (i)   WEX Inc., Term Loan B2, (TSFR1M + 1.750%)      5.466        04/03/28        91,638  


     TOTAL FINANCIAL SERVICES            680,987  


FOOD, BEVERAGE & TOBACCO - 0.2%
        
  44,550      (i)   Aspire Bakeries Holdings LLC, Term Loan B, (TSFR1M + 3.500%)      7.221        12/23/30        44,862  
  22,884      (i),(o)   B&G Foods, Inc., Term Loan B, (TSFR1M + 3.500%)      7.216        10/10/29        22,140  
  121,325      (i)   CHG PPC Parent LLC, Term Loan, (TSFR1M + 3.000%)      6.831        12/08/28        121,932  
  36,476      (i)  
City Brewing Company, LLC, PIK First Out Term Loan, (TSFR3M
+ 7.000%), (cash 10.822%, PIK 7.000%)
     10.822        09/30/30        14,955  
  8,285      (i)   City Brewing Company, LLC, PIK Super Priority Term Loan, (TSFR3M + 7.000%), (cash 10.822%, PIK 7.000%)      10.822        09/30/30        7,125  
  89,287      (i)   Fiesta Purchaser, Inc., Repriced Term Loan, (TSFR1M + 2.750%)      6.466        02/12/31        89,364  
  201,000      (i),(o)   Froneri Lux Finco Sarl, Term Loan, (TSFR6M + 2.250%)      6.122        09/30/32        201,280  
  99,000      (i)   Naked Juice LLC, FLFO Term Loan, (TSFR3M + 5.500%)      9.172        01/24/29        98,753  
  203,376      (i)   Pegasus BidCo BV, Repriced Term Loan B, (TSFR3M + 2.750%)      6.602        07/12/29        204,393  
  8,621      (i),(m)   Sauer Brands Inc, Delayed Draw Term Loan      3.000        02/19/32        8,667  
  90,922      (i)   Sauer Brands Inc, Term Loan B, (TSFR3M + 3.000%)      6.782        02/19/32        91,415  
  238,929      (i)   Triton Water Holdings, Inc, Term Loan B, (TSFR3M + 2.250%)      5.922        03/31/28        239,885  
  42,621      (i)  
Wayne Sanderson Farms LLC, Repriced Term Loan B, (TSFR1M
+ 2.000%)
     5.732        05/21/32        42,994  


     TOTAL FOOD, BEVERAGE & TOBACCO            1,187,765  


HEALTH CARE EQUIPMENT & SERVICES - 0.8%
        
  72,134      (i)   ADMI Corp., Term Loan B5, (TSFR1M + 5.750%)      9.466        12/23/27        69,357  
  188,313      (i)   AHP Health Partners, Inc., Term Loan B, (TSFR1M + 2.250%)      5.966        09/20/32        188,637  
  228,239      (i)   Gainwell Acquisition Corp., Term Loan B, (TSFR3M + 4.000%)      7.772        10/01/27        224,645  
  305,879      (i)   Global Medical Response, Inc., Term Loan B, (TSFR3M + 3.500%)      7.384        09/20/32        308,150  
  89,000      (i),(o)   Lumexa Imaging, Inc., Term Loan B, (TSFR3M + 3.000%)      6.705        12/17/32        89,724  
  87,596      (i)   MedAssets Software Intermediate Holdings, Inc., First Out Term Loan, (TSFR3M + 4.000%)      7.695        12/18/28        79,295  
  8,977      (i)  
Medical Solutions Holdings, Inc., First Lien Term Loan, (TSFR3M
+ 3.500%)
     7.440        11/01/28        2,100  
  167,856      (i)   Medline Borrower, LP, Term Loan B, (TSFR1M + 1.750%)      5.466        10/23/28        168,543  
  33,900      (i),(m)   National Mentor Holdings, Inc., Delayed Draw Term Loan      6.000        12/12/30        34,011  
  79,100      (i)   National Mentor Holdings, Inc., First Lien Term Loan B, (TSFR1M + 6.000%)      9.716        12/12/30        79,360  
 
50
 
See Notes to Financial Statements

 
     PRINCIPAL
        
DESCRIPTION
  
RATE
    
MATURITY
    
VALUE


HEALTH CARE EQUIPMENT & SERVICES
(continued)
        
$ 71,000      (i)   Onex TSG Intermediate Corp., Term Loan B, (TSFR3M + 3.750%)      7.590%        08/06/32      $ 71,566  
  219,450      (i)   Opal Bidco SAS, First Lien Term Loan B, (TSFR3M + 3.000%)      6.686        04/23/32        221,096  
  170,966      (i)   Pacific Dental Services, LLC, Term Loan B, (TSFR1M + 2.500%)      6.236        03/17/31        171,826  
  310,540      (i)   Phoenix Guarantor Inc, Term Loan B, (TSFR1M + 2.500%)      6.216        02/21/31        312,411  
  109,725      (i)   Radiology Partners Inc, Term Loan, (TSFR3M + 4.500%)      8.172        06/30/32        109,665  
  69,128      (i)   Resonetics, LLC, Repriced Term Loan B, (TSFR3M + 2.750%)      6.593        06/18/31        69,352  
  16,002      (i)   Sound Inpatient Physicians, Tranche A Term Loan (First Out), (TSFR3M + 3.250%), (cash 9.433%, PIK 1.000%)      5.217        06/28/28        16,643  
  176,799      (i)   Sound Inpatient Physicians, Tranche B Term Loan (Second Out), (TSFR3M + 3.500%), (cash 7.433%, PIK 1.500%)      7.433        06/28/28        173,190  
  115,121      (i)   Star Parent Inc., Term Loan B, (TSFR3M + 4.000%)      7.672        09/30/30        115,387  
  603,253      (i)   Surgery Center Holdings, Inc., Term Loan B, (TSFR1M + 2.500%)      6.216        12/19/30        606,322  
  447,625      (i)   Team Health Holdings, Inc., Term Loan B, (TSFR3M + 4.500%)      8.340        06/30/28        449,688  
  61,000      (i),(n)   Upstream Newco Inc, Term Loan, (TBD)      TBD        TBD        54,642  
  68,594      (i)   Viant Medical Holdings, Inc., Term Loan B, (TSFR1M + 4.000%)      7.716        10/29/31        68,019  


     TOTAL HEALTH CARE EQUIPMENT & SERVICES               3,683,629  


HOUSEHOLD & PERSONAL PRODUCTS - 0.0%
        
  73,426      (i)   VC GB Holdings I Corp., First Lien Term Loan, (TSFR3M + 3.500%)      7.434        05/16/28        73,844  


     TOTAL HOUSEHOLD & PERSONAL PRODUCTS            73,844  


INSURANCE - 0.8%
        
  106,552      (i)   Acrisure, LLC, First Lien Term Loan B6, (TSFR1M + 3.000%)      6.716        11/06/30        106,602  
  209,475      (i)   Alera Group, Inc., Term Loan, (TSFR1M + 3.250%)      6.966        05/28/32        210,720  
  648,744      (i)   Alliant Holdings Intermediate, LLC, Term Loan B, (TSFR1M + 2.500%)      6.216        09/19/31        650,941  
  275,029      (i)   AmWINS Group, Inc., Term Loan B, (TSFR1M + 2.250%)      5.966        01/30/32        276,130  
  327,000      (i),(o)   Asurion LLC, 2nd Lien Term Loan B3, (TSFR1M + 5.250%)      9.081        02/03/28        326,439  
  117,696      (i)   Asurion LLC, Term Loan B10, (TSFR1M + 4.000%)      7.816        08/21/28        117,976  
  90,477      (i)   Asurion LLC, Term Loan B11, (TSFR1M + 4.250%)      8.066        08/21/28        90,747  
  183,920      (i)   Asurion LLC, Term Loan B13, (TSFR1M + 4.250%)      7.966        09/19/30        184,078  
  618,508      (i)   Broadstreet Partners, Inc., Term Loan B4, (TSFR1M + 2.750%)      6.466        06/16/31        621,263  
  76,500      (i)   Evertec Group, LLC, Term Loan B, (TSFR1M + 2.250%)      5.966        10/15/30        76,755  
  90,592      (i)   HUB International Limited, Term Loan B, (TSFR3M + 2.250%)      6.120        06/20/30        91,165  
  266,206      (i)   Ryan Specialty Group, LLC, Term Loan B, (TSFR1M + 2.000%)      5.716        09/15/31        267,012  
  308,811      (i)   Sedgwick Claims Management Services, Inc., Term Loan B, (TSFR1M + 2.500%)      6.216        07/31/31        310,131  
  169,575      (i)   Trucordia Insurance Holdings LLC, Term Loan B, (TSFR1M + 3.250%)      6.966        06/17/32        168,727  
  274,960      (i)   Truist Insurance Holdings LLC, Term Loan B, (TSFR3M + 2.750%)      6.422        05/06/31        275,763  
  28,219      (i)   USI, Inc., Term Loan C, (TSFR3M + 2.250%)      5.922        09/27/30        28,303  
  195,703      (i)   USI, Inc., Term Loan D, (TSFR3M + 2.250%)      5.922        11/23/29        196,366  


     TOTAL INSURANCE            3,999,118  


MATERIALS - 0.3%
        
  14,296      (i)   Arsenal AIC Parent LLC, Term Loan B, (TSFR1M + 2.750%)      6.466        08/19/30        14,354  
  112,000      (i)   BradyPlus Holdings LLC, Term Loan B, (TSFR3M + 3.500%)      7.172        12/29/32        110,996  
  316,165      (i)   Clydesdale Acquisition Holdings Inc, Term Loan B, (TSFR1M + 3.175%)      6.891        04/13/29        316,785  
  118,367      (i)   Clydesdale Acquisition Holdings Inc, Term Loan B, (TSFR1M + 3.250%)      6.966        03/29/32        118,409  
  64,563      (i)   Fortis 333, Inc., Term Loan B, (TSFR3M + 3.500%)      7.172        04/02/32        64,111  
  142,718      (i)   Klockner-Pentaplast of America, Inc., PIK DIP New Money Term Loan, (TSFR1M + 6.000%)      9.779        08/05/26        128,269  
  214,295      (i)   Klockner-Pentaplast of America, Inc., PIK DIP Roll-Up Term Loan, (TSFR3M + 3.000%)      6.686        08/05/26        192,598  
  233,271      (i),(p)   Klockner-Pentaplast of America, Inc., Term Loan B, (CME Term SOFR 6 Month + 4.725%)      0.000        02/09/26        34,991  
  116,676      (i)   Nouryon Finance B.V., Term Loan B1, (TSFR6M + 3.250%)      7.036        04/03/28        116,919  
  14,702      (i)   Nouryon Finance B.V., Term Loan B2, (TSFR3M + 3.250%)      7.162        04/03/28        14,734  
  93,104      (i)   Proampac PG Borrower LLC, Term Loan, (TSFR3M + 4.000%)      7.891        09/15/28        93,414  
 
See Notes to Financial Statements
 
51

Portfolio of Investments December 31, 2025
(continued)
NMAI
 
     PRINCIPAL
        
DESCRIPTION
  
RATE
    
MATURITY
    
VALUE


MATERIALS
(continued)
        
$ 163,000      (i)   Qnity Electronics Inc, Term Loan B, (TSFR6M + 2.000%)      5.804%        11/01/32      $ 163,942  
  54,042      (i)   SupplyOne, Inc, Term Loan B, (TSFR1M + 3.500%)      7.216        04/21/31        54,220  
  139,628      (i)   TricorBraun Holdings, Inc., Term Loan, (TSFR1M + 3.250%)      6.966        03/03/31        135,562  
  7,600      (i),(m)   USALCO, LLC, Delayed Draw Term Loan      1.000        09/30/31        7,640  
  73,029      (i)   USALCO, LLC, Term Loan, (TSFR1M + 3.500%)      7.216        09/30/31        73,417  


     TOTAL MATERIALS            1,640,361  


MEDIA & ENTERTAINMENT - 0.8%
        
  110,615      (i),(o)   Advantage Sales & Marketing, Inc., Term Loan, (TSFR3M + 4.250%)      8.446        10/28/27        92,529  
  84,302      (i)   Altice France S.A., Term Loan B11, (TSFR3M + 4.125%)      8.110        04/28/28        83,501  
  98,753      (i)   Altice France S.A., Term Loan B12, (TSFR3M + 5.063%)      9.048        10/31/28        97,797  
  142,306      (i)   Altice France S.A., Term Loan B13, (TSFR3M + 5.375%)      9.360        05/14/29        141,417  
  280,851      (i),(o)   Altice France S.A., Term Loan B14, (TSFR3M + 6.875%)      10.860        05/15/31        281,143  
  692,863      (i),(o)   AMC Entertainment Holdings, Inc. , Term Loan, (TSFR1M + 7.000%)      10.731        01/04/29        695,295  
  286,337      (i)   Cengage Learning, Inc., First Lien Term Loan B, (TSFR1M + TSFR3M + 3.500%)      7.275        03/24/31        287,851  
  123,444      (i)   Century De Buyer LLC, Term Loan B, (TSFR3M + 3.000%)      6.840        10/30/30        123,386  
  121,587      (i)   Cinemark USA, Inc., Term Loan B, (TSFR1M + TSFR3M + 2.250%)      5.944        05/24/30        121,849  
  287,605      (i)   Clear Channel Outdoor Holdings, Inc., Term Loan, (TSFR1M + 4.000%)      7.831        08/23/28        288,736  
  84,967      (i)   CMG Media Corporation, Term Loan, (TSFR3M + 3.500%)      7.272        06/18/29        79,546  
  611,835      (i)   Crown Finance US, Inc., Term Loan B, (TSFR1M + 4.500%)      8.343        12/02/31        604,570  
  27,753      (i)   CSC Holdings, LLC, Term Loan B5, (Prime + 1.500%)      8.250        04/15/27        24,324  
  12,406      (i)   E.W. Scripps Company (The), Term Loan B2, (TSFR1M + 5.750%)      9.600        06/30/28        12,579  
  25,870      (i)   E.W. Scripps Company (The), Term Loan B3, (TSFR1M + 3.350%)      7.200        11/30/29        25,029  
  103,738      (i),(n)   iHeartCommunications Inc, Term Loan, (TBD)      TBD        TBD        95,254  
  67,865      (i)   McGraw-Hill Global Education Holdings, LLC, First Lien Term Loan B, (TSFR1M + 2.750%)      6.466        08/06/31        68,526  
  32,000      (i),(n)   NEP Group Inc, Term Loan, (TBD)      TBD        TBD        29,480  
  136,892      (i)   Planet US Buyer LLC, Term Loan B, (TSFR3M + 3.000%)      6.822        02/10/31        137,955  
  51,739      (i)   Sinclair Television Group Inc., Term Loan B6, (TSFR3M + 3.300%)      7.402        12/31/29        47,510  
  82,134      (i)   Sunrise Financing Partnership, Term Loan AAA, (TSFR6M + 2.500%)      6.691        02/17/32        82,528  
  100,000      (i)   Virgin Media Bristol LLC, Term Loan Y, (TSFR6M + 3.175%)      7.052        03/31/31        99,233  
  164,169      (i)   WideOpenWest Finance LLC, Super Senior 2nd Out Term Loan, (TSFR3M + 3.000%)      7.173        12/11/28        149,804  


     TOTAL MEDIA & ENTERTAINMENT               3,669,842  


PHARMACEUTICALS, BIOTECHNOLOGY & LIFE SCIENCES - 0.3%
        
  124,688      (i)   Amneal Pharmaceuticals LLC, Term Loan B, (TSFR1M + 3.500%)      7.216        08/02/32        125,934  
  286,281      (i),(o)   Bausch Health Companies Inc., Term Loan B, (TSFR1M + 6.250%)      9.966        10/08/30        280,342  
  102,000      (i)   Genmab AS, Term Loan B, (TSFR3M + 3.000%)      6.733        11/12/32        102,606  
  211,423      (i)   Jazz Financing Lux S.a.r.l., First Lien Term Loan B, (TSFR1M + 2.250%)      5.966        05/05/28        212,583  
  268,452      (i)   Organon & Co, Term Loan, (TSFR1M + 2.250%)      5.966        05/19/31        259,324  
  578,540      (i)   Parexel International Corporation, Repriced Term Loan B, (TSFR1M + 2.750%)      6.466        12/12/31        581,193  
  108,061      (i)   Perrigo Investments, LLC, Term Loan B, (TSFR1M + 2.000%)      5.716        04/20/29        108,737  


     TOTAL PHARMACEUTICALS, BIOTECHNOLOGY & LIFE SCIENCES            1,670,719  


REAL ESTATE MANAGEMENT & DEVELOPMENT - 0.1%
        
  293,517      (i)  
Cushman & Wakefield U.S. Borrower, LLC, Term Loan, (TSFR1M
+ 2.500%)
     6.216        01/31/30        296,821  
  40,578      (i)   Cushman & Wakefield U.S. Borrower, LLC, Term Loan B3, (TSFR1M + 2.750%)      6.466        01/31/30        40,871  


     TOTAL REAL ESTATE MANAGEMENT & DEVELOPMENT            337,692  


52
 
See Notes to Financial Statements

 
     PRINCIPAL
        
DESCRIPTION
  
RATE
    
MATURITY
    
VALUE


SEMICONDUCTORS & SEMICONDUCTOR EQUIPMENT - 0.1%
        
$ 311,365      (i)  
Instructure Holdings, Inc., Repriced Term Loan, (TSFR3M +
2.750%)
     6.445%        11/13/31      $    312,280  


     TOTAL SEMICONDUCTORS & SEMICONDUCTOR EQUIPMENT         312,280  


SOFTWARE & SERVICES - 1.8%
        
  124,000      (i)   Asurion LLC, Second Lien Term Loan B4, (TSFR1M + 5.250%)      9.081        01/22/29        122,123  
  149,251      (i)   Avalara, Inc, Term Loan, (TSFR3M + 2.750%)      6.422        03/29/32        150,070  
  160,550      (i)   Avaya, Inc., Exit Term Loan, (TSFR1M + 7.500%), (cash 11.216%, PIK 7.500%)      11.216        08/01/28        144,668  
  109,451      (i)   BCPE Pequod Buyer Inc, Term Loan B, (TSFR1M + 3.000%)      6.716        11/25/31        109,827  
  535,536      (i)   Boost Newco Borrower, LLC, Term Loan B, (TSFR3M + 2.000%)      5.672        01/31/31        537,044  
  633,366      (i)   Boxer Parent Company Inc., Term Loan B, (TSFR3M + 3.000%)      6.822        07/30/31        632,463  
  112,718      (i)   Clearwater Analytics, LLC, Term Loan B, (TSFR6M + 2.000%)      6.210        04/21/32        112,929  
  65,800      (i),(o)   Cloud Software Group, Inc., Term Loan B (2031), (TSFR3M + 3.250%)      6.922        03/24/31        65,959  
  60,000      (i),(n)   Cloud Software Group, Inc., Term Loan B (2032), (TBD)      TBD        TBD        60,146  
  93,453      (i)   Cotiviti Corporation, 2nd Amendment Term Loan, (TSFR1M + 2.750%)      6.623        03/29/32        89,949  
  212,304      (i)   Cotiviti Corporation, Term Loan, (TSFR1M + 2.750%)      6.623        05/01/31        204,520  
  272,688      (i)   Darktrace PLC, First Lien Term Loan, (TSFR3M + 3.250%)      7.185        10/09/31        274,028  
  20,000      (i)   Disco Parent, Inc., Term Loan B, (TSFR3M + 3.250%)      7.072        08/06/32        20,150  
  18,950      (i)   Drake Software, LLC, Term Loan B, (TSFR3M + 4.250%)      7.922        06/26/31        18,665  
  168,654      (i)   Ellucian Holdings, Inc., First Lien Term Loan B, (TSFR1M + 2.750%)      6.466        10/09/29        169,813  
  424,859      (i)   Epicor Software Corporation, Term Loan E, (TSFR1M + 2.500%)      6.216        05/30/31        426,728  
  98,012      (i)   Fortress Intermediate 3, Inc, Term Loan B, (TSFR1M + 3.000%)      6.784        06/27/31        98,227  
  743,933      (i)   Genesys Cloud Services Holdings II LLC, Term Loan B, (TSFR1M + 2.500%)      6.216        01/30/32        743,353  
  116,124      (i)   Javelin Buyer, Inc., Term Loan, (TSFR3M + 2.750%)      6.590        12/08/31        116,644  
  83,370      (i)   Kaseya Inc., First Lien Term Loan B, (TSFR1M + 3.000%)      6.716        03/22/32        83,542  
  39,602      (i)   Marcel LUX IV SARL, Repriced Term Loan, (SOFR30A + 3.000%)      6.930        11/13/30        39,849  
  423,462      (i)   McAfee, LLC, First Lien Term Loan B, (TSFR1M + 3.000%)      6.716        03/01/29        392,183  
  323,458      (i)   Mitchell International, Inc., First Lien Term Loan, (TSFR1M + 3.250%)      6.966        06/17/31        324,915  
  320,141      (i),(o)   Peraton Corp., Term Loan B, (TSFR3M + 3.750%)      7.690        02/01/28        297,789  
  45,573      (i)   Perforce Software, Inc., Add-on Term Loan, (TSFR1M + 4.750%)      8.466        03/24/31        38,690  
  42,000      (i)   Ping Identity Corporation, Term Loan, (TSFR3M + 2.750%)      6.625        11/15/32        42,158  
  114,139      (i)   PointClickCare Technologies, Inc., Term Loan B, (TSFR3M + 2.750%)      6.422        11/03/31        114,520  
  247,192      (i)   Press Ganey Holdings, Inc., Repriced Term Loan B, (TSFR1M + 3.000%)      6.716        04/30/31        247,965  
  131,500      (i)   Project Alpha Intermediate Holding, Inc., First Lien Term Loan B, (TSFR3M + 3.250%)      6.922        10/28/30        131,443  
  137,355      (i)   Proofpoint, Inc., Term Loan, (CME Term SOFR 1 Month + 3.000%)      6.672        08/31/28        138,290  
  53,477      (i)   Rackspace Finance, LLC, First Lien First Out Term Loan, (TSFR1M + 6.250%)      10.115        05/15/28        54,557  
  241,624      (i)   Rackspace Finance, LLC, First Lien Second Out Term Loan, (TSFR1M + 2.750%)      6.615        05/15/28        90,340  
  192,237      (i)   Rocket Software, Inc., Term Loan B, (TSFR1M + 3.750%)      7.466        11/28/28        192,436  
  57,465      (i)   SS&C Technologies Inc., Term Loan B8, (TSFR1M + 2.000%)      5.716        05/09/31        57,868  
  87,079      (i)   Surf Holdings, LLC, Incremental Term Loan, (TSFR1M + 3.500%)      7.331        03/05/27        87,240  
  106,108      (i)   Synechron Inc, Term Loan B, (TSFR3M + 3.750%)      7.572        10/03/31        105,842  
  70,646      (i)   Tempo Acquisition LLC, Repriced Term Loan B, (TSFR1M + 1.750%)      5.466        08/31/28        68,097  
  529,240      (i)   UKG Inc., Term Loan B, (TSFR3M + 2.500%)      6.338        02/10/31        530,408  
  81,642      (i)   Vision Solutions, Inc., Incremental Term Loan, (TSFR3M + 4.000%)      8.102        04/24/28        76,192  
  207,906      (i)   VS Buyer, LLC, Term Loan B, (TSFR3M + 2.250%)      6.090        04/14/31        209,075  
  464,296      (i),(o)   X Corp., Term Loan, (TSFR3M + 6.500%)      10.448        10/29/29        457,167  
  310,000      (i),(o)   X Corp., Term Loan, (TSFR3M + 6.500%)      9.500        10/29/29        309,501  
  128,987      (i)   Zelis Payments Buyer, Inc., Term Loan B, (TSFR1M + 2.750%)      6.466        09/28/29        127,913  


     TOTAL SOFTWARE & SERVICES            8,315,286  


See Notes to Financial Statements
 
53

Portfolio of Investments December 31, 2025
(continued)
NMAI
 
     PRINCIPAL
        
DESCRIPTION
  
RATE
    
MATURITY
    
VALUE


TECHNOLOGY HARDWARE & EQUIPMENT - 0.4%
        
$ 855,573      (i)   CommScope, Inc., Term Loan, (TSFR1M + 4.750%)      8.466%        12/17/29      $ 858,294  
  443,756      (i)   Delta TopCo, Inc., Term Loan B, (TSFR1M + TSFR3M + 2.750%)      6.512        11/30/29        442,199  
  74,925      (i)   Ingram Micro Inc., Term Loan, (TSFR1M + 2.250%)      5.982        09/22/31        75,440  
  33,468      (i)   Riverbed Technology, Inc., PIK Term Loan, (TSFR3M + 2.250%), (cash 6.171%, PIK 2.500%)      4.086        07/03/28        15,416  
  24,938      (i)   Spectris Plc, Term Loan, (TSFR3M + 2.750%)      6.604        09/30/32        25,093  
  207,721      (i)(i)   Verifone Systems, Inc., Term Loan, (TSFR3M + 5.250%)      9.352        08/21/28        197,306  
  20,838      (i)   ViaSat, Inc., Term Loan, (TSFR1M + 4.500%)      8.331        03/05/29        20,810  
  196,492      (i)   ViaSat, Inc., Term Loan, (TSFR1M + 4.500%)      8.348        05/30/30        196,216  


     TOTAL TECHNOLOGY HARDWARE & EQUIPMENT            1,830,774  


TELECOMMUNICATION SERVICES - 0.8%
        
  243,184      (i)   Cincinnati Bell, Inc., Term Loan B4, (TSFR1M + 2.250%)      5.966        11/24/28        243,812  
  124,053      (i)   Connect Finco Sarl, Extended Term Loan B, (TSFR1M + 4.500%)      8.216        09/28/29        124,036  
  201,000      (i),(o)   Connect Holding II LLC, Delayed Draw Term Loan, (TSFR1M + 4.250%)      3.740        04/03/31        175,687  
  201,761      (b),(i)   Cyxtera DC Holdings, Inc., Term Loan B      0.000        05/01/26        1,110  
  178,000      (i)   Digicel International Finance Limited, Term Loan B, (TSFR3M + 5.250%)      9.023        08/09/32        178,127  
  652,976      (i)   Frontier Communications Corp., Term Loan B, (TSFR1M + 2.500%)      6.236        07/01/31        654,304  
  59,588      (i)   Iridium Satellite LLC, Term Loan B, (TSFR1M + 2.250%)      5.966        09/20/30        58,206  
  262,000      (i)   Level 3 Financing Inc., Repriced Term Loan B4, (TSFR1M + 3.250%)      6.966        03/29/32        263,081  
  106,727      (i),(o)   Lumen Technologies, Inc., Extended Term Loan B1, (TSFR1M + 2.350%)      6.181        04/16/29        106,320  
  573,341      (i)   Lumen Technologies, Inc., Extended Term Loan B2, (TSFR1M + 2.350%)      6.181        04/15/30        570,965  
  258,091      (i)   Lumen Technologies, Inc., Term Loan A, (TSFR1M + 6.000%)      9.716        06/01/28        260,349  
  184,000      (i)   Telesat Canada, Term Loan B5, (TSFR3M + 2.750%)      6.834        12/07/26        145,524  
  110,000      (i)   Windstream Services LLC, Term Loan B, (CME Term SOFR 1 Month + 4.000%)      7.716        10/06/32        110,550  
  1,022,509      (i),(o)   Zayo Group Holdings, Inc., Term Loan, (TSFR1M + 1.750%)      3.665        03/11/30        973,245  


     TOTAL TELECOMMUNICATION SERVICES         3,865,316  


TRANSPORTATION - 0.3%
        
  161,815      (i)   Air Canada, Term Loan B, (TSFR1M + 2.000%)      5.716        03/21/31        163,079  
  105,022      (i)   American Airlines, Inc., Term Loan, (TSFR3M + 2.250%)      6.134        04/20/28        105,403  
  121,096      (i)   Brown Group Holding, LLC, Incremental Term Loan B2, (TSFR1M + TSFR3M + 2.688%)      6.524        07/01/31        121,840  
  185,047      (i)   Brown Group Holding, LLC, Term Loan B, (TSFR1M + 2.500%)      6.216        07/01/31        186,183  
  98,315      (i)   First Student Bidco Inc, Term Loan B, (TSFR3M + 2.500%)      6.172        08/15/30        98,770  
  17,989      (i)   First Student Bidco Inc, Term Loan C, (TSFR3M + 2.500%)      6.172        08/15/30        18,060  
  289,152      (i)   KKR Apple Bidco, LLC, Term Loan, (TSFR1M + 2.500%)      6.216        09/23/31        290,970  
  88,086      (i)   PODS, LLC, Term Loan B, (TSFR1M + 3.000%)      6.831        03/31/28        87,222  
  156,000      (i)   Stonepeak Nile Parent LLC, Term Loan B, (TSFR3M + 2.250%)      6.162        04/09/32        156,195  
  97,627      (i)   United Airlines, Inc., First Lien Term Loan B, (TSFR1M + 2.000%)      5.732        02/24/31        98,207  
  82,800      (i)   WestJet Loyalty LP, Term Loan B, (TSFR3M + 3.250%)      6.922        02/14/31        83,279  


     TOTAL TRANSPORTATION         1,409,208  


UTILITIES - 0.3%
        
  116,708      (i)   Cornerstone Generation LLC, Term Loan B, (TSFR3M + 3.250%)      7.093        10/28/31        117,969  
  74,488      (i)   Invenergy Thermal Operating I LLC, Term Loan B, (SOFR90A + 2.750%)      6.410        05/06/32        74,972  
  4,688      (i)   Invenergy Thermal Operating I LLC, Term Loan C, (SOFR90A + 2.750%)      6.410        05/06/32        4,718  
  62,184      (i)   NRG Energy, Inc., Term Loan, (TSFR3M + 1.750%)      5.593        04/16/31        62,443  
  648,075      (i)   Talen Energy Supply, LLC, Incremental Term Loan B, (TSFR3M + 2.500%)      6.353        12/15/31        651,921  
  218,006      (i)   Talen Energy Supply, LLC, Term Loan B, (TSFR3M + 2.500%)      6.353        05/17/30        219,165  
  192,000      (i),(o)   Talen Energy Supply, LLC, Term Loan B, (TSFR3M + 2.000%)      5.672        11/26/32        192,271  
 
54
 
See Notes to Financial Statements

 
     PRINCIPAL
        
DESCRIPTION
  
RATE
    
MATURITY
    
VALUE


UTILITIES
(continued)
        
$ 2,819      (i)   Vistra Operations Company LLC, First Lien Term Loan B3, (TSFR1M + 1.750%)      5.466%        12/20/30      $ 2,837  


     TOTAL UTILITIES               1,326,296  


TOTAL VARIABLE RATE SENIOR LOAN INTERESTS
(Cost $50,361,716)
        
 
50,108,432


TOTAL LONG-TERM INVESTMENTS
(Cost $584,217,446)
        
 
678,724,227


PRINCIPAL
        
DESCRIPTION
  
RATE
    
MATURITY
    
VALUE


SHORT-TERM INVESTMENTS - 2.2%(1.5% of Total Investments)
        
    
REPURCHASE AGREEMENTS - 2.2% (1.5% of Total Investments)
        
  10,300,000      (q)   Fixed Income Clearing Corporation      3.780        01/02/26        10,300,000  


TOTAL REPURCHASE AGREEMENTS
(Cost $10,300,000)
        
 
10,300,000


TOTAL SHORT-TERM INVESTMENTS
(Cost $10,300,000)
        
 
10,300,000


TOTAL INVESTMENTS - 144.0%
(Cost $594,517,446)
        
 
689,024,227


BORROWINGS - (36.5)% (r),(s)
        
 
(174,786,000)


REVERSE REPURCHASE AGREEMENTS, INCLUDING ACCRUED INTEREST - (7.3)%(t)


(35,122,150)


OTHER ASSETS & LIABILITIES, NET - (0.2)%
        
 
(640,316)


NET ASSETS APPLICABLE TO COMMON SHARES - 100%
        
$
478,475,761


All percentages shown in the Portfolio of Investments are based on net assets applicable to common shares unless otherwise noted.
 
ADR
American Depositary Receipt
BRL
Brazilian Real
CLP
Chilean Peso
COP
Colombian Peso
CZK
Czech Koruna
ETF
Exchange-Traded Fund
EUR
Euro
GDR
Global Depositary Receipt
HUF
Hungarian Forint
IDR
Indonesian Rupiah
INR
Indian Rupee
KZT
Kazakhstani Tenge
MSCI
Morgan Stanley Capital International
MXN
Mexican Peso
MYR
Malaysian Ringgit
PEN
Peruvian Sol
PIK
Payment-in-kind (“PIK”) security. Depending on the terms of the security, income may be received in the form of cash, securities, or a combination of both. The PIK rate shown, where applicable, represents the annualized rate of the last PIK payment made by the issuer as of the end of the reporting period.
PLN
Polish Zloty
Reg S
Regulation S allows U.S. companies to sell securities to persons or entities located outside of the United States without registering those securities with the Securities and Exchange Commission. Specifically, Regulation S provides a safe harbor from the registration requirements of the Securities Act for the offers and sales of securities by both foreign and domestic issuers that are made outside the United States.
REIT
Real Estate Investment Trust
RON
Romanian Leu
S&P
Standard & Poor’s
SOFR30A
30 Day Average Secured Overnight Financing Rate
SOFR90A
90 Day Average Secured Overnight Financing Rate
TBD
Senior loan purchased on a when-issued or delayed-delivery basis. Certain details associated with this purchase are not known prior to the settlement date of the transaction. In addition, senior loans typically trade without accrued interest and therefore a coupon rate is not available prior to settlement. At settlement, if still unknown, the borrower or counterparty will provide the Fund with the final coupon rate and maturity date.
TRY
Turkish Lira
TSFR1M
CME Term Secured Overnight Financing Rate 1 Month
TSFR3M
CME Term Secured Overnight Financing Rate 3 Month
 
See Notes to Financial Statements
 
55

Portfolio of Investments December 31, 2025
(continued)
NMAI
 
TSFR6M
CME Term Secured Overnight Financing Rate 6 Month
UGX
Ugandan Shilling
UYU
Uruguayan Peso
ZAR
South African Rand
 
(a)
Security is exempt from registration under Rule 144A of the Securities Act of 1933, as amended. These securities are deemed liquid and may be resold in transactions exempt from registration, which are normally those transactions with qualified institutional buyers. As of the end of the fiscal period, the aggregate value of these securities is $114,263,539 or 16.6% of Total Investments.
(b)
For fair value measurement disclosure purposes, investment classified as Level 3.
(c)
Investment, or portion of investment, is hypothecated. The total value of investments hypothecated as of the end of the fiscal period was $153,946,639.
(d)
Non-income producing; issuer has not declared an ex-dividend date within the past twelve months.
(e)
Investment, or portion of investment, has been pledged to collateralize the net payment obligations for investments in derivatives.
(f)
Contains $1,000 Par Preferred and/or Contingent Capital Securities.
(g)
Perpetual security. Maturity date is not applicable.
(h)
$1,000 Par Institutional Preferred security. As of the end of the period, the percent of $1,000 Par Institutional Preferred securities was 3.8% of Total Investments.
(i)
Floating or variable rate security includes the reference rate and spread, when applicable. For mortgage-backed or asset-backed securities the variable rate is based on the underlying asset of the security. Coupon rate reflects the rate at period end.
(j)
Contingent Capital Securities (“CoCos”) are debt or preferred securities with loss absorption characteristics built into the terms of the security for the benefit of the issuer, for example an automatic write-down of principal or a mandatory conversion into the issuer’s common stock under certain adverse circumstances, such as the issuer’s capital ratio falling below a specified level. As of the end of the reporting period, the Fund’s total investment in CoCos was 3.1% of Total Investments.
(k)
Investment, or portion of investment, has been pledged to collateralize the net payment obligations for investments in reverse repurchase agreements. As of the end of the fiscal period, investments with a value of $37,802,647 have been pledged as collateral for reverse repurchase agreements.
(l)
Principal amount for interest accrual purposes is periodically adjusted based on changes in the Consumer Price Index.
(m)
Investment, or portion of investment, represents an outstanding unfunded senior loan commitment.
(n)
When-issued or delayed delivery security.
(o)
Portion of investment purchased on a delayed delivery basis.
(p)
Defaulted security. A security whose issuer has failed to fully pay principal and/or interest when due, or is under the protection of bankruptcy.
(q)
Agreement with Fixed Income Clearing Corporation, 3.780% dated 12/31/25 to be repurchased at $10,302,163 on 1/2/26, collateralized by Government Agency Securities, with coupon rate 3.625% and maturity date 10/31/30, valued at $10,506,122.
(r)
Borrowings as a percentage of Total Investments is 25.4%.
(s)
The Fund may pledge up to 100% of its eligible investments (excluding any investments separately pledged as collateral for specific investments in derivatives, when applicable) in the Portfolio of Investments as collateral for borrowings. As of the end of the reporting period, investments with a value of $327,912,626 have been pledged as collateral for borrowings.
(t)
Reverse Repurchase Agreements, including accrued interest as a percentage of Total investments is 5.1%.
Principal denominated in U.S. Dollars, unless otherwise noted.
Investments in Derivatives
Forward Foreign Currency Contracts
 
Currency Purchased
 
Notional Amount
(Local Currency)
  
Currency Sold
  
Notional Amount
(Local Currency)
    
Counterparty
  
Settlement
Date
    
Unrealized
Appreciation
(Depreciation)
 
$
 
882,331
  
EUR
  
 
752,159
 
  
Citibank N.A.
  
 
1/08/26


$(1,732)
 
Total


$(1,732)
 
Total unrealized appreciation on forward foreign currency contracts


$-
 
Total unrealized depreciation on forward foreign currency contracts


$(1,732)
 
 
56
 
See Notes to Financial Statements

Portfolio of Investments December 31, 2025
JRI
 
      SHARES
        
DESCRIPTION
  
VALUE


LONG-TERM INVESTMENTS - 144.0% (98.3% of Total Investments)
  
    
COMMON STOCKS - 70.5% (48.2% of Total Investments)
  
    
CAPITAL GOODS - 0.6%
  
 
14,491
 
    
Vinci SA
  
$
2,038,638


TOTAL CAPITAL GOODS
  
 
2,038,638


ENERGY - 10.7%
  
 
112,626
 
    
Enbridge Inc
  
 
5,386,902
 
 
482,219
 
    
Energy Transfer LP
  
 
7,951,791
 
 
55,373
 
    
Enterprise Products Partners LP
  
 
1,775,258
 
 
214,189
 
    
Kinder Morgan Inc
  
 
5,888,056
 
 
61,842
 
    
MPLX LP
  
 
3,300,508
 
 
68,839
 
    
ONEOK Inc
  
 
5,059,666
 
 
122,810
 
    
Pembina Pipeline Corp
  
 
4,678,689
 
 
106,424
 
    
Plains All American Pipeline LP
  
 
1,911,375
 
 
36,408
 
    
TC Energy Corp
  
 
2,004,821
 
 
37,978
 
    
Western Midstream Partners LP
  
 
1,500,131


TOTAL ENERGY
  
 
    39,457,197


EQUITY REAL ESTATE INVESTMENT TRUSTS (REITS) - 34.1%
  
 
98,659
 
    
Apple Hospitality REIT Inc
  
 
1,169,109
 
 
106,227
 
    
Armada Hoffler Properties Inc
  
 
703,223
 
 
65,292
 
    
Brixmor Property Group Inc
  
 
1,711,956
 
 
346,922
 
    
Broadstone Net Lease Inc
  
 
6,026,035
 
 
306,901
 
    
CapitaLand Ascendas REIT
  
 
674,744
 
 
409,875
 
    
CapitaLand Integrated Commercial Trust
  
 
760,746
 
 
88,597
 
    
Carmila SA
  
 
1,767,437
 
 
263,847
 
    
Charter Hall Long Wale REIT
  
 
716,557
 
 
257,455
 
    
Charter Hall Retail REIT
  
 
698,284
 
 
104,026
 
    
Community Healthcare Trust Inc
  
 
1,708,107
 
 
83,382
 
    
Crombie Real Estate Investment Trust
  
 
927,648
 
 
57,078
 
    
Crown Castle Inc
  
 
5,072,522
 
 
112,230
 
    
CT Real Estate Investment Trust
  
 
1,330,357
 
 
54,731
 
    
CubeSmart
  
 
1,973,053
 
 
476
 
    
Daiwa Securities Living Investments Corp
  
 
346,299
 
 
30,421
 
    
Derwent London PLC
  
 
709,703
 
 
22,607
 
    
Douglas Emmett Inc
  
 
248,451
 
 
276,593
 
    
Dream Industrial Real Estate Investment Trust
  
 
2,535,092
 
 
15,894
 
    
EPR Properties
  
 
793,111
 
 
46,131
 
    
Equity Residential
  
 
2,908,098
 
 
5,093
 
    
Extra Space Storage Inc
  
 
663,210
 
 
2,713
 
    
Federal Realty Investment Trust
  
 
273,470
 
 
571,267
 
  
(a)
 
FIBRA Macquarie Mexico
  
 
1,076,390
 
 
159,833
 
    
Four Corners Property Trust Inc
  
 
3,685,749
 
 
1,714,436
 
    
Frasers Centrepoint Trust
  
 
3,103,801
 
 
156,440
 
    
Gaming and Leisure Properties Inc
  
 
6,991,304
 
 
16,692
 
    
Gecina SA
  
 
1,585,283
 
 
525
 
    
GLP J-REIT
  
 
499,058
 
 
81,629
 
    
GO Residential Real Estate Investment Trust
  
 
956,692
 
 
9,653
 
    
Granite Real Estate Investment Trust
  
 
574,658
 
 
108,753
 
    
Highwoods Properties Inc
  
 
2,808,002
 
 
1,566
 
    
Invincible Investment Corp
  
 
643,046
 
 
29,487
 
    
Iron Mountain Inc
  
 
2,445,947
 
 
666
 
    
Japan Metropolitan Fund Invest
  
 
526,931
 
 
1,350
 
    
KDX Realty Investment Corp
  
 
1,515,178
 
 
69,860
 
    
Kimco Realty Corp
  
 
1,416,062
 
 
10,528
 
    
Lamar Advertising Co, Class A
  
 
1,332,634
 
 
1,647
 
    
LaSalle Logiport REIT
  
 
1,667,280
 
 
2,055,055
 
    
Lendlease Global Commercial REIT
  
 
990,435
 
 
2,153
 
    
Lineage Inc
  
 
75,355
 
 
67,206
 
    
Link REIT
  
 
300,076
 
 
1,633,478
 
    
LondonMetric Property PLC
  
 
4,164,469
 
 
76,274
 
    
LXP Industrial Trust
  
 
3,781,665
 
 
405,085
 
    
Mapletree Logistics Trust
  
 
415,117
 
 
See Notes to Financial Statements
 
57

Portfolio of Investments December 31, 2025
(continued)
JRI
 
      SHARES
        
DESCRIPTION
  
VALUE


EQUITY REAL ESTATE INVESTMENT TRUSTS (REITS)
(continued)
  
  23,101        Mid-America Apartment Communities Inc    $ 3,208,960  
  57,175        Millrose Properties Inc      1,707,817  
  28,848        Montea NV      2,477,221  
  119,371        NETSTREIT Corp      2,105,704  
  26,145        Nexus Industrial REIT      150,483  
  16,149        NNN REIT Inc      639,985  
  2,368,097      (b)   NTT DC REIT      2,413,134  
  91,226        Omega Healthcare Investors Inc      4,044,961  
  356        Orix JREIT Inc      241,312  
  54,585        Postal Realty Trust Inc, Class A      881,002  
  231,041        Primaris Real Estate Investment Trust      2,624,261  
  36,679        Realty Income Corp      2,067,595  
  1,288        Regency Centers Corp      88,911  
  3,771        Ryman Hospitality Properties Inc      356,812  
  240,345        Sabra Health Care REIT Inc      4,552,134  
  262,818        Scentre Group      734,678  
  71,024        Segro PLC      688,089  
  33,162        Simon Property Group Inc      6,138,618  
  378,073        SITE Centers Corp      2,427,229  
  27,129        SL Green Realty Corp      1,244,407  
  50,452        Smartstop Self Storage REIT Inc      1,560,985  
  2,926        Star Asia Investment Corp      1,151,686  
  745,491        Tritax Big Box REIT PLC      1,523,367  
  42,432        UDR Inc      1,556,406  
  227,326        UNITE Group PLC/The      1,711,494  
  1,237        United Urban Investment Corp      1,442,666  
  56,878        VICI Properties Inc      1,599,409  
  490,884        Waypoint REIT Ltd      833,634  
  13,264        WP Carey Inc      853,671  


     TOTAL EQUITY REAL ESTATE INVESTMENT TRUSTS (REITS)          125,298,975  


FINANCIAL SERVICES - 0.6%
  
  46,999        Apollo Commercial Real Estate Finance Inc      454,950  
  22,037        KKR Real Estate Finance Trust Inc      181,144  
  91,911        Starwood Property Trust Inc      1,655,317  


     TOTAL FINANCIAL SERVICES      2,291,411  


HEALTH CARE EQUIPMENT & SERVICES - 1.3%
  
  327,341        Sienna Senior Living Inc      4,872,374  


     TOTAL HEALTH CARE EQUIPMENT & SERVICES      4,872,374  


MATERIALS - 0.2%
  
  1,839,954        Keppel Infrastructure Trust      700,753  


     TOTAL MATERIALS      700,753  


REAL ESTATE MANAGEMENT & DEVELOPMENT - 2.4%
  
  356,720        Capitaland India Trust      338,290  
  166,738        Cibus Nordic Real Estate AB publ      2,661,397  
  225,571        Hongkong Land Holdings Ltd      1,566,978  
  1,430,809        Sirius Real Estate Ltd      1,857,299  
  842,696        Swire Properties Ltd      2,275,648  


     TOTAL REAL ESTATE MANAGEMENT & DEVELOPMENT      8,699,612  


TELECOMMUNICATION SERVICES - 1.3%
  
  553,291        HKT Trust & HKT Ltd      819,290  
  409,300        Infrastrutture Wireless Italiane SpA      3,787,741  


     TOTAL TELECOMMUNICATION SERVICES      4,607,031  


TRANSPORTATION - 3.9%
  
  85,427      (a)   Aena SME SA      2,386,904  
  703,056        Atlas Arteria Ltd      2,286,710  
  697,153        Dalrymple Bay Infrastructure Ltd      2,328,127  
  167,234      (a)   Enav SpA      924,198  
  6,865        Grupo Aeroportuario del Pacifico SAB de CV, ADR      1,809,820  
  11,787        Grupo Aeroportuario del Sureste SAB de CV, ADR      3,811,916  
  91,028        Transurban Group      861,452  


     TOTAL TRANSPORTATION      14,409,127  


58
 
See Notes to Financial Statements

     SHARES
        
DESCRIPTION
                
VALUE


UTILITIES - 15.4%
        
  3,270        American Electric Power Co Inc                             $ 377,064  
  54,283        Capital Power Corp            2,315,595  
  115,027        CK Infrastructure Holdings Ltd            852,376  
  121,948        Clearway Energy Inc, Class A            3,831,606  
  61,548        Dominion Energy Inc            3,606,097  
  6,320        DTE Energy Co            815,154  
  6,166        Duke Energy Corp            722,717  
  140,327        E.ON SE            2,657,080  
  582,949        Enel SpA            6,061,115  
  75,871        Engie SA            1,993,081  
  8,139        Entergy Corp            752,288  
  73,315        Evergy Inc            5,314,604  
  53,589        Exelon Corp            2,335,944  
  49,032        Iberdrola SA            1,061,709  
  23,776        Italgas SpA            265,188  
  381,892        National Grid PLC            5,857,642  
  47,892        National Grid PLC, Sponsored ADR            3,704,446  
  7,737        Northwestern Energy Group Inc            499,346  
  56,147        OGE Energy Corp            2,397,477  
  342,080        Pennon Group PLC            2,424,497  
  66,760        Redeia Corp SA            1,190,115  
  20,720        Severn Trent PLC            778,058  
  283,618        Snam SpA            1,884,605  
  37,435        Terna - Rete Elettrica Nazionale            398,260  
  32,582        United Utilities Group PLC            523,476  
  35,917        Veolia Environnement SA            1,249,821  
  19,041        WEC Energy Group Inc            2,008,064  
  8,309        Xcel Energy Inc            613,703  


     TOTAL UTILITIES                56,491,128  


TOTAL COMMON STOCKS
(Cost $228,889,553)
        
 
258,866,246


     SHARES
        
DESCRIPTION
  
RATE
           
VALUE


CONVERTIBLE PREFERRED SECURITIES - 3.3% (2.2% of Total Investments)
        
    
EQUITY REAL ESTATE INVESTMENT TRUSTS (REITS) - 0.2%
        
 
12,763
 
    
Kimco Realty Corp
  
 
7.250%


747,529


TOTAL EQUITY REAL ESTATE INVESTMENT TRUSTS (REITS)
        
 
747,529


UTILITIES - 3.1%
        
 
7,950
 
    
NextEra Energy Inc
  
 
4.635


387,562
 
 
44,500
 
    
NextEra Energy Inc
  
 
7.299


2,303,765
 
 
38,500
 
    
PG&E Corp
  
 
6.000


1,578,500
 
 
138,355
 
    
Southern Co/The
  
 
7.125


6,967,558


TOTAL UTILITIES
        
 
11,237,385


TOTAL CONVERTIBLE PREFERRED SECURITIES
(Cost $11,886,036)
        
 
       11,984,914


PRINCIPAL
        
DESCRIPTION
  
RATE
    
MATURITY
    
VALUE


CORPORATE BONDS - 47.4% (32.4% of Total Investments) (c)
        
    
AUTOMOBILES & COMPONENTS - 0.1%
        
 
$380,000
 
  
(a)
 
Clarios Global LP / Clarios US Finance Co
  
 
6.750


02/15/30


396,648


TOTAL AUTOMOBILES & COMPONENTS
        
 
396,648


CAPITAL GOODS - 1.7%
        
 
1,600,000
 
  
(a)
 
Advanced Drainage Systems Inc
  
 
6.375


06/15/30


1,636,114
 
 
1,125,000
 
  
(a)
 
Albion Financing 1 SARL / Aggreko Holdings Inc
  
 
7.000


05/21/30


1,174,174
 
 
450,000
 
  
(a)
 
AmeriTex HoldCo Intermediate LLC
  
 
7.625


08/15/33


474,144
 
 
675,000
 
  
(a)
 
Herc Holdings Inc
  
 
7.250


06/15/33


715,759
 
 
450,000
 
  
(a)
 
Herc Holdings Inc
  
 
5.750


03/15/31


456,680
 
 
250,000
 
  
(a)
 
Quikrete Holdings Inc
  
 
6.750


03/01/33


261,073
 
 
300,000
 
  
(a)
 
Terex Corp
  
 
6.250


10/15/32


307,785
 
 
See Notes to Financial Statements
 
59

Portfolio of Investments December 31, 2025
(continued)
JRI
 
PRINCIPAL
        
DESCRIPTION
  
RATE
    
MATURITY
    
VALUE


CAPITAL GOODS (continued)
        
  $1,150,000      (a)   United Rentals North America Inc      5.375%        11/15/33      $ 1,149,186  


     TOTAL CAPITAL GOODS            6,174,915  


CONSUMER DISCRETIONARY DISTRIBUTION & RETAIL - 0.8%
        
  670,000      (a)   Asbury Automotive Group Inc      5.000        02/15/32        651,105  
  715,000      (a)   Cougar JV Subsidiary LLC      8.000        05/15/32        764,386  
  600,000      (a)   Kohl’s Corp      10.000        06/01/30        660,757  
  705,000      (a)   LCM Investments Holdings II LLC      4.875        05/01/29        694,574  


     TOTAL CONSUMER DISCRETIONARY DISTRIBUTION & RETAIL            2,770,822  


CONSUMER SERVICES - 2.1%
        
  EUR 300,000      (d),(e)   Accor SA, Reg S      7.250        N/A        386,246  
  360,000        Choice Hotels International Inc      5.850        08/01/34        367,042  
  1,400,000      (a)   Churchill Downs Inc      5.750        04/01/30        1,413,635  
  350,000      (a)   Hilton Domestic Operating Co Inc      5.875        03/15/33        360,075  
  580,000        Hyatt Hotels Corp      5.400        12/15/35        581,197  
  600,000      (a)   Light & Wonder International Inc      6.250        10/01/33        607,439  
  450,000      (a)   Marriott Ownership Resorts Inc      6.500        10/01/33        431,687  
  190,000      (a)   Merlin Entertainments Group US Holdings Inc      7.375        02/15/31        169,247  
  995,000        MGM Resorts International      6.500        04/15/32        1,025,154  
  250,000      (a)   Motion Bondco DAC      6.625        11/15/27        242,745  
  675,000      (a)   NCL Corp Ltd      5.875        01/15/31        672,446  
  625,000      (a)   Six Flags Entertainment Corp / Six Flags Theme Parks Inc      6.625        05/01/32        630,259  
  295,000      (a)   Vail Resorts Inc      5.625        07/15/30        299,797  
  690,000      (a)   Wynn Resorts Finance LLC / Wynn Resorts Capital Corp      6.250        03/15/33        705,508  


     TOTAL CONSUMER SERVICES                 7,892,477  


ENERGY—13.2%
        
  900,000      (a)   Antero Midstream Partners LP / Antero Midstream Finance Corp      5.750        10/15/33        905,435  
  485,000      (a)   Archrock Partners LP / Archrock Partners Finance Corp      6.250        04/01/28        487,783  
  1,190,000      (a)   Archrock Partners LP / Archrock Partners Finance Corp      6.625        09/01/32        1,227,312  
  700,000      (a)   Buckeye Partners LP      6.875        07/01/29        728,148  
  450,000        Buckeye Partners LP      5.850        11/15/43        422,000  
  500,000      (a)   CITGO Petroleum Corp      8.375        01/15/29        519,912  
  675,000      (a)   CNX Midstream Partners LP      4.750        04/15/30        654,377  
  300,000      (a)   CQP Holdco LP / BIP-V Chinook Holdco LLC      7.500        12/15/33        321,441  
  235,000      (a)   CQP Holdco LP / BIP-V Chinook Holdco LLC      5.500        06/15/31        232,490  
  1,425,000      (a)   DBR Land Holdings LLC      6.250        12/01/30        1,457,604  
  900,000      (a)   Delek Logistics Partners LP / Delek Logistics Finance Corp      7.375        06/30/33        918,404  
  1,488,000      (e)   Enbridge Inc      5.500        07/15/77        1,474,434  
  2,025,000      (e)   Enbridge Inc      6.000        01/15/77        2,028,260  
  1,425,000      (e)   Enbridge Inc      6.250        03/01/78        1,441,172  
  1,228,000      (e)   Enbridge Inc      7.625        01/15/83        1,332,701  
  1,411,000      (e)   Enbridge Inc      8.500        01/15/84        1,617,949  
  1,117,000      (e),(f)   Energy Transfer LP (TSFR3M + 3.279%)      7.133        11/01/66        1,121,302  
  1,799,000      (d),(e)   Energy Transfer LP      7.125        N/A        1,842,091  
  683,000      (d),(e)   Energy Transfer LP      6.500        N/A        686,008  
  493,000      (e)   Energy Transfer LP      8.000        05/15/54        526,255  
  648,000      (e)   Energy Transfer LP      7.125        10/01/54        664,869  
  1,002,000      (e)   Energy Transfer LP      6.750        02/15/56        1,005,826  
  1,436,000      (e)   Enterprise Products Operating LLC      5.375        02/15/78        1,426,601  
  1,491,000      (e)   Enterprise Products Operating LLC      5.250        08/16/77        1,488,448  
  CAD 515,000      (e)   Gibson Energy Inc      5.250        12/22/80        374,576  
  1,245,000      (a)   Global Partners LP / GLP Finance Corp      8.250        01/15/32        1,311,329  
  450,000      (a)   Harvest Midstream I LP      7.500        05/15/32        469,073  
  CAD 660,000      (e)   Inter Pipeline Ltd/AB      6.625        11/19/79        503,539  
  CAD 670,000      (e)   Keyera Corp      6.875        06/13/79        519,349  
  CAD 1,026,000      (e)   Keyera Corp      5.950        03/10/81        769,274  
  225,000      (a)   Kodiak Gas Services LLC      6.500        10/01/33        229,773  
  1,135,000        ONEOK Inc      5.050        11/01/34        1,124,865  
  190,000        PBF Holding Co LLC / PBF Finance Corp      6.000        02/15/28        188,192  
  665,000      (d),(e),(f)   Plains All American Pipeline LP (TSFR3M + 4.372%)      8.223        N/A        666,887  
  225,000      (a)   Rockies Express Pipeline LLC      6.750        03/15/33        237,447  
 
60
 
See Notes to Financial Statements

     PRINCIPAL
        
DESCRIPTION
  
RATE
    
MATURITY
    
VALUE


ENERGY (continued)
        
  $350,000      (a)   Rockies Express Pipeline LLC      4.800%        05/15/30      $ 344,203  
  378,000      (e)   South Bow Canadian Infrastructure Holdings Ltd      7.500        03/01/55        404,033  
  654,000      (e)   South Bow Canadian Infrastructure Holdings Ltd      7.625        03/01/55        681,711  
  840,000        South Bow USA Infrastructure Holdings LLC      5.584        10/01/34        848,318  
  950,000      (a),(d),(e)   Sunoco LP      7.875        N/A        975,911  
  1,175,000      (a)   Sunoco LP      6.250        07/01/33        1,203,573  
  675,000      (a)   Sunoco LP      7.250        05/01/32        713,702  
  450,000      (a)   Tallgrass Energy Partners LP / Tallgrass Energy Finance Corp      6.000        09/01/31        447,896  
  330,000        Targa Resources Corp      6.150        03/01/29        347,396  
  840,000        Targa Resources Corp      6.125        03/15/33        898,529  
  1,386,000      (e)   TransCanada PipeLines Ltd      7.590        05/15/67        1,225,999  
  1,151,000      (e)   Transcanada Trust      5.600        03/07/82        1,136,813  
  1,038,000      (e)   Transcanada Trust      5.500        09/15/79        1,030,194  
  286,000      (e)   Transcanada Trust      5.300        03/15/77        285,978  
  1,130,000      (e)   Transcanada Trust      5.875        08/15/76        1,131,383  
  555,000      (a)   TransMontaigne Partners LLC      8.500        06/15/30        560,320  
  260,000      (a)   Transocean International Ltd      7.875        10/15/32        271,544  
  546,429      (a)   Transocean Titan Financing Ltd      8.375        02/01/28        558,058  
  720,000      (a)   USA Compression Partners LP / USA Compression Finance Corp      7.125        03/15/29        745,280  
  3,723,000      (a),(d),(e)   Venture Global LNG Inc      9.000        N/A        2,940,167  
  450,000      (a)   Venture Global LNG Inc      9.875        02/01/32        464,883  
  450,000      (a)   Venture Global Plaquemines LNG LLC      6.500        01/15/34        460,908  


     TOTAL ENERGY                48,601,925  


EQUITY REAL ESTATE INVESTMENT TRUSTS (REITS) - 5.4%
        
  1,170,000        Agree LP      4.800        10/01/32        1,177,258  
  735,000        American Assets Trust LP      6.150        10/01/34        745,571  
  1,000,000        American Homes 4 Rent LP      5.500        02/01/34        1,032,594  
  900,000      (a)   Diversified Healthcare Trust      7.250        10/15/30        920,239  
  1,080,000        Essex Portfolio LP      5.500        04/01/34        1,118,626  
  730,000        Extra Space Storage LP      5.700        04/01/28        754,210  
  820,000        Federal Realty OP LP      5.375        05/01/28        840,469  
  480,000        GLP Capital LP / GLP Financing II Inc      6.750        12/01/33        521,700  
  575,000        Highwoods Realty LP      5.350        01/15/33        574,569  
  1,540,000      (a)   Iron Mountain Inc      6.250        01/15/33        1,552,885  
  750,000        Kite Realty Group LP      5.500        03/01/34        774,041  
  823,000        Kite Realty Group LP      4.000        10/01/26        821,620  
  585,000      (a)   Lineage OP LP      5.250        07/15/30        590,170  
  575,000        Mid-America Apartments LP      5.300        02/15/32        600,221  
  750,000      (a)   Millrose Properties Inc      6.375        08/01/30        767,418  
  450,000      (a)   Millrose Properties Inc      6.250        09/15/32        454,043  
  1,255,000      (a)   MPT Operating Partnership LP / MPT Finance Corp      8.500        02/15/32        1,340,256  
  420,000        National Health Investors Inc      5.350        02/01/33        419,415  
  1,215,000        Piedmont Operating Partnership LP      9.250        07/20/28        1,342,488  
  1,665,000      (a)   RHP Hotel Properties LP / RHP Finance Corp      6.500        04/01/32        1,726,747  
  385,000      (a)   RHP Hotel Properties LP / RHP Finance Corp      6.500        06/15/33        400,222  
  380,000      (a)   Uniti Group LP / Uniti Group Finance 2019 Inc / CSL Capital LLC      6.500        02/15/29        364,920  
  995,000        Ventas Realty LP      5.000        01/15/35        996,219  


     TOTAL EQUITY REAL ESTATE INVESTMENT TRUSTS (REITS)            19,835,901  


FINANCIAL SERVICES - 1.4%
        
  500,000      (a)   Azorra Finance Ltd      7.750        04/15/30        527,959  
  225,000      (a)   Azorra Finance Ltd      7.250        01/15/31        235,762  
  350,000      (a)   Freedom Mortgage Holdings LLC      8.375        04/01/32        368,433  
  250,000      (a)   Freedom Mortgage Holdings LLC      7.875        04/01/33        258,891  
  524,000      (e)   HA Sustainable Infrastructure Capital Inc      8.000        06/01/56        547,611  
  1,150,000      (a)   Hunt Cos Inc      5.250        04/15/29        1,122,585  
  580,000      (e)   National Rural Utilities Cooperative Finance Corp      7.125        09/15/53        608,349  
  1,360,000      (a)   Starwood Property Trust Inc      6.000        04/15/30        1,395,907  


     TOTAL FINANCIAL SERVICES            5,065,497  


See Notes to Financial Statements
 
61

Portfolio of Investments December 31, 2025
(continued)
JRI
 
     PRINCIPAL
        
DESCRIPTION
  
RATE
    
MATURITY
    
VALUE


HEALTH CARE EQUIPMENT & SERVICES - 0.6%
        
  $500,000      (a)   CHS/Community Health Systems Inc      5.250%        05/15/30      $ 469,596  
  510,000      (a)   Global Medical Response Inc      7.375        10/01/32        530,081  
  275,000      (a)   LifePoint Health Inc      11.000        10/15/30        301,575  
  625,000      (a)   Prime Healthcare Services Inc      9.375        09/01/29        656,250  
  395,000      (a)   Tenet Healthcare Corp      6.000        11/15/33        406,690  


     TOTAL HEALTH CARE EQUIPMENT & SERVICES            2,364,192  


MATERIALS - 0.1%
        
  335,000      (a)   Mineral Resources Ltd      7.000        04/01/31        349,339  


     TOTAL MATERIALS            349,339  


MEDIA & ENTERTAINMENT - 0.7%
        
  750,000      (a)   Cablevision Lightpath LLC      5.625        09/15/28        733,013  
  885,000      (a)   CCO Holdings LLC / CCO Holdings Capital Corp      4.250        01/15/34        752,493  
  615,000      (a)   Directv Financing LLC      8.875        02/01/30        622,253  
  296,000      (a)   Directv Financing LLC / Directv Financing Co-Obligor Inc      5.875        08/15/27        297,738  


     TOTAL MEDIA & ENTERTAINMENT                 2,405,497  


REAL ESTATE MANAGEMENT & DEVELOPMENT - 0.2%
        
  900,000        Kennedy-Wilson Inc      5.000        03/01/31        846,433  


     TOTAL REAL ESTATE MANAGEMENT & DEVELOPMENT            846,433  


TELECOMMUNICATION SERVICES - 2.7%
        
  675,000      (a)   Altice France SA      6.500        04/15/32        647,110  
  330,000      (a)   Digicel International Finance Ltd / Difl US LLC      8.625        08/01/32        342,358  
  450,000        EchoStar Corp, (cash 6.750%, PIK 6.750%)      6.750        11/30/30        461,011  
  300,000        EchoStar Corp      10.750        11/30/29        331,740  
  865,000      (a)   Holdco II SAS      8.500        04/15/31        930,956  
  645,000      (a)   Holdco II SAS      7.000        04/15/32        664,771  
  385,000      (a)   Level 3 Financing Inc      8.500        01/15/36        394,233  
  450,000      (a)   Level 3 Financing Inc      7.000        03/31/34        463,758  
  450,000      (a)   Level 3 Financing Inc      6.875        06/30/33        460,475  
  275,000      (a)   Lumen Technologies Inc      4.500        01/15/29        254,375  
  865,000      (a)   Sable International Finance Ltd      7.125        10/15/32        875,308  
  720,000      (a)   Vmed O2 UK Financing I PLC      6.750        01/15/33        713,545  
  385,000      (a)   Windstream Services LLC      7.500        10/15/33        394,667  
  570,000      (a)   Windstream Services LLC / Windstream Escrow Finance Corp      8.250        10/01/31        598,369  
  217,514      (a)   Zayo Group Holdings Inc      13.750        09/09/30        199,569  
  1,283,113      (a)   Zayo Group Holdings Inc      9.250        03/09/30        1,218,957  
  818,000      (a)   Zegona Finance PLC      8.625        07/15/29        867,638  


     TOTAL TELECOMMUNICATION SERVICES             9,818,840  


TRANSPORTATION - 0.6%
        
  225,000      (a)   Rand Parent LLC      8.500        02/15/30        234,417  
  700,000      (a)   Stonepeak Nile Parent LLC      7.250        03/15/32        740,807  
  550,000      (a)   VistaJet Malta Finance PLC / Vista Management Holding Inc      9.500        06/01/28        568,855  
  590,000      (a)   XPO Inc      7.125        06/01/31        615,187  


     TOTAL TRANSPORTATION            2,159,266  


UTILITIES - 17.8%
        
  575,000        AEP Transmission Co LLC      5.150        04/01/34        586,206  
  950,000      (a),(e)   AES Andes SA      8.150        06/10/55        994,071  
  1,685,000      (e)   AES Corp/The      7.600        01/15/55        1,716,018  
  731,000      (e)   AES Corp/The      6.950        07/15/55        721,730  
  1,658,000      (e)   Alliant Energy Corp      5.750        04/01/56        1,654,979  
  680,000      (a)   Alpha Generation LLC      6.250        01/15/34        686,104  
  CAD 1,210,000      (e)   AltaGas Ltd      7.350        08/17/82        924,177  
  1,957,000      (a),(e)   AltaGas Ltd      7.200        10/15/54        2,028,904  
  CAD 625,000      (e)   AltaGas Ltd      8.900        11/10/83        505,669  
  1,295,000      (a)   California Buyer Ltd / Atlantica Sustainable Infrastructure PLC      6.375        02/15/32        1,297,135  
  CAD 675,000      (e)   Capital Power Corp      7.950        09/09/82        549,373  
  1,350,000      (a)   Clearway Energy Operating LLC      3.750        01/15/32        1,227,051  
  2,234,000      (e)   CMS Energy Corp      6.500        06/01/55        2,297,155  
  545,000      (a)   ContourGlobal Power Holdings SA      6.750        02/28/30        561,955  
  4,010,000      (e)   Dominion Energy Inc      6.625        05/15/55        4,132,133  
  1,537,000      (e)   Dominion Energy Inc      7.000        06/01/54        1,664,188  
  2,380,000      (e)   Duke Energy Corp      6.450        09/01/54        2,497,996  
 
62
 
See Notes to Financial Statements

     PRINCIPAL
        
DESCRIPTION
  
RATE
    
MATURITY
    
VALUE


UTILITIES
(continued)
        
  $390,000        Duke Energy Progress LLC      5.100%        03/15/34      $ 401,838  
  261,000      (e)   Edison International      7.875        06/15/54        273,985  
  383,000      (e)   Edison International      8.125        06/15/53        398,520  
  GBP 800,000      (d),(e)   Electricite de France SA, Reg S      5.875        N/A        1,083,019  
  1,013,000      (a),(d),(e)   Electricite de France SA      9.125        N/A        1,178,072  
  760,000      (e)   Emera Inc      6.750        06/15/76        763,479  
  1,547,000      (e)   Entergy Corp      7.125        12/01/54        1,624,278  
  733,000      (e)   EUSHI Finance Inc      7.625        12/15/54        770,566  
  1,513,000      (e)   Evergy Inc      6.650        06/01/55        1,546,495  
  2,319,000      (e)   Exelon Corp      6.500        03/15/55        2,413,018  
  1,125,000      (a)   Ferrellgas LP / Ferrellgas Finance Corp      5.875        04/01/29        1,081,016  
  825,000        Interstate Power and Light Co      5.600        06/29/35        858,587  
  581,000      (e)   NextEra Energy Capital Holdings Inc      6.750        06/15/54        620,267  
  943,000      (e)   NextEra Energy Capital Holdings Inc      5.650        05/01/79        952,205  
  1,892,000      (e)   NextEra Energy Capital Holdings Inc      6.375        08/15/55        1,953,011  
  2,340,000      (e)   NiSource Inc      6.950        11/30/54        2,435,477  
  1,800,000      (a)   NRG Energy Inc      5.750        01/15/34        1,818,306  
  385,000        OGE Energy Corp      5.450        05/15/29        398,747  
  955,000      (a)   Pattern Energy Operations LP / Pattern Energy Operations Inc      4.500        08/15/28        941,901  
  1,458,000      (e)   PG&E Corp      7.375        03/15/55        1,518,494  
  741,000      (e)   PPL Capital Funding Inc      6.612        03/30/67        724,153  
  1,276,000      (e)   Sempra      6.875        10/01/54        1,312,726  
  2,119,000      (e)   Sempra      6.400        10/01/54        2,155,297  
  1,495,000      (e)   Sempra      6.550        04/01/55        1,523,910  
  608,000      (e)   Sempra      6.375        04/01/56        620,662  
  1,679,000      (e)   Southern Co/The      6.375        03/15/55        1,752,340  
  980,000      (e)   Spire Inc      6.450        06/01/56        976,214  
  275,000      (a)   Superior Plus LP / Superior General Partner Inc      4.500        03/15/29        268,444  
  770,000      (a)   Talen Energy Supply LLC      6.250        02/01/34        785,334  
  675,000      (a)   Talen Energy Supply LLC      6.500        02/01/36        698,011  
  1,435,000      (a)   TerraForm Power Operating LLC      4.750        01/15/30        1,394,226  
  2,348,000      (a),(d),(e)   Vistra Corp      8.875        N/A        2,587,005  
  537,000      (a),(d),(e)   Vistra Corp      8.000        N/A        550,501  
  333,000      (a),(d),(e)   Vistra Corp      7.000        N/A        338,815  
  375,000      (a)   VoltaGrid LLC      7.375        11/01/30        371,530  
  1,158,000      (e)   WEC Energy Group Inc      5.625        05/15/56        1,165,293  
  900,000      (a)   XPLR Infrastructure Operating Partners LP      7.250        01/15/29        922,150  


     TOTAL UTILITIES                65,222,736  


TOTAL CORPORATE BONDS
(Cost $170,195,393)
        
 
173,904,488


SHARES
        
DESCRIPTION
                
VALUE


INVESTMENT COMPANIES - 0.8% (0.5% of Total Investments)
        
  1,219,584        Foresight Environmental Infrastructure Ltd            1,081,712  
  447,539        Greencoat UK Wind PLC/Funds            590,901  
  713,767        Sdcl Efficiency Income Trust PLC            504,152  
  579,501        Sequoia Economic Infrastructure Income Fund Ltd            616,321  
  16,768        Starwood European Real Estate Finance Ltd            19,664  


TOTAL INVESTMENT COMPANIES
(Cost $3,681,483)
        
 
2,812,750


     PRINCIPAL
        
DESCRIPTION
  
RATE
    
MATURITY
    
VALUE


MORTGAGE-BACKED SECURITIES - 3.0% (2.1% of Total Investments)
        
  500,000      (a),(f)  
ARDN 2025-ARCP Mortgage Trust, Series 2025 ARCP, (TSFR1M
+ 4.500%)
     8.250        06/15/35        502,031  
  100,000      (f)   BANK 2017-BNK6, Series 2017 BNK6      3.964        07/15/60        95,593  
  150,000      (a),(f)  
BLP Commercial Mortgage Trust, Series 2025 IND2, (TSFR1M
+ 2.050%)
     5.800        12/15/42        150,511  
  650,000      (a),(f)   BMP 2024-MF23, Series 2024 MF23, (TSFR1M + 2.390%)      7.194        06/15/41        652,768  
  490,000      (a),(f)   BX Commercial Mortgage Trust 2021-21M, Series 2021 21M, (TSFR1M + 2.285%)      6.607        10/15/36        489,779  
 
See Notes to Financial Statements
 
63

Portfolio of Investments December 31, 2025
(continued)
JRI
 
     PRINCIPAL
        
DESCRIPTION
  
RATE
    
MATURITY
    
VALUE


MORTGAGE-BACKED SECURITIES
(continued)
        
$ 600,000      (a),(f)   BX Commercial Mortgage Trust 2022-AHP, Series 2022 AHP, (TSFR1M + 2.090%)      5.840%        01/17/39      $      599,778  
  556,786      (a),(f)   BX Trust 2021-SDMF, Series 2021 SDMF, (TSFR1M + 1.701%)      2.911        09/15/34        555,002  
  500,000      (a),(f)   BX Trust 2021-VIEW, Series 2021 VIEW, (TSFR1M + 3.714%)      8.036        06/15/36        500,002  
  250,000      (a),(f)   BX Trust 2022-LBA6, Series 2022 LBA6, (TSFR1M + 2.000%)      4.845        01/15/39        250,013  
  322,095      (a),(f)   BX Trust 2024-FNX, Series 2024 FNX, (TSFR1M + 2.291%)      6.603        11/15/41        323,507  
  443,840      (a),(f)   BX Trust 2025-LUNR, Series 2025 LUNR, (TSFR1M + 2.000%)      5.750        06/15/40        446,084  
  500,000      (a),(f)   DBGS 2024-SBL, Series 2024 SBL, (TSFR1M + 2.740%)      7.062        08/15/34        501,082  
  500,000      (a),(f)   GSAT Trust 2025-BMF, Series 2025 BMF, (TSFR1M + 2.500%)      6.250        07/15/40        500,223  
  500,000      (a),(f)   ILPT Commercial Mortgage Trust 2025-LPF2, Series 2025 LPF2      6.508        07/13/42        513,396  
  500,000      (a),(f)   IP 2025-IP Mortgage Trust, Series 2025 IP      5.831        06/10/42        509,890  
  303,276      (a),(f)   LBA Trust 2024-7IND, Series 2024 7IND, (TSFR1M + 2.641%)      6.391        10/15/41        304,396  
  350,000      (a),(f)   MHP Commercial Mortgage Trust 2025-MHIL2, Series 2025 MHIL2, (TSFR1M + 2.650%)      6.400        09/15/40        350,925  
  500,000      (a),(f)   MILE Trust 2025-STNE, Series 2025 STNE, (TSFR1M + 1.700%)      5.450        07/15/42        501,161  
  150,000      (a),(f)   MTN Commercial Mortgage Trust 2022-LPFL, Series 2022 LPFL, (TSFR1M + 2.394%)      3.673        03/15/39        150,316  
  310,000      (a),(f)   Natixis Commercial Mortgage Securities Trust 2019-MILE, Series 2019 MILE, (TSFR1M + 2.829%)      6.580        07/15/36        253,370  
  525,000      (a),(f)   Natixis Commercial Mortgage Securities Trust 2019-MILE, Series 2019 MILE, (TSFR1M + 4.329%)      8.080        07/15/36        366,297  
  500,000      (a),(f)   SCG Commercial Mortgage Trust 2025-FLWR, Series 2025 FLWR, (TSFR1M + 1.750%)      5.500        08/15/42        501,491  
  500,000      (a),(f)   SYCA Commercial Mortgage Trust 2025-WAG, Series 2025 WAG      6.806        11/10/30        503,325  
  525,000      (a),(f)   WCORE Commercial Mortgage Trust 2024-CORE, Series 2024 CORE, (TSFR1M + 2.241%)      5.991        11/15/41        528,549  
  500,000      (a),(f)   Wells Fargo Commercial Mortgage Trust 2025-AGLN, Series 2025 AGLN, (TSFR1M + 2.292%)      6.042        07/15/37        500,821  
  300,000      (a),(f)   Wells Fargo Commercial Mortgage Trust 2025-AURA, Series 2025 AURA, (TSFR1M + 2.292%)      6.042        10/15/42        299,861  
  390,000      (a),(f)   Wells Fargo Commercial Mortgage Trust 2025-B33RP, Series 2025 B33RP, (TSFR1M + 2.500%)      6.850        08/15/42        390,180  


TOTAL MORTGAGE-BACKED SECURITIES
(Cost $11,404,860)
        
 
11,240,351


      SHARES
        
DESCRIPTION
  
RATE
           
VALUE


PREFERRED STOCK - 15.4% (10.5% of Total Investments)
        
    
EQUITY REAL ESTATE INVESTMENT TRUSTS (REITS) - 11.2%
        
  149,615        Agree Realty Corp      4.250           2,561,409  
  52,250        Alpine Income Property Trust Inc      0.000           1,298,935  
  74,697        American Homes 4 Rent      5.875           1,724,754  
  41,901        American Homes 4 Rent      6.250           1,018,613  
  59,921        Armada Hoffler Properties Inc      6.750           1,266,131  
  77,494        Digital Realty Trust Inc      5.250           1,604,901  
  79,932        Digital Realty Trust Inc      5.200           1,636,208  
  69,938        Digital Realty Trust Inc      5.850           1,669,420  
  74,662        Federal Realty Investment Trust      5.000           1,500,706  
  61,308        Kimco Realty Corp      5.125           1,238,422  
  83,318        Kimco Realty Corp      5.250           1,720,517  
  7,927        LXP Industrial Trust      6.500           373,362  
  2,301        Mid-America Apartment Communities Inc      8.500           123,104  
  78,033        National Storage Affiliates Trust      6.000            1,642,595  
  60,325        Pebblebrook Hotel Trust      6.300           1,149,191  
  40,817        Pebblebrook Hotel Trust      6.375           763,278  
  49,270        Pebblebrook Hotel Trust      5.700           871,093  
  13,419        Public Storage      5.050           270,527  
  11,879        Public Storage      4.700           221,662  
  30,250        Public Storage      4.750           574,750  
  31,013        Public Storage      4.625           573,741  
  34,150        Public Storage      4.125           559,718  
  26,493        Public Storage      4.000           421,504  
 
64
 
See Notes to Financial Statements

      SHARES
        
DESCRIPTION
  
RATE
           
VALUE


EQUITY REAL ESTATE INVESTMENT TRUSTS (REITS)
(continued)
        
  26,845        Public Storage      4.000%         $ 428,446  
  35,168        Public Storage      4.875           679,094  
  22,989        Public Storage      4.100           373,801  
  66,178        Regency Centers Corp      5.875           1,493,637  
  73,690        Regency Centers Corp      6.250           1,736,136  
  88,853        Rexford Industrial Realty Inc      5.625           1,903,231  
  37,466        Rexford Industrial Realty Inc      5.875           860,969  
  10,819        RLJ Lodging Trust      1.950           269,393  
  35,516        Summit Hotel Properties Inc      6.250           642,840  
  18,926        Summit Hotel Properties Inc      5.875           342,561  
  37,644        Sunstone Hotel Investors Inc      6.125           750,998  
  48,737        Sunstone Hotel Investors Inc      5.700           940,137  
  15,499        UMH Properties Inc      6.375           338,188  
  104,858        Vornado Realty Trust      4.450           1,494,226  
  70,952        Vornado Realty Trust      5.250           1,199,089  
  82,966        Vornado Realty Trust      5.250           1,406,274  
  82,900        Vornado Realty Trust      5.400           1,464,843  


     TOTAL EQUITY REAL ESTATE INVESTMENT TRUSTS (REITS)                41,108,404  


FINANCIAL SERVICES - 0.1%
        
  23,251        Brookfield Finance Inc      4.625           382,711  


     TOTAL FINANCIAL SERVICES            382,711  


REAL ESTATE MANAGEMENT & DEVELOPMENT - 0.2%
        
  25,270        Brookfield Property Partners LP      6.500           368,942  
  10,309        Brookfield Property Partners LP      6.375           147,213  
  31,178        Brookfield Property Partners LP      5.750           414,667  


     TOTAL REAL ESTATE MANAGEMENT & DEVELOPMENT            930,822  


UTILITIES - 3.9%
        
  25,854        BIP Bermuda Holdings I Ltd      5.125           427,367  
  38,627        Brookfield BRP Holdings Canada Inc      4.625           594,083  
  13,470        Brookfield Infrastructure Finance ULC      5.000           219,426  
  60,551        Brookfield Infrastructure Partners LP      5.125           1,014,229  
  18,594        Brookfield Infrastructure Partners LP      5.000           304,570  
  73,684        Brookfield Renewable Partners LP      5.250           1,344,733  
  11,638        CMS Energy Corp      5.625           255,571  
  18,332        CMS Energy Corp      5.875           415,220  
  18,823        CMS Energy Corp      5.875           435,752  
  15,538        DTE Energy Co      5.250           328,473  
  14,608        DTE Energy Co      4.375           249,066  
  16,486        DTE Energy Co      4.375           283,065  
  47,762        DTE Energy Co      6.250           1,188,796  
  42,195        Duke Energy Corp      5.750           1,053,609  
  35,754        Duke Energy Corp      5.625           879,548  
  28,928        Georgia Power Co      5.000           647,987  
  22,463        SCE Trust VII      7.500           567,865  
  20,225        SCE Trust VIII      6.950           480,748  
  12,974        Southern Co/The      4.200           230,159  
  36,525        Southern Co/The      6.500           927,735  
  15,426        Southern Co/The      4.950           312,222  
  16,742        Southern Co/The      5.250           361,795  
  61,875        Xcel Energy Inc      6.250           1,544,400  


     TOTAL UTILITIES            14,066,419  


TOTAL PREFERRED STOCK
(Cost $64,600,303)
        
 
56,488,356


    PRINCIPAL
        
DESCRIPTION
  
RATE
    
MATURITY
    
VALUE


VARIABLE RATE SENIOR LOAN INTERESTS - 3.6% (2.4% of Total Investments)
        
    
AUTOMOBILES & COMPONENTS - 0.2%
        
$ 598,500      (f)   Clarios Global LP, Term Loan B, (TSFR1M + 2.750%)      6.466        01/28/32        602,333  


     TOTAL AUTOMOBILES & COMPONENTS            602,333  


See Notes to Financial Statements
 
65

Portfolio of Investments December 31, 2025
(continued)
JRI
 
    PRINCIPAL
        
DESCRIPTION
  
RATE
    
MATURITY
    
VALUE
 
    
COMMERCIAL & PROFESSIONAL SERVICES - 0.6%


$ 1,065,000      (f)   Wash Multifamily Parent Inc, Term Loan B, (TSFR1M + 3.250%)      6.966%        09/10/32      $     1,075,426  
  981,778      (f)   WIN Waste Innovations Holdings, Inc., Term Loan B, (TSFR1M + 2.750%)      6.581        03/27/28        985,667  


     TOTAL COMMERCIAL & PROFESSIONAL SERVICES            2,061,093  


CONSUMER SERVICES - 0.2%
        
  949,974      (f)   Caesars Entertainment Inc., Term Loan B, (TSFR1M + 2.250%)      5.966        02/06/30        944,987  


     TOTAL CONSUMER SERVICES            944,987  


MEDIA & ENTERTAINMENT - 0.7%
        
  1,485,000      (f)   Charter Communications Operating, LLC, Term Loan B5, (TSFR3M + 2.250%)      6.235        12/15/31        1,487,784  
  1,000,000      (f)   Sunrise Financing Partnership, Term Loan AAA, (TSFR6M + 2.500%)      6.691        02/17/32        1,004,805  
  224,432      (f),(g)   WideOpenWest Finance LLC, Super Senior 2nd Out Term Loan, (TBD)      TBD        TBD        204,794  


     TOTAL MEDIA & ENTERTAINMENT            2,697,383  


REAL ESTATE MANAGEMENT & DEVELOPMENT - 0.2%
        
  641,109      (f)   Hill Top Energy Center LLC, Term Loan B, (TSFR3M + 3.250%)      6.922        06/28/32        648,055  


     TOTAL REAL ESTATE MANAGEMENT & DEVELOPMENT            648,055  


TECHNOLOGY HARDWARE & EQUIPMENT - 0.1%
        
  435,000      (f)   CommScope, Inc., Term Loan, (TSFR1M + 4.750%)      8.466        12/17/29        436,383  


     TOTAL TECHNOLOGY HARDWARE & EQUIPMENT            436,383  


TELECOMMUNICATION SERVICES - 0.3%
        
  225,000      (f)   Connect Holding II LLC, Delayed Draw Term Loan, (TSFR1M + 4.250%)      3.740        04/03/31        196,665  
  236,000      (f)   GOGO Intermediate Holdings LLC, Term Loan B, (TSFR1M + 3.750%)      7.581        04/28/28        216,382  
  542,151      (f)   Lumen Technologies, Inc., Extended Term Loan B2, (TSFR1M + 2.350%)      6.181        04/15/30        539,904  
  250,000      (f)   Telesat Canada, Term Loan B5, (TSFR3M + 2.750%)      6.834        12/07/26        197,723  


     TOTAL TELECOMMUNICATION SERVICES            1,150,674  


TRANSPORTATION - 0.6%
        
  605,611      (f)   Genesee & Wyoming Inc. (New), Term Loan B, (TSFR3M + 1.750%)      5.422        04/10/31        606,269  
  1,492,500      (f)   NA Rail HoldCo. LLC, Term Loan B, (TSFR3M + 3.000%)      6.738        03/08/32        1,507,425  


     TOTAL TRANSPORTATION            2,113,694  


UTILITIES - 0.7%
        
  1,000,000      (f)   Calpine Corporation, Term Loan B10, (TSFR1M + 1.750%)      5.466        01/31/31        1,001,055  
  496,250      (f)   Long Ridge Energy LLC, Term Loan B, (TSFR3M + 4.500%)      8.172        02/19/32        492,218  
  999,156      (f)   Vistra Operations Company LLC, First Lien Term Loan B3, (TSFR1M + 1.750%)      5.466        12/20/30        1,005,405  


     TOTAL UTILITIES            2,498,678  


TOTAL VARIABLE RATE SENIOR LOAN INTERESTS
(Cost $13,120,561)
        
 
13,153,280


TOTAL LONG-TERM INVESTMENTS
(Cost $503,778,189)
        
 
528,450,385


PRINCIPAL
        
DESCRIPTION
  
RATE
    
MATURITY
    
VALUE


SHORT-TERM INVESTMENTS - 2.5%(1.7% of Total Investments)
        
    
REPURCHASE AGREEMENTS - 2.5% (1.7% of Total Investments)
        
  9,125,000      (h)   Fixed Income Clearing Corporation      3.780        01/02/26        9,125,000  


TOTAL REPURCHASE AGREEMENTS
(Cost $9,125,000)
        
 
9,125,000


TOTAL SHORT-TERM INVESTMENTS
(Cost $9,125,000)
        
 
9,125,000


TOTAL INVESTMENTS - 146.5%
(Cost $512,903,189)
        
 
537,575,385


BORROWINGS - (46.6)% (i),(j)
        
 
(170,945,000


OTHER ASSETS & LIABILITIES, NET - 0.1%
        
 
366,907


NET ASSETS APPLICABLE TO COMMON SHARES - 100%
        
$
366,997,292


66
 
See Notes to Financial Statements

All percentages shown in the Portfolio of Investments are based on net assets applicable to common shares unless otherwise noted.
 
ADR
American Depositary Receipt
CAD
Canadian Dollar
EUR
Euro
GBP
Pound Sterling
PIK
Payment-in-kind (“PIK”) security. Depending on the terms of the security, income may be received in the form of cash, securities, or a combination of both. The PIK rate shown, where applicable, represents the annualized rate of the last PIK payment made by the issuer as of the end of the reporting period.
Reg S
Regulation S allows U.S. companies to sell securities to persons or entities located outside of the United States without registering those securities with the Securities and Exchange Commission. Specifically, Regulation S provides a safe harbor from the registration requirements of the Securities Act for the offers and sales of securities by both foreign and domestic issuers that are made outside the United States.
REIT
Real Estate Investment Trust
TBD
Senior loan purchased on a when-issued or delayed-delivery basis. Certain details associated with this purchase are not known prior to the settlement date of the transaction. In addition, senior loans typically trade without accrued interest and therefore a coupon rate is not available prior to settlement. At settlement, if still unknown, the borrower or counterparty will provide the Fund with the final coupon rate and maturity date.
TSFR1M
CME Term Secured Overnight Financing Rate 1 Month
TSFR3M
CME Term Secured Overnight Financing Rate 3 Month
TSFR6M
CME Term Secured Overnight Financing Rate 6 Month
 
(a)
Security is exempt from registration under Rule 144A of the Securities Act of 1933, as amended. These securities are deemed liquid and may be resold in transactions exempt from registration, which are normally those transactions with qualified institutional buyers. As of the end of the fiscal period, the aggregate value of these securities is $97,855,797 or 18.2% of Total Investments.
(b)
Non-income producing; issuer has not declared an ex-dividend date within the past twelve months.
(c)
Contains $1,000 Par Preferred and/or Contingent Capital Securities.
(d)
Perpetual security. Maturity date is not applicable.
(e)
$1,000 Par Institutional Preferred security. As of the end of the period, the percent of $1,000 Par Institutional Preferred securities was 15.2% of Total Investments.
(f)
Floating or variable rate security includes the reference rate and spread, when applicable. For mortgage-backed or asset-backed securities the variable rate is based on the underlying asset of the security. Coupon rate reflects the rate at period end.
(g)
When-issued or delayed delivery security.
(h)
Agreement with Fixed Income Clearing Corporation, 3.780% dated 12/31/25 to be repurchased at $9,126,916 on 1/2/26, collateralized by Government Agency Securities, with coupon rate 3.500% and maturity date 11/30/30, valued at $9,307,720.
(i)
Borrowings as a percentage of Total Investments is 31.8%.
(j)
The Fund may pledge up to 100% of its eligible investments (excluding any investments separately pledged as collateral for specific investments in derivatives, when applicable) in the Portfolio of Investments as collateral for borrowings. As of the end of the reporting period, investments with a value of $294,830,992 have been pledged as collateral for borrowings.
Principal denominated in U.S. Dollars, unless otherwise noted.
Investments in Derivatives
Futures Contracts - Short
Description
  
 
Number of
Contracts


  Expiration

Date


Notional

 Amount


Value


Unrealized
  Appreciation
(Depreciation)


U.S. Treasury Ultra 10-Year Note      (52     3/26      $ (5,999,295   $ (5,980,812   $ 18,483  
 
See Notes to Financial Statements
 
67

Portfolio of Investments December 31, 2025
JRS
 
  SHARES
        
DESCRIPTION
            
VALUE


LONG-TERM INVESTMENTS - 142.2% (98.2% of Total Investments)
        
    
COMMON STOCKS - 103.5% (71.5% of Total Investments)
        
    
DATA CENTER REITS - 11.2%
        
  87,707        Digital Realty Trust Inc          $      13,569,150  
  16,936        Equinix Inc            12,975,686  


     TOTAL DATA CENTER REITS            26,544,836  


DIVERSIFIED REITS - 0.7%
        
  24,140        WP Carey Inc            1,553,650  


     TOTAL DIVERSIFIED REITS            1,553,650  


HEALTH CARE REITS - 15.9%
        
  76,059        Alexandria Real Estate Equities Inc            3,722,327  
  434,918        Healthpeak Properties Inc            6,993,481  
  202,960        Ventas Inc            15,705,045  
  61,286        Welltower Inc            11,375,294  


     TOTAL HEALTH CARE REITS            37,796,147  


HOTEL & RESORT REITS - 3.3%
        
  255,096        Host Hotels & Resorts Inc            4,522,852  
  239,955        Pebblebrook Hotel Trust            2,716,291  
  82,330        Sunstone Hotel Investors Inc            736,030  


     TOTAL HOTEL & RESORT REITS            7,975,173  


INDUSTRIAL REITS - 14.1%
        
  150,940        First Industrial Realty Trust Inc            8,644,334  
  35,857        LXP Industrial Trust            1,777,790  
  180,297        Prologis Inc            23,016,715  


     TOTAL INDUSTRIAL REITS            33,438,839  


MULTI-FAMILY RESIDENTIAL REITS - 12.8%
        
  29,742        AvalonBay Communities Inc            5,392,522  
  84,444        Camden Property Trust            9,295,596  
  90,779        Equity Residential            5,722,708  
  22,020        Essex Property Trust Inc            5,762,194  
  73,990        UDR Inc            2,713,953  
  116,055        Veris Residential Inc            1,726,898  


     TOTAL MULTI-FAMILY RESIDENTIAL REITS            30,613,871  


OFFICE REITS - 6.1%
        
  56,295        BXP Inc            3,798,787  
  104,905        Cousins Properties Inc            2,704,451  
  158,225        Douglas Emmett Inc            1,738,893  
  105,350        Kilroy Realty Corp            3,936,929  
  50,850        SL Green Realty Corp            2,332,490  


     TOTAL OFFICE REITS            14,511,550  


OTHER SPECIALIZED REITS - 2.8%
        
  237,785        VICI Properties Inc            6,686,514  


     TOTAL OTHER SPECIALIZED REITS            6,686,514  


RETAIL REITS - 21.1%
        
  93,355        Acadia Realty Trust            1,917,512  
  72,955        Agree Realty Corp            5,254,949  
  75,055        Federal Realty Investment Trust            7,565,544  
  159,400        Kimco Realty Corp            3,231,038  
  308,531        Kite Realty Group Trust            7,395,488  
  268,494        Macerich Co/The            4,956,399  
  116,005        NNN REIT Inc            4,597,278  
  107,880        Realty Income Corp            6,081,196  
  48,794        Simon Property Group Inc            9,032,257  


     TOTAL RETAIL REITS            50,031,661  


SELF-STORAGE REITS - 7.4%
        
  188,452        CubeSmart            6,793,695  
  32,639        Extra Space Storage Inc            4,250,251  
  24,475        Public Storage            6,351,262  


     TOTAL SELF-STORAGE REITS            17,395,208  


68
 
See Notes to Financial Statements

 
  SHARES
        
DESCRIPTION
                
VALUE


SINGLE-FAMILY RESIDENTIAL REITS - 5.6%
        
  156,307        American Homes 4 Rent, Class A          $ 5,017,455  
  130,935        Invitation Homes Inc            3,638,684  
  37,385        Sun Communities Inc            4,632,375  


     TOTAL SINGLE-FAMILY RESIDENTIAL REITS            13,288,514  


TELECOM TOWER REITS - 2.5%
        
  30,135        SBA Communications Corp            5,829,013  


     TOTAL TELECOM TOWER REITS            5,829,013  


TOTAL COMMON STOCKS
(Cost $191,267,902)
        
 
    245,664,976


SHARES
        
DESCRIPTION
  
RATE


VALUE


CONVERTIBLE PREFERRED SECURITIES - 0.7% (0.5% of Total Investments)
        
    
EQUITY REAL ESTATE INVESTMENT TRUSTS (REITS) - 0.7%
        
  30,155        Kimco Realty Corp      7.250%           1,766,178  


     TOTAL EQUITY REAL ESTATE INVESTMENT TRUSTS (REITS)        1,766,178        


TOTAL CONVERTIBLE PREFERRED SECURITIES
(Cost $1,495,538)
  
 
1,766,178


SHARES
        
DESCRIPTION
  
RATE
           
VALUE


PREFERRED STOCK - 38.0% (26.2% of Total Investments)
        
    
DATA CENTER REITS - 3.5%
        
  194,120        Digital Realty Trust Inc      5.200           3,973,636  
  96,245        Digital Realty Trust Inc      5.850           2,297,368  
  95,960        Digital Realty Trust Inc      5.250           1,987,332  


     TOTAL DATA CENTER REITS            8,258,336  


DIVERSIFIED REITS - 1.3%
        
  34,560        Armada Hoffler Properties Inc      6.750           730,253  
  10,000        CTO Realty Growth Inc      6.375           205,000  
  44,840        DigitalBridge Group Inc      7.125           994,999  
  52,815        DigitalBridge Group Inc      7.150           1,172,493  


     TOTAL DIVERSIFIED REITS            3,102,745  


HOTEL & RESORT REITS - 3.8%
        
  90,130        Chatham Lodging Trust      6.625           1,774,660  
  21,740        Pebblebrook Hotel Trust      6.300           414,147  
  151,610        Pebblebrook Hotel Trust      6.375           2,835,107  
  88,100        Pebblebrook Hotel Trust      5.700           1,557,608  
  55,820        Sunstone Hotel Investors Inc      6.125           1,113,609  
  69,935        Sunstone Hotel Investors Inc      5.700           1,349,046  


     TOTAL HOTEL & RESORT REITS            9,044,177  


INDUSTRIAL REITS - 3.0%
        
  56,719        Prologis Inc      8.540           3,227,311  
  22,741        Rexford Industrial Realty Inc      5.875           522,588  
  158,030        Rexford Industrial Realty Inc      5.625           3,385,003  


     TOTAL INDUSTRIAL REITS            7,134,902  


MULTI-FAMILY RESIDENTIAL REITS - 0.8%
        
  34,353        Mid-America Apartment Communities Inc      8.500           1,837,885  


     TOTAL MULTI-FAMILY RESIDENTIAL REITS            1,837,885  


OFFICE REITS - 12.1%
        
  12,713        Highwoods Properties Inc      8.625           13,214,955  
  144,320        SL Green Realty Corp      6.500           3,030,720  
  176,330        Vornado Realty Trust      4.450           2,512,702  
  226,090        Vornado Realty Trust      5.250           3,820,921  
  222,827        Vornado Realty Trust      5.250           3,776,918  
  126,524        Vornado Realty Trust      5.400           2,235,679  


     TOTAL OFFICE REITS            28,591,895  


OTHER SPECIALIZED REITS - 0.1%
        
  12,465        EPR Properties      5.750           244,813  


     TOTAL OTHER SPECIALIZED REITS            244,813  


See Notes to Financial Statements
 
69

Portfolio of Investments December 31, 2025
(continued)
JRS
 
  SHARES
        
DESCRIPTION
  
RATE
           
VALUE


RETAIL REITS - 7.0%
        
  99,265        Agree Realty Corp      4.250%                   $ 1,699,417  
  134,110        Federal Realty Investment Trust             5.000           2,695,611  
  156,704        Kimco Realty Corp      5.250           3,235,938  
  124,919        Kimco Realty Corp      5.125           2,523,364  
  51,590        Regency Centers Corp      5.875           1,164,386  
  73,095        Regency Centers Corp      6.250           1,722,118  
  19,725        Saul Centers Inc      6.125           410,477  
  127,775        Saul Centers Inc      6.000           2,915,825  
  3,184        Simon Property Group Inc      8.375           169,378  


     TOTAL RETAIL REITS            16,536,514  


SELF-STORAGE REITS - 4.9%
        
  44,661        National Storage Affiliates Trust      6.000           940,114  
  3,225        Public Storage      4.000           51,471  
  76,355        Public Storage      4.000           1,214,808  
  2,940        Public Storage      3.900           46,011  
  94,460        Public Storage      4.625           1,747,510  
  26,125        Public Storage      4.750           496,375  
  16,700        Public Storage      4.700           311,622  
  83,290        Public Storage      4.875           1,608,330  
  142,370        Public Storage      5.600           3,254,578  
  102,599        Public Storage      5.050           2,068,396  


     TOTAL SELF-STORAGE REITS                11,739,215  


SINGLE-FAMILY RESIDENTIAL REITS - 1.5%
        
  102,970        American Homes 4 Rent      6.250           2,503,201  
  34,615        American Homes 4 Rent      5.875           799,260  
  12,175        UMH Properties Inc      6.375           265,659  


     TOTAL SINGLE-FAMILY RESIDENTIAL REITS            3,568,120  


TOTAL PREFERRED STOCK
(Cost $105,583,840)
        
 
90,058,602


TOTAL LONG-TERM INVESTMENTS
(Cost $298,347,280)
        
 
337,489,756


PRINCIPAL
        
DESCRIPTION
  
RATE
    
MATURITY
    
VALUE


SHORT-TERM INVESTMENTS - 2.6%(1.8% of Total Investments)
        
    
REPURCHASE AGREEMENTS - 2.6% (1.8% of Total Investments)
        
$ 6,100,000      (a)   Fixed Income Clearing Corporation      3.780        01/02/26        6,100,000  


TOTAL REPURCHASE AGREEMENTS
(Cost $6,100,000)
        
 
6,100,000


TOTAL SHORT-TERM INVESTMENTS
(Cost $6,100,000)
        
 
6,100,000


TOTAL INVESTMENTS - 144.8%
(Cost $304,447,280)
        
 
343,589,756


BORROWINGS - (43.2)% (b),(c)
        
 
(102,400,000)


OTHER ASSETS & LIABILITIES, NET - (1.6)%
        
 
(3,943,608)


NET ASSETS APPLICABLE TO COMMON SHARES - 100%
        
$
 237,246,148


All percentages shown in the Portfolio of Investments are based on net assets applicable to common shares unless otherwise noted.
 
REIT
Real Estate Investment Trust
 
(a)
Agreement with Fixed Income Clearing Corporation, 3.780% dated 12/31/25 to be repurchased at $6,101,281 on 1/2/26, collateralized by Government Agency Securities, with coupon rate 3.625% and maturity date 10/31/30, valued at $6,222,131.
(b)
Borrowings as a percentage of Total Investments is 29.8%.
(c)
The Fund may pledge up to 100% of its eligible investments (excluding any investments separately pledged as collateral for specific investments in derivatives, when applicable) in the Portfolio of Investments as collateral for borrowings. As of the end of the reporting period, investments with a value of $204,342,798 have been pledged as collateral for borrowings.
 
70
 
See Notes to Financial Statements

Statement of Assets and Liabilities
 
 
December 31, 2025
  
NMAI
    
JRI
   
JRS
 
ASSETS
       
Long-term investments, at value
  
$
678,724,227
 
  
$
528,450,385
 
 
$
337,489,756
 
Short-term investments, at value
à
  
 
10,300,000


9,125,000


6,100,000
 
Cash denominated in foreign currencies
^
  
 
28,534


889,782


Cash collateral at broker for investments in futures contracts
(1)


142,769


Receivables:
       
Dividends
  
 
222,158


1,183,392


1,496,088
 
Interest
  
 
3,253,347


3,109,907


641
 
Investments sold
  
 
1,856,995


447,478


Reclaims
  
 
626,012


134,218


Reimbursement from Adviser
  
 
4,234


81,663


Variation margin on futures contracts


9,750


Other
  
 
71,191


23,839


36,682
 
Total assets
  
 
695,086,698


543,598,183


345,123,167
 
LIABILITIES
       
Cash overdraft
  
 
3,049,665


3,181,402


4,623,102
 
Borrowings
  
 
174,786,000


170,945,000


102,400,000
 
Reverse repurchase agreements, including accrued interest
  
 
35,122,150


Unrealized depreciation on forward foreign currency contracts
  
 
1,732


Payables:
       
Management fees
  
 
496,139


435,189


248,618
 
Capital gain taxes
  
 
891


Interest
  
 
604,050


744,703


434,092
 
Investments purchased - regular settlement
  
 
32,608


750,118


Investments purchased - when-issued/delayed-delivery settlement
  
 
1,818,425


206,477


Unfunded senior loans
  
 
135,795


Accrued expenses:
       
Custodian fees
  
 
413,217


260,343


47,371
 
Investor relations fees
  
 
34,147


9,911


53,412
 
Trustees fees
  
 
70,167


26,535


37,618
 
Professional fees
  
 
3,707


3,828


4,921
 
Shareholder reporting expenses
  
 
31,083


33,123


27,633
 
Shareholder servicing agent fees
  
 
308


2,619


252
 
Other
  
 
10,853


1,643


Total liabilities
  
 
 216,610,937


 176,600,891


 107,877,019
 
Net assets applicable to common shares
  
$
478,475,761
 
  
$
366,997,292
 
 
$
237,246,148
 
Common shares outstanding
     33,425,645        27,440,071       28,892,471  
Net asset value (“NAV”) per common share outstanding
   $ 14.31      $ 13.37     $ 8.21  
NET ASSETS APPLICABLE TO COMMON SHARES CONSIST OF:


Common shares, $0.01 par value per share
  
$
334,256
 
  
$
274,401
 
 
$
288,925
 
Paid-in capital
  
 
391,479,465


533,129,317


205,269,874
 
Total distributable earnings (loss)
  
 
86,662,040


(166,406,426
 
 
31,687,349
 
Net assets applicable to common shares
   $ 478,475,761      $ 366,997,292     $ 237,246,148  
Authorized shares:
       
Common
  
 
Unlimited


Unlimited


Unlimited
 
Preferred
     Unlimited        Unlimited       Unlimited  
 Long-term investments, cost
  
$
584,217,446
 
  
$
503,778,189
 
 
$
298,347,280
 
à
 Short-term investments, cost
  
$
10,300,000
 
  
$
9,125,000
 
 
$
6,100,000
 
^
 Cash denominated in foreign currencies, cost
  
$
29,781
 
  
$
891,672
 
 
$
 
(1)  Cash pledged to collateralize the net payment obligations for investments in derivatives is in addition to the Fund’s securities pledged as collateral as noted in the Portfolio of Investments.
   
 
See Notes to Financial Statements
 
71

Statement of Operations
 
Year Ended December 31, 2025
  
NMAI
   
JRI
   
JRS
 
INVESTMENT INCOME
      
Affiliated income
  
$
60,834
 
 
$
386,660
 
 
$
 
Dividends
  
 
8,364,301


17,748,619


13,414,970
 
Interest
  
 
20,252,609


13,903,671


214,085
 
Rehypothecation income
  
 
48,092


Tax withheld
  
 
(352,234
 
 
(719,766


Total investment income
  
 
28,373,602


31,319,184


13,629,055
 
EXPENSES
      
Management fees
  
 
5,554,497


5,156,401


3,027,988
 
Shareholder servicing agent fees
  
 
1,375


18,920


Interest expense
  
 
9,240,970


8,598,323


5,147,839
 
Trustees fees
  
 
22,969


19,045


12,425
 
Custodian expenses
  
 
383,759


240,526


48,120
 
Investor relations expenses
  
 
86,021


127,085


75,690
 
Professional fees
  
 
111,677


70,736


58,174
 
Shareholder reporting expenses
  
 
61,069


58,768


56,186
 
Stock exchange listing fees
  
 
10,567


8,671


9,130
 
Other
  
 
24,010


10,112


6,413
 
Total expenses
  
 
15,496,914


14,308,587


8,441,965
 
Net investment income (loss)
  
 
12,876,688


17,010,597


5,187,090
 
REALIZED AND UNREALIZED GAIN (LOSS)
      
Realized gain (loss) from:
      
 Investments*
  
 
23,387,621


10,506,081


9,579,927
 
 Forward foreign currency contracts
  
 
(21,494


 Futures contracts


122,842


 Written options
  
 
462,943


 Swap contracts


1,652,687


1,063,133
 
 Foreign currency transactions
  
 
(197,421
 
 
125,383


(17,209
Net realized gain (loss)
  
 
23,631,649


12,406,993


10,625,851
 
Change in unrealized appreciation (depreciation) on:
      
 Investments **
  
 
44,873,684


21,522,783


(19,108,883
 Forward foreign currency contracts
  
 
(60,225


 Futures contracts


(323,497


 Written options
  
 
(115,914


 Swap contracts


(1,577,197
 
 
(1,015,917
 Foreign currency translations
  
 
59,390


71,538


Net change in unrealized appreciation (depreciation)
  
 
  44,756,935


  19,693,627


  (20,124,800)
 
Net realized and unrealized gain (loss)
  
 
68,388,584


32,100,620


(9,498,949)
 
Net increase (decrease) in net assets applicable to common shares from operations
  
$
81,265,272
 
 
$
49,111,217
 
 
$
(4,311,859
* Net of foreign capital gains tax
  
$
(32
 
$
 
 
$
 
* Net of change in foreign capital gains tax
  
$
(891
 
$
 
 
$
 
 
See Notes to Financial Statements
 
72

Statement of Changes in Net Assets
 
    
NMAI
  
JRI
     
Year Ended
12/31/25
   
Year Ended
12/31/24
         
Year Ended
12/31/25
   
Year Ended
12/31/24
      
OPERATIONS
             
Net investment income (loss)
   $ 12,876,688     $ 12,289,623        $ 17,010,597     $ 14,857,796    
Net realized gain (loss)
     23,631,649       2,139,980          12,406,993       11,025,082    
Net change in unrealized appreciation (depreciation)
     44,756,935       21,345,470            19,693,627       (375,263    
Net increase (decrease) in net assets applicable to common shares from operations
     81,265,272       35,775,073            49,111,217       25,507,615      
DISTRIBUTIONS TO COMMON SHAREHOLDERS
             
Dividends
     (13,281,245     (12,673,637        (22,392,838     (18,052,526  
Return of Capital
     (29,821,124     (42,562,242          (21,534,905     (21,276,701    
Total distributions
     (43,102,369     (55,235,879          (43,927,743     (39,329,227    
CAPITAL SHARE TRANSACTIONS
             
Common shares:
             
Reinvestments of distributions
                      316,245            
Net increase (decrease) applicable to common shares from capital share transactions
                      316,245            
Net increase (decrease) in net assets applicable to common shares
     38,162,903       (19,460,806          5,499,719       (13,821,612    
Net assets applicable to common shares at the beginning of period
     440,312,858       459,773,664            361,497,573       375,319,185      
Net assets applicable to common shares at the end of period
  
$
  478,475,761
 
 
$
  440,312,858
 
      
$
  366,997,292
 
 
$
  361,497,573


See Notes to Financial Statements
 
73

Statement of Changes in Net Assets
(continued)
 
    
JRS
     
Year Ended
12/31/25
   
Year Ended
12/31/24
   
OPERATIONS
      
Net investment income (loss)
   $ 5,187,090     $ 2,420,053    
Net realized gain (loss)
     10,625,851       8,991,450    
Net change in unrealized appreciation (depreciation)
     (20,124,800     13,892,645      
Net increase (decrease) in net assets applicable to common shares from operations
     (4,311,859     25,304,148      
DISTRIBUTIONS TO COMMON SHAREHOLDERS
      
Dividends
     (6,058,316     (7,022,713  
Return of Capital
     (13,588,564     (12,624,167    
Total distributions
     (19,646,880     (19,646,880    
Net increase (decrease) in net assets applicable to common shares
     (23,958,739     5,657,268      
Net assets applicable to common shares at the beginning of period
       261,204,887         255,547,619      
Net assets applicable to common shares at the end of period
  
$
237,246,148
 
 
$
261,204,887


See Notes to Financial Statements
 
74

Statement of Cash Flows
 
 
Year Ended December 31, 2025
  
NMAI
   
JRI
   
JRS
 
CASH FLOWS FROM OPERATING ACTIVITIES
      
Net Increase (Decrease) in Net Assets Applicable to Common Shares from Operations
  
$
81,265,272
 
 
$
49,111,217
 
 
$
(4,311,859
Adjustments to reconcile the net increase (decrease) in net assets applicable to common shares from
operations to net cash provided by (used in) operating activities:
 
   
Purchases of investments
  
 
(435,805,516
 
 
(383,961,249
 
 
(78,351,665
Proceeds from sale and maturities of investments
  
 
445,065,985


413,716,250


95,668,689
 
Proceeds from (Purchase of) short-term investments, net
  
 
15,575,000


3,300,000


4,200,000
 
Proceeds from (Purchase of) closed foreign currency spot transactions
  
 
(43,533
 
 
131,993


(17,209
Proceeds from litigation settlement
  
 
658


3,857


59
 
Capital gains and return of capital distributions from investments
  
 
152,361


2,820,166


3,646,371
 
Amortization (Accretion) of premiums and discounts, net
  
 
(616,321
 
 
(158,222
 
 
(12,052
(Increase) Decrease in:
      
Receivable for dividends
  
 
192,428


59,522


16,663
 
Receivable for interest
  
 
(353,908
 
 
249,939


73,251
 
Receivable for reclaims
  
 
75,473


(4,936


Receivable for investments sold
  
 
(471,728
 
 
(279,653


Receivable for reimbursement from Adviser
  
 
12,709


45,716


Receivable for variation margin on futures contracts


18,625


Other assets
  
 
12,625


4,979


4,249
 
Increase (Decrease) in:
      
Payable for interest
  
 
81,425


(96,637
 
 
(94,808
Payable for investments purchased—regular settlement
  
 
(60,907
 
 
519,977


(888,933
Payable for investments purchased—when-issued/delayed-delivery settlement
  
 
(3,347,008
 
 
(2,294,788


Payable for unfunded senior loans
  
 
96,537


Payable for management fees
  
 
43,328


(8,798
 
 
(30,068
Accrued custodian fees
  
 
177,256


121,331


22,575
 
Accrued investor relations fees
  
 
3,511


2,602


31,465
 
Accrued Trustees fees
  
 
(10,339
 
 
(3,465
 
 
(6,119
Accrued professional fees
  
 
(16,547
 
 
(1,324
 
 
(339
Accrued shareholder reporting expenses
  
 
(11,310
 
 
(12,053
 
 
(3,683
Accrued shareholder servicing agent fees
  
 
203


1,255


(565
Accrued other expenses
  
 
10,853


1,643


Net realized (gain) loss from investments
  
 
(23,387,621
 
 
(10,506,081
 
 
(9,579,927
Net realized (gain) loss from foreign currency transactions
  
 
197,421


(125,383
 
 
17,209
 
Net realized (gain) loss from written options
  
 
(462,943


Net realized (gain) loss from paydowns
  
 
(264,964
 
 
274


Net change in unrealized (appreciation) depreciation of investments
  
 
(44,873,684
 
 
(21,522,783
 
 
19,108,883
 
Net change in unrealized (appreciation) depreciation of forward foreign currency
  
 
60,225


Net change in unrealized (appreciation) depreciation of swap contracts


1,577,197


1,015,917
 
Net change in unrealized (appreciation) depreciation of written options
  
 
115,914


Net change in unrealized (appreciation) depreciation on foreign currency translations
  
 
(59,390
 
 
(71,538


Net cash provided by (used in) operating activities
  
 
33,353,465


52,639,633


30,508,104
 
CASH FLOWS FROM FINANCING ACTIVITIES
      
Proceeds from borrowings
  
 
63,950,000


(Repayments) of borrowings
  
 
(11,500,000
 
 
(8,000,000
 
 
(10,000,000
Proceeds from reverse repurchase agreements
  
 
372,436,800


(Repayments of) reverse repurchase agreements
  
 
(405,474,960


Increase (Decrease) in:
      
Cash overdraft
  
 
(9,678,340
 
 
(896,116
 
 
205,975
 
Cash collateral due to broker


(1,225,766
 
 
(1,067,199
Cash distributions paid to common shareholders
  
 
(43,102,369
 
 
(43,611,498
 
 
(19,646,880
Net cash provided by (used in) financing activities
  
 
(33,368,869
 
 
(53,733,380
 
 
(30,508,104
Net increase (decrease) in cash, cash denominated in foreign currencies and cash collateral at brokers
  
 
(15,404
 
 
(1,093,747


Cash and cash denominated in foreign currencies at the beginning of period
  
 
43,938


2,126,298


Cash, cash denominated in foreign currencies and cash collateral at brokers at the end of period
  
$
28,534
 
 
$
1,032,551
 
 
$
 
 
See Notes to Financial Statements
 
75

 
The following table provides a reconciliation of cash, cash denominated in foreign currencies and cash collateral at brokers to the Statement of Assets and Liabilities:
 
     
NMAI
    
JRI
    
JRS
 
Cash denominated in foreign currencies
  
$
28,534
 
  
$
889,782
 
  
$
 
Cash collateral at broker for investments in futures contracts


142,769


Total cash, cash denominated in foreign currencies and cash collateral at brokers
  
$
28,534
 
  
$
1,032,551
 
  
$
 
SUPPLEMENTAL DISCLOSURE OF CASH FLOW INFORMATION
  
NMAI
    
JRI
    
JRS
 
Cash paid for interest
  
$
   9,135,518
 
  
$
   8,650,410
 
  
$
   5,236,104
 
Non-cash financing activities not included herein consists of reinvestments of common share distributions


316,245


See Notes to Financial Statements
 
76


[This page intentionally left blank.]


77

Financial Highlights
 
The following data is for a common share outstanding for each fiscal year end unless otherwise noted:
 
           
Investment Operations
          
Less Distributions to

Common Shareholders
          
Common Share
     
Common
Share
Net Asset
Value,
Beginning
of Period
    
Net
Investment
Income (NII)
(Loss)
(a)
    
Net
Realized/
Unrealized
Gain
(Loss)
    
Total
    
From NII
   
    
From Net
Realized
Gains
   
Return of
Capital
   
    
Total
   
Discount
Per
Share
Repurchased
and Retired
   
Net Asset
Value,
End of
Period
    
Share
Price, 
End of
Period
NMAI


12/31/25
  
 
$13.17


$0.39


$2.04


$2.43


$(0.40)


$—


$(0.89)


$(1.29)


$—


$14.31
 
  
$13.04
12/31/24
  
 
13.76


0.37


0.69


1.06


(0.38


(1.27)


(1.65


13.17
 
  
12.04
12/31/23
  
 
13.41


0.39


1.26


1.65


(0.62


(0.68)


(1.30


13.76
 
  
12.30
12/31/22
  
 
20.03


0.47


(4.86)


(4.39)


(1.40
    
 
(0.83)


(2.23


13.41
 
  
11.49
12/31/21
(e)
  
 
20.00


0.07


0.31


0.38


(0.06


(0.29)


(0.35


20.03
 
  
18.65
JRI


12/31/25
  
 
13.19


0.62


1.16


1.78


(0.81


(0.79)


(1.60


13.37
 
  
13.61
12/31/24
  
 
13.69


0.54


0.39


0.93


(0.65


(0.78)


(1.43


13.19
 
  
12.13
12/31/23
  
 
13.57


0.55


0.65


1.20


(0.66


(0.42)


(1.08
 
 
(g)


13.69
 
  
11.72
12/31/22
  
 
17.41


0.78


(3.46)


(2.68)


(0.77


(0.39)


(1.16


13.57
 
  
11.70
12/31/21
  
 
15.84


1.00


1.73


2.73


(1.09


(0.07)


(1.16


17.41
 
  
16.12
JRS


12/31/25
  
 
9.04


0.18


(0.33)


(0.15)


(0.21


(0.47)


(0.68


8.21
 
  
7.66
12/31/24
  
 
8.84


0.08


0.80


0.88


(0.24


(0.44)


(0.68


9.04
 
  
8.63
12/31/23
  
 
8.12


0.16


1.24


1.40


(0.23


(0.45)


(0.68


8.84
 
  
7.82
12/31/22
  
 
13.22


0.27


(4.54)


(4.27)


(0.26
    
 
(0.30
 
 
(0.27
    
 
(0.83


8.12
 
  
7.56
12/31/21
  
 
9.63


0.25


4.10


4.35


(0.20


(0.56


(0.76


13.22
 
  
12.82
 
(a)
Based on average shares outstanding.
(b)
Total Return Based on Common Share NAV is the combination of changes in common share NAV, reinvested distributions at Common Share NAV, if any. The last distribution declared in the period, which is typically paid on the first business day of the following month, is assumed to be reinvested at the ending NAV. The actual reinvest price for the last distribution declared in the period may often be based on the Fund’s market price (and not its NAV), and therefore may be different from the price used in the calculation. Total returns are not annualized.
Total Return Based on Common Share Price is the combination of changes in the market price per share and the effect of reinvested distributions, if any, at the average price paid per share at the time of reinvestment. The last distribution declared in the period, which is typically paid on the first business day of the following month, is assumed to be reinvested at the ending market price. The actual reinvestment for the last distribution declared in the period may take place over several days, and in some instances may not be based on the market price, so the actual reinvestment price may be different from the price used in the calculation. Total returns are not annualized.
 
78


Common Share Supplemental Data/
Ratios Applicable to Common Shares
Common Share
Total Returns
           
Ratios to Average

Net Assets
      
Based
on
Net Asset
Value
(b)
  
Based
on
Share
Price
(b)
    
Net
Assets,
End of
Period (000)
    
Expenses
(c)
            
Net
Investment
Income
(Loss)
(c)
,(d)
    
Portfolio
Turnover
Rate
                                                 
19.23%
  
 
19.86%


$478,476


3.38%


2.81%
 
  
68%
7.85 
  
 
11.46 


440,313


3.50 


2.66  
 
  
41  
12.87 
  
 
         19.43 


         459,774


         3.68  


2.86  
 
  
         46  
(21.91)  
  
 
(26.29)  


448,357


2.53  


2.88  
 
  
129  
1.90 
  
 
(5.00)  


669,611


1.63
(f)


3.35
(f)
 
  
66  


14.15 
  
 
26.60 


366,997


3.90  


4.64  
 
  
72  
7.03 
  
 
16.12 


361,498


4.14  


3.99  
 
  
80  
9.32 
  
 
10.02 


375,319


4.07  


4.15  
 
  
59  
(15.83)  
  
 
(20.83)  


372,451


2.63  


5.09  
 
  
71  
17.73 
  
 
29.09 


477,911


1.82  


5.94  
 
  
73  


(1.70)  
  
 
(3.39)  


237,246


3.40  


2.09  
 
  
22  
10.28 
  
 
19.66 


261,205


3.52  


0.93  
 
  
31  
          18.14 
  
 
13.46 


255,548


3.64  


1.88  
 
  
33  
(32.94)  
  
 
(35.25)  


234,497


2.33  


2.58  
 
  
58  
46.38 
  
 
62.73 


381,815


1.54  


2.16  
 
  
92  


(c)
• Net Investment Income (Loss) ratios reflect income earned and expenses incurred on assets attributable to borrowings, preferred shares and/or reverse repurchase agreements (as described in Notes to Financial Statements), where applicable.
• The expense ratios reflect, among other things, all interest expense and other costs related to borrowings, preferred shares and/or reverse repurchase agreements (as described in Notes to Financial Statements) and/or the interest expense deemed to have been paid by the Fund on the floating rate certificates issued by the special purpose trusts for the self-deposited inverse floaters held by the Fund (as described in Notes to Financial Statements), where applicable, as follows:


Ratios of Interest Expense to
Average Net Assets Applicable
to Common Shares
 
 
NMAI


12/31/25
  
 
2.02
 
12/31/24
  
 
2.06
 
 
12/31/23
  
 
      2.32
 
 
12/31/22
  
 
1.04
 
 
12/31/21
  
 
0.12
(e),(f) 
 
JRI


12/31/25
  
 
2.34
 
 
12/31/24
  
 
2.48
 
 
12/31/23
  
 
2.53
 
 
12/31/22
  
 
1.04
 
 
12/31/21
  
 
0.34
 
 
JRS


12/31/25
  
 
2.07
 
 
12/31/24
  
 
2.25
 
 
12/31/23
  
 
2.31
 
 
12/31/22
  
 
1.01
 
 
12/31/21
  
 
0.27
 
 
(d)
Includes voluntary compensation from the Adviser as further described in the Notes to Financial Statements.
(e)
For the period November 22, 2021 (commencement of operations) through December 31, 2021.
(f)
Annualized.
(g)
Value rounded to zero.
 
See Notes to Financial Statements
 
79

Financial Highlights
 
The following table sets forth information regarding each Fund’s outstanding senior securities as of the end of each of the Fund’s last five fiscal periods, as applicable.
 
    
Borrowings
 
             
Aggregate
Amount
Outstanding
(000)
(a)
    
Asset
Coverage
Per $1,000
(b)
 
NMAI


12/31/25
     
$
174,786
 
  
$
3,737
 
12/31/24
     
 
122,336


4,599
 
12/31/23
     
 
85,416


6,383
 
12/31/22
     
 
175,601


3,553
 
12/31/21
(c)


178,550


4,750
 
JRI


12/31/25
     
 
170,945


3,147
 
12/31/24
     
 
178,945


3,020
 
12/31/23
     
 
151,695


3,474
 
12/31/22
     
 
166,985


3,230
 
12/31/21


197,935


3,414
 
JRS


12/31/25
     
 
102,400


3,317
 
12/31/24
     
 
112,400


3,324
 
12/31/23
     
 
94,400


3,707
 
12/31/22
     
 
104,400


3,246
 
12/31/21


144,000


3,651
 
 
(a)
Aggregate Amount Outstanding: Aggregate amount outstanding represents the principal amount outstanding or liquidation preference, if applicable, as of the end of the relevant fiscal year.
(b)
Asset Coverage Per $1,000: Asset coverage per $1,000 is calculated by subtracting the Fund’s liabilities and indebtedness not represented by senior securities from the Fund’s total assets, dividing the result by the aggregate amount of the Fund’s borrowings (excluding temporary borrowings) then outstanding and multiplying the result by 1,000. For purpose of asset coverage above, senior securities consist of preferred shares or borrowings of a Fund and does not include derivative transactions and other investments that have the economic effect of leverage such as reverse repurchase agreements and tender option bonds. If the leverage effects of such investments were included, the asset coverage amounts presented would be lower.
(c)
For the period November 22, 2021 (commencement of operations) through December 31, 2021.
 
80

Notes to Financial Statements
 
1.
General Information
Fund Information:
The funds covered in this report and their corresponding New York Stock Exchange (“NYSE”) symbols are as follows (each a “Fund” and collectively, the “Funds”):
 • Nuveen Multi-Asset Income Fund (NMAI)
 • Nuveen Real Asset Income and Growth Fund (JRI)
 • Nuveen Real Estate Income Fund (JRS)
The Funds are registered under the Investment Company Act of 1940 (the “1940 Act”), as amended, as closed-end management investment companies. NMAI, JRI and JRS were organized as Massachusetts business trusts on April 22, 2021, January 10, 2012 and August 27, 2001, respectively.
Current Fiscal Period
: The end of the reporting period for the Funds is December 31, 2025, and the period covered by these Notes to Financial Statements is the fiscal year ended December 31, 2025 (the “current fiscal period”).
Investment Adviser and Sub-Adviser:
The Funds’ investment adviser is Nuveen Fund Advisors, LLC (the “Adviser”), a subsidiary of Nuveen, LLC (“Nuveen”). Nuveen is the investment management arm of Teachers Insurance and Annuity Association of America (TIAA). The Adviser has overall responsibility for management of the Funds, oversees the management of the Funds’ portfolio, manages the Funds’ business affairs and provides certain clerical, bookkeeping and other administrative services, and, if necessary, asset allocation decisions. For NMAI, the Adviser has entered into sub-advisory agreements (each a “Sub-Advisory Agreement”) with each of Nuveen Asset Management, LLC (“NAM”), Teachers Advisors, LLC (“TAL”) and Winslow Capital Management LLC (“Winslow”), each of which are affiliates of the Adviser. Pursuant to the Sub-Advisory Agreement with NAM, NAM is responsible for the Fund’s dynamic asset allocation strategy and for allocating the Fund’s assets among each of the various Sub-Advisers. NAM, TAL and Winslow under each Sub-Advisory Agreement manages the investment portfolios of the Fund allocated to it. For JRI, the Adviser has entered into a sub-advisory agreement with NAM under which NAM manages the investment portfolio of JRI. For JRS, the Adviser has entered into sub-advisory agreements with Security Capital Research & Management Incorporated (“Security Capital”), under which Security Capital manages JRS’s investment portfolio. The Adviser is responsible for managing the Funds’ investments in swap contracts. NAM, TAL, Winslow and Security Capital are each a “Sub-Adviser”.
 
2.
Significant Accounting Policies
The accompanying financial statements were prepared in accordance with accounting principles generally accepted in the United States of America (“U.S. GAAP”), which may require the use of estimates made by management and the evaluation of subsequent events. Actual results may differ from those estimates. The Funds are investment companies and follow accounting guidance in the Financial Accounting Standards Board (“FASB”) Accounting Standards Codification 946, Financial Services — Investment Companies. The net asset value (“NAV”) for financial reporting purposes may differ from the NAV for processing security and common share transactions. The NAV for financial reporting purposes includes security and common share transactions through the date of the report. Total return is computed based on the NAV used for processing security and common share transactions. The following is a summary of the significant accounting policies consistently followed by the Funds.
Compensation:
The Funds pay no compensation directly to those of its officers, all of whom receive remuneration for their services to the Funds from the Adviser or its affiliates. The Funds’ Board of Trustees (the “Board”) has adopted a deferred compensation plan for independent trustees that enables trustees to elect to defer receipt of all or a portion of the annual compensation they are entitled to receive from certain Nuveen-advised funds. Under the plan, deferred amounts are treated as though equal dollar amounts had been invested in shares of select Nuveen-advised funds.
Distributions to Shareholders:
Distributions to shareholders are recorded on the ex-dividend date. The amount, character and timing of distributions are determined in accordance with federal income tax regulations, which may differ from U.S. GAAP.
NMAI and JRI make monthly cash distributions, while JRS makes quarterly cash distributions to common shareholders of a stated dollar amount per share. Prior to the June 2025 distribution, NMAI made quarterly cash distribution. Subject to approval and oversight by the Board, JRS seeks to maintain a stable distribution level designed to deliver the long-term return potential of each Fund’s investment strategy through regular quarterly distributions (a “Managed Distribution Program”). Total distributions during a calendar year generally will be made from each Fund’s net investment income, net realized capital gains and net unrealized capital gains in the Fund’s portfolio, if any. The portion of distributions paid attributed to net unrealized gains, if any, is distributed from the Fund’s assets and is treated by common shareholders as a non-taxable distribution (“return of capital”) for tax purposes. In the event that total distributions during a calendar year exceed a Fund’s total return on NAV, the difference will reduce NAV per share. If a Fund’s total return on NAV exceeds total distributions during a calendar year, the excess will be reflected as an increase in NAV per share. The final determination of the source and character of all distributions paid by a Fund during the fiscal year is made after the end of the fiscal year and is reflected in the financial statements contained in the annual report as of December 31 each year.
The distribution policy for NMAI and JRI, which may be changed by the Board, is to make regular monthly cash distributions to holders of its common shares (stated in terms of a fixed cents per common share dividend distribution rate which may be set from time to time). Each Fund intends to distribute all or substantially all of its net investment income each year through its regular monthly distribution and to distribute realized capital gains at least annually. In addition, in any monthly period, to maintain its declared per common share distribution amount, Each Fund may distribute more or less than its net investment income during the period. In the event a Fund distributes more than its net investment income during any yearly period, such distributions may also include realized gains and/or a return of capital. To the extent that a distribution includes a return
 
81

Notes to Financial Statements
(continued)
 
of capital the NAV per share may erode. The practice of maintaining a stable distribution level had no material effect on each Fund’s investment strategy during the most recent fiscal period and is not expected to have such an effect in future periods, however, distributions in excess of Fund returns will cause its NAV per share to erode.
The tax character of Fund distributions for a fiscal year is dependent upon the amount and tax character of distributions received from securities held in a Fund’s portfolio. Distributions received from certain securities in which a Fund invests, most notably real estate investment trust securities, may be characterized for tax purposes as ordinary income, long-term capital gain and/or a return of capital. The issuer of a security reports the tax character of its distributions only once per year, generally during the first two months of the calendar year for the previous year. The distribution is included in a Fund’s ordinary income until such time a Fund is notified by the issuer of the actual tax character. Dividend income, net realized gain (loss) and unrealized appreciation (depreciation) recognized on the Statement of Operations reflect the amounts of ordinary income, capital gain, and/or return of capital as reported by the issuers of such securities for distributions during the current fiscal period.
Foreign Currency Transactions and Translation:
To the extent that the Funds invest in securities and/or contracts that are denominated in a currency other than U.S. dollars, the Funds will be subject to currency risk, which is the risk that an increase in the U.S. dollar relative to the foreign currency will reduce returns or portfolio value. Generally, when the U.S. dollar rises in value against a foreign currency, the Funds’ investments denominated in that currency will lose value because their currency is worth fewer U.S. dollars; the opposite effect occurs if the U.S. dollar falls in relative value. Investments and other assets and liabilities denominated in foreign currencies are converted into U.S. dollars on a spot (i.e. cash) basis at the spot rate prevailing in the foreign currency exchange market at the time of valuation. Purchases and sales of investments and income denominated in foreign currencies are translated into U.S. dollars on the respective dates of such transactions.
The books and records of the Funds are maintained in U.S. dollars. Assets, including investments, and liabilities denominated in foreign currencies are translated into U.S. dollars at the end of each day. Purchases and sales of securities, income and expenses are translated into U.S. dollars at the prevailing exchange rate on the respective dates of the transactions.
Some markets in which the Funds invest impose capital controls, repatriation limits and/or transaction fees, for example, on the amount of foreign currency that may be converted to U.S. dollars. These restrictions, in some markets where foreign exchange restrictions are imposed, may be reflected in non-deliverable forward rates (NDF), or prevailing “offshore” rates that apply to non-local investors. Accordingly, the Fund may apply NDF rates, or another alternative exchange rate believed by the Adviser to be more reflective of the rates at which the Funds may transact, where applicable, to convert the value of non-U.S. dollar denominated securities to U.S. dollars. The U.S. dollar market value of such securities held in markets where NDF rates exist may be lower than the U.S. dollar market value of securities using prevailing local or “onshore” foreign currency exchange rates.
Net realized foreign currency gains and losses resulting from changes in exchange rates associated with (i) foreign currency, (ii) investments and (iii) derivatives include foreign currency gains and losses between trade date and settlement date of the transactions, foreign currency transactions, and the difference between the amounts of interest and dividends recorded on the books of the Funds and the amounts actually received are recognized as a component of “Net realized gain (loss) from foreign currency transactions” on the Statement of Operations, when applicable.
The unrealized gains and losses resulting from changes in foreign currency exchange rates and changes in foreign exchange rates associated with (i) investments and (ii) other assets and liabilities are recognized as a component of “Change in net unrealized appreciation (depreciation) of foreign currency translations” on the Statement of Operations, when applicable. The unrealized gains and losses resulting from changes in foreign exchange rates associated with investments in derivatives are recognized as a component of the respective derivative’s related “Change in net unrealized appreciation (depreciation)” on the Statement of Operations, when applicable.
As of the end of the current fiscal period, NMAI’s and JRI’s investments in non-U.S. securities were as follows:
 
NMAI
  
Value
    
% of Total
Investments
Country:
     
Japan
  
$
23,557,362
 
  
3.4%
United Kingdom
  
 
21,247,823
 
  
3.1
France
  
 
16,601,217
 
  
2.4
Germany
  
 
14,062,508
 
  
2.0
Spain
  
 
13,229,630
 
  
1.9
Switzerland
  
 
10,011,048
 
  
1.5
Canada
  
 
8,465,285
 
  
1.2
Netherlands
  
 
7,369,736
 
  
1.1
Mexico
  
 
7,227,339
 
  
1.1
Other
  
 
60,149,827
 
  
8.7
Total non-U.S. Securities
  
$
181,921,775
 
  
26.4%
 
82

 
JRI
  
Value
    
% of Total
Investments
Country:
     
Canada
  
$
53,731,450
 
  
10.0%
United Kingdom
  
 
28,114,275
 
  
5.2
France
  
 
13,524,433
 
  
2.5
Italy
  
 
13,321,106
 
  
2.5
Singapore
  
 
9,397,019
 
  
1.7
Australia
  
 
8,808,782
 
  
1.6
Japan
  
 
8,033,456
 
  
1.5
Mexico
  
 
6,698,126
 
  
1.2
Hong Kong
  
 
5,814,369
 
  
1.1
Other
  
 
18,882,476
 
  
3.6
Total non-U.S. Securities
  
$
166,325,492
 
  
30.9%
Foreign Taxes:
The Funds may be subject to foreign taxes on income, gains on investments or foreign currency repatriation, a portion of which may be recoverable. The Funds will accrue such taxes and recoveries as applicable, based upon the current interpretation of tax rules and regulations that exist in the markets in which the Funds invest.
Indemnifications:
Under the Funds’ organizational documents, their officers and trustees are indemnified against certain liabilities arising out of the performance of their duties to the Funds. In addition, in the normal course of business, the Funds enter into contracts that provide general indemnifications to other parties. The Funds’ maximum exposure under these arrangements is unknown as this would involve future claims that may be made against the Funds that have not yet occurred. However, the Funds have not had prior claims or losses pursuant to these contracts and expects the risk of loss to be remote.
Investments and Investment Income:
Securities transactions are accounted for as of the trade date for financial reporting purposes. Trade date for senior and subordinated loans purchased in the “primary market” is considered the date on which the loan allocations are determined. Trade date for senior and subordinated loans purchased in the “secondary market” is the date on which the transaction is entered into. Realized gains and losses on securities transactions are based upon the specific identification method. Dividend income is recorded on the ex-dividend date or, for certain foreign securities, when information is available. Non-cash dividends received in the form of stock, if any, are recognized on the ex-dividend date and recorded at fair value. Interest income, is recorded on an accrual basis and includes accretion of discounts and amortization of premiums for financial reporting purposes. Interest income also reflects payment-in kind (“PIK”) interest, paydown gains and losses and fee income, if any. PIK interest represents income received in the form of securities in lieu of cash. Fee income consists primarily of amendment fees. Amendment fees are earned as compensation for evaluating and accepting changes to an original senior loan agreement and are recognized when received. Rehypothecation income when applicable, is comprised of fees earned in connection with the rehypothecation of pledged collateral as further described later in these Notes to Financial Statements
Netting Agreements:
In the ordinary course of business, the Funds may enter into transactions subject to enforceable master repurchase agreements, International Swaps and Derivatives Association, Inc. (ISDA) master agreements or other similar arrangements (“netting agreements”). Generally, the right to offset in netting agreements allows each Fund to offset certain securities and derivatives with a specific counterparty, when applicable, as well as any collateral received or delivered to that counterparty based on the terms of the agreements. Generally, each Fund manages its cash collateral and securities collateral on a counterparty basis. With respect to certain counterparties, in accordance with the terms of the netting agreements, collateral posted to the Funds is held in a segregated account by the Funds’ custodian and/or with respect to those amounts which can be sold or repledged, are presented in the Funds’ Portfolio of Investments or Statement of Assets and Liabilities.
The Funds’ investments subject to netting agreements as of the end of the current fiscal period, if any, are further described later in these Notes to Financial Statements.
Segment Reporting:
Each Fund represents a single operating segment. The officers of the Funds act as the chief operating decision maker (“CODM”), as defined in U.S. GAAP. The CODM monitors the operating results of each Fund as a whole and is responsible for each Fund’s long-term strategic asset allocation in accordance with the terms of its prospectus, based on a defined investment strategy which is executed by the Fund’s portfolio managers as a team. The financial information in the form of the Fund’s portfolio composition, total returns, expense ratios and changes in net assets (i.e., changes in net assets resulting from operations, subscriptions and redemptions), which are used by the CODM to assess the segment’s performance versus the Fund’s comparative benchmarks and to make resource allocation decisions for the Fund’s single segment, is consistent with that presented within the Fund’s financial statements. Segment assets are reflected on the Statement of Assets and Liabilities as “total assets” and significant segment revenues and expenses are listed on the Statement of Operations.
New Accounting Pronouncement (ASU No. 2023-09)
: In December 2023, the FASB issued Accounting Standard Update (“ASU”) No. 2023-09, Income Taxes (Topic 740) Improvements to Income tax disclosures (“ASU 2023-09”). The primary purpose of the amendments within ASU 2023-09 is to enhance the transparency and decision usefulness of income tax disclosures primarily related to the rate reconciliation table and income taxes paid information. The amendments in ASU 2023-09 are effective for annual periods beginning after December 15, 2024. During the current fiscal period, the Funds adopted the new guidance. See Note 7 for more information.
 
83

Notes to Financial Statements
(continued)
 
New Accounting Pronouncement (ASU No. 2025-11)
: In December 2025, the FASB issued ASU No. 2025-11, Interim Reporting (Topic 270) Narrow Scope Improvements (“ASU 2025-11”). The amendments in ASU 2025-11 provide a comprehensive list of interim disclosures that are required by U.S. GAAP. ASU 2025-11 also includes a disclosure principle that requires entities to disclose events since the end of the last annual reporting period that have a material impact on the entity. The amendments in ASU 2025-11 are effective for interim reporting periods within annual reporting periods beginning after December 15, 2027. Early adoption is permitted for all entities. Management is currently evaluating the implications of these changes on the financial statements.
 
3.
Investment Valuation and Fair Value Measurements
The Funds’ investments in securities are recorded at their estimated fair value utilizing valuation methods approved by the Adviser, subject to oversight of the Board. Fair value is defined as the price that would be received upon selling an investment or transferring a liability in an orderly transaction to an independent buyer in the principal or most advantageous market for the investment. U.S. GAAP establishes the three-tier hierarchy which is used to maximize the use of observable market data and minimize the use of unobservable inputs and to establish classification of fair value measurements for disclosure purposes. Observable inputs reflect the assumptions market participants would use in pricing the asset or liability. Observable inputs are based on market data obtained from sources independent of the reporting entity. Unobservable inputs reflect management’s assumptions about the assumptions market participants would use in pricing the asset or liability. Unobservable inputs are based on the best information available in the circumstances. The following is a summary of the three-tiered hierarchy of valuation input levels.
Level 1 – Inputs are unadjusted and prices are determined using quoted prices in active markets for identical securities.
Level 2 – Prices are determined using other significant observable inputs (including quoted prices for similar securities, interest rates, credit spreads, etc.).
Level 3 – Prices are determined using significant unobservable inputs (including management’s assumptions in determining the fair value of investments).
A description of the valuation techniques applied to the Funds’ major classifications of assets and liabilities measured at fair value follows:
Equity securities and exchange-traded funds listed or traded on a national market or exchange are valued based on their last reported sales price or official closing price of such market or exchange on the valuation date. Foreign equity securities and registered investment companies that trade on a foreign exchange are valued at the last reported sales price or official closing price on the principal exchange where traded, and converted to U.S. dollars at the prevailing rates of exchange on the valuation date. For events affecting the value of foreign securities between the time when the exchange on which they are traded closes and the time when the Funds’ net assets are calculated, such securities will be valued at fair value in accordance with procedures adopted by the Adviser, subject to the oversight of the Board. To the extent these securities are actively traded and no valuation adjustments are applied, they are generally classified as Level 1. When valuation adjustments are applied to the most recent last sales price or official closing price, these securities are generally classified as Level 2.
Prices of fixed-income securities are generally provided by pricing services approved by the Adviser, which is subject to review by the Adviser and oversight of the Board. Pricing services establish a security’s fair value using methods that may include consideration of the following: yields or prices of investments of comparable quality, type of issue, coupon, maturity and rating, market quotes or indications of value from security dealers, evaluations of anticipated cash flows or collateral, general market conditions and other information and analysis, including the obligor’s credit characteristics considered relevant. In pricing certain securities, particularly less liquid and lower quality securities, pricing services may consider information about a security, its issuer or market activity provided by the Adviser. These securities are generally classified as Level 2.
Prices of certain American Depositary Receipts (“ADR”) held by the Funds that trade in the United States are valued based on the last traded price, official closing price, or an evaluated price provided by the pricing services and are generally classified as Level 1 or 2.
Investments in investment companies are valued at their respective NAVs or share price on the valuation date and are generally classified as Level 1.
Repurchase agreements are valued at contract amount plus accrued interest, which approximates market value. These securities are generally classified as Level 2.
Forward foreign currency contracts are valued using the prevailing forward exchange rate which is derived from quotes provided by the pricing service using the procedures approved by the Adviser, subject to the oversight of the Board, and are generally classified as Level 2.
Futures contracts are valued using the closing settlement price or, in the absence of such a price, the last traded price and are generally classified as Level 1.
Swap contracts are marked-to-market daily based upon a price supplied by a pricing service. Swaps are generally classified as Level 2.
Purchased and written options traded and listed on a national market or exchange are valued at the mean of the closing bid and asked prices and are generally classified as Level 1.
For any portfolio security or derivative for which market quotations are not readily available or for which the Adviser deems the valuations derived using the valuation procedures described above not to reflect fair value, the Adviser will determine a fair value in good faith using alternative procedures approved by the Adviser, subject to the oversight of the Board. As a general principle, the fair value of a security is the amount that the owner might reasonably expect to receive for it in a current sale. A variety of factors may be considered in determining the fair value of such securities, which may include consideration of the following: yields or prices of investments of comparable quality, type of issue, coupon, maturity
 
84

 
and rating, market quotes or indications of value from security dealers, evaluations of anticipated cash flows or collateral, general market conditions and other information and analysis, including the obligor’s credit characteristics considered relevant. To the extent the inputs are observable and timely, the values would be classified as Level 2; otherwise they would be classified as Level 3.
The following table summarizes the market value of the Funds’ investments as of the end of the current fiscal period, based on the inputs used to value them:
 
NMAI
  
Level 1
    
Level 2
   
Level 3
    
Total
 
Long-Term Investments:
          
Asset-Backed Securities
  
$
 
  
$
1,954,469
 
 
$
217,130
 
  
$
2,171,599
 
Common Stocks
  
 
235,199,801


100,246,667


8


335,446,476
 
Corporate Bonds


92,572,057


92,572,057
 
Emerging Market Debt and Foreign Corporate Bonds


68,760,634


1,446,701


70,207,335
 
Exchange-Traded Funds
  
 
36,419,316


36,419,316
 
Investment Companies
  
 
66,548


66,548
 
Mortgage-Backed Securities


58,937,504


58,937,504
 
Preferred Stock
  
 
5,120,097


5,120,097
 
U.S. Government and Agency Obligations


27,674,863


27,674,863
 
Variable Rate Senior Loan Interests


50,107,305


1,127


50,108,432
 
Short-Term Investments:
          
Repurchase Agreements


10,300,000


10,300,000
 
Investments in Derivatives:
          
Forward Foreign Currency Contracts*


(1,732


(1,732
Total
  
$
276,805,762
 
  
$
410,551,767
 
 
$
1,664,966
 
  
$
689,022,495
 
 
JRI
  
Level 1
    
Level 2
    
Level 3
    
Total
 
Long-Term Investments:
           
Common Stocks
  
$
177,551,827
 
  
$
81,314,419
 
  
$
 
  
$
258,866,246
 
Convertible Preferred Securities
  
 
11,984,914


11,984,914
 
Corporate Bonds


173,904,488


173,904,488
 
Investment Companies
  
 
2,812,750


2,812,750
 
Mortgage-Backed Securities


11,240,351


11,240,351
 
Preferred Stock
  
 
56,488,356


56,488,356
 
Variable Rate Senior Loan Interests


13,153,280


13,153,280
 
Short-Term Investments:
           
Repurchase Agreements


9,125,000


9,125,000
 
Investments in Derivatives:
           
Futures Contracts*
  
 
18,483


18,483
 
Total
  
$
248,856,330
 
  
$
288,737,538
 
  
$
 
  
$
537,593,868
 
JRS
  
Level 1
    
Level 2
    
Level 3
    
Total
 
Long-Term Investments:
           
Common Stocks
  
$
245,664,976
 
  
$
 
  
$
 
  
$
245,664,976
 
Convertible Preferred Securities
  
 
1,766,178


1,766,178
 
Preferred Stock
  
 
90,058,602


90,058,602
 
Short-Term Investments:
           
Repurchase Agreements


6,100,000


6,100,000
 
Total
  
$
337,489,756
 
  
$
6,100,000
 
  
$
 
  
$
343,589,756
 
*Represents net unrealized appreciation (depreciation).
 
4.
Portfolio Securities
Unfunded Commitments:
Pursuant to the terms of certain of the variable rate senior loan agreements, NMAI and JRI may have unfunded senior loan commitments. The Fund will maintain with its custodian, cash, liquid securities and/or liquid senior loans having an aggregate value at least equal to the amount of unfunded senior loan commitments. As of the end of the current fiscal period, JRI had no value in outstanding unfunded senior loan commitments, whereas NMAI’s outstanding unfunded senior loan commitments were as follows:
 
85

Notes to Financial Statements
(continued)
 
Fund
 
  
Outstanding Unfunded Senior Loan
Commitments
 
NMAI
  
 
$135,795


Participation Commitments
:
With respect to the senior loans held in NMAI and JRI portfolio, the Funds may: 1) invest in assignments; 2) act as a participant in primary lending syndicates; or 3) invest in participations. If the Funds purchases a participation of a senior loan interest, the Funds would typically enter into a contractual agreement with the lender or other third party selling the participation, rather than directly with the borrower. As such, the Funds not only assumes the credit risk of the borrower, but also that of the selling participant or other persons interpositioned between the Fund and the borrower. As of the end of the current fiscal period, the Funds had no such outstanding participation commitments.
Repurchase Agreements:
In connection with transactions in repurchase agreements, it is each Fund’s policy that its custodian take possession of the underlying collateral securities, the fair value of which exceeds the principal amount of the repurchase transaction, including accrued interest, at all times. If the counterparty defaults, and the fair value of the collateral declines, realization of the collateral may be delayed or limited.
The following table presents the repurchase agreements for the Funds that are subject to netting agreements as of the end of the current fiscal period, and the collateral delivered related to those repurchase agreements.
 
Fund
  
Counterparty
    
Short-term
Investments,
at Value
    
Collateral
Pledged (From)
Counterparty
 
NMAI
     Fixed Income Clearing Corporation           $ 10,300,000          $ (10,506,122
JRI
     Fixed Income Clearing Corporation      9,125,000        (9,307,720
JRS
     Fixed Income Clearing Corporation        6,100,000        (6,222,131
Zero Coupon Securities:
A zero coupon security does not pay a regular interest coupon to its holders during the life of the security. Income to the holder of the security comes from accretion of the difference between the original purchase price of the security at issuance and the par value of the security at maturity and is effectively paid at maturity. The market prices of zero coupon securities generally are more volatile than the market prices of securities that pay interest periodically.
Purchases and Sales:
Long-term purchases and sales during the current fiscal period were as follows:
 
Fund
  
Non-U.S.
Government
Purchases
    
U.S.
Government
Purchases
    
Non-U.S.
Government
Sales and
Maturities
    
U.S.
Government
Sales
 
NMAI
   $   407,951,674      $   27,853,842      $   390,957,707      $   54,108,278  
JRI
     383,961,249               413,716,250         
JRS
     78,351,665               95,668,689         
The Funds may purchase securities on a when-issued or delayed-delivery basis. Securities purchased on a when-issued or delayed-delivery basis may have extended settlement periods; interest income is not accrued until settlement date. Any securities so purchased are subject to market fluctuation during this period. If a Fund has outstanding when-issued/delayed-delivery purchases commitments as of the end of the current fiscal period, such amounts are recognized on the Statement of Assets and Liabilities.
 
5.
Derivative Investments
Each Fund is authorized to invest in certain derivative instruments. As defined by U.S. GAAP, a derivative is a financial instrument whose value is derived from an underlying security price, foreign exchange rate, interest rate, index of prices or rates, or other variables. Investments in derivatives as of the end of and/or during the current fiscal period, if any, are included within the Statement of Assets and Liabilities and the Statement of Operations, respectively.
Forward Foreign Currency Contracts:
During the current fiscal period, NMAI used foreign exchange forwards partially hedge its exposure to non-U.S. dollar denominated positions.
A forward contract is an agreement between two parties to purchase or sell a specified quantity of a currency at or before a specified date in the future at a specified price. Non-deliverable forward foreign currency exchange contracts are settled with the counterparty in cash without the delivery of foreign currency. Forward contracts are typically traded in the over-the-counter (“OTC”) markets and all details of the contract are negotiated between the counterparties to the agreement. Forward contracts are marked-to-market daily and any resulting unrealized gains or losses are reflected as appreciation or depreciation on the Statement of Assets and Liabilities. The Funds realizes gains and losses at the time the forward contracts are closed and are included on the Statement of Operations. Risks may arise upon entering into forward contracts from unanticipated movements in the value of a foreign currency relative to the U.S. dollar; and that losses may exceed amounts recognized on the Statement of Assets and Liabilities.
 
86

 
The average notional amount of forward foreign currency contracts outstanding during the current fiscal period was as follows:
 
Fund
  
Average Notional Amount of Forward
Contracts Outstanding*
NMAI
   $1,868,586
 
*
The average notional amount is calculated based on the absolute aggregate notional amount of contracts outstanding at the beginning of the current fiscal period and at the end of each fiscal quarter within the current fiscal period.
The following table presents the forward foreign currency contracts subject to netting agreements and the collateral delivered related to those forward foreign currency contracts as of the end of the current fiscal period.
 
Fund
  
Counterparty
    
Gross Unrealized
Appreciation on
Forward Foreign
Currency Contracts*
    
Gross Unrealized
(Depreciation) on
Forward Foreign
Currency Contracts*
   
Net Unrealized
   
Collateral
Pledged to (from)
Counterparty
    
Net Exposure
 
NMAI
     Citibank, N.A      $ -      $ (1,732   $ (1,732   $ -      $ (1,732
 
* Represents gross unrealized appreciation (depreciation) for the counterparty as reported in the Funds’ Portfolio of Investments.
Futures Contracts:
During the current fiscal period, JRI continued to use interest rate futures to partially hedge the portfolio against movements in interest rates.
A futures contract is an agreement between two parties to buy and sell a financial instrument for a set price on a future date. Upon execution of a futures contract, the Fund is obligated to deposit cash or eligible securities, also known as “initial margin,” into an account at its clearing broker equal to a specified percentage of the contract amount. Securities deposited for initial margin, if any, are identified in the Portfolio of Investments and cash deposited for initial margin, if any, is reflected on the Statement of Assets and Liabilities.
During the period the futures contract is open, changes in the market value of the contract are recognized as an unrealized gain or loss by “marking-to-market” on a daily basis. The Fund and the clearing broker are obligated to settle monies on a daily basis representing the changes in the value of the contracts. These daily cash settlements are known as “variation margin” and is recognized on the Statement of Assets and Liabilities as a receivable or payable for variation margin on futures contracts. When the contract is closed or expired, the Fund records a realized gain or loss equal to the difference between the value of the contract on the closing date and value of the contract when originally entered into. The net realized gain or loss and the change in unrealized appreciation (depreciation) on futures contracts held during the period is included on the Statement of Operations.
Risks of investments in futures contracts include the possible adverse movement in the price of the securities or indices underlying the contracts, the possibility that there may not be a liquid secondary market for the contracts and/or that a change in the value of the contract may not correlate with a change in the value of the underlying securities or indices.
The average notional amount of futures contracts outstanding during the current fiscal period was as follows:
 
Fund
  
Average Notional Amount of Futures
Contracts Outstanding*
JRI
   $8,110,899
 
*
The average notional amount is calculated based on the absolute aggregate notional amount of contracts outstanding at the beginning of the current fiscal period and at the end of each fiscal quarter within the current fiscal period.
Options Transactions:
During the current fiscal period, NMAI purchased and wrote call and put options as part of its overwrite strategy.
The Funds may purchase (buy) or write (sell) put and call options on specific securities (including groups or “baskets” of specific securities), interest rates, stock indices and/or bond indices (each a “financial instrument”). Options can be settled either directly with the counterparty (over the counter) or through a central clearing house (exchange traded). Call and put options give the holder the right, in return for a premium paid, to purchase or sell, respectively, a financial instrument at a specified exercise price at any time during the period of the option.
When a Fund purchases an option, an amount equal to the premium paid (the premium plus commission) is recognized as an asset on the Statement of Asset and Liabilities. When a Fund writes an option, an amount equal to the net premium received (the premium less commission) is recognized as a liability on the Statement of Assets and Liabilities and is subsequently adjusted to reflect the current value of the written option until the option is exercised or expires or the Fund enters into a closing purchase transaction. The changes in the value of options purchased and/or written during the fiscal period are recognized as in unrealized appreciation (depreciation) on the Statement of Operations. When an option expires, the premiums
 
87

Notes to Financial Statements
(continued)
 
received or paid are recognized as realized gains or losses on the Statement of Operations. When an option is exercised or a closing purchase transaction is entered into, the difference between the premium and the amount received or paid in a closing transaction is recognized as a realized gain or loss on the Statement of Operations.
The market risk associated with purchasing options is limited to the premium paid. The Fund, as writer of an option, has no control over whether the underlying instrument may be sold (called) or purchased (put) and as a result bears the risk of an unfavorable change in the market value of the instrument underlying the written option. There is also the risk the Fund may not be able to enter into a closing transaction because of an illiquid market.
The average notional amount of outstanding options purchased during the current fiscal period, was as follows:
 
Fund
  
Average Notional Amount of Purchased
Options Contracts Outstanding*
NMAI
  
$7,000
 
*
The average notional amount is calculated based on the absolute aggregate notional amount of contracts outstanding at the beginning of the current fiscal period and at the end of each fiscal quarter within the current fiscal period.
The average notional amount of outstanding options written during the current fiscal period, was as follows:
 
Fund
  
Average Notional Amount of Written
Options Contracts Outstanding*
NMAI
   $20,300,000
 
*
The average notional amount is calculated based on the absolute aggregate notional amount of contracts outstanding at the beginning of the current fiscal period and at the end of each fiscal quarter within the current fiscal period.
Interest Rate Swap Contracts:
During the current fiscal period, JRI and JRS continued to use interest rate swap contracts to partially hedge its interest cost of leverage, which the Funds employed through the use if bank borrowings.
Interest rate swap contracts involve the Fund’s agreement with the counterparty to pay or receive a fixed rate payment in exchange for the counterparty receiving or paying a variable rate payment. Forward interest rate swap contracts involve the Fund’s agreement with a counterparty to pay, in the future, a fixed or variable rate payment in exchange for the counterparty paying the Fund a variable or fixed rate payment, the accruals for which would begin at a specified date in the future (the “effective date”).
Upon entering into an interest rate swap contract (and beginning on the effective date for a forward interest rate swap contract), the Fund accrues the fixed rate payment expected to be paid or received and the variable rate payment expected to be received or paid on the interest rate swap contracts on a daily basis, and recognizes the daily change in the fair value of the Fund’s contractual rights and obligations under the contracts. The amount of the payment obligation for an interest rate swap is based on the notional amount and the termination date of the contract. Interest rate swap contracts do not involve the delivery of securities or other underlying assets or principal. Accordingly, the risk of loss on such transactions is limited to the net amount of interest payments that the Fund is to receive from the counterparty. Payments paid (received) at the beginning of the measurement period are reflected as swap premiums paid (received) on the Statement of Assets and Liabilities, when applicable. Interest rate swaps can be settled either directly with the counterparty (“OTC”) or through a central clearinghouse (“centrally cleared”). For OTC swaps, the daily change in the market value of the swap contract, along with any daily interest fees accrued, are recognized as unrealized appreciation (depreciation) on interest rate swaps contracts on the Statement of Assets and Liabilities.
Upon the execution of a centrally cleared swap, a Fund is obligated to deposit cash or eligible securities, also known as “initial margin,” into an account at its clearing broker equal to a specified percentage of the contract amount. Securities deposited for initial margin, if any, are identified in the Portfolio of Investments and cash deposited for initial margin, if any, is reflected on the Statement of Assets and Liabilities. The Fund and the clearing broker are obligated to settle monies on a daily basis representing the changes in the value of the swap contracts. These daily cash settlements are known as “variation margin” and is recognized on the Statement of Assets and Liabilities as a receivable or payable for variation margin on interest rate swaps contracts.
Changes in the value of the swap contracts during the fiscal period are recognized as net unrealized appreciation (depreciation) of swaps contracts on the Statement of Operations. The net amount of periodic payments settled in cash are recognized as net realized gain (loss) from swaps on the Statement of Operations, in addition to the net realized gain or loss recorded upon the termination of the swap contract.
The average notional amount of interest rate swap contracts outstanding during the current fiscal period was as follows:
 
Fund
  
Average Notional Amount of Interest Rate
Swap Contracts Outstanding*
JRI
   $67,440,000
JRS
   43,440,000
 
*
The average notional amount is calculated based on the absolute aggregate notional amount of contracts outstanding at the beginning of the current fiscal period and at the end of each fiscal quarter within the current fiscal period.
 
88

As of the end of the current fiscal period, the Funds have invested in derivative contracts which are reflected in the Statement of Assets and Liabilities as follows:
 
             
Asset Derivatives
             
Liability Derivatives
Derivative Instrument     
  
Risk Exposure
       
Location
  
Value
 
    
Location             
  
Value
NMAI
               
Forward Foreign Currency Contracts
  
Foreign currency
exchange rate


-
  
$–
    
Unrealized depreciation on
forward contracts
  
$(1,732)
JRI
                  
Futures Contracts
  
Interest rate


Unrealized appreciation on
futures contracts*
  
18,483
    
-
  
 
*
The fair value presented includes cumulative gain (loss) on open futures contracts; however, the value reflected in the accompanying Statement of Assets and Liabilities is only the receivable or payable for variation margin on open futures contracts.
During the current fiscal period, the effect of derivative contracts on the Funds’ Statements of Operations was as follows:
 
Derivative Instrument
  
Risk Exposure
  
Net Realized Gain
(Loss)
  
Change in
Unrealized
Appreciation
(Depreciation)
NMAI
        
Forward foreign currency contracts
  
Foreign currency exchange rate
  
$(21,494)
  
$(60,225)
Purchased options
  
Equity
  
1,410*
  
1,596*
Written options
  
Equity
  
462,943
  
(115,914)
JRI
        
Futures contracts
  
Interest rate
  
122,842
  
(323,497)
Swap contracts
  
Interest rate
  
1,652,687
  
(1,577,197)
JRS
        
Swap contracts
  
Interest rate
  
1,063,133
  
(1,015,917)
* Shown as a component of Realized gain (loss) from Investments on the Statement of Operations.
Market and Counterparty Credit Risk:
In the normal course of business each Fund may invest in financial instruments and enter into financial transactions where risk of potential loss exists due to changes in the market (market risk) or failure of the other party to the transaction to perform (counterparty credit risk). The potential loss could exceed the value of the financial assets recorded on the financial statements. Financial assets, which potentially expose each Fund to counterparty credit risk, consist principally of cash due from counterparties on forward, option and swap transactions, when applicable. The extent of each Fund’s exposure to counterparty credit risk in respect to these financial assets approximates their carrying value as recorded on the Statement of Assets and Liabilities.
Each Fund helps manage counterparty credit risk by entering into agreements only with counterparties the Adviser believes have the financial resources to honor their obligations and by having the Adviser monitor the financial stability of the counterparties. Additionally, counterparties may be required to pledge collateral daily (based on the daily valuation of the financial asset) on behalf of each Fund with a value approximately equal to the amount of any unrealized gain above a pre-determined threshold. Reciprocally, when each Fund has an unrealized loss, the Funds have instructed the custodian to pledge assets of the Funds as collateral with a value approximately equal to the amount of the unrealized loss above a pre-determined threshold. Collateral pledges are monitored and subsequently adjusted if and when the valuations fluctuate, either up or down, by at least the pre-determined threshold amount.
 
89

Notes to Financial Statements
(continued)
 
6.
Fund Shares
Common Share Transactions:
Transactions in common shares for the Funds during the Funds’ current and prior fiscal period, where applicable, were as follows:
 
    
JRI
 
     
Year Ended
12/31/25
    
Year Ended
12/31/24
 
Common Shares:
     
Issued to shareholders due to reinvestment of distributions
  
 
23,392


Total
  
 
23,392


7.
Income Tax Information
Each Fund is a separate taxpayer for federal income tax purposes. Each Fund intends to distribute substantially all of its net investment income and net capital gains to shareholders and otherwise comply with the requirements of Subchapter M of the Internal Revenue Code applicable to regulated investment companies. Therefore, no federal income tax provision is required.
Each Fund files income tax returns in U.S. federal and applicable state and local jurisdictions. A Fund’s federal income tax returns are generally subject to examination for a period of three fiscal years after being filed. State and local tax returns may be subject to examination for an additional period of time depending on the jurisdiction. Management has analyzed each Fund’s tax positions taken for all open tax years and has concluded that no provision for income tax is required in the Fund’s financial statements.
Differences between amounts for financial statement and federal income tax purposes are primarily due to timing differences in recognizing gains and losses on investment transactions. Temporary differences do not require reclassification. As of year end, permanent differences that resulted in reclassifications among the components of net assets relate primarily to bond premium amortization adjustments, complex securities character adjustments, deemed dividend due to corporate actions, foreign currency transactions, foreign taxes paid, investments in partnerships, investments in passive foreign investment companies, paydowns, return of capital and long-term capital gain distributions received from portfolio investments, and treatment of notional principal contracts. Temporary and permanent differences have no impact on a Fund’s net assets.
As of year end, the aggregate cost and the net unrealized appreciation/(depreciation) of all investments for federal income tax purposes were as follows:
 
Fund
  
Tax Cost
    
Gross Unrealized
Appreciation
    
Gross Unrealized
(Depreciation)
    
Net Unrealized
Appreciation
(Depreciation)
 
NMAI
   $   596,724,777      $   108,200,363      $   (15,902,645)      $   92,297,718  
JRI
     517,478,794        39,417,297        (19,302,223)        20,115,074  
JRS
     311,549,612        61,674,178        (29,634,034)        32,040,144  
For purposes of this disclosure, tax cost generally includes the cost of portfolio investments as well as up-front fees or premiums exchanged on derivatives and any amounts unrealized for income statement reporting but realized income and/or capital gains for tax reporting, if applicable.
As of year end, the components of accumulated earnings on a tax basis were as follows:
 
Fund
  
Undistributed
Ordinary
Income
    
Undistributed
Long-Term
Capital Gains
    
Unrealized
Appreciation
(Depreciation)
    
Capital Loss
Carryforwards
    
Late-Year Loss
Deferrals
    
Other
Book-to-Tax

Differences
    
Total
 
NMAI
   $      $      $ 92,325,152      $ (5,663,112)      $      $      $ 86,662,040  
JRI
                   20,119,979        (186,526,405)                      (166,406,426)  
JRS
                   32,040,143        (316,032)               (36,762)        31,687,349  
The tax character of distributions paid was as follows:
 
           
12/31/25
           
12/31/24
 
Fund
  
Ordinary
Income
    
Long-Term

Capital Gains
    
Return
of Capital
    
Ordinary
Income
    
Long-Term

Capital Gains
    
Return
of Capital
 
NMAI
   $  13,281,245      $      $  29,821,124      $  12,673,637      $      $  42,562,242  
JRI
     22,392,838               21,534,905        18,052,526               21,276,701  
JRS
     6,058,316               13,588,564        7,022,713               12,624,167  
 
90

 
As of year end, the Funds had capital loss carryforwards, which will not expire:
 
Fund
  
Short-Term
    
Long-Term
    
Total
 
NMAI
  
$
  —
 
  
$
  5,663,112
 
  
$
  5,663,112
 
JRI
  
 
52,614,366


133,912,039


186,526,405
 
JRS
  
 
316,032


316,032
 
As of year end, the Funds utilized the following capital loss carryforwards:
 
Fund
  
Utilized
NMAI
   $16,330,789
JRI
   7,553,244
JRS
   7,418,362
The following table presents income taxes paid by the Funds in foreign jurisdictions during the current fiscal period. The Funds did not pay any other income taxes.
 
Fund
  
NMAI
   
JRI
   
JRS
 
Income taxes by foreign jurisdictions:
      
Australia
  
 
3,903


65,799


Belgium
  
 
(4,249
 
 
29,108


Bermuda


13,886


Brazil
  
 
11,102


Canada
  
 
  19,713


  228,000


Chile
  
 
351


    —
 
China
  
 
2,322


Colombia
  
 
701


Denmark
  
 
(13,348


Finland
  
 
6,714


France
  
 
(41,568
 
 
51,588


Germany
  
 
42,887


India
  
 
1,337


Indonesia
  
 
11,811


Italy
  
 
8,230


110,131


Japan
  
 
35,983


58,509


Mexico
  
 
26,838


67,153


Netherlands
  
 
28,208


14,030


New Zealand
  
 
2,727


1,842


Philippines
  
 
2,119


Portugal


(19,071


Singapore
  
 
121


23,412


South Africa
  
 
(159


South Korea
  
 
15,393


Spain
  
 
39,495


28,528


Sweden


16,781


Switzerland
  
 
27,283


Taiwan
  
 
19,140


Uganda
  
 
1,343


United Kingdom


78,998


Total income taxes paid, net of refunds
  
$
248,397
 
 
$
768,694
 
 
$


8.
Management Fees and Other Transactions with Affiliates
Management Fees:
Each Fund’s management fee compensates the Adviser for overall investment advisory and administrative services and general office facilities. The Sub-Advisers are compensated for their services to the Fund from the management fees paid to the advisor.
Each Fund’s management fee consists of two components – a fund-level fee, based only on the amount of assets within each individual Fund, and a complex-level fee, based on the aggregate amount of all eligible fund assets managed by the Adviser. This pricing structure enables Fund
 
91

Notes to Financial Statements
(continued)
 
shareholders to benefit from growth in the assets within their respective Fund as well as from growth in the amount of complex-wide assets managed by the Adviser.
The annual fund-level fee, payable monthly, for each Fund is calculated according to the following schedule:
 
Average Daily Managed Assets*
  
NMAI
Fund-Level
Fee Rate
   
JRI
Fund-Level
Fee Rate
   
JRS
Fund-Level
Fee Rate


For the first $500 million
  
 
0.7000
 
 
0.8000
 
 
0.7000
For the next $500 million
  
 
0.6750


0.7750


0.6750
 
For the next $500 million
  
 
0.6500


0.7500


0.6500
 
For the next $500 million
  
 
0.6250


0.7250


0.6250
 
For managed assets over $2 billion
  
 
0.6000


0.7000


0.6000


The annual complex-level fee, payable monthly, for each Fund is calculated according to the following schedule:
 
Complex-Level Asset Breakpoint Level*
  
Complex-Level Fee


For the first $124.3 billion
  
 
0.1600
For the next $75.7 billion
  
 
0.1350
 
For the next $200 billion
  
 
0.1325
 
For eligible assets over $400 billion
  
 
0.1300


*
The complex-level fee is calculated based upon the aggregate daily “eligible assets” of all Nuveen-branded closed-end funds and Nuveen branded open-end funds (“Nuveen Mutual Funds”). Except as described below, eligible assets include the assets of all Nuveen-branded closed-end funds and Nuveen Mutual Funds organized in the United States. Eligible assets do not include the net assets of: Nuveen fund-of-funds, Nuveen money market funds, Nuveen index funds, Nuveen Large Cap Responsible Equity Fund or Nuveen Life Large Cap Responsible Equity Fund. In addition, eligible assets include a fixed percentage of the aggregate net assets of the active equity and fixed income Nuveen Mutual Funds advised by the Adviser’s affiliate, Teachers Advisors, LLC (except those identified above). The fixed percentage will increase annually until May 1, 2033, at which time eligible assets will include all of the aggregate net assets of the active equity and fixed income Nuveen Mutual Funds advised by Teachers Advisors, LLC (except those identified above). Eligible assets include closed-end fund assets managed by the Adviser that are attributable to financial leverage. For these purposes, financial leverage includes the closed-end funds’ use of preferred stock and borrowings and certain investments in the residual interest certificates (also called inverse floating rate securities) in tender option bond (TOB) trusts, including the portion of assets held by a TOB trust that has been effectively financed by the trust’s issuance of floating rate securities, subject to an agreement by the Adviser as to certain funds to limit the amount of such assets for determining eligible assets in certain circumstances.
As of the end of the current fiscal period, the annual complex-level fee for each Fund was as follows:
 
Fund
  
Complex-Level Fee


NMAI
  
 
0.1560
JRI
  
 
0.1560
 
JRS
  
 
0.1560


Other Transactions with Affiliates:
The Funds receive voluntary compensation from the Adviser in amounts that approximate the cost of research services obtained from broker-dealers and research providers if the Adviser had purchased the research services directly. This income received by the Funds is recognized in “Affiliated income” on the Statement of Operations and any amounts due to the Funds at the end of the current fiscal period is recognized in “Reimbursement from Adviser” on the Statement of Assets and Liabilities. During the current fiscal period, the values of voluntary compensation were as follows:
 
Fund
  
Value


NMAI
  
$
60,834
 
JRI
  
 
386,660
 
JRS


The Funds are permitted to purchase or sell securities from or to certain other funds or accounts managed by the Sub-Adviser or by an affiliate of the Adviser (each an, “Affiliated Entity”) under specified conditions outlined in procedures adopted by the Board (“cross-trade”). These procedures have been designed to ensure that any cross-trade of securities by the Fund from or to an Affiliated Entity by virtue of having a common investment adviser (or affiliated investment adviser), common officer and/or common trustee complies with Rule 17a-7 under the 1940 Act. These transactions are effected at the current market price (as provided by an independent pricing service) without incurring broker commissions. During the current fiscal period, the Funds engaged in the following security transactions with affiliated entities:
 
92

 
Fund
  
Purchases
    
Sales
    
Realized
Gain (Loss)


NMAI
  
$
   21,825,347
 
  
$
   219,209


$   (45,397
JRI


JRS


9.
Fund Leverage
Borrowings:
Each Fund entered into a borrowing arrangement (“Borrowings”) as a means of leverage. As of the end of the current fiscal period, each Fund’s maximum commitment amount under these Borrowings is as follows:
 
Fund
  
Commitment
Amount


NMAI
  
$
   215,000,000
 
JRI
  
 
200,000,000
 
JRS
  
 
150,000,000


As of the end of the current fiscal period, each Fund’s outstanding balance on its Borrowings was as follows:
 
Fund
  
Outstanding
balance
on Borrowings


NMAI
  
$
   174,786,000
 
JRI
  
 
170,945,000
 
JRS
  
 
102,400,000


For NMAI interest is charged on the Borrowings at a rate per annum equal to OBFR (Overnight Bank Funding Rate) plus a spread that is determined by a portion of the underlying collateral pledged to secure the amount borrowed. The Fund is charged an undrawn fee of 0.50% per annum if the undrawn portion of the Borrowings on that day is more than 20% of the maximum commitment amount, however this fee was waived during the current fiscal period.
For JRI interest is charged on these Borrowings at Daily SOFR plus 0.600% per annum on the amounts borrowed. For JRS interest is charged on these Borrowings at 1-Month Term SOFR plus 0.610% per annum on the amounts borrowed.
During the current fiscal period, the average daily balance outstanding and average annual interest rate on each Fund’s Borrowings were as follows:
 
Fund
  
Utilization
Period (Days
Outstanding)
    
Average Daily Balance
Outstanding
    
Average Annual
Interest Rate


NMAI
  
 
365
 
  
$
   148,105,452


4.77
JRI
  
 
365


173,136,781


4.94
 
JRS
  
 
365


105,057,534


4.89


Other Borrowings Information for the Funds:
In order to maintain these Borrowings, the Funds must meet certain collateral, asset coverage and other requirements. Borrowings outstanding are fully secured by eligible securities held in each Fund’s portfolio of investments.
Borrowings outstanding are recognized as “Borrowings” on the Statement of Assets and Liabilities. Interest expense and other fees incurred on the drawn amount and undrawn balance are recognized as a component of “Interest expense” on the Statement of Operations.
Rehypothecation:
NMAI has entered into a Rehypothecation Side Letter (“Side Letter”) with its prime brokerage lender, allowing it to re-register the Pledged Collateral in its own name or in a name other than the Fund to pledge, repledge, hypothecate, rehypothecate, sell, lend or otherwise transfer or use the Pledged Collateral (the “Hypothecated Securities”) with all rights of ownership as described in the Side Letter. Subject to certain conditions, the total value of the outstanding Hypothecated Securities shall not exceed the lesser of (i) 98% of the outstanding balance on the Borrowings to which the Pledged Collateral relates and (ii) 33 1/3 % of the Fund total assets. The Fund may designate any Pledged Collateral as ineligible for rehypothecation. The Fund may also recall Hypothecated Securities on demand.
 
93

Notes to Financial Statements
(continued)
 
The Fund also has the right to apply and set-off an amount equal to one-hundred percent (100%) of the then-current fair market value of such Pledged Collateral against the current Borrowings under the Side Letter in the event that the prime brokerage lender fails to timely return the Pledged Collateral and in certain other circumstances. In such circumstances, however, the Fund may not be able to obtain replacement financing required to purchase replacement securities and, consequently, the Fund income generating potential may decrease. Even if the Fund is able to obtain replacement financing, it might not be able to purchase replacement securities at favorable prices.
The Fund will receive a fee in connection with the Hypothecated Securities (“Rehypothecation Fees”) in addition to any principal, interest, dividends and other distributions paid on the Hypothecated Securities.
As of the end of the current fiscal period, NMAI had Hypothecated Securities as follows:
 
    
NMAI


Hypothecated Securities
  
$
153,946,639


NMAI earns Rehypothecation Fees, which are recognized as “Rehypothecation income” on the Statement of Operations. During the current fiscal period, the Rehypothecation Fees earned by NMAI was as follows:
 
    
NMAI


Rehypothecation Fees
  
$
48,092


Reverse Repurchase Agreements:
During the current fiscal period, NMAI utilized reverse repurchase agreements as a means of leverage.
Each Fund may enter into a reverse repurchase agreement with brokers, dealers, banks or other financial institutions that have been determined by the Adviser to be creditworthy. In a reverse repurchase agreement, the Fund sells to the counterparty a security that it holds with a contemporaneous agreement to repurchase the same security at an agreed-upon price and date, reflecting the interest rate effective for the term of the agreement. It may also be viewed as the borrowing of money by the Fund. Cash received in exchange for securities delivered, plus accrued interest payments to be made by the Fund to a counterparty, are reflected as a liability on the Statement of Assets and Liabilities. Interest payments made by the Fund to counterparties are recognized as a component of “Interest expense” on the Statement of Operations.
In a reverse repurchase agreement, the Fund retains the risk of loss associated with the sold security. Reverse repurchase agreements also involve the risk that the purchaser fails to return the securities as agreed upon, files for bankruptcy or becomes insolvent. Upon a bankruptcy or insolvency of a counterparty, the Fund is considered to be an unsecured creditor with respect to excess collateral and as such the return of excess collateral may be delayed.
As of the end of the current fiscal period, the Fund’s outstanding balances on its reverse repurchase agreements were as follows:
 
Fund
  
Counterparty
  
Rate
   
Principal
Amount
   
Maturity
    
Value
   
Value and Accrued
Interest


NMAI
  
BNP Paribas SA
  
 
4.18
 
$
(21,225,000


35-day

Evergreen


$
(21,225,000
 
$
(21,367,603
 
 
NMAI
  
Royal Bank of Canada
  
 
4.05
 
 
(13,753,000
 
 
On-Demand


(13,753,000
 
 
(13,754,547
 
 
Total
       
$
(34,978,000
    
$
(34,978,000
 
$
(35,122,150
 
 
During the current fiscal period, the average daily balance outstanding and average annual interest rate on the Funds’ reverse repurchase agreements were as follows:
 
Fund
  
Utilization
Period (Days
Outstanding)
    
Average
Daily
Balance
Outstanding
   
Weighted
Average
Interest rate


NMAI
  
 
365
 
  
$
(45,941,642
 
 
4.13


94

 
The following table presents the reverse repurchase agreements subject to netting agreements and the collateral delivered related to those reverse repurchase agreements.
 
Fund
  
Counterparty
  
Reverse
Repurchase
Agreements*
   
Collateral
Pledged
to Counterparty


NMAI
  
BNP Paribas SA
  
 
$   (21,367,603)
 
 
$
   23,252,704


NMAI
  
RBC Capital Markets, LLC
  
 
(13,754,547
 
 
14,549,943


Total
     
 
(35,122,150
 
 
37,802,647


* Represents gross value and accrued interest for the counterparty as reported in the preceding table.
Inter-Fund Lending Program:
The SEC has granted an exemptive order permitting registered open-end and closed-end Nuveen funds to participate in an inter-fund lending facility whereby the Nuveen funds may directly lend to and borrow money from each other for temporary purposes (e.g., to satisfy redemption requests or when a sale of securities “fails,” resulting in an unanticipated cash shortfall) (the “Inter-Fund Program”). The closed-end Nuveen funds, including the Funds covered by this shareholder report, will participate only as lenders, and not as borrowers, in the Inter-Fund Program because such closed-end funds rarely, if ever, need to borrow cash to meet redemptions. The Inter-Fund Program is subject to a number of conditions, including, among other things, the requirements that (1) no fund may borrow or lend money through the Inter-Fund Program unless it receives a more favorable interest rate than is typically available from a bank or other financial institution for a comparable transaction; (2) no fund may borrow on an unsecured basis through the Inter-Fund Program unless the fund’s outstanding borrowings from all sources immediately after the inter-fund borrowing total 10% or less of its total assets; provided that if the borrowing fund has a secured borrowing outstanding from any other lender, including but not limited to another fund, the inter-fund loan must be secured on at least an equal priority basis with at least an equivalent percentage of collateral to loan value; (3) if a fund’s total outstanding borrowings immediately after an inter-fund borrowing would be greater than 10% of its total assets, the fund may borrow through the inter-fund loan on a secured basis only; (4) no fund may lend money if the loan would cause its aggregate outstanding loans through the Inter-Fund Program to exceed 15% of its net assets at the time of the loan; (5) a fund’s inter-fund loans to any one fund shall not exceed 5% of the lending fund’s net assets; (6) the duration of inter-fund loans will be limited to the time required to receive payment for securities sold, but in no event more than seven days; and (7) each inter-fund loan may be called on one business day’s notice by a lending fund and may be repaid on any day by a borrowing fund. In addition, a Nuveen fund may participate in the Inter-Fund Program only if and to the extent that such participation is consistent with the fund’s investment objective and investment policies. The Board is responsible for overseeing the Inter-Fund Program.
The limitations detailed above and the other conditions of the SEC exemptive order permitting the Inter-Fund Program are designed to minimize the risks associated with Inter-Fund Program for both the lending fund and the borrowing fund. However, no borrowing or lending activity is without risk. When a fund borrows money from another fund, there is a risk that the loan could be called on one day’s notice or not renewed, in which case the fund may have to borrow from a bank at a higher rate or take other actions to payoff such loan if an inter-fund loan is not available from another fund. Any delay in repayment to a lending fund could result in a lost investment opportunity or additional borrowing costs.
During the current fiscal period, none of the Funds covered by this shareholder report have entered into any inter-fund loan activity.
10. Subsequent Events
JRI – Rights Offering:
On January 15, 2026, the Board approved the terms of the issuance of Rights to the holders of the Fund’s Common Shares as of February 6, 2026 (the “Record Date”). Holders of Rights will be entitled to subscribe for additional Common shares (the “Offer”) at a discount to the market price of the Common Shares.
After considering a number of factors, including potential benefits and costs, the Board and the Adviser, determined that the Offer will benefit both the Fund and its common shareholders and increase the assets of the Fund available to take advantage of existing investment opportunities, consistent with the Fund’s investment objective of providing shareholders with a high level of current income and long-term capital appreciation.
Certain key terms of the Offer include:
• Holders of Common Shares on the Record Date (“Record Date Shareholders”) will receive one Right for each outstanding Common Share owned on the Record Date. The Rights entitle the holders to purchase one new Common Share for every four Rights held (1-for-4).
• The subscription price per Common Share (the “Subscription Price”) will be determined based upon a formula equal to 95% of the average of the last reported sales price of the Common Shares on the NYSE on the Expiration Date and each of the four preceding trading days (the “Formula Price”). If, however, the Formula Price is less than 90% of the net asset value per Common Share at the close of trading on the NYSE on the Expiration Date, then the Subscription Price will be 90% of the Fund’s net asset value per Common Share at the close of trading on the NYSE on the Expiration Date. The Rights offering will expire at 5:00 p.m., Eastern time, on March 9, 2026 (the “Expiration Date”).
• Record Date Shareholders who fully exercise all Rights issued to them can subscribe, subject to certain limitations and allotment, for any additional Common Shares which were not subscribed for by other holders of Rights at the Subscription Price, subject to the right of the Board to eliminate this over-subscription privilege. Investors who are not Record Date Shareholders but who otherwise acquire Rights in the secondary market are not entitled to participate in the over-subscription privilege. If these requests exceed available Common Shares, they will be allocated pro rata among those fully exercising Record Date Shareholders who over-subscribe based on the number of Rights originally issued to them by the Fund.
 
95

Notes to Financial Statements
(continued)
 
• Rights are transferable and were admitted for trading on the NYSE under the symbol “JRI RTWI” initially trading “when-issued” on February 5, 2026. The Rights then began trading with regular settlement under the symbol “JRI RT” on February 10, 2026, and will cease trading at the close on March 6, 2026, one day before the Offer’s Expiration Date. During this time, Record Date Shareholders may also choose to sell their Rights.
More details about the Fund’s rights offering are available on www.nuveen.com/cef.
 
96

Shareholder Update
(Unaudited)
 
CURRENT INVESTMENT OBJECTIVES, INVESTMENT POLICIES AND PRINCIPAL RISKS OF THE FUND
NUVEEN MULTI-ASSET INCOME FUND (NMAI)
Investment Objective
The Fund’s investment objective is to provide total return through high current income and capital appreciation.
Investment Policies
Under normal circumstances, the Fund will dynamically invest in a portfolio of equity and debt securities of issuers located around the world. This dynamic investment strategy uses a risk-based framework in which any amount can be allocated to an asset-class at any time. The Fund may invest in equity and debt securities of any type. The Fund may use derivatives for a variety of reasons, including but not limited to, adjusting its exposures to markets, sectors, asset classes and securities, and may utilize derivatives of any type.
As part of its investment strategy, the Fund may employ an options strategy whereby the Fund sells (writes) call options on a percentage of the market value of the Fund’s equity portfolio. The Fund is not required to allocate its investments among asset classes, issuer jurisdiction, or any other investment parameter in any fixed proportion except as specifically described herein.
The Fund will employ a dynamic asset allocation strategy in seeking to achieve the Fund’s investment objective. Nuveen Asset Management, LLC (“Nuveen Asset Management”) will implement the Fund’s dynamic multi-asset income strategy by allocating the Fund’s assets among equity and debt investments.
The relative allocations of the Fund’s Managed Assets (as defined below) for investment between equity and debt securities, and relative allocations to the different types of equity and income strategies, will vary from time to time consistent with the Fund’s investment objective.
Under normal market conditions:
 
   
The Fund may invest in equity securities of any type and across various investment styles (e.g., growth- or value-oriented styles), sectors, market capitalizations (e.g., large-, mid-, and small-cap) and geographic regions throughout the world (including the United States (“U.S.”), non-U.S. developed markets, and emerging markets) without limit.
 
   
The Fund may invest in debt securities of any type without limit. The Fund may invest in debt securities paying a fixed or fluctuating rate of interest, and with any maturity or duration. The Fund may invest in debt securities across various geographic regions throughout the world (including the U.S., non-U.S. developed markets, and emerging markets) without limit.
 
   
The Fund may invest in debt securities of any rating (including below-investment-grade debt securities, commonly known as “high yield” or “junk” bonds), distressed securities, and in debt securities that are unrated.
 
   
The Acquiring Fund may invest in the securities of companies of any market capitalization.
 
   
The Fund may invest in illiquid securities (i.e., securities that are not readily marketable), including, but not limited to, restricted securities (securities the disposition of which is restricted under the federal securities laws), securities that may be resold only pursuant to Rule 144A under the Securities Act of 1933 Act, as amended (the “1933 Act”), and repurchase agreements with maturities in excess of seven days.
 
   
The Fund may invest in inverse floating rate securities.
The foregoing policies apply only at the time of any new investment.
“Managed Assets” mean the total assets of the Fund, minus the sum of its accrued liabilities (other than Fund liabilities incurred for the express purpose of creating leverage). Total assets for this purpose shall include assets attributable to the Fund’s use of leverage (whether or not those assets are reflected in the Fund’s financial statements for purposes of generally accepted accounting principles), and derivatives will be valued at their market value.
Approving Changes in Investment Policies
The Board of Trustees of the Fund may change the policies described above without a shareholder vote.
Portfolio Contents
The Fund may invest in equity securities of any type and across various investment styles (e.g., growth- or value-oriented styles), sectors, market capitalizations (e.g., large-, mid-, and small-cap) and geographic regions throughout the world (including the U.S. and emerging markets) without limit. These securities may include, but are not limited to, common stock, preferred stock, securities convertible into common, depositary receipts, stock, master-limited partnership (“MLPs”) and other partnership interests, real estate investment trusts (“REITs”), rights and warrants, or securities or other instruments whose price is linked to (or derived from) the value of common stock.
 
97

Shareholder Update
(continued)
 
Common stocks generally represent an ownership interest in an issuer, without preference over any other class of securities, including such issuer’s debt securities, preferred stock and other senior equity securities. Common stocks are entitled to the income and increase in the value of the assets and business of the issuer after all its debt obligations and obligations to preferred stockholders are satisfied. Common stocks generally have voting rights. Common stocks fluctuate in price in response to many factors, including historical and prospective earnings of the issuer, the value of its assets, general economic conditions, interest rates, investor perceptions and market liquidity.
Equity securities in which the Fund may invest include MLPs. An MLP is an entity, most commonly a limited partnership, that is taxed as a partnership, publicly traded and listed on a national securities exchange. Holders of common units of MLPs typically have limited control and limited voting rights as compared to holders of a corporation’s common shares.
The Fund may invest in all types of preferred securities, including both traditional preferred securities and non-traditional preferred securities. Traditional preferred securities are generally equity securities of the issuer that have priority over the issuer’s common shares as to the payment of dividends (i.e., the issuer cannot pay dividends on its common shares until the dividends on the preferred shares are current) and as to the payout of proceeds of a bankruptcy or other liquidation, but are subordinate to an issuer’s senior debt and junior debt as to both types of payments. Additionally, in a bankruptcy or other liquidation, traditional preferred securities are generally subordinate to an issuer’s trade creditors and other general obligations. Traditional preferred securities may be perpetual or have a term, and typically have a fixed liquidation (or “par”) value.
The Fund may invest in contingent capital securities (sometimes referred to as “CoCos”). CoCos are hybrid securities, issued primarily by non-U.S. financial institutions, which have loss absorption mechanisms benefitting the issuer built into their terms. CoCos generally provide for mandatory conversion into the common stock of the issuer or a write-down of the principal amount or value of the CoCos upon the occurrence of certain triggers linked to regulatory capital thresholds. In addition, they may provide for mandatory conversion or a principal write-down upon the occurrence of certain events such as regulatory actions calling into question the issuing banking institution’s continued viability as a going-concern. Equity conversion or principal write-down features are tailored to the issuer and its regulatory requirements and, unlike traditional convertible securities, conversions are not voluntary.
The Fund may invest in REITs. REITs are publicly traded corporations or trusts that specialize in acquiring, holding, and managing residential, commercial or industrial real estate. A REIT is not taxed at the entity level on income distributed to its shareholders or unitholders if it distributes to shareholders or unitholders at least 90% of its taxable income for each taxable year and complies with regulatory requirements relating to its organization, ownership, assets and income.
The Fund may invest in equity securities of special purpose acquisition companies (“SPACs”). Also known as a “blank check company,” a SPAC is a company with no commercial operations that is formed solely to raise capital from investors for the purpose of acquiring one or more existing private companies. SPACs often have pre-determined time frames to make an acquisition (typically two years), or the SPAC will liquidate.
The Fund may invest in debt securities of any type without limit, including but not limited to debt securities of the U.S. government and other governments throughout the world (including emerging markets) as well as their agencies and instrumentalities and government-sponsored enterprises, municipal securities, domestic and foreign corporate debt obligations, convertible bonds, municipal bonds, structured notes, credit-linked notes, loan assignments and participations, repurchase agreements, residential and commercial mortgage-backed securities, asset-backed securities, debt obligations of MLPs, and securities issued or guaranteed by certain international organizations such as the World Bank.
The Fund may invest in zero coupon bonds. A zero coupon bond is a bond that typically does not pay interest for the entire life of the obligation or for an initial period after the issuance of the obligation.
The Fund may invest in payment-in-kind securities (“PIKs”). PIKs pay dividends or interest in the form of additional securities of the issuer, rather than in cash. Each of these instruments is typically issued and traded at a deep discount from its face amount. The amount of the discount varies depending on such factors as the time remaining until maturity of the securities, prevailing interest rates, the liquidity of the security and the perceived credit quality of the issuer.
The debt obligations in which the Fund may invest may have variable, floating, or fixed interest rates. Variable rate securities provide for periodic adjustments in the interest rate. Floating rate securities are generally offered at an initial interest rate which is at or above prevailing market rates. The interest rate paid on floating rate securities is then reset periodically (commonly every 90 days) to an increment over some predetermined interest rate index. Commonly utilized indices include the three-month Treasury bill rate, the 180-day Treasury bill rate, the prime rate of a bank, the commercial paper rates, or the longer-term rates on U.S. Treasury securities. Variable and floating rate securities are relatively long-term instruments that often carry demand features permitting the holder to demand payment of principal at any time or at specified intervals prior to maturity plus accrued interest. In order to most effectively use these securities, the Fund must correctly assess probable movements in interest rates.
The Fund may invest in debt securities paying a fixed or fluctuating rate of interest, including senior loans and secured and unsecured junior loans, and with any maturity or duration.
The Fund may invest in debt securities across various geographic regions throughout the world (including the U.S., non-U.S. developed markets, and emerging markets) without limit.
The Fund may invest in foreign securities payable in either U.S. dollars or foreign currencies. These securities may include securities issued or guaranteed by (i) the Government of Canada, any Canadian Province or any instrumentality and political subdivision thereof; (ii) any other foreign government agency or instrumentality; (iii) foreign subsidiaries of U.S. corporations; and (iv) other foreign issuers.
 
98

 
The Fund has no geographic limits on where it may invest, and therefore may invest in the securities of corporate and governmental issuers in both developed and emerging markets around the world. The Fund may emphasize foreign securities when the Fund’s applicable sub-adviser expects these investments to outperform U.S. securities. In addition to investing in foreign securities, the Fund may actively manage its exposure to foreign currencies through the use of forward currency contracts and other currency derivatives.
The Fund will classify an issuer of a security as being a U.S. or non-U.S. issuer based on the determination of an unaffiliated, recognized financial data provider. Such determinations are based on a number of criteria, such as the issuer’s country of domicile, the primary exchange on which the security predominately trades, the location from which the majority of the issuer’s revenue comes, and the issuer’s reporting currency. Furthermore, a country is considered to be an “emerging market” if it has a relatively low gross national product per capita compared to the world’s major economies and the potential for rapid economic growth. The Fund considers a country an emerging market country based on the determination of an international organization, such as the International Monetary Fund (“IMF”), or an unaffiliated, recognized financial data provider.
The Fund may invest in debt securities of any rating (including below-investment-grade debt securities, commonly known as “high yield” or “junk” bonds), distressed securities, and in debt securities that are unrated. The Fund may invest in junk bonds and distressed securities when the Fund’s applicable sub-adviser believes that they will provide an attractive total return, relative to their risk, as compared to higher quality debt securities. The Fund may invest in distressed securities when the Fund’s applicable sub-adviser believes they offer significant potential for higher returns or can be exchanged for other securities that offer this potential.
The Fund may invest in debt securities of governmental issuers in all countries, including emerging market countries. These debt securities may include: debt securities issued or guaranteed by governments and governmental agencies or instrumentalities; debt securities issued by government owned, controlled or sponsored entities; interests in entities organized and operated for the purpose of restructuring the investment characteristics of instruments issued by any of the above issuers; Brady Bonds, which are debt securities issued under the framework of the Brady Plan as a means for debtor nations to restructure their outstanding external indebtedness; participations in loans between governments and financial institutions; or debt securities issued by supranational entities such as the World Bank or the European Economic Community. A supranational entity is a bank, commission or company established or financially supported by the national governments of one or more countries to promote reconstruction or development.
The Fund may invest in U.S. dollar-denominated “Brady Bonds.” Brady Bonds are created through the exchange of existing commercial bank loans to public and private entities in certain emerging markets for new obligations in connection with debt restructurings. These foreign debt obligations, which may be fixed rate par bonds or floating rate discount bonds, are generally collateralized in full as to repayment of principal at maturity by U.S. Treasury zero-coupon obligations that have the same maturity as the Brady Bonds. Brady Bonds can be viewed as having three or four valuation components: (i) the collateralized repayment of principal at final maturity; (ii) the collateralized interest payments; (iii) the uncollateralized interest payments; and (iv) any uncollateralized repayment of principal at maturity.
The Fund may invest in convertible securities, which may include convertible debt, convertible preferred stock, synthetic convertible securities and may also include secured and unsecured debt, based upon the judgment of the Fund’s applicable sub-adviser. Convertible securities may pay interest or dividends that are based on a fixed or floating rate. A convertible security is a preferred stock, warrant or other security that may be converted into or exchanged for a prescribed amount of common stock or other security of the same or a different issuer or into cash within a particular period of time at a specified price or formula.
The Fund may invest in corporate debt securities. Corporate debt securities are bonds, senior loans and notes issued by corporations or other business entities.
Corporate debt securities are fully taxable debt obligations that fund capital improvements, expansions, debt refinancing or acquisitions that require more capital than would ordinarily be available from a single lender. Investors in corporate debt securities lend money to the issuing corporation in exchange for interest payments and repayment of the principal at a set maturity date. Rates on corporate debt securities are set according to prevailing interest rates at the time of the issue, the credit rating of the issuer, the length of the maturity and other terms of the security, such as a call feature. Corporate debt securities are subject to the risk of an issuer’s inability to meet principal and interest payments on the obligations and may also be subject to price volatility due to such factors as market interest rates, market perception of the creditworthiness of the issuer and general market liquidity. In addition, corporate restructurings, such as mergers, leveraged buyouts, takeovers or similar corporate transactions are often financed by an increase in a corporate issuer’s debt securities. As a result of the added debt burden, the credit quality and market value of an issuer’s existing debt securities may decline significantly.
The Fund may invest in exchange-traded notes (“ETNs”). ETNs are a type of senior, unsecured, unsubordinated debt security issued by financial institutions that combine aspects of both bonds and exchange-traded fund (“ETFs”). An ETN’s returns are based on the performance of a market index minus fees and expenses. Similar to ETFs, ETNs are listed on an exchange and traded in the secondary market. However, unlike an ETF, an ETN has a maturity date, at which time the issuer will pay a return linked to the performance of the market index to which the ETN is linked minus certain fees.
The Fund may invest in the securities of companies of any market capitalization. The Fund will generally seek diversification across markets and industries.
The Fund may invest in senior loans. Senior loans typically hold the most senior position in the capital structure of a business entity, are typically secured with specific collateral and have a claim on the assets and/or stock of the issuer that is senior to that held by subordinated debt holders and stockholders of the issuer.
Senior loans generally include: (i) senior loans made by banks or other financial institutions to U.S. and non-U.S. corporations, partnerships and other business entities (each a “Borrower” and, collectively, “Borrowers”), (ii) assignments of such interests in senior loans, or (iii) participation interests in senior loans. Generally, an assignment is the actual sale of the loan, in whole or in part. A participation, on the other hand, means that the original
 
99

Shareholder Update
(continued)
 
lender maintains ownership over the loan and the participant has only a contract right against the original lender, not a credit relationship with the Borrower. Senior loans typically hold the most senior position in the capital structure of a Borrower, are typically secured with specific collateral and have a claim on the assets and/or stock of the Borrower that is senior to that held by subordinated debt holders and stockholders of the Borrower. The capital structure of a Borrower may include senior loans, senior and junior subordinated debt, preferred stock and common stock issued by the Borrower, typically in descending order of seniority with respect to claims on the Borrower’s assets. The proceeds of senior loans primarily are used by Borrowers to finance leveraged buyouts, recapitalizations, mergers, acquisitions, stock repurchases, refinancings, internal growth and for other corporate purposes. A senior loan is typically originated, negotiated and structured by a U.S. or non-U.S. commercial bank, insurance company, finance company or other financial institution (“Agent”) for a lending syndicate of financial institutions which typically includes the Agent (“Lenders”). The Agent typically administers and enforces the senior loan on behalf of the other Lenders in the syndicate. In addition, an institution, typically but not always the Agent, holds any collateral on behalf of the Lenders. The Fund normally will rely primarily on the Agent to collect principal of and interest on a senior loan. Also, the Fund usually will rely on the Agent to monitor compliance by the Borrower with the restrictive covenants in a loan agreement.
Senior loans typically have rates of interest that are redetermined either daily, monthly, quarterly or semi-annually by reference to a base lending rate plus a premium or credit spread. These base lending rates are primarily the prime rate offered by one or more major U.S. banks and the certificate of deposit rate or other base lending rates used by commercial lenders. The base rate for senior loans are generally based on the Secured Overnight Financing Rate (“SOFR”), a U.S. bank’s prime or base rate, the overnight federal funds rate or another rate. As adjustable rate loans, the frequency of how often a senior loan resets its interest rate will impact how closely such senior loans track current market interest rates.
The Fund may purchase participation interests in the original syndicate making senior loans. Loan participation interests typically represent direct participations in a loan to a corporate Borrower, and generally are offered by banks or other financial institutions or lending syndicates. The Fund may participate in such syndications, or can buy part of a senior loan, becoming a Lender. When purchasing a participation interest, the Fund assumes the credit risk associated with the corporate Borrower and may assume the credit risk associated with an interposed bank or other financial intermediary. The participation interests in which the Fund may invest may not be rated by any nationally recognized statistical rating organization.
The Fund may invest in second lien loans and unsecured loans. Such loans are made by public and private corporations and other non-governmental Borrowers for a variety of purposes. As in the case of senior loans, the Fund may purchase interests in second lien loans and unsecured loans through assignments or participations. Second lien loans have similar characteristics as senior loans except that such interests are junior in priority to debt secured with a first lien. Second lien loans are second in priority of payment to one or more senior loans of the related Borrower and are typically secured by a second priority security interest or lien to or on specified collateral securing the Borrower’s obligation under the indebtedness. They typically have similar protections and rights as senior loans. Second lien loans are not (and by their terms cannot become) subordinate in priority of payment to any obligation of the related Borrower other than senior loans of such Borrower. Second lien loans may feature fixed or floating rate interest payments. Because second lien loans are junior to senior loans, they present a greater degree of investment risk but often pay interest at higher rates reflecting this additional risk. In addition, second lien loans of below investment grade quality share many of the risk characteristics of other below investment grade debt instruments.
Unsecured loans generally have lower priority in right of payment compared to holders of secured interests of the Borrower. Unsecured loans are not secured by a security interest or lien to or on specified collateral securing the Borrower’s obligation under the indebtedness. Unsecured loans by their terms may be or may become subordinate in right of payment to other obligations of the Borrower, including senior loans, second lien loans and other interests. Unsecured loans may have fixed or adjustable floating rate interest payments. Because unsecured loans are subordinate to senior loans and other secured debt of the Borrower, they present a greater degree of investment risk but often pay interest at higher rates reflecting this additional risk. Such investments generally are of below investment grade quality. Unsecured loans of below investment grade quality share many of the same risks of other below investment grade debt instruments.
The Fund may invest in subordinated loans that are primarily unsecured and that provide for relatively high, adjustable rates of interest, providing the Fund with significant current interest income. The subordinated loans in which the Fund may invest may have interest-only payments in the early years, with amortization of principal deferred to the later years of the subordinated loans. In some cases, the Fund may acquire subordinated loans that, by their terms, convert into equity or additional debt instruments or defer payments of interest for the first few years after issuance. Also, in some cases the subordinated loans in which the Fund may invest will be collateralized by a subordinated lien on some or all of the assets of the Borrower.
The Fund may invest in asset-backed securities (“ABS”). ABS are securities that are secured or “backed” by pools of various types of assets on which cash payments are due at fixed intervals over set periods of time. ABS are created in a process called securitization.
In a securitization transaction, an originator of loans or an owner of accounts receivables of a certain type of asset class sells such underlying assets in a “true sale” to a special purpose entity, so that there is no recourse to such originator or owner. Payments of principal and interest on asset-backed securities typically are tied to payments made on the pool of underlying assets in the related securitization. Such payments on the underlying assets are effectively “passed through” to the asset-backed security holders on a monthly or other regular, periodic basis. The level of seniority of a particular asset-backed security will determine the priority in which the holder of such asset-backed security is paid, relative to other security holders and parties in such securitization.
The Fund may invest in mortgage-backed securities (“MBS”). MBS are structured debt obligations collateralized by pools of commercial or residential mortgages. Pools of mortgage loans and mortgage-related loans, such as mezzanine loans, are assembled into pools of assets that secure or back securities sold to investors by various governmental, government-related and private organizations. MBS in which the Fund may invest include those with fixed, floating or variable interest rates, those with interest rates that change based on a specified index of interest rates and those with interest rates that change inversely to changes in interest rates, as well as those that do not bear interest.
 
100

 
The Fund may invest in residential mortgage-backed securities (“RMBS”). RMBS are securities with payments which depend (except for rights or other assets designed to assure the servicing or timely distribution of proceeds to holders of such securities) primarily on the cash flow from residential mortgage loans made to borrowers that are secured on a first priority basis or second priority basis, subject to permitted liens, easements and other encumbrances by residential real estate (one-to four-family properties) the proceeds of which are used to purchase real estate and purchase or construct dwellings thereon (or to refinance indebtedness previously so used). Residential mortgage loans are obligations of the borrowers thereunder only and are not typically insured or guaranteed by any other person or entity. The ability of a borrower to repay a loan secured by residential property is dependent upon the income or assets of the borrower. A number of factors, including a general economic downturn, acts of God, terrorism, social unrest and civil disturbances, may impair borrowers’ abilities to repay their loans.
The Fund may invest in commercial mortgage-backed securities (“CMBS”). CMBS generally are multi-class debt or pass-through certificates secured or backed by mortgage loans on commercial properties. CMBS generally are structured to provide protection to the senior class investors against potential losses on the underlying mortgage loans. This protection generally is provided by having the holders of subordinated classes of securities take the first loss if there are defaults on the underlying commercial mortgage loans. Other protection, which may benefit all of the classes or particular classes, may include issuer guarantees, reserve funds, cross-collateralization and over-collateralization. The Fund may invest in CMBS issued or sponsored by commercial banks, savings and loan institutions, mortgage bankers, private mortgage insurance companies and other non-governmental issuers. CMBS have no governmental guarantee.
The Fund may purchase event-linked bonds or “catastrophe bonds.” Event-linked bonds are asset-backed securities generally issued by special purpose vehicles organized by insurance companies, with interest payments tied to the insurance losses of casualty insurance contracts. Large insurance losses, such as those caused by a trigger event, such as a hurricane, earthquake or other physical or weather related phenomenon, will reduce the interest payments and, accordingly, the Fund may lose a portion or all of its principal invested in the bond or suffer a reduction in credited interest. Small losses will lead to above-market interest payments. Generally, event-linked bonds are issued as Rule 144A securities (i.e., securities which are not registered under the Securities Act of 1933, as amended (the “1933 Act”), but which can be sold to certain institutional buyers in accordance with Rule 144A under the Securities Act). If a trigger event causes losses exceeding a specific amount in the geographic region and time period specified in a bond, liability under the terms of the bond is limited to the principal and accrued interest of the bond. If no trigger event occurs, the Fund will recover its principal plus interest. Often, event-linked bonds provide for extensions of maturity that are mandatory, or optional at the discretion of the issuer, in order to process and audit loss claims in those cases where a trigger event has, or possibly has, occurred. An extension of maturity may increase volatility.
The Fund may invest in Collateralized Debt Obligations (“CDOs”) and Collateralized Loan Obligations (“CLOs”). CDOs are debt obligations typically issued by a private special-purpose entity and collateralized principally by debt securities, including, for example, high yield, high-risk bonds, structured finance securities including ABS, mortgage-backed securities and REITs. CLOs are similar to CDOs, but are typically collateralized principally by a pool of loans, which may include, among others, domestic and foreign senior secured loans, senior unsecured loans, and subordinate corporate loans, including loans that may be rated below investment grade (commonly known as “high yield” or “junk” bonds). The special purpose entity typically issues one or more classes (sometimes referred to as “tranches”) of rated debt securities, one or more unrated classes of debt securities that are generally treated as equity interests, and a residual equity interest. The tranches of CDOs and CLOs typically have different interest rates, projected weighted average lives and ratings, with the higher rated tranches paying lower interest rates. One or more forms of credit enhancement are almost always necessary in a CDO/CLO structure to obtain the desired credit ratings for the most highly rated debt securities issued by a CDO or CLO. The types of credit enhancement used include “internal” credit enhancement provided by the underlying assets themselves, such as subordination, excess spread and cash collateral accounts, hedges provided by interest rate swaps, and “external” credit enhancement provided by third parties, principally financial guaranty insurance issued by monoline insurers. Despite this credit enhancement, CDO and CLO tranches can experience substantial losses due to actual defaults, increased sensitivity to defaults due to collateral default and the disappearance of lower rated protecting tranches, market anticipation of defaults, as well as aversion to CDO and CLO securities as a class.
The Fund may invest in municipal securities. Municipal securities include municipal bonds, notes, securities issued to finance and refinance public projects, certificates of participation, variable rate demand obligations, lease obligations, municipal notes, pre-refunded municipal bonds, private activity bonds, securities issued by tender option bond trusts, including inverse floating rate securities, and other forms of municipal bonds and securities, and other related instruments that create exposure to municipal bonds, notes and securities that provide for the payment of interest income that is exempt from regular U.S. federal income tax.
Municipal securities are debt obligations generally issued by states, cities and local authorities and certain possessions and territories of the United States (such as Puerto Rico and Guam) to finance or refinance public purpose projects such as roads, schools, and water supply systems.
The Fund may invest in tobacco settlement bonds, which are municipal securities that are backed solely by expected revenues to be derived from lawsuits involving tobacco related deaths and illnesses which were settled between certain states and American tobacco companies. Tobacco settlement bonds are secured by an issuing state’s proportionate share in the Master Settlement Agreement.
The Fund may enter into mortgage dollar rolls in which the Fund sells mortgage securities for delivery in the current month, realizing a gain (loss), and simultaneously contracts to repurchase similar securities on a specified future date. During the roll period, the Fund forgoes principal and interest paid on the securities. The Fund is compensated by the interest earned on the cash proceeds of the initial sale and by the lower repurchase price at the future date. The difference between the sales proceeds and the repurchase price is recorded as a realized gain or loss.
The Fund’s investments in foreign securities may include investment in depositary receipts, including American Depositary Receipts (“ADRs”), European Depositary Receipts (“EDRs”) and Global Depositary Receipts (“GDRs”). U.S. dollar-denominated ADRs, which are traded in the United States on exchanges or over-the-counter, are issued by domestic banks. ADRs represent the right to receive securities of foreign issuers deposited in a domestic bank or a correspondent bank. In general, there is a large, liquid market in the United States for many ADRs. The information available for ADRs is subject to the accounting, auditing and financial reporting standards of the domestic market or exchange on which they are traded, which standards are more uniform and more exacting than those to which many foreign issuers may be subject.
 
101

Shareholder Update
(continued)
 
The Fund may also invest in EDRs, GDRs and in other similar instruments representing securities of foreign companies. EDRs and GDRs are securities that are typically issued by foreign banks or foreign trust companies, although U.S. banks or U.S. trust companies may issue them. EDRs and GDRs are structured similarly to the arrangements of ADRs. EDRs, in bearer form, are designed for use in European securities markets and are not necessarily denominated in the currency of the underlying security.
The Fund may invest in inflation protected securities. Inflation protected securities are debt securities designed to provide protection against the negative effects of inflation. Two structures are common. The U.S. Treasury and some other issuers use a structure that accrues inflation into the principal value of the bond. Most other issuers pay out the inflation accruals as part of a semiannual coupon.
The Fund may invest a portion of their assets in securities of companies offering shares in initial public offerings (“IPOs”). IPOs may have a magnified performance impact on the Fund with a small asset base. The impact of IPOs on the Fund’s performance likely will decrease as the Fund’s asset size increases, which could reduce the Fund’s total returns. IPOs may not be consistently available to the Fund for investing, particularly as the Fund’s asset base grows. Because IPO shares frequently are volatile in price, the Fund may hold IPO shares for a very short period of time.
The Fund may invest in participatory notes issued by banks or broker-dealers that are designed to replicate the performance of certain non-U.S. companies traded on a non-U.S. exchange. Participatory notes are a type of equity-linked derivative which generally are traded over-the-counter.
The Fund may invest in debentures the interest on which may be paid in other securities rather than cash (“PIKs”) or may be delayed (“delayed interest securities”).
The Fund may buy and sell securities on a when-issued or delayed delivery basis, making payment or taking delivery at a later date, normally within 15 to 45 days of the trade date.
The Fund may hold a portion of its assets in cash or cash equivalents, including foreign cash equivalents or foreign bank deposits.
As part of its investment strategy, the Fund may employ an options strategy whereby the Fund sells (writes) call options on a varying percentage of the market value of the Fund’s equity portfolio. The Fund may also buy calls, buy puts, and sell puts as a secondary emphasis of the options strategy. This may also include certain uncovered options positions. The options may be on indexes, custom baskets of securities and individual securities.
The Fund’s options strategy may include options traded in the over-the-counter (“OTC”) market and exchange-traded options.
An option contract is a contract that gives the holder of the option, in return for a premium, the right to buy from (in the case of a call) or sell to (in the case of a put) the writer of the option the reference instrument underlying the option (or the cash value of the index) at a specified exercise price at any time during the term of the option. The writer of an option on a security has the obligation upon exercise of the option to deliver the reference instrument (or the cash) upon payment of the exercise price or to pay the exercise price upon delivery of the reference instrument (or the cash). Upon exercise of an index option, the writer of an option on an index is obligated to pay the difference between the cash value of the index and the exercise price multiplied by the specified multiplier for the index option. Options may be “covered,” meaning that the party required to deliver the reference instrument if the option is exercised owns that instrument (or has set aside sufficient assets to meet its obligation to deliver the instrument). Options may be listed on an exchange or traded in the OTC market. In general, exchange-traded options have standardized exercise prices and expiration dates and may require the parties to post margin against their obligations, and the performance of the parties’ obligations in connection with such options is guaranteed by the exchange or a related clearing corporation.
The Fund may invest in illiquid securities (i.e., securities that are not readily marketable), including, but not limited to, restricted securities (securities the disposition of which is restricted under the federal securities laws), securities that may be resold only pursuant to Rule 144A under the 1933 Act, and repurchase agreements with maturities in excess of seven days. Illiquid securities may also include securities legally restricted as to resale, such as securities issued pursuant to Section 4(a)(2) of the 1933 Act.
The Fund may purchase equity securities in a private placement that are issued by issuers who have outstanding, publicly-traded equity securities of the same class (“private investments in public equity” or “PIPES”). Shares in PIPES generally are not registered with the SEC until after a certain time period from the date the private sale is completed. This restricted period can last many months. Until the public registration process is completed, PIPES are restricted as to resale and the Fund cannot freely trade the securities. Generally, such restrictions cause the PIPES to be illiquid during this time.
The Fund may use certain derivative instruments in pursuit of its investment objective. Such instruments include financial futures contracts, forward contracts, swap contracts (including interest rate, total return and credit default swaps), options on financial futures, options on swap contracts or other derivative instruments. The credit default swaps in which the Fund may invest include credit default swap indexes and single-name credit default swaps. A credit default swap index is a portfolio of credit default swaps with similar characteristics, such as credit default swaps on high-yield bonds. The Fund will usually enter into interest rate swaps on a net basis; that is, the two payment streams will be netted out in a cash settlement on the payment date or dates specified in the instrument, with the Fund receiving or paying, as the case may be, only the net amount of the two payments.
The Fund may also invest in securities of other open- or closed-end investment companies (including exchange-traded funds (“ETFs”)) that invest primarily in securities of the types in which the Fund may invest directly, to the extent permitted by the Investment Company Act of 1940 Act, as amended (the “1940 Act”), the rules and regulations issued thereunder and applicable exemptive orders issued by the Securities and Exchange Commission (“SEC”).
 
102

 
Use of Leverage
The Fund may use leverage to seek to achieve its investment objective. The Fund may source leverage through the issuance of “senior securities” as defined under the 1940 Act, which include (1) borrowings, including loans from financial institutions; (2) the issuance of debt securities; and (3) the issuance of preferred shares of beneficial interest (“Preferred Shares”). In addition, the Fund may also use certain derivatives and other financing instruments that have the economic effect of leverage by creating additional investment exposures, such as investments in inverse floating rate securities and reverse repurchase agreements. The amount and sources of leverage will vary depending on market conditions.
Temporary Defensive Periods
During temporary defensive periods the Fund may invest any percentage of its total assets in short-term high quality debt securities. The Fund may not achieve its investment objective during such periods.
 
103

Shareholder Update
(continued)
 
NUVEEN REAL ESTATE INCOME FUND (JRS)
Investment Objectives
The Fund’s primary investment objective is to provide high current income. The Fund’s secondary investment objective is capital appreciation.
Investment Policies
Under normal market conditions, the Fund will invest at least 90% of its total assets in income-producing common stocks, preferred stocks, convertible securities and debt securities issued by real estate companies. The Fund has a fundamental policy of concentrating its investments in the United States (“U.S.”) real estate industry and not in any other industry.
Under normal market conditions:
 
   
The Fund will invest at least 80% of its total assets in income producing equity securities issued by Real Estate Investment Trusts (“REITs”), excluding convertible securities.
 
   
The Fund will not invest more than 25% of its total assets in non-investment grade preferred stocks, convertible preferred stocks and debt securities. Investment grade quality preferred stocks, convertible preferred stocks and debt securities are those that, at the time of investment, are rated within the four highest letter grades (BBB or Baa or better) by at least one nationally recognized statistical rating organization (“NRSRO”) that rates such instrument (even if it is rated lower by another), or if it is unrated by any NRSRO but judged to be of comparable quality by the portfolio managers.
 
   
The Fund may invest up to 20% of its total assets in debt securities, including convertible debt securities, issued or guaranteed by real estate companies.
 
   
The Fund will invest at least 25% of its Managed Assets in securities of companies in the financial services sector.
 
   
The Fund will not invest more than 10% of its total assets in the securities of any one issuer.
 
   
The Fund will not enter into short sales or invest in derivatives, except as described below in connection with the interest rate swap or interest rate cap transactions.
The foregoing policies apply only at the time of any new investment.
“Managed Assets” mean the total assets of the Fund, minus the sum of its accrued liabilities (other than Fund liabilities incurred for the express purpose of creating leverage). Total assets for this purpose shall include assets attributable to the Fund’s use of leverage (whether or not those assets are reflected in the Fund’s financial statements for purposes of generally accepted accounting principles), and derivatives will be valued at their market value.
Approving Changes in Investment Policies
The Board of Trustees of the Fund may change the policies described above without a shareholder vote. However, with respect to the Fund’s policy of investing at least 90% of its total assets in income-producing securities issued by real estate companies, such policy may not be changed without 60 days’ prior written notice to shareholders.
The Fund has a fundamental policy of concentrating its investments in the U.S. real estate industry and not in any other industry. This policy may not be changed without the approval of the holders of a majority of the outstanding common shares and preferred shares voting together as a single class, and the approval of the holders of a majority of the outstanding preferred shares, voting separately as a single class. A “majority of the outstanding” shares means (i) 67% or more of the shares present at a meeting, if the holders of more than 50% of the shares are present or represented by proxy or (ii) more than 50% of the shares, whichever is less.
Portfolio Contents
The Fund’s investments are concentrated in the U.S. real estate industry. A real estate company generally derives at least 50% of its revenue from the ownership, construction, financing, management or sale of commercial, industrial or residential real estate (or that has at least 50% of its assets invested in such real estate). A common type of real estate company, a REIT, is a company that pools investors’ funds for investment primarily in income-producing real estate or in real estate related loans (such as mortgages) or other interests. Therefore, a REIT normally derives its income from rents or from interest payments, and may realize capital gains by selling properties that have appreciated in value. REITs generally pay relatively high dividends (as compared to other types of companies) and the Fund intends to use these REIT dividends in an effort to meet its primary objective of high current income.
The Fund may invest in common stocks. Common stock generally represents an equity ownership interest in an issuer, without preference over and with a lower priority than any other class of securities, including such issuer’s debt securities, preferred stock and other senior equity securities. Common stocks usually carry voting rights and earn dividends. Common stocks fluctuate in price in response to many factors including historical and prospective earnings of the issuer, the value of its assets, general economic conditions, interest rates, investor perceptions and market liquidity, as such the company may or may not pay dividends. Dividends on common stocks are declared at the discretion of the company’s board. In addition, common stock generally has the greatest appreciation and depreciation potential because increases and decreases in earnings are usually reflected in a company’s stock price.
 
104

 
The Fund may invest in preferred stocks. Preferred stock, which generally pays fixed or adjustable rate dividends or interest to investors, has preference over common stock in the payment of dividends or interest and the liquidation of a company’s assets, which means that a company typically must pay dividends or interest on its preferred stock before paying any dividends on its common stock. On the other hand, preferred stock is junior to all forms of the company’s debt, including both senior and subordinated debt. Because of its subordinated position in the capital structure of an issuer, the ability to defer dividend or interest payments for extended periods of time without adverse consequences to the issuer, and certain other features, preferred stock is often treated as an equity-like instrument by both issuers and investors, as its quality and value is heavily dependent on the profitability and cash flows of the issuer rather than on any legal claims to specific assets.
The Fund may invest in convertible securities, which may include convertible debt, convertible preferred stock, synthetic convertible securities and may also include secured and unsecured debt, based upon the judgment of the Fund’s sub-adviser. Convertible securities may pay interest or dividends that are based on a fixed or floating rate. A convertible security is a preferred stock, warrant or other security that may be converted into or exchanged for a prescribed amount of common stock or other security of the same or a different issuer or into cash within a particular period of time at a specified price or formula.
The Fund may invest in debt securities, including convertible debt securities, issued or guaranteed by real estate companies.
The Fund’s may invest in below investment grade preferred stocks, convertible preferred stocks and debt securities. Below investment grade preferred stocks, convertible preferred stocks and debt securities (such securities are commonly referred to as “high yield” or “junk”) generally provide high income in an effort to compensate investors for their higher risk of default, which is the failure to make required interest or principal payments.
The Fund will invest in securities of companies in the financial services sector. For purposes of identifying companies in the financial services sector, the Fund will use sector and industry classifications such as those provided by MSCI and Standard & Poor’s (The Global Industry Classification Standard (GICS)), Bloomberg, Barclays or similar sources commonly used in the financial industry. As a result, if one or more of these classifications include a company “in” the financial services sector, the Fund will consider such company as “in” the financial services sector.
The Fund may invest directly or indirectly in foreign securities, including securities denominated in foreign currencies or in multinational currency units. Since foreign securities often are purchased with and payable in currencies of foreign countries, the value of these assets as measured in U.S. dollars may be affected favorably or unfavorably by changes in currency rates and exchange control regulations.
The Fund may invest in illiquid securities (i.e., securities that are not readily marketable), including, but not limited to, restricted securities (securities the disposition of which is restricted under the federal securities laws), securities that may be resold only pursuant to Rule 144A under the Securities Act of 1933, as amended (the “1933 Act”), and repurchase agreements with maturities in excess of seven days. Illiquid securities may also include securities legally restricted as to resale, such as securities issued pursuant to Section 4(a)(2) of the 1933 Act.
The Fund may enter into interest rate swap transactions that are intended to hedge the Fund’s payment obligations. Interest rate swaps involve the Fund’s agreement with the swap counterparty to pay a fixed rate payment in exchange for the counterparty paying the Fund a variable rate payment that is intended to approximate the Fund’s variable rate payment obligation on Borrowings or any preferred shares. The payment obligation is based on the notional amount of the swap.
The Fund may also enter into interest rate cap transactions, which would require it to pay a premium to the cap counterparty and would entitle it, to the extent that a specified variable rate index exceeds a predetermined fixed rate, to receive from the counterparty payment of the difference based on the notional amount.
The Fund may also invest in securities of other open- or closed-end investment companies (including exchange-traded funds (“ETFs”)) that invest primarily in securities of the types in which the Fund may invest directly, to the extent permitted by the Investment Company Act of 1940, as amended (the “1940 Act”), the rules and regulations issued thereunder and applicable exemptive orders issued by the Securities and Exchange Commission (“SEC”). In addition, the Fund may invest a portion of its Managed Assets in pooled investment vehicles (other than investment companies) that invest primarily in securities of the types in which the Fund may invest directly.
Use of Leverage
The Fund uses leverage to pursue its investment objectives. The Fund may source leverage through the issuance of “senior securities” as defined under the 1940 Act, which include (1) borrowings, including loans from financial institutions; (2) the issuance of debt securities; and (3) the issuance of preferred shares of beneficial interest (“Preferred Shares”). In addition, the Fund may also use certain derivatives and other financing instruments that have the economic effect of leverage by creating additional investment exposures, such as investments in reverse repurchase agreements. The amount and sources of leverage will vary depending on market conditions.
Temporary Defensive Periods
During temporary defensive periods the Fund may deviate from investment objectives and policies, and in order to keep the Fund’s cash fully invested, the Fund may invest any percentage of its net assets in short-term investments including high quality, short-term debt securities that may be either tax-exempt or taxable. The Fund may not achieve its investment objectives during such periods.
 
105

Shareholder Update
(continued)
 
NUVEEN REAL ASSET INCOME AND GROWTH FUND (JRI)
Investment Objective
The Fund’s investment objective is to provide a high level of current income and long-term capital appreciation.
Investment Policies
Under normal circumstances, the Fund will invest at least 80% of its Managed Assets (as defined below) in equity and debt securities issued by real asset-related companies located anywhere in the world.
Real asset-related companies are defined as: (i) companies that are in the energy, telecommunications, utilities or materials sectors; (ii) companies in the real estate or transportation industry groups; (iii) companies that, if not in one of these sectors or industry groups (a) derive at least 50% of their revenues or profits from the ownership, management, operation, development, construction, financing or sale of real assets or (b) have at least 50% of the fair market value of their assets invested in real assets; or (iv) pooled investment vehicles that primarily invest in the foregoing companies or that are otherwise designed primarily to provide investment exposure to real assets.
The Fund also employs an option strategy focused on securities issued by real asset-related companies that seeks to generate option premiums for the purpose of enhancing the Fund’s risk-adjusted total returns over time.
Under normal market conditions:
 
   
The Fund’s investments will be concentrated in the infrastructure and real estate sectors.
 
   
The Fund will not have more than 40% of its Managed Assets, at the time of purchase, in debt securities. All of the Fund’s debt securities may be rated lower than investment grade quality (BB+/Ba1 or lower); however, no more than 10% of its Managed Assets may be invested in debt securities rated CCC+/Caa1 or lower at any time.
 
   
The Fund may invest up to 5% of its Managed Assets in senior loans.
 
   
The Fund will invest at least 25% and no more than 75% of its Managed Assets in securities of non-United States (“U.S.”) issuers through the direct investment in securities of non-U.S. companies and depository receipts.
 
   
The Fund may invest up to 50% of its Managed Assets in securities of emerging markets issuers.
 
   
The Fund may write (sell) options with a notional value of options ranging from 0% to 25% of its Managed Assets.
 
   
The Fund may invest up to 10% of is Managed Assets in securities of other open- or closed-end investment companies (including exchange-traded fund (“ETFs”)) that invest primarily in securities of the types in which the Fund may invest directly. In addition, the Fund may invest a portion of its Managed Assets in pooled investment vehicles (other than investment companies) that invest primarily in securities of the types in which the Fund may invest directly.
The foregoing policies apply only at the time of any new investment.
“Managed Assets” mean the total assets of the Fund, minus the sum of its accrued liabilities (other than Fund liabilities incurred for the express purpose of creating leverage). Total assets for this purpose shall include assets attributable to the Fund’s use of leverage (whether or not those assets are reflected in the Fund’s financial statements for purposes of generally accepted accounting principles), and derivatives will be valued at their market value.
Approving Changes in Investment Policies
The Board of Trustees of the Fund may change the policies described above without a shareholder vote. However, with respect to the Fund’s policy of investing at least 80% of its Managed Assets in equity and debt securities issued by real asset-related companies located anywhere in the world, such policy may not be changed without 60 days’ prior written notice to shareholders.
Portfolio Contents
The Fund generally invests in equity and debt securities issued by real asset-related companies located anywhere in the world in the infrastructure and real estate sectors. The infrastructure sector includes investments related to the energy, telecommunications, utilities and materials sectors. The real estate sector includes investments in real estate companies.
Debt securities in which the Fund may invest include: corporate debt, high yield debt, mortgage-backed securities (“MBS”), commercial mortgage-backed securities (“CMBS”), debt securities issued by master-limited partnerships (“MLPs”) and REITs, exchange-traded notes (“ETNs”), commercial paper & repurchase agreements, asset-backed securities (“ABS”) and senior loans.
The Fund may invest in common stocks issued by real asset-related companies. Common stock generally represents an equity ownership interest in an issuer, without preference over and with a lower priority than any other class of securities, including such issuer’s debt securities, preferred stock and other senior equity securities. Common stocks usually carry voting rights and earn dividends. Common stocks fluctuate in price in response to many factors including historical and prospective earnings of the issuer, the value of its assets, general economic conditions, interest rates, investor
 
106

 
perceptions and market liquidity, as such the company may or may not pay dividends. Dividends on common stocks are declared at the discretion of the company’s board. In addition, common stock generally has the greatest appreciation and depreciation potential because increases and decreases in earnings are usually reflected in a company’s stock price.
The Fund may invest in rights and warrants of common stock. Rights and warrants are pure speculation in that they have no voting rights, pay no dividends and have no rights with respect to the assets of the entity issuing them. They do not represent ownership of the securities, but only the right to buy them. The prices of rights (if traded independently) and warrants do not necessarily move parallel to the prices of the underlying securities.
The Fund may invest in the securities of less seasoned companies, which may include start-up companies that have insubstantial operational or earnings history or limited products, markets, financial resources or management depth. These companies may also include emerging companies at the research and development stage with no products or technologies to market or that are approved for marketing.
The Fund may invest in preferred stocks issued by real asset-related companies. Preferred stock, which generally pays fixed or adjustable rate dividends or interest to investors, has preference over common stock in the payment of dividends or interest and the liquidation of a company’s assets, which means that a company typically must pay dividends or interest on its preferred stock before paying any dividends on its common stock. On the other hand, preferred stock is junior to all forms of the company’s debt, including both senior and subordinated debt. Because of its subordinated position in the capital structure of an issuer, the ability to defer dividend or interest payments for extended periods of time without adverse consequences to the issuer, and certain other features, preferred stock is often treated as an equity-like instrument by both issuers and investors, as its quality and value is heavily dependent on the profitability and cash flows of the issuer rather than on any legal claims to specific assets.
The Fund may invest in convertible securities issued by real asset-related companies, which may include convertible debt, convertible preferred stock, synthetic convertible securities and may also include secured and unsecured debt, based upon the judgment of the Fund’s sub-adviser. Convertible securities may pay interest or dividends that are based on a fixed or floating rate. A convertible security is a preferred stock, warrant or other security that may be converted into or exchanged for a prescribed amount of common stock or other security of the same or a different issuer or into cash within a particular period of time at a specified price or formula.
The Fund may invest in securities of non-U.S. issuers, including emerging market issuers. The Fund will classify an issuer of a security as being a U.S. or non-U.S. issuer based on the determination of an unaffiliated, recognized financial data provider. Such determinations are based on a number of criteria, such as the issuer’s country of domicile, the primary exchange on which the security predominately trades, the location from which the majority of the issuer’s revenue comes, and the issuer’s reporting currency. Furthermore, a country is considered to be an “emerging market” if it has a relatively low gross national product per capita compared to the world’s major economies and the potential for rapid economic growth. The Fund considers a country an emerging market country based on the determination of an international organization, such as the International Monetary Fund (“IMF”), or an unaffiliated, recognized financial data provider.
The Fund may invest in debt securities issued or guaranteed by real asset-related companies.
The Fund’s investments in debt securities may include investment grade and below investment grade securities. Below investment grade securities (such securities are commonly referred to as “high yield” or “junk”) generally provide high income in an effort to compensate investors for their higher risk of default, which is the failure to make required interest or principal payments.
The Fund may invest in corporate debt securities, including corporate bonds. Corporate debt securities are fully taxable debt obligations issued by corporations. These securities fund capital improvements, expansions, debt refinancing or acquisitions that require more capital than would ordinarily be available from a single lender. Investors in corporate debt securities lend money to the issuing corporation in exchange for interest payments and repayment of the principal at a set maturity date. Rates on corporate debt securities are set according to prevailing interest rates at the time of the issue, the credit rating of the issuer, the length of the maturity and other terms of the security, such as a call feature. Corporate debt securities are subject to the risk of an issuer’s inability to meet principal and interest payments on the obligations and may also be subject to price volatility due to such factors as market interest rates, market perception of the creditworthiness of the issuer and general market liquidity. In addition, corporate restructurings, such as mergers, leveraged buyouts, takeovers or similar corporate transactions are often financed by an increase in a corporate issuer’s debt securities. As a result of the added debt burden, the credit quality and market value of an issuer’s existing debt securities may decline significantly.
The Fund may invest in zero coupon bonds. A zero coupon bond is a bond that typically does not pay interest for the entire life of the obligation or for an initial period after the issuance of the obligation.
The Fund may invest in PIKs. PIKs pay dividends or interest in the form of additional securities of the issuer, rather than in cash. Each of these instruments is typically issued and traded at a deep discount from its face amount. The amount of the discount varies depending on such factors as the time remaining until maturity of the securities, prevailing interest rates, the liquidity of the security and the perceived credit quality of the issuer.
The Fund may invest in senior loans. Senior loans typically hold the most senior position in the capital structure of a business entity, are typically secured with specific collateral and have a claim on the assets and/or stock of the issuer that is senior to that held by subordinated debt holders and stockholders of the issuer.
Senior loans generally include: (i) senior loans made by banks or other financial institutions to U.S. and non-U.S. corporations, partnerships and other business entities (each a “Borrower” and, collectively, “Borrowers”), (ii) assignments of such interests in senior loans, or (iii) participation interests in senior loans. Generally, an assignment is the actual sale of the loan, in whole or in part. A participation, on the other hand, means that the original lender maintains ownership over the loan and the participant has only a contract right against the original lender, not a credit relationship with the Borrower. Senior loans typically hold the most senior position in the capital structure of a Borrower, are typically secured with specific collateral and
 
107

Shareholder Update
(continued)
 
have a claim on the assets and/or stock of the Borrower that is senior to that held by subordinated debt holders and stockholders of the Borrower. The capital structure of a Borrower may include senior loans, senior and junior subordinated debt, preferred stock and common stock issued by the Borrower, typically in descending order of seniority with respect to claims on the Borrower’s assets. The proceeds of senior loans primarily are used by Borrowers to finance leveraged buyouts, recapitalizations, mergers, acquisitions, stock repurchases, refinancings, internal growth and for other corporate purposes. A senior loan is typically originated, negotiated and structured by a U.S. or non-U.S. commercial bank, insurance company, finance company or other financial institution (“Agent”) for a lending syndicate of financial institutions which typically includes the Agent (“Lenders”). The Agent typically administers and enforces the senior loan on behalf of the other Lenders in the syndicate. In addition, an institution, typically but not always the Agent, holds any collateral on behalf of the Lenders. The Fund normally will rely primarily on the Agent to collect principal of and interest on a senior loan. Also, the Fund usually will rely on the Agent to monitor compliance by the Borrower with the restrictive covenants in a loan agreement.
Senior loans typically have rates of interest that are redetermined either daily, monthly, quarterly or semi-annually by reference to a base lending rate plus a premium or credit spread. These base lending rates are the prime rate offered by one or more major U.S. banks and the certificate of deposit rate or other base lending rates used by commercial lenders. The base rate for senior loans are generally based on SOFR, a U.S. bank’s prime or base rate, the overnight federal funds rate or another rate. As adjustable rate loans, the frequency of how often a senior loan resets its interest rate will impact how closely such senior loans track current market interest rates.
The Fund may invest in MBS. MBS are structured debt obligations collateralized by pools of commercial or residential mortgages. Pools of mortgage loans and mortgage-related loans, such as mezzanine loans, are assembled into pools of assets that secure or back securities sold to investors by various governmental, government-related and private organizations. MBS in which the Fund may invest include those with fixed, floating or variable interest rates, those with interest rates that change based on a specified index of interest rates and those with interest rates that change inversely to changes in interest rates, as well as those that do not bear interest.
The Fund may invest in CMBS. CMBS generally are multi-class debt or pass-through certificates secured or backed by mortgage loans on commercial properties. CMBS generally are structured to provide protection to the senior class investors against potential losses on the underlying mortgage loans. This protection generally is provided by having the holders of subordinated classes of securities take the first loss if there are defaults on the underlying commercial mortgage loans. Other protection, which may benefit all of the classes or particular classes, may include issuer guarantees, reserve funds, cross-collateralization and over-collateralization. The Fund may invest in CMBS issued or sponsored by commercial banks, savings and loan institutions, mortgage bankers, private mortgage insurance companies and other non-governmental issuers. CMBS have no governmental guarantee.
The Fund may also invest in ABS. ABS are securities that are primarily serviced by the cash flows of a discrete pool of receivables or other financial assets, either fixed or revolving, that by their terms convert into cash within a finite time period. Asset-backed securitization is a financing technique in which financial assets, in many cases themselves less liquid, are pooled and converted into instruments that may be offered and sold in the capital markets. While residential mortgages were the first financial assets to be securitized in the form of MBS, non-mortgage related securitizations have grown to include many other types of financial assets, such as credit card receivables, auto loans and student loans.
The Fund may invest in ETNs. ETNs are a type of senior, unsecured, unsubordinated debt security issued by financial institutions that combine aspects of both bonds and ETFs. An ETN’s returns are based on the performance of a market index minus fees and expenses. Similar to ETFs, ETNs are listed on an exchange and traded in the secondary market. However, unlike an ETF, an ETN has a maturity date, at which time the issuer will pay a return linked to the performance of the market index to which the ETN is linked minus certain fees.
The Fund may invest in REITs. A common type of real estate company, a REIT is a company that pools investors’ funds for investment primarily in income-producing real estate or in real estate related loans (such as mortgages) or other interests. Therefore, a REIT normally derives its income from rents or from interest payments, and may realize capital gains by selling properties that have appreciated in value. REITs generally pay relatively high dividends (as compared to other types of companies) and the Fund intends to use these REIT dividends in an effort to meet its primary objective of high current income. REITs generally can be classified as Equity REITs, Mortgage REITs and Hybrid REITs. An Equity REIT invests the majority of its assets directly in real property and derives its income primarily from rents and from capital gains on real estate appreciation which are realized through property sales. A Mortgage REIT invests the majority of its assets in real estate mortgage loans and derives its income primarily from interest payments. A Hybrid REIT combines the characteristics of an Equity REIT and a Mortgage REIT. Although each Fund can invest in all three kinds of REITs, the emphasis of each Fund is expected to be on investments in the common stock and preferred stock of Equity REITs.
The Fund may invest in MLPs. MLPs are publicly traded limited partnerships. The partnership units are registered with the SEC and are freely exchanged on a securities exchange or in the over-the-counter (“OTC”) market. MLPs that are taxed as partnerships for federal income tax purposes are limited by the Code to enterprises that engage in certain businesses, mostly pertaining to the use of natural resources, such as petroleum and natural gas extraction and transportation. Some real estate enterprises also may qualify as MLPs taxed as partnerships.
The Fund may enter into repurchase agreements (the purchase of a security coupled with an agreement to resell that security at a higher price) with respect to its permitted investments. The Fund’s repurchase agreements will provide that the value of the collateral underlying the repurchase agreement will always be at least equal to the repurchase price, including any accrued interest earned on the agreement, and will be marked-to-market daily.
The Fund may invest in commercial paper. Commercial paper represents short-term unsecured promissory notes issued in bearer form by corporations such as banks or bank holding companies and finance companies. The rate of return on commercial paper may be linked or indexed to the level of exchange rates between the U.S. dollar and a foreign currency or currencies.
 
108

 
The Fund may invest in illiquid securities (i.e., securities that are not readily marketable), including, but not limited to, restricted securities (securities the disposition of which is restricted under the federal securities laws), securities that may be resold only pursuant to Rule 144A under the 1933 Act, and repurchase agreements with maturities in excess of seven days. Illiquid securities may also include securities legally restricted as to resale, such as securities issued pursuant to Section 4(a)(2) of the 1933 Act.
The Fund may buy and sell securities on a when-issued or delayed delivery basis, making payment or taking delivery at a later date, normally within 15 to 45 days of the trade date.
The Fund may opportunistically employ an option strategy by writing (selling) call options on custom baskets of real estate securities not owned by the Fund. The Fund may also write (sell) covered call options on individual real estate and/or infrastructure securities owned by the Fund. The Fund also may write (sell) covered call options on individual securities issued by real asset-related companies.
An option contract is a contract that gives the holder of the option, in return for a premium, the right to buy from (in the case of a call) or sell to (in the case of a put) the writer of the option the reference instrument underlying the option (or the cash value of the index) at a specified exercise price at any time during the term of the option. The writer of an option on a security has the obligation upon exercise of the option to deliver the reference instrument (or the cash) upon payment of the exercise price or to pay the exercise price upon delivery of the reference instrument (or the cash). Upon exercise of an index option, the writer of an option on an index is obligated to pay the difference between the cash value of the index and the exercise price multiplied by the specified multiplier for the index option. Options may be “covered,” meaning that the party required to deliver the reference instrument if the option is exercised owns that instrument (or has set aside sufficient assets to meet its obligation to deliver the instrument). Options may be listed on an exchange or traded in the OTC market. In general, exchange-traded options have standardized exercise prices and expiration dates and may require the parties to post margin against their obligations, and the performance of the parties’ obligations in connection with such options is guaranteed by the exchange or a related clearing corporation. OTC options have more flexible terms negotiated between the buyer and the seller, but generally are subject to counterparty risk. The ability of the Fund to transact business with any one or any number of counterparties, the lack of any independent evaluation of the counterparties or their financial capabilities, and the absence of a regulated market to facilitate settlement, may increase the potential for losses to the Fund. OTC options also involve greater liquidity risk. This risk may be increased in times of financial stress, if the trading market for OTC derivative contracts becomes limited. The staff of the SEC takes the position that certain purchased OTC options, and assets used as cover for certain written OTC options, are illiquid.
The Fund may also write call options on custom baskets of real estate securities. A custom basket call option is an OTC option with a counterparty whose value is linked to the market value of a portfolio of underlying securities and is collateralized by a portion of the Fund’s portfolio. In order to minimize the difference between the returns of the underlying securities in the custom basket (commonly referred to as a tracking error), the sub-adviser will use optimization calculations when selecting the individual securities for inclusion in the custom basket.
In selecting real estate securities for each custom basket, the Fund seeks to minimize the difference between the returns of the underlying stocks of the custom basket and an index of real estate securities (commonly referred to as tracking error) and, at the same time, maximize exposure to securities that the portfolio managers believe are less likely to outperform the relevant market benchmarks over time. Securities selected for each custom basket will primarily consist of underweighted positions relative to the relevant market benchmarks, and may include securities held and not held in the Fund’s portfolio. The objective in structuring these custom baskets is to produce option premiums without limiting the upside potential for specific securities that the portfolio managers believe may outperform over time.
In addition to the use of call options as described above, the Fund may enter into certain derivative instruments in pursuit of its investment objective, including to seek to enhance return, to hedge certain risks of its investments in fixed-income securities or as a substitute for a position in the underlying asset. Such instruments include financial futures contracts, swap contracts (including interest rate, credit default swaps and credit default swap indices), options on financial futures, options on swap contracts or other derivative instruments.
Use of Leverage
The Fund uses leverage to pursue its investment objective. The Fund may source leverage through the issuance of “senior securities” as defined under the 1940 Act, which include (1) borrowings, including loans from financial institutions; (2) the issuance of debt securities; (3) the issuance of preferred shares of beneficial interest (“Preferred Shares”). In addition, the Fund may also use certain derivatives and other financing instruments that have the economic effect of leverage by creating additional investment exposures, such as investments in reverse repurchase agreements. The amount and sources of leverage will vary depending on market conditions.
Temporary Defensive Periods
During temporary defensive periods the Fund may deviate from its investment objective and policies, and in order to keep the Fund’s cash fully invested, the Fund may invest up to 100% of its Managed Assets in short-term investments, including high quality, short-term securities or may invest in short-, intermediate-, or long-term U.S. Treasury Bonds. The Fund may not achieve its investment objective during such periods.
 
109

Shareholder Update
(continued)
 
PRINCIPAL RISKS OF THE FUNDS
The factors that are most likely to have a material effect on the Fund’s portfolio as a whole are called “principal risks.” The Fund is subject to the principal risks indicated below, whether through direct investment or derivative positions. The Fund may be subject to additional risks other than those identified and described below because the types of investments made by the Fund can change over time.
 
Risk
  
NMAI
  
JRS
  
JRI
Portfolio Level Risks


Basis Risk
  
X
  
-
  
-
Below Investment Grade Risk
  
X
  
X
  
X
Call Option Risk
  
X
  
-
  
X
Call Risk
  
X
  
X
  
X
Collateralized Debt Obligation (“CDO”) and Collateralized Loan Obligation (“CLO”) Risk
  
X
  
-
  
-
Common Stock Risk
  
X
  
X
  
X
Contingent Capital Security (“CoCos”) Risk
  
X
  
-
  
-
Convertible Securities Risk
  
X
  
X
  
X
Counterparty Risk
  
X
  
X
  
X
Credit Risk
  
X
  
X
  
X
Credit Spread Risk
  
X
  
X
  
X
Debt Securities Risk
  
X
  
X
  
X
Deflation Risk
  
X
  
X
  
X
Depositary Receipts Risk
  
X
  
-
  
-
Derivatives Risk
  
X
  
X
  
X
Dividend-Paying Securities Risk
  
X
  
X
  
X
Distressed or Defaulted Securities Risk
  
X
  
-
  
-
Duration Risk
  
X
  
X
  
X
Exchange-Traded Notes (“ETNs”) Risk
  
X
  
-
  
X
Extension Risk
  
X
  
-
  
-
Financial Futures and Options Transactions Risk
  
X
  
-
  
X
Financial Services Sector Risk
  
-
  
X
  
-
Floating and Variable Rate Securities Risk
  
X
  
-
  
-
Foreign Currency Risk
  
X
  
X
  
X
Foreign Currency Contracts Risk
  
X
  
-
  
-
Foreign Debt Investment Risk
  
X
  
-
  
X
Foreign/Emerging Markets Issuer Risk
  
X
  
X
  
X
Frequent Trading Risk
  
X
  
-
  
X
Growth Stock Risk
  
X
  
-
  
-
Hedging Risk
  
X
  
X
  
X
Income Risk
  
X
  
X
  
X
Inflation Risk
  
X
  
X
  
X
Infrastructure Related Securities Risk
  
X
  
-
  
X
Interest Rate Risk
  
X
  
X
  
X
Inverse Floating Rate Securities Risk
  
X
  
-
  
-
Large-Cap Company Risk
  
X
  
-
  
X
Loan Risk
  
X
  
-
  
-
 
110

 
Risk
  
NMAI
  
JRS
  
JRI
Portfolio Level Risks


Master Limited Partnerships (“MLPs”) Risk
  
X
  
-
  
X
Mortgage-Backed Securities (“MBS”) and Asset-Backed Securities (“ABS”) Risk
  
X
  
-
  
X
Mortgage Roll Risk
  
X
  
-
  
-
Municipal Securities Risk
  
X
  
-
  
-
Natural Resource Related Securities Risk
  
-
  
-
  
X
Options Strategy Risk
  
X
  
-
  
X
Other Investment Companies Risk
  
X
  
X
  
X
Preferred Securities Risk
  
X
  
X
  
X
Prepayment Risk
  
X
  
-
  
-
Put Options Risk
  
X
  
-
  
-
Real Estate Related Securities Risk
  
X
  
X
  
X
Reinvestment Risk
  
X
  
X
  
X
Restricted and Illiquid Investments Risk
  
X
  
X
  
X
Rights and Warrants Risk
  
X
  
-
  
X
Senior Loan Risk
  
X
  
-
  
X
Senior Loan Agent Risk
  
X
  
-
  
X
Small and Mid-Cap Company Risk
  
X
  
-
  
X
Sovereign Government and Supranational Debt Risk
  
X
  
-
  
-
Special Purpose Acquisition Companies (“SPACs”) Risk
  
X
  
-
  
-
Special Risks for Inflation-Indexed Bonds
  
X
  
-
  
-
Swap Transactions Risk
  
X
  
X
  
X
Unrated Securities Risk
  
X
  
X
  
X
U.S. Government Securities Risk
  
X
  
-
  
-
Unseasoned Company Risk
  
-
  
-
  
X
Valuation Risk
  
X
  
X
  
X
Value Stock Risk
  
X
  
-
  
-
When-Issued and Delayed-Delivery Transactions Risk
  
X
  
-
  
X
Whole Loans, Loan Participations and Other Mortgage-Related Interests Risk
  
-
  
-
  
X
Zero Coupon or Pay-In-Kind Securities Risk
  
X
  
-
  
X
 
111

Shareholder Update
(continued)
 
Risk
  
NMAI
  
JRS
  
JRI
Fund Level and Other Risks


Allocation Risk
  
X
  
-
  
-
Anti-Takeover Provisions
  
X
  
X
  
X
Borrowing Risk
  
X
  
X
  
X
Cybersecurity Risk
  
X
  
X
  
X
Distribution Risk
  
-
  
-
  
X
Global Economic Risk
  
X
  
X
  
X
Investment and Market Risk
  
X
  
X
  
X
Legislation and Regulatory Risk
  
X
  
X
  
X
Leverage Risk
  
X
  
X
  
X
Market Discount from Net Asset Value
  
X
  
X
  
X
Multi-Manager Risk
  
X
  
-
  
-
Recent Market Conditions
  
X
  
X
  
X
Reverse Repurchase Agreement Risk
  
X
  
X
  
X
Fund Tax Risk
  
X
  
X
  
X
 
112

 
Portfolio Level Risks:
Basis Risk.
As short-term rates change, interest income from floating rate loans may not increase in concert with increases in the costs of floating rate leverage or other borrowings, introducing basis or imperfect hedging risk.
Below Investment Grade Risk.
Investments of below investment grade quality are regarded as having speculative characteristics with respect to the issuer’s capacity to pay dividends or interest and repay principal, and may be subject to higher price volatility and default risk than investment grade investments of comparable terms and duration. Issuers of lower grade investments may be highly leveraged and may not have available to them more traditional methods of financing. The prices of these lower grade investments are typically more sensitive to negative developments, such as a decline in the issuer’s revenues or a general economic downturn. The secondary market for lower rated investments may not be as liquid as the secondary market for more highly rated investments, a factor which may have an adverse effect on the Fund’s ability to dispose of a particular investment. If a below investment grade security goes into default, or its issuer enters bankruptcy, it might be difficult to sell that security in a timely manner at a reasonable price.
Call Risk.
The Fund may invest in securities that are subject to call risk. Such securities may be redeemed at the option of the issuer, or “called,” before their stated maturity or redemption date. In general, an issuer will call its instruments if they can be refinanced by issuing new instruments that bear a lower interest rate. The Fund is subject to the possibility that during periods of falling interest rates, an issuer will call its high yielding securities. The Fund would then be forced to invest the unanticipated proceeds at lower interest rates, resulting in a decline in the Fund’s income.
Call Option Risk.
As the writer of a call option, the Fund foregoes, during the option’s life, the opportunity to profit from increases in the market value of the instrument underlying the call option above the sum of the premium and the strike price of the option, but will retain the risk of loss should the market value of the instrument underlying the call option decline. The purchaser of the call option has the right to any appreciation in the value of the underlying instrument over the exercise price upon the exercise of the call option or the expiration date. As the Fund increases the option overlay percentage, its ability to benefit from capital appreciation becomes more limited and the risk of net asset value (“NAV”) erosion increases. If the Fund experiences NAV erosion, which itself may have a negative effect on the market price of the Fund’s shares, the Fund will have a reduced asset base over which to write call options, which may eventually lead to reduced distributions to shareholders.
In addition, because the exercise of index options is settled in cash, sellers of index call options, such as the Fund, cannot provide in advance for their potential settlement obligations by acquiring and holding the underlying securities. The Fund bears a risk that the value of the securities held by the Fund will vary from the value of the underlying index and relative to the written index call option positions. Accordingly, the Fund may incur losses on the index call options that it has sold that exceed gains on the Fund’s equity portfolio. The value of index options written by the Fund, which will be priced daily, will be affected by changes in the value of and dividend rates of the underlying common stocks in the index, changes in the actual or perceived volatility of the stock market and the remaining time to the options’ expiration. The value of the index options also may be adversely affected if the market for the index options becomes less liquid or smaller.
Collateralized Debt Obligation (“CDO”) and Collateralized Loan Obligation (“CLO”) Risk.
The risks of an investment in CDOs, including CLOs, depend largely on the type of the collateral securities and the class of the CDO in which the Fund invests. In addition to the normal risks associated with fixed-income investments, CDOs and CLOs carry additional risks including, but not limited to, the risk that: (1) distributions from collateral assets may not be adequate to make interest or other payments; (2) the quality of the collateral may decline in value or default; (3) the fact that the CDOs or CLOs may be subordinate to other classes; and (4) the complex structure of the investment may not be fully understood at the time of investment and may produce disputes with the issuer or unexpected investment results. CDOs and CLOs may also charge management and other administrative fees, which are in addition to those charged by the Fund.
Common Stock Risk.
Common stocks have experienced significantly more volatility in returns and may significantly underperform relative to fixed-income securities during certain periods. An adverse event, such as an unfavorable earnings report, may depress the value of a particular common stock held by the Fund. Also, the prices of common stocks are sensitive to general movements in the stock market, and a drop in the stock market may depress the price of common stocks to which the Fund has exposure. Common stock prices fluctuate for several reasons, including changes in investors’ perceptions of the financial condition of an issuer, the general condition of the relevant stock market or the current and expected future conditions of the broader economy, or when political or economic events affecting the issuer in particular or the stock market in general occur. In addition, common stock prices may be particularly sensitive to rising interest rates, as the cost of capital rises and borrowing costs increase.
Contingent Capital Securities (“CoCos”) Risk.
A loss absorption mechanism trigger event for CoCos would likely be the result of, or related to, the deterioration of the issuer’s financial condition (e.g., a decrease in the issuer’s capital ratio) and status as a going concern. In such a case, with respect to CoCos that provide for conversion into common stock upon the occurrence of the trigger event, the market price of the issuer’s common stock received by the Fund will have likely declined, perhaps substantially, and may continue to decline, which may adversely affect the Fund’s NAV. Further, the issuer’s common stock would be subordinate to the issuer’s other classes of securities and therefore would worsen the Fund’s standing in a bankruptcy proceeding. In addition, because the common stock of the issuer may not pay a dividend, investors in these instruments could experience a reduced income rate, potentially to zero. In view of the foregoing, CoCos are often rated below investment grade and are subject to the risks of below investment grade securities.
CoCos may be subject to an automatic write-down (i.e., the automatic write-down of the principal amount or value of the securities, potentially to zero, and the cancellation of the securities) under certain circumstances, which could result in the Fund losing a portion or all of its investment in such securities. In addition, the Fund may not have any rights with respect to repayment of the principal amount of the securities that has not become due or the payment of interest or dividends on such securities for any period from (and including) the interest or dividend payment date falling immediately prior to the occurrence of such automatic write-down. An automatic write-down could also result in a reduced income rate if the
 
113

Shareholder Update
(continued)
 
dividend or interest payment is based on the security’s par value. Coupon payments on CoCos may be discretionary and may be cancelled by the issuer for any reason or may be subject to approval by the issuer’s regulator and may be suspended in the event there are insufficient distributable reserves.
In certain scenarios, investors in CoCos may suffer a loss of capital ahead of equity holders or when equity holders do not. There is no guarantee that the Fund will receive a return of principal on CoCos. Any indication that an automatic write-down or conversion event may occur can be expected to have a material adverse effect on the market price of CoCos.
The prices of CoCos may be volatile. Additionally, the trading behavior of a given issuer’s CoCo may be strongly impacted by the trading behavior of other issuers’ CoCos, such that negative information from an unrelated CoCo may cause a decline in value of one or more CoCos held by a fund. Accordingly, the trading behavior of CoCos may not follow the trading behavior of other similarly structured securities.
CoCos are issued primarily by financial institutions. Therefore, CoCos present substantially increased risks at times of financial turmoil, which could affect financial institutions more than companies in other sectors and industries.
Convertible Securities Risk.
Convertible securities have characteristics of both equity and debt securities and, as a result, are exposed to certain additional risks that are typically associated with debt, including but not limited to Interest Rate Risk, Credit Risk, Below Investment Grade Risk and Unrated Securities Risk. The value of a convertible security is influenced by both the yield of non-convertible securities of comparable issuers and by the value of the underlying common stock. Convertible securities generally offer lower interest or dividend yields than non-convertible securities of similar credit quality. The market values of convertible securities tend to decline as interest rates increase and, conversely, to increase as interest rates decline. However, the convertible security’s market value tends to reflect the market price of the common stock of the issuing company when that stock price is greater than the convertible security’s “conversion price.” The conversion price is defined as the predetermined price at which the convertible security could be exchanged for the associated common stock. As the market price of the underlying common stock declines, the price of the convertible security tends to be influenced more by the yield of the convertible security. Thus, the convertible security may not decline in price to the same extent as the underlying common stock. Convertible securities fall below debt obligations of the same issuer in order of preference or priority in the event of a liquidation and are typically unrated or rated lower than such debt obligations.
Counterparty Risk.
Changes in the credit quality of the companies that serve as the Fund’s counterparties with respect to derivatives or other transactions supported by another party’s credit will affect the value of those instruments. Certain entities that have served as counterparties in the markets for these transactions have incurred or may incur in the future significant financial hardships including bankruptcy and losses as a result of exposure to sub-prime mortgages and other lower-quality credit investments. As a result, such hardships have reduced these entities’ capital and called into question their continued ability to perform their obligations under such transactions. By using such derivatives or other transactions, the Fund assumes the risk that its counterparties could experience similar financial hardships. In the event of the insolvency of a counterparty, the Fund may sustain losses or be unable to liquidate a derivatives position.
Credit Risk.
Issuers of securities in which the Fund may invest may default on their obligations, including to pay principal or interest when due. This non-payment would result in a reduction of income to the Fund, a reduction in the value of a security experiencing non-payment and potentially a decrease in the NAV of the Fund. With respect to the Fund’s investments that are secured, there can be no assurance that liquidation of collateral would satisfy the issuer’s obligation in the event of non-payment of scheduled dividend, interest or principal or that such collateral could be readily liquidated. In the event of the bankruptcy of an issuer, the Fund could experience delays or limitations with respect to its ability to realize the benefits of any collateral securing an investment. To the extent that the credit rating assigned to a security in the Fund’s portfolio is downgraded, the market price and liquidity of such security may be adversely affected.
Credit Spread Risk.
Credit spread risk is the risk that credit spreads (i.e., the difference in yield between securities that is due to differences in their credit quality) may increase when the market believes that securities generally have a greater risk of default. Increasing credit spreads may reduce the market values of the Fund’s securities. Credit spreads often increase more for lower rated and unrated securities than for investment grade securities. In addition, when credit spreads increase, reductions in market value will generally be greater for longer-maturity securities.
Debt Securities Risk.
Issuers of debt instruments in which the Fund may invest may default on their obligations to pay principal or interest when due. This non-payment would result in a reduction of income to the Fund, a reduction in the value of a debt instrument experiencing non-payment and, potentially, a decrease in the NAV of the Fund. There can be no assurance that liquidation of collateral would satisfy the issuer’s obligation in the event of non-payment of scheduled interest or principal or that such collateral could be readily liquidated. In the event of bankruptcy of an issuer, the Fund could experience delays or limitations with respect to its ability to realize the benefits of any collateral securing a security. To the extent that the credit rating assigned to a security in the Fund’s portfolio is downgraded, the market price and liquidity of such security may be adversely affected. In addition, decreased market making capacity has the potential to decrease liquidity and increase price volatility in the fixed income markets in which the Fund invests, particularly during periods of economic or market stress. Decreased liquidity may result in the Fund having to accept a lower price to sell a security, sell other securities to raise cash, or give up an investment opportunity, any of which could have a negative effect on performance.
Deflation Risk.
Deflation risk is the risk that prices throughout the economy decline over time. Deflation may have an adverse effect on the creditworthiness of issuers and may make issuer default more likely, which may result in a decline in the value of the Fund’s portfolio.
Depositary Receipts Risk
. Foreign securities may trade in the form of depositary receipts. In addition to investment risks associated with the underlying issuer, depositary receipts may expose the Fund to additional risks associated with non-uniform terms that apply to depositary receipt programs, including credit exposure to the depository bank and to the sponsors and other parties with whom the depository bank establishes the programs, currency, political, economic, market risks and the risks of an illiquid market for depositary receipts. Depositary receipts are generally subject to the same risks as the foreign securities that they evidence or into which they may be converted. Depositary receipts may not track
 
114

 
the price of the underlying foreign securities on which they are based, may have limited voting rights, and may have a distribution subject to a fee charged by the depository. As a result, equity shares of the underlying issuer may trade at a discount or premium to the market price of the depositary receipts.
Derivatives Risk.
The use of derivatives involves additional risks and transaction costs which could leave the Fund in a worse position than if it had not used these instruments. Derivative instruments can be used to acquire or to transfer the risk and returns of a security or other asset without buying or selling the security or asset. These instruments may entail investment exposures that are greater than their cost would suggest. As a result, a small investment in derivatives can result in losses that greatly exceed the original investment. Derivatives can be highly volatile, illiquid and difficult to value. An over-the-counter derivative transaction between the Fund and a counterparty that is not cleared through a central counterparty also involves the risk that a loss may be sustained as a result of the failure of the counterparty to the contract to make required payments. The payment obligation for a cleared derivative transaction is guaranteed by a central counterparty, which exposes the Fund to the creditworthiness of the central counterparty. The use of certain derivatives involves leverage, which can cause the Fund’s portfolio to be more volatile than if the portfolio had not been leveraged. Leverage can significantly magnify the effect of price movements of the reference asset, disproportionately increasing the Fund’s losses and reducing the Fund’s opportunities for gains when the reference asset changes in unexpected ways. In some instances, such leverage could result in losses that exceed the original amount invested.
It is possible that regulatory or other developments in the derivatives market, including changes in government regulation could adversely impact the Fund’s ability to invest in certain derivatives or successfully use derivative instruments.
Distressed or Defaulted Securities Risk.
Investments in “distressed” securities, meaning those whose issuers are experiencing financial difficulties or distress at the time the security is acquired, present a substantial risk of future default. In the event distressed securities become defaulted securities or the Fund otherwise holds defaulted securities, the Fund may incur losses, including additional expenses, to the extent it is required to seek recovery upon a default in the payment of principal or interest on those securities. In any reorganization or liquidation proceeding relating to a portfolio investment, the Fund may lose its entire investment or may be required to accept cash or securities with a value less than its original investment. Defaulted or distressed securities may be subject to restrictions on resale.
Dividend-Paying Securities Risk
.
The Fund’s investment in dividend-paying stocks could cause the Fund to underperform similar funds that invest without consideration of a company’s track record of paying dividends. Stocks of companies with a history of paying dividends may not participate in a broad market advance to the same degree as most other stocks, and a sharp rise in interest rates or economic downturn could cause a company to unexpectedly reduce or eliminate its dividend. There is no guarantee that the issuers of the stocks held by the Fund will declare dividends in the future or that, if declared, they will remain at their current levels or increase over time. The Fund may also be harmed by changes to the favorable federal income tax treatment generally afforded to dividends.
Duration Risk
.
Duration is the sensitivity, expressed in years, of the price of a fixed-income security to changes in the general level of interest rates (or yields). Securities with longer durations tend to be more sensitive to interest rate (or yield) changes, which typically corresponds to increased volatility and risk, than securities with shorter durations. For example, if a security or portfolio has a duration of three years and interest rates increase by 1%, then the security or portfolio would decline in value by approximately 3%. Duration differs from maturity in that it considers potential changes to interest rates, and a security’s coupon payments, yield, price and par value and call features, in addition to the amount of time until the security matures. The duration of a security will be expected to change over time with changes in market factors and time to maturity.
Exchange-Traded Notes (“ETNs”) Risk.
Like other index-tracking instruments, ETNs are subject to the risk that the value of the index may decline, at times sharply and unpredictably. In addition, ETNs—which are debt instruments—are subject to risk of default by the issuer. ETNs differ from ETFs. While ETFs are subject to market risk, ETNs are subject to both market risk and the risk of default by the issuer. ETNs are also subject to the risk that a liquid secondary market for any particular ETN might not be established or maintained.
Extension Risk.
Extension risk is the flip side of call or prepayment risk. Extension, or slower prepayments of the underlying mortgage loans, would extend the time it would take to receive cash flows and would generally compress the yield on non-agency RMBS and CMBS. Rising interest rates can cause the average maturity of the Fund to lengthen due to a drop in mortgage prepayments. This will increase both the sensitivity to rising interest rates and the potential for price declines of the Fund.
Financial Futures and Options Transactions Risk.
The Fund may use certain transactions for hedging the portfolio’s exposure to credit risk and the risk of increases in interest rates, which could result in poorer overall performance for the Fund. There may be an imperfect correlation between price movements of the futures and options and price movements of the portfolio securities being hedged.
If the Fund engages in futures transactions or in the writing of options on futures, it will be required to maintain initial margin and maintenance margin and may be required to make daily variation margin payments in accordance with applicable rules of the exchanges and the Commodity Futures Trading Commission (“CFTC”). If the Fund purchases a financial futures contract or a call option or writes a put option in order to hedge the anticipated purchase of securities, and if the Fund fails to complete the anticipated purchase transaction, the Fund may have a loss or a gain on the futures or options transaction that will not be offset by price movements in the securities that were the subject of the anticipatory hedge. There can be no assurance that a liquid market will exist at a time when the Fund seeks to close out a derivatives or futures or a futures option position, and the Fund would remain obligated to meet margin requirements until the position is closed.
Financial Services Sector Risk.
The Fund’s investment in securities issued by financial services companies makes the Fund more susceptible to adverse economic or regulatory occurrences affecting those companies. Investments in financial services companies includes the following risks:
 
   
financial services companies may suffer a setback if regulators change the rules under which they operate;
 
   
unstable interest rates can have a disproportionate effect on the financial services sector;
 
115

Shareholder Update
(continued)
 
   
financial services companies whose securities the Fund may purchase may themselves have concentrated portfolios, such as a high level of loans to real estate developers, which makes them vulnerable to economic conditions that affect that sector;
 
   
financial services companies have been affected by increased competition, which could adversely affect the profitability or viability of such companies; and
 
   
financial services companies have been significantly and negatively affected by the downturn in the subprime mortgage lending market and the resulting impact on the world’s economies.
Floating and Variable Rate Secur
ities
Risk.
Floating and variable rate securities provide for adjustment in the interest rate paid on the obligations. The terms of such obligations typically provide that interest rates are adjusted based upon an interest or market rate adjustment as provided in the respective obligations. The adjustment intervals may be regular, and range from daily up to annually, or may be event-based, such as based on a change in the prime rate. Because of the interest rate adjustment feature, floating and variable rate securities provide an investor with a certain degree of protection against rises in interest rates, although the investor will participate in any declines in interest rates as well. Generally, changes in interest rates will have a smaller effect on the market value of floating and variable rate securities than on the market value of comparable fixed-income obligations. Thus, investing in floating and variable rate securities generally allows less opportunity for capital appreciation and depreciation than investing in comparable fixed-income securities. Floating and variable rate securities may be subject to greater liquidity risk than other debt securities, meaning that there may be limitations on the Fund’s ability to sell the securities at any given time. Such securities also may lose value.
Foreign Currency Risk.
Because the Fund may invest in securities denominated or quoted in currencies other than the U.S. dollar, changes in foreign currency exchange rates may affect the value of securities held by the Fund and the unrealized appreciation or depreciation of investments. Currencies of certain countries may be volatile and therefore may affect the value of securities denominated in such currencies, which means that the Fund’s NAV could decline as a result of changes in the exchange rates between foreign currencies and the U.S. dollar. In addition, certain countries, particularly emerging market countries, may impose foreign currency exchange controls or other restrictions on the transferability, repatriation or convertibility of currency.
Forward Currency Contracts Risk.
Forward currency contracts are not standardized; rather, banks and dealers act as principals in these markets, negotiating each transaction on an individual basis. Forward and “cash” trading is substantially unregulated; there is no limitation on daily price movements and speculative position limits are not applicable. The principals who deal in the forward currency markets are not required to continue to make markets in the securities they trade and these markets can experience periods of illiquidity, sometimes of significant duration. There have been periods during which certain participants in these markets have refused to quote prices for certain securities or have quoted prices with an unusually wide spread between the price at which they were prepared to buy and that at which they were prepared to sell. Market illiquidity or disruption could result in major losses to the Fund. In addition, trading forward currency contracts can have the effect of financial leverage by creating additional investment exposure.
Foreign Debt Investment Risk.
Foreign investments, which may include debt securities of foreign issuers, or securities or contracts payable or denominated in non-U.S. currencies, can involve special risks that arise from one or more of the following events or circumstances: (1) changes in currency exchange rates; (2) possible imposition of market controls or currency exchange controls; (3) possible imposition of withholding taxes on dividends and interest; (4) possible seizure, expropriation or nationalization of assets; (5) more limited financial information about the foreign debt issuer or difficulties interpreting it because of foreign regulations and accounting standards; (6) lower liquidity and higher volatility in some foreign markets; (7) the impact of political, social or diplomatic events; (8) economic sanctions or other measures by the United States or other governments; (9) the difficulty of evaluating some foreign economic trends; and (10) the possibility that a foreign government could restrict an issuer from paying principal and interest on its debt obligations to investors outside the country. It may also be difficult to use foreign laws and courts to force a foreign issuer to make principal and interest payments on its debt obligations. In addition, the cost of servicing external debt will also generally be adversely affected by rising international interest rates because many external debt obligations bear interest at rates which are adjusted based upon international interest rates. To the extent the Fund invests a significant portion of its assets in the securities of companies in a single country or region, it is more likely to be impacted by events or conditions affecting that country or region. Investment in the Fund may be more exposed to a single country or a region’s economic cycles, stock market valuations and currency, which could increase its risk compared with a more geographically diversified fund. In addition, political, social, regulatory, economic or environmental events that occur in a single country or region may adversely affect the values of that country or region’s securities and thus the holdings of the Fund.
Foreign/Emerging Markets Issuer Risk.
Investments in foreign issuers involve special risks not presented by investments in U.S. issuers, including the following: (i) less publicly available information about foreign issuers or markets due to less rigorous disclosure or accounting standards or regulatory practices; (ii) many foreign markets are smaller, less liquid and more volatile; (iii) potential adverse effects of fluctuations in currency exchange rates or controls on the value of the Fund’s investments; (iv) the economies of foreign countries may grow at slower rates than expected or may experience a downturn or recession; (v) the impact of economic, political, social or diplomatic events; (vi) possible seizure of a company’s assets; (vii) restrictions imposed by foreign countries limiting the ability of foreign issuers to make payments of principal and/or interest due to blockages of foreign currency exchanges or otherwise and (viii) withholding and other foreign taxes may decrease the Fund’s return. These risks are more pronounced to the extent that the Fund invests a significant amount of its assets in issuers located in one foreign country or geographic region. In addition, investing in securities of foreign issuers located in emerging markets involves greater risks, including smaller market capitalization of securities markets, which may suffer periods of relative illiquidity; significant price volatility; restrictions on foreign investment; and possible restrictions on repatriation of investment income and capital.
Frequent Trading Risk.
The Fund’s portfolio turnover rate may exceed 100%. Frequent trading of portfolio securities may produce capital gains, which are taxable to shareholders when distributed. Frequent trading may also increase the amount of commissions or mark-ups to broker-dealers that the Fund pays when it buys and sells securities, which may detract from the Fund’s performance.
 
116

 
Growth Stock Risk.
The growth stocks in which the Fund may invest tend to be more volatile than certain other types of stocks and their prices usually fluctuate more dramatically than the overall stock market. Growth stocks may be more expensive relative to their earnings or assets compared to other types of equity securities. Accordingly, a stock with growth characteristics can have sharp price declines due to decreases in current or expected earnings and may lack dividends that can help cushion its share price in a declining market. In addition, growth stocks, at times, may not perform as well as value stocks or the stock market in general, and may be out of favor with investors for varying periods of time. Growth companies may be newer or smaller companies and may retain a large part of their earnings for research, development or investments in capital assets.
Hedging Risk.
The Fund’s use of derivatives or other transactions to reduce risk involves costs and will be subject to the investment adviser’s and/ or the sub-adviser’s ability to predict correctly changes in the relationships of such hedge instruments to the Fund’s portfolio holdings or other factors. No assurance can be given that the investment adviser’s and/or the applicable sub-adviser’s judgment in this respect will be correct, and no assurance can be given that the Fund will enter into hedging or other transactions at times or under circumstances in which it may be advisable to do so. Hedging activities may reduce the Fund’s opportunities for gain by offsetting the positive effects of favorable price movements and may result in net losses.
Income Risk.
The Fund’s level of current income could decline due to falling market interest rates. This is because, in a falling interest rate environment, the Fund generally will have to invest the proceeds from maturing portfolio securities in lower-yielding securities.
Inflation Risk.
Inflation risk is the risk that the value of assets or income from investments will be worth less in the future as inflation decreases the value of money. As inflation increases, the real value of the common shares and distributions can decline. Currently, inflation rates are elevated relative to normal market conditions and could increase.
Infrastructure Related Securities Risk.
General
. The Fund invests significantly in infrastructure related securities, which will expose the Fund to the consequences of any adverse economic, regulatory, political, legal and other changes affecting the issuers of such securities. Infrastructure related businesses are subject to a variety of factors that may adversely affect their business or operations, including high interest costs in connection with capital construction programs, high leverage, costs associated with environmental and other regulations, the effects of economic slowdown and surplus capacity, increased competition from other providers of services, uncertainties concerning the availability of fuel at reasonable prices, the effects of energy conservation policies and other factors. Additionally, infrastructure related businesses may be subject to regulation by various governmental authorities and may also be affected by governmental regulation of rates charged to customers, service interruption and/or legal challenges due to environmental, operational or other mishaps and the imposition of special tariffs and changes in tax laws, regulatory policies and accounting standards. There is also the risk that corruption may negatively affect publicly funded infrastructure projects, especially in emerging markets, resulting in delays and cost overruns.
Technological Risk.
Technological changes in the way a service or product is delivered may render existing technologies obsolete. Infrastructure assets have very few alternative uses should they become obsolete. Communications utilities may be particularly sensitive to these risks, as telecommunications products and services also may be subject to rapid obsolescence resulting from changes in consumer tastes, intense competition and strong market reactions to technological development.
Developing Industries Risk.
Some infrastructure companies are focused on developing new technologies and are strongly influenced by technological changes. Product development efforts by infrastructure companies may not result in viable commercial products. Infrastructure companies may bear high research and development costs, which can limit their ability to maintain operations during periods of organizational growth or instability. Some infrastructure companies may be in the early stages of operations and may have limited operating histories and smaller market capitalizations on average than companies in other sectors. As a result of these and other factors, the value of investments in such infrastructure issuers may be considerably more volatile than those in more established segments of the economy.
Regional Risk
. Should an event that impairs assets occur in a region where an infrastructure company operates, the performance of such infrastructure company may be adversely affected. As many infrastructure assets are not moveable, such an event may have enduring effects on the infrastructure company that are difficult to mitigate.
Strategic Asset Risk
. Infrastructure companies may control significant strategic assets. Strategic assets are assets that have a national or regional profile, and may have monopolistic characteristics. Given the national or regional profile and/or their irreplaceable nature, strategic assets may constitute a higher risk target for terrorist acts or adverse political actions.
Environmental Risk
. Infrastructure companies, in particular those in the electrical utility industry, can have substantial environmental impacts. Ordinary operations or operational accidents may cause major environmental damage, which could cause infrastructure companies significant financial distress. Community and environmental groups may protest the development or operation of assets or facilities of infrastructure companies, and these protests may induce government action to the detriment of infrastructure companies.
Political and Expropriation Risk
. Governments may attempt to influence the operations, revenue, profitability or contractual relationships of infrastructure companies or expropriate infrastructure companies’ assets. The public interest aspect of the products and services provided by infrastructure companies means political oversight will remain pervasive.
Operational Risk
. The long-term profitability of infrastructure companies is partly dependent on the efficient operation and maintenance of their assets. Infrastructure companies may be subject to service interruptions due to environmental disasters, operational accidents or terrorist activities, which may impair their ability to maintain payments of dividends or interest to investors. The destruction or loss of an asset or facility may have a major adverse impact on an infrastructure company. Failure by the infrastructure company to operate and maintain its assets or facilities appropriately or to carry appropriate, enforceable insurance could lead to significant losses.
 
117

Shareholder Update
(continued)
 
Regulatory Risk
. Many infrastructure companies are subject to significant national, regional and local government regulation, which may include how facilities are constructed, maintained and operated, environmental and safety controls and the prices they may charge for the products and services they provide. Various governmental authorities have the power to enforce compliance with these regulations and the permits issued under them, and violators are subject to administrative, civil and criminal penalties, including civil fines, injunctions or both. Stricter laws, regulations or enforcement policies could be enacted in the future which would likely increase compliance costs and may adversely affect the operations and financial performance of infrastructure issuers. Regulators that have the power to set or modify the prices infrastructure issuers can charge for their products or services can have a significant impact on the profitability of such infrastructure issuers. The returns on regulated assets or services are usually stable during regulated periods, but may be volatile during any period that rates are reset by the regulator.
Infrastructure companies may be adversely affected by additional regulatory requirements enacted in response to environmental disasters or to address ongoing environment concerns, which may impose additional costs or limit certain operations by such companies operating in various sectors. Non-U.S. infrastructure companies are also subject to regulation, although such regulations may or may not be comparable to those in the United States. Non-U.S. infrastructure companies may be more heavily regulated by their respective governments than companies in the United States and, as in the United States, may be required to seek government approval for rate increases. In addition, non-U.S. infrastructure companies in the electrical utility industry may use fuels that may cause more pollution than those used in the United States, which may require such companies to invest in pollution control equipment to meet any proposed pollution restrictions. Non-U.S. regulatory systems vary from country to country and may evolve in ways different from regulation in the United States.
Interest Rate Risk
. Due to the high costs of developing, constructing, operating and distributing assets and facilities, many infrastructure companies are highly leveraged. As such, movements in the level of interest rates may affect the returns from these assets. The structure and nature of the debt is therefore an important element to consider in assessing the interest rate risk posed by infrastructure companies. In particular, the type of facilities, maturity profile, rates being paid, fixed versus variable components and covenants in place (including how they impact returns to equity holders) are crucial factors in assessing the degree of interest rate risk.
Inflation Risk
. Many infrastructure companies may have fixed income streams and, therefore, may be unable to increase their dividends during inflationary periods. The market value of infrastructure companies may decline in value in times of higher inflation rates. The prices that an infrastructure company is able to charge users of its assets may not always be linked to inflation. In this case, changes in the rate of inflation may affect the forecast profitability of the infrastructure company.
Interest Rate Risk.
Interest rate risk is the risk that debt securities in the Fund’s portfolio will decline in value because of changes in market interest rates. Generally, when market interest rates rise, the market value of such securities will fall, and vice versa. As interest rates decline, issuers of debt securities may prepay principal earlier than scheduled, forcing the Fund to reinvest in lower-yielding securities and potentially reducing the Fund’s income. As interest rates increase, slower than expected principal payments may extend the average life of debt securities, potentially locking in a below-market interest rate and reducing the Fund’s value. In typical market interest rate environments, the prices of longer-term debt securities generally fluctuate more than prices of shorter-term debt securities as interest rates change. If the Fund invests in floating rate securities, the market value of such securities may fall in a declining interest rate environment and may also fall in a rising interest rate environment if there is a lag between the rise in interest rates and the rest. A secondary risk associated with declining interest rates is the risk that income earned by the Fund on floating rate securities may decline due to lower coupon payments on floating-rate securities.
Inverse Floating Rate Securities Risk.
In general, income on inverse floating rate securities will decrease when short-term interest rates increase and increase when short-term interest rates decrease. Investments in inverse floating rate securities may subject the Fund to the risks of reduced or eliminated interest payments and losses of principal. In addition, inverse floating rate securities may increase or decrease in value at a greater rate than the underlying interest rate, which effectively leverages the Fund’s investment. As a result, the market value of such securities generally will be more volatile than that of fixed rate securities.
The Fund may invest in inverse floating rate securities issued by special purpose trusts that have recourse to the Fund. In such instances, the Fund may be at risk of loss that exceeds its investment in the inverse floating rate securities.
The Fund may be required to sell its inverse floating rate securities at less than favorable prices, or liquidate other Fund portfolio holdings in certain circumstances, including, but not limited to, the following:
 
   
If the Fund has a need for cash and the securities in a special purpose trust are not actively trading due to adverse market conditions;
 
   
If special purpose trust sponsors (as a collective group or individually) experience financial hardship and consequently seek to terminate their respective outstanding special purpose trusts; and
 
   
If the value of an underlying security declines significantly and if additional collateral has not been posted by the Fund.
Large-Cap Company Risk.
While large-cap companies may be less volatile than those of mid-and small-cap companies, they still involve risk. To the extent the Fund invests in large-capitalization securities, the Fund may underperform funds that invest primarily in securities of smaller capitalization companies during periods when the securities of such companies are in favor. Large-capitalization companies may be unable to respond as quickly as smaller capitalization companies to competitive challenges or to changes in business, product, financial or other market conditions.
Loan Risk.
The lack of an active trading market for certain loans may impair the ability of the Fund to realize full value in the event of the need to sell a loan and may make it difficult to value such loans. Portfolio transactions in loans may settle in as short as seven days but typically can take up to two or three weeks, and in some cases much longer. As a result of these extended settlement periods, the Fund may incur losses if it is required to sell other investments or temporarily borrow to meet its cash needs. The risks associated with unsecured loans, which are not backed by a security interest in any specific collateral, are higher than those for comparable loans that are secured by specific collateral. For secured loans, there is a risk
 
118

 
that the value of any collateral securing a loan in which the Fund has an interest may decline and that the collateral may not be sufficient to cover the amount owed on the loan. Interests in loans made to finance highly leveraged companies or transactions such as corporate acquisitions may be especially vulnerable to adverse changes in economic or market conditions. Loans may have restrictive covenants limiting the ability of a borrower to further encumber its assets. However, in periods of high demand by lenders like the Fund for loan investments, borrowers may limit these covenants and weaken a lender’s ability to access collateral securing the loan; reprice the credit risk associated with the borrower; and mitigate potential loss. The Fund may experience relatively greater realized or unrealized losses or delays and expenses in enforcing its rights with respect to loans with fewer restrictive covenants. Additionally, loans may not be considered “securities” and, as a result, the Fund may not be entitled to rely on the anti-fraud protections of the securities laws. Because junior loans have a lower place in an issuer’s capital structure and may be unsecured, junior loans involve a higher degree of overall risk than senior loans of the issuer.
Master Limited Partnerships (“MLPs”) Risk.
An MLP is an investment that combines the tax benefits of a limited partnership with the liquidity of publicly traded securities. Entities commonly referred to as MLPs are generally organized under state law as limited partnerships or limited liability companies. An investment in MLP units involves risks that differ from a similar investment in equity securities, such as common stock, of a corporation. Holders of MLP units have the rights typically afforded to limited partners in a limited partnership. As compared to common stockholders of a corporation, holders of MLP units have significantly more limited rights to exercise control over the partnership and to vote on matters affecting the partnership. In addition, state law governing partnerships is often less restrictive than state law governing corporations. Accordingly, there may be fewer protections afforded investors in an MLP than investors in a corporation. Investments held by MLPs may be relatively illiquid, limiting the MLPs’ ability to vary their portfolios promptly in response to changes in economic or other conditions. MLPs may have limited financial resources and their securities may trade infrequently and in limited volumes and be subject to more abrupt or erratic price movements than securities of larger or more broadly-based companies. The Fund’s investment in MLPs also subjects the Fund to the risks associated with the specific industry or industries in which the MLPs invest. Currently, most MLPs operate in the energy, natural resources or real estate sectors. Additionally, since MLPs generally conduct business in multiple states, the Fund may be subject to income or franchise tax in each of the states in which the partnership does business. The additional cost of preparing and filing the tax returns and paying the related taxes may adversely impact the Fund’s return on its investment in MLPs. The value of any investment by the Fund in MLP units will depend on the MLP’s ability to qualify as a partnership for federal income tax purposes. If an MLP fails to meet the requirements for partnership status under the Code, or if the MLP is unable to do so because of changes in tax law or regulation, the MLP could be taxed as a corporation. In that case, the MLP would be obligated to pay federal income tax at the entity level, and distributions received by the Fund would be taxed as dividend income. The Fund may also invest in debt securities issued by MLPs.
Mortgage-Backed Securities (“MBS”) and Asset-Backed Securities (“ABS”) Risk
. These securities generally can be prepaid at any time, and prepayments that occur either more quickly or more slowly than expected can adversely impact the value of such securities. They are also subject to extension risk, which is the risk that rising interest rates could cause mortgages or other obligations underlying the securities to be prepaid more slowly than expected, thereby lengthening the duration of such securities, increasing their sensitivity to interest rate changes and causing their prices to decline. The Fund may invest in MBS and ABS that are subordinate in right of payment and rank junior to other securities that are secured by or represent an ownership interest in the same pool of assets. In addition, many of the transactions in which such securities are issued have structural features that divert payments of interest and/or principal to more senior classes when the delinquency or loss experience of the pool exceeds certain levels. As a result, such securities may be more sensitive to risk of loss, write-downs, the non-fulfillment of repurchase obligations, over-advancing on a pool of loans and the costs of transferring servicing than senior classes of securities. Further, some of the MBS and ABS in which the Fund invests may be comprised of subprime loans. Subprime loans are those made to borrowers with lower credit ratings and/or shorter credit history, who are more likely to default on their loan obligations as compared to more credit-worthy borrowers. As a result, liquidity risk is even greater for MBS and ABS comprised of subprime loans.
MBS, including CMBS and RMBS, may be negatively affected by the quality of the mortgages underlying such security, the credit quality of its issuer or guarantor, and the nature and structure of its credit support. An unexpectedly high rate of defaults on the mortgages held by a mortgage pool will adversely affect the value of MBS and will result in losses to the Fund. Privately issued mortgage-related securities are not subject to the same underwriting requirements for the underlying mortgages that are applicable to those mortgage-related securities that have government or government-sponsored entity guarantee. As a result, the mortgage loans underlying privately issued mortgage-related securities may, and frequently do, have less favorable collateral, credit risk or other underwriting characteristics than government or government-sponsored mortgage-related securities and have wider variances in a number of terms including interest rate, term, size, purpose and borrower characteristics.
Certain non-agency MBS are only entitled to payments provided for in the underlying agreement when and if funds are generated by the underlying mortgage loan pool. This likelihood of the return of interest and principal may be assessed as a credit matter. However, the holders of such non-agency MBS may not have the legal status of secured creditors, and therefore may not be able to accelerate a claim for payment on their securities or force a sale of the mortgage loan pool in the event that insufficient funds exist to pay such amounts on any date designated for such payment. The holders of such non-agency MBS do not typically have any right to remove a servicer solely as a result of a failure of the mortgage pool to perform as expected. In addition, there can be no assurance that originators and servicers of mortgage loans for non-agency MBS will not experience financial difficulties, which may increase the chances that these entities may default on their warehousing or other credit lines or become insolvent or bankrupt, thus increasing the likelihood that repurchase obligations will not be fulfilled and the potential for loss to holders of such non-agency MBS. Further, the prices of non-agency MBS may decline substantially, for reasons that may not be attributable to any of the other risks described herein. In particular, purchasing assets at what may appear to be “undervalued” levels is no guarantee that these assets will not be trading at even more “undervalued” levels at a time of valuation or at the time of sale. It may not be possible to predict, or to protect against, such “spread widening” risk.
Mortgage Roll Risk.
The risk that the Fund’s adviser or an applicable sub-adviser will not correctly predict mortgage prepayments and interest rates, which will diminish the investment performance of the Fund compared with what such performance would have been without the use of the strategy.
 
119

Shareholder Update
(continued)
 
Municipal Securities Risk.
The values of municipal securities may be adversely affected by local political and economic conditions and developments. Adverse conditions in an industry significant to a local economy could have a correspondingly adverse effect on the financial condition of local issuers. Other factors that could affect municipal securities include a change in the local, state, or national economy, a downgrade of a state’s credit rating or the rating of authorities or political subdivisions of the state, demographic factors, ecological or environmental concerns, inability or perceived inability of a government authority to collect sufficient tax or other revenues, statutory limitations on the issuer’s ability to increase taxes, and other developments generally affecting the revenue of issuers (for example, legislation or court decisions reducing state aid to local governments or mandating additional services). This risk would be heightened to the extent that the Fund invests a substantial portion of the below-investment grade quality portion of its portfolio in the bonds of similar projects (such as those relating to the education, health care, housing, transportation, or utilities industries), in industrial development bonds, or in particular types of municipal securities (such as general obligation bonds, municipal lease obligations, private activity bonds or moral obligation bonds) that are particularly exposed to specific types of adverse economic, business or political events. The value of municipal securities may also be adversely affected by rising health care costs, increasing unfunded pension liabilities, and by the phasing out of federal programs providing financial support. In recent periods, a number of municipal issuers have defaulted on obligations, been downgraded or commenced insolvency proceedings. Financial difficulties of municipal issuers may continue or worsen. In addition, the amount of public information available about municipal bonds is generally less than for certain corporate equities or bonds, meaning that the investment performance of the Fund may be more dependent on the analytical abilities of the Fund’s sub-adviser than funds that invest in stock or other corporate investments.
To the extent that a fund invests a significant portion of its assets in the securities of issuers located in a given state or U.S. territory, it will be disproportionally affected by political and economic conditions and developments in that state or territory and may involve greater risk than funds that invest in a larger universe of securities. In addition, economic, political or regulatory changes in that state or territory could adversely affect municipal securities issuers in that state or territory and therefore the value of a fund’s investment portfolio.
Natural Resource Related Securities Risk.
During periods of financial or economic instability, the securities of companies engaged in the ownership, development, exploration, production, distribution or processing of natural resources, as well as the securities of companies that are suppliers to firms producing natural resources, instruments with economic characteristics similar to natural resources securities or direct holdings of natural resources, may be subject to extreme price fluctuations, reflecting the high volatility of natural resources’ prices. In addition, the instability of the prices of particular natural resources may result in volatile earnings of natural resource companies, which could lead to volatility in their financial condition and in the value of their securities. Additionally, due to the close connection between natural resources and where they are located, securities of natural resource companies may be particularly affected by events occurring in the countries or regions where such natural resources are found. This is heightened with respect to natural resources that are scarce or that are predominantly located in particular areas.
Options Strategy Risk.
The value of call options sold (written) by the Fund will fluctuate. The Fund may not participate in any appreciation of its portfolio as fully as it would if the Fund did not sell call options. In addition, the Fund will continue to bear the risk of declines in the value of its portfolio. In employing the Fund’s option strategy, the sub-adviser seeks to reduce downside risk and volatility of the Fund’s equity portfolio. This strategy may not protect against market declines and may limit the Fund’s participation in market gains, particularly during periods when market values are increasing. This strategy may increase the Fund’s portfolio transaction costs, which could result in losses or reduce gains, and may not be successful.
Other Investment Companies Risk.
Investing in an investment company exposes the Fund to all of the risks of that investment company’s investments. The Fund, as a holder of the securities of other investment companies, will bear its pro rata portion of the other investment companies’ expenses, including advisory fees. These expenses are in addition to the direct expenses of the Fund’s own operations. As a result, the cost of investing in investment company shares may exceed the costs of investing directly in its underlying investments. In addition, securities of other investment companies may be leveraged. As a result, the Fund may be indirectly exposed to leverage through an investment in such securities and therefore magnify the Fund’s leverage risk.
With respect to ETF’s, an ETF that is based on a specific index may not be able to replicate and maintain exactly the composition and relative weighting of securities in the index. The value of an ETF based on a specific index is subject to change as the values of its respective component assets fluctuate according to market volatility. ETFs typically rely on a limited pool of authorized participants to create and redeem shares, and an active trading market for ETF shares may not develop or be maintained. The market value of shares of ETFs and closed-end funds may differ from their NAV.
Preferred Securities Risk.
Preferred securities are subordinated to bonds and other debt instruments in a company’s capital structure, and therefore are subject to greater credit risk. In addition, preferred stockholders (such as the Fund, to the extent it invests in preferred stocks of other issuers) generally have no voting rights with respect to the issuing company unless preferred dividends have been in arrears for a specified number of periods, at which time the preferred stockholders may elect a number of directors to the issuer’s board. Generally, once all the arrearages have been paid, the preferred stockholders no longer have voting rights. In the case of certain taxable preferred stocks, holders generally have no voting rights, except (i) if the issuer fails to pay dividends for a specified period of time or (ii) if a declaration of default occurs and is continuing. In such an event, rights of preferred stockholders generally would include the right to appoint and authorize a trustee to enforce the trust or special purpose entity’s rights as a creditor under the agreement with its operating company. In certain varying circumstances, an issuer of preferred stock may redeem the securities prior to a specified date. For instance, for certain types of preferred stock, a redemption may be triggered by a change in U.S. federal income tax or securities laws. As with call provisions, a redemption by the issuer may negatively impact the return of the security held by the Fund.
Prepayment Risk.
The risk that, during periods of falling interest rates, borrowers may pay off their mortgage loans sooner than expected, forcing the Fund to reinvest the unanticipated proceeds at lower interest rates, resulting in a decline in income. These risks are normally present in MBS and other ABS. For example, homeowners have the option to prepay their mortgages. Therefore, the duration of a security backed by home mortgages can shorten depending on homeowner prepayment activity. A rise in the prepayment rate and the resulting decline in duration of debt securities held by the Fund can result in losses to investors in the Fund.
 
120

 
Put Options Risk.
By writing put options, the Fund takes on the risk of declines in the value of the underlying instrument, including the possibility of a loss up to the entire strike price of each option it sells but without the corresponding opportunity to benefit from potential increases in the value of the underlying instrument. When the Fund writes a put option, it assumes the risk that it must purchase the underlying instrument at a strike price that may be higher than the market price of the instrument. If there is a broad market decline and the Fund is not able to close out its written put options, it may result in substantial losses to the Fund. The Fund will receive a premium from writing options, but the premium received may not be sufficient to offset any losses sustained from exercised put options.
Real Estate Related Securities Risk.
Real estate companies have been subject to substantial fluctuations and declines on a local, regional and national basis in the past and may continue to be in the future. Real property values and incomes from real property may decline due to general and local economic conditions, overbuilding and increased competition for tenants, increases in property taxes and operating expenses, changes in zoning laws, casualty or condemnation losses, regulatory limitations on rents, changes in neighborhoods and in demographics, increases in market interest rates, or other factors. Factors such as these may adversely affect companies that own and operate real estate directly, companies that lend to them, and companies that service the real estate industry. Equity REITs may be affected by changes in the values of and incomes from the properties they own, while mortgage REITs may be affected by the credit quality of the mortgage loans they hold. REITs are subject to other risks as well, including the fact that REITs are dependent on specialized management skills, which may affect their ability to generate cash flow for operating purposes and to make distributions to shareholders or unitholders. REITs may have limited diversification and are subject to the risks associated with obtaining financing for real property. A U.S. domestic REIT can pass its income through to shareholders or unitholders without any U.S. federal income tax at the entity level if it complies with various requirements under the Code. There is the risk that a REIT held by the Fund will fail to qualify for this tax-free pass-through treatment of its income, in which case the REIT would become subject to U.S. federal income tax. Similarly, REITs formed under the laws of non-U.S. countries may fail to qualify for corporate tax benefits made available by the governments of such countries. The Fund, as a holder of a REIT, will bear its pro rata portion of the REIT’s expenses.
Reinvestment Risk.
Reinvestment risk is the risk that income from the Fund’s portfolio will decline if and when the Fund invests the proceeds from matured, traded or called securities at market interest rates that are below the portfolio’s current earnings rate. A decline in income could affect the common shares’ market price, NAV and/or a common shareholder’s overall returns.
Restricted and Illiquid Investments Risk.
Illiquid investments are investments that are not readily marketable. These investments may include restricted investments, including Rule 144A securities, which cannot be resold to the public without an effective registration statement under the 1933 Act, or if they are unregistered may be sold only in a privately negotiated transaction or pursuant to an available exemption from registration. The Fund may not be able to readily dispose of such investments at prices that approximate those at which the Fund could sell the investments if they were more widely traded and, as a result of such illiquidity, the Fund may have to sell other investments or engage in borrowing transactions if necessary to raise cash to meet its obligations. Limited liquidity can also affect the market price of investments, thereby adversely affecting the Fund’s NAV and ability to make dividend distributions. The financial markets in general have in recent years experienced periods of extreme secondary market supply and demand imbalance, resulting in a loss of liquidity during which market prices were suddenly and substantially below traditional measures of intrinsic value. During such periods, some investments could be sold only at arbitrary prices and with substantial losses. Periods of such market dislocation may occur again at any time.
Rights and Warrants Risk.
Rights and warrants are subject to the same market risks as common stocks, but are more volatile in price. Rights and warrants do not carry the right to dividends or voting rights with respect to their underlying securities, and they do not represent any rights in the assets of the issuer. An investment in rights or warrants may be considered speculative. In addition, the value of a right or warrant does not necessarily change with the value of the underlying security and a right or warrant ceases to have value if it is not exercised prior to its expiration date. The purchase of warrants or rights involves the risk that the Fund could lose the purchase value of a right or warrant if the right to subscribe for additional shares is not exercised prior to the rights’ or warrants’ expiration. Also, the purchase of rights and warrants involves the risk that the effective price paid for the right or warrant added to the subscription price of the related security may exceed the value of the subscribed security’s market price such as when there is no movement in the price of the underlying security.
Senior Loan Risk.
Senior loans typically hold the most senior position in the capital structure of a business entity, are typically secured with specific collateral and have a claim on the assets and/or stock of the issuer that is senior to that held by subordinated debt holders and stockholders of the issuer. Senior loans are usually rated below investment grade, and share the same risks of other below investment grade debt instruments.
Although the Fund may invest in senior loans that are secured by specific collateral, there can be no assurance that the liquidation of such collateral would satisfy an issuer’s obligation to the Fund in the event of issuer default or that such collateral could be readily liquidated under such circumstances. If the terms of a senior loan do not require the issuer to pledge additional collateral in the event of a decline in the value of the already pledged collateral, the Fund will be exposed to the risk that the value of the collateral will not at all times equal or exceed the amount of the issuer’s obligations under the senior loan.
In the event of bankruptcy of an issuer, the Fund could also experience delays or limitations with respect to its ability to realize the benefits of any collateral securing a senior loan. Some senior loans are subject to the risk that a court, pursuant to fraudulent conveyance or other similar laws, could subordinate the senior loans to presently existing or future indebtedness of the issuer or take other action detrimental to lenders, including the Fund. Such court action could, under certain circumstances, include invalidation of senior loans.
Senior Loan Agent Risk.
A financial institution’s employment as an agent under a senior loan might be terminated if it fails to observe a requisite standard of care or becomes insolvent. A successor agent would generally be appointed to replace the terminated agent, and assets held by the agent under the loan agreement would likely remain available to holders of such indebtedness. However, if assets held by the terminated agent for the benefit of the Fund were determined to be subject to the claims of the agent’s general creditors, the Fund might incur certain costs and delays in realizing payment on a senior loan or loan participation and could suffer a loss of principal and/or interest. In situations involving other interposed financial institutions (e.g., an insurance company or government agency) similar risks may arise.
 
121

Shareholder Update
(continued)
 
Small and Mid-Cap Company Risk.
Smaller and medium-sized company stocks can be more volatile than, and perform differently from, larger company stocks. There may be less trading in the stock of a smaller or medium-sized company, which means that buy and sell transactions in that stock could have a larger impact on the stock’s price than is typically the case with larger company stocks. Smaller and medium-sized companies may have fewer business lines; changes in any one line of business, therefore, may have a greater impact on a smaller or medium-sized company’s stock price than is the case for a larger company. As a result, the purchase or sale of more than a limited number of shares of a small or medium-sized company may affect its market price. The Fund may need a considerable amount of time to purchase or sell its positions in these securities. In addition, smaller or medium-sized company stocks may not be well known to the investing public.
Sovereign Government and Supranational Debt Risk.
Investments in sovereign debt, including supranational debt, involves special risks. Foreign governmental issuers of debt or the governmental authorities that control the repayment of the debt may be unable or unwilling to repay principal or pay interest when due. In the event of default, there may be limited or no legal recourse in that, generally, remedies for defaults must be pursued in the courts of the defaulting party. Political conditions, especially a sovereign entity’s willingness to meet the terms of its debt obligations, are of considerable significance. The ability of a foreign sovereign issuer, especially an emerging market country, to make timely payments on its debt obligations will also be strongly influenced by the sovereign issuer’s balance of payments, including export performance, its access to international credit facilities and investments, fluctuations of interest rates and the extent of its foreign reserves. A country whose exports are concentrated in a few commodities or whose economy depends on certain strategic imports could be vulnerable to fluctuations in international prices of these commodities or imports. If a sovereign issuer cannot generate sufficient earnings from foreign trade to service its external debt, it may need to depend on continuing loans and aid from foreign governments, commercial banks, and multinational organizations. The cost of servicing external debt will also generally be adversely affected by rising international interest rates, as many external debt obligations bear interest at rates which are adjusted based upon international interest rates. Foreign investment in certain sovereign debt is restricted or controlled to varying degrees, including requiring governmental approval for the repatriation of income, capital or proceeds of sales by foreign investors. There are no bankruptcy proceedings similar to those in the U.S. by which defaulted sovereign debt may be collected.
Special Purpose Acquisition Companies (“SPACs”) Risk.
Unless and until an acquisition is completed, a SPAC generally invests its assets (less a portion retained to cover expenses) in U.S. government securities, money market funds and similar investments whose returns or yields may be significantly lower than those of the Fund’s other investments. If an acquisition that meets the requirements for the SPAC is not completed within the pre-established period of time, the invested funds are returned to the SPAC’s shareholders, less certain permitted expenses, and any warrants issued by the SPAC will expire worthless. SPACs have no operating history or ongoing business other than seeking acquisitions. The value of a SPAC’s securities is particularly dependent on the ability of its management to identify and complete a profitable acquisition. There is no guarantee that any SPAC which the Fund invests may will complete an acquisition or that any acquisitions completed by such SPAC will be profitable. Public stockholders of SPACs, such as the Fund, may not be afforded a meaningful opportunity to vote on a proposed initial business combination because certain stockholders, including stockholders affiliated with the management of the SPAC, may have sufficient voting power, and a financial incentive, to approve such a transaction without support from public stockholders. As a result, a SPAC may complete a transaction even though a majority of its public stockholders do not support such a business combination. Some SPACs may pursue acquisitions or mergers only within certain industries or regions, which may lead to an increase in the volatility of their prices following completion of a business combination. An investment in SPACs, which are typically traded in the over-the-counter market, may also have little or no liquidity and may be subject to restrictions on resale.
Special Risks for Inflation-Indexed Bonds.
The risk that market values of inflation-indexed investments held by the Fund may be adversely affected by a number of factors, including changes in the market’s inflation expectations, changes in real rates of interest or declines in inflation (or deflation). There is a risk that interest payments in inflation-indexed investments may fall because of a decline in inflation (or deflation). In addition, the Consumer Price Index for All Urban Consumers (“CPI-U”) may not accurately reflect the true rate of inflation. If the market perceives that any of these events have occurred, then the market value of those investments could be adversely affected.
Swap Transactions Risk.
Like most derivative instruments, the use of swaps is a highly specialized activity that involves investment techniques and risks different from those associated with ordinary portfolio securities transactions. In addition, the use of swaps requires an understanding by the investment adviser and/or the applicable sub-adviser of not only the referenced asset, rate or index, but also of the swap itself. If the investment adviser and/or the applicable sub-adviser is incorrect in its forecasts of default risks, market spreads or other applicable factors or events, the investment performance of the Fund would diminish compared with what it would have been if these techniques were not used.
Unrated Securities Risk.
Unrated securities determined by the Fund’s investment adviser to be of comparable quality to rated investments which the Fund may purchase may pay a higher dividend or interest rate than such rated investments and be subject to a greater risk of illiquidity or price changes. Less public information is typically available about unrated investments or issuers than rated investments or issuers. Some unrated securities may not have an active trading market or may be difficult to value, which means the Fund might have difficulty selling them promptly at an acceptable price. To the extent that the Fund invests in unrated securities, the Fund’s ability to achieve its investment objectives will be more dependent on the investment adviser’s credit analysis than would be the case when the Fund invests in rated securities.
U.S. Government Securities Risk.
U.S. government securities are guaranteed only as to the timely payment of interest and the payment of principal when held to maturity. Accordingly, the current market values for these securities will fluctuate with changes in interest rates. Securities issued or guaranteed by U.S. government agencies and instrumentalities are supported by varying degrees of credit but generally are not backed by the full faith and credit of the U.S. government. No assurance can be given that the U.S. government will provide financial support to its agencies and instrumentalities if it is not obligated by law to do so.
Unseasoned Company Risk.
Investments in unseasoned companies may involve greater risks than customarily are associated with investments in securities of more established companies. Securities of unseasoned companies may lack an active secondary market and may be subject to more abrupt or erratic price movements than securities of larger, more established companies or stock market averages in general. Less seasoned companies may seek to compete in markets and industries in which there are more established companies with substantially greater financial resources than they have, which could place such less seasoned companies at a significant competitive disadvantage and make it difficult for them to gain market share.
 
122

 
Valuation Risk.
Certain securities in which the Fund invests typically are valued by a pricing service utilizing a range of market-based inputs and assumptions, including readily available market quotations obtained from broker-dealers making markets in such instruments, cash flows and transactions for comparable instruments. There is no assurance that the Fund will be able to sell a portfolio security at the price established by the pricing service, which could result in a loss to the Fund. Pricing services generally price securities assuming orderly transactions of an institutional “round lot” size, but some trades may occur in smaller, “odd lot” sizes, often at lower prices than institutional round lot trades. Different pricing services may incorporate different assumptions and inputs into their valuation methodologies, potentially resulting in different values for the same securities. As a result, if the Fund were to change pricing services, or if the Fund’s pricing service were to change its valuation methodology, there could be a material impact, either positive or negative, on the Fund’s NAV.
Value Stock Risk.
Value stocks are securities of companies that typically trade at a perceived discount to their intrinsic value and at valuation discounts relative to companies in the same industry. Value stocks are often also in sectors that trade at a discount to the broader market. The reasons for their discount may vary greatly, but some examples may include adverse business, industry or other developments that may cause the company to be subject to special risks. The intrinsic value of a stock with value characteristics may be difficult to identify and may not be fully recognized by the market for a long time or a stock identified to be undervalued may actually be appropriately priced at a low level.
When-Issued and Delayed-Delivery Transactions Risk.
When-issued and delayed-delivery transactions may involve an element of risk because no interest accrues on the securities prior to settlement and, because securities are subject to market fluctuations, the value of the securities at time of delivery may be less (or more) than their cost. A separate account of the Fund will be established with its custodian consisting of cash equivalents or liquid securities having a market value at all times at least equal to the amount of any delayed payment commitment.
Whole Loans, Loan Participations and Other Mortgage-Related Interests Risk.
Whole loans and loan participations represent undivided (in the case of the whole loans) and fractional (in the case of loan participations) interests in individual loans secured by residential real estate, including multi-family and/or single family residences, or commercial real estate, including shopping malls, retail space, office buildings and/or industrial or warehouse properties. The market values of and cash flows to these instruments are highly dependent on creditworthiness and economic situation of the particular borrowers under each loan, and therefore the performance of individual whole loans and loan participations may suffer even when general economic conditions are favorable. Whole loans and loan participations also may subject the Fund to a greater risk of loss arising from defaults by borrowers under the related loans than do mortgage-backed securities because whole loans and loan participations, unlike most mortgage-backed securities, generally are not backed by any government guarantee or private credit enhancement. Such risks may be greater during a period of declining or stagnant real estate values. The individual loans underlying whole loans and loan participations may be larger than those underlying mortgage-backed securities. There may be certain costs and delays in the event of a foreclosure, and there is no assurance that the subsequent sale of the property will produce an amount equal to the sum of the unpaid principal balance of the loan as of the date the borrower went into default, accrued but unpaid interest and all foreclosure expenses, in which case the Fund may suffer a loss. In addition to the foregoing, with respect to loan participations, the Fund generally will not be able to unilaterally enforce its rights in the event of a default, but rather will be dependent upon the cooperation of the other participation holders.
Investment in whole loans and loan participations relating to multi-family residential properties may subject the Fund to a higher level of risk than investment in whole loans and loan participations relating to other residential properties. Multi-family lending is generally viewed as involving a greater risk of loss than one- to four-family residential lending. Multi-family lending typically involves larger loans to single borrowers or groups of related borrowers than residential one- to four-family mortgage loans. Furthermore, the repayment of loans secured by income-producing multifamily properties is typically dependent upon the successful operation of the underlying real estate project. If the cash flow from the project is reduced (for example, if leases are not obtained or renewed), the borrower’s ability to repay the multi-family loan may be impaired. The market values of and cash flow to multi-family real estate can be affected significantly by supply and demand in the local market for the residential rental property and, therefore, the value to the Fund of any whole loans or loan participations relating to multi-family properties will be highly sensitive to changes in the local economic conditions where such multi-family properties are located. In addition, market values may vary as a result of economic events or governmental regulations outside the control of the borrower or lender, such as rent control laws, which impact the future cash flow to the property.
Investment in whole loans and loan participations relating to commercial properties may subject the Fund to certain risks that do not typically apply to investment in whole loans and loan participations relating to residential properties. Market values of and cash flows to commercial real estate may be adversely affected by declines in rental or occupancy rates and extended vacancies, the management skills of the borrower or third-party manager operating a business at the commercial property, overbuilding and changes in zoning laws and other environmental and land use regulations. Mortgage loans relating to commercial properties are also generally not fully amortizing, meaning they may have a significant “balloon” payment due at maturity. Loans with a balloon payment may be riskier than fully amortizing loans because the ability of a borrower to make a balloon payment will typically depend on its ability to either refinance the loan or sell the property, which the borrower may not be able to accomplish on commercially acceptable terms, if at all. In addition, mortgage loans relating to commercial properties are typically non-recourse to the borrowers, resulting in a higher risk of loss in the event of a foreclosure.
Certain loan participations held by the Fund may continue to have the mortgage servicers reflected as record owners of the underlying mortgages. Accordingly, if the mortgage servicer under a particular loan participation were to become insolvent, to have a receiver, conservator or similar official appointed for it by an appropriate regulatory authority or to become a debtor in a bankruptcy proceeding, there is a risk that the Fund’s rights to payments under the loan participation could become subject to the claims of the mortgage servicer’s creditors, which would adversely affect the value of the loan participation to the Fund. The Fund could also incur costs and delays in enforcing its rights to such payments.
Whole loans and loan participations are illiquid and may be difficult to sell when the sub-adviser deems it advisable to do so. See “Illiquid Securities Risk” above. Whole loans and loan participations, like mortgage-backed securities, are also subject to pre-payment risk, which is the risk that the borrowers under the mortgage loans might pay off their mortgage loans sooner than expected, which could happened when interest rates fall or for other reasons, which could cause the value of the Fund’s whole loans and loan participations to fall. Moreover, if the mortgage loans are paid off sooner than expected, the Fund may have to reinvest the proceeds in other securities that have lower yields.
 
123

Shareholder Update
(continued)
 
Zero Coupon or Pay-In-Kind Securities Risk.
Zero coupon and pay-in-kind securities may be subject to greater fluctuation in value and less liquidity in the event of adverse market conditions than comparably rated securities paying cash interest at regular interest payment periods. Prices on non-cash-paying instruments may be more sensitive to changes in the issuer’s financial condition, fluctuation in interest rates and market demand/supply imbalances than cash-paying securities with similar credit ratings, and thus may be more speculative.
Fund Level and Other Risks:
Allocation Risk.
The Fund’s ability to achieve its investment objective depends upon Nuveen Asset Management’s skill in determining the Fund’s allocation to different sub-advisers and strategies. There is the risk that Nuveen Asset Management’s evaluations and assumptions used in making such allocations may be incorrect.
Anti-Takeover Provisions.
The Declaration of Trust and the Fund’s by-laws include provisions that could limit the ability of other entities or persons to acquire control of the Fund or convert the Fund to open-end status. These provisions could have the effect of depriving the Common Shareholders of opportunities to sell their Common Shares at a premium over the then-current market price of the Common Shares.
Borrowing Risk.
In addition to borrowing for leverage, the Fund may borrow for temporary or emergency purposes, to pay dividends, repurchase its shares, or clear portfolio transactions. Borrowing may exaggerate changes in the NAV of the Fund’s shares and may affect the Fund’s net income. When the Fund borrows money, it must pay interest and other fees, which will reduce the Fund’s returns if such costs exceed the returns on the portfolio securities purchased or retained with such borrowings. Any such borrowings are intended to be temporary. However, under certain market circumstances, such borrowings might be outstanding for longer periods of time.
Cybersecurity Risk.
The Fund and its service providers are susceptible to operational and information security risk resulting from cyber incidents. Cyber incidents refer to both intentional attacks and unintentional events including: processing errors, human errors, technical errors including computer glitches and system malfunctions, inadequate or failed internal or external processes, market-wide technical-related disruptions, unauthorized access to digital systems (through “hacking” or malicious software coding), computer viruses, and cyber-attacks which shut down, disable, slow or otherwise disrupt operations, business processes or website access or functionality (including denial of service attacks). Cyber incidents could adversely impact the Fund and cause the Fund to incur financial loss and expense, as well as face exposure to regulatory penalties, reputational damage, and additional compliance costs associated with corrective measures. In addition, substantial costs may be incurred in order to prevent any cyber incidents in the future. Furthermore, the Fund cannot control the cybersecurity plans and systems put in place by its service providers or any other third parties whose operations may affect the Fund.
Distribution Risk.
The Fund’s distributions will be composed of net investment income and a supplemental amount generally representing the potential for capital appreciation, which will take the form of realized capital gains and/or a return of capital. The return of capital component of a Fund distribution may (but will not necessarily) represent unrealized capital gains. A return of capital is a non-taxable distribution of a portion of the Fund’s capital. If over the life of a shareholder’s investment, the total return of the Fund’s overall strategy is less than the distribution rate, a return of capital will represent a portion of a shareholder’s original principal (in effect a partial return of the amount a shareholder invested in the Fund). A return of capital reduces a shareholder’s tax cost basis (but not below zero) in Fund shares, which could result in more taxable gain or less taxable loss when the shareholder sells their shares. This may cause the shareholder to pay taxes even if he or she sells shares for less than the original price. The Fund’s distribution policy, rate of distributions on the Common Shares and the portion of distributions composed of net investment income, realized capital gain and return of capital may vary over time. Shareholders who periodically receive the payment of a distribution consisting of a return of capital may be under the impression that they are receiving net income or profits when they are not. Shareholders should not assume that the source of a return of capital distribution from the Fund is net income or profit.
Global Economic Risk.
National and regional economies and financial markets are becoming increasingly interconnected, which increases the possibilities that conditions in one country, region or market might adversely impact issuers in a different country, region or market. Changes in legal, political, regulatory, tax and economic conditions may cause fluctuations in markets and asset prices around the world, which could negatively impact the value of the Fund’s investments. Major economic or political disruptions, particularly in large economies, may have global negative economic and market repercussions. Additionally, instability in various countries, war, natural and environmental disasters, the spread of infectious illnesses or other public health emergencies, terrorist attacks in the United States and around the world, growing social and political discord in the United States, debt crises, the response of the international community—through economic sanctions and otherwise—to international events, further downgrade of U.S. government securities, changes in the U.S. president or political shifts in Congress, trade disputes and other similar events may adversely affect the global economy and the markets and issuers in which the Fund invests. These events could reduce consumer demand or economic output, result in market closure, travel restrictions or quarantines, and generally have a significant impact on the global economy. These events could also impair the information technology and other operational systems upon which the Fund’s service providers, including the Fund’s sub-adviser, rely, and could otherwise disrupt the ability of employees of the Fund’s service providers to perform essential tasks on behalf of the Fund.
The Fund does not know and cannot predict how long the securities markets may be affected by these events, and the future impact of these and similar events on the global economy and securities markets is uncertain. The Fund may be adversely affected by abrogation of international agreements and national laws which have created the market instruments in which the Fund may invest, failure of the designated national and international authorities to enforce compliance with the same laws and agreements, failure of local, national and international organizations to carry out the duties prescribed to them under the relevant agreements, revisions of these laws and agreements which dilute their effectiveness or conflicting interpretation of provisions of the same laws and agreements.
Governmental and quasi-governmental authorities and regulators throughout the world have in the past responded to major economic disruptions with a variety of significant fiscal and monetary policy changes, including but not limited to, direct capital infusions into companies, new monetary programs and dramatically lower interest rates. An unexpected or quick reversal of these policies, or the ineffectiveness of these policies, could increase volatility in securities markets, which could adversely affect the Fund’s investments.
 
124

 
Investment and Market Risk.
An investment in common shares is subject to investment risk, including the possible loss of the entire principal amount that you invest. Common shares frequently trade at a discount to their NAV. An investment in common shares represents an indirect investment in the securities owned by the Fund. Common shares at any point in time may be worth less than your original investment, even after taking into account the reinvestment of Fund dividends and distributions.
Legislation and Regulatory Risk.
At any time after the date of this report, legislation or additional regulations may be enacted that could negatively affect the assets of the Fund, securities held by the Fund or the issuers of such securities. Fund shareholders may incur increased costs resulting from such legislation or additional regulation. There can be no assurance that future legislation, regulation or deregulation will not have a material adverse effect on the Fund or will not impair the ability of the Fund to achieve its investment objectives.
Leverage Risk.
The use of leverage creates special risks for common shareholders, including potential interest rate risks and the likelihood of greater volatility of NAV and market price of, and distributions on, the common shares. The use of leverage in a declining market will likely cause a greater decline in the Fund’s NAV, which may result at a greater decline of the common share price, than if the Fund were not to have used leverage.
Certain types of leverage may result in the Fund being subject to certain covenants, asset coverage or other portfolio composition limits by its lenders, debt or preferred securities purchasers, rating agencies that may rate the debt or preferred securities, or reverse repurchase counterparties. Such limitations may be more stringent than those imposed by the 1940 Act and may impact whether the Fund is able to maintain its desired amount of leverage. In addition, whenever the Fund incurs borrowings and/or preferred shares are outstanding, Common Shareholders will not be entitled to receive any cash distributions from the Fund unless all interest on such borrowings has been paid and all accumulated dividends on preferred shares have been paid, unless asset coverage (as defined in the 1940 Act) with respect to any borrowings would be at least 300% after giving effect to the distributions and asset coverage (as defined in the 1940 Act) with respect to preferred shares would be at least 200% after giving effect to the distributions.
The Fund will pay (and common shareholders will bear) any costs and expenses relating to the Fund’s use of leverage, which will result in a reduction in the Fund’s NAV. The investment adviser may, based on its assessment of market conditions and composition of the Fund’s holdings, increase or decrease the amount of leverage. Such changes may impact the Fund’s distributions and the price of the common shares in the secondary market. There is no assurance that the Fund’s use of leverage will be successful.
The Fund may seek to refinance its leverage over time, in the ordinary course, as current forms of leverage mature or it is otherwise desirable to refinance; however, the form that such leverage will take cannot be predicted at this time. If the Fund is unable to replace existing leverage on comparable terms, its costs of leverage will increase. Accordingly, there is no assurance that the use of leverage may result in a higher yield or return to common shareholders.
The amount of fees paid to the investment adviser and the applicable sub-adviser for investment advisory services will be higher if the Fund uses leverage because the fees will be calculated based on the Fund’s Managed Assets - this may create an incentive for the investment adviser and the applicable sub-adviser to leverage the Fund or increase the Fund’s leverage.
Market Discount from Net Asset Value.
Shares of closed-end investment companies like the Fund frequently trade at prices lower than their NAV. This characteristic is a risk separate and distinct from the risk that the Fund’s NAV could decrease as a result of investment activities. Whether investors will realize gains or losses upon the sale of the common shares will depend not upon the Fund’s NAV but entirely upon whether the market price of the common shares at the time of sale is above or below the investor’s purchase price for the common shares. Furthermore, management may have difficulty meeting the Fund’s investment objectives and managing its portfolio when the underlying securities are redeemed or sold during periods of market turmoil and as investors’ perceptions regarding closed-end funds or their underlying investments change. Because the market price of the common shares will be determined by factors such as relative supply of and demand for the common shares in the market, general market and economic circumstances, and other factors beyond the control of the Fund, the Fund cannot predict whether the common shares will trade at, below or above NAV. The common shares are designed primarily for long-term investors, and you should not view the Fund as a vehicle for short-term trading purposes.
Multi-Manager Risk.
The interplay of the various strategies employed by portfolio managers of Nuveen and its affiliates may result in the Fund holding a significant amount of certain types of securities. This may be beneficial or detrimental to the Fund’s performance depending upon the performance of those securities and the overall economic environment. The portfolio managers may make investment decisions which conflict with each other; for example, at any particular time, portfolio managers of one strategy may be purchasing shares of an issuer whose shares are being sold by portfolio managers of another strategy. Consequently, the Fund could indirectly incur transaction costs without accomplishing any net investment result. In addition, the multi-manager approach could increase the Fund’s portfolio turnover rate which may result in higher transaction costs and a greater amount of tax on the Fund’s shareholders.
Recent Market Conditions.
Periods of unusually high financial market volatility and restrictive credit conditions, at times limited to a particular sector or geographic area, have occurred in the past and may be expected to recur in the future. Some countries, including the United States, have adopted or have signaled protectionist trade measures, including the imposition of tariffs, relaxation of the financial industry regulations that followed the financial crisis, and/or reductions to corporate taxes. The scope of these policy changes is still developing, but the equity and debt markets may react strongly to expectations of change, which could increase volatility, particularly if a resulting policy runs counter to the market’s expectations. The outcome of such changes cannot be foreseen at the present time. In addition, geopolitical and other risks, including environmental and public health risks, may add to instability in the world economy and markets generally. As a result of increasingly interconnected global economies and financial markets, the value and liquidity of the Fund’s investments may be negatively affected by events impacting a country or region, regardless of whether the Fund invests in issuers located in or with significant exposure to such country or region.
Ukraine has experienced ongoing military conflict, most recently commencing in February 2022 when Russia invaded Ukraine; this conflict may expand and military attacks could occur elsewhere in Europe. Europe has also been struggling with mass migration from the Middle East and Africa. The ultimate effects of these events and other socio-political or geographical issues are not known but could profoundly affect global economies and
 
125

Shareholder Update
(continued)
 
markets. Additionally, in October 2023 armed conflict broke out between Israel and the militant group Hamas after Hamas infiltrated Israel’s southern border from the Gaza Strip. Israel has since declared war against Hamas and this conflict has escalated into a greater regional conflict. The ultimate effects of these events and other socio-political or geographical issues are not known but could profoundly affect global economies and markets.
The ongoing trade war between China and the United States, including the imposition of tariffs by each country on the other country’s products, has created a tense political environment. These actions may trigger a significant reduction in international trade, adverse effects in the supply of certain manufactured goods, substantial adverse price changes for goods and possible failure of individual companies and/or large segments of China’s export industry and U.S. importers, which could have a negative impact on the Fund’s performance. U.S. companies that source material and goods from China and those that make large amounts of sales in China would are vulnerable to an escalation of trade tensions. Beginning in early 2025, the United States also imposed tariffs on other countries, including Mexico and Canada. The possibility of additional tariffs being imposed or the outbreak of a trade war may adversely impact U.S. and international markets. Uncertainty regarding the outcome of the trade tensions and the potential for a trade war could cause the U.S. dollar to decline further. Events such as these and their consequences are difficult to predict and it is unclear whether further tariffs may be imposed or other escalating actions may be taken in the future. Additionally, political uncertainty regarding U.S. policy, including the U.S. government’s approach to trade, may impact the markets and the Fund’s performance.
The U.S. Federal Reserve (the “Fed”) has in the past sharply raised interest rates, and has signaled an intention to maintain relatively higher interest rates until current inflation levels re-align with the Fed’s long-term inflation target. Changing interest rate environments impact the various sectors of the economy in different ways. For example, in March 2023, the Federal Deposit Insurance Corporation (“FDIC”) was appointed receiver for each of Silicon Valley Bank and Signature Bank, the second- and third-largest bank failures in U.S. history, which failures may be attributable, in part, to rising interest rates. Bank failures may have a destabilizing impact on the broader banking industry or markets generally.
The impact of these developments in the near- and long-term is unknown and could have additional adverse effects on economies, financial markets and asset valuations around the world.
Reverse Repurchase Agreement Risk.
A reverse repurchase agreement, in economic essence, constitutes a securitized borrowing by the Fund from the security purchaser. The Fund may enter into reverse repurchase agreements for the purpose of creating a leveraged investment exposure and, as such, their usage involves essentially the same risks associated with a leveraging strategy generally since the proceeds from these agreements may be invested in additional portfolio securities. Reverse repurchase agreements tend to be short-term in tenor, and there can be no assurances that the purchaser (lender) will commit to extend or “roll” a given agreement upon its agreed-upon repurchase date or an alternative purchaser can be identified on similar terms. Reverse repurchase agreements also involve the risk that the purchaser fails to return the securities as agreed upon, files for bankruptcy or becomes insolvent. The Fund may be restricted from taking normal portfolio actions during such time, could be subject to loss to the extent that the proceeds of the agreement are less than the value of securities subject to the agreement and may experience adverse tax consequences.
Fund Tax Risk.
The Fund has elected to be treated and intends to qualify each year as a Regulated Investment Company (“RIC”) under the Internal Revenue Code of 1986, as amended (the “Code”). As a RIC, the Fund is not expected to be subject to U.S. federal income tax to the extent that it distributes its investment company taxable income and net capital gains. To qualify for the special tax treatment available to a RIC, the Fund must comply with certain investment, distribution, and diversification requirements. Under certain circumstances, the Fund may be forced to sell certain assets when it is not advantageous in order to meet these requirements, which may reduce the Fund’s overall return. If the Fund fails to meet any of these requirements, subject to the opportunity to cure such failures under applicable provisions of the Code, the Fund’s income would be subject to a double level of U.S. federal income tax. The Fund’s income, including its net capital gain, would first be subject to U.S. federal income tax at regular corporate rates, even if such income were distributed to shareholders and, second, all distributions by the Fund from earnings and profits, including distributions of net capital gain (if any), would be taxable to shareholders as dividends.
 
126

 
EFFECTS OF LEVERAGE
The following table is furnished in response to requirements of the SEC. It is designed to illustrate the effects of leverage through the use of senior securities, as that term is defined under Section 18 of the 1940 Act, as well as certain other forms of leverage, on common share total return, assuming investment portfolio total returns (consisting of income and changes in the value of investments held in the Fund’s portfolio) of -10%, -5%, 0%, 5% and 10%. The table below reflects the Fund’s (i) continued use of leverage as of December 31, 2025 as a percentage of Managed Assets (including assets attributable to such leverage), (ii) the estimated annual effective interest expense rate payable by the Fund on such instruments (based on actual leverage costs incurred during the fiscal year ended December 31, 2025) as set forth in the table, and (iii) the annual return that the Fund’s portfolio must experience (net of expenses) in order to cover such costs of leverage based on such estimated annual effective interest expense rate. The information below does not reflect any Fund’s use of certain other forms of economic leverage achieved through the use of certain derivative instruments.
The numbers are merely estimates, used for illustration. The costs of leverage may vary frequently and may be significantly higher or lower than the estimated rate. The assumed investment portfolio returns in the table below are hypothetical figures and are not necessarily indicative of the investment portfolio returns experienced or expected to be experienced by the Fund. Your actual returns may be greater or less than those appearing below.
 
     
NMAI 
    
   JRI   
  
   JRS   
Estimat
ed
Leverage as a Percentage of Managed Assets (Including Assets Attributable to Leverage)
  
 
30.48% 
 
  
31.78
%
  
30.15%
Estimated Annual Effective Leverage Expense Rate Payable by Fund on Leverage
  
 
4.75% 
 
  
4.94%
  
4.89%
Annual Return Fund Portfolio Must Experience (net of expenses) to Cover Estimated Annual Effective Interest Expense Rate on Leverage
  
 
1.45% 
 
  
1.57%
  
1.48%
Common Share Total Return for (10.00)% Assumed Portfolio Total Return
  
 
(16.47)% 
 
  
(16.96)%
  
(16.43)%
Common Share Total Return for (5.00)% Assumed Portfolio Total Return
  
 
(9.27)% 
 
  
(9.63)%
  
(9.27)%
Common Share Total Return for 0.00% Assumed Portfolio Total Return
  
 
(2.08)% 
 
  
(2.30)%
  
(2.11)%
Common Share Total Return for 5.00% Assumed Portfolio Total Return
  
 
5.11% 
 
  
5.03%
  
5.05%
Common Share Total Return for 10.00% Assumed Portfolio Total Return
  
 
12.30% 
 
  
12.36%
  
12.20%
Common Share total return is composed of two elements — the distributions paid by the Fund to holders of common shares (the amount of which is largely determined by the net investment income of the Fund after paying dividend payments on any preferred shares issued by the Fund and expenses on any forms of leverage outstanding) and gains or losses on the value of the securities and other instruments the Fund owns. As required by SEC rules, the table assumes that the Fund are more likely to suffer capital losses than to enjoy capital appreciation. For example, to assume a total return of 0%, the Fund must assume that the income it receives on its investments is entirely offset by losses in the value of those investments. This table reflects hypothetical performance of the Fund’s portfolio and not the actual performance of the Fund’s common shares, the value of which is determined by market forces and other factors. Should the Fund elect to add additional leverage to its portfolio, any benefits of such additional leverage cannot be fully achieved until the proceeds resulting from the use of such leverage have been received by the Fund and invested in accordance with the Fund’s investment objectives and policies. As noted above, the Fund’s willingness to use additional leverage, and the extent to which leverage is used at any time, will depend on many factors.
 
127

Shareholder Update
(continued)
 
DIVIDEND REINVESTMENT PLAN
Nuveen Closed-End Funds Automatic Reinvestment Plan
Your Nuveen Closed-End Fund allows you to conveniently reinvest distributions in additional Fund shares. By choosing to reinvest, you’ll be able to invest money regularly and automatically, and watch your investment grow through the power of compounding. Just like distributions in cash, there may be times when income or capital gains taxes may be payable on distributions that are reinvested. It is important to note that an automatic reinvestment plan does not ensure a profit, nor does it protect you against loss in a declining market.
Easy and convenient
To make recordkeeping easy and convenient, each quarter you’ll receive a statement showing your total distributions, the date of investment, the shares acquired and the price per share, and the total number of shares you own.
How shares are purchased
The shares you acquire by reinvesting will either be purchased on the open market or newly issued by the Fund. If the shares are trading at or above NAV at the time of valuation, the Fund will issue new shares at the greater of the NAV or 95% of the then-current market price. If the shares are trading at less than NAV, shares for your account will be purchased on the open market. If Computershare Trust Company, N.A. (the “Plan Agent”) begins purchasing Fund shares on the open market while shares are trading below NAV, but the Fund’s shares subsequently trade at or above their NAV before the Plan Agent is able to complete its purchases, the Plan Agent may cease open-market purchases and may invest the uninvested portion of the distribution in newly-issued Fund shares at a price equal to the greater of the shares’ NAV or 95% of the shares’ market value on the last business day immediately prior to the purchase date. Distributions received to purchase shares in the open market will normally be invested shortly after the distribution payment date. No interest will be paid on distributions awaiting reinvestment. Because the market price of the shares may increase before purchases are completed, the average purchase price per share may exceed the market price at the time of valuation, resulting in the acquisition of fewer shares than if the distribution had been paid in shares issued by the Fund. A pro rata portion of any applicable brokerage commissions on open market purchases will be paid by Dividend Reinvestment Plan (the “Plan”) participants. These commissions usually will be lower than those charged on individual transactions.
Flexible
You may change your distribution option or withdraw from the Plan at any time, should your needs or situation change. You can reinvest whether your shares are registered in your name, or in the name of a brokerage firm, bank, or other nominee. Ask your investment adviser if his or her firm will participate on your behalf. Participants whose shares are registered in the name of one firm may not be able to transfer the shares to another firm and continue to participate in the Plan. The Fund reserves the right to amend or terminate the Plan at any time. Although the Fund reserves the right to amend the Plan to include a service charge payable by the participants, there is no direct service charge to participants in the Plan at this time.
Call today to start reinvesting distributions
For more information on the Nuveen Automatic Reinvestment Plan or to enroll in or withdraw from the Plan, speak with your financial professional or call us at (800) 257-8787.
 
128

 
CHANGES OCCURRING DURING THE FISCAL YEAR
The following information in this annual report is a summary of certain changes during the most recent fiscal year. This information may not reflect all of the changes that have occurred since you purchased shares of a Fund.
During the most recent fiscal year, there have been no changes required to be reported in connection with: (i) the Fund’s investment objectives and principal investment policies that have not been approved by shareholders, (ii) the principal risks of the Fund, (iii) the portfolio managers of the Fund; or (iv) the Fund’s charter or by-laws that would delay or prevent a change of control of the Fund that have not been approved by shareholders, except as follows:
Principal Risks
The following risk factor was added as a principal risk for Nuveen Real Estate Income Fund (“JRS”):
Dividend-Paying Securities Risk.
The Fund’s investment in dividend-paying stocks could cause the Fund to underperform similar funds that invest without consideration of a company’s track record of paying dividends. Stocks of companies with a history of paying dividends may not participate in a broad market advance to the same degree as most other stocks, and a sharp rise in interest rates or economic downturn could cause a company to unexpectedly reduce or eliminate its dividend. There is no guarantee that the issuers of the stocks held by the Fund will declare dividends in the future or that, if declared, they will remain at their current levels or increase over time. The Fund may also be harmed by changes to the favorable federal income tax treatment generally afforded to dividends.
The following risk factor was added as a principal risk for Nuveen Real Asset Income and Growth Fund (“JRI”):
Foreign Debt Investment Risk.
Foreign investments, which may include debt securities of foreign issuers, or securities or contracts payable or denominated in non-U.S. currencies, can involve special risks that arise from one or more of the following events or circumstances: (1) changes in currency exchange rates; (2) possible imposition of market controls or currency exchange controls; (3) possible imposition of withholding taxes on dividends and interest; (4) possible seizure, expropriation or nationalization of assets; (5) more limited financial information about the foreign debt issuer or difficulties interpreting it because of foreign regulations and accounting standards; (6) lower liquidity and higher volatility in some foreign markets; (7) the impact of political, social or diplomatic events; (8) economic sanctions or other measures by the United States or other governments; (9) the difficulty of evaluating some foreign economic trends; and (10) the possibility that a foreign government could restrict an issuer from paying principal and interest on its debt obligations to investors outside the country. It may also be difficult to use foreign laws and courts to force a foreign issuer to make principal and interest payments on its debt obligations. In addition, the cost of servicing external debt will also generally be adversely affected by rising international interest rates because many external debt obligations bear interest at rates which are adjusted based upon international interest rates. To the extent the Fund invests a significant portion of its assets in the securities of companies in a single country or region, it is more likely to be impacted by events or conditions affecting that country or region. Investment in the Fund may be more exposed to a single country or a region’s economic cycles, stock market valuations and currency, which could increase its risk compared with a more geographically diversified fund. In addition, political, social, regulatory, economic or environmental events that occur in a single country or region may adversely affect the values of that country or region’s securities and thus the holdings of the Fund.
Mortgage-Backed Securities (“MBS”) and Asset-Backed Securities (“ABS”) Risk.
These securities generally can be prepaid at any time, and prepayments that occur either more quickly or more slowly than expected can adversely impact the value of such securities. They are also subject to extension risk, which is the risk that rising interest rates could cause mortgages or other obligations underlying the securities to be prepaid more slowly than expected, thereby lengthening the duration of such securities, increasing their sensitivity to interest rate changes and causing their prices to decline. The Fund may invest in MBS and ABS that are subordinate in right of payment and rank junior to other securities that are secured by or represent an ownership interest in the same pool of assets. In addition, many of the transactions in which such securities are issued have structural features that divert payments of interest and/or principal to more senior classes when the delinquency or loss experience of the pool exceeds certain levels. As a result, such securities may be more sensitive to risk of loss, write-downs, the non-fulfillment of repurchase obligations, over-advancing on a pool of loans and the costs of transferring servicing than senior classes of securities. Further, some of the MBS and ABS in which the Fund invests may be comprised of subprime loans. Subprime loans are those made to borrowers with lower credit ratings and/or shorter credit history, who are more likely to default on their loan obligations as compared to more credit-worthy borrowers. As a result, liquidity risk is even greater for MBS and ABS comprised of subprime loans.
MBS, including CMBS and RMBS, may be negatively affected by the quality of the mortgages underlying such security, the credit quality of its issuer or guarantor, and the nature and structure of its credit support. An unexpectedly high rate of defaults on the mortgages held by a mortgage pool will adversely affect the value of MBS and will result in losses to the Fund. Privately issued mortgage-related securities are not subject to the same underwriting requirements for the underlying mortgages that are applicable to those mortgage-related securities that have government or government-sponsored entity guarantee. As a result, the mortgage loans underlying privately issued mortgage-related securities may, and frequently do, have less favorable collateral, credit risk or other underwriting characteristics than government or government-sponsored mortgage-related securities and have wider variances in a number of terms including interest rate, term, size, purpose and borrower characteristics.
Certain non-agency MBS are only entitled to payments provided for in the underlying agreement when and if funds are generated by the underlying mortgage loan pool. This likelihood of the return of interest and principal may be assessed as a credit matter. However, the holders of such non-agency MBS may not have the legal status of secured creditors, and therefore may not be able to accelerate a claim for payment on their securities or force a sale of the mortgage loan pool in the event that insufficient funds exist to pay such amounts on any date designated for such payment. The holders of such non-agency MBS do not typically have any right to remove a servicer solely as a result of a failure of the mortgage pool to perform as expected. In addition, there can be no assurance that originators and servicers of mortgage loans for non-agency MBS will not experience financial difficulties, which may increase the chances that these entities may default on their warehousing or other credit lines or become
 
129

Shareholder Update
(continued)
 
insolvent or bankrupt, thus increasing the likelihood that repurchase obligations will not be fulfilled and the potential for loss to holders of such non-agency MBS. Further, the prices of non-agency MBS may decline substantially, for reasons that may not be attributable to any of the other risks described herein. In particular, purchasing assets at what may appear to be “undervalued” levels is no guarantee that these assets will not be trading at even more “undervalued” levels at a time of valuation or at the time of sale. It may not be possible to predict, or to protect against, such “spread widening” risk.
The following principal risks are no longer included as stand-alone risks because they were consolidated into other principal risk factors as indicated below:
 
Stand-Alone Risk Removed
  
Consolidated Into the Following Risk
Emerging Markets Risk
  
Foreign/Emerging Market Issuer Risk
Non-U.S. Securities Risk
  
Foreign/Emerging Market Issuer Risk
Portfolio Managers
Nuveen Real Asset Income and Growth Fund (“JRI” or the “Fund”)
Effective February 11, 2025, James Kim was added as a portfolio manager of the Fund. Effective April 1, 2025, Jean Lin retired and is no longer a portfolio manager of the Fund. The biography of James Kim is presented below:
James is a portfolio manager for Nuveen’s leveraged finance team with a focus on the management of high yield mandates. James is the lead manager of the High Yield Income strategy and a co-manager on the High Yield, Real Asset Income and Credit Income strategies. He has also been the head of special situations, leading workouts and opportunistic investing for the leveraged finance platform for over five years.
Previously, James was co-head of global fixed income research and head of the leveraged finance research team, overseeing its daily investment process. He also served as the co-head of research at Nuveen affiliate Symphony Asset Management, leading the firm’s research team, daily investment process and opportunistic investments across its various mandates. Prior to this, he was a distressed generalist and an industry analyst responsible for a number of different industries, including energy, power, metals & mining and chemicals, providing long and short ideas across the capital structure. Prior to joining the firm, James was an associate at Greywolf Capital in its special situations group and an analyst at Watershed Asset Management. He began his career at Goldman Sachs, as an investment banking analyst both in the Strategy Group and Energy & Power Group.
James graduated with a B.S. in Economics from the University of Pennsylvania’s Wharton School of Business.
 
130

 
CHANGES OCCURRING AFTER THE FISCAL YEAR END
Portfolio Managers
Nuveen Multi-Asset Income Fund (“NMAI” or the “Fund”)
Effective January 7, 2026, Mark Zheng, James Kim and John Tribolet became portfolio managers of the Fund. Nathan Shetty and Anurag Dugar are no longer managers of the Fund. The biographies of Nathan Shetty and Anurag Dugar are presented below:
Mark Zheng
Mark Zheng is a portfolio manager for Nuveen, focused on Multi-Sector portfolio management. He is currently lead manager of a diversified, total return component portfolio for the CREF Real Estate Account. He is also a co-manager for the Stable Value Account. Mark is a member of the Core and Core-Plus Strategy teams. Mark provides strategic and quantitative analysis across a broad set of Multi-Sector Fixed Income strategies incorporating emerging markets, mortgage-backed securities, high yield bond and loans and non-agency structured products. Since joining the firm in 2010, he has held several positions, including co-manager of fixed income ETFs. He also served as a research analyst for investments in mortgage-backed securities and as a business analyst for fixed income business applications.
Prior to working in the financial services industry, Mark worked in the engineering industry, providing consulting services for global pharmaceutical, chemical, and manufacturing firms.
Mark graduated with a Bachelor’s degree in Chemical Engineering and Master’s degree in Engineering from The Cooper Union and an M.S. in Computational Finance from the Carnegie Mellon Tepper School of Business. He is a CFA charter holder and certified Financial Risk Manager (FRM), with membership in the CFA Institute and Global Association of Risk Professionals, respectively.
James Kim
James is a portfolio manager for Nuveen’s leveraged finance team with a focus on the management of high yield mandates. James is the lead manager of the High Yield Income strategy and a co-manager on the High Yield, Real Asset Income and Credit Income strategies. He has also been the head of special situations, leading workouts and opportunistic investing for the leveraged finance platform for over five years.
Previously, James was co-head of global fixed income research and head of the leveraged finance research team, overseeing its daily investment process. He also served as the co-head of research at Nuveen affiliate Symphony Asset Management, leading the firm’s research team, daily investment process and opportunistic investments across its various mandates. Prior to this, he was a distressed generalist and an industry analyst responsible for a number of different industries, including energy, power, metals & mining and chemicals, providing long and short ideas across the capital structure. Prior to joining the firm, James was an associate at Greywolf Capital in its special situations group and an analyst at Watershed Asset Management. He began his career at Goldman Sachs, as an investment banking analyst both in the Strategy Group and Energy & Power Group.
James graduated with a B.S. in Economics from the University of Pennsylvania’s Wharton School of Business.
John Tribolet
John is a portfolio manager for Nuveen’s equities team and has lead portfolio management responsibilities for several global and international strategies. He is also a member of the Equities Investment Council (EIC) with a focus on international investing.
Prior to his current role and since joining Nuveen in 2005, John has served as head of global equities research for Nuveen as well as a lead international and global portfolio manager on multiple strategies. Prior to joining Nuveen, John was co-head of the Loomis Sayles International Equity Fund and an international portfolio manager at Nicholas Applegate.
John graduated with a B.A. in Economics from Columbia University and an M.B.A., with honors, in Finance from the University of Chicago.
 
131

Shareholder Update
(continued)
 
ADDITIONAL DISCLOSURES FOR THE FUND AS OF THE FISCAL YEAR ENDED DECEMBER 31, 2025
This annual report includes additional disclosures for certain Funds that have, or intend to have, an effective shelf offering registration statement on file with the Securities and Exchange Commission (SEC) at the time this report was prepared. Refer to Note 6, Fund Shares of the Notes to Financial Statements for further details on the shelf offering program.
NUVEEN REAL ASSET INCOME AND GROWTH FUND (JRI)
SUMMARY OF FUND EXPENSES
The purpose of the tables and the example below are to help you understand all fees and expenses that you, as a common shareholder, would bear directly or indirectly. The tables show the expenses of the Fund as a percentage of the average net assets applicable to Common Shares and not as a percentage of total assets or managed assets.
 
Shareholder Transaction Expenses
  
JRI
Maximum Sales Charge (as a percentage of offering price) (1)
  
1.00%
Dividend Reinvestment Plan Fees (2)
  
$2.50
 
(1)
The maximum sales charge for offerings made at-the-market is 1.00%. If the Common Shares are sold to or through underwriters in an offering that is not made at-the-market, the applicable Prospectus Supplement will set forth any other applicable sales load. Additionally, the applicable Prospectus Supplement will set forth the offering expenses (if any) borne by Fund common shareholders.
(2)
You will be charged a $2.50 service charge and pay brokerage charges if you direct Computershare Inc. and Computershare Trust Company, N.A., as agent for the common shareholders, to sell your Common Shares held in a dividend reinvestment account.
 
Annual Expenses (As a Percentage of Net Assets Attributable to Common Shares) (1)
  
JRI
Management Fees
  
1.41%
Interest and Other Related Expenses (2)
  
2.34%
Other Expenses (3)
  
0.15%
Total Annual Expenses
  
3.90%
 
(1)
Stated as percentages of average net assets attributable to Common Shares for the fiscal year ended December 31, 2025.
(2)
Interest and Other Related Expenses reflect actual expenses and fees for leverage incurred by a Fund for the fiscal year ended December 31, 2025. The types of leverage used by the Fund during the fiscal year ended December 31, 2025 are described in the Fund Leverage and the Notes to Financial Statements sections of this annual report. Actual Interest and Other Related Expenses incurred in the future may be higher or lower. If short-term market interest rates rise in the future, and if the Fund continues to maintain leverage, the cost of which is tied to short-term interest rates, the Fund’s interest expenses on its short-term borrowings can be expected to rise in tandem. The Fund’s use of leverage will increase the amount of management fees paid to the Fund’s adviser and sub-advisor(s).
(3)
Other Expenses are based on estimated amounts for the current fiscal year. Expenses attributable to the Fund’s investments, if any, in other investment companies are currently estimated not to exceed 0.01%.
Example
The following example illustrates the expenses, including the applicable transaction fees (referred to as the “Maximum Sales Charge” in the Shareholder Transaction Expenses table above), if any, that a common shareholder would pay on a $1,000 investment that is held for the time periods provided in the table. The example assumes that all dividends and other distributions are reinvested in the Fund and that the Fund’s Annual Expenses, as provided above, remain the same. The example also assume a 5% annual return. Actual expenses may be greater or less than those assumed. Moreover, the Fund’s actual rate of return may be greater or less than the hypothetical 5% return shown in the example.
Example # 1 (At-the-Market Transaction)
The following example assumes a transaction fee of 1.00%, as a percentage of the offering price.


1 Year
  
3 Years
  
5 Years
  
10 Years
JRI
  
$49
  
$128
  
$208
  
$418
The example should not be considered a representation of future expenses. Actual expenses may be greater or less than those shown above.
 
132

 
TRADING AND NET ASSET VALUE INFORMATION
The following table shows for the periods indicated: (i) the high and low sales prices for the Common Shares reported as of the end of the day on the NYSE, (ii) the corresponding NAV per share; and (iii) the premium/(discount) to NAV per share at which the Common Shares were trading as of such date.
 
JRI
  
Closing Market Price per
Common Share
  
NAV per Common Share on Date of
Market Price
  
Premium/(Discount)
on Date of Market Price
Fiscal Quarter End
  
  High
  
  Low
  
  High
  
  Low
  
High
  
Low
December 2025
  
$14.33
  
$13.16
  
$13.76
  
$13.15
  
4.14%
  
0.08%
September 2025
  
$14.25
  
$13.03
  
$13.71
  
$13.38
  
3.94%
  
(2.62)%
June 2025
  
$13.50
  
$11.26
  
$13.56
  
$12.32
  
(0.44)%
  
(8.60)%
March 2025
  
$13.14
  
$12.04
  
$13.36
  
$12.91
  
(1.65)%
  
(6.74)%
December 2024
  
$13.61
  
$11.95
  
$14.02
  
$12.97
  
(2.92)%
  
(7.86)%
September 2024
  
$13.67
  
$12.21
  
$14.54
  
$13.21
  
(5.98)%
  
(7.57)%
June 2024
  
$12.21
  
$10.86
  
$13.18
  
$12.66
  
(7.36)%
  
(14.22)%
March 2024
  
$12.12
  
$11.35
  
$13.68
  
$13.25
  
(11.40)%
  
(14.34)%
The following table shows, as of December 31, 2025 the Fund’s: (i) NAV per Common Share, (ii) market price, (iii) percentage of premium/(discount) to NAV per Common Share and, (iv) net assets attributable to Common Shares.
 
December 31, 2025
  
JRI
 
NAV per Common Share
  
 
$ 13.37
 
Market Price
  
 
$ 13.61
 
Percentage of Premium/(Discount) to NAV per Common Share
  
 
1.80%
 
Net Assets Attributable to Common Shares
  
 
$ 366,997,292
 
Shares of closed-end investment companies, including the Fund, may frequently trade at prices lower than NAV, the Fund’s Board of Trustees (Board) has currently determined that, at least annually, it will consider action that might be taken to reduce or eliminate any material discount from NAV in respect of Common Shares, which may include the repurchase of such shares in the open market or in private transactions, the making of a tender offer for such shares at NAV, or the conversion of the Fund to an open-end investment company. The Fund cannot assure you that its Board will decide to take any of these actions, or that share repurchases or tender offers will actually reduce market discount.
 
133

Shareholder Update
(continued)
 
SENIOR SECURITIES
The following table sets forth information regarding the Fund’s outstanding senior securities as of the end of the Fund’s last ten fiscal years, as applicable. The Fund’s senior securities during this time period are comprised of borrowings that constitute “senior securities” as defined in the Investment Company Act of 1940, as amended (1940 Act). The information in this table is derived from the financial statements. The financial statements for the year ended December 31, 2025 have been audited by PricewaterhouseCoopers LLP (“PwC”), independent registered public accounting firm. The financial statements with respect to the fiscal years ended prior to 2025, where applicable, have been audited by other auditors. The Funds’ audited financial statements for the year ended December 31, 2025, including the report of PwC thereon, and accompanying notes thereto, are included in this Annual Report.
JRI


Borrowings Outstanding at the End of Period
Year Ended 12/31:
  
Aggregate Amount Outstanding
(000) (1)
  
Asset Coverage Per $1,000 (2)
2025
  
$170,945
  
$3,147
2024
  
$178,945
  
$3,020
2023
  
$151,695
  
$3,474
2022
  
$166,985
  
$3,230
2021
  
$197,935
  
$3,414
2020
  
$166,035
  
$3,618
2019
  
$222,225
  
$3,477
2018
  
$215,225
  
$3,103
2017
  
$225,225
  
$3,406
2016
  
$73,275
  
$3,408
 
(1)
Aggregate Amount Outstanding: Aggregate amount outstanding represents the principal amount outstanding or liquidation preference, if applicable, as of the end of the relevant fiscal year.
 
(2)
Asset Coverage Per $1,000: Asset coverage per $1,000 is calculated by subtracting the Fund’s liabilities and indebtedness not represented by senior securities from the Fund’s total assets, dividing the result by the aggregate amount of Fund’s borrowings (excluding temporary borrowings) then outstanding and multiplying the result by 1,000. For purpose of asset coverage above, senior securities consist of preferred shares or borrowings of a Fund and does not include derivative transactions and other investments that have the economic effect of leverage such as reverse repurchase agreements and tender option bonds. If the leverage effects of such investments were included, the asset coverage amounts presented would be lower.
UNRESOLVED STAFF COMMENTS
The Fund believes that there are no material unresolved written comments, received 180 days or more before December 31, 2025, from the Staff of the Securities and Exchange Commission (SEC) regarding any of its periodic or current reports under the Securities Exchange Act or the Investment Company Act of 1940, or its registration statement.
 
134

Important Tax Information
(Unaudited)
 
As required by the Internal Revenue Code and Treasury Regulations, certain tax information, as detailed below, must be provided to shareholders. Shareholders are advised to consult their tax advisor with respect to the tax implications of their investment. The amounts listed below may differ from the actual amounts reported on Form 1099-DIV, which will be sent to shareholders shortly after calendar year end.
Long-Term Capital Gains
As of year end, each Fund designates the following distribution amounts, or maximum amount allowable, as being from net long-term capital gains pursuant to Section 852(b)(3) of the Internal Revenue Code:
 
Fund
  
Net Long-Term
Capital Gains
 
NMAI
  
 
$–
 
JRI


JRS


Dividends Received Deduction (DRD)
Each Fund listed below had the following percentage, or maximum amount allowable, of ordinary income distributions eligible for the dividends received deduction for corporate shareholders:
 
Fund
  
Percentage
 
NMAI
  
 
32.3
JRI
  
 
17.9
 
JRS
  
 
9.9
 
Qualified Dividend Income (QDI)
Each Fund listed below had the following percentage, or maximum amount allowable, of ordinary income distributions treated as qualified dividend income for individuals pursuant to Section 1(h)(11) of the Internal Revenue Code:
 
Fund
  
Percentage
 
NMAI
  
 
75.4
JRI
  
 
46.8
 
JRS
  
 
9.9
 
Qualified Interest Income (QII)
Each Fund listed below had the following percentage, or maximum amount allowable, of ordinary income distributions treated as qualified interest income and/or short-term capital gain dividends pursuant to Section 871(k) of the Internal Revenue Code:
 
Fund
  
1/1 to Current
Year End
Percentage
 
NMAI
  
 
44.4
JRI
  
 
28.4
 
JRS
  
 
1.5
 
 
135

Important Tax Information
(continued)
 
Qualified Business Income (QBI)
Each Fund listed below had the following percentage, or maximum amount allowable, of ordinary income distributions treated as qualified business income for individuals pursuant to Section 199A of the Internal Revenue Code:
 
Fund
  
Percentage
 
NMAI
  
 
2.5
JRI
  
 
17.3
 
JRS
  
 
82.2
 
163(j)
Each Fund listed below had the following percentage, or maximum amount allowable, of ordinary dividends treated as Section 163(j) interest dividends pursuant to Section 163(j) of the Internal Revenue Code:
 
Fund
  
Percentage
 
NMAI
  
 
56.0
JRI
  
 
33.0
 
JRS
  
 
1.5
 
 
136

Additional Fund Information
(Unaudited)
 
Board of Trustees
Joseph A. Boateng
  
Michael A. Forrester
  
Thomas J. Kenny
  
Amy B.R. Lancellotta
  
Joanne T. Medero
  
Albin F. Moschner
  
John K. Nelson
Loren M. Starr
  
Matthew Thornton III
  
Terence J. Toth
  
Margaret L. Wolff
  
Robert L. Young


Investment Adviser
Nuveen
Fund Advisors, LLC
333 West Wacker Drive
Chicago, IL 60606
 
Custodian
State Street Bank &
Trust Company
One Congress Street Suite 1
Boston, MA 02114-2016
 
Legal Counsel
Chapman and Cutler LLP
Chicago, IL 60606
 
Independent Registered
Public Accounting Firm
PricewaterhouseCoopers LLP
One North Wacker Drive
Chicago, IL 60606
 
Transfer Agent and
Shareholder Services
Computershare Trust Company, N.A.
150 Royall Street
Canton, MA 02021
(800) 257-8787
 
 
Portfolio of Investments Information
Each Fund is required to file its complete schedule of portfolio holdings with the Securities and Exchange Commission (SEC) for the first and third quarters of each fiscal year as an exhibit to its report on Form N-PORT. You may obtain this information on the SEC’s website at http://www.sec.gov.
 
 
Nuveen Funds’ Proxy Voting Information
You may obtain (i) information regarding how each fund voted proxies relating to portfolio securities held during the most recent twelve-month period ended June 30, without charge, upon request, by calling Nuveen toll-free at (800) 257-8787 or on Nuveen’s website at www.nuveen.com and (ii) a description of the policies and procedures that each fund used to determine how to vote proxies relating to portfolio securities without charge, upon request, by calling Nuveen toll-free at (800) 257-8787. You may also obtain this information directly from the SEC. Visit the SEC on-line at http://www.sec.gov.
 
 
CEO Certification Disclosure
Each Fund’s Chief Executive Officer (CEO) has submitted to the New York Stock Exchange (NYSE) the annual CEO certification as required by Section 303A.12(a) of the NYSE Listed Company Manual. Each Fund has filed with the SEC the certification of its CEO and Chief Financial Officer required by Section 302 of the Sarbanes-Oxley Act.
 
 
Common Share Repurchases
Each Fund intends to repurchase, through its open-market share repurchase program, shares of its own common stock at such times and in such amounts as is deemed advisable. During the period covered by this report, each Fund repurchased shares of its common stock as shown in the accompanying table. Any future repurchases will be reported to shareholders in the next annual or semi-annual report.
 
     
   NMAI
    
    JRI
    
    JRS
 
Common shares repurchased
  
 
0


0


0
 
FINRA BrokerCheck:
The Financial Industry Regulatory Authority (FINRA) provides information regarding the disciplinary history of FINRA member firms and associated investment professionals. This information as well as an investor brochure describing FINRA BrokerCheck is available to the public by calling the FINRA BrokerCheck Hotline number at (800) 289-9999 or by visiting www.FINRA.org.
 
137

Glossary of Terms Used in this Report
(Unaudited)
 
19(a) Notice:
Section 19(a) of the Investment Company Act of 1940 requires that the payment of any distribution which is made from a source other than the fund’s net income be accompanied by a written notice that discloses the estimated sources of such payment.
Average Annual Total Return:
This is a commonly used method to express an investment’s performance over a particular, usually multi-year time period. It expresses the return that would have been necessary each year to equal the investment’s actual cumulative performance (including change in NAV or offer price and reinvested dividends and capital gains distributions, if any) over the time period being considered.
Effective Leverage:
Effective leverage is a fund’s effective economic leverage, and includes both regulatory leverage (see below) and the leverage effects of certain derivative investments in the fund’s portfolio.
Leverage:
Leverage is created whenever a fund has investment exposure (both reward and/or risk) equivalent to more than 100% of the investment capital.
Net Asset Value (NAV) Per Share:
A fund’s Net Assets is equal to its total assets (securities, cash, accrued earnings and receivables) less its total liabilities. NAV per share is equal to the fund’s Net Assets divided by its number of shares outstanding.
Regulatory Leverage:
Regulatory leverage consists of preferred shares issued by or borrowings of a fund. Both of these are part of a fund’s capital structure. Regulatory leverage is subject to asset coverage limits set forth in the Investment Company Act of 1940.
 
138

Board Members & Officers
 
(Unaudited)
 
The management of the Funds, including general supervision of the duties performed for the Funds by the Adviser, is the responsibility of the Board of Trustees of the Funds. None of the trustees who are not “interested” persons of the Funds (referred to herein as “independent board members”) has ever been a director or employee of, or consultant to, Nuveen or its affiliates. The names and business addresses of the trustees and officers of the Funds, their principal occupations and other affiliations during the past five years, the number of portfolios each Trustee oversees and other directorships they hold are set forth below.
 
Name,
Year of Birth
& Address
  
Position(s) Held
with the Funds
  
Year First
Elected or
Appointed
and Term
(1)
  
Principal Occupation(s)
Including other Directorships
During Past 5 Years
  
Number of
Portfolios
in Fund
Complex
Overseen By
Board Member
Independent Trustees:


Joseph A. Boateng
1963
333 W. Wacker Drive
Chicago, IL 60606
  
Board Member
  
2019
Class II
  
Chief Investment Officer, Casey Family Programs (since 2007); formerly, Director of U.S. Pension Plans, Johnson & Johnson (2002–2006); Board Member, Lumina Foundation (since 2019) and Waterside School (since 2021); Board Member (2012–2019) and Emeritus Board Member (since 2020), Year-Up Puget Sound; Investment Advisory Committee Member and Former Chair (since 2007), Seattle City Employees’ Retirement System; Investment Committee Member (since 2019), The Seattle Foundation; Trustee (2018–2023), the College Retirement Equities Fund; Manager (2019–2023), TIAA Separate Account VA-1.
  
216
Michael A. Forrester
1967
333 W. Wacker Drive
Chicago, IL 60606
  
Board Member
  
2007
Class I
  
Formerly, Chief Executive Officer (2014–2021) and Chief Operating Officer (2007–2014), Copper Rock Capital Partners, LLC; Director, Aflac Incorporated (since 2025); Trustee, Dexter Southfield
School (since 2019); Member (since 2020), Governing Council of the Independent Directors Council (IDC); Trustee, the College Retirement Equities Fund and Manager, TIAA Separate Account VA-1 (2007–2023).
  
216
Thomas J. Kenny
1963
333 W. Wacker Drive
Chicago, IL 60606
  
Board Member
  
2011
Class I
  
Formerly, Advisory Director (2010–2011), Partner (2004–2010), Managing Director (1999–2004) and Co-Head of Global Cash and Fixed Income Portfolio Management Team (2002–2010), Goldman Sachs Asset Management; Director (since 2015) and Chair of the Finance and Investment Committee (since 2018), Aflac Incorporated; Director (since 2018), ParentSquare; formerly, Director (2021–2022) and Finance Committee Chair (2016–2022), Sansum Clinic; formerly, Advisory Board Member (2017–2019), B’Box; formerly, Member (2011–2012), the University of California at Santa Barbara Arts and Lectures Advisory Council; formerly, Investment Committee Member (2012–2020), Cottage Health
System; formerly, Board member (2009–2019) and President of the Board (2014–2018), Crane Country Day School; Trustee (2011–2023) and Chairman (2017–2023), the College Retirement Equities Fund; Manager (2011–2023) and Chairman (2017–2023), TIAA Separate Account VA-1.
  
217
Amy B. R. Lancellotta
1959
333 W. Wacker Drive
Chicago, IL 60606
  
Board Member
  
2021
Class II
  
Formerly, Managing Director, IDC (supports the fund independent director community and is part of the Investment Company Institute (ICI), which represents regulated investment companies) (2006-2019); formerly, various positions with ICI (1989-2006); President (since 2023) and Member (since 2020) of the Board of Directors, Jewish Coalition Against Domestic Abuse (JCADA).
  
217
 
139

Board Members & Officers
(continued)
 
Name,
Year of Birth
& Address
  
Position(s) Held
with the Funds
  
Year First
Elected or
Appointed
and Term
(1)
  
Principal Occupation(s)
Including other Directorships
During Past 5 Years
  
Number of
Portfolios
in Fund
Complex
Overseen By
Board Member
Joanne T. Medero
1954
333 W. Wacker Drive
Chicago, IL 60606
   Board Member   
2021
Class III
  
Formerly, Managing Director, Government Relations and Public Policy (2009-2020) and Senior Advisor to the Vice Chairman (2018-2020), BlackRock, Inc. (global investment management
firm); formerly, Managing Director, Global Head of Government Relations and Public Policy, Barclays Group (IBIM) (investment banking, investment management and wealth management businesses) (2006-2009); formerly, Managing Director, Global General Counsel and Corporate Secretary, Barclays Global Investors (global investment management firm) (1996-2006); formerly, Partner, Orrick, Herrington & Sutcliffe LLP (law firm) (1993-1995); formerly, General Counsel, Commodity Futures Trading Commission (government agency overseeing U.S. derivatives markets) (1989-1993); formerly, Deputy Associate Director/Associate Director for Legal and Financial Affairs, Office of Presidential Personnel, The White House (1986-1989); Member of the Board of Directors, Baltic-American Freedom Foundation (seeks to provide opportunities for citizens of the Baltic states to gain education and professional development through exchanges in the U.S.) (since 2019).
   217
Albin F. Moschner
1952
333 W. Wacker Drive
Chicago, IL 60606
   Board Member   
2016
Class III
  
Founder and Chief Executive Officer, Northcroft Partners, LLC, (management consulting) (since 2012); formerly,
Chairman (2019), and Director (2012-2019), USA Technologies, Inc., (provider of solutions and services to facilitate electronic payment transactions); formerly, Director, Wintrust Financial Corporation (1996-2016); previously, held positions at Leap Wireless International, Inc. (consumer wireless services), including Consultant (2011-2012), Chief Operating Officer (2008-2011), and Chief Marketing Officer (2004-2008); formerly, President, Verizon Card Services division of Verizon Communications, Inc. (2000-2003); formerly, President, One Point Services at One Point Communications (telecommunication services) (1999-2000); formerly, Vice Chairman of the Board, Diba, Incorporated (internet
technology provider) (1996-1997); formerly, various executive positions (1991-1996) including Chief Executive Officer
(1995-1996) of Zenith Electronics Corporation (consumer electronics).
   217
John K. Nelson
1962
333 W. Wacker
Drive Chicago, IL 60606
   Board Member   
2013
Class II
   Formerly, Member of Board of Directors of Core12 LLC (2008–2023) (private firm which develops branding, marketing and communications strategies for clients); formerly, Member of The President’s Council of Fordham University (2010–2019); formerly, Director of the Curran Center for Catholic American Studies (2009–2018); formerly, senior external advisor to the Financial Services practice of Deloitte Consulting LLP. (2012–2014); formerly, Trustee and Chairman of the Board of Trustees of Marian University (2010–2013); formerly Chief Executive Officer of ABN AMRO Bank N.V., North America, and Global Head of the Financial Markets Division (2007–2008), with various executive leadership roles in ABN AMRO Bank N.V. between 1996 and 2007.    217
 
140

 
Name,
Year of Birth
& Address
  
Position(s) Held
with the Funds
  
Year First
Elected or
Appointed
and Term
(1)
  
Principal Occupation(s)
Including other Directorships
During Past 5 Years
  
Number of
Portfolios
in Fund
Complex
Overseen By
Board Member
Loren M. Starr
1961
333 W. Wacker Drive
Chicago, IL 60606
   Board Member   
2022
Class III
  
Independent Consultant/Advisor (since 2021); formerly, Vice Chair, Senior Managing Director (2020–2021), Chief Financial Officer, Senior Managing Director (2005–2020), Invesco Ltd.; Director (since 2023) and Chair of the Board (since 2025), formerly, Chair of the Audit Committee (2024-2025), AMG; formerly, Chair and Member of the Board of Directors (2014–2021), Georgia Leadership Institute for School Improvement (GLISI); formerly, Chair and Member of the Board of Trustees (2014–2018), Georgia Council on Economic Education (GCEE); Trustee, the College Retirement Equities Fund and Manager, TIAA Separate Account
VA-1 (2022–2023).
   216
Matthew Thornton III
1958
333 W. Wacker Drive
Chicago, IL 60606
   Board Member   
2020
Class III
   Formerly, Executive Vice President and Chief Operating Officer (2018-2019), FedEx Freight Corporation, a subsidiary of FedEx Corporation (FedEx) (provider of transportation, e-commerce and business services through its portfolio of companies); formerly, Senior Vice President, U.S. Operations (2006-2018), Federal Express Corporation, a subsidiary of FedEx; formerly Member of the Board of Directors (2012-2018), Safe Kids Worldwide
®
(a non-profit organization dedicated to preventing childhood injuries). Member of the Board of Directors (since 2014), The Sherwin-Williams Company (develops, manufactures, distributes and sells paints, coatings and related products); Director (since 2020), Crown Castle International (provider of communications infrastructure).
   217
Terence J. Toth
1959
333 W. Wacker Drive
Chicago, IL 60606
   Board Member   
2008
Class II
   Formerly, a Co–Founding Partner, Promus Capital (investment advisory firm) (2008–2017); formerly, Director, Quality Control Corporation (manufacturing) (2012–2021); formerly, Chair and Member of the Board of Directors (2021–2024), Kehrein Center for the Arts (philanthropy); Member of the Board of Directors (since 2008), Catalyst Schools of Chicago (philanthropy); Member of the Board of Directors (since 2012), formerly, Investment Committee Chair (2017–2022), Mather Foundation Board (philanthropy); formerly, Member (2005–2016), Chicago Fellowship Board (philanthropy); formerly, Director, Fulcrum IT Services LLC (information technology services firm to government entities) (2010–2019); formerly, Director, LogicMark LLC (health services) (2012–2016); formerly, Director, Legal & General Investment Management America, Inc. (asset management) (2008–2013); formerly, CEO and President, Northern Trust Global Investments (financial services) (2004–2007); Executive Vice President, Quantitative Management & Securities Lending (2000–2004); prior thereto, various positions with Northern Trust Company (financial services) (since 1994); formerly, Member, Northern Trust Mutual Funds Board (2005–2007), Northern Trust Global Investments Board (2004–2007), Northern Trust Japan Board (2004–2007), Northern Trust Securities Inc. Board (2003–2007) and Northern Trust Hong Kong Board (1997–2004).    217
 
141

Board Members & Officers
(continued)
 
Name,
Year of Birth
& Address
  
Position(s) Held
with the Funds
  
Year First
Elected or
Appointed
and Term
(1)
  
Principal Occupation(s)
Including other Directorships
During Past 5 Years
  
Number of
Portfolios
in Fund
Complex
Overseen By
Board Member
Margaret L. Wolff
1955
333 W. Wacker Drive
Chicago, IL 60606
   Board Member   
2016
Class I
  
Formerly, member of the Board of Directors (2013-2017) of Travelers Insurance Company of Canada and The Dominion of Canada General Insurance Company (each, a part of Travelers Canada, the Canadian operation of The Travelers Companies, Inc.); formerly, Of Counsel, Skadden, Arps, Slate, Meagher & Flom LLP (Mergers & Acquisitions Group) (legal services) (2005-2014); Member of the Board of Trustees of New York-Presbyterian Hospital (since 2005); Member of the Board of Trustees (since 2004) formerly, Chair (2015-2022) of The John A. Hartford Foundation (a philanthropy dedicated to improving the care of
older adults); formerly, Member (2005-2015) and Vice Chair (2011-2015) of the Board of Trustees of Mt. Holyoke College.
   217
Robert L. Young
1963
333 W. Wacker Drive
Chicago, IL 60606
   Chair and Board Member   
2017
Class I
  
Formerly, Chief Operating Officer and Director, J.P. Morgan Investment Management Inc. (financial services) (2010-2016); formerly, President and Principal Executive Officer (2013-2016), and Senior Vice President and Chief Operating Officer
(2005-2010), of J.P. Morgan Funds; formerly, Director and various officer positions for J.P. Morgan Investment Management Inc. (formerly, JPMorgan Funds Management, Inc. and formerly, One Group Administrative Services) and JPMorgan Distribution Services, Inc. (financial services) (formerly, One Group Dealer Services, Inc.) (1999-2017).
   217
 
142

 
Name,
Year of Birth
& Address
  
Position(s) Held
with the Funds
   Year First
Elected or
Appointed
(2)
  
Principal Occupation(s)
Including other Directorships
During Past 5 Years
Officers of the Funds:


David J. Lamb
1963
333 W. Wacker Drive
Chicago, IL 60606
  
Chief Administrative Officer (Principal Executive Officer)
  
2015
  
Senior Managing Director of Nuveen Fund Advisors, LLC, Nuveen Securities, LLC and Nuveen; has previously held various positions with Nuveen.
Brett E. Black
1972
333 W. Wacker Drive
Chicago, IL 60606
  
Vice President and Chief Compliance Officer
  
2022
  
Managing Director, Chief Compliance Officer of Nuveen; formerly, Vice President (2014-2022), Chief Compliance Officer and Anti-Money Laundering Compliance Officer (2017-2022) of BMO Funds, Inc.
Marc Cardella
1984
8500 Andrew Carnegie Blvd.
Charlotte, NC 28262
  
Vice President and Controller (Principal Financial Officer)
  
2024
  
Senior Managing Director, Head of Public Investment Finance of Nuveen; Senior Managing Director of Nuveen Fund Advisors, LLC, Nuveen Asset Management, LLC, Teachers Advisors, LLC and TIAA-CREF Investment Management, LLC, Managing Director of Teachers Insurance and Annuity Association of America and TIAA SMA Strategies LLC; Principal Financial Officer, Principal Accounting Officer and Treasurer of TIAA Separate Account VA-1 and the College Retirement Equities Fund; Senior Managing Director, Brooklyn Artificial Intelligence, Inc. and Brooklyn Investment Group, LLC.
Joseph T. Castro
1964
333 W. Wacker Drive
Chicago, IL 60606
  
Vice President
  
2025
  
Executive Vice President, Chief Risk and Compliance Officer, formerly, Senior Managing Director and Head of Compliance, Nuveen; Executive Vice President and Chief Risk and Compliance Officer, formerly, Senior Managing Director, Nuveen Securities, LLC and Nuveen, LLC; formerly, Senior Managing Director, Nuveen Fund Advisors, LLC.
Mark J. Czarniecki
1979
901 Marquette Avenue
Minneapolis, MN 55402
  
Vice President and Assistant Secretary
  
2013
  
Managing Director and Assistant Secretary of Nuveen Securities, LLC and Nuveen Fund Advisors, LLC; Managing Director and Associate General Counsel of Nuveen; Managing Director, Assistant Secretary and Associate General Counsel of Nuveen Asset Management, LLC; has previously held various positions with Nuveen; Managing Director, Associate General Counsel and Assistant Secretary of Teachers Advisors, LLC and TIAA-CREF Investment Management, LLC; Managing Director, General Counsel and Assistant Secretary, Brooklyn Artificial Intelligence, Inc. and Brooklyn Investment Group, LLC.
Jeremy D. Franklin
1983
8500 Andrew Carnegie Blvd.
Charlotte, NC 28262
  
Vice President and Assistant Secretary
  
2024
  
Managing Director and Assistant Secretary, Nuveen Fund Advisors, LLC; Managing Director, Associate General Counsel and Assistant Secretary, Nuveen Asset Management, LLC, Teachers Advisors, LLC and TIAA-CREF Investment Management, LLC; Vice President and Associate General Counsel, Teachers Insurance and Annuity Association of America; Vice President and Assistant Secretary, TIAA-CREF Funds and TIAA-CREF Life Funds; Vice President, Associate General Counsel, and Assistant Secretary, TIAA Separate Account VA-1 and College Retirement Equities Fund.
Diana R. Gonzalez
1978
8500 Andrew Carnegie Blvd.
Charlotte, NC 28262
  
Vice President and Assistant Secretary
  
2017
  
Vice President and Assistant Secretary of Nuveen Fund Advisors, LLC; Vice President, Associate General Counsel and Assistant Secretary of Nuveen Asset Management, LLC, Teachers Advisors, LLC and TIAA-CREF Investment Management, LLC; Vice President and Associate General Counsel of Nuveen.
Nathaniel T. Jones
1979
333 W. Wacker Drive
Chicago, IL 60606
  
Vice President
  
2016
  
Senior Managing Director, Head of Public Product of Nuveen; President. formerly, Senior Managing Director, of Nuveen Fund Advisors, LLC; has previously held various positions with Nuveen; Chartered Financial Analyst.
Brian H. Lawrence
1982
8500 Andrew Carnegie Blvd.
Charlotte, NC 28262
  
Vice President and Assistant Secretary
  
2023
  
Vice President and Associate General Counsel of Nuveen; Vice President, Associate General Counsel and Assistant Secretary of Teachers Advisors, LLC and TIAA-CREF Investment Management, LLC; formerly Corporate Counsel of Franklin Templeton (2018-2022).
Tina M. Lazar
1961
333 W. Wacker Drive
Chicago, IL 60606
  
Vice President
  
2002
  
Managing Director of Nuveen Securities, LLC.
 
143

Board Members & Officers
(continued)
 
Name,
Year of Birth
& Address
  
Position(s) Held
with the Funds
   Year First
Elected or
Appointed
(2)
  
Principal Occupation(s)
Including other Directorships
During Past 5 Years
Brian J. Lockhart
1974
333 W. Wacker Drive
Chicago, IL 60606
   Vice President    2019    Senior Managing Director and Head of Investment Oversight of Nuveen; Senior Managing Director of Nuveen Fund Advisors, LLC; has previously held various positions with Nuveen; Chartered Financial Analyst and Certified Financial Risk Manager.
John M. McCann
1975
8500 Andrew Carnegie Blvd.
Charlotte, NC 28262
   Vice President and Assistant Secretary    2022   
Senior Managing Director, Division General Counsel of Nuveen; Senior Managing Director, General Counsel and Secretary of Nuveen Fund Advisors, LLC; Senior Managing Director, Associate General Counsel and Assistant Secretary of Nuveen Asset Management, LLC Teachers Advisors, LLC and TIAA-CREF Investment Management, LLC; Managing Director and Assistant Secretary of TIAA SMA Strategies LLC; Managing Director, Associate General Counsel and Assistant Secretary of College Retirement Equities Fund, TIAA Separate Account VA-1, TIAA-CREF Funds, TIAA-CREF Life Funds, Teachers Insurance and Annuity Association of America and Nuveen Alternative Advisors LLC; Senior Managing Director, Associate General Counsel and Assistant Secretary, Brooklyn Artificial Intelligence,
Inc. and Brooklyn Investment Group, LLC; has previously held various positions with Nuveen/TIAA.
Kevin J. McCarthy
1966
333 W. Wacker Drive
Chicago, IL 60606
   Vice President and Assistant Secretary    2007   
Executive Vice President, Secretary and General Counsel of Nuveen Investments, Inc.; Executive Vice President and Assistant Secretary of Nuveen Securities,
LLC and Nuveen Fund Advisors, LLC; Executive Vice President and Secretary of Nuveen Asset Management, LLC, Teachers Advisors, LLC, TIAA-CREF Investment Management, LLC and Nuveen Alternative Investments, LLC; Executive Vice President, Associate General Counsel and Assistant Secretary of TIAA-CREF Funds and TIAA-CREF Life Funds; has previously held various positions with Nuveen; Vice President and Secretary of Winslow Capital Management, LLC; Executive Vice President, Brooklyn Artificial Intelligence, Inc. and Brooklyn Investment Group, LLC;
formerly, Vice President (2007-2021) and Secretary (2016-2021) of NWQ Investment Management Company, LLC and Santa Barbara Asset Management, LLC.
R. Tanner Page
1985
333 W. Wacker Drive
Chicago, IL 60606
   Vice President and Treasurer    2025    Managing Director, formerly, Vice President of Nuveen; has previously held various positions with Nuveen.
William A. Siffermann
1975
333 W. Wacker Drive
Chicago, IL 60606
   Vice President    2017    Senior Managing Director of Nuveen.
Mark L. Winget
1968
333 W. Wacker Drive
Chicago, IL 60606
   Vice President and Secretary    2008    Vice President and Assistant Secretary of Nuveen Securities, LLC and Nuveen Fund Advisors, LLC; Vice President, Associate General Counsel and Assistant Secretary of Teachers Advisors, LLC and TIAA-CREF Investment Management, LLC and Nuveen Asset Management, LLC; Vice President and Associate General Counsel of Nuveen; Vice President, Associate General Counsel and Assistant Secretary, Brooklyn Artificial Intelligence, Inc. and Brooklyn Investment Group, LLC.
Rachael Zufall
1973
8500 Andrew Carnegie Blvd.
Charlotte, NC 28262
   Vice President and Assistant Secretary    2022    Managing Director and Assistant Secretary of Nuveen Fund Advisors, LLC; Managing Director, Associate General Counsel and Assistant Secretary of the College Retirement Equities Fund, TIAA Separate Account VA-1, TIAA-CREF Funds and TIAA-CREF Life Funds; Managing Director, Associate General Counsel and Assistant Secretary of Teacher Advisors, LLC and TIAA-CREF Investment Management, LLC; Managing Director of Nuveen, LLC and of TIAA.
 
(1)
The Board of Trustees is divided into three classes, Class I, Class II, and Class III, with each being elected to serve until the third succeeding annual shareholders’ meeting subsequent to its election or thereafter in each case when its respective successors are duly elected or appointed, except two board members are elected by the holders of Preferred Shares, when applicable, to serve until the next annual shareholders’ meeting subsequent to its election or thereafter in each case when its respective successors are duly elected or appointed. The year first elected or appointed represents the year in which the board member was first elected or appointed to any fund in the Nuveen complex.
(2)
Officers serve indefinite terms until their successor has been duly elected and qualified, their death or their resignation or removal. The year first elected or appointed represents the year in which the Officer was first elected or appointed to any fund in the Nuveen Complex.
 
144


[This page intentionally left blank.]


[This page intentionally left blank.]


[This page intentionally left blank.]

LOGO
Nuveen:
Serving Investors for Generations
Since 1898, financial advisors and their clients have relied on Nuveen to provide dependable investment solutions through continued adherence to proven, long-term investing principles. Today, we offer a range of high quality solutions designed to be integral components of a well-diversified core portfolio.
Focused on meeting investor needs.
Nuveen is the investment manager of TIAA. We have grown into one of the world’s premier global asset managers, with specialist knowledge across all major asset classes and particular strength in solutions that provide income for investors and that draw on our expertise in alternatives and responsible investing. Nuveen is driven not only by the independent investment processes across the firm, but also the insights, risk management, analytics and other tools and resources that a truly world-class platform provides. As a global asset manager, our mission is to work in partnership with our clients to create solutions which help them secure their financial future.
Find out how we can help you.
To learn more about how the products and services of Nuveen may be able to help you meet your financial goals, talk to your financial advisor, or call us at (800) 257-8787. Please read the information provided carefully before you invest. Investors should consider the investment objective and policies, risk considerations, charges and expenses of any investment carefully. Where applicable, be sure to obtain a prospectus, which contains this and other relevant information. To obtain a prospectus, please contact your securities representative or Nuveen, 333 W. Wacker Dr., Chicago, IL 60606. Please read the prospectus carefully before you invest or send money.
Learn more about Nuveen Funds at: www.nuveen.com/closed-end-funds
NOT FDIC INSURED MAY LOSE VALUE NO BANK GUARANTEE


Nuveen Securities, LLC, member FINRA and SIPC 
 
 333 West Wacker Drive 
 
 Chicago, IL 60606 
 
 www.nuveen.com 
 
EAN-C-1225P 5093099


Item 2.

Code of Ethics.

As of the end of the period covered by this report, the registrant has adopted a code of ethics that applies to the registrant’s principal executive officer, principal financial officer, principal accounting officer or controller, or persons performing similar functions. There were no amendments to or waivers from the code during the period covered by this report. Upon request, a copy of the registrant’s code of ethics is available without charge by calling 800-257-8787.


Item 3.

Audit Committee Financial Expert.

As of the end of the period covered by this report, the registrant’s Board of Directors or Trustees (“Board”) had determined that the registrant has at least one “audit committee financial expert” (as defined in Item 3 of Form N-CSR) serving on its Audit Committee. The members of the registrant’s audit committee that have been designated as audit committee financial experts are Joseph A. Boateng, John K. Nelson and Loren M. Starr, who are “independent” for purposes of Item 3 of Form N-CSR.

Mr. Boateng has served as the Chief Investment Officer for Casey Family Programs since 2007. He was previously Director of U.S. Pension Plans for Johnson & Johnson from 2002-2006. Mr. Boateng is a board member of the Lumina Foundation and Waterside School, an emeritus board member of Year Up Puget Sound, member of the Investment Advisory Committee and former Chair for the Seattle City Employees’ Retirement System, and an Investment Committee Member for The Seattle Foundation. Mr. Boateng previously served on the Board of Trustees for the College Retirement Equities Fund (2018-2023) and on the Management Committee for TIAA Separate Account VA-1 (2019-2023).

Mr. Nelson formerly served on the Board of Directors of Core12, LLC from 2008 to 2023, a private firm which develops branding, marketing, and communications strategies for clients. Mr. Nelson has extensive experience in global banking and markets, having served in several senior executive positions with ABN AMRO Holdings N.V. and its affiliated entities and predecessors, including LaSalle Bank Corporation from 1996 to 2008, ultimately serving as Chief Executive Officer of ABN AMRO N.V. North America. During his tenure at the bank, he also served as Global Head of its Financial Markets Division, which encompassed the bank’s Currency, Commodity, Fixed Income, Emerging Markets, and Derivatives businesses. He was a member of the Foreign Exchange Committee of the Federal Reserve Bank of the United States and during his tenure with ABN AMRO served as the bank’s representative on various committees of The Bank of Canada, European Central Bank, and The Bank of England. Mr. Nelson previously served as a senior, external advisor to the financial services practice of Deloitte Consulting LLP. (2012-2014).

Mr. Starr was Vice Chair, Senior Managing Director from 2020 to 2021, and Chief Financial Officer, Senior Managing Director from 2005 to 2020, for Invesco Ltd. Mr. Starr is also a Director and Chair of the Board for AMG. He is former Chair and member of the Board of Directors, Georgia Leadership Institute for School Improvement (GLISI); former Chair and member of the Board of Trustees, Georgia Council on Economic Education (GCEE). Mr. Starr previously served on the Board of Trustees for the College Retirement Equities Fund and on the Management Committee for TIAA Separate Account VA-1 (2022-2023).


Item 4.

Principal Accountant Fees and Services.

Nuveen Real Asset Income and Growth Fund

The following tables show the amount of fees that PricewaterhouseCoopers LLP (“PwC”), the Registrant’s current independent registered public accounting firm, billed to the Registrant during the Registrant’s fiscal year ended December 31, 2025, and the amount of fees that KPMG LLP (“KPMG”), the Registrant’s former independent registered public accounting firm, billed to the Registrant during the Registrant’s fiscal year ended December 31, 2024. The Audit Committee approved in advance all audit services and non-audit services that PwC and KPMG provided to the Registrant, except for those non-audit services that were subject to the pre-approval exception under Rule 2-01 of Regulation S-X (the “pre-approval exception”). The pre-approval exception for services provided directly to the Registrant waives the pre-approval requirement for services other than audit, review or attest services if: (A) the aggregate amount of all such services provided constitutes no more than 5% of the total amount of revenues paid by the Registrant during the fiscal year in which the services are provided; (B) the Registrant did not recognize the services as non-audit services at the time of the engagement; and (C) the services are promptly brought to the Audit Committee’s attention, and the Committee (or its delegate) approves the services before the audit is completed.

The Audit Committee has delegated certain pre-approval responsibilities to its Chair.

SERVICES THAT THE REGISTRANT’S INDEPENDENT REGISTERED PUBLIC ACCOUNTING FIRM BILLED TO THE REGISTRANT


Fiscal Year Ended5   

Audit Fees

Billed to Registrant1

     Audit-Related Fees
Billed to Registrant2
     Tax Fees
Billed to Registrant3
     All Other Fees
Billed to Registrant4
 

December 31, 2025 (PwC)

     $31,383        $7,000        $0        $0  


Percentage approved pursuant to pre-approval exception      0%        0%        0%        0%  


December 31, 2024 (KPMG)

     $31,400        $0        $0        $0  


Percentage approved pursuant to pre-approval exception      0%        0%        0%        0%  


1

“Audit Fees” are the aggregate fees billed for professional services for the audit of the Registrant’s annual financial statements and services provided in connection with statutory and regulatory filings.

2

“Audit-Related Fees” are the aggregate fees billed for assurance and related services reasonably related to the performance of the audit or review of financial statements that are not reported under “Audit Fees”. These fees include offerings related to the Registrant’s common shares and leverage.

3

“Tax Fees” are the aggregate fees billed for professional services for tax compliance, tax advice, and tax planning.

4

“All Other Fees” are the aggregate fees billed for products and services other than “Audit Fees”, “Audit-Related Fees” and “Tax Fees”.

5

The Registrant changed audit firm from KPMG to PwC on October 24, 2024.

SERVICES THAT THE REGISTRANT’S INDEPENDENT REGISTERED PUBLIC ACCOUNTING FIRM BILLED TO THE ADVISER AND AFFILIATED REGISTRANT SERVICE PROVIDERS

The following tables show the amount of fees billed by PwC to Nuveen Fund Advisors, LLC (the “Adviser”), and any entity controlling, controlled by or under common control with the Adviser that provides ongoing services to the Registrant (“Affiliated Fund Service Provider”), for engagements directly related to the Registrant’s operations and financial reporting, during the Registrant’s fiscal year ended December 31, 2025, and the amount of fees billed by KPMG to the Adviser and any Affiliated Fund Service Provider, for engagements directly related to the Registrant’s operations and financial reporting, during the Registrant’s fiscal year ended December 31, 2024.


The tables also show the percentage of fees subject to the pre-approval exception. The pre-approval exception for services provided to the Adviser and any Affiliated Fund Service Provider (other than audit, review or attest services) waives the pre-approval requirement if: (A) the aggregate amount of all such services provided constitutes no more than 5% of the total amount of revenues paid by the Registrant, the Adviser and Affiliated Fund Service Providers during the fiscal year in which the services are provided that would have to be pre-approved by the Audit Committee; (B) the Registrant did not recognize the services as non-audit services at the time of the engagement; and (C) the services are promptly brought to the Audit Committee’s attention, and the Committee (or its delegate) approves the services before the Registrant’s audit is completed.


Fiscal Year Ended    Audit-Related Fees
Billed to Adviser
and Affiliated Fund
Service Providers
     Tax Fees
Billed to Adviser
and Affiliated Fund
Service Providers
     All Other Fees
Billed to Adviser
and Affiliated Fund
Service Providers
 

December 31, 2025 (PwC)

     $0        $0        $0  


Percentage approved pursuant to pre-approval exception

     0%        0%        0%  


December 31, 2024 (KPMG)

     $0        $0        $0  


Percentage approved pursuant to pre-approval exception

     0%        0%        0%  


NON-AUDIT SERVICES

The following table shows the amount of fees that PwC billed during the Registrant’s fiscal year ended December 31, 2025 for non-audit services, and the amount of fees that KPMG billed during the Registrant’s fiscal year ended December 31, 2024 for non-audit services. The Audit Committee is required to pre-approve non-audit services that the Registrant’s independent registered public accounting firm provides to the Adviser and any Affiliated Fund Service Provider, if the engagement related directly to the Registrant’s operations and financial reporting (except for those subject to the pre-approval exception described above). The Audit Committee requested and received information from PwC and KPMG about any non-audit services rendered during the Registrant’s last fiscal year to the Adviser and any Affiliated Fund Service Provider. The Committee considered this information in evaluating PwC’s and KPMG’s independence.


Fiscal Year Ended    Total Non-Audit Fees
Billed to Registrant
     Total Non-Audit Fees
Billed to Adviser and
Affiliated Fund Service
Providers (engagements
related directly to the
operations and financial
reporting of the
Registrant)
     Total Non-Audit Fees
Billed to Adviser and
Affiliated Fund Service
Providers (all other
engagements)
     Total  

December 31, 2025 (PwC)

     $0        $0        $11,542,000        $11,542,000  

December 31, 2024 (KPMG)

     $0        $0        $0        $0  

“Non-Audit Fees billed to Registrant” for both fiscal year ends represent “Tax Fees” and “All Other Fees” billed to the Registrant in their respective amounts from the previous table.

Less than 50 percent of the hours expended on the independent registered public accounting firm’s engagement to audit the Registrant’s financial statements for the most recent fiscal year were attributed to work performed by persons other than the independent registered public accounting firm’s full-time, permanent employees.

Audit Committee Pre-Approval Policies and Procedures. Generally, the Audit Committee must approve (i) all non-audit services to be performed for the Registrant by the Registrant’s independent registered public accounting firm and (ii) all audit and non-audit services to be performed by the Registrant’s independent registered public accounting firm for the Affiliated Fund Service Providers with respect to the operations and financial reporting of the Registrant.


Item 4(i) and Item 4(j) are not applicable to the Registrant.


Item 5.

Audit Committee of Listed Registrants.

The registrant’s Board has a separately designated Audit Committee established in accordance with Section 3(a)(58)(A) of the Securities Exchange Act of 1934, as amended (15 U.S.C. 78c(a)(58)(A)). The members of the audit committee are Joseph A. Boateng, Amy B. R. Lancellotta, John K. Nelson, Chair, Loren M. Starr, Terence J. Toth, Matthew Thornton III and Margaret L. Wolff.


Item 6.

Investments.


(a)

Schedule of Investments is included as part of the Portfolio of Investments filed under Item 1 of this Form N-CSR.


(b)

Not applicable.


Item 7.

Financial Statements and Financial Highlights for Open-End Management Investment Companies.

Not applicable to closed-end investment companies.


Item 8.

Changes in and Disagreements with Accountants for Open-End Management Investment Companies.

Not applicable to closed-end investment companies.


Item 9.

Proxy Disclosures for Open-End Management Investment Companies.

Not applicable to closed-end investment companies.


Item 10.

Remuneration Paid to Directors, Officers, and Others of Open-End Management Investment Companies.

Not applicable to closed-end investment companies.


Item 11.

Statement Regarding Basis for Approval of Investment Advisory Contract.

Not applicable.


Item 12.

Disclosure of Proxy Voting Policies and Procedures for Closed-End Management Investment Companies.

Nuveen Fund Advisors, LLC is the registrant’s investment adviser (referred to herein as the “Adviser”). The Adviser is responsible for the on-going monitoring of the Fund’s investment portfolio, managing the Fund’s business affairs and providing certain clerical, bookkeeping and administrative services. The Adviser has engaged Nuveen Asset Management, LLC (“Sub-Adviser”) as Sub-Adviser to provide discretionary investment advisory services. As part of these services, the Adviser has delegated to the Sub-Adviser the full responsibility for proxy voting on securities held in the registrant’s portfolio and related duties in accordance with the Sub-Adviser’s policies and procedures. The Adviser periodically monitors the Sub-Adviser’s voting to ensure that it is carrying out its duties. The Sub-Adviser’s proxy voting policies and procedures are attached to this filing as an exhibit and incorporated herein by reference.


Item 13.

Portfolio Managers of Closed-End Management Investment Companies.

Nuveen Fund Advisors, LLC is the registrant’s investment adviser (also referred to as the “Adviser”). The Adviser is responsible for the selection and on-going monitoring of the Fund’s investment portfolio, managing the Fund’s business affairs and providing certain clerical, bookkeeping and administrative services. The Adviser has engaged Nuveen Asset Management, LLC (“Nuveen Asset Management” or “Sub-Adviser”) as Sub-Adviser to provide discretionary investment advisory services. The following section provides information on the portfolio managers at the Sub-Adviser:

(a)(1) Portfolio Manager Biographies

As of the date of filing this report, the following individuals at the Sub-Adviser (the “Portfolio Managers”) have primary responsibility for the day-to-day implementation of the registrant’s investment strategies:

Brenda A. Langenfeld, CFA, is a portfolio manager for Nuveen’s global fixed income team and a member of the preferred securities sector team. She is the lead manager for Nuveen’s preferred and income-focused closed-end funds and portfolio manager of the Preferred Securities and Income strategy. She joined the preferred securities sector team in 2011. Brenda has been a co-manager for the Real Asset Income strategy since 2015, which invests in income generating debt and equity securities from both the real estate and infrastructure segments. In 2020 she became co-manager of the Credit Income strategy. Prior to her portfolio management roles, Brenda was a member of the high-grade credit sector team, responsible for trading corporate bonds. Previously, she was a member of the securitized debt sector team, trading mortgage-backed securities, asset-backed securities and commercial mortgage-backed securities.

Noah P. Hauser, CFA, serves as Head of Infrastructure Investments for Nuveen, overseeing strategy, investment process and performance of the firm’s infrastructure platform and also serves as a portfolio manager for Nuveen’s public global infrastructure strategies. Offerings span both the traditional public real assets and responsible investing-focused investment styles. Previously, Noah served as a senior research analyst and head of North American utilities. Prior to joining Nuveen in 2015, Noah worked at Xcel Energy as the director of investor relations. Previously, he was a buy-side investment analyst for an energy-focused, relative value equity strategy at Decade Capital Management, a Millennium Group company. In that role, Noah performed detailed analysis on regulated utilities, independent power producers, pipelines and master limited partnerships. He began his career working as a sell-side equity analyst covering regulated utilities and power companies at Barclays Capital and Lehman Brothers. Noah began working in the investment industry in 2008.

Tryg T. Sarsland, Managing Director and Director of Global Infrastructure Research at Nuveen, is a portfolio manager for Nuveen’s public global infrastructure and real asset income strategies. Offerings span both the traditional public real assets and responsible investing-focused investment styles. In addition, he is the director of research—infrastructure, overseeing direct management of the U.S.-based equity research analysts dedicated to global infrastructure and real asset income. Tryg also maintains analyst responsibilities for the global infrastructure and real asset income strategies, specializing in non-U.S. utilities. Before joining the firm in 2011, he was vice president and director of project finance at National Wind, LLC, where he spearheaded the development, procurement and investment of funds for wind energy projects. He was also vice president with Meridian Companies, LLC, and Standard Chartered Bank.

Benjamin T. Kerl, Managing Director at Nuveen, is a portfolio manager for Nuveen’s global real estate securities and global real estate carbon reduction strategies. He is also head of real estate investments for the Real Assets investment team at Nuveen. He specializes in real estate equities in the U.K., Europe and Canada. From 2012 through 2017, Ben also covered the multi-family and healthcare sectors for the firm’s Real Estate Securities strategy. Ben began working in the investment industry in 2012 when he joined the firm. Before joining the firm, he worked for eight years in the real estate and renewable energy industries. Most recently, Ben was an independent consultant providing project development services to national and international wind energy


developers. He started his career as a real estate development manager at Lander Group, where he managed infill multifamily and commercial projects from 2005 to 2007.

James Kim is a portfolio manager for Nuveen’s leveraged finance team with a focus on the management of high yield mandates. James is the lead manager of the High Yield Income strategy and a co-manager on the High Yield, Real Asset Income and Credit Income strategies. He is also head of special situations, leading workouts and opportunistic investing for the leveraged finance platform. Previously, James was co-head of global fixed income research and head of the leveraged finance research team, overseeing its daily investment process. He also served as the co-head of research at Nuveen affiliate Symphony Asset Management, leading the firm’s research team, daily investment process and opportunistic investments across its various mandates. Prior to this, he was a distressed generalist and an industry analyst responsible for a number of different industries, including energy, power, metals & mining and chemicals, providing long and short ideas across the capital structure. Prior to joining the firm, James was an associate at Greywolf Capital in its special situations group and an analyst at Watershed Asset Management. He began his career at Goldman Sachs, as an investment banking analyst both in the Strategy Group and Energy & Power Group.

(a)(2) Other Accounts Managed by Portfolio Managers

Other Accounts Managed. In addition to managing the registrant, the Portfolio Managers are also primarily responsible for the day-to-day portfolio management of the following accounts:


Portfolio Manager    Type of Account
Managed
   Number of
Accounts
   Assets*

Brenda A. Langenfeld

   Registered Investment Company    9    $13.40 billion
   Other Pooled Investment Vehicles    1    $3.46 million
   Other Accounts    4,480         $4.56 billion
        

Noah P. Hauser

   Registered Investment Company    3    $1.74 billion
   Other Pooled Investment Vehicles    6    $1.42 billion
   Other Accounts    2    $186.58 million
        

Tryg T. Sarsland

   Registered Investment Company    3    $1.74 billion
   Other Pooled Investment Vehicles    6    $1.42 billion
   Other Accounts    2    $186.58 million
        

Benjamin T. Kerl

   Registered Investment Company    7    $5.15 billion
   Other Pooled Investment Vehicles    7    $1.54 billion
   Other Accounts    5    $726.23 million      
        

James Kim

   Registered Investment Company    9    $8.13 billion
   Other Pooled Investment Vehicles    2    $71.64 million
   Other Accounts    3    $152.51 million
*

Assets are as of December 31, 2025. None of the assets in these accounts are subject to an advisory fee based on performance.

Potential Material Conflicts of Interest

Actual or apparent conflicts of interest may arise when a portfolio manager has day-to-day management responsibilities with respect to more than one account. More specifically, portfolio managers who manage multiple accounts are presented a number of potential conflicts, including, among others, those discussed below.

The management of multiple accounts may result in a portfolio manager devoting unequal time and attention to the management of each account. Nuveen Asset Management seeks to manage such competing interests for the time and attention of portfolio managers by having portfolio managers focus on a particular investment discipline. Most accounts managed by a portfolio manager in a particular investment strategy are managed using the same investment models.


If a portfolio manager identifies a limited investment opportunity which may be suitable for more than one account, an account may not be able to take full advantage of that opportunity due to an allocation of filled purchase or sale orders across all eligible accounts. To deal with these situations, Nuveen Asset Management has adopted procedures for allocating limited opportunities across multiple accounts.

With respect to many of its clients’ accounts, Nuveen Asset Management determines which broker to use to execute transaction orders, consistent with its duty to seek best execution of the transaction. However, with respect to certain other accounts, Nuveen Asset Management may be limited by the client with respect to the selection of brokers or may be instructed to direct trades through a particular broker. In these cases, Nuveen Asset Management may place separate, non-simultaneous, transactions for a Fund and other accounts which may temporarily affect the market price of the security or the execution of the transaction, or both, to the detriment of the Fund or the other accounts.

Some clients are subject to different regulations. As a consequence of this difference in regulatory requirements, some clients may not be permitted to engage in all the investment techniques or transactions or to engage in these transactions to the same extent as the other accounts managed by a portfolio manager. Finally, the appearance of a conflict of interest may arise where Nuveen Asset Management has an incentive, such as a performance-based management fee, which relates to the management of some accounts, with respect to which a portfolio manager has day-to-day management responsibilities.

Conflicts of interest may also arise when the Sub-Adviser invests one or more of its client accounts in different or multiple parts of the same issuer’s capital structure, including investments in public versus private securities, debt versus equity, or senior versus junior/subordinated debt, or otherwise where there are different or inconsistent rights or benefits. Decisions or actions such as investing, trading, proxy voting, exercising, waiving or amending rights or covenants, workout activity, or serving on a board, committee or other involvement in governance may result in conflicts of interest between clients holding different securities or investments. Generally, individual portfolio managers will seek to act in a manner that they believe serves the best interest of the accounts they manage. In cases where a portfolio manager or team faces a conflict among its client accounts, it will seek to act in a manner that it believes best reflects its overall fiduciary duty, which may result in relative advantages or disadvantages for particular accounts.

Nuveen Asset Management has adopted certain compliance procedures which are designed to address these types of conflicts common among investment managers. However, there is no guarantee that such procedures will detect each and every situation in which a conflict arises.

Nuveen Asset Management or its affiliates, including TIAA, sponsor an array of financial products for retirement and other investment goals, and provide services worldwide to a diverse customer base. Accordingly, from time to time, a Fund may be restricted from purchasing or selling securities, or from engaging in other investment activities because of regulatory, legal or contractual restrictions that arise due to another client account’s investments and/or the internal policies of Nuveen Asset Management, TIAA or its affiliates designed to comply with such restrictions. As a result, there may be periods, for example, when Nuveen Asset Management will not initiate or recommend certain types of transactions in certain securities or instruments with respect to which investment limits have been reached.

The investment activities of Nuveen Asset Management or its affiliates may also limit the investment strategies and rights of the Funds. For example, in certain circumstances where the Funds invest in securities issued by companies that operate in certain regulated industries, in certain emerging or international markets, or are subject to corporate or regulatory ownership definitions, or invest in certain futures and derivative transactions, there may be limits on the aggregate amount invested by Nuveen Asset Management or its affiliates for the Funds and other client accounts that may not be exceeded without the grant of a license or other regulatory or corporate consent. If certain aggregate ownership thresholds are reached or certain transactions undertaken, the ability of Nuveen Asset Management, on behalf of the Funds or other client accounts, to purchase or dispose of investments or


exercise rights or undertake business transactions may be restricted by regulation or otherwise impaired. As a result, Nuveen Asset Management, on behalf of the Funds or other client accounts, may limit purchases, sell existing investments, or otherwise restrict or limit the exercise of rights (including voting rights) when Nuveen Asset Management, in its sole discretion, deems it appropriate in light of potential regulatory or other restrictions on ownership or other consequences resulting from reaching investment thresholds.

(a)(3) Fund Manager Compensation

As of the most recently completed fiscal year end, the primary Portfolio Managers’ compensation is as follows:

Portfolio manager compensation consists primarily of base salary and variable components consisting of (i) a cash bonus; (ii) a long-term performance award; and (iii) participation in a profits interest plan.

Base salary. A portfolio manager’s base salary is determined based upon an analysis of the portfolio manager’s general performance, experience and market levels of base pay for such position.

Cash bonus. A portfolio manager is eligible to receive an annual cash bonus that is based on three variables: risk-adjusted investment performance relative to benchmark generally measured over the most recent one, three and five year periods (unless the portfolio manager’s tenure is shorter), ranking versus Morningstar peer funds generally measured over the most recent one, three and five year periods (unless the portfolio manager’s tenure is shorter), and management and peer reviews.

Long-term performance award. A portfolio manager is eligible to receive a long-term performance award that vests after three years. The amount of the award when granted is based on the same factors used in determining the cash bonus. The value of the award at the completion of the three-year vesting period is adjusted based on the risk-adjusted investment performance of Fund(s) managed by the portfolio manager during the vesting period and the performance of the TIAA organization as a whole.

Profits interest plan. Portfolio managers are eligible to receive profits interests in Nuveen Asset Management and its affiliate, Teachers Advisors, LLC, which vest over time and entitle their holders to a percentage of the firms’ annual profits. Profits interests are allocated to each portfolio manager based on such person’s overall contribution to the firms.

There are generally no differences between the methods used to determine compensation with respect to the Fund and the Other Accounts shown in the table above.

(a)(4) Beneficial Ownership of JRI Securities

As of December 31, 2025, the portfolio managers beneficially owned the following dollar range of equity securities issued by the Fund.


Name of Portfolio Manager    None      $1-
$10,000
     $10,001-
$50,000
     $50,001-
$100,000
     $100,001-
$500,000
     $500,001-
$1,000,000
     Over
$1,000,000
 

Brenda A. Langenfeld

     X                                                         

Noah P. Hauser

     X                                                         

Tryg T. Sarsland

     X                                                         

Benjamin T. Kerl

     X                                                         

James Kim

     X                                                         


Item 14.

Purchases of Equity Securities by Closed-End Management Investment Company and Affiliated Purchasers.

Not applicable.


Item 15.

Submission of Matters to a Vote of Security Holders.

There have been no material changes to the procedures by which shareholders may recommend nominees to the registrant’s Board implemented after the registrant last provided disclosure in response to this Item.


Item 16.

Controls and Procedures.


(a)

The registrant’s principal executive and principal financial officers, or persons performing similar functions, have concluded that the registrant’s disclosure controls and procedures (as defined in Rule 30a-3(c) under the Investment Company Act of 1940, as amended (the “1940 Act”) (17 CFR 270.30a-3(c))) are effective, as of a date within 90 days of the filing date of this report that includes the disclosure required by this paragraph, based on their evaluation of the controls and procedures required by Rule 30a-3(b) under the 1940 Act (17 CFR 270.30a-3(b)) and Rules 13a-15(b) or 15d-15(b) under the Securities Exchange Act of 1934, as amended (the “Exchange Act”) (17 CFR 240.13a-15(b) or 240.15d-15(b)).


(b)

There were no changes in the registrant’s internal control over financial reporting (as defined in Rule 30a-3(d) under the 1940 Act (17 CFR 270.30a-3(d)) that occurred during the period covered by this report that has materially affected, or is reasonably likely to materially affect, the registrant’s internal control over financial reporting.


Item 17.

Disclosure of Securities Lending Activities for Closed-End Management Investment Companies.

Not applicable.


Item 18.

Recovery of Erroneously Awarded Compensation.


(a)

Not applicable.


(b)

Not applicable.


Item 19.

Exhibits.


(a)(1)

Not applicable because the code of ethics is available, upon request and without charge, by calling 800-257-8787 and there were no amendments during the period covered by this report.


(a)(2)

Not applicable.


(a)(3)

Certifications pursuant to Rule 30a-2(a) under the Investment Company Act of 1940 and Section 302 of the Sarbanes-Oxley Act of 2002 are attached hereto.


(a)(4)

Not applicable.


(a)(5)

Not applicable.


(b)

Certification pursuant to Rule 30a-2(b) under the Investment Company Act of 1940 and Section 906 of the Sarbanes-Oxley Act of 2002 is attached hereto.


(c)

Consent of Independent Registered Public Accounting Firm.


SIGNATURES

Pursuant to the requirements of the Securities Exchange Act of 1934 and the Investment Company Act of 1940, the registrant has duly caused this report to be signed on its behalf by the undersigned, thereunto duly authorized.

Nuveen Real Asset Income and Growth Fund


Date: March 6, 2026     By:   /s/ David J. Lamb            
      David J. Lamb
      Chief Administrative Officer

Pursuant to the requirements of the Securities Exchange Act of 1934 and the Investment Company Act of 1940, this report has been signed below by the following persons on behalf of the registrant and in the capacities and on the dates indicated.


Date: March 6, 2026     By:   /s/ David J. Lamb            
      David J. Lamb
      Chief Administrative Officer
      (principal executive officer)
Date: March 6, 2026     By:   /s/ Marc Cardella             
      Marc Cardella
      Vice President and Controller
      (principal financial officer)