For the third quarter, we recorded net income to common stockholders of $0.9 million, or $0.04 per diluted share. Our results include certain non-core expenses totaling $4.4 million which were largely due to previously announced restructuring efforts. There is further detail on non-core items at the end of this letter.[1]
During the quarter, we continued to execute the strategy we have articulated for several prior quarters — investing through the cycle and proving the power of our integrated network and platform. We are beginning to realize the benefits of our investments and efficiency initiatives, which is showing up in our financial results.
CEO Summary of Key Points
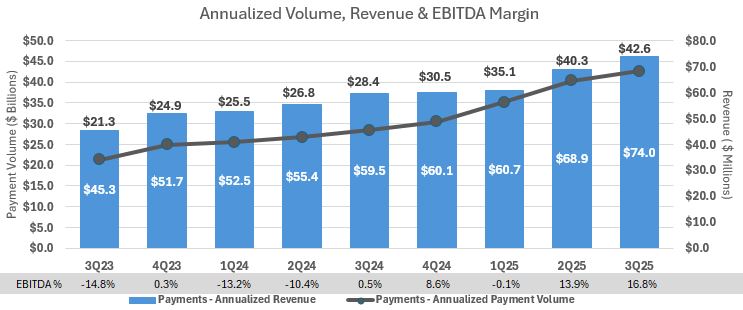
•Transportation Revenue Growth & Outlook. Our Payments revenue grew 7.4% q/o/q; EBITDA margin improved to 16.8%, and we generated positive pretax operating income in the segment for the first time. Factoring revenue was up slightly and core operating margin improved. Intelligence revenue was flat. In a difficult market, we grew total transportation revenue 3.7% q/o/q in 3Q[2]. I stand by my statement in the last earnings call that we expect our transportation revenue to grow 20% annually.
•Expense Reduction & Margin Improvement. We reduced total expenses by ~5% through our efficiency efforts in 3Q, and 90% of those savings are in our run rate as we begin 4Q. We expect the remaining savings to be in place by year-end. These restructuring efforts were not a one-and-done event; they are representative of the evolution of our business I've been alluding to for the last few quarters. We are now at the point of properly monetizing our platform and Network and improving efficiency. Our work to become leaner and more efficient is far from done, and we expect to progress on this front in 2026. The investments we have made in AI tools are bearing the expected fruit, and we continue to find new ways to incorporate these tools into our operations, as I discuss later. We project 4Q expenses to be $96.5 million, which is 4.5% below adjusted 2Q 2025 numbers. The following table shows the expense reductions segment and adjusts for the impact of non-recurring items.
Noninterest Expense
in millions
Reported 2Q25
Reported 3Q25
Adjusted 2Q25
Adjusted 3Q25
Adjusted QoQ $
Adjusted QoQ %
Factoring
$
14.1
$
19.1
$
19.5
$
18.0
$
(1.5)
(7.7)
%
Payments
$
16.8
$
17.1
$
16.8
$
16.6
$
(0.2)
(1.2)
%
Intelligence (partial qtr 2Q)
$
7.7
$
5.9
$
4.7
$
5.7
$
1.0
21.3
%
Banking
$
32.0
$
31.7
$
32.0
$
31.2
$
(0.8)
(2.5)
%
Corporate
$
30.2
$
29.9
$
28.1
$
27.8
$
(0.3)
(1.1)
%
Total
$
100.8
$
103.7
$
101.1
$
99.3
$
(1.8)
(1.8)
%
Note - adjusted to exclude, as appropriate, the expense impacts of USPS and other nonrecurring items highlighted in 2Q reporting,
and restructuring expense related non-recurring items in 3Q (see footnotes [1,3]).
•Credit. The market noise around Tricolor was unexpected and unfortunate. We have more to learn about the outcome of this credit, but at present we believe we remain adequately secured. Our collateral is of a different nature than lenders who may take the largest losses, and we have been diligent in monitoring it. In a war no one wants to be involved in, we like our battlefield position better than most others. Nevertheless, this type of lending is not core to our strategy, and investors should expect us to continue to shrink our non-transportation footprint.
•Share Repurchase Announcement. We believe our current share price does not reflect the intrinsic value of Triumph. As of today, our board authorized a $30 million share repurchase program. We have consistently told investors that we have three potential outlets for excess capital: (i) as a buffer against the unknown, (ii) to pursue
1
acquisitions that enhance the value we deliver to the transportation industry, and (iii) to reduce our share count. We will always maintain a capital cushion above regulatory requirements. For as long as our stock trades near current levels, we expect to use a portion of our earnings to buy back shares.
Our Strategy and The Harmony of a Customer-Centric Organization
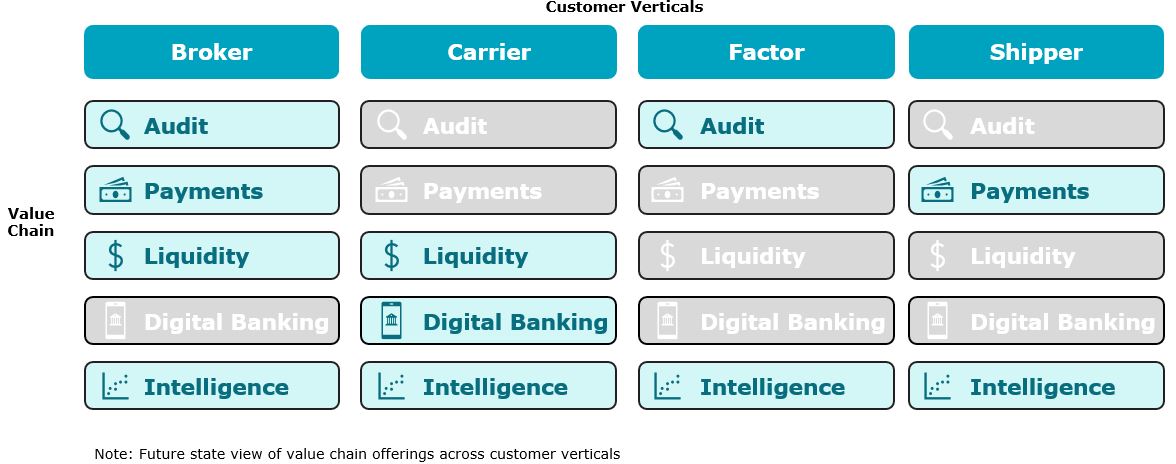
Triumph is a technology and payments provider to the trucking industry. We connect brokers, carriers, shippers, and factors to improve their data strategy, payments, and working capital. Our goal is to serve our customers through the integrated value chain we are building, which is transforming the financial infrastructure of trucking, leading to improved margins, greater profitability, and reduced fraud and waste for all our stakeholders. Our competitive advantage in furtherance of this goal comes from the system of reinforcing activities across audit, payments, liquidity solutions, digital banking, and intelligence. No single competitor offers this full suite of services, nor can they easily replicate it. It took five years to lay the foundation, but we believe the integrated, reinforcing power of this value chain will drive sustainable revenue growth and margin expansion for our shareholders.
1.Audit – reducing the time and effort required to process invoices through automation and efficiency at scale
2.Payments – improving transactional confidence by efficiently making remittances to the right party at the right time while mitigating fraud
3.Liquidity Solutions – factoring, supply chain finance ("SCF"), Factoring-as-a-Service ("FaaS"), quickpay and cash advances that turn freight receivables into cash as well as equipment financing
4.Digital Banking+ – a business bank account integrated with our Network to allow for the seamless movement of money, plus an integrated set of tools to serve as the hub of a carrier’s back office
5.Intelligence – fraud protection, pricing, capacity and performance insights powered by our data
Each of these activities reinforces others, creating a competitive advantage rivals cannot copy piecemeal. As examples, our audit and payments processes feed transactional data to our Intelligence platform, and our payments Network and liquidity solutions connect directly to LoadPay, our digital banking product. It is difficult for any company to achieve competence in multiple products, but when all these products are fully integrated and working in harmony, it will create greater customer and shareholder value.
Reorganizing around a customer-centric view better serves our clients and creates efficiencies for the enterprise. Using a product-centric approach as we built density was appropriate, but to achieve the long-term revenue growth and margin improvement goals we have set, this is now the best path forward.
2
In hindsight, none of us comprehended how bad the freight market of 2021-2022 was going to be for trucking. In fact, I think that the issues created by that market distortion have been a net negative for Triumph and the industry, despite the short-term boost to our stock price. The unprecedented growth created an all-hands-on-deck situation that became a desperate attempt to hold the sail while market tailwinds pushed us along. That same tailwind also brought with it a flood of capacity that the government has struggled to properly regulate, license and track. Organized crime also took advantage of this chaos. These elements have always been part of the trucking industry, but they are more present in the supply chain now than ever before. I am encouraged that our government is beginning to focus on this issue. Truckers should not have to bend or break the rules just to compete against a shadow market.
Our focus is now squarely on two things: (i) serving our customers with excellence as an indispensable partner, and (ii) growing revenue and improving margins to create long-term shareholder value. Through a major effort and despite the voices of many skeptics and naysayers, we have willed into existence the only financial Network in brokered freight. We have largely done it through the most difficult freight cycle since deregulation in the 1980s. We will continue to expand the value of the Network as we now focus on building returns and delivering a leaner enterprise.
Payments
1.Analysis of Financial and Operational Performance for the Quarter
2.Pricing Changes; Revenue Drivers and Growth Forecasts
3.LoadPay Update
4.Additional Segment Financial Analysis
Analysis of Financial and Operational Performance for the Quarter. Revenue grew 7.4% q/o/q, and EBITDA margin for the quarter improved to 16.8%. Pretax operating income was positive for the first time in 3Q.
September 30, 2025
June 30, 2025
March 31, 2025
December 31, 2024
September 30, 2024
Current Quarter Q/Q
Current Year Y/Y
For the Qtr Ending
Change
% Change
Change
% Change
Payments:
Invoice Volume
8,826,848
8,500,565
7,182,044
6,788,408
6,278,246
326,283
3.8
%
2,548,602
40.6
%
Payment Volume
$
10,662,418,000
$
10,081,206,000
$
8,777,825,000
$
7,625,735,000
$
7,091,493,000
$
581,212,000
5.8
%
$
3,570,925,000
50.4
%
Network Invoice Volume
1,057,606
1,004,603
719,531
567,258
661,628
53,003
5.3
%
395,978
59.8
%
Network Payment Volume
$
1,696,817,000
$
1,579,662,000
$
1,167,464,000
$
922,927,000
$
1,063,228,000
$
117,155,000
7.4
%
$
633,589,000
59.6
%
Average Invoice Price
1,208
1,186
1,222
1,123
1,130
22
1.9
%
78
6.9
%
Network Engagement
63.4
%
63.3
%
50.4
%
48.7
%
47.8
%
0.1
%
0.2
%
15.6
%
32.6
%
Average Float
$
484,582,000
$
469,211,000
$
442,901,000
$
410,044,000
$
363,255,000
$
15,371,000
3.3
%
$
121,327,000
33.4
%
Fee Revenue
$
8,791,000
$
8,105,000
$
6,903,000
$
6,704,000
$
6,611,000
$
686,000
8.5
%
$
2,180,000
33.0
%
Total Revenue
$
18,503,000
$
17,231,000
$
15,184,000
$
15,031,000
$
14,873,000
$
1,272,000
7.4
%
$
3,630,000
24.4
%
# of LoadPay Accounts
4,421
2,367
778
192
65
2,054
86.8
%
4,356
6701.5
%
LoadPay Funding
$
53,042,000
$
22,212,000
$
4,986,000
$
777,000
$
178
$
30,830,000
138.8
%
$
52,864,000
29698.9
%
Average Interchange Fees
1.64
%
1.61
%
1.76
%
1.67
%
—
%
0.03
%
1.86
%
1.64
%
—
%
EBITDA margin
16.8
%
13.9
%
(0.1)
%
8.6
%
0.5
%
2.9
%
20.9
%
16.3
%
3260.0
%
For 3Q, annualized Network engagement[4] (breadth) was steady at $70 billion, while depth was $114 billion[5]. As a reminder, the breadth of the network represents the percentage of unique brokered freight[6] transactions Triumph has touched at least once regardless of product or segment. The depth of the network is the dollar volume of all transactions in each product or segment. The depth is larger because we touch certain transactions in multiple products and segments. Payment volume increased by 5.8% to $42.6 billion, annualized. Our broker customers represent $38.1 billion of that.
Pricing Changes; Revenue Drivers and Growth Forecasts. Payments revenue grew 7.4% in 3Q to an annualized rate of $74.0 million. While growth over the last two quarters has been driven by new customer additions, we expect our repricing efforts to drive more revenue growth in 4Q 2025 and accelerate in 1Q 2026.
3
Anyone can use inflation or a hot market as air cover for price increases. While we see inflationary pressures, we do not have anything resembling a hot market in freight (right now or for the last three years). Investors have asked about the revenue growth trajectory of our existing customer base – specifically, when would we bring legacy customers to our standard pricing. Our position has been that the value we provide our customers would precede monetization. This is how we create long-term value for both customers and shareholders. We have reached that point in the development of the Network. Our experience with recent repricing efforts confirms the logic of our approach. We have proven the increasing value proposition of our payments services to customers, which has allowed us to increase prices towards our standard rates with no customer attrition thus far.
Importantly, fee revenue represented ~54% of the growth this quarter and should continue to lead our growth. In 3Q, the percentage of payments for which we charged a fee increased from 28.5% to 30.8%. During the quarter, fee revenue for payments increased by $0.7 million, or an annualized $2.7 million.
Closely related to the repricing question, I am often asked about the revenue opportunity of our existing Payments business. Investors and analysts want to be able to forecast the future. I want to do the same. My experience, however, has been that forecasting the Network is hard to do. Perhaps the best way to look at this is on a per invoice basis.
We have sized the brokered freight industry at about $110 billion for several years. When we use that number, we are referring to what brokers pay carriers (not what brokers charge shippers, which would be larger to account for broker margins). That number is directionally correct today given lower invoice sizes, although it is fair to say that brokered freight continues to grow. We can use $1,500 as an average for all truckload invoices. Doing that math, we can estimate about 73 million invoices annually for full truckload freight. If you use our standard rate card for doing both audit and payment, the potential fee revenue for the truckload brokered market is ~$150 million. This is a market dimension of fee revenue, not a target. This does not include revenue potential from our existing embedded liquidity solutions, the value of float, less-than-truckload (“LTL”) audit which we just launched with RXO, and other areas of our future expansion. We will account for the revenue from these offerings in Payments, and cumulatively, these have a larger total revenue opportunity than per invoice audit and payment fees.
In 3Q, we earned $7.1 million in broker noninterest income on 8.8 million invoices. Triumph’s annualized run rate of invoices paid is approximately 35 million invoices, or 47% of all invoices. As a reminder, broker noninterest income includes audit and payment revenues, and we audit some invoices that we do not pay. For purposes of this sizing exercise, we are using invoices that we pay and excluding those where we only perform audit. We earned $0.80 per invoice on average for those payment invoices. Using basic assumptions, we believe there is an opportunity to generate $42 million more revenue per year if existing customers for whom we currently make payments utilized our audit feature and paid standard pricing for audit and payments. It is highly improbable that we will get to 100% of this revenue opportunity in the near term, but the opportunity to grow fee income within our existing client base alone is still a material one. Further, we have growth opportunities to add new clients and monetize the network in other ways, as described below. This repricing exercise to our standard rates isn’t accomplished by just announcing fee increases; we are doing it by individually demonstrating the increasing value of the Network to the broker for their own operation. It is a collaborative approach. If I were on the other side of the negotiation, it’s how I would want to be treated. That’s how we endeavor to do things at Triumph. It may take longer and more work, but it builds loyalty and trust in your brand.
Once again, we recognize that 100% realization on penetration or pricing is not realistic, but we are making demonstrable progress in moving pricing towards standard rates and improving margins while we do it. The ability to cross-sell brokers our other products (e.g., Intelligence) and other modes (e.g., LTL) to deliver more value to their bottom line is also an exciting opportunity. Finally, we will continue to add new customers nearly every quarter.
LoadPay Update. If the broker fee revenue of our original payments business is still less than 50% of its total opportunity, then LoadPay is just getting started. LoadPay is positioned to win for several reasons, but its primary competitive edge is its deep integration and connection into our payments Network. We have previously sized the LoadPay addressable market to be about $100 million, and we stand by that projection.
We added 2,054 LoadPay accounts during the quarter, nearly doubling our total number of accounts to 4,421. With a quarter to go, we can reaffirm our expectation that we will open between 5,000 and 10,000 accounts in 2025. LoadPay functionality is expanding beyond being the leading bank for over-the-road carriers. In 3Q, we started connecting limited
4
factoring capabilities for carriers who use both our factoring services and LoadPay banking accounts. This is a first step in expanding LoadPay beyond its banking roots into a full-service financial companion for carriers. In the coming months, we will introduce features which empower carriers to make more informed business decisions and build financial resilience. Features include the ability for carriers to access lane rate insights and savings toward specific goals or recurring costs. We will also begin offering cash advances and insights driven by both the carriers' own behavior/data and industry insights.
Additional Segment Financial Analysis. In the chart below we graphically highlight the continued revenue growth and its trend over the last eight quarters against the backdrop of our payment volumes (note this is payment volume only, not Network engagement). We have generated a roughly 27.8% CAGR in revenue over the last two years and 102% over the last six years despite more than half of that period being part of the longest recession in the history of trucking..
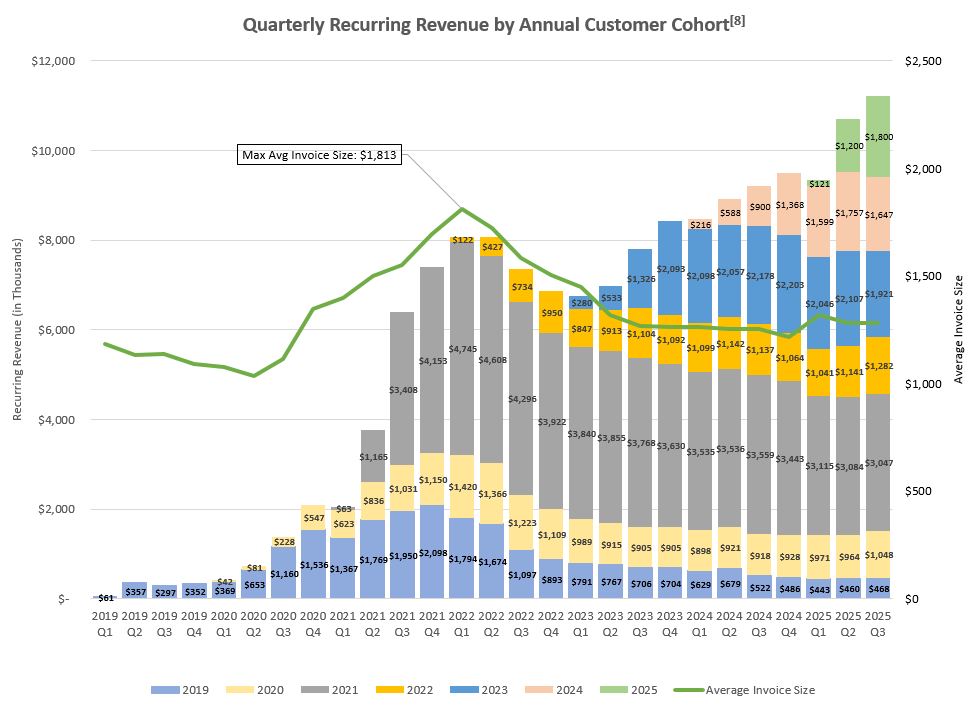
The chart on the next page provides a visual demonstration of how we have increased revenue in our Payments segment to date. The line represents invoice sizes[7], while the bars represent revenue. The revenue bars highlight fee income which can be attributed to a specific customer in a specific year and excludes supply chain finance income and float.
5
Factoring
1.Analysis of Financial and Operational Performance for the Quarter
2.Automation & AI Update
3.FaaS Update
Analysis of Financial and Operational Performance for the Quarter. Factoring segment pretax operating income was $8.2 million, revenue declined (2.7)% q/o/q, and pretax operating margin was 20.7%. Adjusting for USPS and our restructuring efforts[1,2,3], pretax operating income was $9.3 million, revenue was up 0.3% q/o/q, and pretax operating margin was 23.5%. During 3Q, our average transportation invoice price was $1,690. This is $27 higher than 2Q 2025, but $34 lower than the same period in 2024. Given the two distinct customer profiles we serve — fleets and small owner-operators (“O/O”) — it is helpful to look at the average invoice size separately. This is also interesting as it leverages our data to help explain a common question in trucking: “why are O/O not leaving the system faster?” The average invoice size for our fleet customers was $1,817; for O/O it was $1,317. Said differently, on average, fleet invoices are 38% larger. Compared to 2Q, these numbers represent modest declines of $36 and $16, respectively. Compared to 3Q 2024, fleet average invoice sizes were down $92, while the O/O segment showed a $16 increase. I would offer a few takeaways from this data, although I am not suggesting that these anecdotes fully explain all the countervailing market forces in trucking and in our own client base...doing that would require a much longer letter.
•First, it is important to recognize that the O/O has a lower fixed operating cost and more flexibility. They can park their truck, drive for Uber and skip maintenance cycles. I am not saying it is always in their best interest long term to do this, but it allows them to stay in the game longer than many thought possible. Because of a fleet’s large, fixed cost base, they don’t have the same option to sit on the sidelines. This partially explains why O/O invoice sizes have gone up while fleets have not – the O/O market has partially self-regulated.
6
•Second, O/Os have access to different load offerings and aggregated discounts that were not as prevalent in the last major slowdown in 2009. Taking an Amazon power-only load with shorter hauls between distribution centers can keep O/Os alive, while a fleet would not likely take that load. The fuel discount aggregators have also reduced a major gap between what fleets and O/Os pay for fuel.
The punchline is this; small carriers are suffering for a variety of reasons, but have hung in longer than anyone anticipated. Until there is focused enforcement to ensure the capacity in the system is properly licensed and tracked, low rates are likely here to stay. It is possible we are at an inflection point, but this all happens against the backdrop of trade policy and macroeconomic forces.
Total purchased volume reached $3.0 billion for the quarter, a 4.3% increase over 2Q, and 14.9% over the same quarter in 2024. Invoice volume increased 2.2% this quarter.
September 30, 2025
June 30, 2025
March 31, 2025
December 31, 2024
September 30, 2024
Current Quarter Q/Q
Current Year Y/Y
For the Qtr Ending
Change
% Change
Change
% Change
Factoring:
Invoice Volume
1,735,860
1,697,851
1,497,644
1,524,904
1,480,824
38,009
2.2
%
255,036
17.2
%
Purchased Volume
$
2,997,895,000
$
2,873,659,000
$
2,707,805,000
$
2,747,351,000
$
2,610,177,000
$
124,236,000
4.3
%
$
387,718,000
14.9
%
Average Transportation Invoice Size
$
1,690
$
1,663
$
1,769
$
1,767
$
1,724
$
27
1.6
%
$
(34)
(2.0)
%
Invoices / Client
236
232
204
205
192
4
1.7
%
44
22.9
%
Discount Rate
1.29
%
1.37
%
1.31
%
1.34
%
1.40
%
(0.08)
%
(5.8)
%
(0.11)
%
(7.9)
%
Avg Daily Purchases*
$
46,842,000
$
45,614,000
$
44,390,000
$
43,609,000
$
40,784,000
1,228,000
2.7
%
6,058,000
14.9
%
Operating margin
20.71
%
48.46
%
19.24
%
23.67
%
20.99
%
(27.75)
%
(57.3)
%
(0.28)
%
(1.3)
%
*calculated using number of working days
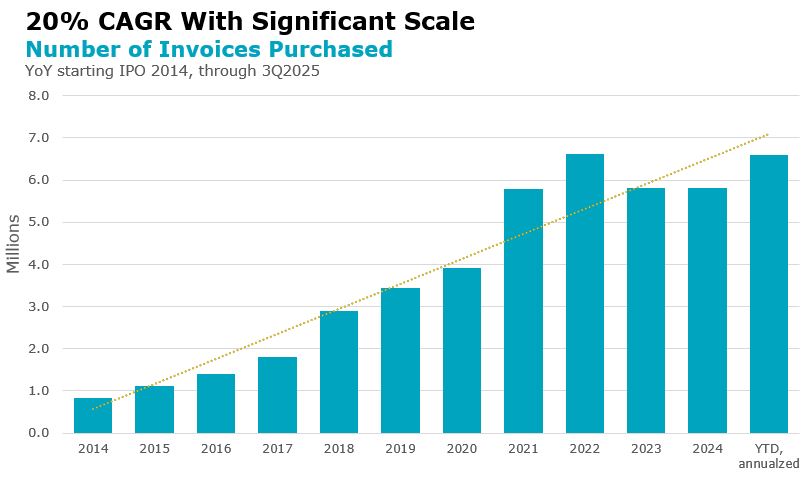
It is not easy to grow a business of material size and scale at a 20% CAGR consistently for over a decade. We have done so. As we reached nearly $3 billion in purchases last quarter with subdued invoice prices, it reminds me that we have a lot to celebrate in our factoring business.
7
Automation & AI Update. We remain focused on initiatives that will drive revenue growth and improve operating margin. In 3Q, we launched automated cash posting, delivering a ~20% efficiency lift within our treasury department. We expect that additional enhancements that are underway in this area will further streamline back-office operations and reduce manual effort.
We also introduced our automated bill reminder system, which proactively reaches out to account debtors regarding aged invoices. While currently in beta testing, the early results are promising, showing the capability to touch 10x more invoices than could previously be managed. This allows our staff to focus their time and expertise on exception handling and complex cases rather than routine outreach.
Our instant decision model continues to drive efficiency, with a pass and approval rate of 58% in our O/O segment, enabling these clients to get instant funding when they use LoadPay or our fuel card. Today, the product team is working on improving the model to better support our large fleet operations team, which is currently experiencing a ~15% approval rate. This is custom built AI that is, in my opinion, unrivaled in the industry. We will continue to update our AI models to improve performance, reduce friction, and increase margins.
We also have some exciting initiatives on the horizon, including the automation of our origination process to enhance the client experience and accelerate approvals during the application journey. These efforts will streamline workflow and ensure that applications move through the funnel more efficiently, delivering faster decisions, greater satisfaction for our clients, and the ability to manage more volume without adding expenses.
FaaS Update. FaaS is slowly grinding upwards, but we are beginning to see some inflection in adoption. This is to be expected with an intricate partnership – it takes time to get things in place and work out the kinks. Our partners are deeply committed to the opportunity and recognize the value it brings to their organizations. For example, CHRW has publicly discussed it as an area of growth. While our partners focus on deployment and capitalizing on their unique delivery channels, we continue to advance the technology behind FaaS to deliver a more seamless, efficient, and intuitive experience for our shared clients, positioning us for meaningful growth as adoption accelerates.
Intelligence
1.Analysis of Financial and Operational Performance for the Quarter
2.Product Roadmap
3.Partnership with Highway on the Trusted Freight Exchange
Analysis of Financial and Operational Performance for the Quarter. Total revenue was $2.3 million, our average contract value (ACV) was $43 thousand, and gross margin was 89%.
Product Roadmap. It has been 160 days since we completed the acquisition of Greenscreens.ai. We did not intend to just offer the existing Greenscreens product with a rebranded interface. Our goal was to combine that product with the ISO platform we acquired in December 2024, and to inject existing Triumph data into the combined offering. This has taken a bit of time and explains why revenue remained flat during our first full quarter post-acquisition.
In late September, we launched our integrated Pricing and Performance Intelligence solution. This product unifies pricing, performance, and capacity sourcing into a single data solution for freight brokers. With this tool, brokers can see rate, performance, and embedded capacity information with AI-driven predictive analytics and capacity sourcing suggestions. This solution builds on the AI models we acquired with Greenscreens. By combining real-world performance metrics with predictive analytics, brokers can sharpen their pencil on pricing, making smarter, more efficient decisions, balancing cost and reliability to improve load coverage and overall freight outcomes. Using AI and our proprietary data to do this makes our offering differentiated and highly scalable. I would also mention that we have ~400 Payments Network customers who do not currently use our Intelligence solution or its Greenscreens predecessor, and I would repeat here what I said earlier about treating customers the way we want to be treated to build loyalty and brand trust. If customers can trust you to do one thing well, they are likely to trust you with another. I would expect many of our existing Payments customers to become Intelligence customers in 2026.
8
We are also working on our Intelligence solutions for shippers to enable strategic rate and performance benchmarking and transportation procurement. The first phase of this initiative will see us establish a pilot program to achieve critical mass of shipper intelligence data with an expected commercial offering by the second half of 2026. This product would focus on the aggregation of information derived from participating Shippers, as opposed to Brokers, in an effort to provide a targeted solution for this market.
Partnership with Highway on the Trusted Freight Exchange. Our work continues in our partnership with Highway to power portions of their Trusted Freight Exchange (TFX). TFX is a secure alternative to public loadboards. As Highway continues to build density within their two-sided freight exchange, we are actively integrating various Intelligence and liquidity solutions capabilities to enhance the experience for carriers and brokers.
In TFX, carriers can access market rate ranges in the context of each load they evaluate using our Intelligence rate data. Carriers are also able to understand the specific payment terms available to them on a given load by incorporating the capabilities of our Payments platform. There are additional liquidity solutions in development for carriers on loads posted from brokers who are Payments customers. We will provide more details on this in future quarters.
Banking
1.Analysis of Financial and Operational Performance for the Quarter
2.Update on Credit Metrics
Analysis of Financial and Operational Performance for the Quarter. Banking segment operating income increased $0.7 million to $27.1 million, or 2.7%, from the prior quarter, on lower noninterest and credit loss expense, while revenue was marginally higher.
Update on Credit Metrics. The credit risk in our business is generally low, but we must be diligent against fraud. When introducing investors to Triumph, we stress the quick turn of our portfolio where the receivables portion turns about every 37 days, our mortgage warehouse portfolio turns about every three weeks, and 70% of the entire portfolio will turn in under one year. Our allowance for credit losses reflects these fast-turning portfolios and, when those specifics are accounted for, the rest of the portfolio reserves are in-line with most community banks. Our credit outlook and expectations remain in line with our comments on last quarter’s earnings call.
Fraud is something against which we maintain constant vigilance. Despite that, in mid-September, we issued an 8-K related to Tricolor’s bankruptcy announcement. Although we do not yet know the details, there have been public statements that Tricolor had engaged in fraud. We have $22.5 million of a $60 million facility. Our exposure is through a floorplan lending facility secured by vehicle inventory with a perfected first lien position. This perfected status should give us priority in repayment. As of now, we can identify thousands of vehicles we believe are collateral that adequately secure our loan and as such it would not be appropriate to record a specific loss reserve at this time. Should the bankruptcy process lead us to a place where our beliefs around the nature of that collateral is no longer correct, we will evaluate accordingly. Going forward, we will continue to review our portfolio in light of our strategic focus on transportation.
Credit metrics for the quarter generally moved modestly negatively, largely influenced by Tricolor.
•Total non-performing loans to total loans increased by 0.16% to 1.36%.
•Total classified assets increased by $8.2 million.
•Past due to total loans improved by 0.30% to 1.91%.
Freight Market Update
State of the US Trucking Market. The U.S. trucking industry remains in a prolonged correction phase caused by excess capacity built during the post-Covid boom. Supply continues to exceed demand, leading to stagnant rates and margin pressures for carriers. Gradual capacity rationalization and modest economic growth signals potential stabilization, though key metrics continue to send mixed signals.
9
Trucking capacity remains oversupplied, keeping rates near or below breakeven for carriers due to structural challenges from private fleet insourcing and slow exits among O/O. Key drivers of these challenges include uncertainty around tariffs (particularly tariffs on heavy duty imports, raw materials, and manufacturing components) as well as the FMCSA’s Interim Final Ruling “Restoring Integrity to the Issuance of Non-Domiciled Commercial Drivers Licenses”. The FMCSA IFR states: “There are roughly 200,000 non-domiciled CDL holders, which is approximately five percent of the 3.8 million active interstate CDL holders in 2024. A focus on enforcement of non-domiciled capacity issues could create material benefits for legitimate American small businesses, restoring some pricing power to small U.S. carriers. FMCSA anticipates that these non-domiciled drivers will exit the market within approximately two years as their credential comes up for renewal, and that the market will respond to this change in capacity as it has in the past, with rates adjusting and drivers and carriers entering the market where needed.” We would add to this statement that while the 3.8 million number is accurate as a total, it is more precise to say that 1.0 - 1.3 million drivers work in for-hire freight (as opposed to company owned fleets). We believe that a significant proportion of non-domiciled CDL holders work in the for-hire market, which is the market we primarily serve. If the enforcement actions proceed, it will likely have a bigger impact on the for-hire market than the overall market.
Expense Forecast & Closing Thoughts
As I noted at the beginning of the letter, there was noise this quarter related to our restructuring efforts, but those benefits are evidenced in our improving core expense run rate. We will not see the full benefit of those savings until 4Q, and project 4Q noninterest expense to be approximately $96.5 million. We are not done in our pursuit of greater efficiencies for our enterprise, and we expect to make additional progress in 2026.
While we are pursuing expense discipline, we remain committed to strategic investments, helping our broker customers ensure they are dealing with legitimate capacity and helping our carriers ensure they are working with legitimate and solvent payors.
I am excited about our Network and platform and the work we are doing in that ecosystem today to deliver unique value to our customers, helping them capture efficiency, improve margins, and generate new sources of revenue. While they do that, we will continue to innovate to help them capitalize on the opportunities tomorrow’s challenges will bring.
With warm regards,
Aaron P. Graft
Founder, Vice Chairman and CEO
10
[1]Summary of nonrecurring items highlighted in 2Q25 and 3Q25.
(in millions)
2Q25
3Q25
Factoring
Noninterest expense
$
14.1
$
19.1
Salaries and benefits
Restructuring costs
—
(1.1)
Professional Fees
USPS - Recovery of legal expense
7.4
—
Other
Other Legal Settlements
(2.0)
—
Adjusted noninterest expense
$
19.5
$
18.0
Payments
Noninterest expense
$
16.8
$
17.1
Salaries and benefits
Restructuring costs
—
(0.5)
Adjusted noninterest expense
$
16.8
$
16.6
Intelligence (partial qtr 2Q)
Noninterest expense
$
7.7
$
5.9
Salaries and benefits
Restructuring costs
—
(0.2)
Professional fees
Greenscreens transaction costs
(3.0)
—
Adjusted noninterest expense
$
4.7
$
5.7
Banking
Noninterest expense
$
32.0
$
31.7
Salaries and benefits
Restructuring costs
—
(0.5)
Adjusted noninterest expense
$
32.0
$
31.2
Corporate
Noninterest expense
$
30.2
$
29.9
Salaries and benefits and Professional fees
Restructuring costs
—
(2.1)
Other and Amortization of intangibles
New HQ termination fees and accelerated amortization
(2.1)
—
Adjusted noninterest expense
$
28.1
$
27.8
Total
Noninterest expense
$
100.8
$
103.7
Salaries and benefits and Professional fees
Restructuring costs
—
(4.4)
Professional Fees
USPS - Recovery of legal expense
7.4
—
Professional fees
Greenscreens transaction costs
(3.0)
—
Other
Other Legal Settlements
(2.0)
—
Other and Amortization of intangibles
New HQ termination fees and accelerated amortization
(2.1)
—
Adjusted noninterest expense
$
101.1
$
99.3
11
[2]Summary of nonrecurring items and highlighted in 2Q25 and 3Q25.
(in millions)
2Q25
3Q25
Factoring
Total Revenue
$
40.8
$
39.7
Noninterest Income
Intersegment Noninterest Income
(0.9)
(0.9)
Interest Income and Fees
USPS - Collection of fees
(1.2)
—
Adjusted Total Revenue
$
38.7
$
38.8
Payments
Total Revenue
$
17.2
$
18.5
Noninterest Income
Intersegment Noninterest Income
(0.4)
(0.3)
No Adjustments
No Adjustments
—
—
Adjusted Total Revenue
$
16.8
$
18.2
Intelligence (partial qtr 2Q)
Total Revenue
$
1.7
$
2.3
No Adjustments
No Adjustments
—
—
Adjusted Total Revenue
$
1.7
$
2.3
Total Transportation Revenue*
Total revenue
$
59.7
$
60.5
Noninterest Income
Intersegment Noninterest Income
(1.3)
(1.2)
Interest Income and Fees
USPS - Collection of fees
(1.2)
—
Adjusted Total Transportation Revenue
$
57.2
$
59.3
Annualized Adjusted Total Transportation Revenue
$
228.8
$
237.2
*Presented this quarter and going forward excluding intracompany noninterest revenue.
[3]Summary of 2Q nonrecurring items included in 2Q reporting.
Broad Category
Income Statement Line Item
Segment
Description
$ Impact
Interest income
Interest income and fees
Factoring
USPS - Collection of fees
$1,213,000
Noninterest expense
Professional Fees
Factoring
USPS - Recovery of legal expense
$7,376,000
Credit loss expense
Credit loss expense
Factoring
USPS - ACL Recovery
$3,773,000
Net impact of USPS settlement
$12,362,000
Noninterest expense
Professional Fees
Intelligence
Greenscreens transaction costs
$(3,024,000)
Noninterest expense
Other Noninterest Expense
Factoring
Other Legal Settlements
$(2,000,000)
Noninterest expense
Other & Amortization of intangibles
Corporate
New HQ termination fees and accelerated amortization.
$(2,067,000)
Net impact of other non-recurring items
$(7,091,000)
Pre-tax operating income impact
$5,271,000
Income Tax Expense
Income Tax Expense
All Segments
Equity award vesting and non-deductible transaction expenses
$
(1,100,000)
[4] We define Network engagement as the amount of freight touched through our payments, audit, full AP automation and rate intelligence products. It is an indicator of our broker volume density in the market, the source for growing available Network transactions and data assets, and a key value driver of the Network.
[5] The step up this quarter in depth is mostly related to the inclusion of all of Triumph Factoring's broker related volumes as well as continued improvement in our data validation processes. Triumph Factoring's data in 2Q only included the associated TriumphPay Audit volumes in keeping with our historical reporting practices.
[6] This reference to brokered freight is specific to domestic truckload (TL) freight only. Thus, this calculation would exclude less than truckload (LTL), parcel, etc. It would also exclude shipper volumes. Admittedly, this is a difficult percentage to calculate with precision, and it will move from year to year. That being said, we can evaluate the number of payments received in our factoring segment as a proxy for the percentage of TL freight Triumph
12
Payments is touching and also use industry data points to make informed assumptions. In the end, this goal is not intended to be a precise measurement in the same way as we would measure earnings. It is a directional and blunt measurement of the reach of the Network.
[7] Average invoice sizes in our payments segment are generally smaller than average invoice sizes in our factoring segment as a transportation factor generally will only factor long-haul trucking invoices. Less than truckload (LTL) and parcel typically are not regularly serviced by the transportation factoring industry due to their small ticket size. Our payments business pays all transportation invoices of a freight broker and, as such, includes some LTL, parcel and shorter hauls that a transportation factor normally will not service.
[8] Recurring cohort revenue is defined as quickpay revenue and fee revenue attributable to customers onboarded in the annual cohorts shown. It does not include non-recurring fees or gains, float revenue, or other supply chain finance income aside from quickpays. Average Invoice size presented excludes shipper and freight broker factoring invoices.
13
Conference Call Information
Aaron P. Graft, Vice Chairman and CEO, and Brad Voss, CFO, will review the financial results in a conference call with investors and analysts beginning at 9:30 a.m. central time on Thursday, October 16, 2025.
The live video conference option may be accessed directly through this link, https://triumph-financial-q3-2025-earnings.open-exchange.net/ or via the Company's IR website at ir.triumph.io through the News & Events, Events & Presentations links. An archive of this conference call will subsequently be available at this same location, referenced above, on the Company’s website.
About Triumph Financial
Triumph Financial, Inc. (NYSE: TFIN) is a financial and technology company focused on payments, factoring, intelligence and banking to modernize and simplify freight transactions. Headquartered in Dallas, Texas, its portfolio of brands includes Triumph, TBK Bank and LoadPay. ir.triumph.io
Forward-Looking Statements
This letter to shareholders contains forward-looking statements. Any statements about our expectations, beliefs, plans, predictions, forecasts, objectives, assumptions or future events or performance are not historical facts and may be forward-looking. You can identify forward-looking statements by the use of forward-looking terminology such as “believes,” “expects,” “could,” “may,” “will,” “should,” “seeks,” “likely,” “intends,” “plans,” “pro forma,” “projects,” “estimates” or “anticipates” or the negative of these words and phrases or similar words or phrases that are predictions of or indicate future events or trends and that do not relate solely to historical matters. You can also identify forward-looking statements by discussions of strategy, plans or intentions. Forward-looking statements involve numerous risks and uncertainties, and you should not rely on them as predictions of future events. Forward-looking statements depend on assumptions, data or methods that may be incorrect or imprecise and we may not be able to realize them. We do not guarantee that the transactions and events described will happen as described (or that they will happen at all). The following factors, among others, could cause actual results and future events to differ materially from those set forth or contemplated in the forward-looking statements: business and economic conditions generally and in the bank and non-bank financial services industries, nationally and within our local market areas; our ability to mitigate our risk exposures; our ability to maintain our historical earnings trends; changes in management personnel; interest rate risk; concentration of our products and services in the transportation industry; credit risk associated with our loan portfolio; lack of seasoning in our loan portfolio; deteriorating asset quality and higher loan charge-offs; time and effort necessary to resolve non-performing assets; inaccuracy of the assumptions and estimates we make in establishing reserves for probable loan losses and other estimates; risks related to the integration of acquired businesses and any future acquisitions; our ability to successfully identify and address the risks associated with our possible future acquisitions, and the risks that our prior and possible future acquisitions make it more difficult for investors to evaluate our business, financial condition and results of operations, and impairs our ability to accurately forecast our future performance; lack of liquidity; fluctuations in the fair value and liquidity of the securities we hold for sale; impairment of investment securities, goodwill, other intangible assets or deferred tax assets; our risk management strategies; environmental liability associated with our lending activities; increased competition in the bank and non-bank financial services industries, nationally, regionally or locally, which may adversely affect pricing and terms; the accuracy of our financial statements and related disclosures; material weaknesses in our internal control over financial reporting; system failures or failures to prevent breaches of our network security; the institution and outcome of litigation and other legal proceedings against us or to which we become subject; changes in carry-forwards of net operating losses; changes in federal tax law or policy; the impact of recent and future legislative and regulatory changes, including changes in banking, securities and tax laws and regulations, such as the Dodd-Frank Act and their application by our regulators as well as privacy, cybersecurity, and artificial intelligence regulation and oversight; governmental monetary and fiscal policies; changes in the scope and cost of FDIC, insurance and other coverages; failure to receive regulatory approval for future acquisitions and increases in our capital requirements.
14
While forward-looking statements reflect our good-faith beliefs, they are not guarantees of future performance. All forward-looking statements are necessarily only estimates of future results. Accordingly, actual results may differ materially from those expressed in or contemplated by the particular forward-looking statement, and, therefore, you are cautioned not to place undue reliance on such statements. Further, any forward-looking statement speaks only as of the date on which it is made, and we undertake no obligation to update any forward-looking statement to reflect events or circumstances after the date on which the statement is made or to reflect the occurrence of unanticipated events or circumstances, except as required by applicable law. For a discussion of such risks and uncertainties, which could cause actual results to differ from those contained in the forward-looking statements, see "Risk Factors" and the forward-looking statement disclosure contained in Triumph Financial’s Annual Report on Form 10-K, filed with the Securities and Exchange Commission on February 11, 2025.
Non-GAAP Financial Measures
This letter to shareholders includes certain non‐GAAP financial measures intended to supplement, not substitute for, comparable GAAP measures. Reconciliations of non‐GAAP financial measures to GAAP financial measures are provided at the end of this letter to shareholders.
15
The following table sets forth key metrics used by Triumph Financial to monitor our operations. Footnotes in this table can be found in our definitions of non-GAAP financial measures at the end of this document.
As of and for the Three Months Ended
As of and for the Nine Months Ended
(Dollars in thousands)
September 30, 2025
June 30, 2025
March 31, 2025
December 31, 2024
September 30, 2024
September 30, 2025
September 30, 2024
Financial Highlights:
Total assets
$
6,357,149
$
6,494,748
$
6,268,394
$
5,948,975
$
5,866,046
$
6,357,149
$
5,866,046
Loans held for investment
$
4,986,922
$
4,953,170
$
4,666,223
$
4,546,960
$
4,332,967
$
4,986,922
$
4,332,967
Deposits
$
4,955,246
$
5,186,098
$
4,976,750
$
4,820,820
$
4,706,694
$
4,955,246
$
4,706,694
Net income available to common stockholders
$
907
$
3,618
$
(784)
$
3,036
$
4,546
$
3,741
$
9,848
Performance Ratios - Annualized:
Return on average assets
0.11
%
0.28
%
—
%
0.26
%
0.36
%
0.13
%
0.29
%
Return on average total equity
0.73
%
1.95
%
0.01
%
1.70
%
2.39
%
0.90
%
1.85
%
Return on average common equity
0.41
%
1.68
%
(0.37
%)
1.41
%
2.14
%
0.58
%
1.57
%
Return on average tangible common equity (1)
0.76
%
2.81
%
(0.53
%)
2.01
%
3.07
%
0.94
%
2.26
%
Yield on loans
8.17
%
8.41
%
8.37
%
8.48
%
8.85
%
8.31
%
9.01
%
Cost of interest bearing deposits
2.36
%
2.22
%
2.14
%
2.17
%
2.20
%
2.24
%
2.18
%
Cost of total deposits
1.35
%
1.25
%
1.23
%
1.22
%
1.23
%
1.28
%
1.26
%
Cost of total funds
1.55
%
1.53
%
1.45
%
1.41
%
1.57
%
1.51
%
1.55
%
Net interest margin
6.29
%
6.43
%
6.49
%
6.65
%
6.81
%
6.40
%
7.05
%
Net noninterest expense to average assets
5.08
%
5.13
%
5.61
%
5.17
%
5.29
%
5.27
%
5.52
%
Asset Quality:(2)
Past due to total loans
1.91
%
2.21
%
3.24
%
3.27
%
2.62
%
1.91
%
2.62
%
Non-performing loans to total loans
1.36
%
1.20
%
2.07
%
2.49
%
2.62
%
1.36
%
2.62
%
Non-performing assets to total assets
1.10
%
1.04
%
1.64
%
2.02
%
2.07
%
1.10
%
2.07
%
ACL to non-performing loans
49.53
%
65.02
%
37.47
%
35.93
%
36.28
%
49.53
%
36.28
%
ACL to total loans
0.67
%
0.78
%
0.78
%
0.90
%
0.95
%
0.67
%
0.95
%
Net charge-offs to average loans
0.19
%
0.17
%
0.13
%
0.11
%
0.08
%
0.49
%
0.20
%
Capital:
Tier 1 capital to average assets(3)
9.55
%
9.46
%
12.04
%
12.03
%
12.21
%
9.55
%
12.21
%
Tier 1 capital to risk-weighted assets(3)
10.20
%
9.98
%
12.90
%
13.06
%
13.57
%
10.20
%
13.57
%
Common equity tier 1 capital to risk-weighted assets(3)
8.65
%
8.43
%
11.27
%
11.40
%
11.85
%
8.65
%
11.85
%
Total capital to risk-weighted assets
12.09
%
11.95
%
14.93
%
15.23
%
16.62
%
12.09
%
16.62
%
Total equity to total assets
14.46
%
14.05
%
14.26
%
14.98
%
15.10
%
14.46
%
15.10
%
Tangible common stockholders' equity to tangible assets(1)
7.87
%
7.53
%
9.86
%
10.33
%
10.50
%
7.87
%
10.50
%
Per Share Amounts:
Book value per share
$
36.79
$
36.56
$
36.25
$
36.16
$
35.95
$
36.79
$
35.95
Tangible book value per share (1)
$
19.70
$
19.31
$
25.32
$
25.13
$
25.22
$
19.70
$
25.22
Basic earnings per common share
$
0.04
$
0.15
$
(0.03)
$
0.13
$
0.19
$
0.16
$
0.42
Diluted earnings per common share
$
0.04
$
0.15
$
(0.03)
$
0.13
$
0.19
$
0.16
$
0.42
Shares outstanding end of period
23,763,401
23,727,046
23,419,740
23,391,411
23,387,522
23,763,401
23,387,522
16
Unaudited consolidated balance sheet as of:
(Dollars in thousands)
September 30, 2025
June 30, 2025
March 31, 2025
December 31, 2024
September 30, 2024
ASSETS
Total cash and cash equivalents
$
147,222
$
282,346
$
502,944
$
330,117
$
489,280
Securities - available for sale
378,088
392,275
411,925
381,561
403,186
Securities - held to maturity, net
1,766
1,782
1,731
1,876
2,121
Equity securities with readily determinable fair value
4,569
4,526
4,512
4,445
4,583
Loans held for sale
9,741
6,066
2,950
1,172
26
Loans held for investment
4,986,922
4,953,170
4,666,223
4,546,960
4,332,967
Allowance for credit losses
(33,549)
(38,691)
(36,229)
(40,714)
(41,243)
Loans, net
4,953,373
4,914,479
4,629,994
4,506,246
4,291,724
FHLB and other restricted stock
14,092
13,339
12,987
14,054
7,112
Premises and equipment, net
141,141
149,120
150,247
160,737
156,462
Capitalized software, net
44,934
43,011
40,869
37,971
34,481
Goodwill
353,898
353,900
241,949
241,949
233,709
Intangible assets, net
52,291
55,265
13,963
16,259
17,316
Bank-owned life insurance
64,338
63,787
63,200
62,690
42,381
Deferred tax asset, net
—
3,023
11,868
13,581
10,667
Other assets
191,696
211,829
179,255
176,317
172,998
Total assets
$
6,357,149
$
6,494,748
$
6,268,394
$
5,948,975
$
5,866,046
LIABILITIES
Noninterest bearing deposits
$
2,095,017
$
2,285,327
$
2,260,048
$
1,964,457
$
2,103,092
Interest bearing deposits
2,860,229
2,900,771
2,716,702
2,856,363
2,603,602
Total deposits
4,955,246
5,186,098
4,976,750
4,820,820
4,706,694
Federal Home Loan Bank advances
280,000
180,000
205,000
30,000
30,000
Subordinated notes
69,829
69,780
69,732
69,662
109,072
Junior subordinated debentures
42,829
42,666
42,507
42,352
42,196
Deferred tax liabilities, net
687
—
—
—
—
Other liabilities
89,225
103,822
80,478
95,222
92,320
Total liabilities
5,437,816
5,582,366
5,374,467
5,058,056
4,980,282
EQUITY
Preferred Stock
45,000
45,000
45,000
45,000
45,000
Common stock
295
295
292
291
291
Additional paid-in-capital
593,624
588,302
572,143
567,884
564,464
Treasury stock, at cost
(270,619)
(270,619)
(268,520)
(268,356)
(268,352)
Retained earnings
552,956
552,049
548,431
549,215
546,179
Accumulated other comprehensive income (loss)
(1,923)
(2,645)
(3,419)
(3,115)
(1,818)
Total stockholders' equity
919,333
912,382
893,927
890,919
885,764
Total liabilities and equity
$
6,357,149
$
6,494,748
$
6,268,394
$
5,948,975
$
5,866,046
17
Unaudited consolidated statement of income:
For the Three Months Ended
For the Nine Months Ended
(Dollars in thousands)
September 30, 2025
June 30, 2025
March 31, 2025
December 31, 2024
September 30, 2024
September 30, 2025
September 30, 2024
Interest income:
Loans, including fees
$
56,400
$
54,836
$
53,576
$
52,493
$
52,886
$
164,812
$
161,338
Factored receivables, including fees
43,841
44,217
38,694
41,351
40,598
126,752
118,535
Securities
5,489
5,721
5,308
6,182
6,500
16,518
17,374
FHLB and other restricted stock
223
246
249
153
379
718
845
Cash deposits
2,987
4,181
4,443
5,299
7,712
11,611
18,945
Total interest income
108,940
109,201
102,270
105,478
108,075
320,411
317,037
Interest expense:
Deposits
17,532
15,505
14,397
14,522
14,041
47,434
41,713
Subordinated notes
661
661
682
1,024
1,227
2,004
3,676
Junior subordinated debentures
1,049
1,035
994
1,129
1,172
3,078
3,518
Other borrowings
1,865
3,322
1,814
996
2,936
7,001
5,481
Total interest expense
21,107
20,523
17,887
17,671
19,376
59,517
54,388
Net interest income
87,833
88,678
84,383
87,807
88,699
260,894
262,649
Credit loss expense (benefit)
4,284
(702)
1,330
4,453
4,263
4,912
14,314
Net interest income after credit loss expense (benefit)
83,549
89,380
83,053
83,354
84,436
255,982
248,335
Noninterest income:
Service charges on deposits
1,847
1,742
1,596
1,682
1,865
5,185
5,402
Card income
1,968
1,922
1,797
1,948
2,135
5,687
6,088
Net gains (losses) on sale of securities
—
—
—
(1)
—
—
—
Net gains (losses) on sale of loans
119
190
134
(6)
253
443
184
Fee income
14,305
12,755
9,114
9,048
9,129
36,174
26,329
Insurance commissions
1,481
1,282
1,250
1,338
1,472
4,013
4,545
Other
1,728
1,493
3,299
1,742
2,643
6,520
7,115
Total noninterest income
21,448
19,384
17,190
15,751
17,497
58,022
49,663
Noninterest expense:
Salaries and employee benefits
60,192
59,882
58,718
53,943
55,447
178,792
165,637
Occupancy, furniture and equipment
7,862
8,139
8,442
8,112
8,701
24,443
24,902
FDIC insurance and other regulatory assessments
1,468
894
727
744
679
3,089
1,973
Professional fees
5,228
(320)
6,064
5,006
4,734
10,972
12,833
Amortization of intangible assets
2,956
3,400
2,400
2,799
3,600
8,756
9,193
Advertising and promotion
2,209
1,838
1,464
1,545
1,416
5,511
4,638
Communications and technology
12,295
12,315
12,244
12,299
12,422
36,854
38,623
Software amortization
2,868
2,865
1,992
1,831
1,484
7,725
4,015
Travel and entertainment
1,043
1,619
1,492
975
1,431
4,154
4,453
Other
7,593
10,208
6,630
6,021
5,732
24,431
17,093
Total noninterest expense
103,714
100,840
100,173
93,275
95,646
304,727
283,360
Net income before income tax
1,283
7,924
70
5,830
6,287
9,277
14,638
Income tax expense
(425)
3,504
53
1,992
940
3,132
2,386
Net income
$
1,708
$
4,420
$
17
$
3,838
$
5,347
$
6,145
$
12,252
Dividends on preferred stock
(801)
(802)
(801)
(802)
(801)
(2,404)
(2,404)
Net income available to common stockholders
$
907
$
3,618
$
(784)
$
3,036
$
4,546
$
3,741
$
9,848
18
Earnings per share:
For the Three Months Ended
For the Nine Months Ended
(Dollars in thousands)
September 30, 2025
June 30, 2025
March 31, 2025
December 31, 2024
September 30, 2024
September 30, 2025
September 30, 2024
Basic
Net income (loss) to common stockholders
$
907
$
3,618
$
(784)
$
3,036
$
4,546
$
3,741
$
9,848
Weighted average common shares outstanding
23,752,331
23,590,119
23,362,400
23,339,651
23,330,635
23,569,712
23,268,887
Basic earnings (loss) per common share
$
0.04
$
0.15
$
(0.03)
$
0.13
$
0.19
$
0.16
$
0.42
Diluted
Net income (loss) to common stockholders - diluted
$
907
$
3,618
$
(784)
$
3,036
$
4,546
$
3,741
$
9,848
Weighted average common shares outstanding
23,752,331
23,590,119
23,362,400
23,339,651
23,330,635
23,569,712
23,268,887
Dilutive effects of:
Assumed exercises of stock options
59,389
54,952
—
106,713
95,472
65,104
89,349
Restricted stock awards
—
16,097
—
43,875
40,259
20,410
67,805
Restricted stock units
90,675
89,156
—
153,326
130,331
115,441
129,047
Performance stock units - market based
18,812
17,704
—
223,173
128,157
20,699
117,101
Employee stock purchase plan
3,651
4,627
—
2,711
470
4,083
1,774
Weighted average shares outstanding - diluted
23,924,858
23,772,655
23,362,400
23,869,449
23,725,324
23,795,449
23,673,963
Diluted earnings (loss) per common share
$
0.04
$
0.15
$
(0.03)
$
0.13
$
0.19
$
0.16
$
0.42
Shares that were not considered in computing diluted earnings per common share because they were antidilutive or have not met the thresholds to be considered in the dilutive calculation are as follows:
For the Three Months Ended
For the Nine Months Ended
September 30, 2025
June 30, 2025
March 31, 2025
December 31, 2024
September 30, 2024
September 30, 2025
September 30, 2024
Stock options
181,647
199,859
253,629
43,582
64,315
141,531
43,389
Restricted stock awards
—
—
48,076
—
—
—
—
Restricted stock units
—
5,171
203,812
—
7,500
3,750
7,818
Performance stock units - market based
77,074
56,311
82,020
23,476
—
42,846
24,798
Employee stock purchase plan
—
—
—
—
—
—
—
19
Loans held for investment summarized as of:
(Dollars in thousands)
September 30, 2025
June 30, 2025
March 31, 2025
December 31, 2024
September 30, 2024
Commercial real estate
$
769,314
$
754,509
$
811,244
$
777,689
$
762,343
Construction, land development, land
204,247
221,419
204,021
203,804
217,148
1-4 family residential properties
180,970
172,312
159,105
154,020
126,103
Farmland
43,208
44,069
47,311
56,366
57,621
Commercial
1,144,872
1,132,269
1,121,740
1,119,245
1,093,477
Factored receivables
1,424,631
1,401,377
1,350,656
1,204,510
1,201,495
Consumer
17,235
17,520
7,088
8,000
6,990
Mortgage warehouse
1,202,445
1,209,695
965,058
1,023,326
867,790
Total loans
$
4,986,922
$
4,953,170
$
4,666,223
$
4,546,960
$
4,332,967
Our banking loan portfolio consists of traditional community bank loans as well as commercial finance product lines focused on businesses that require specialized financial solutions and national lending product lines that further diversify our lending operations.
Banking loans held for investment are further summarized below:
(Dollars in thousands)
September 30, 2025
June 30, 2025
March 31, 2025
December 31, 2024
September 30, 2024
Commercial real estate
$
769,314
$
754,509
$
811,244
$
777,689
$
762,343
Construction, land development, land
204,247
221,419
204,021
203,804
217,148
1-4 family residential
180,970
172,312
159,105
154,020
126,103
Farmland
43,208
44,069
47,311
56,366
57,621
Commercial - General
285,571
298,653
274,697
285,469
284,989
Commercial - Agriculture
49,742
48,107
49,529
49,365
52,997
Commercial - Equipment
564,984
543,062
529,359
511,855
488,326
Commercial - Asset-based lending
198,809
192,793
214,000
205,353
205,476
Commercial - Liquid Credit
42,593
47,061
53,075
65,053
59,539
Consumer
17,235
17,520
7,088
8,000
6,990
Mortgage Warehouse
1,202,445
1,209,695
965,058
1,023,326
867,790
Total banking loans held for investment
$
3,559,118
$
3,549,200
$
3,314,487
$
3,340,300
$
3,129,322
The following table presents the Company’s operating segments:
20
(Dollars in thousands)
Total
Corporate
Three Months Ended September 30, 2025
Banking
Factoring
Payments
Intelligence
Segments
and Other(1)
Consolidated
Total interest income
$
64,931
$
37,157
$
6,769
$
—
$
108,857
$
83
$
108,940
Intersegment interest allocations
6,657
(9,600)
2,943
—
—
—
—
Total interest expense
19,391
6
—
—
19,397
1,710
21,107
Net interest income (expense)
52,197
27,551
9,712
—
89,460
(1,627)
87,833
Credit loss expense (benefit)
1,973
2,302
9
—
4,284
—
4,284
Net interest income after credit loss expense
50,224
25,249
9,703
—
85,176
(1,627)
83,549
Noninterest income
8,364
1,585
8,462
2,338
20,749
699
21,448
Noninterest expense:
Salaries and employee benefits
15,349
13,674
8,769
3,767
41,559
18,633
60,192
Depreciation
1,603
449
203
15
2,270
1,431
3,701
Other occupancy, furniture and equipment
2,134
525
152
17
2,828
1,333
4,161
FDIC insurance and other regulatory assessments
1,468
—
—
—
1,468
—
1,468
Professional fees
1,194
45
248
131
1,618
3,610
5,228
Amortization of intangible assets
385
193
904
1,360
2,842
114
2,956
Advertising and promotion
416
186
1,221
56
1,879
330
2,209
Communications and technology
4,541
2,251
2,713
381
9,886
2,409
12,295
Software amortization
—
952
1,550
12
2,514
354
2,868
Travel and entertainment
188
108
179
127
602
441
1,043
Other
4,393
702
1,155
70
6,320
1,273
7,593
Total noninterest expense
31,671
19,085
17,094
5,936
73,786
29,928
103,714
Net intersegment noninterest income (expense)(2)
158
463
(621)
—
—
—
—
Operating income (loss)
$
27,075
$
8,212
$
450
$
(3,598)
$
32,139
$
(30,856)
$
1,283
21
(Dollars in thousands)
Total
Corporate
Three Months Ended June 30, 2025
Banking
Factoring
Payments
Intelligence
Segments
and Other(1)
Consolidated
Total interest income
$
64,851
$
38,040
$
6,230
$
—
$
109,121
$
80
$
109,201
Intersegment interest allocations
6,386
(9,282)
2,896
—
—
—
—
Total interest expense
18,825
2
—
—
18,827
1,696
20,523
Net interest income (expense)
52,412
28,756
9,126
—
90,294
(1,616)
88,678
Credit loss expense (benefit)
2,219
(2,916)
92
—
(605)
(97)
(702)
Net interest income after credit loss expense
50,193
31,672
9,034
—
90,899
(1,519)
89,380
Noninterest income
7,989
1,811
7,724
1,724
19,248
136
19,384
Noninterest expense:
Salaries and employee benefits
16,001
13,444
8,711
3,234
41,390
18,492
59,882
Depreciation
1,656
468
222
7
2,353
1,602
3,955
Other occupancy, furniture and equipment
1,896
508
163
14
2,581
1,603
4,184
FDIC insurance and other regulatory assessments
894
—
—
—
894
—
894
Professional fees
1,801
(7,272)
240
2,995
(2,236)
1,916
(320)
Amortization of intangible assets
385
193
1,418
946
2,942
458
3,400
Advertising and promotion
557
223
669
22
1,471
367
1,838
Communications and technology
5,257
2,438
2,455
278
10,428
1,887
12,315
Software amortization
—
1,125
1,413
—
2,538
327
2,865
Travel and entertainment
306
245
456
130
1,137
482
1,619
Other
3,210
2,770
1,097
84
7,161
3,047
10,208
Total noninterest expense
31,963
14,142
16,844
7,710
70,659
30,181
100,840
Intersegment noninterest income (expense)(2)
155
413
(568)
—
—
—
—
Operating income (loss)
$
26,374
$
19,754
$
(654)
$
(5,986)
$
39,488
$
(31,564)
$
7,924
(1) Includes revenue and expense from the Company’s holding company, which does not meet the definition of an operating segment. Also includes corporate shared service costs such as the majority of salaries and benefits expense for our executive leadership team, as well as other selling, general, and administrative shared services costs including human resources, accounting, finance, risk management and a significant amount of information technology expense.
(2) Intersegment noninterest income (expense) includes:
(Dollars in thousands)
Banking
Factoring
Payments
Three Months Ended September 30, 2025
Factoring revenue received from Payments
$
—
$
911
$
(911)
Payments revenue received from Factoring
—
(329)
329
Banking revenue received from Payments and Factoring
158
(119)
(39)
Intersegment noninterest income (expense)
$
158
$
463
$
(621)
Three Months Ended June 30, 2025
Factoring revenue received from Payments
$
—
$
910
$
(910)
Payments revenue received from Factoring
—
(381)
381
Banking revenue received from Payments and Factoring
155
(116)
(39)
Intersegment noninterest income (expense)
$
155
$
413
$
(568)
22
Information pertaining to our Factoring segment, summarized as of and for the quarters ended:
(1)Operating margin is a non-GAAP financial measure used as a supplemental measure to evaluate the performance of our Factoring segment. For the three months ended June 30, 2025, operating income and factoring total revenue were impacted by $1.2 million of interest and fees resulting from the USPS Settlement and such settlement further impacted operating income by $7.4 million of legal expense accrual reversal and $3.8 million of recovery of factoring balances charged-off in a prior period. Operating income was also impacted by a $2.0 million legal settlement that was unrelated to the USPS Settlement. Such items had a 24.71% impact on operating margin, a 0.43% impact on yield on average receivables, and a 0.46% impact on yield on average net funds employed for the three months ended June 30, 2025.
(2)The current quarter charge-off rate for the three months ended June 30, 2025 reflects a $3.8 million recovery of factoring balances charged off in a prior period. Such recovery impacted the current quarter charge-off rate for that period by (0.33%).
23
Information pertaining to our Payments segment, summarized as of and for the quarters ended:
Payments
September 30, 2025
June 30, 2025
March 31, 2025
December 31, 2024
September 30, 2024
Supply chain financing factored receivables
$
157,662,000
$
152,054,000
$
122,583,000
$
107,300,000
$
101,336,000
Quickpay and other factored receivables
73,120,000
74,493,000
81,644,000
64,368,000
68,526,000
Total factored receivable period end balance
$
230,782,000
$
226,547,000
$
204,227,000
$
171,668,000
$
169,862,000
Total revenue
Supply chain finance interest income
$
3,895,000
$
3,412,000
$
2,695,000
$
2,789,000
$
2,897,000
Quickpay interest income
2,874,000
2,818,000
2,668,000
2,808,000
2,796,000
Intersegment interest income allocation
2,943,000
2,896,000
2,918,000
2,730,000
2,569,000
Total interest income
9,712,000
9,126,000
8,281,000
8,327,000
8,262,000
Broker noninterest income
7,131,000
6,443,000
5,178,000
5,082,000
4,804,000
Factor noninterest income
933,000
993,000
1,233,000
1,346,000
1,339,000
Other noninterest income
398,000
288,000
120,000
(80,000)
179,000
Intersegment noninterest income
329,000
381,000
372,000
356,000
289,000
Total noninterest income
8,791,000
8,105,000
6,903,000
6,704,000
6,611,000
$
18,503,000
$
17,231,000
$
15,184,000
$
15,031,000
$
14,873,000
Total expense
Credit loss expense (benefit)
$
9,000
$
92,000
$
118,000
$
2,000
$
(5,000)
Noninterest expense
17,094,000
16,844,000
17,113,000
15,820,000
16,598,000
Intersegment noninterest expense
950,000
949,000
944,000
895,000
893,000
$
18,053,000
$
17,885,000
$
18,175,000
$
16,717,000
$
17,486,000
Pre-tax operating income (loss)
$
450,000
$
(654,000)
$
(2,991,000)
$
(1,686,000)
$
(2,613,000)
Depreciation expense
203,000
222,000
230,000
243,000
253,000
Software amortization expense
1,550,000
1,413,000
1,196,000
1,049,000
743,000
Intangible amortization expense
904,000
1,418,000
1,551,000
1,687,000
1,687,000
Earnings (losses) before interest, taxes, depreciation, and amortization(1)
$
3,107,000
$
2,399,000
$
(14,000)
$
1,293,000
$
70,000
EBITDA Margin(1)
16.8
%
13.9
%
(0.1)
%
8.6
%
0.5
%
Number of invoices processed
8,826,848
8,500,565
7,182,044
6,788,408
6,278,246
Amount of payments processed
$
10,662,418,000
$
10,081,206,000
$
8,777,825,000
$
7,625,735,000
$
7,091,493,000
Network invoice volume
1,057,606
1,004,603
719,531
567,258
661,628
Network payment volume
$
1,696,817,000
$
1,579,662,000
$
1,167,464,000
$
922,927,000
$
1,063,228,000
(1)Earnings (losses) before interest, taxes, depreciation, and amortization ("EBITDA") and EBITDA margin are non-GAAP financial measures used as supplemental measures to evaluate the performance of our Payments segment.
24
Information pertaining to our Intelligence segment, summarized as of and for the quarters ended:
Intelligence
September 30, 2025
Revenue
$
2,338,000
Cost of revenue
266,000
Gross profit
2,072,000
Selling, general and administrative costs
5,670,000
Pre-tax operating income (loss)
(3,598,000)
Gross Margin(1)
89
%
*prior periods not meaningful
(1)Gross margin is a non-GAAP financial measure used as supplemental measure to evaluate the performance of our Intelligence segment. Cost of revenues is comprised primarily of salaries and benefits and communications and technology costs for employees providing services to the Company's customers. This includes the costs of the Company's personnel performing integration, customer support, third-party data center and customer training activities. Cost of revenues also includes the direct costs of third party hosting services as well as costs related to bad debt expense. We have elected to exclude amortization expense of capitalized developed software and acquired technology, as well as allocations of fixed asset depreciation expense and occupancy expenses from cost of revenues.
25
Deposits summarized as of:
(Dollars in thousands)
September 30, 2025
June 30, 2025
March 31, 2025
December 31, 2024
September 30, 2024
Non-interest bearing demand
$
2,095,017
$
2,285,327
$
2,260,048
$
1,964,457
$
2,103,092
Interest bearing demand
668,576
694,005
731,477
697,949
700,928
Individual retirement accounts
39,133
40,888
42,344
43,937
46,096
Money market
580,748
565,781
610,120
629,610
606,321
Savings
522,469
517,474
525,133
515,545
533,553
Certificates of deposit
228,415
230,179
231,076
232,232
242,093
Brokered time deposits
705,772
701,059
576,552
490,650
474,611
Other brokered deposits
115,116
151,385
—
246,440
—
Total deposits
$
4,955,246
$
5,186,098
$
4,976,750
$
4,820,820
$
4,706,694
26
Net interest margin summarized for the three months ended:
September 30, 2025
June 30, 2025
(Dollars in thousands)
Average Balance
Interest
Average
Rate(4)
Average Balance
Interest
Average
Rate(4)
Interest earning assets:
Interest earning cash balances
$
268,704
$
2,987
4.41
%
$
377,775
$
4,181
4.44
%
Taxable securities
388,181
5,473
5.59
%
409,277
5,705
5.59
%
Tax-exempt securities
2,511
16
2.53
%
2,535
16
2.53
%
FHLB and other restricted stock
13,176
223
6.71
%
17,687
246
5.58
%
Loans(1)
4,864,878
100,241
8.17
%
4,725,240
99,053
8.41
%
Total interest earning assets
$
5,537,450
$
108,940
7.81
%
$
5,532,514
$
109,201
7.92
%
Non-interest earning assets:
Other assets
887,821
834,470
Total assets
$
6,425,271
$
6,366,984
Interest bearing liabilities:
Deposits:
Interest bearing demand
$
689,220
$
856
0.49
%
$
722,653
$
916
0.51
%
Individual retirement accounts
40,176
125
1.23
%
41,694
131
1.26
%
Money market
584,459
3,989
2.71
%
586,420
3,931
2.69
%
Savings
518,854
1,480
1.13
%
519,067
1,354
1.05
%
Certificates of deposit
228,802
1,497
2.60
%
225,333
1,520
2.71
%
Brokered time deposits
744,436
8,017
4.27
%
614,168
6,618
4.32
%
Other brokered deposits
142,814
1,568
4.36
%
93,315
1,035
4.45
%
Total interest bearing deposits
2,948,761
17,532
2.36
%
2,802,650
15,505
2.22
%
Federal Home Loan Bank advances
166,141
1,865
4.45
%
298,132
3,322
4.47
%
Subordinated notes
69,797
661
3.76
%
69,749
661
3.80
%
Junior subordinated debentures
42,729
1,049
9.74
%
42,587
1,035
9.75
%
Other borrowings
—
—
—
%
—
—
—
%
Total interest bearing liabilities
$
3,227,428
$
21,107
2.59
%
$
3,213,118
$
20,523
2.56
%
Noninterest bearing liabilities and equity:
Non-interest bearing demand deposits
2,188,828
2,166,628
Other liabilities
83,556
77,036
Total equity
925,459
910,202
Total liabilities and equity
$
6,425,271
$
6,366,984
Net interest income
$
87,833
$
88,678
Interest spread(2)
5.22
%
5.36
%
Net interest margin(3)
6.29
%
6.43
%
(1) Loan balance totals include respective nonaccrual assets.
(2) Net interest spread is the yield on average interest earning assets less the rate on interest bearing liabilities.
(3) Net interest margin is the ratio of net interest income to average interest earning assets.
(4) Average rates have been annualized.
27
Additional information pertaining to our loan portfolio, including loans held for investment and loans held for sale, summarized for the quarters ended:
(Dollars in thousands)
September 30, 2025
June 30, 2025
March 31, 2025
December 31, 2024
September 30, 2024
Average Banking loans
$
3,484,400
$
3,381,919
$
3,237,692
$
3,163,999
$
3,008,767
Average Factoring receivables
1,167,092
1,138,792
1,060,482
1,064,772
1,023,570
Average Payments receivables
213,386
204,529
173,536
175,218
167,969
Average total loans
$
4,864,878
$
4,725,240
$
4,471,710
$
4,403,989
$
4,200,306
Banking yield
6.41
%
6.50
%
6.71
%
6.60
%
6.99
%
Factoring yield
12.63
%
13.40
%
12.75
%
13.36
%
13.57
%
Payments yield
12.59
%
12.22
%
12.53
%
12.71
%
13.48
%
Total loan yield
8.17
%
8.41
%
8.37
%
8.48
%
8.85
%
Metrics and non-GAAP financial:
As of and for the Three Months Ended
As of and for the Nine Months Ended
(Dollars in thousands, except per share amounts)
September 30, 2025
June 30, 2025
March 31, 2025
December 31, 2024
September 30, 2024
September 30, 2025
September 30, 2024
Average total stockholders' equity
$
925,459
$
910,202
$
902,260
$
898,965
$
888,435
$
912,725
$
882,849
Average preferred stock liquidation preference
(45,000)
(45,000)
(45,000)
(45,000)
(45,000)
(45,000)
(45,000)
Average total common stockholders' equity
880,459
865,202
857,260
853,965
843,435
867,725
837,849
Average goodwill and other intangibles
(408,025)
(347,894)
(257,399)
(253,415)
(253,656)
(338,324)
(255,431)
Average tangible common stockholders' equity
$
472,434
$
517,308
$
599,861
$
600,550
$
589,779
$
529,401
$
582,418
Net income available to common stockholders
$
907
$
3,618
$
(784)
$
3,036
$
4,546
$
3,741
$
9,848
Average tangible common equity
472,434
517,308
599,861
600,550
589,779
529,401
582,418
Return on average tangible common equity
0.76
%
2.81
%
(0.53
%)
2.01
%
3.07
%
0.94
%
2.26
%
Net non-interest expense to average assets ratio:
Noninterest expenses
$
103,714
$
100,840
$
100,173
$
93,275
$
95,646
$
304,727
$
283,360
Noninterest income
$
21,448
$
19,384
$
17,190
$
15,751
$
17,497
$
58,022
$
49,663
Net noninterest expenses
$
82,266
$
81,456
$
82,983
$
77,524
$
78,149
$
246,705
$
233,697
Average total assets
$
6,425,267
$
6,366,984
$
5,994,040
$
5,966,161
$
5,871,903
$
6,263,681
$
5,654,804
Net noninterest expense to average assets ratio
5.08
%
5.13
%
5.61
%
5.17
%
5.29
%
5.27
%
5.52
%
Total stockholders' equity
$
919,333
$
912,382
$
893,927
$
890,919
$
885,764
$
919,333
$
885,764
Preferred stock liquidation preference
(45,000)
(45,000)
(45,000)
(45,000)
(45,000)
(45,000)
(45,000)
Total common stockholders' equity
874,333
867,382
848,927
845,919
840,764
874,333
840,764
Goodwill and other intangibles
(406,189)
(409,165)
(255,912)
(258,208)
(251,025)
(406,189)
(251,025)
Tangible common stockholders' equity
$
468,144
$
458,217
$
593,015
$
587,711
$
589,739
$
468,144
$
589,739
Common shares outstanding
23,763,401
23,727,046
23,419,740
23,391,411
23,387,522
23,763,401
23,387,522
Tangible book value per share
$
19.70
$
19.31
$
25.32
$
25.13
$
25.22
$
19.70
$
25.22
Total assets at end of period
$
6,357,149
$
6,494,748
$
6,268,394
$
5,948,975
$
5,866,046
$
6,357,149
$
5,866,046
Goodwill and other intangibles
(406,189)
(409,165)
(255,912)
(258,208)
(251,025)
(406,189)
(251,025)
Tangible assets at period end
$
5,950,960
$
6,085,583
$
6,012,482
$
5,690,767
$
5,615,021
$
5,950,960
$
5,615,021
Tangible common stockholders' equity ratio
7.87
%
7.53
%
9.86
%
10.33
%
10.50
%
7.87
%
10.50
%
1)Triumph Financial uses certain non-GAAP financial measures to provide meaningful supplemental information regarding Triumph Financial's operational performance and to enhance investors' overall understanding of such financial performance. The non-GAAP measures used by Triumph Financial include the following:
•"Tangible common stockholders' equity" is defined as common stockholders' equity less goodwill and other intangible assets.
28
•"Total tangible assets" is defined as total assets less goodwill and other intangible assets.
•"Tangible book value per share" is defined as tangible common stockholders' equity divided by total common shares outstanding. This measure is important to investors interested in changes from period-to-period in book value per share exclusive of changes in intangible assets.
•"Tangible common stockholders' equity ratio" is defined as the ratio of tangible common stockholders' equity divided by total tangible assets. We believe that this measure is important to many investors in the marketplace who are interested in relative changes from period-to period in common equity and total assets, each exclusive of changes in intangible assets.
•"Return on Average Tangible Common Equity" is defined as net income available to common stockholders divided by average tangible common stockholders' equity.
2)Asset quality ratios exclude loans held for sale, except for non-performing assets to total assets.
3)Current quarter ratios are preliminary.
Source: Triumph Financial, Inc.
###
Investor Relations:
Luke Wyse
Executive Vice President, Head of Investor Relations
lwyse@tfin.com
214-365-6936
Media Contact:
Amanda Tavackoli
Senior Vice President, Director of Corporate Communication