For the first quarter, we recorded net income to common stockholders of $5.6 million, or $0.23 per diluted share. Transportation revenue growth was 0.6% in 1Q 2026 vs. 4Q 2025. Historically, we have experienced a high single digit decline between 4Q and 1Q due to seasonality. We view net revenue growth in this quarter's results as a positive signal that we have only experienced once before in the past decade.
CEO Summary: The Metrics That Matter Most
North Star Metrics
Long-Term Target
Qtr Ending 3/31/26
Transportation Revenue Growth*
> 15%
23.5
%
Factoring Operating Margin
> 40%
34.7
%
Payments EBITDA Margin (ex-LoadPay)
> 50%
34.0
%
Intelligence Gross Margin
> 85%
86.1%
* Growth figures are YoY, all other metrics are as of the quarter end.
This is a new and simple table for investors. We added it because key performance indicators change as we build out the Payments Network and our transactional platform. We used to talk about logos, density, and product roadmap; we now talk about revenue growth and margin. This does not mean we have stopped innovating or pursuing growth — it means we expect those efforts to show up in our numbers. We will continue putting forth the KPIs that we believe are the best signal of achieving long-term value creation. Investors will be able to judge both the merit of our recommended KPIs and our performance against them.
Our North Star. If we achieve our revenue growth and margin targets expressed in the table above, and all other things remain equal (which rarely happens!), we should generate roughly $1.00 of incremental earnings annually. That is where the North Star leads us. The purpose of investing in our Network and platform over the last several years, including through a very long and difficult cycle, was so that we could deliver value to our customers that compounds earnings for our investors.
These metrics will be influenced by factors outside of our control — cyclicality, seasonality, regulation, interest rates, and geopolitics to name a few. We cannot and will not manage the business to short-term fluctuations, whether cyclical or seasonal, but we will report on our progress with a focus on sustained improvement and performance that builds durable value over time.
What are the performance drivers to achieve our North Star? While the targets above define the outcomes, how we manage the business beneath them is equally important. We will continue to report legacy metrics within the letter, but expect that we will emphasize the following.
Factoring – Our target for the year 2026 is to grow revenue in the low teens for this segment and to achieve our long-term >40% margin target exiting the year. In addition to these North Star metrics, we will also report on (i) customer growth, (ii) volume growth, and (iii) product attachment ratio ("PAR") for the reasons discussed below.
•Rationale for Margin Target: A 40% operating margin is rare air in commercial finance. To consistently achieve that margin usually requires proprietary data, embedded distribution, and network effects. As such, it deserves a different multiple than traditional finance because it performs more like a transactional platform than a lending business. With that platform comes high margin add-on business opportunities, including FaaS, Intelligence, and LoadPay.
◦To be clear, we report operating margin inclusive of funding costs. Not all operating margins in commercial finance are created or reported equally. If companies report operating income before cost of funds, it inflates apparent margins but obscures the true economics of the transaction. We measure
1
margin in our factoring segment after credit losses and operating expenses, and in a manner that reflects the full cost of delivering the service.
•Customer & Volume Growth: Which is more valuable for long-term value creation — customer growth or volume growth? This is not a simple answer. Both are valuable for different reasons. I can say with certainty that 500 owner/operator ("O/O") clients contribute more to our margin than a single customer with a fleet of 500 trucks. This discussion may sound familiar to pre-pandemic shareholders, as we moved away from reporting customer counts years ago as scale and mix dynamics made that measure less useful at predicting revenue in the segment. Times change, and our investments in technology have materially changed our cost of service and customer acquisition for O/Os and smaller fleets. We also offer products and services beyond working capital and smaller fleets are more likely to consume the entire bundle. If we can help smaller fleets thrive, our revenue scales with the economic value of each transaction more than just truck counts. As a result, we now think customer growth is a key indicator of long-term value creation that should be reported alongside of volume growth.
•PAR: Because multiple product attachment by our carriers is key to broadening the economic value of the carrier relationship, and because it often extends the duration of the carrier relationship, we are including PAR as a measure of our effectiveness at cross-selling. PAR examines our carrier customer universe against the three main Triumph factoring products: Factoring, LoadPay, and Fuel Cards, and will be expressed as a number out of a possible three.
Core Payments – Our target for the year is to grow revenue by 20% for this segment and, ex-LoadPay, achieve a ~40% EBITDA margin target exiting 2026. In addition to these North Star metrics, we will also report (i) PAR and (ii) revenue per invoice for the reasons discussed below.
•Rationale for Margin Target: A 50% EBITDA margin in our core Payments offering is a very strong midpoint for this business. While it does not reach the margin performance of the card networks, we believe it is positioned at the top end of other scaled payments platforms. When we add the current YoY revenue growth for core Payments (23.1%) plus the current EBITDA margin ex-LoadPay investments (34.0%), the sum approaches a “Rule of 60” business.[1] A business approaching the Rule of 60 reflects both growth and profitability, signaling a model capable of generating durable and compounding shareholder returns.
◦We break out LoadPay from our overall Payments segment so investors can see returns both inclusive and exclusive of the investments associated with LoadPay. Over the long run, we expect LoadPay, which is in its early stages, to be accretive to Payments margins.
•PAR: Our Payments products generate audit and payment fee revenue as well as quickpay and embedded working capital finance revenue. When customers adopt multiple products and use our banking payment rails, the margins are better, and it creates network effects that Payments or Audit alone do not. PAR examines our customer universe against the three main Triumph broker products: Payments, Audit, and Intelligence, and will be expressed as a number out of a possible three. When a broker adds Payments alongside Audit, or Intelligence services to either, we are not just adding new revenue — we are deepening the relationship and strengthening the network effects for every other participant. That is the compounding dynamic which segment economics alone do not reveal.
•Revenue per Invoice: Another important value driver is our ability to monetize the invoice in multiple ways for our broker customers, even across segments, as we add value through each touch. As such, the best way to track our progress is by the revenue generated per broker invoice, which we define as the revenue generated by our Payments, Audit, and Intelligence services to brokers divided by the number of unique invoices associated with those revenues. This metric captures our new business development, cross-sell success, and repricing efforts without getting lost in the details of a dozen other metrics to determine progress. Coupling this metric with our focus on growing both EBITDA margin and earnings contribution, ensures new revenue is created efficiently.
LoadPay - Our target for the year is to grow accounts by over 120% and revenue by 150% exiting 2026. In addition to these metrics, we will also report (i) revenue per account and (ii) revenue per active carrier account for the reasons discussed below.
2
•Rationale for 2026 Targets: LoadPay operates inside our Payments segment as an early-stage venture. To this point, we have focused on growth in customer accounts and the revenue per linked and funded account. We continue to believe this is the best measure of future value, but that these accounts are better described as "active carrier accounts." A LoadPay active carrier account is defined as one that is linked to Triumph Factoring or Payments and has been funded through the Triumph Network. Though LoadPay is only a little over one year old, those two metrics have been helpful in determining progress through the initial product rollout.
•Revenue per Account/Active Carrier Account: We believe these two metrics are effective in tracking our progress. These metrics require reporting total account growth as well as active carrier account growth allowing visibility into our success in converting carriers between these two cohorts. The revenue per active carrier account should be a better reflection of the long-term opportunity than revenue per account as customer behavior changes through using LoadPay as a primary operating account. To be frank, we are all still learning about the revenue opportunity inside of LoadPay as we roll out features and test things that have not yet been done by a financial institution at scale within the trucking industry. The uncertainty is what adds excitement to the opportunity — we are not afraid to do new things, and our new things are directed at very large markets. In sum, these metrics will communicate to investors how we are scaling the product, the value of attached services to the carrier, and how these unit economics are accretive to our Payments segment EBITDA margin target of > 50%.
Intelligence - Our target for the year is to grow revenue materially for this segment and maintain a > 85% gross margin target exiting 2026. In addition to this North Star metric, we will also report (i) annual recurring revenue ("ARR"), (ii) net revenue retention ("NRR"), and (iii) EBITDA margin for the reasons discussed below.
•Rationale for Gross Margin Target: A gross margin in our Intelligence segment that exceeds 85% positions it alongside the best data businesses for this metric. It is not normal for an early-stage data product to achieve this metric; however, because our Intelligence segment is connected to our Network, we have been able to do so. A gross margin at > 85% reflects high incremental margins, a low marginal cost to serve, and differentiated data.
•Revenue Growth: We have spent a year incorporating the technology we purchased from Greenscreens into our technology stack. This has been a time-consuming process. It is worth noting here the reinforcing value chain discussed in prior shareholder letters, where client growth in other segments enriches the Network data fueling Intelligence, creating a reinforcing loop which increases product value for the same customers. While Intelligence is a great product to help win and retain business, it must also stand on its own and generate material growth in revenue off of its current base.
•ARR, NRR, and EBITDA Margin: Given the high gross margins, lower seasonality, and scalable nature of the Intelligence platform, success in this segment can be measured simply: are we growing ARR as we maintain gross margin? If the answer to the first question is yes, then the top of the funnel is working well. We then ask how we are doing at delivering value to existing customers, which is where the NRR metric becomes relevant. To do all of this well requires a productized delivery model where incremental costs scale materially slower than revenue. As such, we must maintain discipline around product standardization, compute efficiency, and support scalability to preserve high incremental margins. Monitoring gross margins and, to a lesser extent at this stage of the product’s lifecycle, EBITDA margin will ensure that new revenue is added efficiently as we scale.
In summary, these metrics give investors the clearest picture of what we believe matter most. We will continue to answer questions about legacy metrics or topics of investor interest, but if an investor wants to understand how to model Triumph and how we are driving future value creation, I suggest focusing on these things.
Payments
1.Analysis of Financial and Operational Performance for the Quarter
2.Revenue Drivers and Growth Forecast
3.LoadPay Update
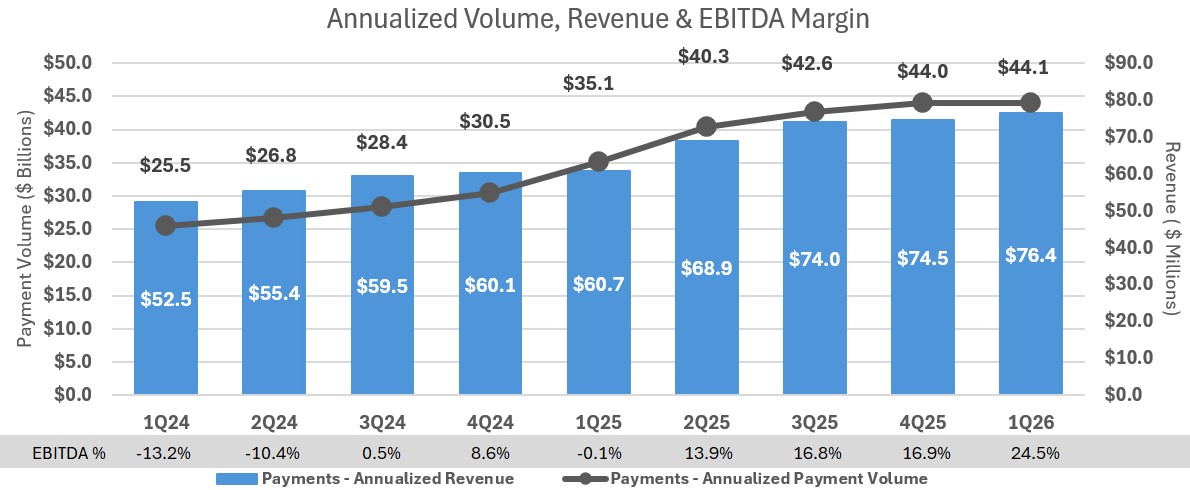
Analysis of Financial and Operational Performance for the Quarter. Revenue grew 2.6% QoQ despite a seasonal decline in invoice volumes of 9.2%. Fee and financing revenue grew 6.0% and 3.3%, respectively, partially offset by lower float revenue, which is correlated to the interest rate environment. Total revenue grew 25.8% YoY to $76.4 million, annualized. EBITDA margin for the quarter improved to 24.5%, up from (0.1)% in 1Q 2025. Ex-LoadPay, EBITDA margin for the quarter was 34.0%, up from 29.5% in 4Q 2025. Pretax operating income was $1.9 million.
3
March 31, 2026
December 31, 2025
September 30, 2025
June 30, 2025
March 31, 2025
Current Quarter Q/Q
Current Year Y/Y
For the Qtr Ending
Change
% Change
Change
% Change
Payments:
Invoice Volume
8,220,371
9,053,274
8,826,848
8,500,565
7,182,044
(832,903)
(9.2)
%
1,038,327
14.5
%
Payment Volume
$
11,014,040,000
$
10,995,478,000
$
10,662,418,000
$
10,081,206,000
$
8,777,825,000
$
18,562,000
0.2
%
$
2,236,215,000
25.5
%
Network Engagement[2]
66.1
%
64.2
%
63.4
%
63.3
%
50.4
%
1.9
%
3.0
%
15.7
%
31.2
%
Average Float
$
538,303,000
$
518,182,000
$
484,582,000
$
469,211,000
$
442,901,000
$
20,121,000
3.9
%
$
95,402,000
21.5
%
Fee Revenue
$
9,450,000
$
8,913,000
$
8,791,000
$
8,105,000
$
6,903,000
$
537,000
6.0
%
$
2,547,000
36.9
%
Total Revenue
$
19,104,000
$
18,628,000
$
18,503,000
$
17,231,000
$
15,184,000
$
476,000
2.6
%
$
3,920,000
25.8
%
EBITDA margin
24.5
%
16.9
%
16.8
%
13.9
%
(0.1)
%
7.6
%
45.0
%
24.6
%
(24600.0)
%
EBITDA Margin (ex-LoadPay)
34.0
%
29.5
%
28.2
%
22.7
%
5.9
%
4.5
%
15.3
%
28.1
%
476.3
%
LoadPay:
# of Accounts
8,065
5,892
4,421
2,367
778
2,173
36.9
%
7,287
936.6
%
# of Active Carrier Accounts
3,157
2,487
1,916
968
379
670
26.9
%
2,778
733.0
%
Revenue per Account (Ann.)
$
252.21
$
248.33
$
234.70
$
206.30
$
200.93
$3.88
1.6
%
$51.28
25.5
%
Revenue per Active Carrier Account (Ann.)
$
633.10
$
572.15
$
516.78
$
478.32
$
393.82
$60.95
10.7
%
$239.28
60.8
%
LoadPay Funding
$
118,384,000
$
84,770,000
$
53,042,000
$
22,212,000
$
4,986,000
$
33,614,000
39.7
%
$
113,398,000
2274.3
%
Average Interchange Fees
1.62
%
1.68
%
1.64
%
1.61
%
1.76
%
(0.06)
%
(3.6)
%
(0.1)
%
(5.7)
%
Cross Segment:
Unique Broker Invoice Volume*
9,994,137
10,689,056
10,689,315
10,217,761
9,353,366
(694,919)
(6.5)
%
640,771
6.9
%
Broker Revenue*
$
13,056,000
$
12,436,000
$
12,343,000
$
10,985,000
$
8,241,000
$
620,000
5.0
%
$4,815,000
58.4
%
Broker Revenue Per Invoice
$
1.31
$
1.16
$
1.15
$
1.08
$
0.88
$0.15
12.9
%
$0.43
48.9
%
PAR
1.30
1.33
1.31
1.30
1.24
(0.03)
(2.3)
%
0.06
4.8
%
* Unique Broker Invoice Volume refers to Invoices from our broker Payments and Audit services as well as our Intelligence services to brokers. * Broker Revenue is the revenue generated by our broker Payments and Audit services (Broker Fee Income + Quickpay Interest Income) + broker Intelligence revenue.
For 1Q 2026, the dollar-volume of Payments was flat as the seasonal decline in invoice volume was offset by increasing invoice prices. It is worth highlighting that Payments services are generally charged on a per invoice basis, so invoice counts are a better gauge of revenue growth than Payments volumes.
In the chart below, we graphically highlight the continued revenue growth and its trend over the last eight quarters against the backdrop of our Payment volumes. We have generated a ~21% CAGR in revenue over the last two years despite the continuance of the longest recession in the history of trucking.
4
Revenue Drivers and Growth Forecast. Payments revenue growth is driven by three levers: winning net new relationships, deepening existing ones, and value-based pricing. Repricing was the largest growth driver in the quarter, but we also brought on and ramped up several new relationships while deepening relationships with others through our cross-selling efforts. The second phase of our contractual repricing efforts went into effect on April 1. There will be an additional phase on July 1. By 4Q 2026, we expect over $10 million of incremental annualized revenue from our repricing efforts.
As highlighted above, we are introducing revenue per invoice and our PAR to assist investors in monitoring our progress. Revenue per invoice grew to $1.31, an increase of $0.15 (12.9%) from 4Q 2025. PAR was 1.30. Cross-selling represents significant upside and is a compounding lever to drive continued growth in revenue per invoice.
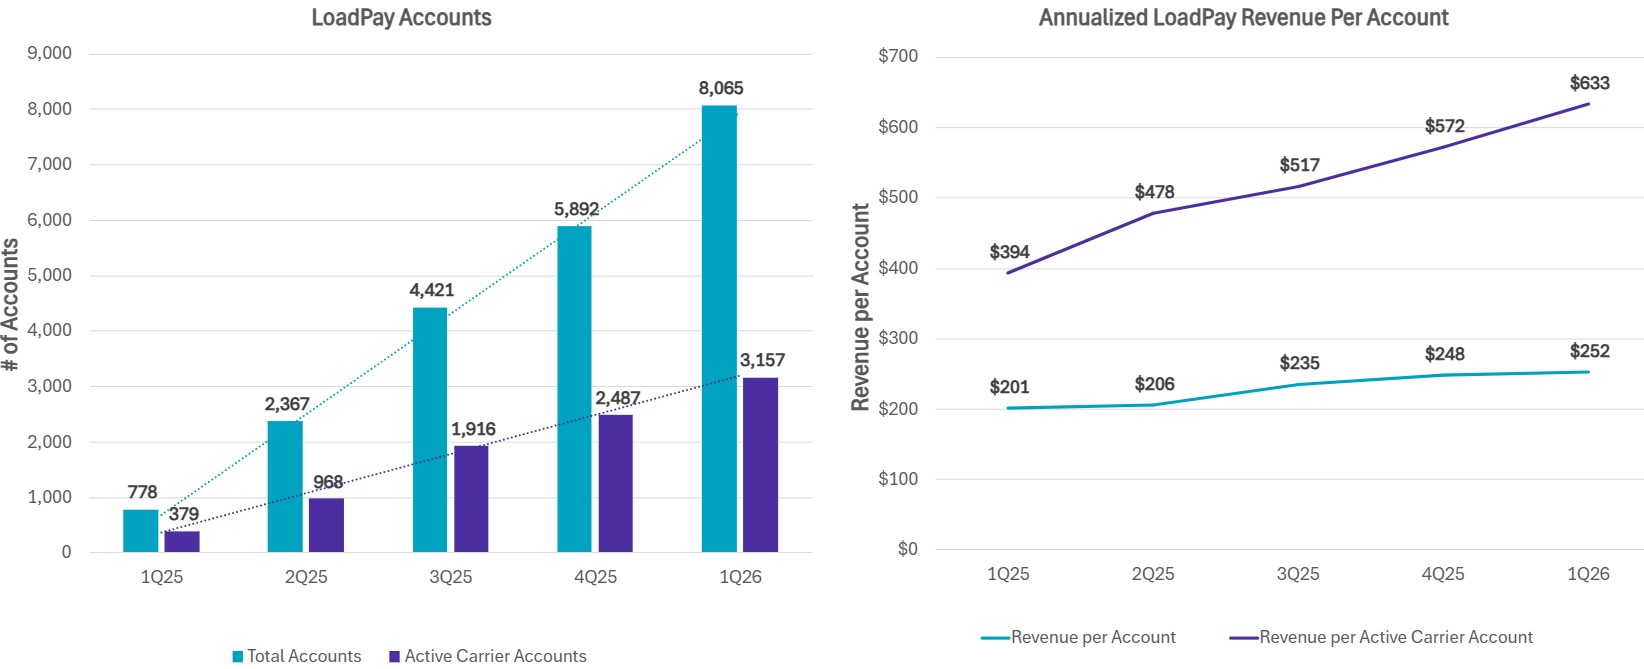
LoadPay Update. LoadPay remains an early-stage product inside our Payments segment. We continue to focus on growth in accounts and the revenue per active carrier account. For the quarter, gross revenue was $437 thousand, revenue per account was $252, and revenue per active carrier account was $633. As a reminder, our target annual revenue for active carrier accounts is $750. That number was an estimate we calculated at the time we introduced LoadPay. I am hopeful that as we introduce more features over time, that estimate proves to be materially below the opportunity threshold. For the quarter, the percentage of accounts active was 39.1% of all accounts, and the total number of accounts was 8,065. In the chart below, we graphically highlight these elements over the last five quarters.
Factoring
1.Analysis of Financial and Operational Performance for the Quarter
2.Automation and AI Update
Analysis of Financial and Operational Performance for the Quarter. The Factoring segment delivered pretax operating income of $14.5 million. Revenue decreased (0.4)% QoQ, and pretax operating margin was 34.7%. Total purchased volume reached $3.3 billion for the quarter, a 4.6% increase over 4Q 2025, and 20.5% over the same quarter in 2025. That is robust growth for a mature business. I am also impressed with how our team outperformed seasonality in the first quarter. Our Payments business, which is a reasonable proxy for the industry, saw a 9.2% decline in invoice volumes in 1Q 2026 due to seasonality. Our Factoring invoice volumes declined 3.5% in the same period, which was ~2/3 less than the Payments decline. This positive variance illustrates our growth in market share.
5
March 31, 2026
December 31, 2025
September 30, 2025
June 30, 2025
March 31, 2025
Current Quarter Q/Q
Current Year Y/Y
For the Qtr Ending
Change
% Change
Change
% Change
Factoring:
Invoice Volume
1,683,160
1,744,811
1,735,860
1,697,851
1,497,644
(61,651)
(3.5)
%
185,516
12.4
%
Purchased Volume
$
3,262,610,000
$
3,119,443,000
$
2,997,895,000
$
2,873,659,000
$
2,707,805,000
$
143,167,000
4.6
%
$
554,805,000
20.5
%
Average Transportation Invoice Size
$
1,897
$
1,751
$
1,690
$
1,663
$
1,769
$
146
8.3
%
$
128
7.2
%
Invoices / Client
226
241
236
232
204
(15)
(6.2)
%
22
10.8
%
Discount Rate
1.28
%
1.28
%
1.29
%
1.37
%
1.31
%
—
%
—
%
(0.03)
%
(2.3)
%
Avg Daily Purchases*
$
53,485,000
$
50,314,000
$
46,842,000
$
45,614,000
$
44,390,000
3,171,000
6.3
%
9,095,000
20.5
%
# of Customers
7,436
7,241
7,355
7,319
7,352
195
2.7
%
84
1.1
%
PAR
1.19
1.17
1.16
1.12
1.09
0.02
1.7
%
0.10
9.2
%
Operating margin
34.72
%
32.61
%
20.71
%
48.46
%
19.24
%
2.11
%
6.5
%
15.48
%
80.5
%
*calculated using number of working days
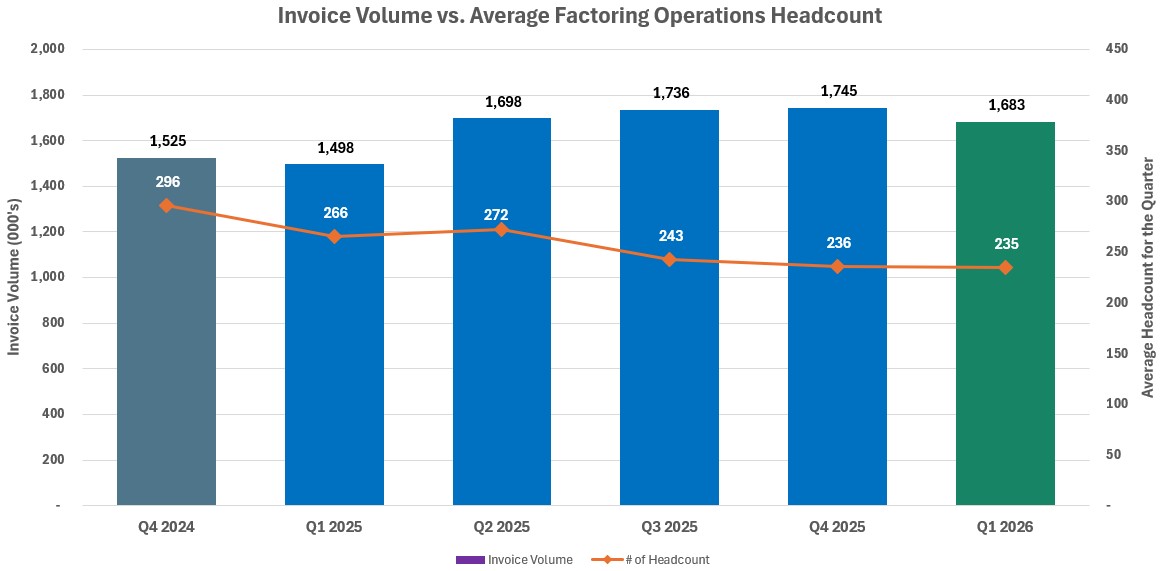
Automation and AI Update. Our instant decision platform continues to drive meaningful operating leverage. During the quarter, we purchased approximately 1.7 million invoices supported by 235 average full‑time employees, representing a 12.4% increase in the number of invoices purchased by 11.4% fewer FTEs compared to the same quarter last year. This improvement reflects the scalability of our operating model and our ability to support higher transaction volumes without proportional increases in headcount. These gains are being reinforced by broader efficiency gains across Factoring. We are simplifying workflows, reducing handoffs, and eliminating non‑value‑added activities which results in measurable improvements in both capacity and operating margin.
In parallel, we are advancing a focused set of AI‑ and LLM‑enabled automation initiatives alongside pragmatic process simplification across decisioning, cash application, and collections. While several initiatives remain in progress, early results are translating into improved throughput and workflow efficiency, supporting continued increases in invoices processed per employee. These efforts are strengthening the scalability of our operating model, enabling us to support growth without proportional cost expansion, with the benefits reflected in our expense outlook. As these initiatives mature, we expect further efficiency gains and sustained margin support as volumes scale.
Last quarter, we introduced a chart comparing client-facing headcount with the number of invoices purchased, highlighting meaningful efficiency gains from our investments. Going forward, as AI and automation extend beyond the back office to encompass the entire factoring operation, we will continue to demonstrate these efficiencies across the business.
6
Intelligence
1.Analysis of Financial and Operational Performance for the Quarter
2.Our Focus in 2026
3.How Triumph Intelligence is Different
Analysis of Financial and Operational Performance for the Quarter. Intelligence revenue was $2.4 million, up 2.1% QoQ, while gross margin was 86%. We continue to expect 2026 revenue in this business to increase materially.
March 31, 2026
December 31, 2025
September 30, 2025
June 30, 2025
March 31, 2025
Current Quarter Q/Q
Current Year Y/Y
For the Qtr Ending
Change
% Change
Change
% Change
Intelligence:
Annual Recurring Revenue (ARR)
$
8,445,963
$
8,297,772
$
8,306,590
$
8,045,118
$
8,003,372
$
148,191
1.8
%
$
442,591
5.5
%
Net Revenue Retention (NRR)
93.4
%
94.1
%
98.8
%
95.2
%
98.0
%
(0.7)
%
(0.7)
%
(4.6)
%
(4.7)
%
EBITDA Margin
(68.7)
%
(42.2)
%
(94.6)
%
n/m
n/m
(26.5)
%
62.8
%
n/m
n/m
Our Focus in 2026. This year, the focus will be on growing PAR through cross-selling and a more robust Intelligence platform that brings together all constituents in the ecosystem with an emphasis on enabling sustainable, strategic relationships through Capacity Intelligence and support for RFP collaboration. We are also adding additional Intelligence tools aimed at enterprise brokers who have already made investments in data science in their own organizations. Capacity Intelligence is a strategic engine inside Triumph Intelligence that helps capacity teams build predictable, profitable, relationship-based carrier networks. It identifies the lanes that matter most, surfaces the right carriers to serve them and guides teams through a simple, repeatable workflow. Capacity Intelligence is not a load board or an exchange, nor is it designed to replace either. Capacity Intelligence solves a different challenge: providing a means for brokers to identify lanes within their networks where optimizing non-transactional freight will result in more stability.
How Triumph Intelligence Is Different. Triumph Intelligence is the only scaled market intelligence provider that delivers a holistic market price, considering performance and capacity, on both the buy and sell side of the broker transaction. We believe our offering is superior to incumbents not only because we have “more features,” but because we have better data, better analytics, and a forward-looking posture. Fully settled real-time transactions are THE best source of truth. This data set allows machine learning to build firm-specific views which create realizable value for customers. As we continue to integrate Intelligence into the Triumph Network, we expect a reinforcing feedback loop: adoption in other segments enriches the data asset, thereby increasing product value for those same customers.
Freight Market Analysis
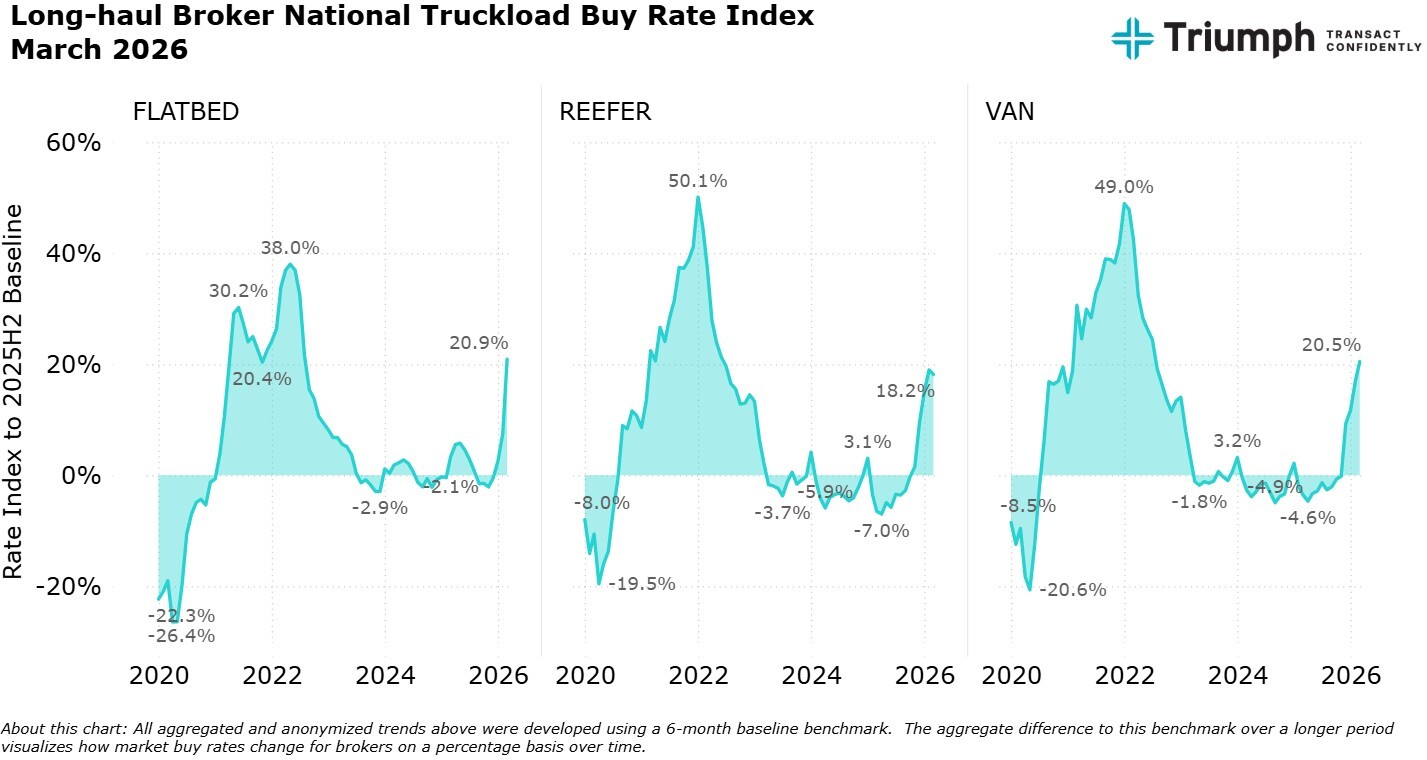
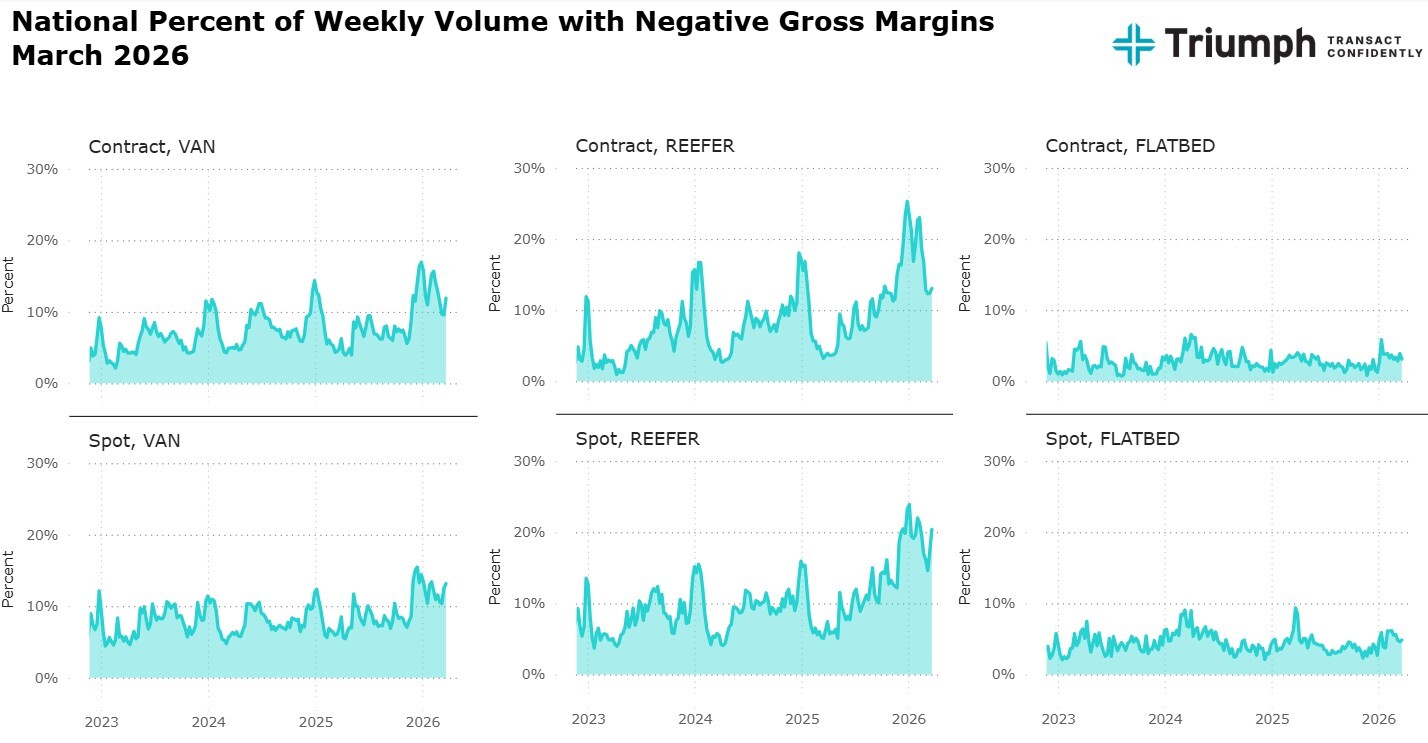
The following observations reflect transaction-backed insights from the Triumph Network, offering a real-time perspective on market dynamics. The first quarter of 2026 exhibited a significant continuation of rate inflation first measured in December 2025 across all transport types driven by fuel prices, improvements in demand, and continued non-domiciled CDL supply-related driver reductions.
The Triumph Network supports five key findings for 1Q 2026:
1.Negative weekly gross margin volume trended above 10% for most weeks across Van and Reefer freight volumes, with four weeks measuring above 20% for Reefer. These figures exceed all prior post-Covid markets. (Chart below: National Percent of Weekly Volume with Negative Margins)
2.Aggregate rate inflation rates over the last four months met or exceeded month-over-month (MoM) inflation rates witnessed during Covid. However, current truckload pricing is consistently within levels experienced in 1Q 2021, which was 12-months shy of peak Covid rate inflation occurring in 1Q 2022. (Chart below: Long-haul Broker National Truckload Buy Rate Index)
3.Flatbed, which is typically affected by lower seasonal demand, showed significant rate inflation in March exceeding all measured MoM rates of inflation of any transport type since pre-Covid at 13.4% MoM. While exact causality is unattainable, data center construction combined with higher fuel prices is a likely driver of this anomalous rate inflation. (Chart below: Long-haul Broker National Truckload Buy Rate Index)
7
4.The Iran conflict has increased fuel rates almost $2 per gallon over 1Q 2026. Carriers will experience an estimated 30-40 cents per mile increase in fuel expense as a result, significantly adding costs to fleets with higher empty miles figures across their networks. Fleets struggling with higher operating ratios will certainly feel more pressure from this key input cost.
5.Industrial and manufacturing-related demand are showing signs of improvement. The ISM PMI Composite Index, a key forward indicator of trucking demand, has maintained expansion level readings for all months in 1Q 2026.
Looking Ahead
Much of what we reported last quarter is still in play — rate inflation, margin compression, and CDL enforcement. Visibility to these issues is growing beyond transportation industry actors. Key rulings from the Supreme Court this summer, as well as continued administrative policy changes from FMCSA/DOT, are the biggest questions the transportation industry faces this year. Any significant changes to the levels of liability or driver certification requirements could recast the trucking industry significantly, adding bottlenecks to fleet expansion or additional administrative requirements across industry actors in an already challenged marketplace.
8
Banking
1.Analysis of Financial and Operational Performance for the Quarter
2.Update on Credit Metrics
3.Portfolio Simplification
Analysis of Financial and Operational Performance for the Quarter. Banking segment operating income decreased $1.0 million to $24.6 million, or 3.9%, from the prior quarter, driven by lower average loan balances as well as lower interest rates. During the quarter, we added roughly $1 billion of new servicing deposits from mortgage warehouse clients. As a result of these deposits, cash balances increased and wholesale funding such as FHLB advances and brokered deposits declined.
Update on Credit Metrics. The metrics reflect credit exposure work tied to some of the business lines we are exiting, as well as normal-course credit noise. We continue to monitor the bankruptcy proceedings related to our Tricolor ABL exposure, and we continue to believe that our loan position is adequately secured by inventory and other assets that serve as our collateral.
•Total non-performing loans to total loans: increased by 0.62% to 1.77% due primarily to one large classified CRE loan that was moved to nonaccrual during the quarter. We completed an appraisal in March that indicates no reserve is warranted at this time.
•Total classified assets: decreased by ~$3.3 million to $184.0 million.
•Past due to total loans: decreased by 0.37% to 2.35% due primarily to improving credit trends in equipment finance and lower past due balances in factoring.
Portfolio Simplification. Our banking team is focused on generating and maintaining a healthy, low-cost funding base through excellent service and competitive products in the communities we serve. Our national lending businesses continue to empower their customers through mortgage warehouse services, temporary and short-term real estate financing, and equipment lending. We continue to expect loan growth in total to be flat for the overall company in 2026 as growth in factored receivables is offset by declines in our ABL and liquid credit portfolios and other strategic opportunities in the Banking segment’s portfolio.
9
AI, Disruption, and Our Approach
We generally think about AI in three categories: functionality, efficiency, and data. We participate in all three. Investors may see the data and product opportunity today; the efficiency benefits should be increasingly visible in 2026.
Our working view is that AI will compress “feature moats” across software, but it does not eliminate moats built on trusted networks, embedded workflows, and proprietary real‑time data. The most useful way to frame this — internally and with investors — is to distinguish between building a tool and operating a two‑sided network that sits inside the core transaction. In that construct, AI may replicate discrete product functionality faster, but it cannot reproduce the combination of network participation on both sides of the freight payment, the trust layer that enables audit and accurate settlement, the fraud‑mitigation guardrails, and the downstream intelligence embedded within those workflows. The defensibility is therefore less about “software we wrote” and more about the ecosystem we operate and the data asset we continuously create: settled, clean, real‑time transactions that can train models and drive actionable intelligence in a high‑confidence environment.
At the operating level, we view AI as both (i) a lever to lower cost‑to‑serve and (ii) an opportunity to redesign workflows from first principles rather than simply “bolting AI on” to existing processes. The strategic winners will be the companies that rebuild processes around AI and use it to do things better and differently — not just faster. We are applying that mindset alongside a lean operating posture that remains customer‑centric and innovation‑forward, while maintaining humility about the range of outcomes and resisting hype-driven narratives. We expect to continue innovating as we execute, with outcomes investors can see in our results, not press releases.
Expense Forecast and Closing Thoughts
We project expenses of $97.0 million for 2Q 2026. We are grateful for the interest investors have shown in Triumph and for the patience many have demonstrated as we invested through the cycle. Our responsibility now is to reward that patience with consistent, high-margin revenue growth and earnings growth. If we do those things, with an eye fixed firmly on the North Star framework — compounding transportation revenue and steadily improving margins — we believe the results will take care of themselves.
With warm regards,
Aaron P. Graft
Founder, Vice Chairman and CEO
[1] The Rule of 40 recognizes that young companies trade profit today for growth tomorrow, while mature companies generate cash even if growth slows. A rule of 40 business is healthy, investable, and speaks to viability. A rule of 60 business is best in class and speaks to quality and durability.
[2] We define Network engagement as the amount of freight touched through our payments, audit, full AP automation and rate intelligence products. It is an indicator of our broker volume density in the market, the source for growing available Network transactions and data assets, and a key value driver of the Network.
10
Conference Call Information
Aaron P. Graft, Vice Chairman and CEO, and Brad Voss, CFO, will review the financial results in a conference call with investors and analysts beginning at 9:30 a.m. central time on Wednesday, April 22, 2026.
The live video conference may be accessed directly through this link, https://triumph-financial-q1-2026-earnings.open-exchange.net/ or via the Company's IR website at ir.triumph.io through the Financial Results link. An archive of this video conference will subsequently be available at the same location, referenced above, on the Company’s website.
About Triumph Financial
Triumph Financial, Inc. (NYSE: TFIN) is a financial and technology company focused on payments, factoring, intelligence and banking to modernize and simplify freight transactions. Headquartered in Dallas, Texas, its portfolio of brands includes Triumph, TBK Bank and LoadPay. ir.triumph.io
Forward-Looking Statements
This letter to shareholders contains forward-looking statements. Any statements about our expectations, beliefs, plans, predictions, forecasts, objectives, assumptions or future events or performance are not historical facts and may be forward-looking. You can identify forward-looking statements by the use of forward-looking terminology such as “believes,” “expects,” “could,” “may,” “will,” “should,” “seeks,” “likely,” “intends,” “plans,” “pro forma,” “projects,” “estimates” or “anticipates” or the negative of these words and phrases or similar words or phrases that are predictions of or indicate future events or trends and that do not relate solely to historical matters. You can also identify forward-looking statements by discussions of strategy, plans or intentions. Forward-looking statements involve numerous risks and uncertainties, and you should not rely on them as predictions of future events. Forward-looking statements depend on assumptions, data or methods that may be incorrect or imprecise and we may not be able to realize them. We do not guarantee that the transactions and events described will happen as described (or that they will happen at all). The following factors, among others, could cause actual results and future events to differ materially from those set forth or contemplated in the forward-looking statements: business and economic conditions generally and in the bank and non-bank financial services industries, nationally and within our local market areas; our ability to mitigate our risk exposures; our ability to maintain our historical earnings trends; changes in management personnel; interest rate risk; concentration of our products and services in the transportation industry; credit risk associated with our loan portfolio; lack of seasoning in our loan portfolio; deteriorating asset quality and higher loan charge-offs; time and effort necessary to resolve non-performing assets; inaccuracy of the assumptions and estimates we make in establishing reserves for probable loan losses and other estimates; risks related to the integration of acquired businesses and any future acquisitions; our ability to successfully identify and address the risks associated with our possible future acquisitions, and the risks that our prior and possible future acquisitions make it more difficult for investors to evaluate our business, financial condition and results of operations, and impairs our ability to accurately forecast our future performance; lack of liquidity; fluctuations in the fair value and liquidity of the securities we hold for sale; impairment of investment securities, goodwill, other intangible assets or deferred tax assets; our risk management strategies; environmental liability associated with our lending activities; increased competition in the bank and non-bank financial services industries, nationally, regionally or locally, which may adversely affect pricing and terms; the accuracy of our financial statements and related disclosures; material weaknesses in our internal control over financial reporting; system failures or failures to prevent breaches of our network security; the institution and outcome of litigation and other legal proceedings against us or to which we become subject; changes in carry-forwards of net operating losses; changes in federal tax law or policy; the impact of recent and future legislative and regulatory changes, including changes in banking, securities and tax laws and regulations, such as the Dodd-Frank Act and their application by our regulators as well as privacy, cybersecurity, and artificial intelligence regulation and oversight; governmental monetary and fiscal policies; changes in the scope and cost of FDIC, insurance and other coverages; failure to receive regulatory approval for future acquisitions and increases in our capital requirements.
11
While forward-looking statements reflect our good-faith beliefs, they are not guarantees of future performance. All forward-looking statements are necessarily only estimates of future results. Accordingly, actual results may differ materially from those expressed in or contemplated by the particular forward-looking statement, and, therefore, you are cautioned not to place undue reliance on such statements. Further, any forward-looking statement speaks only as of the date on which it is made, and we undertake no obligation to update any forward-looking statement to reflect events or circumstances after the date on which the statement is made or to reflect the occurrence of unanticipated events or circumstances, except as required by applicable law. For a discussion of such risks and uncertainties, which could cause actual results to differ from those contained in the forward-looking statements, see "Risk Factors" and the forward-looking statement disclosure contained in Triumph Financial’s Annual Report on Form 10-K, filed with the Securities and Exchange Commission on February 11, 2026.
Non-GAAP Financial Measures
This letter to shareholders includes certain non‐GAAP financial measures intended to supplement, not substitute for, comparable GAAP measures. Reconciliations of non‐GAAP financial measures to GAAP financial measures are provided at the end of this letter to shareholders.
12
The following table sets forth key metrics used by Triumph Financial to monitor our operations. Footnotes in this table can be found in our definitions of non-GAAP financial measures at the end of this document.
As of and for the Three Months Ended
(Dollars in thousands)
March 31, 2026
December 31, 2025
September 30, 2025
June 30, 2025
March 31, 2025
Financial Highlights:
Total assets
$
6,876,715
$
6,380,588
$
6,357,149
$
6,494,748
$
6,268,394
Loans held for investment
$
5,189,139
$
4,991,307
$
4,986,922
$
4,953,170
$
4,666,223
Deposits
$
5,699,939
$
4,950,216
$
4,955,246
$
5,186,098
$
4,976,750
Net income available to common stockholders
$
5,554
$
18,412
$
907
$
3,618
$
(784)
Performance Ratios - Annualized:
Return on average assets
0.39
%
1.18
%
0.11
%
0.28
%
—
%
Return on average total equity
2.71
%
8.14
%
0.73
%
1.95
%
0.01
%
Return on average common equity
2.48
%
8.19
%
0.41
%
1.68
%
(0.37
%)
Return on average tangible common equity (1)
4.46
%
15.00
%
0.76
%
2.81
%
(0.53
%)
Yield on loans
7.72
%
8.14
%
8.17
%
8.41
%
8.37
%
Cost of interest bearing deposits
2.07
%
2.28
%
2.36
%
2.22
%
2.14
%
Cost of total deposits
1.07
%
1.29
%
1.35
%
1.25
%
1.23
%
Cost of total funds
1.22
%
1.48
%
1.55
%
1.53
%
1.45
%
Net interest margin
6.06
%
6.36
%
6.29
%
6.43
%
6.49
%
Net noninterest expense to average assets(1)
4.85
%
4.16
%
5.08
%
5.13
%
5.61
%
Asset Quality:(2)
Past due to total loans
2.35
%
2.72
%
1.91
%
2.21
%
3.24
%
Non-performing loans to total loans
1.77
%
1.15
%
1.36
%
1.20
%
2.07
%
Non-performing assets to total assets
1.53
%
1.10
%
1.10
%
1.04
%
1.64
%
ACL to non-performing loans
37.15
%
63.44
%
49.53
%
65.02
%
37.47
%
ACL to total loans
0.66
%
0.73
%
0.67
%
0.78
%
0.78
%
Net charge-offs to average loans
0.04
%
(0.10
%)
0.19
%
0.17
%
0.13
%
Capital:
Tier 1 capital to average assets(3)
9.90
%
9.86
%
9.55
%
9.46
%
12.04
%
Tier 1 capital to risk-weighted assets(3)
10.68
%
10.74
%
10.20
%
9.98
%
12.90
%
Common equity tier 1 capital to risk-weighted assets(3)
9.14
%
9.16
%
8.65
%
8.43
%
11.27
%
Total capital to risk-weighted assets(3)
12.56
%
12.71
%
12.09
%
11.95
%
14.93
%
Total equity to total assets
13.83
%
14.76
%
14.46
%
14.05
%
14.26
%
Tangible common stockholders' equity to tangible assets(1)
7.80
%
8.26
%
7.87
%
7.53
%
9.86
%
Per Share Amounts:
Book value per share
$
38.05
$
37.73
$
36.79
$
36.56
$
36.25
Tangible book value per share (1)
$
21.21
$
20.77
$
19.70
$
19.31
$
25.32
Basic earnings per common share
$
0.23
$
0.77
$
0.04
$
0.15
$
(0.03)
Diluted earnings per common share
$
0.23
$
0.77
$
0.04
$
0.15
$
(0.03)
Shares outstanding end of period
23,806,253
23,765,385
23,763,401
23,727,046
23,419,740
13
Unaudited consolidated balance sheet as of:
(Dollars in thousands)
March 31, 2026
December 31, 2025
September 30, 2025
June 30, 2025
March 31, 2025
ASSETS
Total cash and cash equivalents
$
581,939
$
248,471
$
147,222
$
282,346
$
502,944
Securities - available for sale
339,562
364,277
378,088
392,275
411,925
Securities - held to maturity, net
1,031
1,550
1,766
1,782
1,731
Equity securities with readily determinable fair value
4,559
4,588
4,569
4,526
4,512
Loans held for sale
2,495
459
9,741
6,066
2,950
Loans held for investment
5,189,139
4,991,307
4,986,922
4,953,170
4,666,223
Allowance for credit losses
(34,157)
(36,511)
(33,549)
(38,691)
(36,229)
Loans, net
5,154,982
4,954,796
4,953,373
4,914,479
4,629,994
FHLB and other restricted stock
4,366
14,253
14,092
13,339
12,987
Premises and equipment, net
89,492
91,071
141,141
149,120
150,247
Capitalized software, net
48,322
46,370
44,934
43,011
40,869
Goodwill
355,296
355,296
353,898
353,900
241,949
Intangible assets, net
45,372
47,888
52,291
55,265
13,963
Bank-owned life insurance
65,406
64,887
64,338
63,787
63,200
Deferred tax asset, net
—
181
—
3,023
11,868
Other assets
183,893
186,501
191,696
211,829
179,255
Total assets
$
6,876,715
$
6,380,588
$
6,357,149
$
6,494,748
$
6,268,394
LIABILITIES
Noninterest bearing deposits
$
3,042,210
$
1,901,638
$
2,095,017
$
2,285,327
$
2,260,048
Interest bearing deposits
2,657,729
3,048,578
2,860,229
2,900,771
2,716,702
Total deposits
5,699,939
4,950,216
4,955,246
5,186,098
4,976,750
Federal Home Loan Bank advances
30,000
280,000
280,000
180,000
205,000
Subordinated notes
69,929
69,879
69,829
69,780
69,732
Junior subordinated debentures
43,154
42,991
42,829
42,666
42,507
Deferred tax liabilities, net
4,454
—
687
—
—
Other liabilities
78,524
95,731
89,225
103,822
80,478
Total liabilities
5,926,000
5,438,817
5,437,816
5,582,366
5,374,467
EQUITY
Preferred Stock
45,000
45,000
45,000
45,000
45,000
Common stock
296
295
295
295
292
Additional paid-in-capital
601,832
597,466
593,624
588,302
572,143
Treasury stock, at cost
(270,711)
(270,619)
(270,619)
(270,619)
(268,520)
Retained earnings
576,922
571,368
552,956
552,049
548,431
Accumulated other comprehensive income (loss)
(2,624)
(1,739)
(1,923)
(2,645)
(3,419)
Total stockholders' equity
950,715
941,771
919,333
912,382
893,927
Total liabilities and equity
$
6,876,715
$
6,380,588
$
6,357,149
$
6,494,748
$
6,268,394
14
Unaudited consolidated statement of income:
For the Three Months Ended
(Dollars in thousands)
March 31, 2026
December 31, 2025
September 30, 2025
June 30, 2025
March 31, 2025
Interest income:
Loans, including fees
$
47,656
$
55,233
$
56,400
$
54,836
$
53,576
Factored receivables, including fees
46,021
46,165
43,841
44,217
38,694
Securities
4,540
5,083
5,489
5,721
5,308
FHLB and other stock
272
969
223
246
249
Cash deposits
4,266
2,606
2,987
4,181
4,443
Total interest income
102,755
110,056
108,940
109,201
102,270
Interest expense:
Deposits
14,052
16,639
17,532
15,505
14,397
Subordinated notes
662
662
661
661
682
Junior subordinated debentures
954
1,007
1,049
1,035
994
Other borrowings
993
2,054
1,865
3,322
1,814
Total interest expense
16,661
20,362
21,107
20,523
17,887
Net interest income
86,094
89,694
87,833
88,678
84,383
Credit loss expense (benefit)
(607)
(1,764)
4,284
(702)
1,330
Net interest income after credit loss expense (benefit)
86,701
91,458
83,549
89,380
83,053
Noninterest income:
Service charges on deposits
1,212
1,483
1,847
1,742
1,596
Card income
1,960
1,935
1,968
1,922
1,797
Net gains (losses) on sale of loans
87
71
119
190
134
Net gains (losses) on disposal of premises and equipment
606
14,265
(3)
(218)
846
Fee income
13,735
13,478
14,305
12,755
9,114
Insurance commissions
1,111
(496)
1,481
1,282
1,250
Other
996
(346)
1,731
1,711
2,453
Total noninterest income
19,707
30,390
21,448
19,384
17,190
Noninterest expense:
Salaries and employee benefits
58,168
55,086
60,192
59,882
58,718
Occupancy, furniture and equipment
6,501
7,431
7,862
8,139
8,442
FDIC insurance and other regulatory assessments
1,058
1,337
1,468
894
727
Professional fees
4,763
4,286
5,228
(320)
6,064
Amortization of intangible assets
2,516
2,826
2,956
3,400
2,400
Advertising and promotion
1,212
1,689
2,209
1,838
1,464
Communications and technology
13,119
12,911
12,295
12,315
12,244
Software amortization
3,300
3,081
2,868
2,865
1,992
Travel and entertainment
1,520
1,147
1,043
1,619
1,492
Other
6,104
8,340
7,593
10,208
6,630
Total noninterest expense
98,261
98,134
103,714
100,840
100,173
Net income before income tax
8,147
23,714
1,283
7,924
70
Income tax expense
1,792
4,500
(425)
3,504
53
Net income
$
6,355
$
19,214
$
1,708
$
4,420
$
17
Dividends on preferred stock
(801)
(802)
(801)
(802)
(801)
Net income available to common stockholders
$
5,554
$
18,412
$
907
$
3,618
$
(784)
15
Earnings per share:
For the Three Months Ended
(Dollars in thousands)
March 31, 2026
December 31, 2025
September 30, 2025
June 30, 2025
March 31, 2025
Basic
Net income (loss) to common stockholders
$
5,554
$
18,412
$
907
$
3,618
$
(784)
Weighted average common shares outstanding
23,787,051
23,764,954
23,752,331
23,590,119
23,362,400
Basic earnings (loss) per common share
$
0.23
$
0.77
$
0.04
$
0.15
$
(0.03)
Diluted
Net income (loss) to common stockholders - diluted
$
5,554
$
18,412
$
907
$
3,618
$
(784)
Weighted average common shares outstanding
23,787,051
23,764,954
23,752,331
23,590,119
23,362,400
Dilutive effects of:
Assumed exercises of stock options
62,027
53,795
59,389
54,952
—
Restricted stock awards
—
—
—
16,097
—
Restricted stock units
125,664
102,264
90,675
89,156
—
Performance stock units - market based
61,150
38,245
18,812
17,704
—
Employee stock purchase plan
263
2,645
3,651
4,627
—
Weighted average shares outstanding - diluted
24,036,155
23,961,903
23,924,858
23,772,655
23,362,400
Diluted earnings (loss) per common share
$
0.23
$
0.77
$
0.04
$
0.15
$
(0.03)
Shares that were not considered in computing diluted earnings per common share because they were antidilutive or have not met the thresholds to be considered in the dilutive calculation are as follows:
For the Three Months Ended
March 31, 2026
December 31, 2025
September 30, 2025
June 30, 2025
March 31, 2025
Stock options
172,482
177,436
181,647
199,859
253,629
Restricted stock awards
—
—
—
—
48,076
Restricted stock units
—
—
—
5,171
203,812
Performance stock units - market based
—
60,840
77,074
56,311
82,020
Employee stock purchase plan
—
—
—
—
—
Loans held for investment summarized as of:
(Dollars in thousands)
March 31, 2026
December 31, 2025
September 30, 2025
June 30, 2025
March 31, 2025
Commercial real estate
$
724,923
$
730,435
$
769,314
$
754,509
$
811,244
Construction, land development, land
206,693
224,214
204,247
221,419
204,021
1-4 family residential properties
187,991
193,508
180,970
172,312
159,105
Farmland
42,666
43,433
43,208
44,069
47,311
Commercial
1,112,802
1,163,664
1,144,872
1,132,269
1,121,740
Factored receivables
1,717,808
1,462,900
1,424,631
1,401,377
1,350,656
Consumer
15,381
16,819
17,235
17,520
7,088
Mortgage warehouse
1,180,875
1,156,334
1,202,445
1,209,695
965,058
Total loans
$
5,189,139
$
4,991,307
$
4,986,922
$
4,953,170
$
4,666,223
16
Our banking loan portfolio consists of traditional community bank loans as well as commercial finance product lines focused on businesses that require specialized financial solutions and national lending product lines that further diversify our lending operations.
Banking loans held for investment are further summarized below:
(Dollars in thousands)
March 31, 2026
December 31, 2025
September 30, 2025
June 30, 2025
March 31, 2025
Commercial real estate
$
724,923
$
730,435
$
769,314
$
754,509
$
811,244
Construction, land development, land
206,693
224,214
204,247
221,419
204,021
1-4 family residential
187,991
193,508
180,970
172,312
159,105
Farmland
42,666
43,433
43,208
44,069
47,311
Commercial - General
303,561
313,696
285,571
298,653
274,697
Commercial - Agriculture
44,396
42,588
49,742
48,107
49,529
Commercial - Equipment
583,374
587,926
564,984
543,062
529,359
Commercial - Asset-based lending
138,982
180,012
198,809
192,793
214,000
Commercial - Liquid Credit
38,579
36,482
42,593
47,061
53,075
Consumer
15,381
16,819
17,235
17,520
7,088
Mortgage Warehouse
1,180,875
1,156,334
1,202,445
1,209,695
965,058
Total banking loans held for investment
$
3,467,421
$
3,525,447
$
3,559,118
$
3,549,200
$
3,314,487
The following table presents the Company’s operating segments:
(Dollars in thousands)
Total
Corporate
Three Months Ended March 31, 2026
Banking
Factoring
Payments
Intelligence
Segments
and Other(1)
Consolidated
Total interest income
$
56,611
$
38,944
$
7,166
$
—
$
102,721
$
34
$
102,755
Intersegment interest allocations
5,731
(8,219)
2,488
—
—
—
—
Total interest expense
15,039
6
—
—
15,045
1,616
16,661
Net interest income (expense)
47,303
30,719
9,654
—
87,676
(1,582)
86,094
Credit loss expense (benefit)
(2,338)
1,057
197
—
(1,084)
477
(607)
Net interest income after credit loss expense
49,641
29,662
9,457
—
88,760
(2,059)
86,701
Noninterest income
6,158
1,918
9,163
2,397
19,636
71
19,707
Noninterest expense:
Salaries and employee benefits
14,974
11,841
8,774
3,217
38,806
19,362
58,168
Depreciation
1,577
288
176
16
2,057
826
2,883
Other occupancy, furniture and equipment
2,016
496
141
27
2,680
938
3,618
FDIC insurance and other regulatory assessments
1,058
—
—
—
1,058
—
1,058
Professional fees
2,324
277
234
129
2,964
1,799
4,763
Amortization of intangible assets
269
137
817
1,283
2,506
10
2,516
Advertising and promotion
354
261
196
94
905
307
1,212
Communications and technology
5,097
2,320
2,836
359
10,612
2,507
13,119
Software amortization
—
1,070
1,821
58
2,949
351
3,300
Travel and entertainment
229
230
293
146
898
622
1,520
Other
3,444
670
816
71
5,001
1,103
6,104
Total noninterest expense
31,342
17,590
16,104
5,400
70,436
27,825
98,261
Net intersegment noninterest income (expense)(2)
125
515
(640)
—
—
—
—
Operating income (loss)
$
24,582
$
14,505
$
1,876
$
(3,003)
$
37,960
$
(29,813)
$
8,147
17
(Dollars in thousands)
Total
Corporate
Three Months Ended December 31, 2025
Banking
Factoring
Payments
Intelligence
Segments
and Other(1)
Consolidated
Total interest income
$
63,703
$
39,336
$
6,936
$
—
$
109,975
$
81
$
110,056
Intersegment interest allocations
5,903
(8,682)
2,779
—
—
—
—
Total interest expense
18,686
7
—
—
18,693
1,669
20,362
Net interest income (expense)
50,920
30,647
9,715
—
91,282
(1,588)
89,694
Credit loss expense (benefit)
(3,421)
1,400
28
—
(1,993)
229
(1,764)
Net interest income after credit loss expense
54,341
29,247
9,687
—
93,275
(1,817)
91,458
Noninterest income
2,931
1,687
8,623
2,347
15,588
14,802
30,390
Noninterest expense:
Salaries and employee benefits
14,355
12,232
8,544
2,571
37,702
17,384
55,086
Depreciation
1,583
348
182
14
2,127
1,146
3,273
Other occupancy, furniture and equipment
1,997
468
141
16
2,622
1,536
4,158
FDIC insurance and other regulatory assessments
1,337
—
—
—
1,337
—
1,337
Professional fees
2,005
137
271
(15)
2,398
1,888
4,286
Amortization of intangible assets
385
193
878
1,291
2,747
79
2,826
Advertising and promotion
408
194
818
27
1,447
242
1,689
Communications and technology
5,186
2,290
2,755
326
10,557
2,354
12,911
Software amortization
—
1,014
1,684
30
2,728
353
3,081
Travel and entertainment
133
119
227
202
681
466
1,147
Other
4,450
765
1,758
210
7,183
1,157
8,340
Total noninterest expense
31,839
17,760
17,258
4,672
71,529
26,605
98,134
Intersegment noninterest income (expense)(2)
138
502
(640)
—
—
—
—
Operating income (loss)
$
25,571
$
13,676
$
412
$
(2,325)
$
37,334
$
(13,620)
$
23,714
(1) Includes revenue and expense from the Company’s holding company, which does not meet the definition of an operating segment. Also includes corporate shared service costs such as the majority of salaries and benefits expense for our executive leadership team, as well as other selling, general, and administrative shared services costs including human resources, accounting, finance, risk management and a significant amount of information technology expense. For the three months ended December 31, 2025, noninterest income in the Corporate and Other category included a gain of $8.7 million on the sale of the building purchased in 2024 and a gain of $5.6 million on the sale of an aircraft.
(2) Intersegment noninterest income (expense) includes:
(Dollars in thousands)
Banking
Factoring
Payments
Three Months Ended March 31, 2026
Factoring revenue received from Payments
$
—
$
911
$
(911)
Payments revenue received from Factoring
—
(287)
287
Banking revenue received from Payments and Factoring
125
(109)
(16)
Intersegment noninterest income (expense)
$
125
$
515
$
(640)
Three Months Ended December 31, 2025
Factoring revenue received from Payments
$
—
$
911
$
(911)
Payments revenue received from Factoring
—
(290)
290
Banking revenue received from Payments and Factoring
138
(119)
(19)
Intersegment noninterest income (expense)
$
138
$
502
$
(640)
18
Information pertaining to our Factoring segment, summarized as of and for the quarters ended:
(1)Operating margin is a non-GAAP financial measure used as a supplemental measure to evaluate the performance of our Factoring segment. For the three months ended June 30, 2025, operating income and factoring total revenue were impacted by $1.2 million of interest and fees resulting from the USPS Settlement and such settlement further impacted operating income by $7.4 million of legal expense accrual reversal and $3.8 million of recovery of factoring balances charged-off in a prior period. Operating income for the three months ended June 30, 2025 was also impacted by a $2.0 million legal settlement that was unrelated to the USPS Settlement. Such items had a 24.71% impact on operating margin, a 0.43% impact on yield on average receivables, and a 0.46% impact on yield on average net funds employed for the three months ended June 30, 2025.
(2)The current quarter charge-off rate for the three months ended June 30, 2025 reflects a $3.8 million recovery of factoring balances charged off in a prior period. Such recovery impacted the current quarter charge-off rate for that period by (0.33%).
19
Information pertaining to our Payments segment, summarized as of and for the quarters ended:
Payments
March 31, 2026
December 31, 2025
September 30, 2025
June 30, 2025
March 31, 2025
Supply chain financing factored receivables
$
222,168,000
$
174,292,000
$
157,662,000
$
152,054,000
$
122,583,000
Quickpay and other factored receivables
90,682,000
67,828,000
73,120,000
74,493,000
81,644,000
Total factored receivable period end balance
$
312,850,000
$
242,120,000
$
230,782,000
$
226,547,000
$
204,227,000
Total revenue
Supply chain finance interest income
$
4,192,000
$
4,177,000
$
3,895,000
$
3,412,000
$
2,695,000
Quickpay interest income
2,974,000
2,759,000
2,874,000
2,818,000
2,668,000
Intersegment interest income allocation
2,488,000
2,779,000
2,943,000
2,896,000
2,918,000
Total interest income
9,654,000
9,715,000
9,712,000
9,126,000
8,281,000
Broker noninterest income
7,820,000
7,330,000
7,131,000
6,443,000
5,178,000
Factor noninterest income
796,000
952,000
933,000
993,000
1,233,000
Other noninterest income
547,000
341,000
398,000
288,000
120,000
Intersegment noninterest income
287,000
290,000
329,000
381,000
372,000
Total noninterest income
9,450,000
8,913,000
8,791,000
8,105,000
6,903,000
$
19,104,000
$
18,628,000
$
18,503,000
$
17,231,000
$
15,184,000
Total expense
Credit loss expense (benefit)
$
197,000
$
28,000
$
9,000
$
92,000
$
118,000
Noninterest expense
16,104,000
17,258,000
17,094,000
16,844,000
17,113,000
Intersegment noninterest expense
927,000
930,000
950,000
949,000
944,000
$
17,228,000
$
18,216,000
$
18,053,000
$
17,885,000
$
18,175,000
Pre-tax operating income (loss)
$
1,876,000
$
412,000
$
450,000
$
(654,000)
$
(2,991,000)
Depreciation expense
176,000
182,000
203,000
222,000
230,000
Software amortization expense
1,821,000
1,684,000
1,550,000
1,413,000
1,196,000
Intangible amortization expense
817,000
878,000
904,000
1,418,000
1,551,000
Earnings (losses) before interest, taxes, depreciation, and amortization(1)
$
4,690,000
$
3,156,000
$
3,107,000
$
2,399,000
$
(14,000)
EBITDA Margin(1)
24.5
%
16.9
%
16.8
%
13.9
%
(0.1)
%
Number of invoices processed
8,220,371
9,053,274
8,826,848
8,500,565
7,182,044
Amount of payments processed
$
11,014,040,000
$
10,995,478,000
$
10,662,418,000
$
10,081,206,000
$
8,777,825,000
Network invoice volume
1,043,488
1,090,848
1,057,606
1,004,603
719,531
Network payment volume
$
1,941,127,000
$
1,829,509,000
$
1,696,817,000
$
1,579,662,000
$
1,167,464,000
LoadPay
Revenue
$
437,000
$
345,000
$
218,000
$
92,000
$
24,000
Pre-tax operating income (loss)
$
(2,059,000)
$
(2,584,000)
$
(2,353,000)
$
(1,751,000)
$
(1,053,000)
Depreciation expense
21,000
21,000
20,000
16,000
3,000
Software amortization expense
374,000
324,000
289,000
251,000
140,000
Earnings (losses) before interest, taxes, depreciation, and amortization(1)
$
(1,664,000)
$
(2,239,000)
$
(2,044,000)
$
(1,484,000)
$
(910,000)
Payments revenue excluding LoadPay
$
18,667,000
$
18,283,000
$
18,285,000
$
17,139,000
$
15,160,000
Payments EBITDA excluding LoadPay(2)
$
6,354,000
$
5,395,000
$
5,151,000
$
3,883,000
$
896,000
Payments EBITDA Margin excluding LoadPay(2)
34.0
%
29.5
%
28.2
%
22.7
%
5.9
%
20
(1)Earnings (losses) before interest, taxes, depreciation, and amortization ("EBITDA") and EBITDA margin are non-GAAP financial measures used as supplemental measures to evaluate the performance of our Payments segment. EBITDA is useful because it provides a clearer view of underlying operating performance by excluding the effects of capital structure, tax regimes, and non-cash depreciation and amortization. EBITDA margin complements EBITDA by illustrating how efficiently revenue is converted into operating profitability.
(2)Payments EBITDA excluding LoadPay and Payments EBITDA Margin excluding LoadPay are non-GAAP financial metrics used as supplemental measures to evaluate the performance of our Payments segment exclusive of the investments associated with LoadPay, which is a relatively new product in its early stages. Such adjusted EBITDA measures provide comparable clarity into the performance of our Payments segment prior to the advent of our LoadPay product.
Information pertaining to our Intelligence segment, summarized as of and for the quarters ended:
Intelligence
March 31, 2026
December 31, 2025
September 30, 2025
Revenue
$
2,397,000
$
2,347,000
$
2,338,000
Cost of revenue
333,000
283,000
266,000
Gross profit
2,064,000
2,064,000
2,072,000
Selling, general and administrative costs
5,067,000
4,389,000
5,670,000
Pre-tax operating income (loss)
$
(3,003,000)
$
(2,325,000)
(3,598,000)
Gross Margin(1)
86
%
88
%
89
%
*prior periods not meaningful
(1)Gross margin is a non-GAAP financial measure used as supplemental measure to evaluate the performance of our Intelligence segment. Cost of revenues is comprised primarily of salaries and benefits and communications and technology costs for employees providing services to the Company's customers. This includes the costs of the Company's personnel performing integration, customer support, third-party data center and customer training activities. Cost of revenues also includes the direct costs of third party hosting services. We have elected to exclude amortization expense of capitalized developed software and acquired technology, as well as allocations of fixed asset depreciation expense and occupancy expenses from cost of revenues.
Transportation revenue:
Three Months Ended
(Dollars in thousands)
March 31, 2026
December 31, 2025
September 30, 2025
June 30, 2025
March 31, 2025
Transportation Revenue
Factoring revenue
$
41,773
$
41,934
$
39,653
$
40,761
$
35,961
Intersegment noninterest income
(911)
(911)
(911)
(910)
(911)
Factoring revenue excluding intersegment noninterest income
$
40,862
$
41,023
$
38,742
$
39,851
$
35,050
Payments revenue
$
19,104
$
18,628
$
18,503
$
17,231
$
15,184
Intersegment noninterest income
(287)
(290)
(329)
(381)
(372)
Payments revenue excluding intersegment noninterest income
$
18,817
$
18,338
$
18,174
$
16,850
$
14,812
Intelligence revenue
$
2,397
$
2,347
$
2,338
$
1,724
$
395
Transportation revenue
$
62,076
$
61,708
$
59,254
$
58,425
$
50,257
21
Deposits summarized as of:
(Dollars in thousands)
March 31, 2026
December 31, 2025
September 30, 2025
June 30, 2025
March 31, 2025
Non-interest bearing demand
$
3,042,210
$
1,901,638
$
2,095,017
$
2,285,327
$
2,260,048
Interest bearing demand
691,572
845,060
668,576
694,005
731,477
Individual retirement accounts
35,977
37,634
39,133
40,888
42,344
Money market
639,651
608,036
580,748
565,781
610,120
Savings
546,374
522,189
522,469
517,474
525,133
Certificates of deposit
222,123
224,644
228,415
230,179
231,076
Brokered time deposits
442,872
695,093
705,772
701,059
576,552
Other brokered deposits
79,160
115,922
115,116
151,385
—
Total deposits
$
5,699,939
$
4,950,216
$
4,955,246
$
5,186,098
$
4,976,750
Net interest margin summarized for the three months ended:
March 31, 2026
December 31, 2025
(Dollars in thousands)
Average Balance
Interest
Average
Rate(4)
Average Balance
Interest
Average
Rate(4)
Interest earning assets:
Interest earning cash balances
$
469,986
$
4,266
3.68
%
$
260,766
$
2,606
3.96
%
Taxable securities
358,048
4,525
5.13
%
374,076
5,068
5.38
%
Tax-exempt securities
2,277
15
2.67
%
2,394
15
2.49
%
FHLB and other stock
13,263
272
8.32
%
14,107
969
27.25
%
Loans(1)
4,918,116
93,677
7.72
%
4,939,502
101,398
8.14
%
Total interest earning assets
$
5,761,690
$
102,755
7.23
%
$
5,590,845
$
110,056
7.81
%
Non-interest earning assets:
Other assets
811,385
874,702
Total assets
$
6,573,075
$
6,465,547
Interest bearing liabilities:
Deposits:
Interest bearing demand
$
682,468
$
745
0.44
%
$
674,985
$
834
0.49
%
Individual retirement accounts
36,590
108
1.20
%
38,434
120
1.24
%
Money market
608,415
3,787
2.52
%
588,528
3,896
2.63
%
Savings
535,308
1,524
1.15
%
523,816
1,540
1.17
%
Certificates of deposit
224,469
1,422
2.57
%
227,577
1,582
2.76
%
Brokered time deposits
562,295
5,505
3.97
%
720,088
7,515
4.14
%
Other brokered deposits
105,565
961
3.69
%
115,676
1,152
3.95
%
Total interest bearing deposits
2,755,110
14,052
2.07
%
2,889,104
16,639
2.28
%
Federal Home Loan Bank advances
106,667
993
3.78
%
203,641
2,054
4.00
%
Subordinated notes
69,903
662
3.84
%
69,853
662
3.76
%
Junior subordinated debentures
43,057
954
8.99
%
42,885
1,007
9.32
%
Other borrowings
—
—
—
%
1
—
—
%
Total interest bearing liabilities
$
2,974,737
$
16,661
2.27
%
$
3,205,484
$
20,362
2.52
%
Noninterest bearing liabilities and equity:
Non-interest bearing demand deposits
2,558,992
2,239,961
Other liabilities
86,869
83,079
Total equity
952,477
937,023
Total liabilities and equity
$
6,573,075
$
6,465,547
Net interest income
$
86,094
$
89,694
Interest spread(2)
4.96
%
5.29
%
Net interest margin(3)
6.06
%
6.36
%
22
(1) Loan balance totals include respective nonaccrual assets.
(2) Net interest spread is the yield on average interest earning assets less the rate on interest bearing liabilities.
(3) Net interest margin is the ratio of net interest income to average interest earning assets.
(4) Average rates have been annualized.
Additional information pertaining to our loan portfolio, including loans held for investment and loans held for sale, summarized for the quarters ended:
(Dollars in thousands)
March 31, 2026
December 31, 2025
September 30, 2025
June 30, 2025
March 31, 2025
Average Banking loans
$
3,389,580
$
3,491,230
$
3,484,400
$
3,381,919
$
3,237,692
Average Factoring receivables
1,269,715
1,219,914
1,167,092
1,138,792
1,060,482
Average Payments receivables
258,821
228,358
213,386
204,529
173,536
Average total loans
$
4,918,116
$
4,939,502
$
4,864,878
$
4,725,240
$
4,471,710
Banking yield
5.69
%
6.26
%
6.41
%
6.50
%
6.71
%
Factoring yield
12.44
%
12.79
%
12.63
%
13.40
%
12.75
%
Payments yield
11.23
%
12.05
%
12.59
%
12.22
%
12.53
%
Total loan yield
7.72
%
8.14
%
8.17
%
8.41
%
8.37
%
Reconciliation of non-GAAP financial measures:
As of and for the Three Months Ended
(Dollars in thousands, except per share amounts)
March 31, 2026
December 31, 2025
September 30, 2025
June 30, 2025
March 31, 2025
Average total stockholders' equity
$
952,477
$
937,023
$
925,459
$
910,202
$
902,260
Average preferred stock liquidation preference
(45,000)
(45,000)
(45,000)
(45,000)
(45,000)
Average total common stockholders' equity
907,477
892,023
880,459
865,202
857,260
Average goodwill and other intangibles
(402,158)
(404,893)
(408,025)
(347,894)
(257,399)
Average tangible common stockholders' equity
$
505,319
$
487,130
$
472,434
$
517,308
$
599,861
Net income available to common stockholders
$
5,554
$
18,412
$
907
$
3,618
$
(784)
Average tangible common equity
505,319
487,130
472,434
517,308
599,861
Return on average tangible common equity
4.46
%
15.00
%
0.76
%
2.81
%
(0.53
%)
Net non-interest expense to average assets ratio:
Noninterest expenses
$
98,261
$
98,134
$
103,714
$
100,840
$
100,173
Noninterest income
$
19,707
$
30,390
$
21,448
$
19,384
$
17,190
Net noninterest expenses
$
78,554
$
67,744
$
82,266
$
81,456
$
82,983
Average total assets
$
6,573,075
$
6,465,547
$
6,425,267
$
6,366,984
$
5,994,040
Net noninterest expense to average assets ratio
4.85
%
4.16
%
5.08
%
5.13
%
5.61
%
Total stockholders' equity
$
950,715
$
941,771
$
919,333
$
912,382
$
893,927
Preferred stock liquidation preference
(45,000)
(45,000)
(45,000)
(45,000)
(45,000)
Total common stockholders' equity
905,715
896,771
874,333
867,382
848,927
Goodwill and other intangibles
(400,668)
(403,184)
(406,189)
(409,165)
(255,912)
Tangible common stockholders' equity
$
505,047
$
493,587
$
468,144
$
458,217
$
593,015
Common shares outstanding
23,806,253
23,765,385
23,763,401
23,727,046
23,419,740
Tangible book value per share
$
21.21
$
20.77
$
19.70
$
19.31
$
25.32
Total assets at end of period
$
6,876,715
$
6,380,588
$
6,357,149
$
6,494,748
$
6,268,394
Goodwill and other intangibles
(400,668)
(403,184)
(406,189)
(409,165)
(255,912)
Tangible assets at period end
$
6,476,047
$
5,977,404
$
5,950,960
$
6,085,583
$
6,012,482
Tangible common stockholders' equity ratio
7.80
%
8.26
%
7.87
%
7.53
%
9.86
%
23
1)Triumph Financial uses certain non-GAAP financial measures to provide meaningful supplemental information regarding Triumph Financial's operational performance and to enhance investors' overall understanding of such financial performance. The non-GAAP measures used by Triumph Financial include the following:
•"Tangible common stockholders' equity" is defined as common stockholders' equity less goodwill and other intangible assets.
•"Total tangible assets" is defined as total assets less goodwill and other intangible assets.
•"Tangible book value per share" is defined as tangible common stockholders' equity divided by total common shares outstanding. This measure is important to investors interested in changes from period-to-period in book value per share exclusive of changes in intangible assets.
•"Tangible common stockholders' equity ratio" is defined as the ratio of tangible common stockholders' equity divided by total tangible assets. We believe that this measure is important to many investors in the marketplace who are interested in relative changes from period-to-period in common equity and total assets, each exclusive of changes in intangible assets.
•"Return on Average Tangible Common Equity" is defined as net income available to common stockholders divided by average tangible common stockholders' equity.
2)Asset quality ratios exclude loans held for sale, except for non-performing assets to total assets.
3)Current quarter ratios are preliminary.
Source: Triumph Financial, Inc.
###
Investor Relations:
Luke Wyse
Executive Vice President, Head of Investor Relations
lwyse@tfin.com
214-365-6936
Media Contact:
Amanda Tavackoli
Senior Vice President, Director of Corporate Communication