For the second quarter, we recorded net income to common stockholders of $10.6 million, or $0.44 per diluted share. Earnings for the quarter were affected by certain non-core items detailed at the end of this letter, which in aggregate reduced EPS by $0.13. The majority of this non-core expense is related to our ongoing efficiency initiatives, which should continue to create positive operating leverage for Triumph going forward.
CEO Summary: The Metrics That Matter Most
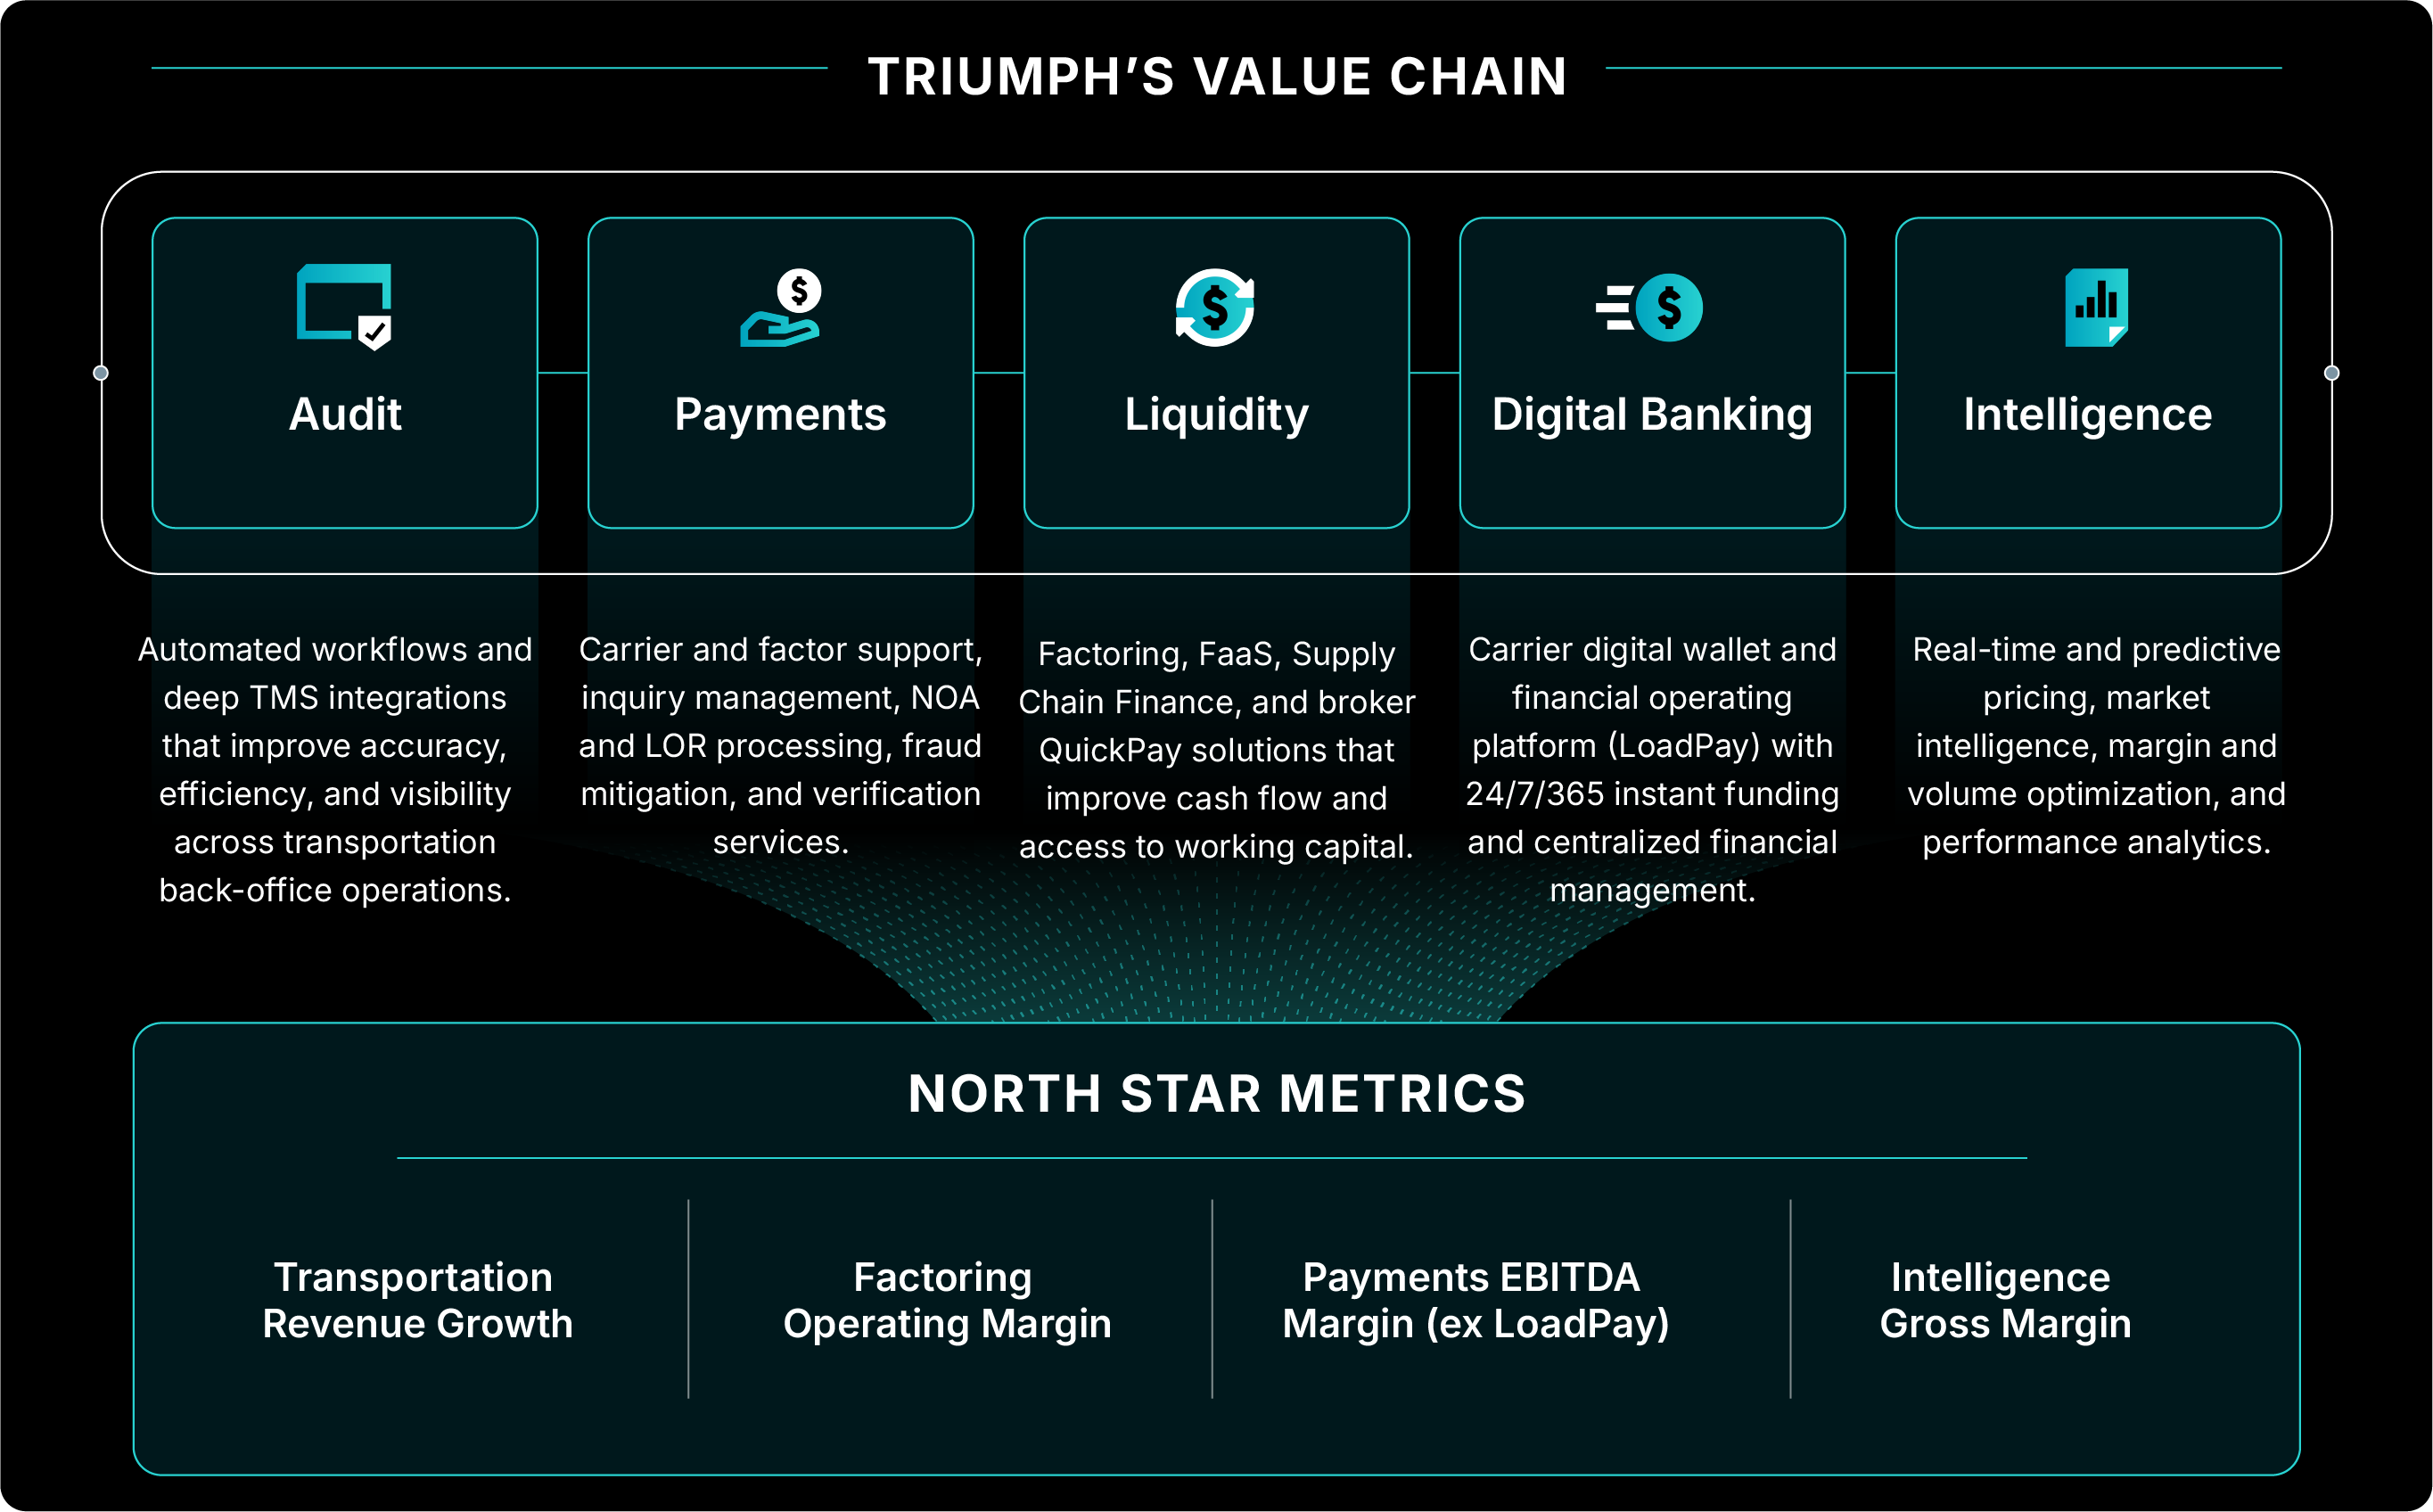
North Star Metrics
Long-Term Target
2Q26*
1Q26*
△ From Prior Quarter
Transportation Revenue Growth
> 15%
30.9
%
23.5
%
7.4
%
Factoring Operating Margin
> 40%
39.4
%
34.7
%
4.7
%
Payments EBITDA Margin (ex-LoadPay)
> 50%
34.0
%
34.0
%
—
%
Intelligence Gross Margin
> 85%
84.7
%
86.1
%
(1.4
%)
* Growth figures are YoY, all other metrics are for the quarter indicated.
The annual and quarterly comparisons among these important metrics are almost universally favorable. Factoring margin is less than 1% short of our long-term goal. Add to that excellent growth in LoadPay, exciting product launches in Intelligence, positive trends in Banking, and continuing efficiency gains across the enterprise, and it is the recipe for an improved quarter and, much more importantly, positive overall momentum.
As a reminder, we introduced our North Star metrics in 1Q. These metrics are the dashboard that tells us how the economic engine of our value chain is working. A year ago, I wrote about Triumph’s value chain in our 2Q25 letter. Our value chain is the sequence and design of our transportation products and services that create value for carriers, brokers, factors, and shippers. Broadly speaking, Triumph's value chain moves money and data along the line of supply from shippers to carriers and injects liquidity as needed along the way.
1
Our metrics for 2Q26 show that the economic engine of our value chain is performing well. Even though Payments EBITDA margin was flat QoQ due to a few unique items, overall momentum is positive. In addition, market conditions have become more favorable for Triumph’s earnings. While that is true, the underlying truth is that over 30% of the revenue growth we have experienced in transportation year-to-date has come from organic growth, not just market tailwinds.
In the future, I expect the North Star metric for Payments EBITDA margin to be reported inclusive of LoadPay. I further expect that gross margin for Intelligence will be replaced by a measure of revenue growth and/or margin for that segment. For at least the remainder of 2026, however, our North Star metrics will remain as they are.
What Has Changed in the Freight Market and Where Do We Go from Here?
There has been more than enough ink spilled by experts and interested observers on the structural changes in the freight market. We have included a deeper dive into this topic in the Freight Market Update section below. For purposes of the CEO Summary, I will boil it down to a few points:
•The reduction in supply is real and unlikely to reverse in the near term. Regulatory enforcement, industry efforts to combat fraud, and the emergence of a new era of vicarious liability for brokers and shippers have collectively removed capacity from the market and thus altered the supply-demand balance. Over the long run, the "right" rate for freight should allow a well-run, law-abiding carrier to earn their cost of capital. For much of the last four years, the industry has operated below that level for carriers, both large and small. Freight markets are inherently cyclical, and rates rarely remain at the "right" equilibrium for long, but we believe the equilibrium itself has moved higher due to supply constraints.
•Demand is only part of the story this time. The biggest difference between this freight cycle and every upcycle I have seen before is that it has not been fueled by a surge in freight demand. Demand is better than many people think or fear or predict, but it is not strong by historical standards. Housing is below long-term averages, food and beverage is weak, automotive freight is only modestly supportive, and consumer demand has been uneven. The obvious bright spot has been data center construction, which has created a meaningful amount of freight demand.
•The winners of the next cycle will not likely be the winners of the last one. For most of the last decade, cheap capacity has been the dominant variable in freight. Today, compliance, fraud prevention, liability management, and operational transparency increasingly determine who can profitably participate in the market. The cost of doing things the right way has increased, but so has the penalty for not doing so. We believe the industry's increasing complexity favors companies that help participants navigate that complexity. It is too simplistic to say that this exclusively benefits large fleets – the benefit belongs to those who can demonstrate their ability to operate in a compliant manner. At Triumph, we are not simply positioning for a tighter freight market; we are positioning for a different freight market.
The Impact of Freight Rates on Earnings
It is important to understand how the freight market (which affects revenue per mile, and thus, the average size of invoices we purchase and finance) affects Triumph. Not all our transportation-related revenue is tied directly to freight invoice size. Portions of our business – particularly Payments, Intelligence, and Audit – generate revenue through transaction fees and subscriptions. That said, our Factoring business remains a significant contributor to earnings, and it benefits meaningfully when invoice sizes increase. The operating cost structure of Factoring is directionally fixed, which means increases in invoice size tend to flow through to revenue with little corresponding increase in expense beyond funding costs. As a result, stronger freight pricing can have a significant impact on our earnings even when freight volumes are growing only modestly.
For the quarter, Factoring transportation invoice prices averaged $2,160, a 23.4% increase over the 4Q25 average. For the first 17 days of July, invoice prices have averaged $2,210. The month of July is typically soft from a demand perspective compared to 2Q, and we believe relative monthly softness in demand to be the case again this year. Thus, we believe that continuing upwards pressure on invoice sizes is a function of limited supply rather than increasing demand.
A $100 move in invoice prices moves our annual pretax income by approximately $7.0 million. The goals I shared in January contemplated a 4Q26 annualized earnings exit rate of approximately $2.00 per share based on an expected average invoice size of $1,800. All other things being equal, if average invoice prices for 2026 are $2,200 or more, the implied earnings trajectory is meaningfully higher.
2
The Same Capital Allocation Question Five Years Later
Considering the foregoing, our commitment to investors is that most of the earnings benefit from a stronger market will fall to the bottom line. Investors deserve that. "Most" is a directional statement that might lead to a related question – how much of "most" of Triumph’s earnings are we reinvesting in the business, whether the freight market is favorable or unfavorable?
Before answering, let me connect this topic back to the opening of the letter. The value chain is the engine, and the North Star metrics are the dashboard indicators for the engine's performance. Capital allocation – the topic I am addressing here – is how we improve the engine over time. I think it is important that investors understand the way that Triumph thinks about this topic, so I will demonstrate it with a historical comparison. Before I do, I want to point out that no single example accounts for all the ways that Triumph is continually improving its products and value chain.
In 3Q21, we reported earnings of $0.94 per share for the quarter. At that time, Factoring was generating a roughly 7% pretax ROAA on average invoice transportation prices of $2,195.[1] As good as those numbers were, our total earnings would have been even higher but for an annualized pretax earnings drag of ~$20 million from our investment in TriumphPay (now reported as our Payments segment). At the time, there were investors who thought our efforts to create a payments network were smart and others who thought it was foolish. We plowed on. We had to recalibrate multiple times along the way, but as we sit today, I believe there is universal acknowledgment that our Payments segment has been a success. It is profitable and growing. Beyond its current earnings and future earnings power, our Payments segment also became the connective tissue that allowed the rest of the value chain to emerge.
Why is this bit of history relevant? Because some five years later, history is at least rhyming if not repeating itself. We now hold ~$2 billion of factored receivables, which is 50X the size of the business we bought in 2012. Its pretax ROAA is ~5%, and the composition of our earnings looks more like a financial technology company than it did five years ago. On the other hand, the combined annual drag on pretax earnings of our Intelligence segment and our LoadPay line of business is currently ~$20 million, which is remarkably similar to the early stages of Payments. If we were to curtail investments in those two lines of business and the freight market stayed tight, we could approach $4.00 per share of earnings in short order. This leaves us facing a decision like the one we faced five years ago: maximizing near-term earnings or continuing to invest in businesses we believe can materially increase Triumph's long-term value. Our choice is to invest and let the results of those investments speak for themselves over time. We are choosing that because we believe LoadPay and Intelligence are important to our value chain and capable of producing high margin and durable revenue.
We have never believed that the purpose of a public company is to maximize the next four quarters of earnings at the expense of future value. We believe our job is to allocate resources and capital in a manner which maximizes intrinsic value over many years while generating positive earnings along the way. That philosophy produced the growth in Factoring and the Payments business we have today. It is the same philosophy guiding our investments in LoadPay and Intelligence.
Payments
1.Analysis of Financial and Operational Performance for the Quarter
2.A New Denominator: $135 is the New $110
3.LoadPay Update
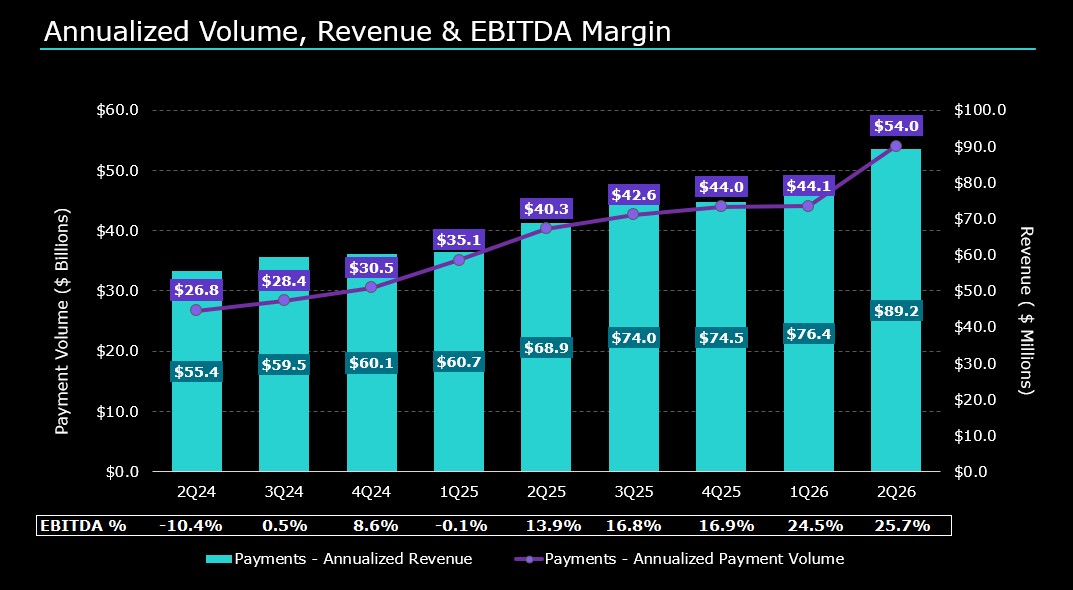
Analysis of Financial and Operational Performance for the Quarter. Revenue grew 29.4% YoY to $89.2 million, annualized. On a quarterly basis, revenue grew 16.7%, with contributions coming from contractual price increases, increased supply chain finance volumes, and seasonality. EBITDA margin for the quarter improved to 25.7%, up from 24.5% in 1Q26 and 13.9% in 2Q25. Ex-LoadPay, EBITDA margin for the quarter was 34.0%, unchanged from 1Q26. But for some transitory expenses in the quarter, EBITDA margin would have improved by a little over 3%. It will not be perfectly linear, but we absolutely expect margin expansion from here. At maturity, we also expect LoadPay to be accretive to overall Payments margin.
3
June 30, 2026
March 31, 2026
December 31, 2025
September 30, 2025
June 30, 2025
Current Quarter Q/Q
Current Year Y/Y
For the Qtr Ending
Change
% Change
Change
% Change
Payments:
Invoice Volume
9,086,400
8,220,371
9,053,274
8,826,848
8,500,565
866,029
10.5
%
585,835
6.9
%
Payment Volume
$
13,492,237,000
$
11,014,040,000
$
10,995,478,000
$
10,662,418,000
$
10,081,206,000
$
2,478,197,000
22.5
%
$
3,411,031,000
33.8
%
Network Engagement[2]
65.6
%
66.1
%
64.2
%
63.4
%
63.3
%
(0.5)
%
(0.8)
%
2.3
%
3.6
%
Average Float
$
560,861,000
$
538,303,000
$
518,182,000
$
484,582,000
$
469,211,000
$
22,558,000
4.2
%
$
91,650,000
19.5
%
Fee Revenue
$
11,159,000
$
9,450,000
$
8,913,000
$
8,791,000
$
8,105,000
$
1,709,000
18.1
%
$
3,054,000
37.7
%
Total Revenue
$
22,296,000
$
19,104,000
$
18,628,000
$
18,503,000
$
17,231,000
$
3,192,000
16.7
%
$
5,065,000
29.4
%
EBITDA margin
25.7
%
24.5
%
16.9
%
16.8
%
13.9
%
1.2
%
4.9
%
11.8
%
84.9
%
EBITDA Margin (ex-LoadPay)
34.0
%
34.0
%
29.5
%
28.2
%
22.7
%
—
%
—
%
11.3
%
49.8
%
LoadPay:
# of Accounts
10,204
8,065
5,892
4,421
2,367
2,139
26.5
%
7,837
331.1
%
# of Active Carrier Accounts
4,004
3,157
2,487
1,916
968
847
26.8
%
3,036
313.6
%
Revenue per Account (Ann.)
$
281.05
$
252.21
$
248.33
$
234.70
$
206.30
$28.84
11.4
%
$74.75
36.2
%
Revenue per Active Carrier Account (Ann.)
$
706.89
$
633.10
$
572.15
$
516.78
$
478.32
$73.79
11.7
%
$228.57
47.8
%
LoadPay Funding
$
195,063,000
$
118,384,000
$
84,770,000
$
53,042,000
$
22,212,000
$
76,679,000
64.8
%
$
172,851,000
778.2
%
Average Interchange Fees
1.58
%
1.62
%
1.68
%
1.64
%
1.61
%
(0.04)
%
(2.5)
%
(0.03)
%
(1.9)
%
Cross Segment:
Broker Revenue Per Invoice*
$
1.39
$
1.31
$
1.16
$
1.15
$
1.08
$0.08
6.1
%
$0.31
28.7
%
PAR**
1.32
1.30
1.33
1.31
1.30
0.02
1.5
%
0.02
1.5
%
*Broker Revenue per Invoice is calculated using unique broker invoice volume, referring to Invoices from our broker Payments and Audit services as well as our Intelligence services to brokers, and broker revenue, referring to revenue generated by our broker Payments and Audit services (Broker Fee Income + Quickpay Interest Income) + broker Intelligence revenue. **PAR indicates product attachment rate and measures cross-selling of Payments, Audit, and Intelligence across our broker clients.
For the second quarter of 2026, the dollar-volume of Payments increased due to the seasonal increase in volume and the market-driven increase in invoice prices. We generally charge for Payments on a per invoice basis, so invoice counts are a better gauge of revenue growth than Payments volumes in this segment.
In the chart below, we graphically highlight the continued revenue growth and its trend over the last eight quarters against the backdrop of our Payment volumes. We have generated a ~27% CAGR in revenue over the last two years.
A New Denominator: $135 is the New $110. In the first quarter of 2024, we sized the brokered freight market at $110 billion, which incorporated the pullback we saw in spot and contract rates from the pandemic and reflected significant inflation. Since then, inflation has remained steadily above Fed targets, and 2Q has seen dramatic upward pressure on
4
spot and contract rates again. Our annualized broker payment volume in 2Q was $49.4 billion, and Network engagement was $88.5 billion, annualized. These increases were the result of a mix of organic growth and a significant increase in spot and contract rates. Due to the increase in market rates, we need to recalibrate the denominator for our market penetration assessment, or it risks becoming disingenuous. Therefore, we are updating the addressable market for 2Q from $110 billion to $135 billion. It is possible that we will need to revise this denominator higher in 3Q. If we considered June only (instead of the entire 2Q), the addressable market would be ~$145 billion on annualized broker volumes of $53.7 billion in Payments.
LoadPay Update. LoadPay revenue growth was 49.2% for the quarter, and we crossed over 10,000 accounts, both of which are very encouraging. We are still early in the journey, but growth in accounts, active usage, and revenue per active carrier account gives us confidence that LoadPay can become more than a feature; it can become a durable carrier operating platform.
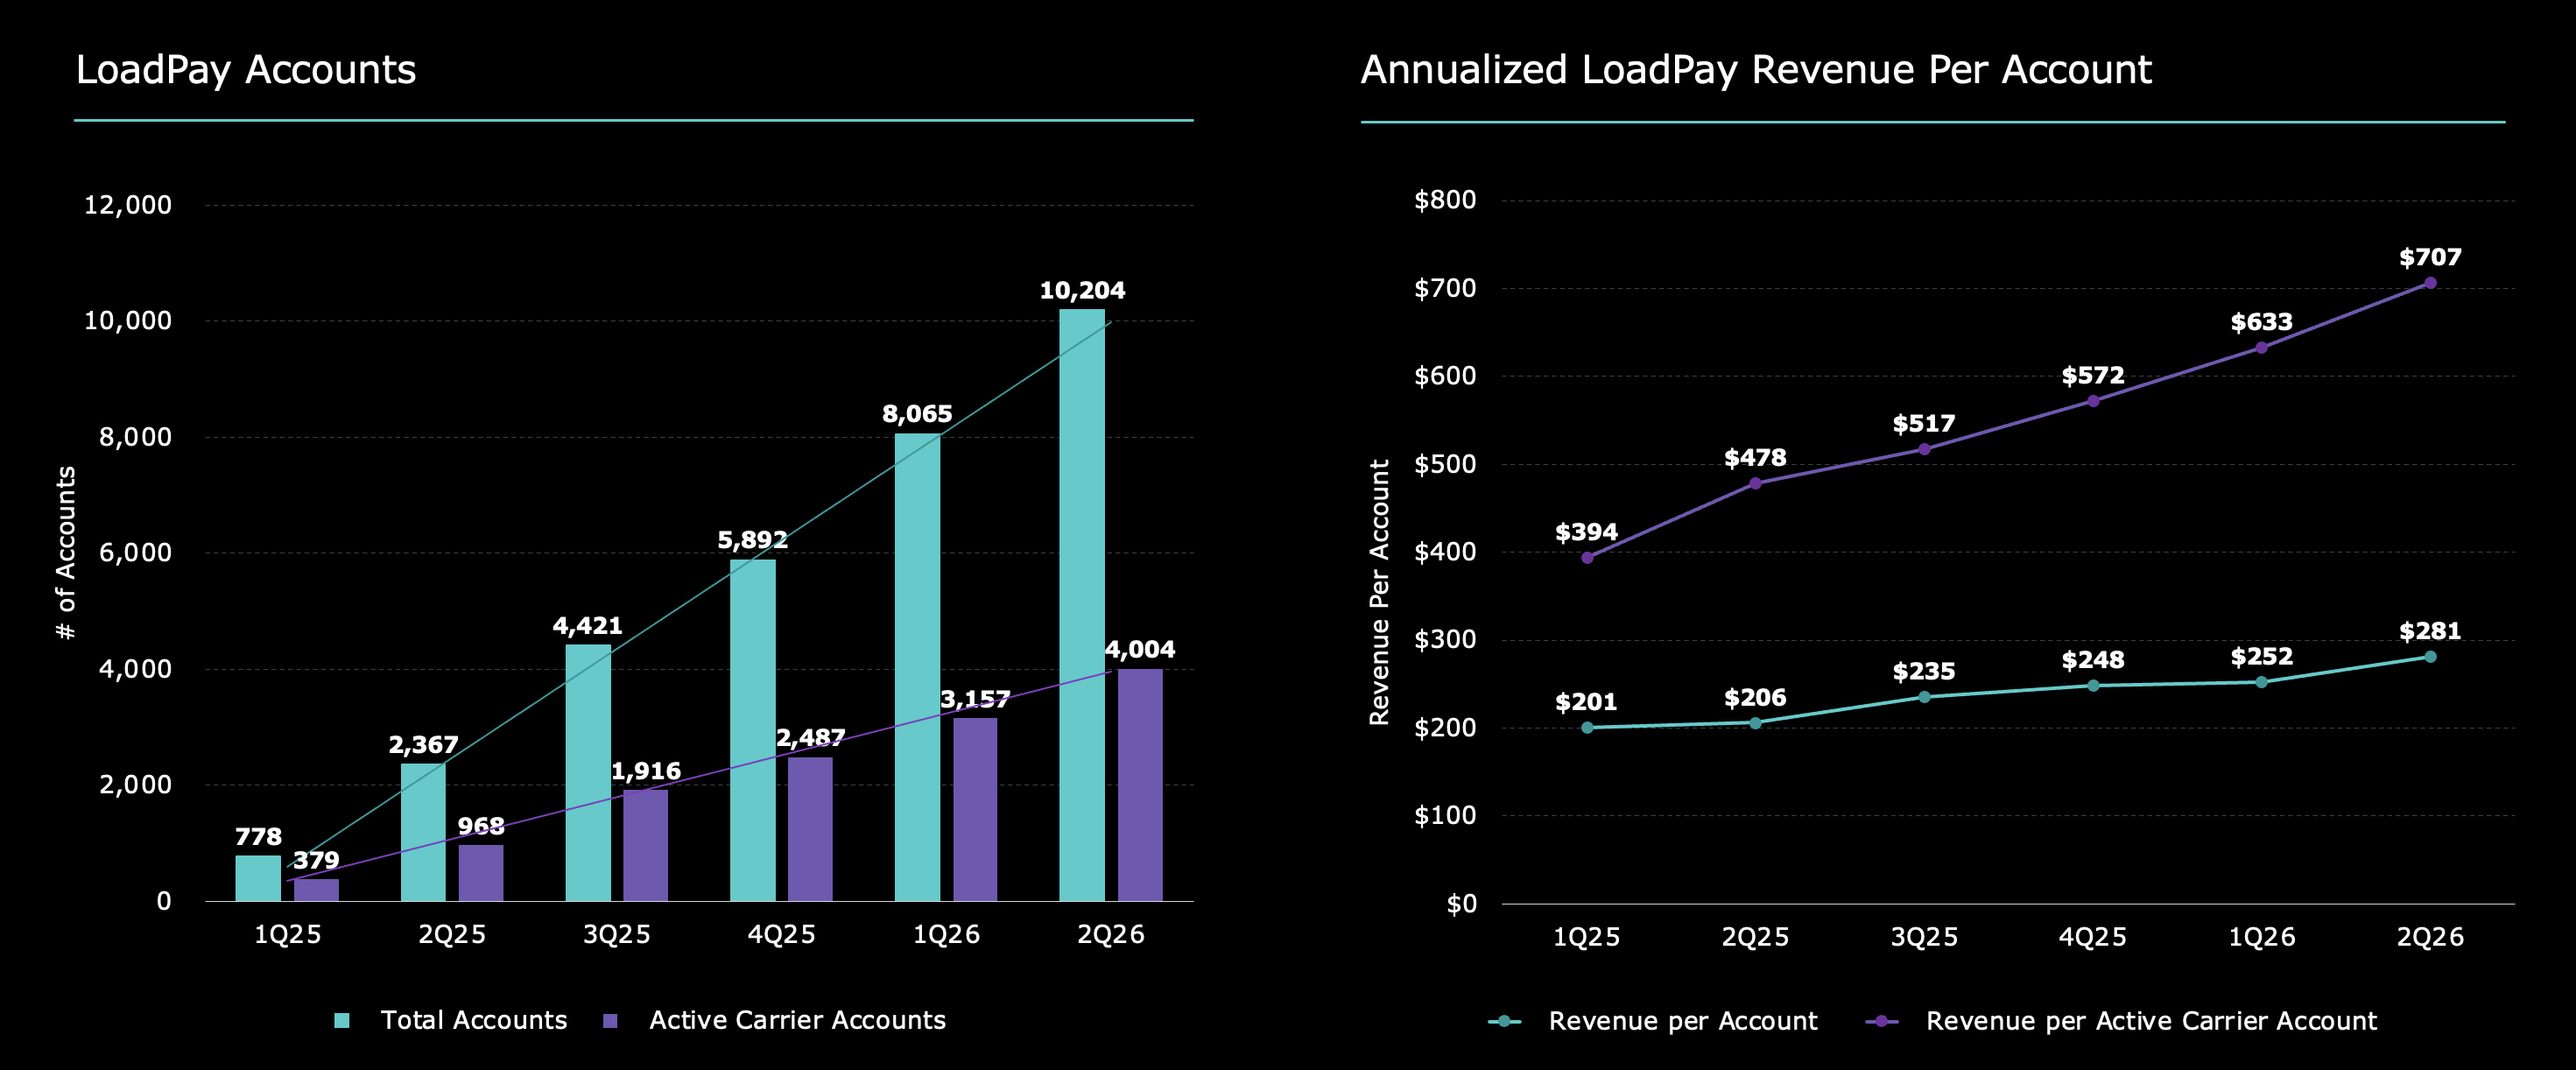
Gross revenue was $652 thousand, annualized revenue per account was $281, and annualized revenue per active carrier account was $707. As a reminder, our target annual revenue for active carrier accounts is $750. For the quarter, the percentage of active carrier accounts was 39.2% of all accounts, and the total number of accounts was 10,204. In the chart below, we graphically highlight these elements over the last six quarters.
At the end of Q2, we introduced the ability for carriers to complete their factoring workflows in LoadPay, enabling customers to get more work done in a single web or mobile application. This is a major step in product advancement with more to come as we continue to embed our industry-leading carrier solutions within LoadPay, including document management, insurance, equipment finance, factoring, and payments to deliver a superior carrier experience.
Factoring
1.Analysis of Financial and Operational Performance for the Quarter
2.Carrier Health and the Effects of Size
Analysis of Financial and Operational Performance for the Quarter. The Factoring segment delivered pretax operating income of $20.9 million. Revenue increased 26.9% QoQ, and pretax operating margin was 39.4%, which is just shy of our North Star target. To prevent unnecessary confusion, let me be clear that we intend the target as more of a floor than a ceiling for all our North Star metrics.
Total purchased volume reached $4.1 billion for the quarter, a 26.2% increase over 1Q26, and 43.3% over the same quarter in 2025. Beyond those impressive headlines, I am very encouraged that our Factoring invoice volumes increased 10.2% YoY, demonstrating continued success in attracting and retaining carriers in a market with flat demand. During 2Q, the average transportation invoice was $2,160 – up $263 from 1Q, and $497 higher than 2Q25.
5
June 30, 2026
March 31, 2026
December 31, 2025
September 30, 2025
June 30, 2025
Current Quarter Q/Q
Current Year Y/Y
For the Qtr Ending
Change
% Change
Change
% Change
Factoring:
Invoice Volume
1,870,938
1,683,160
1,744,811
1,735,860
1,697,851
187,778
11.2
%
173,087
10.2
%
Purchased Volume
$
4,117,210,000
$
3,262,610,000
$
3,119,443,000
$
2,997,895,000
$
2,873,659,000
$
854,600,000
26.2
%
$
1,243,551,000
43.3
%
Average Transportation Invoice Size
$
2,160
$
1,897
$
1,751
$
1,690
$
1,663
$
263
13.9
%
$
497
29.9
%
Invoices / Client
243
226
241
236
232
17
7.5
%
11
4.7
%
Discount Rate
1.29
%
1.28
%
1.28
%
1.29
%
1.37
%
0.01
%
0.8
%
(0.08)
%
(5.8)
%
Avg Daily Purchases*
$
65,353,000
$
53,485,000
$
50,314,000
$
46,842,000
$
45,614,000
11,868,000
22.2
%
19,739,000
43.3
%
# of Customers
7,705
7,436
7,241
7,355
7,319
269
3.6
%
386
5.3
%
PAR
1.20
1.19
1.17
1.16
1.12
0.01
0.8
%
0.08
7.1
%
Operating Margin
39.39
%
34.72
%
32.61
%
20.71
%
48.46
%
4.67
%
13.5
%
(9.07)
%
(18.7)
%
*calculated using number of working days
Carrier Health and the Effects of Size. Factoring was our original transportation business and one of the clearest beneficiaries of the current freight environment. Each quarter, we evaluate this business through the metrics of purchased volume, average invoice size, client growth, credit performance, margin, and the extent to which it contributes to our broader liquidity solutions strategy.
Our Factoring portfolio continues to reflect the different utilization between larger (>7 trucks) and smaller (≤7 trucks) carrier cohorts. In 2Q, larger carriers represented 75% of invoice volume, while making up only 15% of client count. By contrast, small carriers continue to represent the largest number of our client relationships (~85%). YoY, small carrier purchase volume declined 1.21%, and invoice volume declined 2.49%, even as client count increased in this cohort. Small carriers remain under pressure in our opinion. There are several reasons for this, including the recent SCOTUS Montgomery decision on broker liability among them. A healthy market should not simply transfer distress from one vertical to another; it should allow law-abiding carriers with safe operating records of any size to earn their cost of capital.
Industry observers might find it interesting that the average age of operating authority across our carrier portfolio is approximately 43 months. Smaller carriers average 38.9 months, and larger carriers average 45 months.
Based upon the composition of our Factoring portfolio, we estimate that 65% of our exposure comes from the spot market, with the remaining 35% from the contract market. This reflects the portfolio’s broker-heavy debtor mix, with brokers representing approximately 72% of our accounts receivable. While not all broker freight is spot freight, the portfolio is meaningfully more sensitive to spot market conditions than a shipper direct portfolio.
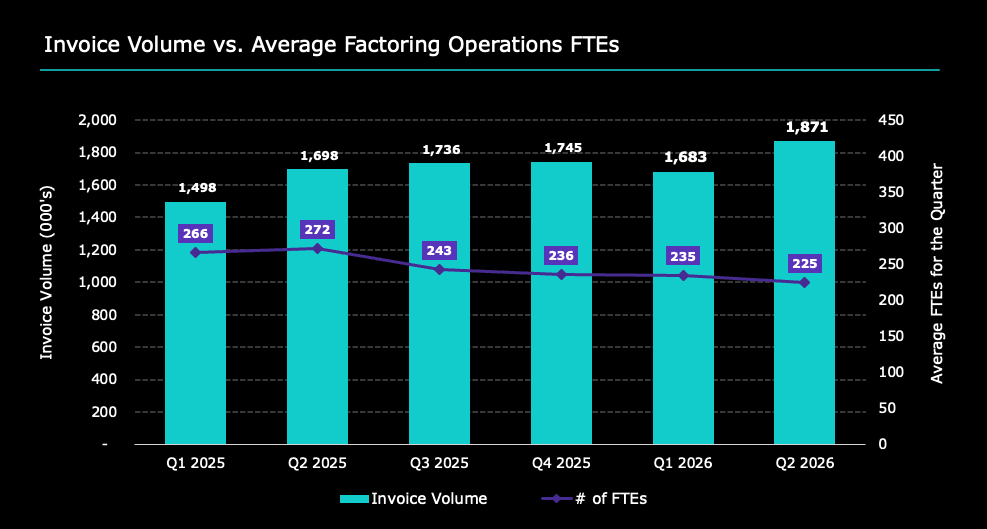
Last quarter, we introduced a chart comparing back-office FTEs with the number of invoices purchased. The purpose of the chart is to highlight meaningful efficiency gains from our technology investments in Factoring. We expect that trend to continue.
6
Intelligence & Freight Market Update
1.Analysis of Financial and Operational Performance for the Quarter
2.New Intelligence Products
3.Introducing Triumph Freight Transaction Indices
4.Freight Market Update: Structural Reset or Cyclical Recovery
Analysis of Financial and Operational Performance for the Quarter. Intelligence delivered a mixed quarter, with stable reported revenue, continued high gross margins, and improved new-logo activity, offset by customer churn and lower ARR exiting June. Total revenue was flat QoQ at $2.4 million, while gross margin remained strong at ~85%. We remain optimistic about the revenue and margin trajectory for this business in 2026 and beyond even as we acknowledge the uneven start.
June 30, 2026
March 31, 2026
December 31, 2025
September 30, 2025
June 30, 2025
Current Quarter Q/Q
Current Year Y/Y
For the Qtr Ending
Change
% Change
Change
% Change
Intelligence:
Total Revenue*
$
2,389,000
$
2,397,000
$
2,347,000
$
2,338,000
$
1,724,000
$
(8,000)
(0.3)
%
$
665,000
38.6
%
EBITDA Margin
(81.7)
%
(68.7)
%
(42.2)
%
(94.6)
%
n/m
(13.0)
%
n/m
n/m
n/m
*2Q25 represents a partial period related to the timing of the acquired business.
In addition to the opportunity for high margin and durable segment revenue, Intelligence is also strategically important to Triumph’s value chain. Our customers and prospects regularly express interest in the output of our data as they seek to improve their competitive position. We are fine-tuning our products to meet these inquiries – in general, our objective is to convert transactional data into high-impact decision tools for the market.
New Intelligence Products. On the topic of delivering decisioning tools, we have expanded the Triumph Intelligence platform with the launch of RFP Manager and Capacity Intelligence. We built both offerings on the unique data advantage created by the Triumph Network, and both reflect our strategy of turning transportation data into practical workflows which improve execution, protect margins, and create measurable customer value.
RFP Manager transforms what has traditionally been a manual, spreadsheet-driven process into a structured workflow for contract freight procurement. The product combines long-term pricing intelligence, broker-specific buying patterns, and real freight transaction data to help customers evaluate opportunities faster, price with greater confidence, and improve consistency across contract bids. By bringing workflow management and predictive pricing intelligence together in a single solution, RFP Manager helps brokers move from fragmented processes to more disciplined and data-driven contract pricing.
During the quarter, we also launched Capacity Intelligence, a strategic capacity management solution that helps brokers build more reliable and profitable carrier networks. Rather than focusing on transactional freight coverage, Capacity Intelligence helps customers identify high-value lanes, uncover the most relevant carrier relationships, and manage carrier outreach and bidding activities within a repeatable workflow. By combining a broker’s own operating history with performance signals and capacity insights derived from the Triumph Network, the product enables customers to move beyond one-off carrier transactions and build more durable, relationship-driven capacity strategies.
The launch of RFP Manager and Capacity Intelligence represents the next of several steps in our strategy to transform Triumph’s transportation data assets into actionable intelligence. As we continue to expand the ways customers can leverage insights from the Triumph Network, we are also creating new tools which provide broader visibility into freight market conditions and trends. This next evolution extends beyond workflow and decision support, establishing a foundation for market intelligence built on real freight transactions at scale.
Introduction to Triumph Freight Market Indices. In addition to new products, we are also introducing an initial set of Triumph Freight Market Indices during 3Q. We designed these indices to provide a transaction-backed view of freight market conditions. These are:
•Triumph Broker Buy Rate Index – Measures the changes in the rate-per-mile for linehaul and fuel for long-haul trucking rates by transport type.
•Triumph Broker Margin Index – Measures the average gross margin percent across all shipments by transport type.
•Triumph Truckload Market Volume Index – Measures the change in total monthly volumes across all shipment types indexed to the first month of the reporting period across all brokers with 13 contributing months of volume.
7
•Triumph Broker Total Margin Index – Measures the change in total gross margin indexed to the first month of the reporting period across all brokers with 13 contributing months of gross margin.
Triumph is in a unique position to produce these insights because of the transaction-level data flowing through our Network. Freight markets remain difficult to interpret because many available indicators are fragmented, lagged, or disconnected from observed transaction activity. By applying a disciplined methodology to this data, Triumph Intelligence can deliver more transparent market signals to clients, partners, and market participants while creating additional long-term value from Triumph’s platform.
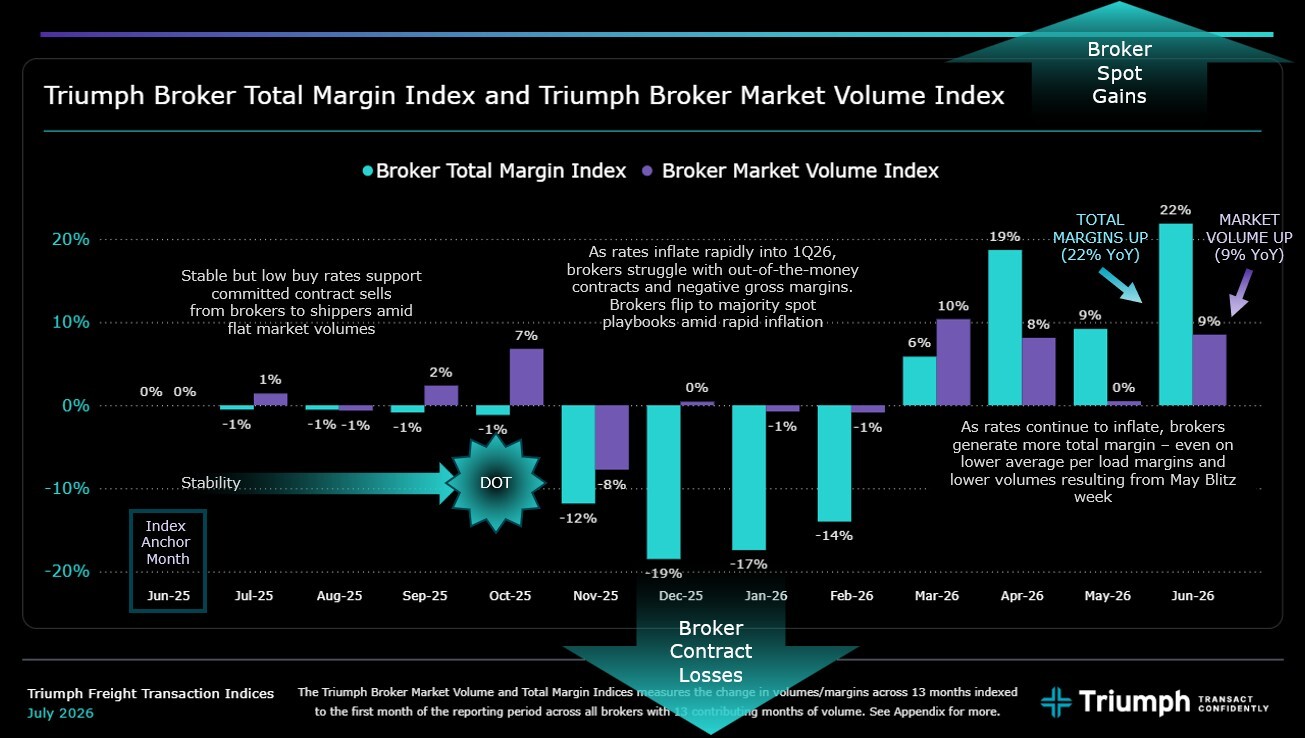
The June 2026 Triumph Broker Total Margin and Triumph Truckload Market Volume Indices are worth highlighting here because they reveal information that is very hard to get elsewhere. These indices measure changes in shipment volume and total broker gross margin dollars across a set of brokers, reducing noise from changes in network composition and allowing us to observe underlying market trends more directly. Importantly, the Triumph Broker Total Margin Index measures total gross margin dollars, not simply margin percentage per load, providing a broader view of broker earnings power across the market.
In June, year-over-year comparisons showed a 9% increase in shipment volume and a 22% increase in total gross margin, exceeding what many industry observers predicted following the Montgomery ruling. Recent DOT enforcement actions, which began in 4Q25, appear to be contributing to changes in shipper route guides and broader routing behavior. These changes may be creating a cascading market effect: higher tender rejections, more spot opportunities for brokers, and more frequent renegotiation of contract rates directly with carriers. While average per-load margins remained below typical levels in June (at 10% to 12% across transport types), rising buy-rate inflation and higher shipment volumes contributed to stronger total gross margin dollars.
Freight Market Update: Structural Reset or Cyclical Recovery? The central question in freight today is whether the changes we are seeing are cyclical, structural, or some combination of both. We believe the answer is both, which is usually the convenient or intelligent sounding choice, but seems to actually be true here. Traditional cyclical forces will always affect trucking; however, supply-side factors are meaningfully shaping the current environment.
To that end, several enforcement-related developments have reduced the amount of capacity in the market. These include greater scrutiny of non-domiciled capacity, more consistent enforcement of cabotage rules, and increased attention on electronic logging devices (ELDs) which may be vulnerable to manipulation. These issues matter because they affect more than price. They influence highway safety, fair competition, insurance risk, supply chain integrity, and the ability of
8
brokers and shippers to verify that compliant and law-abiding carriers are moving their freight. Importantly, while new legislation is being discussed, much of this activity does not appear to reflect the creation of new rules, but rather the more consistent enforcement of rules that already exist.
The post-Montgomery environment may be creating an equally important structural change: a higher standard of care around carrier selection, documentation, insurance, and operating history. In this environment, carriers with unsafe operating records, incomplete backgrounds, unverifiable identities, or inadequate insurance are likely to face greater difficulty accessing freight. Conversely, carriers with safe operations, verifiable identities, proper insurance, and strong compliance practices are better positioned to compete and earn sustainable returns. While this transition may create friction in the near term, we believe it is healthy for the industry.
These changes are affecting market participants differently. Capacity continues to leave parts of the market, but midsized fleets with established compliance and safety programs appear to be benefiting from the shift. Smaller carriers with strong documentation, verifiable identities, and sound safety records can still compete effectively, although conditions remain uneven across regions and customer segments. Brokers, meanwhile, continue to face margin pressure as buy rates rise and compliance expectations increase. Larger brokers may be better equipped to manage the operational burden of carrier vetting, documentation, and reasonableness standards, while smaller brokers may face greater pressure as shippers reassess risk and liability across their routing decisions.
The likely result is a more expensive but more disciplined freight market. Compliance, insurance, safety, technology, and operating costs are all moving higher, and those increases are inflationary. While cyclical forces will continue to matter, enforcement, regulation, legislation, litigation risk, insurance standards, and supply chain integrity are also reframing how shippers and brokers evaluate and use capacity. That is why we believe market tightness may prove more durable than a typical cyclical upswing.
Banking
1.Analysis of Financial and Operational Performance for the Quarter
2.Update on Credit Metrics
Analysis of Financial and Operational Performance for the Quarter. Banking segment operating income was flat from the prior quarter, and pre-provision net revenue improved by $2.0 million.
During the quarter, we added $600 million of new servicing deposits from mortgage warehouse clients, continuing the growth we saw in the first quarter. As a result of these deposits, cash balances increased, and wholesale funding such as FHLB advances and brokered deposits declined again. Investors may notice that our reported interest expense this quarter ticked up materially from the prior quarter – this is the direct result of the recent growth in these warehouse deposits. Given their structure, we report these deposits as noninterest bearing deposits on our balance sheet. Despite that classification, they are not free of cost as we compensate our clients for these balances in the form of an earnings interest rebate rather than deposit interest. Because the recent influx of these deposits has resulted in some clients with much higher deposit balances than loan balances, we are now in some cases paying out much more in rebates than we earn in interest on a given client’s loans. In these cases, we are recording that excess rebate as interest expense. In 2Q, those excess rebates resulted in about $12.3 million of interest expense. Whether recorded as interest expense or an offset to interest income, the effect on net interest income is the same: these are profitable funds as they displace more expensive wholesale funding, and we can invest them risk-free above their cost.
Update on Credit Metrics. The metrics reflect credit exposure work tied to some of the business lines we are exiting, as well as normal-course credit noise. We continue to monitor the bankruptcy proceedings related to our Tricolor ABL exposure, and we continue to believe that our loan position is adequately secured by inventory and other assets that serve as our collateral.
•Total non-performing loans to total loans: decreased by 0.12% to 1.65%.
•Total classified assets: decreased by ~$15 million to $169 million.
•Past due to total loans: decreased by 0.16% to 2.19%.
Notable Items, Expense Forecast, and Closing Thoughts
As noted in the opening remarks, there were a few non-core items that impacted our 2Q26 financial results. In aggregate, these items reduced our pretax earnings for the quarter by $3.8 million and EPS by approximately $0.13. They include the following.
9
•During the quarter, we recorded a $1.9 million net loss on the disposal of premises and equipment, driven by a valuation adjustment on the real estate of an unprofitable branch we are in the process of closing and a terminated prepaid maintenance agreement.
•Offsetting this, we received a $1.8 million payment tied to a change in control provision on the sale of an unrelated third-party business. We recorded this gain in other noninterest income.
•We recorded $1.7 million in severance expenses during the quarter largely in continuation of ongoing efficiency efforts.
•During the quarter, we recorded $2.0 million in consulting expense related to our ongoing efficiency initiatives, which we do not expect to be recurring. As a result of these initiatives, we experienced $1.8 million in savings in our Communication & Technology expenses for the quarter. We expect this quarterly savings to be ongoing.
As we continue our work to become more efficient, we run into market realities. Based on relatively extraordinary sales growth, our variable compensation costs will come in higher than forecast. As a result, we expect to exit 2026 at a $98 million run rate versus our previously forecasted $96.5 million. We can cut other places to hit the mark, but we believe that would be short-sighted considering all the positive momentum and opportunities in front of us.
I have one other caveat to add to the expense run rate discussion. That $98 million number is our base case scenario, which assumes that we will pay annual incentive targets at 100%. If present trends continue, it is probable that for the first time in several years our annual incentive program pays above target. The annual incentive program is a company-wide program, with most of the dollars going to non-executive team members. We estimate the pre-tax earnings impact of the additional accrual would be $6 million for the back half of the year (i.e., $3 million per quarter). This is directional information for the benefit of investor and analyst models; it is not a final or specific forecast because unforeseeable things happen, both positive and negative, either of which will affect the final number. Given that this is a variable item related to annual targets set prior to the freight recovery, we would not anticipate this level of elevated annual incentive expense to continue into 2027 unless our performance materially outperforms the new annual targets approved by the board.
For 3Q, we expect core expenses to be approximately $99 million, excluding any incremental annual incentive accrual discussed above.
We have consistently said that revenue must grow faster than expenses, and that remains the framework. We will have more to say about our 2027 objectives and full-year expense guidance later this year. We expect to continue our investments in product and sales, offset by improving operational efficiencies.
Thank you for your interest in Triumph. We will face good markets and bad markets, and that means continually investing to improve our value chain while we pursue ever greater efficiency. That is the plan, and we will stick to the plan.
With warm regards,
Aaron P. Graft
Founder, Vice Chairman and CEO
[1] To preempt distracting comparisons of Factoring ROAA between 2021 and 2026, we would remind investors that Fed funds were 3.5% lower in 2021 than today and that the cumulative effects of inflation means that a $2,195 invoice then is roughly equivalent to a $2,650 invoice at present.
[2] We define Network engagement as the amount of freight touched through our payments, audit, full AP automation and rate intelligence products. It is an indicator of our broker volume density in the market, the source for growing available Network transactions and data assets, and a key value driver of the Network.
10
Conference Call Information
Aaron P. Graft, Vice Chairman and CEO, and Brad Voss, CFO, will review the financial results in a conference call with investors and analysts beginning at 9:30 a.m. central time on Wednesday, July 22, 2026.
The live video conference may be accessed directly through this link, https://triumph-financial-q2-2026-earnings.open-exchange.net or via the Company's IR website at ir.triumph.io through the Financial Results link. An archive of this video conference will subsequently be available at the same location, referenced above, on the Company’s website.
About Triumph Financial
Triumph (NYSE: TFIN) is a transportation-focused financial and technology company that delivers payments, factoring, banking, and intelligence solutions designed to simplify and modernize freight transactions for brokers, carriers, shippers and factors. The company develops technology and financial products that improve operational efficiency, increase transparency and security in transactions, and expand access to working capital across the transportation industry. Headquartered in Dallas, Texas, Triumph’s portfolio includes Triumph, LoadPay and TBK Bank. Learn more at ir.triumph.io.
Forward-Looking Statements
This letter to shareholders contains forward-looking statements. Any statements about our expectations, beliefs, plans, predictions, forecasts, objectives, assumptions or future events or performance are not historical facts and may be forward-looking. You can identify forward-looking statements by the use of forward-looking terminology such as “believes,” “expects,” “could,” “may,” “will,” “should,” “seeks,” “likely,” “intends,” “plans,” “pro forma,” “projects,” “estimates” or “anticipates” or the negative of these words and phrases or similar words or phrases that are predictions of or indicate future events or trends and that do not relate solely to historical matters. You can also identify forward-looking statements by discussions of strategy, plans or intentions. Forward-looking statements involve numerous risks and uncertainties, and you should not rely on them as predictions of future events. Forward-looking statements depend on assumptions, data or methods that may be incorrect or imprecise and we may not be able to realize them. We do not guarantee that the transactions and events described will happen as described (or that they will happen at all). The following factors, among others, could cause actual results and future events to differ materially from those set forth or contemplated in the forward-looking statements: business and economic conditions generally and in the bank and non-bank financial services industries, nationally and within our local market areas; our ability to mitigate our risk exposures; our ability to maintain our historical earnings trends; changes in management personnel; interest rate risk; concentration of our products and services in the transportation industry; credit risk associated with our loan portfolio; lack of seasoning in our loan portfolio; deteriorating asset quality and higher loan charge-offs; time and effort necessary to resolve non-performing assets; inaccuracy of the assumptions and estimates we make in establishing reserves for probable loan losses and other estimates; risks related to the integration of acquired businesses, including our acquisition of Greenscreens, and any future acquisitions; our ability to successfully identify and address the risks associated with our possible future acquisitions, and the risks that our prior and possible future acquisitions make it more difficult for investors to evaluate our business, financial condition and results of operations, and impairs our ability to accurately forecast our future performance; lack of liquidity; fluctuations in the fair value and liquidity of the securities we hold for sale; impairment of investment securities, goodwill, other intangible assets or deferred tax assets; our risk management strategies; environmental liability associated with our lending activities; increased competition in the bank and non-bank financial services industries, nationally, regionally or locally, which may adversely affect pricing and terms; the accuracy of our financial statements and related disclosures; material weaknesses in our internal control over financial reporting; system failures or failures to prevent breaches of our network security; the institution and outcome of litigation and other legal proceedings against us or to which we become subject; changes in carry-forwards of net operating losses; changes in federal tax law or policy; the impact of recent and future legislative and regulatory changes, including changes in banking, securities and tax laws and regulations, such as the Dodd-Frank Act and their application by our regulators as well as privacy, cybersecurity, and artificial intelligence regulation and oversight; governmental monetary and fiscal policies; changes in the scope and cost of FDIC, insurance and other coverages; failure to receive regulatory approval for future acquisitions and increases in our capital requirements.
11
While forward-looking statements reflect our good-faith beliefs, they are not guarantees of future performance. All forward-looking statements are necessarily only estimates of future results. Accordingly, actual results may differ materially from those expressed in or contemplated by the particular forward-looking statement, and, therefore, you are cautioned not to place undue reliance on such statements. Further, any forward-looking statement speaks only as of the date on which it is made, and we undertake no obligation to update any forward-looking statement to reflect events or circumstances after the date on which the statement is made or to reflect the occurrence of unanticipated events or circumstances, except as required by applicable law. For a discussion of such risks and uncertainties, which could cause actual results to differ from those contained in the forward-looking statements, see "Risk Factors" and the forward-looking statement disclosure contained in Triumph Financial’s Annual Report on Form 10-K, filed with the Securities and Exchange Commission on February 11, 2026.
Non-GAAP Financial Measures
This letter to shareholders includes certain non‐GAAP financial measures intended to supplement, not substitute for, comparable GAAP measures. Reconciliations of non‐GAAP financial measures to GAAP financial measures are provided at the end of this letter to shareholders.
12
The following table sets forth key metrics used by Triumph Financial to monitor our operations. Footnotes in this table can be found in our definitions of non-GAAP financial measures at the end of this document.
As of and for the Three Months Ended
As of and for the Six Months Ended
(Dollars in thousands)
June 30, 2026
March 31, 2026
December 31, 2025
September 30, 2025
June 30, 2025
June 30, 2026
June 30, 2025
Financial Highlights:
Total assets
$
7,403,685
$
6,876,715
$
6,380,588
$
6,357,149
$
6,494,748
$
7,403,685
$
6,494,748
Loans held for investment
$
5,477,091
$
5,189,139
$
4,991,307
$
4,986,922
$
4,953,170
$
5,477,091
$
4,953,170
Deposits
$
6,217,389
$
5,699,939
$
4,950,216
$
4,955,246
$
5,186,098
$
6,217,389
$
5,186,098
Net income available to common stockholders
$
10,568
$
5,554
$
18,412
$
907
$
3,618
$
16,122
$
2,834
Performance Ratios - Annualized:
Return on average assets
0.63
%
0.39
%
1.18
%
0.11
%
0.28
%
0.52
%
0.14
%
Return on average total equity
4.71
%
2.71
%
8.14
%
0.73
%
1.95
%
3.72
%
0.99
%
Return on average common equity
4.59
%
2.48
%
8.19
%
0.41
%
1.68
%
3.55
%
0.66
%
Return on average tangible common equity (1)
8.09
%
4.46
%
15.00
%
0.76
%
2.81
%
6.32
%
1.02
%
Yield on loans
8.56
%
7.72
%
8.14
%
8.17
%
8.41
%
8.16
%
8.39
%
Cost of interest bearing deposits
3.84
%
2.07
%
2.28
%
2.36
%
2.22
%
2.92
%
2.18
%
Cost of total deposits
1.58
%
1.07
%
1.29
%
1.35
%
1.25
%
1.35
%
1.24
%
Cost of total funds
1.66
%
1.22
%
1.48
%
1.55
%
1.53
%
1.45
%
1.49
%
Net interest margin
6.15
%
6.06
%
6.36
%
6.29
%
6.43
%
6.11
%
6.46
%
Net noninterest expense to average assets(1)
4.43
%
4.85
%
4.16
%
5.08
%
5.13
%
4.63
%
5.36
%
Asset Quality:(2)
Past due to total loans
2.19
%
2.35
%
2.72
%
1.91
%
2.21
%
2.19
%
2.21
%
Non-performing loans to total loans
1.65
%
1.77
%
1.15
%
1.36
%
1.20
%
1.65
%
1.20
%
Non-performing assets to total assets
1.29
%
1.53
%
1.10
%
1.10
%
1.04
%
1.29
%
1.04
%
ACL to non-performing loans
38.43
%
37.15
%
63.44
%
49.53
%
65.02
%
38.43
%
65.02
%
ACL to total loans
0.64
%
0.66
%
0.73
%
0.67
%
0.78
%
0.64
%
0.78
%
Net charge-offs to average loans
0.03
%
0.04
%
(0.10
%)
0.19
%
0.17
%
0.07
%
0.30
%
Capital:
Tier 1 capital to average assets(3)
9.15
%
9.90
%
9.86
%
9.55
%
9.46
%
9.15
%
9.46
%
Tier 1 capital to risk-weighted assets(3)
10.47
%
10.68
%
10.74
%
10.20
%
9.98
%
10.47
%
9.98
%
Common equity tier 1 capital to risk-weighted assets(3)
9.00
%
9.14
%
9.16
%
8.65
%
8.43
%
9.00
%
8.43
%
Total capital to risk-weighted assets(3)
12.28
%
12.56
%
12.71
%
12.09
%
11.95
%
12.28
%
11.95
%
Total equity to total assets
13.01
%
13.83
%
14.76
%
14.46
%
14.05
%
13.01
%
14.05
%
Tangible common stockholders' equity to tangible assets(1)
7.42
%
7.80
%
8.26
%
7.87
%
7.53
%
7.42
%
7.53
%
Per Share Amounts:
Book value per share
$
38.43
$
38.05
$
37.73
$
36.79
$
36.56
$
38.43
$
36.56
Tangible book value per share (1)
$
21.76
$
21.21
$
20.77
$
19.70
$
19.31
$
21.76
$
19.31
Basic earnings per common share
$
0.44
$
0.23
$
0.77
$
0.04
$
0.15
$
0.68
$
0.12
Diluted earnings per common share
$
0.44
$
0.23
$
0.77
$
0.04
$
0.15
$
0.67
$
0.12
Shares outstanding end of period
23,894,537
23,806,253
23,765,385
23,763,401
23,727,046
23,894,537
23,727,046
13
Unaudited consolidated balance sheet as of:
(Dollars in thousands)
June 30, 2026
March 31, 2026
December 31, 2025
September 30, 2025
June 30, 2025
ASSETS
Total cash and cash equivalents
$
896,811
$
581,939
$
248,471
$
147,222
$
282,346
Equity securities with readily determinable fair value
4,540
4,559
4,588
4,569
4,526
Securities - available for sale
268,118
339,562
364,277
378,088
392,275
Securities - held to maturity, net
977
1,031
1,550
1,766
1,782
Loans held for sale
1,405
2,495
459
9,741
6,066
Loans held for investment
5,477,091
5,189,139
4,991,307
4,986,922
4,953,170
Allowance for credit losses
(34,783)
(34,157)
(36,511)
(33,549)
(38,691)
Loans, net
5,442,308
5,154,982
4,954,796
4,953,373
4,914,479
FHLB and other restricted stock
3,171
4,366
14,253
14,092
13,339
Premises and equipment, net
85,968
89,492
91,071
141,141
149,120
Capitalized software, net
49,873
48,322
46,370
44,934
43,011
Goodwill
355,296
355,296
355,296
353,898
353,900
Intangible assets, net
42,925
45,372
47,888
52,291
55,265
Bank-owned life insurance
65,302
65,406
64,887
64,338
63,787
Deferred tax asset, net
—
—
181
—
3,023
Other assets
186,991
183,893
186,501
191,696
211,829
Total assets
$
7,403,685
$
6,876,715
$
6,380,588
$
6,357,149
$
6,494,748
LIABILITIES
Noninterest bearing deposits
$
3,780,765
$
3,042,210
$
1,901,638
$
2,095,017
$
2,285,327
Interest bearing deposits
2,436,624
2,657,729
3,048,578
2,860,229
2,900,771
Total deposits
6,217,389
5,699,939
4,950,216
4,955,246
5,186,098
Federal Home Loan Bank advances
—
30,000
280,000
280,000
180,000
Subordinated notes
69,979
69,929
69,879
69,829
69,780
Junior subordinated debentures
43,321
43,154
42,991
42,829
42,666
Deferred tax liabilities, net
7,187
4,454
—
687
—
Other liabilities
102,546
78,524
95,731
89,225
103,822
Total liabilities
6,440,422
5,926,000
5,438,817
5,437,816
5,582,366
EQUITY
Preferred Stock
45,000
45,000
45,000
45,000
45,000
Common stock
297
296
295
295
295
Additional paid-in-capital
605,940
601,832
597,466
593,624
588,302
Treasury stock, at cost
(272,840)
(270,711)
(270,619)
(270,619)
(270,619)
Retained earnings
587,490
576,922
571,368
552,956
552,049
Accumulated other comprehensive income (loss)
(2,624)
(2,624)
(1,739)
(1,923)
(2,645)
Total stockholders' equity
963,263
950,715
941,771
919,333
912,382
Total liabilities and equity
$
7,403,685
$
6,876,715
$
6,380,588
$
6,357,149
$
6,494,748
14
Unaudited consolidated statement of income:
For the Three Months Ended
For the Six Months Ended
(Dollars in thousands)
June 30, 2026
March 31, 2026
December 31, 2025
September 30, 2025
June 30, 2025
June 30, 2026
June 30, 2025
Interest income:
Loans, including fees
$
53,592
$
47,656
$
55,233
$
56,400
$
54,836
$
101,248
$
108,412
Factored receivables, including fees
58,958
46,021
46,165
43,841
44,217
104,979
82,911
Securities
3,904
4,540
5,083
5,489
5,721
8,444
11,029
FHLB and other stock
146
272
969
223
246
418
495
Cash deposits
7,937
4,266
2,606
2,987
4,181
12,203
8,624
Total interest income
124,537
102,755
110,056
108,940
109,201
227,292
211,471
Interest expense:
Deposits
24,027
14,052
16,639
17,532
15,505
38,079
29,902
Subordinated notes
663
662
662
661
661
1,325
1,343
Junior subordinated debentures
965
954
1,007
1,049
1,035
1,919
2,029
Other borrowings
56
993
2,054
1,865
3,322
1,049
5,136
Total interest expense
25,711
16,661
20,362
21,107
20,523
42,372
38,410
Net interest income
98,826
86,094
89,694
87,833
88,678
184,920
173,061
Credit loss expense (benefit)
2,736
(607)
(1,764)
4,284
(702)
2,129
628
Net interest income after credit loss expense (benefit)
96,090
86,701
91,458
83,549
89,380
182,791
172,433
Noninterest income:
Service charges on deposits
1,798
1,212
1,483
1,847
1,742
3,010
3,338
Card income
2,129
1,960
1,935
1,968
1,922
4,089
3,719
Net gains (losses) on sale of loans
100
87
71
119
190
187
324
Net gains (losses) on disposal of premises and equipment
(1,779)
606
14,265
(3)
(218)
(1,173)
628
Fee income
15,527
13,735
13,478
14,305
12,755
29,262
21,869
Insurance commissions
1,006
1,111
(496)
1,481
1,282
2,117
2,532
Other
2,634
996
(346)
1,731
1,711
3,630
4,164
Total noninterest income
21,415
19,707
30,390
21,448
19,384
41,122
36,574
Noninterest expense:
Salaries and employee benefits
60,087
58,168
55,086
60,192
59,882
118,255
118,600
Occupancy, furniture and equipment
6,364
6,501
7,431
7,862
8,139
12,865
16,581
FDIC insurance and other regulatory assessments
1,167
1,058
1,337
1,468
894
2,225
1,621
Professional fees
7,089
4,763
4,286
5,228
(320)
11,852
5,744
Amortization of intangible assets
2,486
2,516
2,826
2,956
3,400
5,002
5,800
Advertising and promotion
1,405
1,212
1,689
2,209
1,838
2,617
3,302
Communications and technology
11,950
13,119
12,911
12,295
12,315
25,069
24,559
Software amortization
3,477
3,300
3,081
2,868
2,865
6,777
4,857
Travel and entertainment
1,208
1,520
1,147
1,043
1,619
2,728
3,111
Other
6,401
6,104
8,340
7,593
10,208
12,505
16,838
Total noninterest expense
101,634
98,261
98,134
103,714
100,840
199,895
201,013
Net income before income tax
15,871
8,147
23,714
1,283
7,924
24,018
7,994
Income tax expense
4,501
1,792
4,500
(425)
3,504
6,293
3,557
Net income
$
11,370
$
6,355
$
19,214
$
1,708
$
4,420
$
17,725
$
4,437
Dividends on preferred stock
(802)
(801)
(802)
(801)
(802)
(1,603)
(1,603)
Net income available to common stockholders
$
10,568
$
5,554
$
18,412
$
907
$
3,618
$
16,122
$
2,834
15
Earnings per share:
For the Three Months Ended
For the Six Months Ended
(Dollars in thousands)
June 30, 2026
March 31, 2026
December 31, 2025
September 30, 2025
June 30, 2025
June 30, 2026
June 30, 2025
Basic
Net income (loss) to common stockholders
$
10,568
$
5,554
$
18,412
$
907
$
3,618
$
16,122
$
2,834
Weighted average common shares outstanding
23,865,432
23,787,051
23,764,954
23,752,331
23,590,119
23,826,458
23,476,888
Basic earnings (loss) per common share
$
0.44
$
0.23
$
0.77
$
0.04
$
0.15
$
0.68
$
0.12
Diluted
Net income (loss) to common stockholders - diluted
$
10,568
$
5,554
$
18,412
$
907
$
3,618
$
16,122
$
2,834
Weighted average common shares outstanding
23,865,432
23,787,051
23,764,954
23,752,331
23,590,119
23,826,458
23,476,888
Dilutive effects of:
Assumed exercises of stock options
55,497
62,027
53,795
59,389
54,952
58,523
67,878
Restricted stock awards
—
—
—
—
16,097
—
30,785
Restricted stock units
101,847
125,664
102,264
90,675
89,156
113,023
124,984
Performance stock units - market based
122,961
61,150
38,245
18,812
17,704
124,493
23,171
Employee stock purchase plan
2,772
263
2,645
3,651
4,627
1,518
4,299
Weighted average shares outstanding - diluted
24,148,509
24,036,155
23,961,903
23,924,858
23,772,655
24,124,015
23,728,005
Diluted earnings (loss) per common share
$
0.44
$
0.23
$
0.77
$
0.04
$
0.15
$
0.67
$
0.12
Shares that were not considered in computing diluted earnings per common share because they were antidilutive or have not met the thresholds to be considered in the dilutive calculation are as follows:
For the Three Months Ended
For the Six Months Ended
June 30, 2026
March 31, 2026
December 31, 2025
September 30, 2025
June 30, 2025
June 30, 2026
June 30, 2025
Stock options
131,024
172,482
177,436
181,647
199,859
190,410
122,151
Restricted stock awards
—
—
—
—
—
—
—
Restricted stock units
—
—
—
—
5,171
—
3,750
Performance stock units - market based
88,187
—
60,840
77,074
56,311
44,337
28,313
Employee stock purchase plan
—
—
—
—
—
—
—
Loans held for investment summarized as of:
(Dollars in thousands)
June 30, 2026
March 31, 2026
December 31, 2025
September 30, 2025
June 30, 2025
Commercial real estate
$
667,520
$
724,923
$
730,435
$
769,314
$
754,509
Construction, land development, land
192,091
206,693
224,214
204,247
221,419
1-4 family residential properties
205,540
187,991
193,508
180,970
172,312
Farmland
42,909
42,666
43,433
43,208
44,069
Commercial
1,160,128
1,112,802
1,163,664
1,144,872
1,132,269
Factored receivables
2,135,878
1,717,808
1,462,900
1,424,631
1,401,377
Consumer
16,715
15,381
16,819
17,235
17,520
Mortgage warehouse
1,056,310
1,180,875
1,156,334
1,202,445
1,209,695
Total loans
$
5,477,091
$
5,189,139
$
4,991,307
$
4,986,922
$
4,953,170
16
Our banking loan portfolio consists of traditional community bank loans as well as commercial finance product lines focused on businesses that require specialized financial solutions and national lending product lines that further diversify our lending operations.
Banking loans held for investment are further summarized below:
(Dollars in thousands)
June 30, 2026
March 31, 2026
December 31, 2025
September 30, 2025
June 30, 2025
Commercial real estate
$
667,520
$
724,923
$
730,435
$
769,314
$
754,509
Construction, land development, land
192,091
206,693
224,214
204,247
221,419
1-4 family residential
205,540
187,991
193,508
180,970
172,312
Farmland
42,909
42,666
43,433
43,208
44,069
Commercial - General
322,969
303,561
313,696
285,571
298,653
Commercial - Agriculture
51,130
44,396
42,588
49,742
48,107
Commercial - Equipment
621,884
583,374
587,926
564,984
543,062
Commercial - Asset-based lending
123,053
138,982
180,012
198,809
192,793
Commercial - Liquid Credit
37,091
38,579
36,482
42,593
47,061
Consumer
16,715
15,381
16,819
17,235
17,520
Mortgage Warehouse
1,056,310
1,180,875
1,156,334
1,202,445
1,209,695
Total banking loans held for investment
$
3,337,212
$
3,467,421
$
3,525,447
$
3,559,118
$
3,549,200
The following table presents the Company’s operating segments:
(Dollars in thousands)
Total
Corporate
Three Months Ended June 30, 2026
Banking
Factoring
Payments
Intelligence
Segments
and Other(1)
Consolidated
Total interest income
$
65,381
$
50,166
$
8,957
$
—
$
124,504
$
33
$
124,537
Intersegment interest allocations
8,405
(10,585)
2,180
—
—
—
—
Total interest expense
24,076
7
—
—
24,083
1,628
25,711
Net interest income (expense)
49,710
39,574
11,137
—
100,421
(1,595)
98,826
Credit loss expense (benefit)
(30)
2,716
155
—
2,841
(105)
2,736
Net interest income after credit loss expense
49,740
36,858
10,982
—
97,580
(1,490)
96,090
Noninterest income
5,331
1,917
10,893
2,389
20,530
885
21,415
Noninterest expense:
Salaries and employee benefits
14,684
12,452
9,771
3,449
40,356
19,731
60,087
Depreciation
1,540
273
156
18
1,987
776
2,763
Other occupancy, furniture and equipment
2,128
463
163
13
2,767
834
3,601
FDIC insurance and other regulatory assessments
1,167
—
—
—
1,167
—
1,167
Professional fees
4,356
436
300
112
5,204
1,885
7,089
Amortization of intangible assets
269
111
812
1,283
2,475
11
2,486
Advertising and promotion
317
383
333
24
1,057
348
1,405
Communications and technology
3,405
2,459
3,106
358
9,328
2,622
11,950
Software amortization
—
1,117
1,932
77
3,126
351
3,477
Travel and entertainment
210
156
219
115
700
508
1,208
Other
2,912
567
1,583
269
5,331
1,070
6,401
Total noninterest expense
30,988
18,417
18,375
5,718
73,498
28,136
101,634
Net intersegment noninterest income (expense)(2)
144
518
(662)
—
—
—
—
Operating income (loss)
$
24,227
$
20,876
$
2,838
$
(3,329)
$
44,612
$
(28,741)
$
15,871
17
(Dollars in thousands)
Total
Corporate
Three Months Ended March 31, 2026
Banking
Factoring
Payments
Intelligence
Segments
and Other(1)
Consolidated
Total interest income
$
56,611
$
38,944
$
7,166
$
—
$
102,721
$
34
$
102,755
Intersegment interest allocations
5,731
(8,219)
2,488
—
—
—
—
Total interest expense
15,039
6
—
—
15,045
1,616
16,661
Net interest income (expense)
47,303
30,719
9,654
—
87,676
(1,582)
86,094
Credit loss expense (benefit)
(2,338)
1,057
197
—
(1,084)
477
(607)
Net interest income after credit loss expense
49,641
29,662
9,457
—
88,760
(2,059)
86,701
Noninterest income
6,158
1,918
9,163
2,397
19,636
71
19,707
Noninterest expense:
Salaries and employee benefits
14,974
11,841
8,774
3,217
38,806
19,362
58,168
Depreciation
1,577
288
176
16
2,057
826
2,883
Other occupancy, furniture and equipment
2,016
496
141
27
2,680
938
3,618
FDIC insurance and other regulatory assessments
1,058
—
—
—
1,058
—
1,058
Professional fees
2,324
277
234
129
2,964
1,799
4,763
Amortization of intangible assets
269
137
817
1,283
2,506
10
2,516
Advertising and promotion
354
261
196
94
905
307
1,212
Communications and technology
5,097
2,320
2,836
359
10,612
2,507
13,119
Software amortization
—
1,070
1,821
58
2,949
351
3,300
Travel and entertainment
229
230
293
146
898
622
1,520
Other
3,444
670
816
71
5,001
1,103
6,104
Total noninterest expense
31,342
17,590
16,104
5,400
70,436
27,825
98,261
Net intersegment noninterest income (expense)(2)
125
515
(640)
—
—
—
—
Operating income (loss)
$
24,582
$
14,505
$
1,876
$
(3,003)
$
37,960
$
(29,813)
$
8,147
(1) Includes revenue and expense from the Company’s holding company, which does not meet the definition of an operating segment. Also includes corporate shared service costs such as the majority of salaries and benefits expense for our executive leadership team, as well as other selling, general, and administrative shared services costs including human resources, accounting, finance, risk management and a significant amount of information technology expense.
(2) Intersegment noninterest income (expense) includes:
(Dollars in thousands)
Banking
Factoring
Payments
Three Months Ended June 30, 2026
Factoring revenue received from Payments
$
—
$
910
$
(910)
Payments revenue received from Factoring
—
(266)
266
Banking revenue received from Payments and Factoring
144
(126)
(18)
Intersegment noninterest income (expense)
$
144
$
518
$
(662)
Three Months Ended March 31, 2026
Factoring revenue received from Payments
$
—
$
911
$
(911)
Payments revenue received from Factoring
—
(287)
287
Banking revenue received from Payments and Factoring
125
(109)
(16)
Intersegment noninterest income (expense)
$
125
$
515
$
(640)
18
Information pertaining to our Factoring segment, summarized as of and for the quarters ended:
(1)Operating margin is a non-GAAP financial measure used as a supplemental measure to evaluate the performance of our Factoring segment. For the three months ended June 30, 2025, operating income and factoring total revenue were impacted by $1.2 million of interest and fees resulting from the USPS Settlement and such settlement further impacted operating income by $7.4 million of legal expense accrual reversal and $3.8 million of recovery of factoring balances charged-off in a prior period. Operating income for the three months ended June 30, 2025 was also impacted by a $2.0 million legal settlement that was unrelated to the USPS Settlement. Such items had a 24.71% impact on operating margin, a 0.43% impact on yield on average receivables, and a 0.46% impact on yield on average net funds employed for the three months ended June 30, 2025.
(2)The current quarter charge-off rate for the three months ended June 30, 2025 reflects a $3.8 million recovery of factoring balances charged off in a prior period. Such recovery impacted the current quarter charge-off rate for that period by (0.33%).
19
Information pertaining to our Payments segment, summarized as of and for the quarters ended:
Payments
June 30, 2026
March 31, 2026
December 31, 2025
September 30, 2025
June 30, 2025
Supply chain financing factored receivables
$
287,454,000
$
222,168,000
$
174,292,000
$
157,662,000
$
152,054,000
Quickpay and other factored receivables
99,933,000
90,682,000
67,828,000
73,120,000
74,493,000
Total factored receivable period end balance
$
387,387,000
$
312,850,000
$
242,120,000
$
230,782,000
$
226,547,000
Total revenue
Supply chain finance interest income
$
5,676,000
$
4,192,000
$
4,177,000
$
3,895,000
$
3,412,000
Quickpay interest income
3,281,000
2,974,000
2,759,000
2,874,000
2,818,000
Intersegment interest income allocation
2,180,000
2,488,000
2,779,000
2,943,000
2,896,000
Total interest income
11,137,000
9,654,000
9,715,000
9,712,000
9,126,000
Broker noninterest income
9,536,000
7,820,000
7,330,000
7,131,000
6,443,000
Factor noninterest income
630,000
796,000
952,000
933,000
993,000
Other noninterest income
727,000
547,000
341,000
398,000
288,000
Intersegment noninterest income
266,000
287,000
290,000
329,000
381,000
Total noninterest income
11,159,000
9,450,000
8,913,000
8,791,000
8,105,000
$
22,296,000
$
19,104,000
$
18,628,000
$
18,503,000
$
17,231,000
Total expense
Credit loss expense (benefit)
$
155,000
$
197,000
$
28,000
$
9,000
$
92,000
Noninterest expense
18,375,000
16,104,000
17,258,000
17,094,000
16,844,000
Intersegment noninterest expense
928,000
927,000
930,000
950,000
949,000
$
19,458,000
$
17,228,000
$
18,216,000
$
18,053,000
$
17,885,000
Pre-tax operating income (loss)
$
2,838,000
$
1,876,000
$
412,000
$
450,000
$
(654,000)
Depreciation expense
156,000
176,000
182,000
203,000
222,000
Software amortization expense
1,932,000
1,821,000
1,684,000
1,550,000
1,413,000
Intangible amortization expense
812,000
817,000
878,000
904,000
1,418,000
Earnings (losses) before interest, taxes, depreciation, and amortization(1)
$
5,738,000
$
4,690,000
$
3,156,000
$
3,107,000
$
2,399,000
EBITDA Margin(1)
25.7
%
24.5
%
16.9
%
16.8
%
13.9
%
Number of invoices processed
9,086,400
8,220,371
9,053,274
8,826,848
8,500,565
Amount of payments processed
$
13,492,237,000
$
11,014,040,000
$
10,995,478,000
$
10,662,418,000
$
10,081,206,000
Network invoice volume
1,045,637
1,043,488
1,090,848
1,057,606
1,004,603
Network payment volume
$
2,277,297,000
$
1,941,127,000
$
1,829,509,000
$
1,696,817,000
$
1,579,662,000
LoadPay
Revenue
$
652,000
$
437,000
$
345,000
$
218,000
$
92,000
Pre-tax operating income (loss)
$
(2,052,000)
$
(2,059,000)
$
(2,584,000)
$
(2,353,000)
$
(1,751,000)
Depreciation expense
23,000
21,000
21,000
20,000
16,000
Software amortization expense
416,000
374,000
324,000
289,000
251,000
Earnings (losses) before interest, taxes, depreciation, and amortization(1)
$
(1,613,000)
$
(1,664,000)
$
(2,239,000)
$
(2,044,000)
$
(1,484,000)
Payments revenue excluding LoadPay
$
21,644,000
$
18,667,000
$
18,283,000
$
18,285,000
$
17,139,000
Payments EBITDA excluding LoadPay(2)
$
7,351,000
$
6,354,000
$
5,395,000
$
5,151,000
$
3,883,000
Payments EBITDA Margin excluding LoadPay(2)
34.0
%
34.0
%
29.5
%
28.2
%
22.7
%
20
(1)Earnings (losses) before interest, taxes, depreciation, and amortization ("EBITDA") and EBITDA margin are non-GAAP financial measures used as supplemental measures to evaluate the performance of our Payments segment. EBITDA is useful because it provides a clearer view of underlying operating performance by excluding the effects of capital structure, tax regimes, and non-cash depreciation and amortization. EBITDA margin complements EBITDA by illustrating how efficiently revenue is converted into operating profitability.
(2)Payments EBITDA excluding LoadPay and Payments EBITDA Margin excluding LoadPay are non-GAAP financial metrics used as supplemental measures to evaluate the performance of our Payments segment exclusive of the investments associated with LoadPay, which is a relatively new product in its early stages. Such adjusted EBITDA measures provide comparable clarity into the performance of our Payments segment prior to the advent of our LoadPay product.
Information pertaining to our Intelligence segment, summarized as of and for the quarters ended:
Intelligence
June 30, 2026
March 31, 2026
December 31, 2025
September 30, 2025
Revenue
$
2,389,000
$
2,397,000
$
2,347,000
$
2,338,000
Cost of revenue
365,000
333,000
283,000
266,000
Gross profit
2,024,000
2,064,000
2,064,000
2,072,000
Selling, general and administrative costs
5,353,000
5,067,000
4,389,000
5,670,000
Pre-tax operating income (loss)
$
(3,329,000)
$
(3,003,000)
(2,325,000)
(3,598,000)
Gross Margin(1)
85
%
86
%
88
%
89
%
*prior periods not meaningful
(1)Gross margin is a non-GAAP financial measure used as supplemental measure to evaluate the performance of our Intelligence segment. Cost of revenues is comprised primarily of salaries and benefits and communications and technology costs for employees providing services to the Company's customers. This includes the costs of the Company's personnel performing integration, customer support, third-party data center and customer training activities. Cost of revenues also includes the direct costs of third party hosting services. We have elected to exclude amortization expense of capitalized developed software and acquired technology, as well as allocations of fixed asset depreciation expense and occupancy expenses from cost of revenues.
Transportation revenue:
Three Months Ended
Linked Quarter
Year over Year
(Dollars in thousands)
June 30, 2026
March 31, 2026
December 31, 2025
September 30, 2025
June 30, 2025
$ Change
% Change
$ Change
% Change
Transportation Revenue
Factoring revenue
$
52,993
$
41,773
$
41,934
$
39,653
$
40,761
$
11,220
26.9
%
$
12,232
30.0
%
Intersegment noninterest income
(910)
(911)
(911)
(911)
(910)
1
0.1
%
—
—
%
Factoring revenue excluding intersegment noninterest income
$
52,083
$
40,862
$
41,023
$
38,742
$
39,851
$
11,221
27.5
%
$
12,232
30.7
%
Payments revenue
$
22,296
$
19,104
$
18,628
$
18,503
$
17,231
$
3,192
16.7
%
$
5,065
29.4
%
Intersegment noninterest income
(266)
(287)
(290)
(329)
(381)
21
7.3
%
115
30.2
%
Payments revenue excluding intersegment noninterest income
$
22,030
$
18,817
$
18,338
$
18,174
$
16,850
$
3,213
17.1
%
$
5,180
30.7
%
Intelligence revenue
$
2,389
$
2,397
$
2,347
$
2,338
$
1,724
$
(8)
(0.3)
%
$
665
38.6
%
Transportation revenue
$
76,502
$
62,076
$
61,708
$
59,254
$
58,425
$
14,426
23.2
%
$
18,077
30.9
%
21
Deposits summarized as of:
(Dollars in thousands)
June 30, 2026
March 31, 2026
December 31, 2025
September 30, 2025
June 30, 2025
Non-interest bearing demand
$
3,780,765
$
3,042,210
$
1,901,638
$
2,095,017
$
2,285,327
Interest bearing demand
661,332
691,572
845,060
668,576
694,005
Individual retirement accounts
35,170
35,977
37,634
39,133
40,888
Money market
719,455
639,651
608,036
580,748
565,781
Savings
552,238
546,374
522,189
522,469
517,474
Certificates of deposit
212,943
222,123
224,644
228,415
230,179
Brokered time deposits
213,315
442,872
695,093
705,772
701,059
Other brokered deposits
42,171
79,160
115,922
115,116
151,385
Total deposits
$
6,217,389
$
5,699,939
$
4,950,216
$
4,955,246
$
5,186,098
Net interest margin summarized for the three months ended:
June 30, 2026
March 31, 2026
(Dollars in thousands)
Average Balance
Interest
Average
Rate(5)
Average Balance
Interest
Average
Rate(5)
Interest earning assets:
Interest earning cash balances
$
862,507
$
7,937
3.69
%
$
469,986
$
4,266
3.68
%
Taxable securities
305,173
3,889
5.11
%
358,048
4,525
5.13
%
Tax-exempt securities
2,276
15
2.64
%
2,277
15
2.67
%
FHLB and other stock
4,260
146
13.75
%
13,263
272
8.32
%
Loans(1)
5,271,228
112,550
8.56
%
4,918,116
93,677
7.72
%
Total interest earning assets
$
6,445,444
$
124,537
7.75
%
$
5,761,690
$
102,755
7.23
%
Non-interest earning assets:
Other assets
812,508
811,385
Total assets
$
7,257,952
$
6,573,075
Interest bearing liabilities:
Deposits:
Interest bearing demand(2)
$
678,219
$
13,181
7.80
%
$
682,468
$
745
0.44
%
Individual retirement accounts
35,623
113
1.27
%
36,590
108
1.20
%
Money market
662,643
4,233
2.56
%
608,415
3,787
2.52
%
Savings
550,784
1,623
1.18
%
535,308
1,524
1.15
%
Certificates of deposit
218,365
1,334
2.45
%
224,469
1,422
2.57
%
Brokered time deposits
306,476
3,019
3.95
%
562,295
5,505
3.97
%
Other brokered deposits
56,864
524
3.70
%
105,565
961
3.69
%
Total interest bearing deposits(2)
2,508,974
24,027
3.84
%
2,755,110
14,052
2.07
%
Federal Home Loan Bank advances
6,099
56
3.68
%
106,667
993
3.78
%
Subordinated notes
69,956
663
3.80
%
69,903
662
3.84
%
Junior subordinated debentures
43,223
965
8.95
%
43,057
954
8.99
%
Total interest bearing liabilities
$
2,628,252
$
25,711
3.92
%
$
2,974,737
$
16,661
2.27
%
Noninterest bearing liabilities and equity:
Non-interest bearing demand deposits
3,583,133
2,558,992
Other liabilities
78,159
86,869
Total equity
968,408
952,477
Total liabilities and equity
$
7,257,952
$
6,573,075
Net interest income
$
98,826
$
86,094
Interest spread(3)
3.83
%
4.96
%
Net interest margin(4)
6.15
%
6.06
%
(1) Loan balance totals include respective nonaccrual assets.
22
(2) Our mortgage warehouse business is more than self-funded due to the noninterest bearing servicing deposits of its clients. The average balance of such deposits was $2.045 billion for the three months ended June 30, 2026. Given their legal form, these deposits are classified as noninterest bearing deposits on our balance sheet. Despite their classification, many of these deposits are not truly free of cost as we compensate our clients for these balances in the form of an earnings interest rebate rather than deposit interest. As a result, such noninterest bearing deposits first decrease our loan yield before increasing our deposit rates. Because of the recent influx of these deposits, some clients hold significantly higher deposit balances than loan balances. As a result, we are now, in some cases, paying out more in rebates than we earn in interest on a given client’s loans. In those cases, we are recording that excess rebate as deposit interest expense. Whether recorded as interest expense or an offset to interest income, the effect on net interest income and net income is the same: these are profitable funds as they displace more expensive wholesale funding and can be invested risk-free above their cost. During the three months ended June 30, 2026, deposit interest expense recognized on these deposits was $12.3 million.
The following table shows the impact of mortgage warehouse excess rebates:
Total interest bearing deposits excluding mortgage warehouse excess rebates
$
2,508,974
$
11,685
1.87
%
(3) Net interest spread is the yield on average interest earning assets less the rate on interest bearing liabilities.
(4) Net interest margin is the ratio of net interest income to average interest earning assets.
(5) Average rates have been annualized.
Additional information pertaining to our loan portfolio, including loans held for investment and loans held for sale, summarized for the quarters ended:
(Dollars in thousands)
June 30, 2026
March 31, 2026
December 31, 2025
September 30, 2025
June 30, 2025
Average Banking loans
$
3,362,327
$
3,389,580
$
3,491,230
$
3,484,400
$
3,381,919
Average Factoring receivables
1,580,178
1,269,715
1,219,914
1,167,092
1,138,792
Average Payments receivables
328,723
258,821
228,358
213,386
204,529
Average total loans
$
5,271,228
$
4,918,116
$
4,939,502
$
4,864,878
$
4,725,240
Banking yield
6.37
%
5.69
%
6.26
%
6.41
%
6.50
%
Factoring yield
12.73
%
12.44
%
12.79
%
12.63
%
13.40
%
Payments yield
10.93
%
11.23
%
12.05
%
12.59
%
12.22
%
Total loan yield
8.56
%
7.72
%
8.14
%
8.17
%
8.41
%
23
Reconciliation of non-GAAP financial measures:
As of and for the Three Months Ended
As of and for the Six Months Ended
(Dollars in thousands, except per share amounts)
June 30, 2026
March 31, 2026
December 31, 2025
September 30, 2025
June 30, 2025
June 30, 2026
June 30, 2025
Average total stockholders' equity
$
968,408
$
952,477
$
937,023
$
925,459
$
910,202
$
960,486
$
906,253
Average preferred stock liquidation preference
(45,000)
(45,000)
(45,000)
(45,000)
(45,000)
(45,000)
(45,000)
Average total common stockholders' equity
923,408
907,477
892,023
880,459
865,202
915,486
861,253
Average goodwill and other intangibles
(399,652)
(402,158)
(404,893)
(408,025)
(347,894)
(400,898)
(302,896)
Average tangible common stockholders' equity
$
523,756
$
505,319
$
487,130
$
472,434
$
517,308
$
514,588
$
558,357
Net income available to common stockholders
$
10,568
$
5,554
$
18,412
$
907
$
3,618
$
16,122
$
2,834
Average tangible common equity
523,756
505,319
487,130
472,434
517,308
514,588
558,357
Return on average tangible common equity
8.09
%
4.46
%
15.00
%
0.76
%
2.81
%
6.32
%
1.02
%
Net non-interest expense to average assets ratio:
Noninterest expenses
$
101,634
$
98,261
$
98,134
$
103,714
$
100,840
$
199,895
$
201,013
Noninterest income
$
21,415
$
19,707
$
30,390
$
21,448
$
19,384
$
41,122
$
36,574
Net noninterest expenses
$
80,219
$
78,554
$
67,744
$
82,266
$
81,456
$
158,773
$
164,439
Average total assets
$
7,257,952
$
6,573,075
$
6,465,547
$
6,425,267
$
6,366,984
$
6,917,405
$
6,181,549
Net noninterest expense to average assets ratio
4.43
%
4.85
%
4.16
%
5.08
%
5.13
%
4.63
%
5.36
%
Total stockholders' equity
$
963,263
$
950,715
$
941,771
$
919,333
$
912,382
$
963,263
$
912,382
Preferred stock liquidation preference
(45,000)
(45,000)
(45,000)
(45,000)
(45,000)
(45,000)
(45,000)
Total common stockholders' equity
918,263
905,715
896,771
874,333
867,382
918,263
867,382
Goodwill and other intangibles
(398,221)
(400,668)
(403,184)
(406,189)
(409,165)
(398,221)
(409,165)
Tangible common stockholders' equity
$
520,042
$
505,047
$
493,587
$
468,144
$
458,217
$
520,042
$
458,217
Common shares outstanding
23,894,537
23,806,253
23,765,385
23,763,401
23,727,046
23,894,537
23,727,046
Tangible book value per share
$
21.76
$
21.21
$
20.77
$
19.70
$
19.31
$
21.76
$
19.31
Total assets at end of period
$
7,403,685
$
6,876,715
$
6,380,588
$
6,357,149
$
6,494,748
$
7,403,685
$
6,494,748
Goodwill and other intangibles
(398,221)
(400,668)
(403,184)
(406,189)
(409,165)
(398,221)
(409,165)
Tangible assets at period end
$
7,005,464
$
6,476,047
$
5,977,404
$
5,950,960
$
6,085,583
$
7,005,464
$
6,085,583
Tangible common stockholders' equity ratio
7.42
%
7.80
%
8.26
%
7.87
%
7.53
%
7.42
%
7.53
%
1)Triumph Financial uses certain non-GAAP financial measures to provide meaningful supplemental information regarding Triumph Financial's operational performance and to enhance investors' overall understanding of such financial performance. The non-GAAP measures used by Triumph Financial include the following:
•"Tangible common stockholders' equity" is defined as common stockholders' equity less goodwill and other intangible assets.
•"Total tangible assets" is defined as total assets less goodwill and other intangible assets.
•"Tangible book value per share" is defined as tangible common stockholders' equity divided by total common shares outstanding. This measure is important to investors interested in changes from period-to-period in book value per share exclusive of changes in intangible assets.
•"Tangible common stockholders' equity ratio" is defined as the ratio of tangible common stockholders' equity divided by total tangible assets. We believe that this measure is important to many investors in the marketplace who are interested in relative changes from period-to-period in common equity and total assets, each exclusive of changes in intangible assets.
•"Return on Average Tangible Common Equity" is defined as net income available to common stockholders divided by average tangible common stockholders' equity.
2)Asset quality ratios exclude loans held for sale, except for non-performing assets to total assets.
3)Current quarter ratios are preliminary.
24
Source: Triumph Financial, Inc.
###
Investor Relations:
Luke Wyse
Executive Vice President, Head of Investor Relations
lwyse@tfin.com
214-365-6936
Media Contact:
Amanda Tavackoli
Senior Vice President, Director of Corporate Communication