Please wait
.3
MANAGEMENT’S DISCUSSION AND ANALYSIS
Management's discussion and analysis (“MD&A”) is dated February 26, 2025 and should be read in conjunction with the audited consolidated financial statements for the year ended December 31, 2024 for a full understanding of the financial position and results of operations of Veren Inc. (the “Company” or “Veren”). Except as otherwise noted, the results of operations present only continuing operations.
The audited consolidated financial statements and comparative information for the year ended December 31, 2024 are presented under IFRS Accounting Standards as issued by the International Accounting Standards Board.
Structure of the Business
On May 10, 2024, Crescent Point Energy Corp. changed its name to Veren Inc. The principal undertaking of Veren and its subsidiaries is to carry on the business of acquiring, developing and holding interests in petroleum and natural gas properties. Amounts in this MD&A are in Canadian dollars unless noted otherwise. References to “US$” and "US dollars" are to United States (“U.S.”) dollars.
Overview
The Company reported adjusted funds flow from operations of $2.35 billion, net income of $273.3 million, adjusted net earnings from operations of $848.8 million and excess cash flow of $641.6 million for the year ended December 31, 2024. The Company continued to execute on its return of capital framework by returning $385.7 million to shareholders in 2024 through its base dividend and share repurchases.
In 2024, Veren had average annual production of 191,163 boe/d (guidance of 191,000 boe/d), annual operating expenses of $13.46/boe (guidance of $13.50/boe) and development capital expenditures of $1.51 billion (guidance of $1.45 - $1.50 billion) to drill 180 (165.8 net) wells.
The Company executed on a number of strategic transactions in 2024, which allowed for increased operational efficiencies and concentrated development of the Alberta Montney and Kaybob Duvernay assets. In the first quarter of 2024, Veren completed the disposition of its Southern Alberta and Swan Hills assets for total consideration of $37.1 million and $80.5 million, respectively. On June 14, 2024, the Company completed the disposition of certain non-core assets in its Southeast Saskatchewan and Southwest Saskatchewan cash-generating units ("CGUs") for total consideration of $531.6 million. The Company closed its Alberta Montney infrastructure transaction on October 9, 2024 for cash proceeds of $400.0 million. The net proceeds from these transactions were used to repay indebtedness.
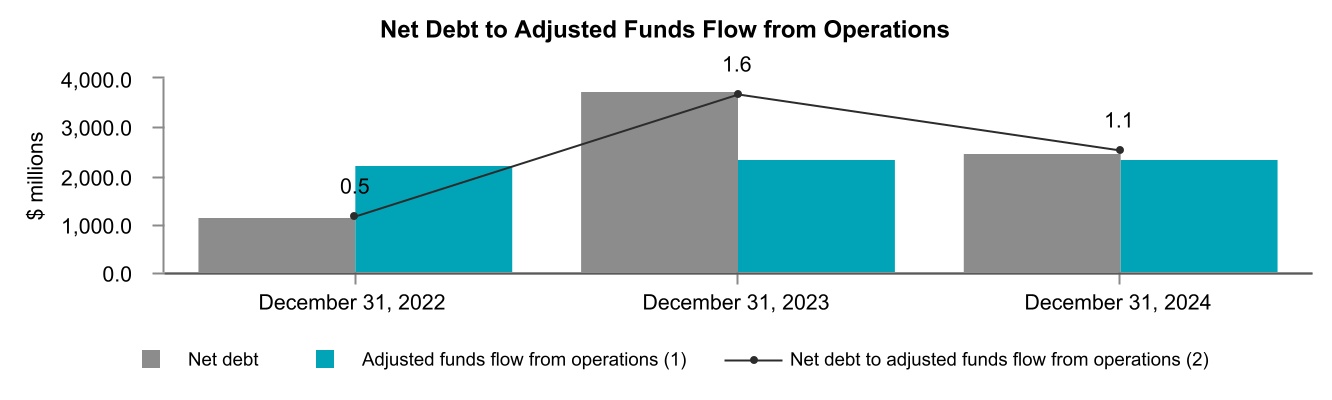
Veren received an investment-grade credit rating and subsequently closed an aggregate $1.00 billion public senior note offering during the second quarter of 2024. The proceeds received from this offering were used to repay bank debt, including retiring the Company's bank term loan. The Company reduced its net debt by $1.26 billion during the year ended December 31, 2024, reflecting a reduction of approximately 35 percent, exiting the year with net debt of $2.48 billion or 1.1 times net debt to adjusted funds flow from operations.
To protect against commodity price volatility, the Company continues to hedge a portion of its production. Veren has hedged approximately 35 percent of its oil and liquids production and approximately 35 percent of its natural gas production in 2025, net of royalty interest.
Veren's 2025 guidance includes average production of 188,000 - 196,000 boe/d, development capital expenditures of $1.48 - $1.58 billion and operating expenses of $12.75 - $13.75/boe. Based on the current forecast commodity prices and the Company's 2025 hedge book, the Company expects to generate strong returns and excess cash flow to provide continued returns to shareholders.
Adjusted funds flow from operations, adjusted net earnings from operations, excess cash flow, total return of capital, base dividends, development capital expenditures, net debt and net debt to adjusted funds flow from operations are specified financial measures that do not have any standardized meaning prescribed by IFRS and, therefore, may not be comparable with the calculation of similar measures presented by other entities. Refer to the Specified Financial Measures section in this MD&A for further information.
Results of Operations
Production
| | | | | | | | | | | | | | | | | | | | | | | | | | |
| | | | |
| | | | | | | 2024 | | 2023 | | % Change | |
| Crude oil and condensate (bbls/d) | | | | | | | 107,541 | | | 88,087 | | | 22 | | |
| NGLs (bbls/d) | | | | | | | 17,533 | | | 15,026 | | | 17 | | |
Natural gas (mcf/d) | | | | | | | 396,534 | | | 211,275 | | | 88 | | |
| Production from continuing operations (boe/d) | | | | | | | 191,163 | | | 138,326 | | | 38 | | |
| Production from discontinued operations (boe/d) | | | | | | | — | | | 21,085 | | | (100) | | |
| Total average daily production (boe/d) | | | | | | | 191,163 | | | 159,411 | | | 20 | | |
| Crude oil and liquids - continuing operations (%) | | | | | | | 65 | | | 75 | | | (10) | | |
| Natural gas - continuing operations (%) | | | | | | | 35 | | | 25 | | | 10 | | |
Total (%) | | | | | | | 100 | | | 100 | | | — | | |
The following is a summary of Veren's production by area:
| | | | | | | | | | | | | | | | | | | | | | | | | | |
| | | | |
| Production By Area (boe/d) | | | | | | | 2024 | | 2023 | | % Change | |
| Alberta | | | | | | | 140,037 | | | 75,792 | | | 85 | | |
| Saskatchewan | | | | | | | 51,126 | | | 62,534 | | | (18) | | |
| Production from continuing operations | | | | | | | 191,163 | | | 138,326 | | | 38 | | |
| Production from discontinued operations - North Dakota | | | | | | | — | | | 21,085 | | | (100) | | |
| Total average daily production | | | | | | | 191,163 | | | 159,411 | | | 20 | | |
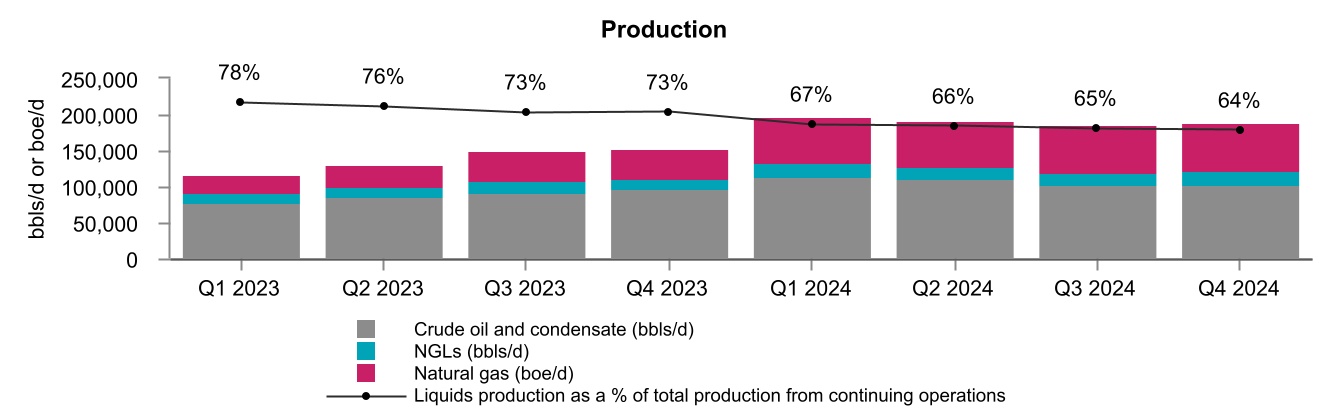
Production from continuing operations averaged 191,163 boe/d during 2024 compared to 138,326 boe/d in 2023. The increase of 38 percent is primarily due to the acquisitions of the Alberta Montney assets in May 2023 and December 2023, along with organic growth from the Company's Alberta development program. This was partially offset by the disposition of non-core assets in the first half of 2024.
The Company's crude oil and liquids weighting decreased by 10 percent year over year. The decrease was mainly due to the increased production from the Alberta Montney assets mentioned above, which have a higher proportion of natural gas production, and the disposition of oil-weighted assets in the first half of 2024.
Exhibit 1
Marketing and Prices
| | | | | | | | | | | | | | | | | | | | | | | | | | |
| | | | |
Average Selling Prices (1) | | | | | | | 2024 | | 2023 | | % Change | |
| Crude oil and condensate ($/bbl) | | | | | | | 95.07 | | | 95.87 | | | (1) | | |
NGLs ($/bbl) | | | | | | | 36.71 | | | 32.86 | | | 12 | | |
Natural gas ($/mcf) | | | | | | | 2.02 | | | 3.06 | | | (34) | | |
Total ($/boe) | | | | | | | 61.05 | | | 69.30 | | | (12) | | |
(1)The average selling prices reported are before realized commodity derivatives and transportation.
| | | | | | | | | | | | | | | | | | | | | | | | | | |
| | | | |
| Benchmark Pricing | | | | | | | 2024 | | 2023 | | % Change | |
Crude Oil Prices | | | | | | | | | | | | |
WTI crude oil (US$/bbl) (1) | | | | | | | 75.72 | | | 77.61 | | | (2) | | |
WTI crude oil (Cdn$/bbl) | | | | | | | 103.73 | | | 104.74 | | | (1) | | |
| Crude Oil and Condensate Differentials | | | | | | | | | | | | |
LSB crude oil (Cdn$/bbl) (2) | | | | | | | (8.18) | | | (6.79) | | | 20 | | |
FOS crude oil (Cdn$/bbl) (3) | | | | | | | (18.66) | | | (23.39) | | | (20) | | |
MSW crude oil (Cdn$/bbl) (4) | | | | | | | (5.77) | | | (3.64) | | | 59 | | |
C5+ condensate (Cdn$/bbl) (5) | | | | | | | (3.81) | | | (1.44) | | | 165 | | |
Natural Gas Prices | | | | | | | | | | | | |
AECO daily spot natural gas (Cdn$/mcf) (6) | | | | | | | 1.46 | | | 2.64 | | | (45) | | |
AECO monthly index natural gas (Cdn$/mcf) | | | | | | | 1.43 | | | 2.92 | | | (51) | | |
NYMEX natural gas (US$/mmbtu) (7) | | | | | | | 2.27 | | | 2.74 | | | (17) | | |
Dawn natural gas (US$/mmbtu) (8) | | | | | | | 1.82 | | | 2.16 | | | (16) | | |
Chicago natural gas (US$/mmbtu) (9) | | | | | | | 1.97 | | | 2.11 | | | (7) | | |
Foreign Exchange Rate | | | | | | | | | | | | |
Exchange rate (US$/Cdn$) | | | | | | | 0.730 | | | 0.741 | | | (1) | | |
(1)WTI refers to the West Texas Intermediate crude oil price.
(2)LSB refers to the Light Sour Blend crude oil price.
(3)FOS refers to the Fosterton crude oil price, which typically receives a premium to the Western Canadian Select ("WCS") price.
(4)MSW refers to Mixed Sweet Blend crude oil price.
(5)C5+ condensate refers to the Canadian C5+ condensate index.
(6)AECO refers to the Alberta Energy Company natural gas price.
(7)NYMEX refers to the New York Mercantile Exchange natural gas price.
(8)Dawn refers to the Dawn Ontario natural gas price.
(9)Chicago refers to the Chicago City-Gate natural gas price.
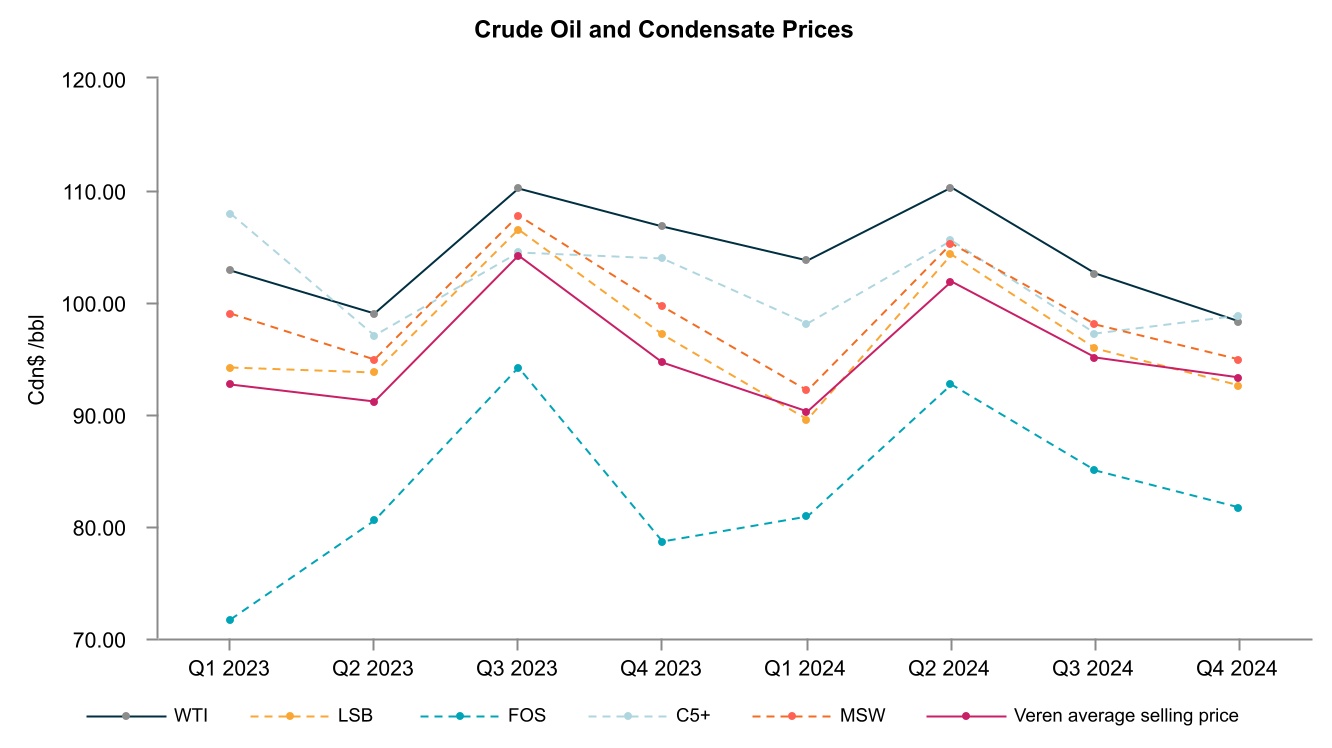
Benchmark crude oil prices weakened slightly in 2024 compared to 2023, primarily due to global demand concerns driven by weaker economic and demand growth outlooks in China, coupled with an increase in crude oil supply from non-OPEC+ producers. This was partially offset by sustained OPEC+ voluntary production cuts.
Natural gas prices were significantly weaker in 2024 compared to 2023. Mild weather conditions across most of North America led to a decrease in gas consumption during the typical peak demand season. As a result, inventory storage levels exceeded the 5-year average, while higher production from the U.S. and Canada placed further downward pressure on natural gas prices. The AECO daily and NYMEX benchmark prices decreased 45 percent and 17 percent in 2024, respectively, compared to 2023. The AECO daily benchmark price experienced a sharper decline in 2024 relative to the NYMEX benchmark price, primarily due to an over-supplied Alberta market and downstream pipeline maintenance, which restricted production sales from Alberta and led to increased injection and storage levels.
Exhibit 2
LSB and MSW crude oil differentials weakened in 2024 compared to 2023, primarily due to a rise in crude oil supply in the Western Canadian Sedimentary Basin, constrained takeaway capacity and unplanned refinery outages. This was partially offset by the startup of the Trans Mountain pipeline ("TMX") expansion in May 2024, which increased pipeline capacity and access to Asian markets. FOS crude oil differentials strengthened in 2024 compared to 2023, primarily due to narrower WCS differentials as a result of the TMX expansion. Condensate differentials weakened in 2024 compared to 2023, largely due to an oversupplied North American condensate market and elevated storage levels.
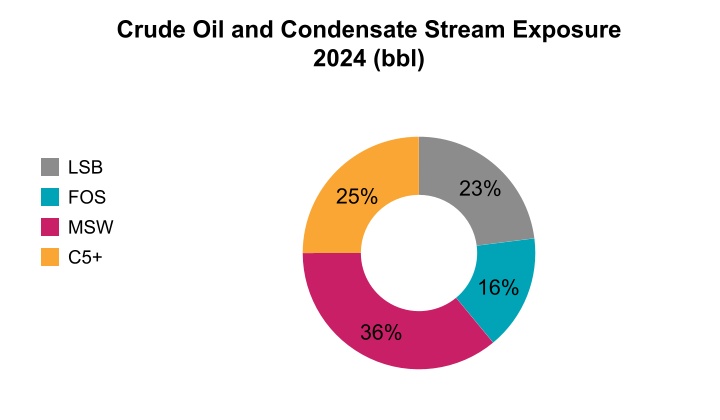
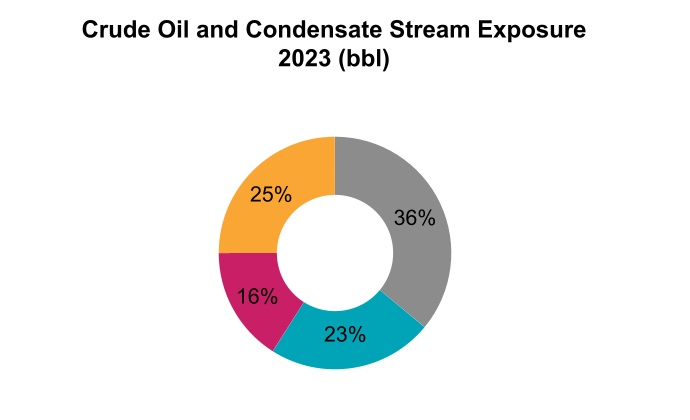
Despite significant widening of the benchmark oil and condensate differentials relative to WTI, the Company's realized pricing differential remained generally consistent year over year. The slight tightening in the Company's realized crude oil and condensate differential from $8.87 per bbl in 2023 to $8.66 per bbl in 2024 was primarily due to an increase in the proportion of liquids sold on higher quality benchmarks as a result of the Alberta Montney acquisitions.
In 2024, the Company's average selling price for NGLs increased 12 percent, primarily due to higher propane prices related to increased U.S. exports, lower inventory levels and the sale of a portion of the Company's propane production at Far East Index pricing, which receives a premium relative to the Edmonton propane market.
The Company's average selling price for natural gas decreased 34 percent in 2024 compared to 2023, primarily as a result of weaker AECO daily and NYMEX benchmark prices. Veren's average selling price experienced a smaller decline relative to the AECO daily benchmark price, primarily due to the Company's physical gas diversification into markets outside Alberta, such as Dawn and Chicago.
Exhibit 3
Commodity Derivatives
Management of cash flow variability is an integral component of Veren's business strategy. Veren regularly monitors changing business and market conditions while executing its strategic risk management program. Veren proactively manages the risk exposure inherent in movements in the price of crude oil, natural gas, interest rates, the Company's share price and the US/Cdn dollar exchange rate using derivatives with investment-grade counterparties.
The Company's crude oil derivatives are referenced to WTI, MSW, WCS and C5+ condensate. The Company's natural gas derivatives are referenced to NYMEX and the AECO monthly index. Veren utilizes a variety of derivatives, including swaps, swaptions, collars and put options, to protect against downward commodity price movements while also providing the opportunity for some upside participation during periods of rising prices. This reduces the volatility of the selling price of crude oil, NGLs, condensate and natural gas production and provides a measure of stability to the Company's cash flow. See Note 27 - "Financial Instruments and Derivatives" in the audited consolidated financial statements for the year ended December 31, 2024, for additional information on the Company's derivatives.
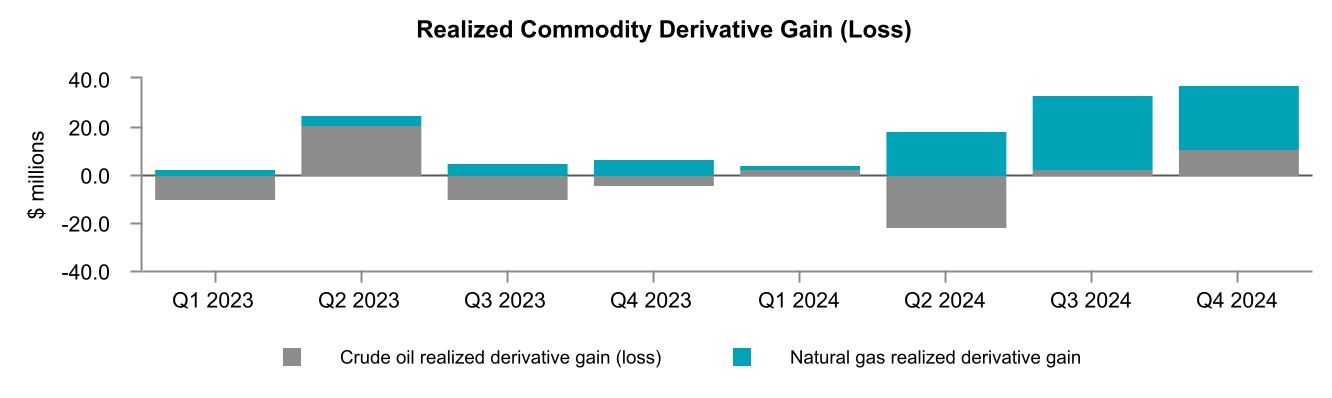
The following is a summary of the realized commodity derivative gains (losses):
| | | | | | | | | | | | | | | | | | | | | | | | | | |
| | | | |
| ($ millions, except volume amounts) | | | | | | | 2024 | | 2023 | | % Change | |
Average crude oil volumes hedged (bbls/d) (1) | | | | | | | 54,700 | | | 28,955 | | | 89 | | |
Crude oil realized derivative loss (1) | | | | | | | (6.0) | | | (3.3) | | | 82 | | |
| per bbl - continuing operations | | | | | | | (0.15) | | | (0.10) | | | 50 | | |
| | | | | | | | | | | | |
| | | | | | | | | | | | |
| | | | | | | | | | | | |
Average natural gas volumes hedged (GJ/d) (2) (3) | | | | | | | 122,208 | | | 40,325 | | | 203 | | |
Natural gas realized derivative gain (3) | | | | | | | 77.8 | | | 18.8 | | | 314 | | |
| per mcf - continuing operations | | | | | | | 0.54 | | | 0.24 | | | 125 | | |
Average barrels of oil equivalent hedged (boe/d) (1) (3) | | | | | | | 74,006 | | | 35,325 | | | 110 | | |
| | | | | | | | | | | | |
Total realized commodity derivative gains (1) (3) | | | | | | | 71.8 | | | 15.5 | | | 363 | | |
| per boe - continuing operations | | | | | | | 1.03 | | | 0.31 | | | 232 | | |
| per boe - total average daily production | | | | | | | 1.03 | | | 0.27 | | | 281 | | |
(1)The crude oil realized derivative loss for the years ended December 31, 2024 and December 31, 2023 includes the realized derivative gains and losses on financial crude oil price differential contracts. The average crude oil volumes hedged and average barrels of oil equivalent hedged do not include the hedged volumes related to financial crude oil price differential contracts.
(2)GJ/d is defined as gigajoules per day.
(3)The natural gas realized derivative gain for the years ended December 31, 2024 and December 31, 2023 includes the realized derivative gains and losses on financial natural gas price differential contracts. The average natural gas volumes hedged and average barrels of oil equivalent hedged do not include the hedged volumes related to financial natural gas price differentials contracts.
For the year ended December 31, 2024, the Company's realized derivative loss on crude oil contracts was $6.0 million. The realized derivative loss was primarily attributable to higher Cdn$ WTI benchmark pricing compared to the Company's average hedge price.
The Company's realized derivative gain on natural gas contracts was $77.8 million for the year ended December 31, 2024. The realized derivative gain was primarily due to lower average NYMEX and AECO monthly index prices compared to the Company's average hedge price. Wider AECO to NYMEX differentials in 2024 also resulted in gains on the Company's natural gas differential contracts.
Exhibit 4
The following is a summary of the Company's unrealized commodity derivative gains (losses):
| | | | | | | | | | | | | | | | | | | | | | | | | | |
| | | | |
($ millions) | | | | | | | 2024 | | 2023 | | % Change | |
| Crude oil | | | | | | | (138.0) | | | 127.4 | | | (208) | | |
| | | | | | | | | | | | |
Natural gas | | | | | | | 51.6 | | | 20.9 | | | 147 | | |
| Total unrealized commodity derivative gains (losses) | | | | | | | (86.4) | | | 148.3 | | | (158) | | |
In the year ended December 31, 2024, the Company recognized a total unrealized derivative loss of $86.4 million on its commodity contracts compared to a total unrealized derivative gain of $148.3 million in 2023. The unrealized crude oil derivative loss of $138.0 million in 2024 was primarily attributable to the change in forward benchmark crude oil prices relative to the Company's average hedge price. The unrealized derivative gain for natural gas of $51.6 million in 2024 was primarily due to the wider forward AECO to NYMEX differential at December 31, 2024 compared to December 31, 2023, partially offset by the maturity of in-the-money natural gas derivative contracts.
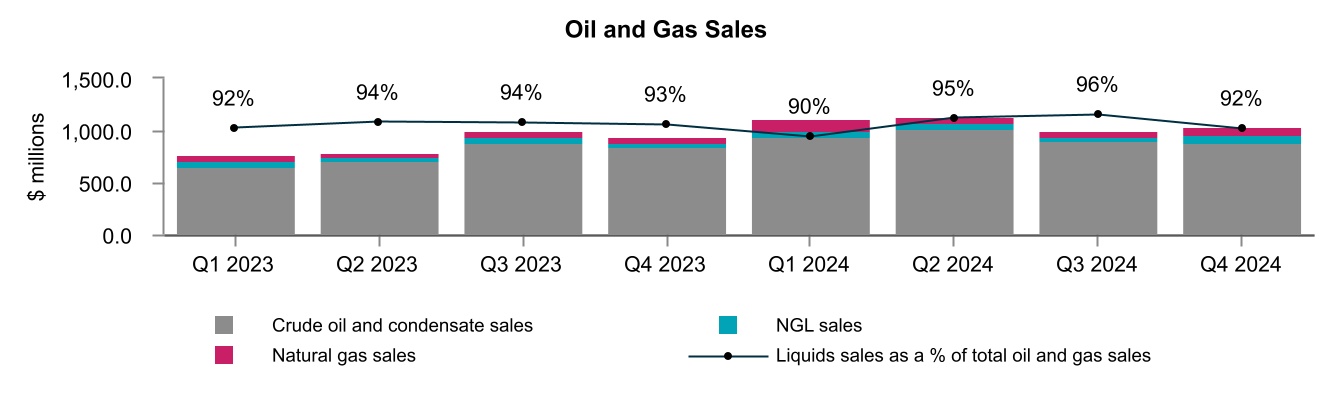
Oil and Gas Sales
| | | | | | | | | | | | | | | | | | | | | | | | | | |
| | | | |
($ millions) (1) | | | | | | | 2024 | | 2023 | | % Change | |
| Crude oil and condensate sales | | | | | | | 3,741.9 | | | 3,082.5 | | | 21 | | |
NGL sales | | | | | | | 235.6 | | | 180.2 | | | 31 | | |
Natural gas sales | | | | | | | 293.8 | | | 236.3 | | | 24 | | |
Total oil and gas sales | | | | | | | 4,271.3 | | | 3,499.0 | | | 22 | | |
(1)Oil and gas sales are reported before realized commodity derivatives.
Total oil and gas sales increased by 22 percent in 2024 compared to 2023. The increase is due to higher production volumes, partially offset by lower average selling prices.
Exhibit 5
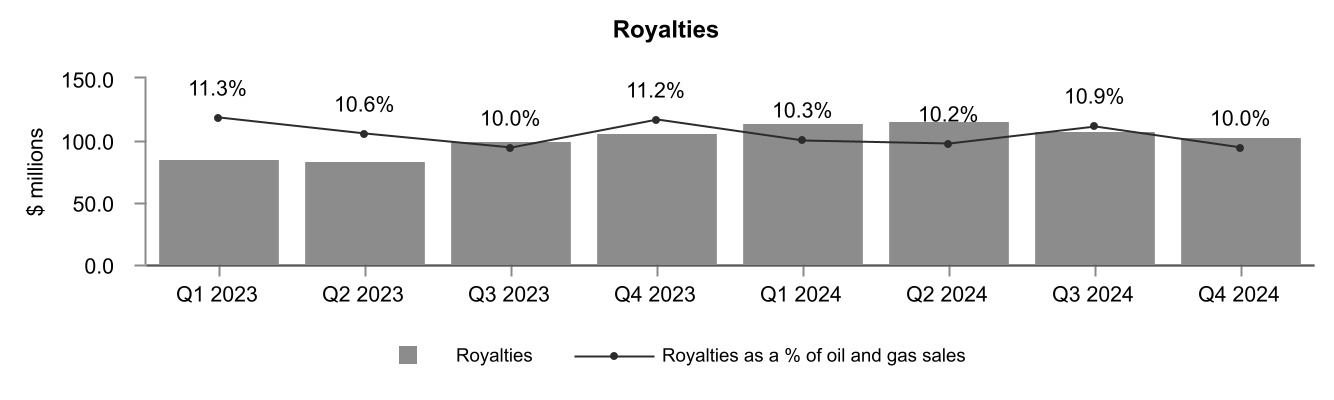
Royalties
| | | | | | | | | | | | | | | | | | | | | | | | | | |
| | | | |
| ($ millions, except % and per boe amounts) | | | | | | | 2024 | | 2023 | | % Change | |
| Royalties | | | | | | | 441.7 | | | 375.3 | | | 18 | | |
| As a % of oil and gas sales | | | | | | | 10.3 | | | 10.7 | | | (0.4) | | |
| Per boe | | | | | | | 6.31 | | | 7.43 | | | (15) | | |
Royalties increased 18 percent in 2024 compared to 2023 due to higher oil and gas sales, partially offset by a lower average royalty rate. Royalties as a percentage of oil and gas sales decreased slightly in 2024 compared to 2023, primarily due to the lower royalty rate associated with the Alberta Montney assets acquired in December 2023 and the non-core asset dispositions in the first half of 2024 that had higher royalty rates.
Royalties per boe decreased 15 percent in 2024 from the 2023 comparative year. This is primarily due to the addition of the Alberta Montney assets with a higher natural gas weighting and the lower royalty rate mentioned above.
Exhibit 6
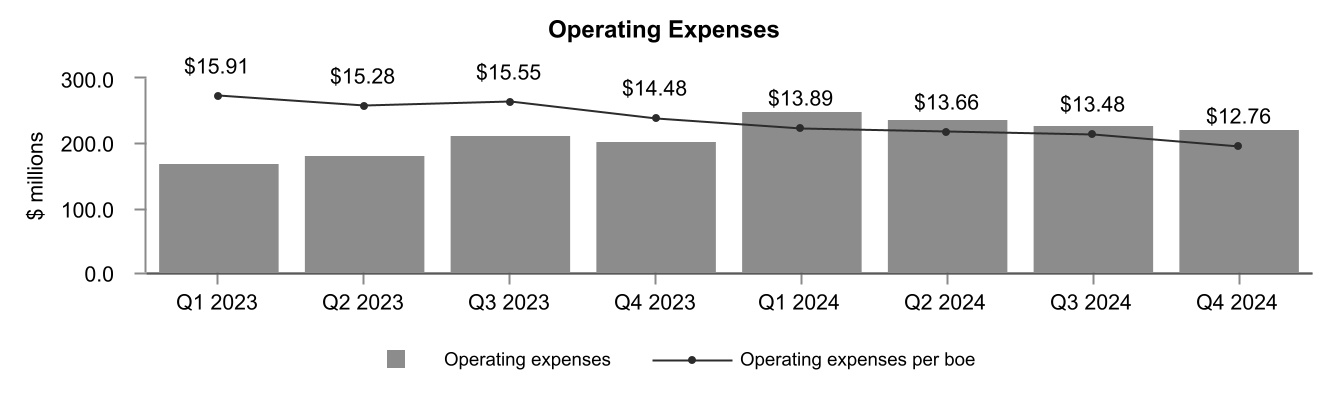
Operating Expenses
| | | | | | | | | | | | | | | | | | | | | | | | | | |
| | | | |
| ($ millions, except per boe amounts) | | | | | | | 2024 | | 2023 | | % Change | |
Operating expenses | | | | | | | 941.4 | | | 770.5 | | | 22 | | |
Per boe | | | | | | | 13.46 | | | 15.26 | | | (12) | | |
Operating expenses increased 22 percent in 2024 compared to 2023. The increase was primarily due to higher production as a result of the Alberta Montney acquisition in December 2023, partially offset by the dispositions of non-core assets in the first half of 2024.
Operating expenses per boe decreased by 12 percent in 2024 compared to 2023, primarily due to lower per boe operating costs associated with the acquired Alberta Montney assets and the dispositions mentioned above that had higher per boe operating costs.
Exhibit 7
Transportation Expenses
| | | | | | | | | | | | | | | | | | | | | | | | | | |
| | | | |
| ($ millions, except per boe amounts) | | | | | | | 2024 | | 2023 | | % Change | |
| Transportation expenses | | | | | | | 311.5 | | | 174.3 | | | 79 | | |
| Per boe | | | | | | | 4.45 | | | 3.45 | | | 29 | | |
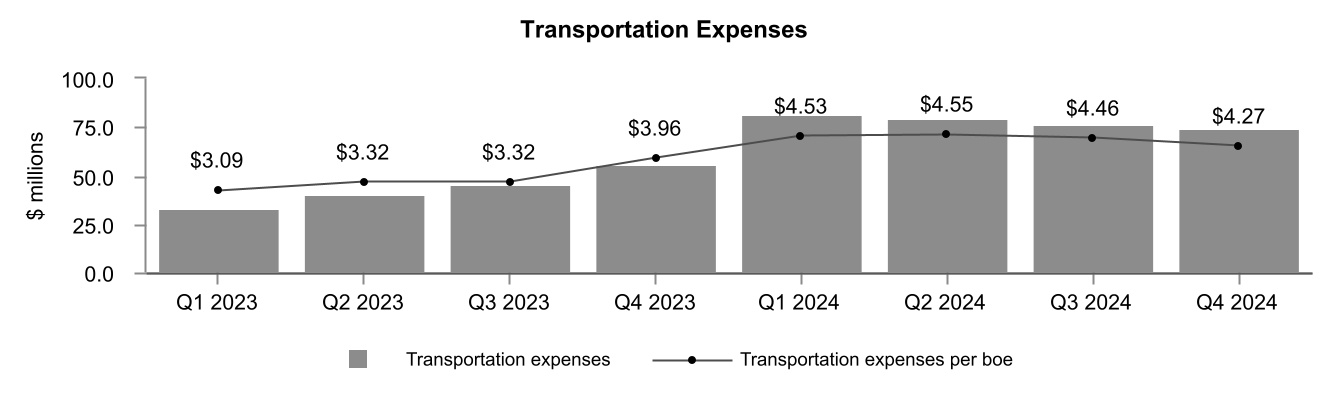
Transportation expenses increased 79 percent in 2024 compared to 2023, due to increased production and higher pipeline tolls. On a per boe basis, transportation expenses increased 29 percent in 2024 compared to 2023. The increase was primarily due to higher transportation fees associated with the Company's Alberta assets, which made up a larger proportion of production in 2024 compared to 2023. The higher transportation fees associated with these assets provides access to more favorable pricing in the Edmonton liquids market and U.S. Midwest natural gas market.
Exhibit 8
Netback
| | | | | | | | | | | | | | | | | | | | | | | | | | |
| | | | |
($/boe) (1) | | | | | | | 2024 | | 2023 | | % Change | |
| Oil and gas sales | | | | | | | 61.05 | | | 69.30 | | | (12) | | |
Royalties | | | | | | | (6.31) | | | (7.43) | | | (15) | | |
Operating expenses | | | | | | | (13.46) | | | (15.26) | | | (12) | | |
Transportation expenses | | | | | | | (4.45) | | | (3.45) | | | 29 | | |
Operating netback (2) | | | | | | | 36.83 | | | 43.16 | | | (15) | | |
| Realized gain on commodity derivatives | | | | | | | 1.03 | | | 0.31 | | | 232 | | |
Netback (2) | | | | | | | 37.86 | | | 43.47 | | | (13) | | |
(1)The dominant production category for the Company's properties is crude oil and condensate. These categories include associated natural gas and NGL volumes. The combined operating netback and netback across all production categories have been presented.
(2)Specified financial measure that does not have any standardized meaning prescribed by IFRS and, therefore, may not be comparable with the calculation of similar measures presented by other entities. Refer to the Specified Financial Measures section in this MD&A for further information.
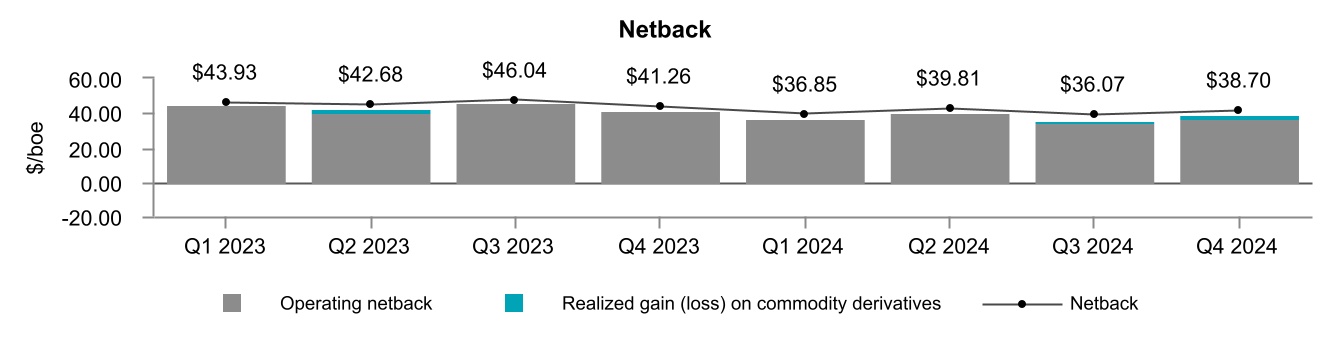
The Company's operating netback for the year ended December 31, 2024 decreased to $36.83 per boe from $43.16 per boe in 2023. The decrease in the Company's operating netback was primarily due to the decrease in average selling price and the increase in transportation expenses, partially offset by lower operating expenses and royalties. The decrease in the Company's netback was a result of the decrease in the operating netback, partially offset by an increased realized gain on commodity derivatives.
Exhibit 9
General and Administrative Expenses
| | | | | | | | | | | | | | | | | | | | | | | | | | |
| | | | |
| ($ millions, except per boe amounts) | | | | | | | 2024 | | 2023 | | % Change | |
| Gross general and administrative expenses | | | | | | | 175.5 | | | 179.0 | | | (2) | | |
| Overhead recoveries | | | | | | | (23.8) | | | (18.2) | | | 31 | | |
Capitalized | | | | | | | (39.7) | | | (34.3) | | | 16 | | |
General and administrative expenses | | | | | | | 112.0 | | | 126.5 | | | (11) | | |
| Transaction costs | | | | | | | (19.8) | | | (39.8) | | | (50) | | |
Net general and administrative expenses (1) | | | | | | | 92.2 | | | 86.7 | | | 6 | | |
Per boe (1) | | | | | | | 1.32 | | | 1.72 | | | (23) | | |
(1)Specified financial measures that does not have any standardized meaning prescribed by IFRS and, therefore, may not be comparable with the calculation of similar measures presented by other entities. Refer to the Specified Financial Measures section in this MD&A for further information.
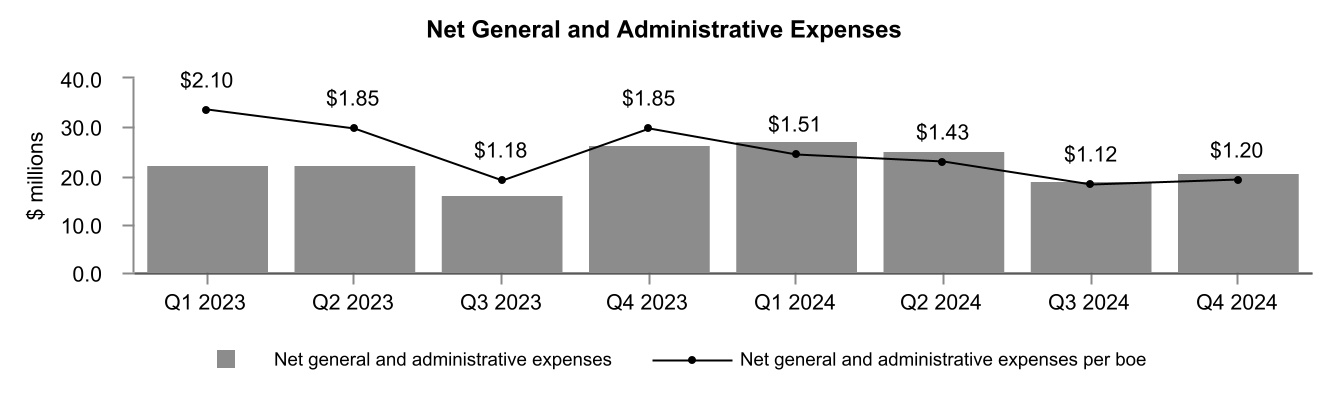
Net general and administrative ("G&A") expenses increased to $92.2 million for the year ended December 31, 2024, compared to $86.7 million in 2023. The increase is primarily due to higher employee related and information systems costs.
For the year ended December 31, 2024, net G&A expenses on a per boe basis decreased 23 percent compared to 2023, primarily due to higher production volumes and synergies achieved through the Company's acquisitions.
Transaction costs relate to the Company's acquisition and disposition transactions. Refer to the Capital Acquisitions and Dispositions section in this MD&A for further information.
Exhibit 10
Interest Expense
| | | | | | | | | | | | | | | | | | | | | | | | | | |
| | | | |
| ($ millions, except per boe amounts) | | | | | | | 2024 | | 2023 | | % Change | |
Interest expense on long-term debt | | | | | | | 194.3 | | | 126.0 | | | 54 | | |
| Unrealized loss on interest derivative contracts | | | | | | | — | | | 3.4 | | | (100) | | |
| Interest expense | | | | | | | 194.3 | | | 129.4 | | | 50 | | |
| Per boe - continuing operations | | | | | | | 2.78 | | | 2.56 | | | 9 | | |
| Per boe - total average daily production | | | | | | | 2.78 | | | 2.22 | | | 25 | | |
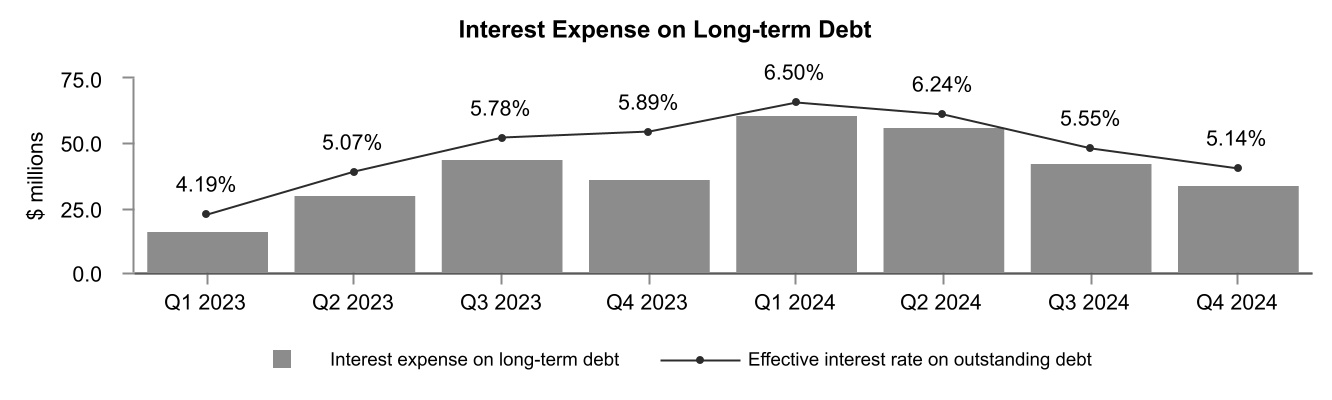
Interest expense on long-term debt increased 54 percent in the year ended December 31, 2024, compared to 2023, due to the Company's higher average debt balance and higher effective interest rate. For the year ended December 31, 2024, the Company's effective interest rate increased to 5.94 percent compared to 5.40 percent in 2023, due to the higher proportion of the Company's debt at floating rates in the first half of 2024.
At December 31, 2024, approximately 60 percent of the Company's outstanding long-term debt had fixed interest rates.
Exhibit 11
Foreign Exchange Gain
| | | | | | | | | | | | | | | | | | | | | | | | | | |
| | | | |
| ($ millions) | | | | | | | 2024 | | 2023 | | % Change | |
Translation of US dollar long-term debt | | | | | | | (155.6) | | | 16.8 | | | (1,026) | | |
| Realized gain on CCS - principal | | | | | | | 103.9 | | | 151.8 | | | (32) | | |
| Unrealized gain (loss) on CCS - principal | | | | | | | 43.5 | | | (155.8) | | | (128) | | |
Foreign exchange gain (loss) related to US dollar long-term debt | | | | | | | (8.2) | | | 12.8 | | | (164) | | |
Unrealized gain (loss) on foreign exchange swaps | | | | | | | (3.2) | | | 2.2 | | | (245) | | |
Other | | | | | | | 17.4 | | | (5.0) | | | (448) | | |
| Foreign exchange gain | | | | | | | 6.0 | | | 10.0 | | | (40) | | |
The Company records foreign exchange gains or losses on the period end translation of US dollar long-term debt and related accrued interest. The Company hedges its foreign exchange exposure on US dollar denominated long-term debt using cross currency swaps (“CCS”) to mitigate this foreign exchange exposure. During the year ended December 31, 2024, the Company recognized a foreign exchange loss related to US dollar long-term debt of $8.2 million, primarily related to the period end translation on US dollar private senior notes that do not have underlying CCS.
Share-based Compensation Expense
| | | | | | | | | | | | | | | | | | | | | | | | | | |
| | | | |
| ($ millions, except per boe amounts) | | | | | | | 2024 | | 2023 | | % Change | |
| Share-based compensation costs | | | | | | | 19.7 | | | 40.4 | | | (51) | | |
| Realized gain on equity derivative contracts | | | | | | | (4.5) | | | (25.6) | | | (82) | | |
| Unrealized loss on equity derivative contracts | | | | | | | 9.3 | | | 29.3 | | | (68) | | |
| Capitalized | | | | | | | (5.4) | | | (5.4) | | | — | | |
| Share-based compensation expense | | | | | | | 19.1 | | | 38.7 | | | (51) | | |
| Per boe | | | | | | | 0.27 | | | 0.77 | | | (65) | | |
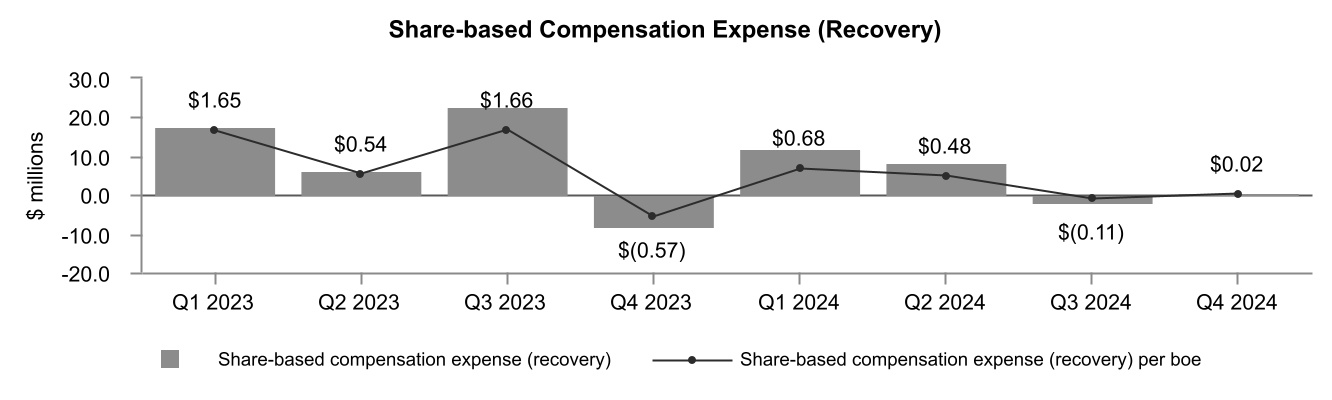
During the year ended December 31, 2024, the Company recorded share-based compensation ("SBC") costs of $19.7 million compared to $40.4 million in 2023. The decrease in SBC costs is primarily attributable to the lower share price at December 31, 2024 as compared to December 31, 2023 and lower performance achievements associated with the Performance Share Unit ("PSU") plan in 2024 relative to 2023.
In 2024, the Company recognized a realized gain of $4.5 million on in-the-money equity derivative contracts that matured in the first quarter of 2024. The realized gain is primarily due to the increase in the Company's share price on the maturity date compared to the hedge price at the time of grant.
During the year ended December 31, 2024, the Company recognized an unrealized loss on equity derivative contracts of $9.3 million compared to $29.3 million in 2023. The unrealized loss in 2024 was primarily due to the decrease in the Company's share price at December 31, 2024 compared to the grant date, as well as maturity of in-the-money equity derivative contracts in the first quarter of 2024.
Exhibit 12
The following table summarizes the number of restricted shares, Employee Share Value Plan ("ESVP") awards, PSUs, Deferred Share Units ("DSUs") and stock options outstanding:
| | | | | | | | | | | | | | |
| December 31, 2024 | | December 31, 2023 | |
Restricted Share Bonus Plan (1) | 1,119,165 | | | 1,380,685 | | |
| Employee Share Value Plan | 2,848,960 | | | 2,660,066 | | |
Performance Share Unit Plan (2) | 2,106,192 | | | 1,623,248 | | |
| Deferred Share Unit Plan | 1,951,870 | | | 1,728,423 | | |
Stock Option Plan (3) | 713,876 | | | 3,224,260 | | |
(1)At December 31, 2024, the Company was authorized to issue up to 9,041,281 common shares (December 31, 2023 - 9,774,533 common shares).
(2)Based on underlying units before any effect of performance multipliers.
(3)At December 31, 2024, the weighted average exercise price is $5.93 per share (December 31, 2023 - $4.74 per share).
As of the date of this MD&A, the Company had 1,119,165 restricted shares, 2,790,781 ESVP awards, 3,690,288 PSUs, 2,000,073 DSUs and 445,407 stock options outstanding.
Depletion, Depreciation and Amortization
| | | | | | | | | | | | | | | | | | | | | | | | | | |
| | | | |
| ($ millions, except per boe amounts) | | | | | | | 2024 | | 2023 | | % Change | |
Depletion and depreciation | | | | | | | 1,215.7 | | | 863.8 | | | 41 | | |
| Amortization of exploration and evaluation undeveloped land | | | | | | | 122.6 | | | 30.9 | | | 297 | | |
| Depletion, depreciation and amortization | | | | | | | 1,338.3 | | | 894.7 | | | 50 | | |
| Per boe | | | | | | | 19.13 | | | 17.72 | | | 8 | | |
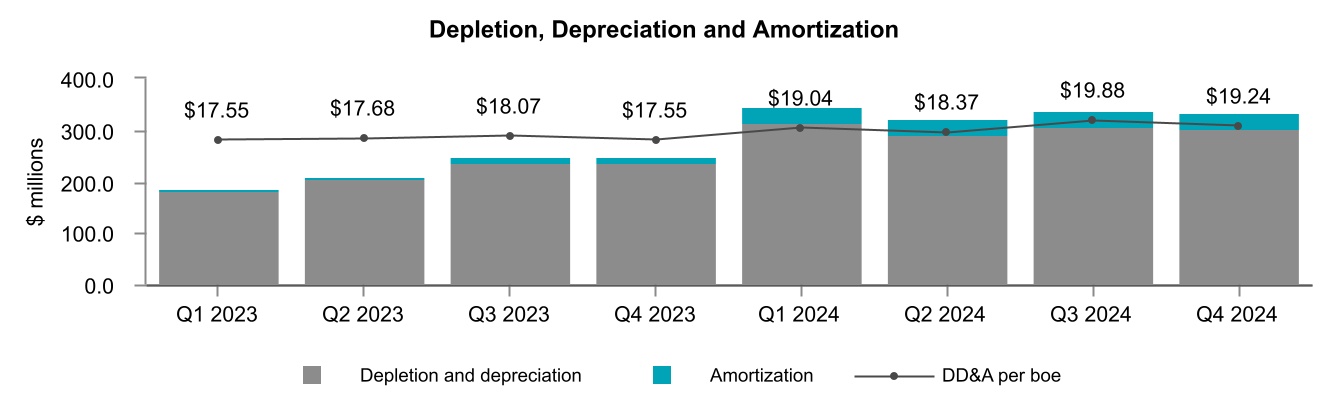
The Company's depletion, depreciation and amortization ("DD&A") rate increased to $19.13 per boe in 2024 compared to $17.72 per boe in 2023. The increase in the DD&A rate per boe in 2024 was due to the increase in amortization of exploration and evaluation ("E&E") undeveloped land, primarily as a result of the acquisition of the Alberta Montney assets in May 2023 and December 2023.
For the year ended December 31, 2024, DD&A expense increased 50 percent compared to 2023, due to higher production volumes and DD&A rates in 2024.
Exhibit 13
Impairment
| | | | | | | | | | | | | | | | | | | | | | | | | | |
| | | | |
| ($ millions, except per boe amounts) | | | | | | | 2024 | | 2023 | | % Change | |
| Impairment | | | | | | | 512.3 | | | 93.8 | | | 446 | | |
| Per boe | | | | | | | 7.32 | | | 1.86 | | | 294 | | |
Veren recognized an impairment loss of $512.3 million in the first quarter of 2024 and $93.8 million in 2023, related entirely to non-core assets classified as held for sale, which were subsequently disposed. At March 31, 2024, the Company classified certain non-core assets in its Southeast Saskatchewan and Southwest Saskatchewan CGUs as held for sale. Immediately prior to classifying the assets as held for sale and at the balance sheet date, the Company conducted a review of the assets' estimated recoverable amounts and recorded impairment losses of $486.8 million on Property, Plant & Equipment ("PP&E") and $25.5 million on goodwill. The recoverable amount was determined based on the assets' fair value less costs of disposal and based on expected consideration.
Taxes
| | | | | | | | | | | | | | | | | | | | | | | | | | |
| | | | |
| ($ millions) | | | | | | | 2024 | | 2023 | | % Change | |
| Current tax recovery | | | | | | | — | | | (0.7) | | | (100) | | |
| Deferred tax expense | | | | | | | 59.8 | | | 254.4 | | | (76) | | |
Current Tax Recovery
In the year ended December 31, 2024, the Company recorded current tax expense of nil, compared to a current tax recovery of $0.7 million for the year ended December 31, 2023. Refer to the Company's Annual Information Form ("AIF") for the year ended December 31, 2024 for information on the Company's expected tax horizon, which is available on SEDAR+ at www.sedarplus.ca. Additionally, our AIF forms part of our Form 40-F that is filed with the SEC and is available on EDGAR at www.sec.gov.
Deferred Tax Expense
In the year ended December 31, 2024, the Company recorded deferred tax expense of $59.8 million compared to $254.4 million in 2023. The decrease in the deferred tax expense in 2024 primarily relates to a decrease in net income before taxes.
Cash Flow from Operating Activities, Adjusted Funds Flow from Operations, Net Income and Adjusted Net Earnings from Operations
| | | | | | | | | | | | | | | | | | | | | | | | | | |
| | | | |
| ($ millions, except per share amounts) | | | | | | | 2024 | | 2023 | | % Change | |
| Cash flow from operating activities from continuing operations | | | | | | | 2,111.8 | | | 1,796.7 | | | 18 | | |
| | | | | | | | | | | | |
Adjusted funds flow from continuing operations (1) | | | | | | | 2,347.8 | | | 1,975.6 | | | 19 | | |
| | | | | | | | | | | | |
| Net income from continuing operations | | | | | | | 283.9 | | | 799.4 | | | (64) | | |
| Net income from continuing operations per share - diluted | | | | | | | 0.46 | | | 1.46 | | | (68) | | |
| | | | | | | | | | | | |
Adjusted net earnings from continuing operations (1) | | | | | | | 848.8 | | | 795.9 | | | 7 | | |
Adjusted net earnings from continuing operations per share - diluted (1) | | | | | | | 1.37 | | | 1.45 | | | (6) | | |
(1)Specified financial measure that does not have any standardized meaning prescribed by IFRS and, therefore, may not be comparable with the calculation of similar measures presented by other entities. Refer to the Specified Financial Measures section in this MD&A for further information.
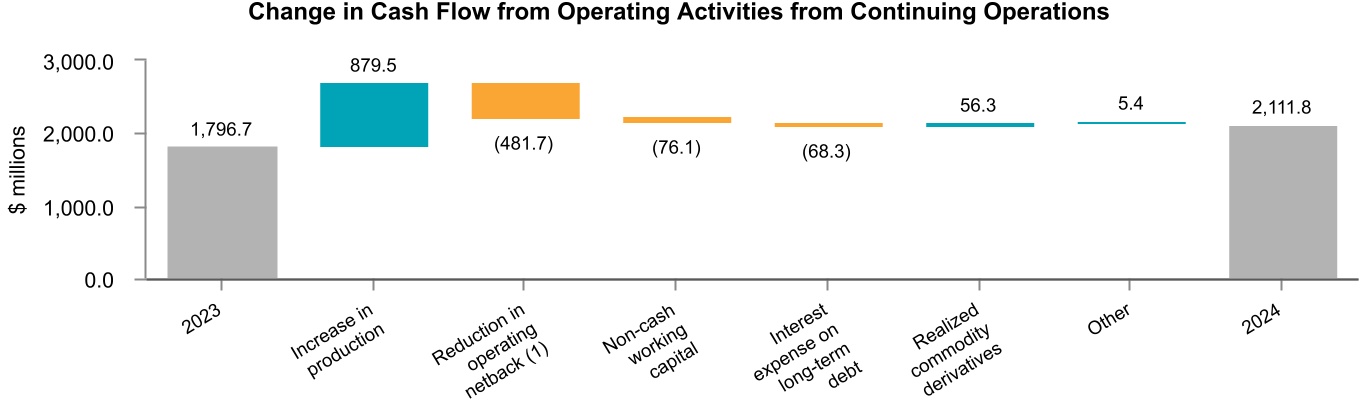
In the year ended December 31, 2024, cash flow from operating activities from continuing operations increased to $2.11 billion from $1.80 billion in 2023. The increase was primarily due to increased production and realized gains on commodity derivatives, partially offset by the lower operating netback, changes in non-cash working capital and higher interest expense on long-term debt.
Exhibit 14
(1)Specified financial measure that does not have any standardized meaning prescribed by IFRS and, therefore, may not be comparable with the calculation of similar measures presented by other entities. Refer to the Specified Financial Measures section in this MD&A for further information.
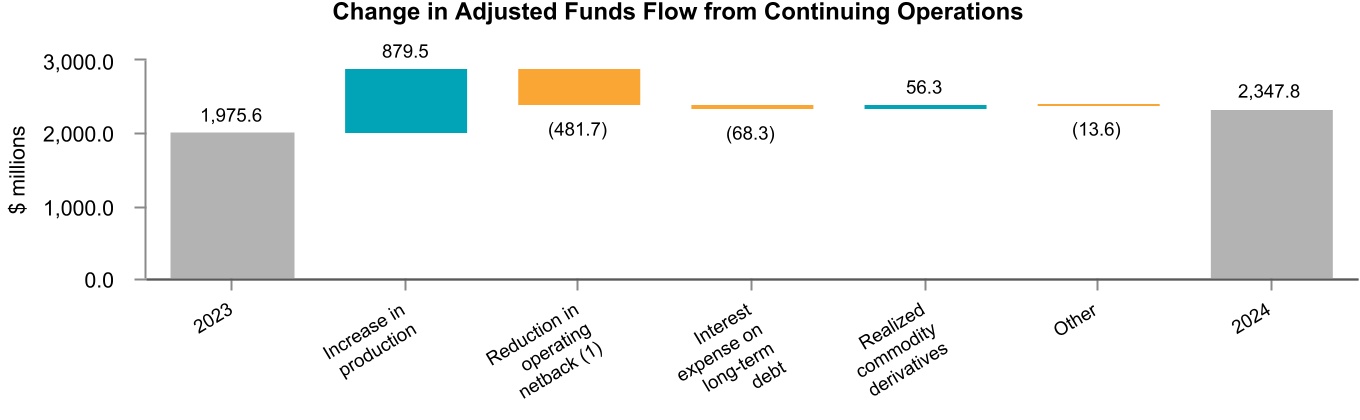
Adjusted funds flow from continuing operations increased in 2024 to $2.35 billion compared to $1.98 billion in 2023. The increase in adjusted funds flow from continuing operations was primarily due to increased production and realized gains on commodity derivatives, partially offset by the lower operating netback and higher interest expense on long-term debt.
Exhibit 15
(1)Specified financial measure that does not have any standardized meaning prescribed by IFRS and, therefore, may not be comparable with the calculation of similar measures presented by other entities. Refer to the Specified Financial Measures section in this MD&A for further information.
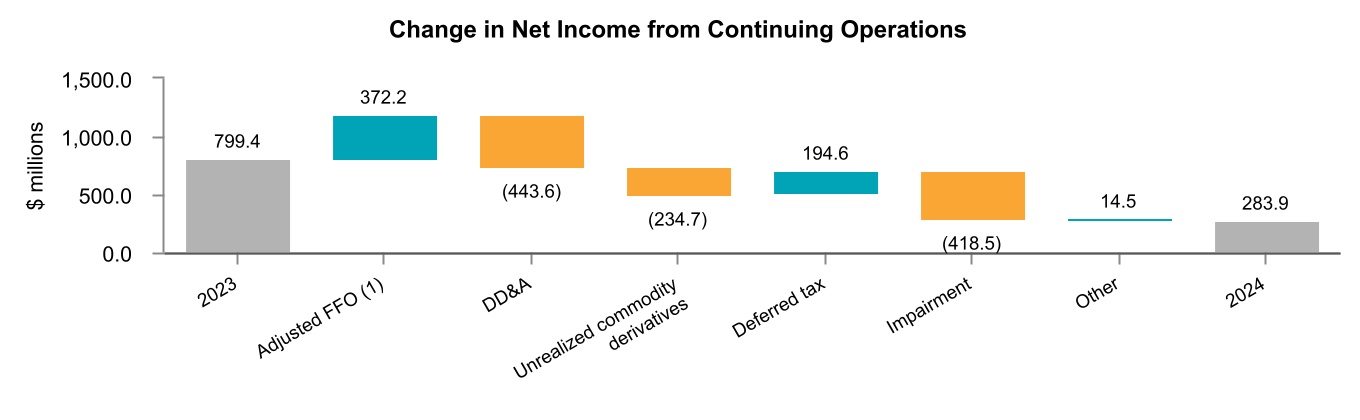
In the year ended December 31, 2024, the Company reported net income from continuing operations of $283.9 million ($0.46 per fully diluted share) compared to $799.4 million in 2023 ($1.46 per fully diluted share). The decrease in net income in 2024 was primarily due to higher DD&A, higher impairment expense related to assets held for sale and unrealized commodity derivative losses, partially offset by higher adjusted funds flow from continuing operations and lower deferred tax expense.
Exhibit 16
(1)Specified financial measure that does not have any standardized meaning prescribed by IFRS and, therefore, may not be comparable with the calculation of similar measures presented by other entities. Refer to the Specified Financial Measures section in this MD&A for further information.
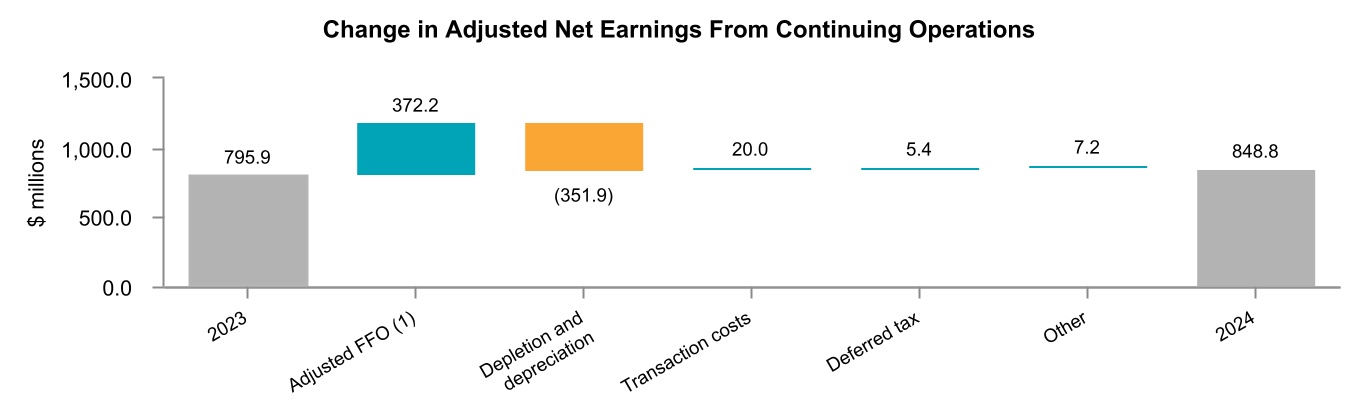
Adjusted net earnings from continuing operations in the year ended December 31, 2024 was $848.8 million ($1.37 per fully diluted share) compared to $795.9 million in 2023 ($1.45 per fully diluted share). The increase in adjusted net earnings from continuing operations was primarily due to higher adjusted funds flow from continuing operations, partially offset by higher depletion and depreciation expense.
Exhibit 17
(1)Specified financial measure that does not have any standardized meaning prescribed by IFRS and, therefore, may not be comparable with the calculation of similar measures presented by other entities. Refer to the Specified Financial Measures section in this MD&A for further information.
Excess Cash Flow
For the year ended December 31, 2024, corporate excess cash flow decreased to $641.6 million from $981.6 million in 2023. The decrease was primarily due to higher development capital and other expenditures.
Discontinued Operations
| | | | | | | | | | | | | | | | | | | | | | | | | | |
| | | | |
| ($ millions, except per share amounts) | | | | | | | 2024 | | 2023 | | % Change | |
| Cash flow from operating activities from discontinued operations | | | | | | | — | | | 399.0 | | | (100) | | |
| | | | | | | | | | | | |
Adjusted funds flow from discontinued operations (1) | | | | | | | — | | | 363.5 | | | (100) | | |
| | | | | | | | | | | | |
Net income (loss) from discontinued operations | | | | | | | (10.6) | | | (229.1) | | | (95) | | |
Net income (loss) from discontinued operations per share - diluted | | | | | | | (0.02) | | | (0.42) | | | (95) | | |
| | | | | | | | | | | | |
Adjusted net earnings from discontinued operations (1) | | | | | | | — | | | 136.7 | | | (100) | | |
Adjusted net earnings from discontinued operations per share - diluted (1) | | | | | | | — | | | 0.25 | | | (100) | | |
(1)Specified financial measure that does not have any standardized meaning prescribed by IFRS and, therefore, may not be comparable with the calculation of similar measures presented by other entities. Refer to the Specified Financial Measures section in this MD&A for further information.
In 2023, the Company disposed of its entire Northern U.S. CGU, which was comprised of producing assets in North Dakota and represented a distinct geographical area of the Company's operations. In accordance with IFRS 5 Non-current Assets Held for Sale and Discontinued Operations, the results from this CGU were classified as discontinued operations.
For the year ended December 31, 2024, the Company recognized a net loss from discontinued operations of $10.6 million compared to $229.1 million in 2023. The net loss in 2024 was a result of final closing adjustments related to the sale of the North Dakota assets.
Dividends Declared
| | | | | | | | | | | | | | | | | | | | | | | | | | |
| | | | |
| ($ millions, except per share amounts) | | | | | | | 2024 | | 2023 | | % Change | |
| Dividends declared | | | | | | | 284.6 | | | 211.9 | | | 34 | | |
| Dividends declared per share | | | | | | | 0.460 | | | 0.387 | | | 19 | | |
In October 2024, the Company declared a quarterly dividend of $0.115 per share that was paid on January 2, 2025.
In 2024, the Company declared total cash dividends of $0.460 per share compared to $0.387 per share in 2023.
Related Party Transactions
Key management personnel of the Company consists of its directors and executive officers. For the year ended December 31, 2024, the compensation recorded as short-term benefits relating to key management personnel was $6.7 million (year ended December 31, 2023 - $7.3 million). Short-term benefits include salaries and directors' fees, annual bonuses and other benefits. In addition, the Company provides share-based compensation under its RSU, PSU, DSU and stock option plans. For the year ended December 31, 2024, share-based compensation costs relating to key management personnel was $3.2 million (year ended December 31, 2023 - $19.4 million).
Capital Expenditures
| | | | | | | | | | | | | | | | | | | | | | | | | | |
| | | | |
| ($ millions) | | | | | | | 2024 | | 2023 | | % Change | |
Development capital expenditures (1) | | | | | | | 1,508.1 | | | 1,138.7 | | | 32 | | |
Land expenditures | | | | | | | 41.8 | | | 33.6 | | | 24 | | |
Capitalized administration (2) | | | | | | | 45.1 | | | 42.3 | | | 7 | | |
| Corporate assets | | | | | | | 5.7 | | | 5.9 | | | (3) | | |
Capital acquisitions (1) | | | | | | | 32.4 | | | 4,589.7 | | | (99) | | |
Capital dispositions (1) (3) | | | | | | | (1,037.7) | | | (613.6) | | | 69 | | |
Total (4) | | | | | | | 595.4 | | | 5,196.6 | | | (89) | | |
(1)Specified financial measures that does not have any standardized meaning prescribed by IFRS and, therefore, may not be comparable with the calculation of similar measures presented by other entities. Refer to the Specified Financial Measures section in this MD&A for further information.
(2)Capitalized administration excludes capitalized equity-settled SBC.
(3)Includes dispositions recorded through assets held for sale.
(4)Includes both continuing and discontinued operations.
Capital Acquisitions and Dispositions
Major Property Dispositions
North Dakota disposition
In 2023, the Company completed the disposition of its North Dakota assets for total consideration of $585.8 million, consisting of $504.6 million in cash and $81.2 million in deferred consideration receivable. In the year ended December 31, 2024, the Company incurred $12.7 million in final closing adjustments related to the disposition. Refer to the Discontinued Operations section in this MD&A for further information.
Southern Alberta disposition
On January 26, 2024, the Company completed the disposition of its Southern Alberta assets for total cash consideration of $37.1 million, including closing adjustments. Total consideration consisted of $12.1 million in cash and $25.0 million of deferred consideration receivable. These assets were recorded as assets held for sale at December 31, 2023.
Swan Hills disposition
On March 21, 2024, the Company completed the disposition of its Swan Hills assets in Northern Alberta for total cash consideration of $80.5 million, including closing adjustments. These assets were recorded as assets held for sale at December 31, 2023.
Non-core Saskatchewan disposition
On June 14, 2024, the Company completed the disposition of certain non-core assets in its Southeast Saskatchewan and Southwest Saskatchewan CGUs for total cash consideration of $531.6 million, including closing adjustments. These assets were recorded as assets held for sale at March 31, 2024.
Montney Infrastructure transaction
On October 9, 2024, Veren closed its strategic Alberta Montney infrastructure transaction, disposing of four Company owned batteries for cash consideration of $400.0 million. These assets were recorded as assets held for sale at September 30, 2024. Concurrent with the transaction, the Company re-negotiated certain processing and handling agreements in the Alberta Montney area to improve operational efficiencies. As part of these agreements, the Company gained operatorship of four third-party batteries and maintained operatorship of the batteries disposed. The agreements include a long-term fixed take-or-pay commitment, which has been recorded as a lease and a sale and leaseback in accordance with IFRS 16 Leases. See Note 14 - "Leases" in the audited consolidated financial statements for the year ended December 31, 2024 for additional information.
Development Capital Expenditures
| | | | | | | | | | | | | | | | | | | | | | | | | | |
| | | | |
| ($ millions) | | | | | | | 2024 | | 2023 | | % Change | |
Development capital expenditures from continuing operations (1) | | | | | | | 1,508.1 | | | 844.9 | | | 78 | | |
Development capital expenditures from discontinued operations (1) | | | | | | | — | | | 293.8 | | | (100) | | |
Development capital expenditures (1) | | | | | | | 1,508.1 | | | 1,138.7 | | | 32 | | |
(1)Specified financial measures that does not have any standardized meaning prescribed by IFRS and, therefore, may not be comparable with the calculation of similar measures presented by other entities. Refer to the Specified Financial Measures section in this MD&A for further information.
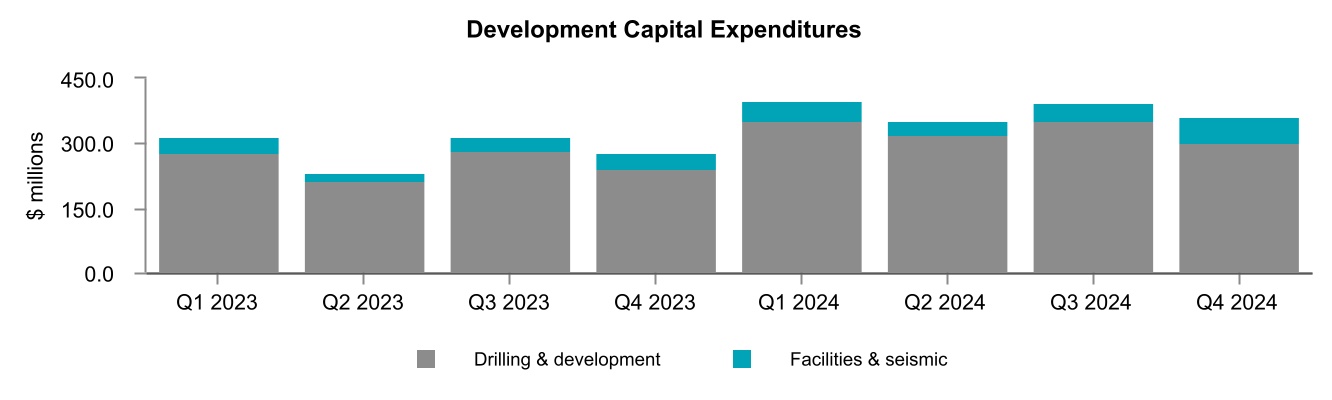
The Company's development capital expenditure for the year ended December 31, 2024 were $1.51 billion compared to $1.14 billion in 2023. The increased spending in 2024 was primarily focused on development in the Alberta Montney and Kaybob Duvernay areas. In the year ended December 31, 2024, 180 (165.8 net) wells were drilled and $184.3 million was spent on facilities and seismic (2023 - $121.8 million).
Refer to the Guidance section in this MD&A for Veren's development capital expenditure guidance for 2025.
Exhibit 18
Goodwill
The Company's goodwill balance is attributable to corporate acquisitions completed during the period from 2003 through 2023. The goodwill balance as at December 31, 2024 was $243.8 million compared to $275.9 million at December 31, 2023. The decrease of $32.1 million is primarily attributable to the impairment recorded on goodwill related to assets held for sale and the disposition of the Southern Alberta and Swan Hills assets in 2024.
Other Current Liabilities
At December 31, 2024, other current liabilities consist of $15.5 million related to the current portion of long-term share-based compensation, $59.5 million related to the current portion of lease liabilities, and $20.0 million related to decommissioning liability.
Other Long-Term Liabilities
At December 31, 2024, other long-term liabilities consist of $24.2 million of long-term compensation liability related to share-based compensation.
Lease Liability
At December 31, 2024, the Company had $611.1 million of lease liabilities for contracts related to facilities, office space, fleet vehicles, equipment and drilling rigs.
Decommissioning Liability
The decommissioning liability, including liabilities associated with assets held for sale, decreased by $158.8 million during 2024, from $738.8 million at December 31, 2023 to $580.0 million at December 31, 2024. The decrease primarily relates to liabilities disposed through assets held for sale and the Company's continued abandonment and reclamation program, partially offset by changes in estimated future costs. The liability is based on estimated undiscounted cash flows before inflation to settle the obligation of $827.9 million.
Liquidity and Capital Resources
| | | | | | | | | | | | | | |
Capitalization Table ($ millions, except share, per share, ratio and percent amounts) | December 31, 2024 | | December 31, 2023 | |
Net debt (1) | 2,477.9 | | | 3,738.1 | | |
Shares outstanding | 611,816,627 | | | 619,929,490 | | |
| Market price at end of period (per share) | 7.39 | | | 9.19 | | |
| Market capitalization | 4,521.3 | | | 5,697.2 | | |
Enterprise value (1) | 6,999.2 | | | 9,435.3 | | |
Net debt as a percentage of enterprise value (1) | 35 | | | 40 | | |
Adjusted funds flow from operations (1) (2) | 2,347.8 | | | 2,339.1 | | |
Net debt to adjusted funds flow from operations (1) (3) | 1.1 | | | 1.6 | | |
(1)Specified financial measure that does not have any standardized meaning prescribed by IFRS and, therefore, may not be comparable with the calculation of similar measures presented by other entities. Refer to the Specified Financial Measures section in this MD&A for further information.
(2)The sum of adjusted funds flow from operations for the trailing four quarters. Includes both continuing and discontinued operations.
(3)The net debt reflects the financing of acquisitions, however, the adjusted funds flow from operations only reflects adjusted funds flow from operations generated from the acquired properties since the closing date of the acquisitions.
At December 31, 2024, Veren's enterprise value was $7.00 billion and the Company was capitalized with 65 percent equity compared to $9.44 billion and 60 percent at December 31, 2023, respectively. The decrease in enterprise value at December 31, 2024 compared to December 31, 2023 is due to the reduction in net debt and the Company's lower market capitalization. The Company's net debt to adjusted funds flow from operations ratio at December 31, 2024, decreased to 1.1 times from 1.6 times at December 31, 2023. The decrease was largely due to the reduction in net debt as a result of capital dispositions and excess cash flow generation in the year ended December 31, 2024.
Veren's market capitalization decreased to $4.52 billion at December 31, 2024 from $5.70 billion at December 31, 2023, primarily due to the decrease in the Company's share price and the lower number of shares outstanding due to the impact of the shares purchased for cancellation under the Company's Normal Course Issuer Bid ("NCIB").
Exhibit 19
(1)The sum of adjusted funds flow from operations for the trailing four quarters.
(2)The net debt reflects the financing of acquisitions, however, the adjusted funds flow from operations only reflects adjusted funds flow from operations generated from the acquired properties since the closing date of the acquisitions.
At December 31, 2024, the Company had combined facilities of $2.36 billion. This includes a $2.26 billion syndicated unsecured credit facility and a $100.0 million unsecured operating credit facility, both with a current maturity date of November 26, 2028. Both of these facilities constitute revolving credit facilities and are extendible annually.
At December 31, 2024, the Company had available unused borrowing capacity on its revolving bank credit facilities of approximately $1.45 billion, including cash of $17.1 million.
The Company has a $60.0 million unsecured demand letter of credit facility. The Company had letters of credit in the amount of $43.0 million outstanding at December 31, 2024.
During the second quarter of 2024, the Company issued Cdn$1.00 billion of investment grade public senior notes, consisting of Cdn$550.0 million of 4.968% notes priced at par and due June 2029, and Cdn$450.0 million of 5.503% notes priced at par and due June 2034. The net proceeds from the offering were used to repay existing indebtedness under bank facilities, including fully retiring the Company's bank term loan.
At December 31, 2024, the Company had outstanding private senior notes of US$332.0 million and Cdn$65.0 million and public senior notes of Cdn$1.00 billion. The private senior notes have financial covenants similar to those of the combined credit facilities described above. There are no financial covenants associated with the public senior notes.
Concurrent with the issuance of private senior notes with total principal of US$259.5 million, the Company entered into CCS to manage the Company's foreign exchange risk. CCS fixes the US dollar amount of the individual tranches of notes for purposes of interest and principal repayments at a notional amount of $330.5 million. At December 31, 2024, $471.1 million of notional principal was repayable within one year. See Note 27 - "Financial Instruments and Derivatives" in the audited consolidated financial statements for the year ended December 31, 2024 for additional information.
The Company is in compliance with all debt covenants at December 31, 2024, which are listed in the table below:
| | | | | | | | | | | | | | |
Covenant Description | Maximum Ratio | | December 31, 2024 | |
Senior debt to adjusted EBITDA (1) (2) | 3.50 | | 0.97 | |
Total debt to adjusted EBITDA (1) (3) | 4.00 | | 0.97 | |
Total debt to capital (2) (3) (4) | 0.60 | | 0.27 | |
(1)Adjusted EBITDA is calculated as earnings before interest, taxes, depletion, depreciation, amortization, impairment and impairment reversals, adjusted for certain non-cash items. Adjusted EBITDA is calculated on a trailing 12 month basis adjusted for material acquisitions and dispositions.
(2)Senior debt is calculated as the sum of amounts drawn on the combined facilities, outstanding letters of credit and the principal amount of the senior notes.
(3)Total debt is calculated as the sum of senior debt plus subordinated debt. Veren does not have any subordinated debt.
(4)Capital is calculated as the sum of senior debt and shareholders' equity and excludes the effect of unrealized derivative gains or losses and the adoption of IFRS 16.
The Company's ongoing working capital requirements are expected to be financed through cash, adjusted funds flow from operations and its bank credit facilities.
Shareholders' Equity
At December 31, 2024, Veren had 611.8 million common shares issued and outstanding compared to 619.9 million common shares at December 31, 2023. The decrease of 8.1 million is primarily due to shares purchased for cancellation under the Company's current NCIB, partially offset by stock options exercised pursuant to the Stock Option Plan and shares issued pursuant to the Restricted Share Bonus Plan.
As of the date of this MD&A, the Company had 611,816,627 common shares outstanding.
Normal Course Issuer Bid
On March 7, 2024, the Company announced the approval by the Toronto Stock Exchange of its notice to implement an NCIB. The NCIB commenced on March 11, 2024 and is due to expire on March 10, 2025. The NCIB allows the Company to purchase, for cancellation, up to 61,663,522 common shares, or 10 percent of the Company's public float, as at February 29, 2024. The Company intends to renew the NCIB. The Company's previous NCIB commenced on March 9, 2023 and expired on March 8, 2024.
During the year ended December 31, 2024, the Company purchased 10.4 million common shares for total consideration of $101.1 million under its current NCIB. Total costs paid, including commissions, fees and taxes are recognized directly as a reduction in shareholders' equity. Under the NCIB, all common shares purchased are cancelled.
Contractual Obligations and Commitments
At December 31, 2024, the Company had contractual obligations and commitments as follows:
| | | | | | | | | | | | | | | | | | | | | | | | | | | | | | | | | | | |
| ($ millions) | | 1 year | | 2 to 3 years | | 4 to 5 years | | More than 5 years | | Total | |
Off balance sheet commitments | | | | | | | | | | | |
Operating (1) | | 16.1 | | | 20.9 | | | 10.4 | | | 2.6 | | | 50.0 | |
Gas processing | | 87.5 | | | 174.0 | | | 143.4 | | | 469.3 | | | 874.2 | |
Transportation | | 253.2 | | | 391.6 | | | 373.1 | | | 507.8 | | | 1,525.7 | | |
| | | | | | | | | | | |
Total contractual commitments (2) | | 356.8 | | 586.5 | | 526.9 | | 979.7 | | 2,449.9 | | |
(1)Includes operating costs on the Company's office space, net of $17.2 million recoveries from subleases.
(2)Excludes contracts accounted for under IFRS 16. See Note 14 - "Leases" in the annual consolidated financial statements for the year ended December 31, 2024 for further information.
| | | | | | | | | | | | | | | | | | | | | | | | | | | | | | | | | | | |
| ($ millions) | | 1 year | | 2 to 3 years | | 4 to 5 years | | More than 5 years | | Total | |
Other contractual commitments | | | | | | | | | | | |
Senior notes (1) | | 534.0 | | 134.8 | | | 640.5 | | | 561.4 | | | 1,870.7 | | |
Bank debt (2) | | 59.7 | | | 113.2 | | | 971.5 | | | — | | | 1,144.4 | | |
Total contractual commitments | | 593.7 | | | 248.0 | | | 1,612.0 | | | 561.4 | | | 3,015.1 | | |
(1)These amounts include the notional principal and interest payments pursuant to the related CCS which fix the amounts due in Canadian dollars. US dollar private senior notes that do not have any underlying CCS are translated at the period end foreign exchange rate.
(2)These amounts include interest based on debt outstanding and interest rates effective as at December 31, 2024, and includes undiscounted cash outflows pursuant to the CCS related to Secured Overnight Financing Rate loans.
Off Balance Sheet Arrangements
The Company has off-balance sheet arrangements consisting of various contracts which are entered into in the normal course of operations. Contracts that contain a lease are accounted for under IFRS 16 and recorded on the balance sheet as at December 31, 2024. All other contracts which are entered into in the normal course of operations are captured in the "off balance sheet commitments" table in the Contractual Obligations and Commitments section above and no asset or liability value has been assigned to these contracts on the balance sheet as at December 31, 2024.
Critical Accounting Estimates
The preparation of the Company’s consolidated financial statements requires management to adopt accounting policies that involve the use of significant estimates and assumptions. These estimates and assumptions are developed based on the best available information and are believed by management to be reasonable under the existing circumstances. New events or additional information may result in the revision of these estimates over time. A summary of the significant accounting policies used by Veren can be found in Note 3 - "Material Accounting Policies" in the audited consolidated financial statements for the year ended December 31, 2024. The following discussion outlines what management believes are the most critical policies involving the use of estimates and assumptions.
Oil and gas activities
Reserves estimates, although not reported as part of the Company’s consolidated financial statements, can have a significant effect on net income, assets and liabilities as a result of their impact on DD&A, decommissioning liability, deferred taxes, asset impairments and impairment reversals, and business combinations. Independent petroleum reservoir engineers perform evaluations of the Company’s oil and gas reserves on an annual or as needed basis. The estimation of oil and gas reserves is an inherently complex process requiring significant judgment. Estimates of economically recoverable oil and gas reserves are based upon a number of variables and assumptions such as production forecasts, commodity prices, costs and related future cash flows, all of which may vary considerably from actual results. These estimates are revised upward or downward over time, as additional information such as reservoir performance becomes available, or as economic conditions change.
For purposes of impairment testing, PP&E is aggregated into CGUs, based on separately identifiable and largely independent cash inflows. The determination of the Company’s CGUs is subject to judgment. Factors considered in the classification of CGUs include the integration between assets, shared infrastructures, the existence of common sales points, geography, geologic structure and the manner in which management monitors and makes decisions regarding operations.
The determination of technical feasibility and commercial viability is subject to judgment as it is based on the presence of reserves and results in the transfer of assets from E&E to PP&E.
Decommissioning liability
Upon retirement of its oil and gas assets, the Company anticipates incurring substantial costs associated with decommissioning. Estimates of these costs are subject to uncertainty associated with the method, timing and extent of future decommissioning activities. The liability, the related asset and the expense are based on estimates with respect to the cost and timing of decommissioning.
Business combinations
Business combinations are accounted for using the acquisition method of accounting. The determination of fair value often requires management to make assumptions and estimates about future events. The assumptions and estimates with respect to determining the fair value of PP&E and E&E assets acquired generally require the most judgment and include estimates of oil and gas reserves acquired, forecast benchmark commodity prices and discount rates. Changes in any of the assumptions or estimates used in determining the fair value of acquired assets and liabilities could impact the amounts assigned to assets, liabilities and goodwill. Future net earnings can be affected as a result of changes in future DD&A, asset impairment or goodwill impairment.
Fair value measurement
The estimated fair value of derivative instruments resulting in derivative assets and liabilities, by its very nature, is subject to measurement uncertainty. Estimates included in the determination of the fair value of derivative instruments include forward benchmark prices, discount rates, share price and forward foreign exchange rates.
Joint control
Judgment is required to determine when the Company has joint control over an arrangement, which requires an assessment of the capital and operating activities of the projects it undertakes with partners and when the decisions in relation to those activities require unanimous consent.
Share-based compensation
Compensation costs recorded pursuant to share-based compensation plans are subject to estimated fair values, forfeiture rates and the future attainment of performance criteria.
Income taxes
Tax regulations and legislation and the interpretations thereof are subject to change. In addition, deferred income tax assets and liabilities recognize the extent that temporary differences will be receivable and payable in future periods. The calculation of the related asset and liability involves a significant amount of estimation including an evaluation of when the temporary differences will reverse, an analysis of the amount of future taxable earnings, expected cash flows from estimated proved plus probable oil and gas reserves and the application of tax laws. Changes in tax regulations and legislation and the other assumptions listed are subject to measurement uncertainty.
Risk Factors
Financial Risk
Financial risk is the risk of loss or lost opportunity resulting from financial management and market conditions that could have an impact on Veren’s business. Financial risks the Company is exposed to include: marketing production at an acceptable price given market conditions and market access; finding and producing oil and gas reserves at a reasonable cost; volatility in market prices for oil and natural gas; volatility in crude oil price differentials; fluctuations in foreign exchange and interest rates; tariffs; stock market volatility; debt service which may limit timing or amount of dividends as well as market price of shares; the continued availability of adequate debt and equity financing and cash flow to fund planned expenditures; sufficient liquidity for future operations; lost revenue or increased expenditures as a result of delayed or denied environmental, safety or regulatory approvals; adverse changes to income tax laws or other laws or government incentive programs and regulations relating to the oil and gas industry; cost of capital risk to carry out the Company’s operations; and uncertainties associated with credit facilities and counterparty credit risk.
Operational Risk
Operational risk is the risk of loss or lost opportunity resulting from operating and capital activities that, by their nature, could have an impact on the Company’s ability to achieve objectives. Operational risks to which Veren is exposed include: uncertainties associated with estimating oil and natural gas reserves; incorrect assessments of the value of acquisitions and exploration and development programs; failure to realize the anticipated benefits of acquisitions and dispositions; uncertainties associated with partner plans and approvals; operational matters related to non-operated properties; inability to secure adequate product transportation including sufficient crude-by-rail or other alternate transportation; delays in business operations, pipeline restrictions, public infrastructure constraints including blockades and blowouts; unforeseen title defects; increased competition for, among other things, capital, acquisitions of oil and gas reserves and undeveloped lands; competition for and availability of qualified personnel or management; outbreaks; mobility restrictions, loss and health of key personnel; unexpected geological, technical, drilling, construction and processing problems; availability of insurance; competitive action by other companies; the ability of suppliers to meet commitments and risks; and cyber security risks.
Potential drought conditions can result in a higher likelihood of water restrictions and increased susceptibility to wildfire conditions. During drought conditions provincial regulators can restrict water license allocations and limit the water we use that are critical to our operations. Wildfires may restrict the Company's ability to access and operate its properties and cause operational difficulties, including damage to equipment and infrastructure. Wildfires also increase the risk of personnel injury as a result of dangerous working conditions.
Safety, Environmental and Regulatory Risks
Safety, environmental and regulatory risks are the risks of loss or lost opportunity resulting from changes to laws governing safety, the environment, royalties and taxation. Safety, environmental and regulatory risks Veren is exposed to include: the risk of wildfires or drought; indigenous land claims; uncertainties associated with regulatory approvals; uncertainty of government policy changes; the risk of carrying out operations with minimal environmental impact; changes in or adoption of new laws and regulations or changes in how they are interpreted or enforced; obtaining required approvals of regulatory authorities and stakeholder support for activities and growth plans.
The Company’s operations are subject to costs being incurred to pay carbon taxes, to reduce Greenhouse Gas ("GHG") emissions (including methane emissions) and to perform necessary monitoring, measurement, verification and reporting of GHG emissions. Future environmental legislation may require further reductions in emissions from the Company’s operations and result in increased capital and operational expenditures related to the transition to a low-carbon economy.
Refer to the Company's Annual Information Form for the year ended December 31, 2024 for additional information on the Company's risk factors.
Risk Management
Veren is committed to identifying and managing its risks in the near term, as well as on a strategic and longer term basis at all levels in the organization in accordance with the Company's Board-approved Risk Management and Counterparty Credit Policy and risk management programs. Issues affecting, or with the potential to affect, our assets, operations and/or reputation, are generally of a strategic nature or are emerging issues that can be identified early and then managed, but occasionally include unforeseen issues that arise unexpectedly and must be managed on an urgent basis. Veren takes a proactive approach to the identification and management of issues that can affect the Company’s assets, operations and/or reputation and have established consistent and clear policies, procedures, guidelines and responsibilities for issue identification and management.
Specific actions Veren takes to ensure effective risk management include but are not limited to: employing qualified professional and technical staff; concentrating in a limited number of areas with lower risk development projects; utilizing market proven technology for finding and developing oil and gas reserves; constructing quality, environmentally sensitive and safe production facilities; adopting and communicating sound policies governing all areas of our business; maximizing operational control of drilling and production operations; strategic hedging program including commodity prices, interest and foreign exchange rates; adhering to conservative borrowing guidelines and maintaining significant liquidity; monitoring counterparty creditworthiness and obtaining supplementary credit protection when warranted.
Changes in Accounting Policies
Presentation of Financial Statements
IAS 1 Presentation of Financial Statements was amended in January 2020 by the International Accounting Standards Board to clarify the presentation requirements of liabilities as either current or non-current within the statement of financial position. The Company adopted this amendment in 2024 and the adoption did not have an impact on the Company's annual consolidated financial statements.
Income Taxes
IAS 12 Income Taxes was amended in May 2023 by the International Accounting Standards Board to provide guidance on deferred taxes arising in jurisdictions implementing the Pillar Two model rules published by the Organisation for Economic Co-operation and Development. This amendment was effective immediately and has been adopted by the Company with no impact to the Company's annual consolidated financial statements.
Lease Liability in a Sale and Leaseback
In September 2022, the International Accounting Standards Board issued narrow-scope amendments to IFRS 16 Leases, which applies to sale and leaseback transactions that include variable lease payments. The amendments specify that no gain or loss can be recognized on the rights retained by the seller-lessee, and require the inclusion of variable payments that do not depend on an index or rate in the initial measurement of the right-of-use asset and lease liability. These amendments were effective for fiscal years beginning on or after January 1, 2024. In the current accounting period, the Company adopted the narrow-scope amendments. See Note 14 - "Leases" in the annual consolidated financial statements for the year ended December 31, 2024 for additional information regarding transactions impacted by these amendments.
New accounting standards and amendments not yet adopted
Presentation and Disclosure in Financial Statements
IFRS 18 Presentation and Disclosure in Financial Statements was issued in April 2024 by the International Accounting Standards Board and replaces IAS 1 Presentation of Financial Statements. The Standard introduces a defined structure to the statements of comprehensive income and specific disclosure requirements related to the same. The Standard is required to be adopted retrospectively and is effective for fiscal years beginning on or after January 1, 2027, with early adoption permitted. The Company is evaluating the impact that this standard will have on the consolidated financial statements.
Financial Instruments and Financial Instruments: Disclosures
IFRS 9 Financial Instruments and IFRS 7 Financial Instruments: Disclosures were amended in May 2024 to clarify the date of recognition and derecognition of financial assets and liabilities. The amendments are effective for fiscal years beginning on or after January 1, 2026, with early adoption permitted. The Company is evaluating the impact that this amendment will have on the consolidated financial statements.
Selected Annual Information
| | | | | | | | | | | | | | | | | | | | | | |
| ($ millions, except per share amounts) | 2024 | | 2023 | | 2022 | | | |
| Oil and gas sales from continuing operations | 4,271.3 | | | 3,499.0 | | | 3,847.0 | | | | |
| Total oil and gas sales | 4,271.3 | | | 4,111.9 | | | 4,493.1 | | | | |
| | | | | | | | |
| Average daily production from continuing operations | | | | | | | | |
| Crude oil and condensate (bbls/d) | 107,541 | | | 88,087 | | | 79,323 | | | | |
| NGLs (bbls/d) | 17,533 | | | 15,026 | | | 13,079 | | | | |
| Natural gas (mcf/d) | 396,534 | | | 211,275 | | | 128,099 | | | | |
| Production from continuing operations (boe/d) | 191,163 | | | 138,326 | | | 113,752 | | | | |
| Total average daily production (boe/d) | 191,163 | | | 159,411 | | | 132,282 | | | | |
| | | | | | | | |
| Net income from continuing operations | 283.9 | | | 799.4 | | | 1,146.7 | | | | |
| Net income per share from continuing operations - diluted | 0.46 | | | 1.46 | | | 2.01 | | | | |
| | | | | | | | |
| Net income | 273.3 | | | 570.3 | | | 1,483.4 | | | | |
| Net income per share - diluted | 0.44 | | | 1.04 | | | 2.60 | | | | |
| | | | | | | | |
Adjusted net earnings from continuing operations (1) | 848.8 | | | 795.9 | | | 764.1 | | | | |
Adjusted net earnings from continuing operations per share – diluted (1) | 1.37 | | | 1.45 | | | 1.34 | | | | |
| | | | | | | | |
Adjusted net earnings from operations (1) | 848.8 | | | 932.6 | | 965.7 | | | |
Adjusted net earnings from operations per share – diluted (1) | 1.37 | | | 1.70 | | 1.69 | | | |
| | | | | | | | |
| Cash flow from operating activities from continuing operations | 2,111.8 | | | 1,796.7 | | | 1,828.7 | | | | |
| Cash flow from operating activities | 2,111.8 | | | 2,195.7 | | | 2,192.2 | | | | |
| | | | | | | | |
Adjusted funds flow from continuing operations (1) | 2,347.8 | | | 1,975.6 | | | 1,848.6 | | | | |
Adjusted funds flow from operations (1) | 2,347.8 | | | 2,339.1 | | | 2,232.4 | | | | |
| | | | | | | | |
Adjusted working capital surplus (deficiency) (1) | (90.9) | | | (196.3) | | | 95.1 | | | | |
| Total assets | 11,751.0 | | | 12,775.7 | | | 9,486.4 | | | | |
| Total liabilities | 4,990.0 | | | 5,908.2 | | | 2,993.0 | | | | |
Net debt (1) | 2,477.9 | | | 3,738.1 | | | 1,154.7 | | | | |
| | | | | | | | |
| Weighted average shares - diluted (millions) | 618.9 | | | 548.3 | | | 571.1 | | | | |
| | | | | | | | |
Total capital acquisitions (1) | 32.4 | | | 4,589.7 | | | 90.7 | | | | |
Total capital dispositions (1) | (1,037.7) | | | (613.6) | | | (283.6) | | | | |
Development capital expenditures from continuing operations (1) | 1,508.1 | | | 844.9 | | | 698.0 | | | | |
Development capital expenditures (1) | 1,508.1 | | | 1,138.7 | | | 956.1 | | | | |
| | | | | | | | |
| Dividends declared | 284.6 | | | 211.9 | | | 200.6 | | | | |
| Dividends declared per share | 0.460 | | | 0.387 | | | 0.360 | | | | |
(1)Specified financial measure that does not have any standardized meaning prescribed by IFRS and, therefore, may not be comparable with the calculation of similar measures presented by other entities. Refer to the Specified Financial Measures section in this MD&A for further information.
Veren’s oil and gas sales, cash flow from operating activities, adjusted funds flow from operations and total assets have fluctuated for the years 2022 through 2024, primarily due to changes in the Cdn$ WTI benchmark prices and corporate oil price differentials, numerous acquisitions and dispositions and the Company's drilling program.
Net income over the past three years has fluctuated, primarily due to unrealized derivative gains and losses on commodity contracts, which fluctuate with changes in market conditions, and PP&E impairment charges and reversals, along with associated fluctuations in deferred tax expense (recovery).
Adjusted net earnings from operations fluctuated over the past three years, primarily due to changes in adjusted funds flow from operations, depletion and share-based compensation expense along with associated fluctuations in deferred tax expense (recovery).
Summary of Quarterly Results
| | | | | | | | | | | | | | | | | | | | | | | | | | | | | | | | |
| 2024 | 2023 |
| ($ millions, except per share amounts) | Q4 | Q3 | Q2 | Q1 | | Q4 | Q3 | Q2 | Q1 | |
| Oil and gas sales from continuing operations | 1,034.1 | | 992.9 | | 1,136.4 | | 1,107.9 | | | 946.7 | | 998.7 | | 791.6 | | 762.0 | | |
| Total oil and gas sales | 1,034.1 | | 992.9 | | 1,136.4 | | 1,107.9 | | | 1,012.4 | | 1,236.3 | | 949.6 | | 913.6 | | |
| | | | | | | | | | |
| Average daily production from continuing operations | | | | | | | | | | |
| Crude oil and condensate (bbls/d) | 103,885 | | 102,373 | | 110,399 | | 113,607 | | | 96,144 | | 92,824 | | 84,944 | | 78,191 | | |
| NGLs (bbls/d) | 17,165 | | 16,859 | | 17,041 | | 19,077 | | | 16,023 | | 16,119 | | 14,360 | | 13,562 | | |
| Natural gas (mcf/d) | 406,027 | | 393,582 | | 391,249 | | 395,204 | | | 248,306 | | 244,777 | | 192,964 | | 157,690 | | |
| Production from continuing operations (boe/d) | 188,721 | | 184,829 | | 192,648 | | 198,551 | | | 153,551 | | 149,739 | | 131,465 | | 118,035 | | |
| Total average daily production (boe/d) | 188,721 | | 184,829 | | 192,648 | | 198,551 | | | 162,269 | | 180,581 | | 155,031 | | 139,280 | | |
| | | | | | | | | | |
| Net income (loss) from continuing operations | 144.7 | | 277.2 | | 260.9 | | (398.9) | | | 302.6 | | 133.6 | | 178.4 | | 184.8 | | |
| Net income (loss) per share from continuing operations - diluted | 0.24 | | 0.45 | | 0.42 | | (0.64) | | | 0.54 | | 0.25 | | 0.33 | | 0.33 | | |
| | | | | | | | | | |
Net income (loss) | 146.8 | | 277.2 | | 261.0 | | (411.7) | | | 951.2 | | (809.9) | | 212.3 | | 216.7 | | |
| Net income (loss) per share – diluted | 0.24 | | 0.45 | | 0.42 | | (0.66) | | | 1.70 | | (1.52) | | 0.39 | | 0.39 | | |
| | | | | | | | | | |
Adjusted net earnings from continuing operations (1) | 247.0 | | 177.0 | | 237.8 | | 187.0 | | | 210.0 | | 226.6 | | 171.6 | | 187.7 | | |
Adjusted net earnings from continuing operations per share – diluted (1) | 0.40 | | 0.29 | | 0.38 | | 0.30 | | | 0.37 | | 0.42 | | 0.32 | | 0.34 | | |
| | | | | | | | | | |
Adjusted net earnings from operations (1) | 247.0 | | 177.0 | | 237.8 | | 187.0 | | | 192.8 | | 315.5 | | 205.4 | | 218.9 | | |
Adjusted net earnings from operations per share – diluted (1) | 0.40 | | 0.29 | | 0.38 | | 0.30 | | | 0.34 | | 0.59 | | 0.38 | | 0.40 | | |
| | | | | | | | | | |
| Cash flow from operating activities from continuing operations | 513.1 | | 561.7 | | 625.8 | | 411.2 | | | 524.0 | | 537.1 | | 365.9 | | 369.8 | | |
| Cash flow from operating activities | 513.1 | | 561.7 | | 625.8 | | 411.2 | | | 611.3 | | 648.9 | | 462.1 | | 473.4 | | |
| | | | | | | | | | |
Adjusted funds flow from continuing operations (1) | 619.6 | | 548.3 | | 611.7 | | 568.2 | | | 535.1 | | 548.6 | | 453.4 | | 438.6 | | |
Adjusted funds flow from operations (1) | 619.6 | | 548.3 | | 611.7 | | 568.2 | | | 574.5 | | 687.1 | | 552.6 | | 524.9 | | |
| | | | | | | | | | |
Adjusted working capital deficiency (1) | (90.9) | | (190.4) | | (140.4) | | (82.0) | | | (196.3) | | (45.7) | | (82.5) | | (79.9) | | |
| Total assets | 11,751.0 | | 11,511.9 | | 11,336.4 | | 12,035.5 | | | 12,775.7 | | 10,371.0 | | 11,277.2 | | 9,759.6 | | |
| Total liabilities | 4,990.0 | | 4,793.7 | | 4,811.5 | | 5,659.6 | | | 5,908.2 | | 4,660.6 | | 4,597.5 | | 3,113.8 | | |
Net debt (1) | 2,477.9 | | 2,959.4 | | 2,962.7 | | 3,582.9 | | | 3,738.1 | | 2,876.2 | | 3,000.7 | | 1,436.3 | | |
| | | | | | | | | | |
| Weighted average shares – diluted (millions) | 615.8 | | 617.5 | | 620.3 | | 622.6 | | | 559.1 | | 536.9 | | 545.3 | | 552.7 | | |
| | | | | | | | | | |
Total capital acquisitions (1) | 6.0 | | 26.4 | | — | | — | | | 2,513.9 | | 1.1 | | 1,702.7 | | 372.0 | | |
Total capital dispositions (1) | (389.4) | | (1.4) | | (541.1) | | (105.8) | | | (602.4) | | (0.2) | | (8.4) | | (2.6) | | |
Development capital expenditures from continuing operations (1) | 363.0 | | 395.9 | | 350.6 | | 398.6 | | | 276.0 | | 260.4 | | 123.5 | | 185.0 | | |
Development capital expenditures (1) | 363.0 | | 395.9 | | 350.6 | | 398.6 | | | 278.9 | | 315.5 | | 230.1 | | 314.2 | | |
| | | | | | | | | | |
| Dividends declared | 70.7 | | 70.9 | | 71.7 | | 71.3 | | | 68.3 | | 71.7 | | 54.8 | | 17.1 | | |
| Dividends declared per share | 0.115 | | 0.115 | | 0.115 | | 0.115 | | | 0.120 | | 0.135 | | 0.100 | | 0.032 | | |
(1)Specified financial measure that does not have any standardized meaning prescribed by IFRS and, therefore, may not be comparable with the calculation of similar measures presented by other entities. Refer to the Specified Financial Measures section in this MD&A for further information.
Over the past eight quarters, the Company's oil and gas sales have fluctuated due to volatility in the crude oil, condensate and natural gas benchmark prices, changes in production and fluctuations in corporate oil price differentials. The Company's production has fluctuated due to changes in its development capital spending levels, acquisitions and dispositions and natural declines.
Net income (loss) has fluctuated over the past eight quarters, primarily due to changes in PP&E impairment charges and reversals, changes in adjusted funds flow from operations, unrealized derivative gains and losses, which fluctuate with changes in forward market prices and foreign exchange rates, gains and losses on capital dispositions, and fluctuations in deferred tax expense.
Adjusted net earnings from operations has fluctuated over the past eight quarters, primarily due to changes in adjusted funds flow from operations, depletion and share-based compensation expense along with associated fluctuations in deferred tax expense.
Development capital expenditures have also fluctuated throughout this period due to the timing of acquisitions, dispositions and changes in the Company's development capital spending levels which vary based on a number of factors, including the prevailing commodity price environment.
Fourth Quarter 2024 Review
•Veren's total production averaged 188,721 boe/d in the fourth quarter of 2024, weighted 64 percent towards crude oil and liquids.
•Adjusted funds flow from operations totaled $619.6 million in the fourth quarter of 2024, a 13 percent increase from $548.3 million in the third quarter of 2024. The increase in adjusted funds flow was primarily due to higher production levels.
•During the fourth quarter of 2024, the Company spent $300.4 million on drilling and development activities, drilling 47 (41.9 net) wells. Veren also spent $62.6 million on facilities and seismic, for total development capital expenditures of $363.0 million.
•Net debt decreased by $481.5 million in the fourth quarter of 2024 to $2.48 billion or 1.1 times trailing adjusted funds flow from operations. The decrease was primarily due to proceeds from the Alberta Montney infrastructure transaction and excess cash flow generation.
Disclosure Controls and Procedures
Disclosure controls and procedures (“DC&P”), as defined in Rule 13a-15 under the US Securities Exchange Act of 1934 and as defined in Canada by National Instrument 52-109 Certification of Disclosure in Issuers’ Annual and Interim Filings, are designed to provide reasonable assurance that information required to be disclosed in the Company’s annual filings, interim filings or other reports filed, or submitted by the Company under securities legislation is recorded, processed, summarized and reported within the time periods specified under securities legislation and include controls and procedures designed to ensure that information required to be so disclosed is accumulated and communicated to management, including the Chief Executive Officer and the Chief Financial Officer, as appropriate, to allow timely decisions regarding required disclosure. The Chief Executive Officer and the Chief Financial Officer of Veren evaluated the effectiveness of the design and operation of the Company’s DC&P. Based on that evaluation, the Chief Executive Officer and Chief Financial Officer concluded that Veren’s DC&P were effective as at December 31, 2024.
Internal Controls over Financial Reporting
Internal control over financial reporting (“ICFR”), as defined in Rule 13a-15 under the US Securities Exchange Act of 1934 and as defined in Canada by National Instrument 52-109 - Certification of Disclosure in Issuers' Annual and Interim Filings, includes those policies and procedures that:
1.pertain to the maintenance of records that, in reasonable detail, accurately and fairly reflect transactions and dispositions of assets of Veren;
2.are designed to provide reasonable assurance that transactions are recorded as necessary to permit preparation of financial statements in accordance with generally accepted accounting principles and that receipts and expenditures of Veren are being made in accordance with authorizations of management and Directors of Veren; and
3.are designed to provide reasonable assurance regarding prevention or timely detection of unauthorized acquisition, use, or disposition of the Company’s assets that could have a material effect on the annual financial statements or interim financial reports.
Management is responsible for establishing and maintaining ICFR for Veren. They have, as at the financial year ended December 31, 2024, designed ICFR, or caused it to be designed under their supervision, to provide reasonable assurance regarding the reliability of financial reporting and the preparation of financial statements for external purposes in accordance with IFRS. The control framework Veren’s officers used to design the Company’s ICFR is the Internal Control-Integrated Framework (2013) issued by the Committee of Sponsoring Organizations of the Treadway Commission (“COSO”).
Under the supervision of Management, Veren conducted an evaluation of the effectiveness of the Company’s ICFR as at December 31, 2024 based on the COSO Framework. Based on this evaluation, Management concluded that as of December 31, 2024, Veren maintained effective ICFR.
The effectiveness of Veren's ICFR as of December 31, 2024 was audited by PricewaterhouseCoopers LLP, as reflected in their report accompanying the Company's financial statements for the year ended December 31, 2024. There were no changes in Veren’s ICFR during the year ended December 31, 2024 that materially affected, or are reasonably likely to materially affect, the Company’s ICFR.
It should be noted that while Veren’s officers believe that the Company’s controls provide a reasonable level of assurance with regard to their effectiveness, they do not expect that the DC&P and ICFR will prevent all errors and fraud. A control system, no matter how well conceived or operated, can provide only reasonable, but not absolute, assurance that the objectives of the control system are met.
Guidance
Veren's guidance for 2025 is as follows:
| | | | | | | | | | |
| | | | |
Total Annual Average Production (boe/d) (1) | | | 188,000 - 196,000 | |
Development Capital Expenditures ($ millions) (2) (3) | | | $1,475 - $1,575 | |
| | | | |
| Other Information | | | | |
| Annual operating expenses ($/boe) | | | $12.75 - $13.75 | |
| Royalties | | | 10.75% - 11.75% | |
| | | | |
| | | | |
| | | | |
| | | | |
| | | | |
| | | | |
| | | | |
| | | | |
| | | | |
(1)Total annual average production (boe/d) is comprised of approximately 65% Oil, Condensate & NGLs and 35% Natural Gas.
(2)Specified financial measures that does not have any standardized meaning prescribed by IFRS and, therefore, may not be comparable with the calculation of similar measures presented by other entities. Refer to the Specified Financial Measures section in this MD&A for further information.
(3)Excludes capitalized administration of approximately $40.0 million, in addition to land expenditures and net property acquisitions and dispositions. Development capital expenditures spend is allocated on an approximate basis as follows: 85% drilling & development and 15% facilities & seismic.
Return of Capital Outlook
| | | | | | | | | | | | | | |
Base Dividend | | | | |
| | | | |
| Current quarterly base dividend per share | | | $0.115 | |
| Total Return of Capital | | | | |
% of excess cash flow (1) | | | 60% | |
(1)Total return of capital is based on a framework that targets to return to shareholders 60% of excess cash flow on an annual basis. Refer to the Specified Financial Measures section in this MD&A for further information on base dividends and excess cash flow.
Additional information relating to Veren, including the Company's December 31, 2024 AIF, which along with other relevant documents are available on SEDAR+ at www.sedarplus.ca. Additionally, our AIF forms part of our Form 40-F that is filed with the SEC and is available on EDGAR at www.sec.gov.
Specified Financial Measures
Throughout this MD&A, the Company uses the terms “total operating netback”, "total netback”, "operating netback", "netback", “adjusted funds flow from operations” (or "adjusted FFO"), “adjusted funds flow from continuing operations”, “adjusted funds flow from discontinued operations”, "excess cash flow", "base dividends", "total return of capital", "adjusted working capital surplus (deficiency)", “net debt”, “enterprise value”, “net debt to adjusted funds flow from operations”, "net debt as a percentage of enterprise value", “adjusted net earnings from operations”, “adjusted net earnings from continuing operations”, “adjusted net earnings from continuing operations per share – diluted”, “adjusted net earnings from discontinued operations”, “adjusted net earnings from discontinued operations per share – diluted”, “adjusted net earnings from operations per share - diluted”, "development capital expenditures", "development capital expenditures from continuing operations", "development capital expenditures from discontinued operations", "total capital acquisitions", "total capital dispositions", "net general and administrative expenses" and "net general and administrative expenses per boe". These terms do not have any standardized meaning as prescribed by the International Accounting Standards Board and, therefore, may not be comparable with the calculation of similar measures presented by other issuers.
Total operating netback and total netback are historical non-GAAP financial measures. Total operating netback is calculated as oil and gas sales, less royalties, operating and transportation expenses. Total netback is calculated as total operating netback plus realized commodity derivative gains and losses. Total operating netback and total netback are common metrics used in the oil and gas industry and are used to measure operating results to better analyze performance against prior periods on a comparable basis. The most directly comparable financial measure to total operating netback and total netback is oil and gas sales.
The following table reconciles oil and gas sales to total operating netback and total netback:
| | | | | | | | | | | | | | | | | | | | | | | | | | |
| | | | |
| ($ millions) | | | | | | | 2024 | | 2023 | | % Change | |
| Oil and gas sales | | | | | | | 4,271.3 | | | 3,499.0 | | | 22 | | |
| Royalties | | | | | | | (441.7) | | | (375.3) | | | 18 | | |
| Operating expenses | | | | | | | (941.4) | | | (770.5) | | | 22 | | |
| Transportation expenses | | | | | | | (311.5) | | | (174.3) | | | 79 | | |
| Total operating netback | | | | | | | 2,576.7 | | | 2,178.9 | | | 18 | | |
Realized gain on commodity derivatives | | | | | | | 71.8 | | | 15.5 | | | 363 | | |
| Total netback | | | | | | | 2,648.5 | | | 2,194.4 | | | 21 | | |
Operating netback and netback are non-GAAP ratios and are calculated as total operating netback and total netback, respectively, divided by total production. Operating netback and netback are common metrics used in the oil and gas industry and are used to measure operating results on a per boe basis.
Base dividends is a historical non-GAAP financial measure and is calculated as dividends declared less special dividends declared as part of the Company’s return of capital framework and adjusted for timing of the dividend record date. Base dividends are based on a framework that targets dividend sustainability at lower commodity prices, allows for flexibility in the capital allocation process and dividend growth over time, and assists in determining the additional return of capital to shareholders as part of the Company’s return of capital framework.
Total return of capital is a supplementary financial measure and is comprised of base dividends, special dividends and share repurchases, adjusted for the timing of special dividend payments.
Adjusted funds flow from operations is a capital management measure and is calculated based on cash flow from operating activities before changes in non-cash working capital, transaction costs and decommissioning expenditures funded by the Company. Transaction costs are excluded as they vary based on the Company's acquisition and disposition activity and to ensure that this metric is more comparable between periods. Decommissioning expenditures are discretionary and are excluded as they may vary based on the development stage of the Company's assets and operating areas. The most directly comparable financial measure to adjusted funds flow from operations is cash flow from operating activities. Adjusted funds flow from operations is a key measure that assesses the ability of the Company to finance dividends, potential share repurchases, operating activities, capital expenditures and debt repayments. Adjusted funds flow from operations as presented is not intended to represent cash flow from operating activities, net earnings or other measures of financial performance calculated in accordance with IFRS. See Note 19 - "Capital Management" in the audited consolidated financial statements for the year ended December 31, 2024, for additional information on the Company's capital management.
Excess cash flow is a historical non-GAAP financial measure and is defined as adjusted funds flow from operations less development capital and other expenditures, payments on principal portion of lease liability, decommissioning expenditures funded by the Company, unrealized gains and losses on equity derivative contracts, transaction costs and other items (excluding net acquisitions and dispositions). The most directly comparable financial measure to excess cash flow disclosed in the Company's financial statements is cash flow from operating activities. Excess cash flow is a key measure that assesses the ability of the Company to finance dividends, potential share repurchases, debt repayments and returns-based growth.
The following table reconciles cash flow from operating activities to adjusted funds flow from operations and excess cash flow:
| | | | | | | | | | | | | | | | | | | | | | | | | | |
| | | | |
| ($ millions) | | | | | | | 2024 | | 2023 | | % Change | |
Cash flow from operating activities | | | | | | | 2,111.8 | | | 2,195.7 | | | (4) | | |
Changes in non-cash working capital | | | | | | | 175.6 | | | 54.9 | | | 220 | | |
Transaction costs | | | | | | | 19.8 | | | 48.5 | | | (59) | | |
Decommissioning expenditures (1) | | | | | | | 40.6 | | | 40.0 | | | 2 | | |
Adjusted funds flow from operations | | | | | | | 2,347.8 | | | 2,339.1 | | | — | | |
| Development capital and other expenditures | | | | | | | (1,587.8) | | | (1,220.5) | | | 30 | | |
| Payments on principal portion of lease liability | | | | | | | (41.0) | | | (20.8) | | | 97 | | |
| Decommissioning expenditures | | | | | | | (40.6) | | | (40.0) | | | 2 | | |
| Unrealized loss on equity derivative contracts | | | | | | | (9.3) | | | (29.3) | | | (68) | | |
| Transaction costs | | | | | | | (19.8) | | | (48.5) | | | (59) | | |
Other items (2) | | | | | | | (7.7) | | | 1.6 | | | (581) | | |
| Excess cash flow | | | | | | | 641.6 | | | 981.6 | | | (35) | | |
(1)Excludes amounts received from government grant programs.
(2)Other items exclude net acquisitions and dispositions.
The following table reconciles cash flow from operating activities from discontinued operations to adjusted funds flow from discontinued operations:
| | | | | | | | | | | | | | | | | | | | | | | | | | |
| | | | |
| ($ millions) | | | | | | | 2024 | | 2023 | | % Change | |
| Cash flow from operating activities from discontinued operations | | | | | | | — | | | 399.0 | | | (100) | | |
Changes in non-cash working capital | | | | | | | — | | | (44.6) | | | (100) | | |
Transaction costs | | | | | | | — | | | 8.7 | | | (100) | | |
Decommissioning expenditures (1) | | | | | | | — | | | 0.4 | | | (100) | | |
| Adjusted funds flow from discontinued operations | | | | | | | — | | | 363.5 | | | (100) | | |
(1)Excludes amounts received from government grant programs.
The following tables reconcile cash flow from operating activities and adjusted funds flow from operations from continuing and discontinued operations:
| | | | | | | | | | | | | | | | | | | | | | | | | | |
| | | | |
| ($ millions) | | | | | | | 2024 | | 2023 | | % Change | |
| Cash flow from operating activities from continuing operations | | | | | | | 2,111.8 | | | 1,796.7 | | | 18 | | |
| Cash flow from operating activities from discontinued operations | | | | | | | — | | | 399.0 | | | (100) | | |
| Cash flow from operating activities | | | | | | | 2,111.8 | | | 2,195.7 | | | (4) | | |
| | | | | | | | | | | | | | | | | | | | | | | | | | |
| | | | |
| ($ millions) | | | | | | | 2024 | | 2023 | | % Change | |
| Adjusted funds flow from continuing operations | | | | | | | 2,347.8 | | | 1,975.6 | | | 19 | | |
| Adjusted funds flow from discontinued operations | | | | | | | — | | | 363.5 | | | (100) | | |
| Adjusted funds flow from operations | | | | | | | 2,347.8 | | | 2,339.1 | | | — | | |
Adjusted working capital surplus (deficiency) is a capital management measure and is calculated as accounts payable and accrued liabilities, dividends payable and long-term compensation liability net of equity derivative contracts, less cash, accounts receivable, prepaids and deposits and deferred consideration receivable. Deferred consideration receivable was incurred in 2023 and 2024 through capital dispositions and is included in "other current assets" and "other long-term assets" on the balance sheet. Adjusted working capital surplus (deficiency) is a component of net debt and is a measure of the Company's liquidity.
The following table reconciles adjusted working capital deficiency:
| | | | | | | | | | | | | | | | | | | | |
| ($ millions) | December 31, 2024 | | December 31, 2023 | | % Change | |
| Accounts payable and accrued liabilities | 493.5 | | | 634.9 | | | (22) | | |
Dividends payable | 70.7 | | | 56.8 | | | 24 | | |
Long-term compensation liability (1) | 47.4 | | | 66.8 | | | (29) | | |
Cash | (17.1) | | | (17.3) | | | (1) | | |
Accounts receivable | (386.5) | | | (377.9) | | | 2 | | |
| Prepaids and deposits | (99.1) | | | (87.8) | | | 13 | | |
Deferred consideration receivable (2) | (18.0) | | | (79.2) | | | (77) | | |
| | | | | | |
| Adjusted working capital deficiency | 90.9 | | | 196.3 | | | (54) | | |
(1)Includes current portion of long-term compensation liability and is net of equity derivative contracts.
(2)Deferred consideration receivable is comprised of $7.2 million included in other current assets and $10.8 million included in other long-term assets (December 31, 2023 - $79.2 million in other current assets and nil in other long-term assets).
Net debt is a capital management measure and is calculated as long-term debt plus adjusted working capital deficiency, excluding the unrealized foreign exchange on translation of hedged US dollar long-term debt. The most directly comparable financial measure to net debt disclosed in the Company's financial statements is long-term debt. Net debt is a key measure of the Company's liquidity.
The following table reconciles long-term debt to net debt:
| | | | | | | | | | | | | | | | | | | | |
($ millions) | December 31, 2024 | | December 31, 2023 | | % Change | |
Long-term debt (1) | 2,454.5 | | | 3,566.3 | | | (31) | | |
| Adjusted working capital deficiency | 90.9 | | | 196.3 | | | (54) | | |
| | | | | | |
| Unrealized foreign exchange on translation of hedged US dollar long-term debt | (67.5) | | | (24.5) | | | 176 | | |
Net debt | 2,477.9 | | | 3,738.1 | | | (34) | | |
(1)Includes current portion of long-term debt.
Enterprise value is a supplementary financial measure and is calculated as market capitalization plus net debt. Enterprise value is used to assess the valuation of the Company. Refer to the Liquidity and Capital Resources section in this MD&A for further information.
Net debt to adjusted funds flow from operations is a capital management measure and is calculated as the period end net debt divided by the sum of adjusted funds flow from operations for the trailing four quarters. Net debt as a percentage of enterprise value is a supplementary financial measure and is calculated as net debt divided by enterprise value. The measures of net debt to adjusted funds flow from operations and net debt as a percentage of enterprise value are used to measure the Company's overall debt position and to measure the strength of the Company's balance sheet. Veren monitors these measures and uses them as key measures in capital allocation decisions including capital spending levels, returns to shareholders including dividends and share repurchases, and financial considerations.
Adjusted net earnings from operations is a historical non-GAAP financial measure and is calculated based on net income (loss) before amortization of E&E undeveloped land, impairment or impairment reversals, unrealized derivative gains or losses, unrealized foreign exchange gain or loss on translation of hedged US dollar long-term debt, gains or losses on capital acquisitions and dispositions, cumulative foreign currency translation of discontinued foreign operations, and deferred tax related to these adjustments. Adjusted net earnings from operations is a key measure of financial performance that is more comparable between periods. The most directly comparable financial measure to adjusted net earnings from operations disclosed in the Company's financial statements is net income (loss).
The following table reconciles net income to adjusted net earnings from operations:
| | | | | | | | | | | | | | | | | | | | | | | | | | |
| | | | |
| ($ millions) | | | | | | | 2024 | | 2023 | | % Change | |
| Net income | | | | | | | 273.3 | | | 570.3 | | | (52) | | |
Amortization of E&E undeveloped land | | | | | | | 122.6 | | | 30.9 | | | 297 | | |
| Impairment | | | | | | | 512.3 | | | 822.2 | | | (38) | | |
| Unrealized derivative losses | | | | | | | 55.4 | | | 56.9 | | | (3) | | |
Unrealized foreign exchange (gain) loss on translation of hedged US dollar long-term debt | | | | | | | 51.7 | | | (168.6) | | | (131) | | |
| | | | | | | | | | | | |
| | | | | | | | | | | | |
| Net loss on capital dispositions | | | | | | | 21.3 | | | 9.6 | | | 122 | | |
| Reclassification of cumulative foreign currency translation of discontinued foreign operations | | | | | | | (0.5) | | | (621.7) | | | (100) | | |
| Deferred tax adjustments | | | | | | | (187.3) | | | 233.0 | | | (180) | | |
| Adjusted net earnings from operations | | | | | | | 848.8 | | | 932.6 | | | (9) | | |
The following table reconciles net income (loss) from discontinued operations to adjusted net earnings from discontinued operations:
| | | | | | | | | | | | | | | | | | | | | | | | | | |
| | | | |
| ($ millions) | | | | | | | 2024 | | 2023 | | % Change | |
| Net income (loss) from discontinued operations | | | | | | | (10.6) | | | (229.1) | | | (95) | | |
| | | | | | | | | | | | |
| Impairment | | | | | | | — | | | 728.4 | | | (100) | | |
| Unrealized derivative losses | | | | | | | — | | | 18.9 | | | (100) | | |
| | | | | | | | | | | | |
| Net loss on capital dispositions | | | | | | | 11.1 | | | 9.0 | | | 23 | | |
| Reclassification of cumulative foreign currency translation of discontinued foreign operations | | | | | | | (0.5) | | | (621.7) | | | (100) | | |
| Deferred tax adjustments | | | | | | | — | | | 231.2 | | | (100) | | |
| Adjusted net earnings from discontinued operations | | | | | | | — | | | 136.7 | | | (100) | | |
The following table reconciles adjusted net earnings from continuing and discontinued operations:
| | | | | | | | | | | | | | | | | | | | | | | | | | |
| | | | |
| ($ millions) | | | | | | | 2024 | | 2023 | | % Change | |
| Adjusted net earnings from continuing operations | | | | | | | 848.8 | | | 795.9 | | | 7 | | |
| Adjusted net earnings from discontinued operations | | | | | | | — | | | 136.7 | | | (100) | | |
| Adjusted net earnings from operations | | | | | | | 848.8 | | | 932.6 | | | (9) | | |
Adjusted net earnings from operations per share - diluted is a non-GAAP ratio and is calculated as adjusted net earnings from operations divided by the number of weighted average diluted shares outstanding. Adjusted net earnings from operations presents a measure of financial performance that is more comparable between periods. Adjusted net earnings from operations as presented is not intended to represent net earnings or other measures of financial performance calculated in accordance with IFRS.
The following table reconciles development capital and other expenditures to development capital expenditures:
| | | | | | | | | | | | | | | | | | | | | | | | | | |
| | | | |
| ($ millions) | | | | | | | 2024 | | 2023 | | % Change | |
| Development capital and other expenditures | | | | | | | 1,587.8 | | | 1,220.5 | | | 30 | | |
| Payments on drilling rig lease liabilities | | | | | | | 12.9 | | | — | | | 100 | | |
| Land expenditures | | | | | | | (41.8) | | | (33.6) | | | 24 | | |
Capitalized administration (1) | | | | | | | (45.1) | | | (42.3) | | | 7 | | |
| Corporate assets | | | | | | | (5.7) | | | (5.9) | | | (3) | | |
Development capital expenditures | | | | | | | 1,508.1 | | | 1,138.7 | | | 32 | | |
(1)Capitalized administration excludes capitalized equity-settled SBC.
Development capital expenditures is a historical non-GAAP financial measure that presents total budgeted development capital spending under the Company's guidance. The most directly comparable financial measure disclosed in the Company's financial statements is development capital and other expenditures on the consolidated statements of cash flows. Development capital expenditures is calculated as development capital and other expenditures plus payments on drilling rig lease liabilities, and excludes land expenditures, capitalized administration and corporate assets. These drilling rig contracts are accounted for in accordance with IFRS 16 Leases.
The following table reconciles capital acquisitions, net of cash acquired to total capital acquisitions:
| | | | | | | | | | | | | | | | | | | | | | | | | | |
| | | | |
($ millions) | | | | | | | 2024 | | 2023 | | % Change | |
| Capital acquisitions, net of cash acquired | | | | | | | 26.4 | | | 3,616.2 | | | (99) | | |
| Common shares issued on capital acquisition | | | | | | | — | | | 493.0 | | | (100) | | |
| Working capital acquired through capital acquisition | | | | | | | 6.0 | | | 116.7 | | | (95) | | |
| Long-term debt acquired through capital acquisition | | | | | | | — | | | 363.8 | | | (100) | | |
| Total capital acquisitions | | | | | | | 32.4 | | | 4,589.7 | | | (99) | | |
The following table reconciles capital dispositions to total capital dispositions:
| | | | | | | | | | | | | | | | | | | | | | | | | | |
| | | | |
($ millions) | | | | | | | 2024 | | 2023 | | % Change | |
| Capital dispositions | | | | | | | (1,037.7) | | | (604.5) | | | 72 | | |
| Working capital disposed through capital disposition | | | | | | | — | | | (9.1) | | | (100) | | |
| Total capital dispositions | | | | | | | (1,037.7) | | | (613.6) | | | 69 | | |
Total capital acquisitions and total capital dispositions are historical non-GAAP financial measures. Total capital acquisitions are calculated as capital acquisitions, net of cash acquired plus common shares issued on capital acquisition, working capital acquired through capital acquisition and long-term debt acquired through capital acquisition. Total capital dispositions are calculated as capital dispositions less working capital disposed through capital dispositions. Total capital acquisitions and total capital dispositions present the total consideration, including share consideration and working capital, that are included in corporate acquisitions or dispositions.
Net general and administrative expenses is a historical non-GAAP financial measure. Net general and administrative expenses is calculated as general and administrative expenses less transaction costs. Transaction costs vary based on the Company's acquisition and disposition activity, and are excluded from this measure to ensure comparability of general and administrative expenses between periods. Net general and administrative expenses per boe is a non-GAAP ratio and calculated as net general and administrative expenses divided by total production. Net general and administrative expenses per boe measure financial results on a per boe basis.
Management believes the presentation of the specified financial measures above provide useful information to investors and shareholders as the measures provide increased transparency and the ability to better analyze performance against prior periods on a comparable basis.
Forward-Looking Information
Certain statements contained in this management's discussion and analysis constitute forward-looking statements and are based on Veren's beliefs and assumptions based on information available at the time the assumption was made. By its nature, such forward-looking information involves known and unknown risks, uncertainties and other factors that may cause actual results or events to differ materially from those anticipated in such forward-looking statements. The Company believes the expectations reflected in those forward-looking statements are reasonable but no assurance can be given that these expectations will prove to be correct and such forward-looking statements should not be unduly relied upon. These statements are effective only as of the date of this MD&A. Veren undertakes no obligation to update publicly or revise any forward-looking statements, whether as a result of new information, future events or otherwise, unless required to do so pursuant to applicable law. For additional information on the Company's guidance, refer to the press release dated October 31, 2024 available on SEDAR+ at www.sedarplus.ca and EDGAR at www.sec.gov.
Any “financial outlook” or “future oriented financial information” in this management’s discussion and analysis, as defined by applicable securities legislation, have been approved by management of Veren. Such financial outlook or future oriented financial information is provided for the purpose of providing information about management’s current expectations and plans relating to the future. Readers are cautioned that reliance on such information may not be appropriate for other purposes.
Certain statements contained in this MD&A, including statements related to Veren's capital expenditures, projected asset growth, view and outlook toward future commodity prices, drilling activity and statements that contain words such as "could", "should", "can", "anticipate", "expect", "believe", "will", "may", “projected”, “sustain”, “continues”, “strategy”, “potential”, “projects”, “grow”, “take advantage”, “estimate” and similar expressions and statements relating to matters that are not historical facts constitute "forward-looking information" within the meaning of applicable Canadian securities legislation. The material assumptions and factors in making these forward-looking statements are disclosed in this MD&A under the headings "Overview", "Commodity Derivatives", “Liquidity and Capital Resources” and “Guidance”.
In particular, forward-looking statements include:
| | | | | |
l An investment-grade credit rating l Veren's approach to proactively manage the risk exposure inherent in movements in the price of crude oil, natural gas, the Company's share price, the US/Cdn dollar exchange rate and interest rates through the use of derivatives with investment-grade counterparties; l Veren's use of derivatives to reduce the volatility of the selling price of commodities, protect against downward price movements and provide some upside participation during rising prices and how these derivatives provide a measure of stability to cash flow; l Veren's 2025 production, operating expenses and capital expenditures guidance, and other information forming part of the 2025 guidance; l The extent and effectiveness of hedges; | l Veren's return of capital outlook including dividend expectations and total return of capital target as a percentage of excess cash flow; l Generating strong returns and excess cash flow to provide continued returns to shareholders: l Economic and demand growth outlooks; l OPEC+ voluntary production cuts; l The Company's liquidity and financial flexibility; l The method by which the Company's ongoing working capital requirements are financed; l Natural gas diversification and pricing; l NCIB expectations; and l Estimated undiscounted and uninflated cash flows to settle decommissioning liability.
|
This information contains certain forward-looking estimates that involve substantial known and unknown risks and uncertainties, many of which are beyond Veren's control. Such risks and uncertainties include, but are not limited to: financial risk of marketing reserves at an acceptable price given market conditions; volatility in market prices for oil and natural gas, decisions or actions of OPEC+ and non-OPEC+ countries in respect of supplies of oil and gas; delays in business operations or delivery of services due to pipeline restrictions, rail blockades, outbreaks, pandemics, and blowouts; the risk of carrying out operations with minimal environmental impact; industry conditions including changes in laws and regulations including the adoption of new environmental laws and regulations and changes in how they are interpreted and enforced, including, but not limited to, the potential for emissions reductions legislation; uncertainties associated with estimating oil and natural gas reserves; risks and uncertainties related to oil and gas interests and operations on Indigenous lands; economic risk of finding and producing reserves at a reasonable cost; uncertainties associated with partner plans and approvals; operational matters related to non-operated properties; increased competition for, among other things, capital, acquisitions of reserves and undeveloped lands; competition for and availability of qualified personnel or management; incorrect assessments of the value and likelihood of acquisitions and dispositions, and exploration and development programs; unexpected geological, technical, drilling, construction, processing and transportation problems; the impacts of drought, wildfires and severe weather events; availability of insurance; fluctuations in foreign exchange and interest rates; stock market volatility; general economic, market and business conditions, including uncertainty in the demand for oil and gas and economic activity in general; changes in interest rates and inflation; uncertainties associated with regulatory approvals; geopolitical conflicts, including the Russian invasion of Ukraine and conflict in the Middle East; uncertainty of government policy changes; the impact of the implementation of the Canada-United States-Mexico Agreement; uncertainty regarding the benefits and costs of dispositions; failure to complete acquisitions and dispositions; uncertainties associated with credit facilities and counterparty credit risk; and changes in income tax laws, tariffs, tax laws, crown royalty rates and incentive programs relating to the oil and gas industry; and other factors, many of which are outside the control of the Company.
Therefore, Veren's actual results, performance or achievement could differ materially from those expressed in, or implied by, these forward-looking estimates and if such actual results, performance or achievements transpire or occur, or if any of them do so, there can be no certainty as to what benefits or detriments Veren will derive therefrom.
Credit ratings are intended to provide investors with an independent measure of credit quality of an issue of securities. Credit ratings are not recommendations to purchase, hold or sell securities and do not address the market price or suitability of a specific security for a particular investor. There is no assurance that any rating will remain in effect for any given period of time or that any rating will not be revised or withdrawn entirely by a rating agency in the future if, in its judgement, circumstances so warrant.
Crude oil and condensate, and natural gas information is provided in accordance with the United States Financial Accounting Standards Board Topic 932 - "Extractive Activities - Oil and Gas" and where applicable, financial information is prepared in accordance with International Financial Reporting Standards ("IFRS").
The Company files its reserves information under National Instrument 51-101 - "Standards of Disclosure of Oil and Gas Activities" (NI 51-101), which prescribes the standards for the preparation and disclosure of reserves and related information for companies listed in Canada.
There are significant differences to the type of volumes disclosed and the basis from which the volumes are economically determined under the United States Securities and Exchange Commission (“SEC”) requirements and NI 51-101. The SEC requires disclosure of net reserves, after royalties, using 12-month average prices and current costs; whereas NI 51-101 requires Company gross reserves, before royalties, using forecast pricing and costs. Therefore the difference between the reported numbers under the two disclosure standards may be material.
Barrels of oil equivalent (“boe”) may be misleading, particularly if used in isolation. A boe conversion ratio of 6 mcf : 1 bbl is based on an energy equivalency conversion method primarily applicable at the burner tip and does not represent a value equivalency at the wellhead. Given that the value ratio based on the current price of crude oil and condensate as compared to natural gas is significantly different from the energy equivalency of oil, utilizing a conversion on a 6:1 basis may be misleading as an indication of value. Oil and gas metrics such as operating netback and netback do not have standardized meaning and as such may not be reliable, and should not be used to make comparisons.
NI 51-101 includes condensate within the natural gas liquids (NGLs) product type. The Company has disclosed condensate as combined with crude oil and separately from other natural gas liquids in this MD&A since the price of condensate as compared to other natural gas liquids is currently significantly higher and the Company believes that this crude oil and condensate presentation provides a more accurate description of its operations and results therefrom. The Company’s aggregate production for the past eight quarters and the references to “natural gas”, “crude oil" and "condensate”, reported in this MD&A consist of the following product types, as defined in NI 51-101 and using a conversion ratio of 6 mcf : 1 bbl where applicable:
| | | | | | | | | | | | | | | | | | | | | | | | | | | | | | | | | | | |
| 2024 | 2023 | 2022 |
| Annual | Q4 | Q3 | Q2 | Q1 | Annual | Q4 | Q3 | Q2 | Q1 | Annual |
| Light & Medium Crude Oil (bbl/d) | 8,637 | | 6,439 | | 7,062 | | 9,653 | | 11,434 | | 12,665 | | 12,198 | | 12,405 | | 13,188 | | 12,879 | | 14,274 | |
| Heavy Crude Oil (bbl/d) | 1,612 | | — | | — | | 2,866 | | 3,620 | | 3,818 | | 3,795 | | 3,617 | | 3,857 | | 4,010 | | 4,027 | |
| Tight Oil (bbl/d) | 69,944 | | 67,177 | | 67,262 | | 72,546 | | 72,849 | | 49,779 | | 56,657 | | 54,605 | | 48,151 | | 39,464 | | 42,134 | |
| Total Crude Oil (bbl/d) | 80,193 | | 73,616 | | 74,324 | | 85,065 | | 87,903 | | 66,262 | | 72,650 | | 70,627 | | 65,196 | | 56,353 | | 60,435 | |
| | | | | | | | | | | |
Condensate (bbl/d) | 27,349 | | 30,269 | | 28,049 | | 25,334 | | 25,703 | | 21,825 | | 23,494 | | 22,198 | | 19,747 | | 21,839 | | 18,889 | |
Other (bbl/d) | 17,532 | | 17,165 | | 16,859 | | 17,041 | | 19,077 | | 15,026 | | 16,023 | | 16,118 | | 14,361 | | 13,562 | | 13,078 | |
| NGLs (bbl/d) | 44,881 | | 47,434 | | 44,908 | | 42,375 | | 44,780 | | 36,851 | | 39,517 | | 38,316 | | 34,108 | | 35,401 | | 31,967 | |
| | | | | | | | | | | |
| Shale Gas (mcf/d) | 392,539 | | 403,412 | | 390,322 | | 387,893 | | 388,432 | | 200,514 | | 236,926 | | 232,235 | | 184,105 | | 147,458 | | 117,617 | |
| Conventional Natural Gas (mcf/d) | 3,995 | | 2,615 | | 3,260 | | 3,357 | | 6,773 | | 10,761 | | 11,380 | | 12,542 | | 8,859 | | 10,233 | | 10,482 | |
| Total Natural Gas (mcf/d) | 396,534 | | 406,027 | | 393,582 | | 391,250 | | 395,205 | | 211,275 | | 248,306 | | 244,777 | | 192,964 | | 157,691 | | 128,099 | |
| | | | | | | | | | | |
Total production from continuing operations (boe/d) | 191,163 | | 188,721 | | 184,829 | | 192,648 | | 198,551 | | 138,326 | | 153,551 | | 149,739 | | 131,465 | | 118,036 | | 113,752 | |
| | | | | | | | | | | | | | | | | | | | | | | | | | | | | | | | | | | |
| 2024 | 2023 | 2022 |
| Annual | Q4 | Q3 | Q2 | Q1 | Annual | Q4 | Q3 | Q2 | Q1 | Annual |
| Light & Medium Crude Oil (bbl/d) | 8,637 | | 6,439 | | 7,062 | | 9,653 | | 11,434 | | 12,665 | | 12,198 | | 12,405 | | 13,190 | | 12,879 | | 14,274 | |
| Heavy Crude Oil (bbl/d) | 1,612 | | — | | — | | 2,866 | | 3,620 | | 3,818 | | 3,795 | | 3,617 | | 3,857 | | 4,010 | | 4,027 | |
| Tight Oil (bbl/d) | 69,944 | | 67,177 | | 67,262 | | 72,546 | | 72,849 | | 63,906 | | 62,512 | | 75,882 | | 63,812 | | 53,184 | | 53,861 | |
| Total Crude Oil (bbl/d) | 80,193 | | 73,616 | | 74,324 | | 85,065 | | 87,903 | | 80,389 | | 78,505 | | 91,904 | | 80,859 | | 70,073 | | 72,162 | |
| | | | | | | | | | | |
Condensate (bbl/d) | 27,349 | | 30,269 | | 28,049 | | 25,334 | | 25,703 | | 22,517 | | 23,846 | | 23,094 | | 20,488 | | 22,621 | | 19,518 | |
| Other (bbl/d) | 17,532 | | 17,165 | | 16,859 | | 17,041 | | 19,077 | | 19,017 | | 17,527 | | 21,634 | | 18,911 | | 17,971 | | 17,038 | |
| NGLs (bbl/d) | 44,881 | | 47,434 | | 44,908 | | 42,375 | | 44,780 | | 41,534 | | 41,373 | | 44,728 | | 39,399 | | 40,592 | | 36,556 | |
| | | | | | | | | | | |
| Shale Gas (mcf/d) | 392,539 | | 403,412 | | 390,322 | | 387,893 | | 388,432 | | 214,165 | | 242,965 | | 251,152 | | 199,781 | | 161,459 | | 130,902 | |
| Conventional Natural Gas (mcf/d) | 3,995 | | 2,615 | | 3,260 | | 3,357 | | 6,773 | | 10,761 | | 11,380 | | 12,542 | | 8,859 | | 10,233 | | 10,482 | |
| Total Natural Gas (mcf/d) | 396,534 | | 406,027 | | 393,582 | | 391,250 | | 395,205 | | 224,926 | | 254,345 | | 263,694 | | 208,640 | | 171,692 | | 141,384 | |
| | | | | | | | | | | |
| Total average daily production (boe/d) | 191,163 | | 188,721 | | 184,829 | | 192,648 | | 198,551 | | 159,411 | | 162,269 | | 180,581 | | 155,031 | | 139,280 | | 132,282 | |
| | | | | | | | |
Directors Barbara Munroe, Chair (6) Corey Bieber (1) (5) James Craddock (2) (3) (5) John Dielwart (3) (4) Mike Jackson (1) (5) Jennifer Koury (2) (5) Jodi Jenson Labrie (1) (2) François Langlois (1) (3) (4) Myron Stadnyk (1) (2) (4) Mindy Wight (2) Craig Bryksa (4) (1) Member of the Audit Committee of the Board of Directors (2) Member of the Human Resources and Compensation Committee of the Board of Directors (3) Member of the Reserves Committee of the Board of Directors (4) Member of the Environment, Safety and Sustainability Committee of the Board of Directors (5) Member of the Corporate Governance and Nominating Committee (6) Chair of the Board serves in an ex officio capacity on each Committee Officers Craig Bryksa President and Chief Executive Officer Ken Lamont Chief Financial Officer Ryan Gritzfeldt Chief Operating Officer Mark Eade Senior Vice President, General Counsel and Corporate Secretary Justin Foraie Senior Vice President, Operations and Marketing Garret Holt Senior Vice President, Strategy and Planning Michael Politeski Senior Vice President, Finance and Treasurer Shelly Witwer Senior Vice President, Business Development Head Office Suite 2000, 585 - 8th Avenue S.W. Calgary, Alberta T2P 1G1 Tel: (403) 693-0020 Fax: (403) 693-0070 Toll Free: (888) 693-0020 Banker The Bank of Nova Scotia Calgary, Alberta | | Auditor PricewaterhouseCoopers LLP Calgary, Alberta Legal Counsel Norton Rose Fulbright Canada LLP Calgary, Alberta Evaluation Engineers McDaniel & Associates Consultants Ltd. Calgary, Alberta Registrar and Transfer Agent Investors are encouraged to contact Veren's Registrar and Transfer Agent for information regarding their security holdings: Computershare Trust Company of Canada 600, 530 - 8th Avenue S.W. Calgary, Alberta T2P 3S8 Tel: (403) 267-6800 Stock Exchanges Toronto Stock Exchange - TSX New York Stock Exchange - NYSE Stock Symbol VRN Investor Contacts Sarfraz Somani Manager, Investor Relations (403) 693-0020 |
| | |