Please wait
| | | | | | | | | | | |
REPORT TO SHAREHOLDERS | | |
Year ended December 31, 2025 | |
| | | |
| MANAGEMENT'S DISCUSSION AND ANALYSIS | |
| | | |
| | | |
Table of Contents | | | |
| | | |
| |
| |
| |
| |
| |
| |
| |
| |
| |
| |
| |
| |
| |
| |
| |
| | | |
| | | |
| | | |
Basis of Presentation
The following Management's Discussion and Analysis ("MD&A") of the financial and operating results of Pembina Pipeline Corporation ("Pembina" or the "Company") is dated February 26, 2026, and is supplementary to, and should be read in conjunction with, Pembina's audited consolidated financial statements as at and for the year ended December 31, 2025 ("Consolidated Financial Statements"). The Consolidated Financial Statements have been prepared in accordance with International Financial Reporting Standards ("IFRS") as issued by the International Accounting Standards Board, using the accounting policies described in Note 3 of the Consolidated Financial Statements. All dollar amounts contained in this MD&A are expressed in Canadian dollars unless otherwise noted. For further details on Pembina and Pembina's significant assets, including definitions for capitalized terms used herein and not otherwise defined, refer to Pembina's annual information form ("AIF") for the year ended December 31, 2025. Additional information about Pembina filed with Canadian and U.S. securities commissions, including quarterly and annual reports, annual information forms (filed with the U.S. Securities and Exchange Commission under Form 40-F) and management information circulars, can be found online at www.sedarplus.ca, www.sec.gov and through Pembina's website at www.pembina.com. Information contained in or otherwise accessible through Pembina's website does not form part of this MD&A and is not incorporated into this document by reference.
Abbreviations
For a list of abbreviations that may be used in this MD&A, refer to the "Abbreviations" section of this MD&A.
Non-GAAP and Other Financial Measures
Pembina has disclosed certain financial measures and ratios within this MD&A that management believes provide meaningful information in assessing Pembina's underlying performance, but which are not specified, defined or determined in accordance with the Canadian generally accepted accounting principles ("GAAP") and which are not disclosed in Pembina's Consolidated Financial Statements. Such non-GAAP financial measures and non-GAAP ratios do not have any standardized meaning prescribed by IFRS and may not be comparable to similar financial measures or ratios disclosed by other issuers. Refer to the "Non-GAAP & Other Financial Measures" section of this MD&A for additional information regarding these non-GAAP financial measures and non-GAAP ratios.
Risk Factors and Forward-Looking Information
Management has identified the primary risk factors that could have a material impact on the financial results and operations of Pembina. Such risk factors are presented in the "Risk Factors" section of this MD&A and are also included in Pembina's AIF. The Company's financial and operational performance is potentially affected by a number of factors, including, but not limited to, the factors described within the "Forward-Looking Statements & Information" section of this MD&A. This MD&A contains forward-looking statements based on Pembina's current expectations, estimates, projections and assumptions. This information is provided to assist readers in understanding the Company's future plans and expectations and may not be appropriate for other purposes.
Pembina Pipeline Corporation 2025 Annual Report 1
1. ABOUT PEMBINA
Pembina Pipeline Corporation is a leading energy transportation and midstream service provider that has served North America's energy industry for more than 70 years. Pembina owns an extensive network of strategically located assets, including hydrocarbon liquids and natural gas pipelines, gas gathering and processing facilities, oil and natural gas liquids infrastructure and logistics services, and an export terminals business. Through our integrated value chain, we seek to provide safe and reliable energy solutions that connect producers and consumers across the world, support a more sustainable future and benefit our customers, investors, employees and communities. For more information, please visit www.pembina.com.
Pembina's Purpose and Strategy
We deliver extraordinary energy solutions so the world can thrive.
Pembina will build on its strengths by continuing to invest in and grow the core businesses that provide critical transportation and midstream services to help ensure reliable and secure energy supply. Pembina will capitalize on exciting opportunities to leverage its assets and expertise into new service offerings that enable the transition to a lower-carbon economy. In continuing to meet global energy demand and its customers' needs, while ensuring Pembina's long-term success and resilience, the Company has established four strategic priorities:
1.To be resilient, we will sustain, decarbonize, and enhance our businesses. This priority is focused on strengthening and growing our existing franchise and demonstrating environmental leadership.
2.To thrive, we will invest in the energy transition to improve the basins in which we operate. We will prioritize lighter commodities as we continue to invest in new infrastructure and expand our portfolio to include new businesses associated with lower-carbon commodities.
3.To meet global demand, we will transform and export our products. We will continue our focus on supporting the transformation of Western Canadian Sedimentary Basin commodities into higher margin products and enabling more coastal egress.
4.To set ourselves apart, we will create a differentiated experience for our stakeholders. We remain committed to delivering excellence for our four key stakeholder groups meaning that:
a.Employees say we are the 'employer of choice' and value our safe, respectful, collaborative, and inclusive work culture.
b.Communities welcome us and recognize the net positive impact of our social and environmental commitment.
c.Customers choose us first for reliable and value-added services.
d.Investors receive sustainable industry-leading total returns.
2 Pembina Pipeline Corporation 2025 Annual Report
2. FINANCIAL & OPERATING OVERVIEW
Consolidated Financial Overview for the Three Months Ended December 31
Results of Operations
| | | | | | | | | | | | |
| ($ millions, except where noted) | 2025 | 2024 | Change | |
| Revenue | 1,913 | | 2,145 | | (232) | | |
Net revenue(1) | 1,139 | | 1,383 | | (244) | | |
| Operating expenses | 241 | | 270 | | (29) | | |
Gross profit | 827 | | 1,024 | | (197) | | |
Adjusted EBITDA(1) | 1,075 | | 1,254 | | (179) | | |
| | | | |
Earnings | 489 | | 572 | | (83) | | |
Earnings per common share – basic and diluted (dollars) | 0.78 | | 0.92 | | (0.14) | | |
| | | | |
| Cash flow from operating activities | 861 | | 902 | | (41) | | |
Cash flow from operating activities per common share – basic (dollars) | 1.48 | | 1.55 | | (0.07) | | |
Adjusted cash flow from operating activities(1) | 731 | | 922 | | (191) | | |
Adjusted cash flow from operating activities per common share – basic (dollars)(1) | 1.26 | | 1.59 | | (0.33) | | |
| Capital expenditures | 235 | | 242 | | (7) | | |
| | | | |
Change in Earnings ($ millions)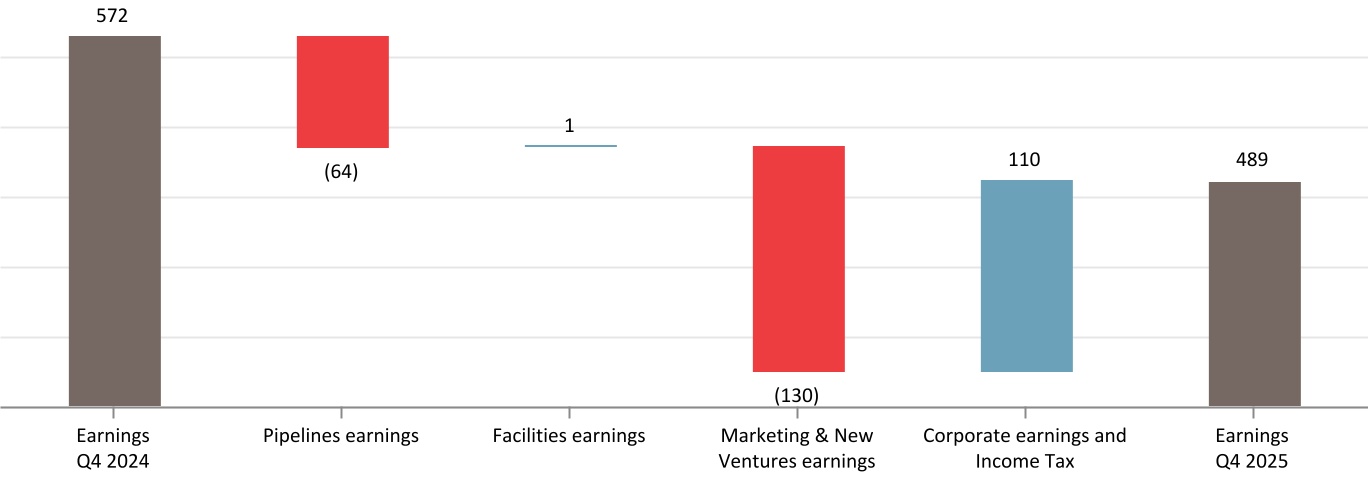
Earnings Overview
Earnings in the fourth quarter of 2025 decreased by $83 million compared to the prior period. The change primarily reflects narrower WCSB and U.S. NGL frac spreads as well as lower revenue from derivative contracts within the Marketing & New Ventures Division. Results also include the impact of a new toll structure and revenue sharing mechanism on the Alliance Pipeline, and period specific capital recoveries that impacted the fourth quarter of 2024 with no similar impact in the same period in 2025. These factors were offset by a gain on a land sale recognized within the Corporate and Marketing & New Ventures Division, as well as volume growth and solid performance across the Pipelines and Facilities Divisions. Further details by division are outlined below:
•Pipelines: Decrease largely due to lower revenue on the Canadian portion of the Alliance Pipeline as a result of reduced long-term firm tolls and impacts from the new revenue-sharing mechanism resulting from the negotiated settlement between Alliance and its shippers effective November 2025 ("Alliance Negotiated Settlement"), partially offset by higher seasonal revenue on the Alliance Pipeline. Lower earnings was also due to the recognition of period specific capital recoveries that impacted certain Pipelines assets in the fourth quarter of 2024 with no similar impact in the same period in 2025, lower volumes on the Cochin Pipeline, and higher depreciation and amortization expense. These decreases were offset in part by higher revenue on the Peace Pipeline system and lower operating expenses on the Cochin Pipeline.
•Facilities: Consistent with prior period as a higher share of profit from PGI due to an increase in contributions from certain PGI assets was largely offset by minor decreases in revenue across certain other Facilities assets.
Pembina Pipeline Corporation 2025 Annual Report 3
•Marketing & New Ventures: Decrease primarily due to lower net revenue as a result of narrower WCSB and U.S. NGL frac spreads in the fourth quarter of 2025 compared to the same period in 2024, lower net revenue from risk management and other derivative contracts primarily due to an unrealized loss on the embedded derivative arising from the Cedar LNG capacity commercial arrangement entered into during the fourth quarter of 2025, combined with lower unrealized gains recognized by Cedar LNG, partially offset by a higher share of profit from Greenlight due to a gain on the sale of land to a third-party potential customer.
•Corporate and Income Tax: Higher largely due to a gain on the sale of land to a third-party potential customer of Greenlight in the fourth quarter of 2025, combined with lower net finance costs, income tax expense, as well as acquisition and integration costs, partially offset by higher long-term incentive and restructuring costs.
Adjusted EBITDA(1) Overview
Adjusted EBITDA in the fourth quarter of 2025 decreased by $179 million compared to the prior period. The change primarily reflects a lower contribution from the Marketing & New Ventures Division, the impact of a new toll structure and revenue sharing mechanism on the Alliance Pipeline, and period specific capital recoveries that impacted 2024 with no similar impact in 2025, partially offset by volume growth and solid performance across the Pipelines and Facilities Divisions. Further details by division are outlined below:
•Pipelines: Decrease largely due to lower revenue on the Canadian portion of the Alliance Pipeline as a result of the Alliance Negotiated Settlement, partially offset by higher seasonal revenue on the Alliance Pipeline. Lower results were also due to period specific capital recoveries that impacted certain Pipelines assets in the fourth quarter of 2024 with no similar impact in the same period in 2025 and lower volumes on the Cochin Pipeline. These decreases were offset in part by higher revenue on the Peace Pipeline system and lower operating expenses on the Cochin Pipeline.
•Facilities: Consistent with prior period. Higher contributions from certain PGI assets due to an increase in volumes and the positive impact of PGI's acquisition of a 50 percent working interest in Whitecap Resources Inc.'s ("Whitecap") Kaybob Complex in the fourth quarter of 2024, were largely offset by lower revenue due to period specific capital recoveries that impacted certain PGI assets in the fourth quarter of 2024 with no similar impact in the same period in 2025 and minor decreases in revenue across certain other Facilities assets.
•Marketing & New Ventures: Decrease primarily due to narrower WCSB and U.S. NGL frac spreads in the fourth quarter of 2025 compared to the same period in 2024 and lower realized gains on crude oil-based derivatives due to lower volumes and narrower crude oil price spreads, partially offset by realized gains on NGL-based derivatives in the fourth quarter of 2025 compared to losses in the same period in 2024.
•Corporate: Lower primarily due to higher long-term incentive costs, partially offset by lower non-compensation related general and administrative costs.
Further details and additional factors impacting earnings and adjusted EBITDA by divisions are discussed in the "Segment Results" section of this MD&A.
Cash Flow Measures
| | | | | | |
For the Three Months Ended December 31 |
| | |
| | |
| | |
| | |
| | |
| | |
| Cash flow from operating activities | | $41 million decrease, primarily driven by lower earnings adjusted for items not involving cash and higher taxes paid, partially offset by the change in non-cash operating working capital primarily driven by movements in trade accounts receivable resulting from commodity price and volume fluctuations, as well as higher distributions received from equity accounted investees. |
Adjusted cash flow from operating activities(1) | | $191 million decrease, primarily due to the same items impacting cash flow from operating activities, discussed above, excluding the change in non-cash working capital and taxes paid, combined with higher current income tax expense and accrued share-based payment expense. |
Adjusted cash flow from operating activities per common share – basic (dollars)(1) | | $0.33 decrease, primarily due to the factors impacting adjusted cash flow from operating activities, discussed above, while outstanding common shares remained consistent with prior period. |
| | |
| | |
(1) Refer to the "Non-GAAP & Other Financial Measures" section of this MD&A.
4 Pembina Pipeline Corporation 2025 Annual Report
Consolidated Financial Overview for the Twelve Months Ended December 31
Results of Operations
| | | | | | | | | | | | |
| ($ millions, except where noted) | 2025 | 2024 | Change | |
| Revenue | 7,778 | | 7,384 | | 394 | | |
Net revenue(1) | 4,877 | | 4,776 | | 101 | | |
| Operating expenses | 961 | | 976 | | (15) | | |
Gross profit | 3,193 | | 3,316 | | (123) | | |
Adjusted EBITDA(1) | 4,289 | | 4,408 | | (119) | | |
| | | | |
Earnings | 1,694 | | 1,874 | | (180) | | |
Earnings per common share – basic (dollars) | 2.67 | | 3.00 | | (0.33) | | |
Earnings per common share – diluted (dollars) | 2.66 | | 3.00 | | (0.34) | | |
| Cash flow from operating activities | 3,301 | | 3,214 | | 87 | | |
Cash flow from operating activities per common share – basic (dollars) | 5.68 | | 5.61 | | 0.07 | | |
Adjusted cash flow from operating activities(1) | 2,854 | | 3,265 | | (411) | | |
Adjusted cash flow from operating activities per common share – basic (dollars)(1) | 4.91 | | 5.70 | | (0.79) | | |
| Capital expenditures | 784 | | 955 | | (171) | | |
| | | | |
Change in Earnings ($ millions)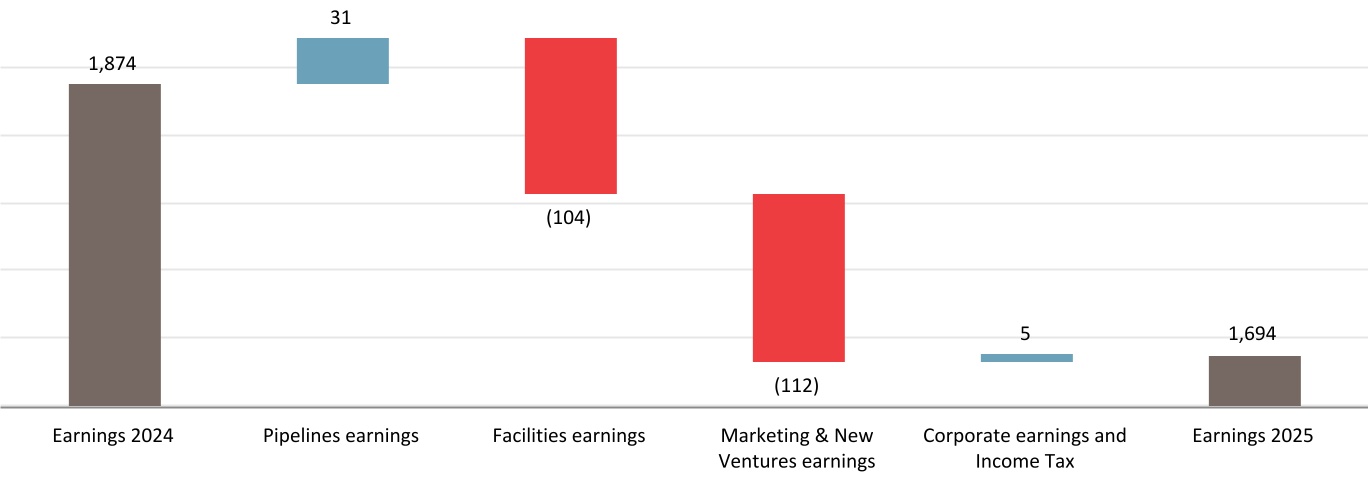
Earnings Overview
Earnings during 2025 decreased by $180 million compared to the prior year. The change primarily reflects narrower WCSB and U.S. NGL frac spreads, impairment recognized within PGI share of profit, the impact of a new toll structure and revenue sharing mechanism on the Alliance Pipeline, and period specific capital recoveries that impacted 2024 with no similar impact in 2025. These factors were partially offset by gains recognized within each division and higher revenue from derivative contracts within the Marketing & New Ventures Division, as well as volume growth and solid performance across the Pipelines and Facilities Divisions. Further details by division are outlined below:
•Pipelines: Increase largely due to the positive impacts from Pembina acquiring a controlling ownership interest in Alliance on April 1, 2024, combined with higher seasonal revenue, partially offset by the impacts of the Alliance Negotiated Settlement. Additionally, earnings were impacted by higher revenue on the Peace Pipeline system due to increased volumes and higher tolls mainly related to contractual inflation adjustments, higher revenue on the Nipisi Pipeline, and the recognition of a gain on the sale of the North segment of the Western Pipeline in the third quarter of 2025. These impacts were partially offset by lower net revenue on the Cochin Pipeline, Vantage Pipeline, and at the Edmonton Terminals, along with a decrease in revenue on certain Pipeline assets due to period specific capital recoveries that impacted 2024 with no similar impact in 2025, as well as higher depreciation and amortization expense.
•Facilities: Decrease largely due to lower share of profit from PGI primarily due to an impairment of certain PGI assets and higher depreciation and amortization expense. These results were partially offset by the positive impacts of Pembina acquiring a controlling ownership interest in Aux Sable on April 1, 2024, the recognition of a gain following the amendment of PGI's credit facility, and higher contributions from certain PGI assets.
Pembina Pipeline Corporation 2025 Annual Report 5
•Marketing & New Ventures: Lower primarily due to narrower WCSB and U.S. NGL frac spreads in 2025 compared to 2024 and lower other income, partially offset by the positive impacts from Pembina acquiring a controlling ownership interest in Aux Sable on April 1, 2024, a higher share of profit from Greenlight due to a gain on the sale of land to a third-party potential customer in the fourth quarter of 2025, and higher revenue from risk management and other derivative contracts.
•Corporate and Income Tax: Consistent with prior year. A gain on the sale of land to a third-party potential customer of Greenlight in the fourth quarter of 2025 combined with lower acquisition and integration costs compared to those incurred in 2024, were largely offset by higher income tax expense, net finance costs, general and administrative expenses, and restructuring costs, along with no similar net gain on acquisition to that recognized in the second quarter of 2024 following Pembina acquiring a controlling ownership interest in Alliance and Aux Sable on April 1, 2024.
Adjusted EBITDA(1) Overview
Adjusted EBITDA during 2025 decreased by $119 million compared to the prior year. The change primarily reflects lower contribution from the Marketing & New Ventures Division, the impact of a new toll structure and revenue sharing mechanism on the Alliance Pipeline, and period specific capital recoveries that impacted 2024 with no similar impact in 2025. These factors were partially offset by volume growth and solid performance across the Pipelines and Facilities Divisions. Further details by division are outlined below:
•Pipelines: Positive impacts from Pembina acquiring a controlling ownership interest in Alliance on April 1, 2024, combined with higher seasonal revenue, partially offset by the impacts of the Alliance Negotiated Settlement. Additionally, earnings were impacted by higher revenue on the Peace Pipeline system due to increased volumes and higher tolls mainly related to contractual inflation adjustments, higher revenue on the Nipisi Pipeline, and the recognition of a gain on the sale of the North segment of the Western Pipeline in the third quarter of 2025. These impacts were partially offset by lower net revenue on the Cochin Pipeline, Vantage Pipeline, and at the Edmonton Terminals, along with a decrease in revenue on certain Pipeline assets due to period specific capital recoveries that impacted 2024 with no similar impact in 2025.
•Facilities: Increase largely due to the net positive impacts from Pembina acquiring a controlling ownership interest in Aux Sable on April 1, 2024, combined with higher contributions from certain PGI assets related to an increase in volumes and the net impact of PGI's acquisition of a 50 percent working interest in Whitecap's Kaybob Complex and PGI’s acquisition of Whitecap's Gold Creek and Karr oil batteries in the fourth quarter of 2024 (collectively, the "Whitecap Transactions"). These increases were partially offset by lower volumes at certain PGI assets due to outages in 2025 and third-party downstream restrictions.
•Marketing & New Ventures: Decrease primarily due to narrower NGL frac spreads in 2025 compared to 2024 and lower realized gains on crude oil-based derivatives due to lower volumes and narrower crude oil price spreads. These decreases were partially offset by the net positive impacts from Pembina acquiring a controlling ownership interest in Aux Sable on April 1, 2024 and lower realized losses on NGL-based derivatives.
•Corporate: Consistent with prior year. Higher incentive costs as well as salaries and wages were largely offset by lower other expenses.
Further details and additional factors impacting on earnings and adjusted EBITDA by divisions are discussed in the "Segment Results" section of this MD&A.
Cash Flow Metrics
| | | | | | |
For the Twelve Months Ended December 31 |
| | |
| | |
| | |
| | |
| | |
| Cash flow from operating activities | | $87 million increase, primarily driven by the change in non-cash operating working capital largely driven by movements in trade accounts receivable resulting from commodity price and volume fluctuations and lower taxes paid. These increases were partially offset by lower distributions received from equity accounted investees and higher net interest paid, both largely the result of Pembina acquiring a controlling ownership interest in Alliance and Aux Sable on April 1, 2024, as well as the net change in contract liabilities. |
Adjusted cash flow from operating activities(1) | | $411 million decrease, primarily driven by the same factors impacting cash flow from operating activities, discussed above. However, when excluding the change in non-cash working capital and taxes paid, the adjusted result reflects a decrease. The decrease was further impacted by higher current income tax expense. |
Adjusted cash flow from operating activities per common share – basic (dollars)(1) | | $0.79 decrease, primarily due to the factors impacting adjusted cash flow from operating activities, discussed above, as well as an increase in outstanding common shares following the conversion of subscription receipts into common shares, concurrent with the closing of Pembina's acquisition of a controlling ownership interest in Alliance and Aux Sable on April 1, 2024. |
| | |
| | |
(1) Refer to the "Non-GAAP & Other Financial Measures" section of this MD&A.
6 Pembina Pipeline Corporation 2025 Annual Report
3. SEGMENT RESULTS
Business Overview
The Pipelines Division provides customers with pipeline transportation, terminalling, and storage in key market hubs in Canada and the United States for crude oil, condensate, natural gas liquids and natural gas. Through Pembina's wholly-owned and joint venture assets, the Pipelines Division manages pipeline transportation capacity of approximately 3.0 mmboe/d(1) and above ground storage capacity of approximately 10 mmbbls(1) within its conventional, oil sands and heavy oil, and transmission assets. The conventional assets include strategically located pipelines and terminalling hubs that gather and transport light and medium crude oil, condensate and natural gas liquids from western Alberta and northeast British Columbia to downstream pipelines and processing facilities in the Edmonton, Alberta area. The oil sands and heavy oil assets transport heavy and synthetic crude oil produced within Alberta to the Edmonton, Alberta area and offer associated storage and terminalling services. The transmission assets transport natural gas, ethane and condensate throughout Canada and the United States on long haul pipelines linking various key market hubs. In addition, the Pipelines Division assets provide linkages to Pembina's Facilities Division assets across North America, enabling flexibility and optionality in the Company's customer service offerings. Together, these assets supply products from hydrocarbon producing regions to refineries, fractionators and market hubs in Alberta, British Columbia, and Illinois, as well as other regions throughout North America.
The Facilities Division includes infrastructure that provides Pembina's customers with natural gas, condensate and NGL services. Through its wholly-owned assets and its interest in PGI, Pembina's natural gas gathering and processing facilities are strategically positioned in active, liquids-rich areas of the WCSB and Williston Basin and may be serviced by the Company's other businesses. Pembina provides its customers with sweet and sour gas gathering, compression, condensate stabilization, and both shallow cut and deep cut gas processing services with a total capacity of approximately 6.7 bcf/d(1). Condensate and NGL extracted at virtually all Canadian-based facilities have access to transportation on Pembina's pipelines. In addition, all NGL transported along the Alliance Pipeline are extracted through the Channahon Facility at the terminus. The Facilities Division includes approximately 430 mbpd(1) of NGL fractionation capacity, 21 mmbbls(1) of cavern storage capacity, various oil batteries, associated pipeline and rail terminalling facilities and a liquefied propane export facility on Canada's West Coast. These facilities are accessible to Pembina's other strategically-located assets and pipeline systems, providing customers with flexibility and optionality to access a comprehensive suite of services to enhance the value of their hydrocarbons. In addition, Pembina owns a bulk marine import/export terminal in Vancouver, British Columbia.
The Marketing & New Ventures Division leverages Pembina's integrated value chain and existing network of pipelines, facilities, and energy infrastructure assets to maximize the value of hydrocarbon liquids and natural gas originating in the basins where the Company operates. Pembina pursues the creation of new markets, and further enhances existing markets, to support both the Company's and its customers' business interests. In particular, Pembina seeks to identify opportunities to connect hydrocarbon production to new demand locations through the development of infrastructure. The division also focuses on developing new business platforms and undertaking initiatives that seek to reduce the GHG emissions of Pembina's and its customers' operations.
Within the Marketing & New Ventures Division, Pembina undertakes value-added commodity marketing activities, including buying and selling products (natural gas, ethane, propane, butane, condensate, crude oil, electricity, and carbon credits), commodity arbitrage, and optimizing storage opportunities. The marketing business enters into contracts for capacity on both Pembina's and third-party infrastructure, handles proprietary and customer volumes and aggregates production for onward sale. Through this infrastructure capacity, including Pembina's Prince Rupert Terminal and 30,000 bdp of export capacity secured at AltaGas' Ridley Island facilities, as well as utilizing the Company's expansive rail fleet and logistics capabilities, Pembina's marketing business adds incremental value to the commodities by accessing high value markets across North America and globally.
The Marketing & New Ventures Division is also responsible for the development of new large-scale, or value chain extending projects, including those that provide enhanced access to global markets and support a transition to a lower-carbon economy. Currently, Pembina is pursuing opportunities associated with LNG, natural gas-fired power generation, and large-scale GHG emissions reductions.
(1)Net capacity.
Pembina Pipeline Corporation 2025 Annual Report 7
Financial and Operational Overview by Division
| | | | | | | | | | | | | | | | | | | | | | | | |
| 3 Months Ended December 31 |
| 2025 | 2024 |
($ millions, except where noted) | Volumes(1) | Earnings (loss) | | | Adjusted EBITDA(2) | Volumes(1) | Earnings (loss) | | | Adjusted EBITDA(2) |
| Pipelines | 2,815 | | 470 | | | | 643 | | 2,790 | | 534 | | | | 686 | |
| Facilities | 898 | | 178 | | | | 366 | | 877 | | 177 | | | | 373 | |
Marketing & New Ventures | 337 | | 115 | | | | 116 | | 349 | | 245 | | | | 234 | |
| Corporate | — | | (126) | | | | (50) | | — | | (212) | | | | (39) | |
| | | | | | | | | | |
| Income tax expense | — | | (148) | | | | — | | — | | (172) | | | | — | |
| Total | | 489 | | | | 1,075 | | | 572 | | | | 1,254 | |
| | | | | | | | | | |
| |
| | |
| | | | | | | | | | |
| | | | | | | | | | |
| | | | | | | | | | |
| | | | | | | | | | |
| | | | | | | | | | |
| | | | | | | | | | |
| | | | | | | | | | | | | | | | | | | | | | | | |
| 12 Months Ended December 31 |
| 2025 | 2024 |
($ millions, except where noted) | Volumes(1) | Earnings (loss) | | | Adjusted EBITDA(2) | Volumes(1) | Earnings (loss) | | | Adjusted EBITDA(2) |
| Pipelines | 2,786 | | 1,938 | | | | 2,596 | | 2,711 | | 1,907 | | | | 2,533 | |
| Facilities | 871 | | 562 | | | | 1,396 | | 837 | | 666 | | | | 1,347 | |
Marketing & New Ventures | 339 | | 457 | | | | 499 | | 327 | | 569 | | | | 724 | |
| Corporate | — | | (750) | | | | (202) | | — | | (1,422) | | | | (196) | |
| | | | | | | | | | |
| Income tax (expense) recovery | — | | (513) | | | | — | | — | | 154 | | | | — | |
| Total | | 1,694 | | | | 4,289 | | | 1,874 | | | | 4,408 | |
| | | | | | | | | | |
| |
| | |
| | | | | | | | | | |
| | | | | | | | | | |
| | | | | | | | | | |
| | | | | | | | | | |
| | | | | | | | | | |
| | | | | | | | | | |
(1) Volumes in mboe/d. See the "Abbreviations" section of this MD&A for definition. Volumes for Pipelines and Facilities divisions are revenue volumes, which are physical volumes plus volumes recognized from take-or-pay commitments. Volumes for Marketing & New Ventures are marketed crude oil and NGL volumes.
(2) Refer to the "Non-GAAP & Other Financial Measures" section of this MD&A.
Equity Accounted Investees Overview by Division
| | | | | | | | | | | | | | | | | | | | | | | | | | | | | | | | |
| 3 Months Ended December 31 |
| | | | |
| 2025 | 2024 |
| ($ millions, except where noted) | Share of profit | Adjusted EBITDA(5) | Contributions | Distributions | Volumes(6) | Share of profit | Adjusted EBITDA(5) | Contributions | Distributions | Volumes(6) |
Pipelines(1) | 1 | | 1 | | — | | — | | — | | — | | — | | — | | — | | — | |
Facilities(2) | 74 | | 200 | | 45 | | 148 | | 386 | | 59 | | 195 | | — | | 131 | | 358 | |
| | | | | | | | | | |
| | | | | | | | | | |
| | | | | | | | | | |
Marketing & New Ventures(3) | 96 | | (1) | | 82 | | — | | — | | 74 | | — | | — | | — | | — | |
| Total | 171 | | 200 | | 127 | | 148 | | 386 | | 133 | | 195 | | — | | 131 | | 358 | |
| | | | | | | | | | | | | | | | | | | | | | | | | | | | | | | | |
| 12 Months Ended December 31 |
| | | | |
| 2025 | 2024 |
| ($ millions, except where noted) | Share of profit | Adjusted EBITDA(5) | Contributions | Distributions | Volumes(6) | Share of profit | Adjusted EBITDA(5) | Contributions | Distributions | Volumes(6) |
| | | | | | | | | | |
| | | | | | | | | | |
| | | | | | | | | | |
Pipelines(1)(4) | 1 | | 4 | | — | | — | | — | | 42 | | 88 | | 5 | | 80 | | 37 | |
| | | | | | | | | | |
| | | | | | | | | | |
| | | | | | | | | | |
Facilities(2) | 134 | | 744 | | 243 | | 544 | | 364 | | 231 | | 717 | | 124 | | 515 | | 358 | |
| | | | | | | | | | |
| | | | | | | | | | |
| | | | | | | | | | |
| | | | | | | | | | |
Marketing & New Ventures(3)(4) | 74 | | (4) | | 168 | | — | | — | | 55 | | 39 | | 242 | | 31 | | 9 | |
| Total | 209 | | 744 | | 411 | | 544 | | 364 | | 328 | | 844 | | 371 | | 626 | | 404 | |
(1) Pipelines includes Grand Valley.
(2) Facilities includes PGI and Fort Corp.
(3) Marketing and New Ventures includes Greenlight in 2025, Cedar LNG and ACG.
(4) For the comparative 2024 period, the results of Alliance and Aux Sable are equity-accounted for the first quarter of 2024. Pembina owned a 50 percent interest in Alliance, an approximately 42.7 percent interest in Aux Sable's U.S operations, and a 50 percent interest in Aux Sable's Canadian operations up to the closing of the acquisition on April 1, 2024. Following the closing of the acquisition, the results of Alliance and Aux Sable are fully consolidated and incorporated into Pembina's financial results.
(5) Refer to the "Non-GAAP & Other Financial Measures" section of this MD&A.
(6) Volumes in mboe/d. See the "Abbreviations" section of this MD&A for definition.
Refer to the "Segment Results – Changes in Results" sections of this MD&A under each of the divisions for additional information.
In 2025, contributions in the Facilities Division were made to PGI to partially fund growth capital projects. Contributions in Marketing & New Ventures in 2025 and 2024 were made to Greenlight and Cedar LNG to fund ongoing project development costs. Refer to the "Segment Results – Marketing & New Ventures Division – Projects & New Developments" sections of this MD&A for additional information.
8 Pembina Pipeline Corporation 2025 Annual Report
Pipelines
Financial Overview for the Three Months Ended December 31
Results of Operations
| | | | | | | | | | | | |
| ($ millions, except where noted) | 2025 | 2024 | Change | |
| | | | |
| | | | |
| | | | |
Pipelines revenue(1) | 871 | | 948 | | (77) | | |
Cost of goods sold(1) | 14 | | 5 | | 9 | | |
Net revenue(1)(2) | 857 | | 943 | | (86) | | |
Operating expenses(1) | 200 | | 231 | | (31) | | |
| Depreciation and amortization included in gross profit | 164 | | 147 | | 17 | | |
| Share of profit from equity accounted investees | 1 | | — | | 1 | | |
| Gross profit | 494 | | 565 | | (71) | | |
| Earnings | 470 | | 534 | | (64) | | |
Adjusted EBITDA(2) | 643 | | 686 | | (43) | | |
Volumes(3) | 2,815 | | 2,790 | | 25 | | |
| | | | | | |
| Change in Results | | |
| | |
| | |
| | |
Net revenue(1)(2) | | Decrease largely due to lower revenue as a result of the impacts of the Alliance Negotiated Settlement ($33 million) and the presentation of certain flow-through costs on a net basis, with an offsetting decrease to operating expenses for the Alliance Pipeline ($18 million). These impacts were partially offset by higher demand on seasonal contracts on the Alliance Pipeline ($19 million). Lower net revenue due to period specific capital recoveries that impacted certain Pipelines assets in the fourth quarter of 2024 with no similar impact in the same period in 2025 ($23 million), lower interruptible volumes on the Cochin Pipeline driven by narrower condensate price differentials, the sale of the North segment of the Western Pipeline in the third quarter of 2025, and lower revenue at the Edmonton Terminals largely due to lower fees. These decreases were partially offset by higher volumes on the Peace Pipeline system. |
| | |
Operating expenses(1) | | Decrease largely due to the presentation of certain flow-through costs now netted within revenue in 2025 for the Alliance Pipeline. Lower operating expenses were also due to the sale of the North segment of the Western Pipeline in third quarter of 2025 and lower repairs and maintenance costs on the Cochin Pipeline. |
| Depreciation and amortization included in gross profit | | Higher primarily due to a change in estimate related to the decommissioning provision of certain assets and a decrease in the estimated useful life of an intangible asset. |
| | |
| Earnings | | Decrease largely due to the impacts of the Alliance Negotiated Settlement, partially offset by higher seasonal revenue on the Alliance Pipeline. Lower earnings were also driven by period specific capital recoveries that impacted certain Pipelines assets in the fourth quarter of 2024 with no similar impact in the same period in 2025, lower interruptible volumes on the Cochin Pipeline, and higher depreciation and amortization expense. These decreases were partially offset by higher volumes on the Peace Pipeline system and lower operating expenses on the Cochin Pipeline. |
Adjusted EBITDA(2) | | Decrease largely due to the same factors impacting earnings, discussed above, excluding the change in depreciation and amortization expense. |
Volumes(3) | | Higher largely due to higher interruptible and contracted volumes on the Peace Pipeline system, an increase in volumes on AEGS as the fourth quarter in 2024 was impacted by third-party outages, and an increase in contracted volumes on the Nipisi Pipeline. This is partially offset by narrower condensate price differentials resulting in lower interruptible volumes on the Cochin Pipeline and the sale of the North segment of the Western Pipeline in third quarter of 2025. |
Change in Adjusted EBITDA ($ millions)(1)(2)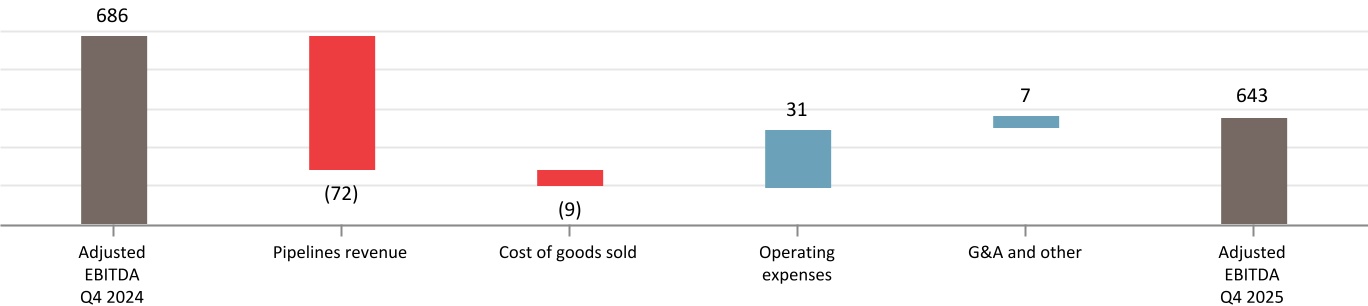
(1) Includes inter-segment transactions. See Note 5 to the Consolidated Financial Statements.
(2) Refer to the "Non-GAAP & Other Financial Measures" section of this MD&A.
(3) Revenue volumes in mboe/d. See the "Abbreviations" section of this MD&A for definition.
Pembina Pipeline Corporation 2025 Annual Report 9
Financial Overview for the Twelve Months Ended December 31
Results of Operations
| | | | | | | | | | | | |
| ($ millions, except where noted) | 2025 | 2024 | Change | |
| | | | |
| | | | |
| | | | |
Pipelines revenue(1) | 3,521 | | 3,386 | | 135 | | |
Cost of goods sold(1) | 51 | | 40 | | 11 | | |
Net revenue(1)(2) | 3,470 | | 3,346 | | 124 | | |
Operating expenses(1) | 804 | | 832 | | (28) | | |
| Depreciation and amortization included in gross profit | 641 | | 557 | | 84 | | |
| Share of profit from equity accounted investees | 1 | | 42 | | (41) | | |
| Gross profit | 2,026 | | 1,999 | | 27 | | |
| Earnings | 1,938 | | 1,907 | | 31 | | |
Adjusted EBITDA(2) | 2,596 | | 2,533 | | 63 | | |
Volumes(3) | 2,786 | | 2,711 | | 75 | | |
| | | | | | |
| Change in Results | | |
| | |
| | |
| | |
Net revenue(1)(2) | | Increase largely due to higher net revenue on the Alliance Pipeline resulting from Pembina acquiring a controlling ownership interest in Alliance on April 1, 2024, and higher demand on seasonal contracts ($60 million), partially offset by the impacts of the Alliance Negotiated Settlement ($33 million). Also contributing to the increase were higher interruptible and contracted volumes on the Peace Pipeline system, higher contracted volumes on the Nipisi Pipeline, and higher tolls on the Peace Pipeline system mainly related to contractual inflation adjustments. Higher net revenue on the NEBC Pipelines in 2025 due to the NEBC MPS Expansion being placed into service in November 2024, along with favourable U.S. dollar foreign exchange rate impacts on certain assets, contributed to an increase to net revenue.
These increases were offset in part by lower net revenue on the Cochin Pipeline largely due to lower tolls as a result of the replacement of long-term contracts that expired in mid-July 2024 and lower volumes due to narrower condensate price differentials. Revenue was also lower due to the presentation of certain flow-through costs on a net basis, with an offsetting decrease to operating expenses for the Alliance Pipeline ($39 million), as well as lower revenue due to period specific capital recoveries that impacted 2024 with no similar impact in 2025 ($23 million). In addition, lower tolls and volumes on the Vantage Pipeline, lower revenue on the Western Pipeline due to the sale of the North segment of the Western Pipeline in the third quarter of 2025, lower revenue at the Edmonton Terminals largely due to lower fees and the decommissioning of the Edmonton South Rail Terminal in the second quarter of 2024, and lower recoverable power and geotechnical costs, contributed to a decrease to net revenue. |
| | |
Operating expenses(1) | | Decrease largely due to the presentation of certain flow-through costs now netted within revenue in 2025 for the Alliance Pipeline and the sale of the North segment of the Western Pipeline in third quarter of 2025. Additionally, there were lower geotechnical spend on certain Pipelines assets and lower power costs resulting from a lower power pool price during 2025, both of which were partially recovered in revenue. The decreases were offset in part by higher costs related to Pembina acquiring a controlling ownership interest in Alliance on April 1, 2024. |
Depreciation and amortization included in gross profit | | Higher largely due to Pembina acquiring a controlling ownership interest in Alliance on April 1, 2024, new assets placed into service in the second half of 2024, a change in estimate related to the decommissioning provision of certain assets, and a decrease in the estimated useful life of an intangible asset in 2025. |
Share of profit from equity accounted investees | | Following Pembina acquiring a controlling ownership interest in Alliance on April 1, 2024, the results from Alliance are no longer accounted for in share of profit and are fully consolidated. |
| Earnings | | Increase largely due to higher net revenue on the Alliance Pipeline as a result of the net positive impacts of Pembina acquiring a controlling ownership interest in Alliance on April 1, 2024 and higher seasonal revenue, partially offset by the impacts of the Alliance Negotiated Settlement. Additionally, higher net revenue on the Peace Pipeline system, Nipisi Pipeline, and NEBC Pipelines, also contributed to the increase in earnings, as well as the recognition of a gain on the sale of the North segment of the Western Pipeline in the third quarter of 2025 and favourable foreign exchange rate impacts on certain assets. These factors were partially offset by lower tolls and volumes on the Cochin Pipeline and Vantage Pipeline, along with a decrease in revenue on certain Pipeline assets due to period specific capital recoveries that impacted 2024 with no similar impact in 2025. Furthermore, lower revenue at the Edmonton Terminals along with higher depreciation and amortization expense, contributed to the offsetting decrease. |
Adjusted EBITDA(2) | | Increase largely due to the same factors impacting earnings, discussed above, excluding the gain on the sale of the North segment of the Western Pipeline and the change in depreciation and amortization expense. |
Volumes(3) | | Higher largely due to Pembina acquiring a controlling ownership interest in Alliance on April 1, 2024. Additionally, higher contracted volumes on the Peace Pipeline system and the Nipisi Pipeline, and higher interruptible volumes on the Peace Pipeline system in the 2025 period compared to the same period in 2024 which was impacted by planned outages for the commissioning of the Phase VIII Peace Pipeline Expansion, contributed to an increase to volumes. These increases were offset in part by lower volumes on the Cochin Pipeline due to narrower condensate price differentials and lower interruptible volumes on the Vantage Pipeline. |
(1) Includes inter-segment transactions. See Note 5 to the Consolidated Financial Statements.
(2) Refer to the "Non-GAAP & Other Financial Measures" section of this MD&A.
(3) Revenue volumes in mboe/d. See the "Abbreviations" section of this MD&A for definition.
10 Pembina Pipeline Corporation 2025 Annual Report
Change in Adjusted EBITDA ($ millions)(1)(2)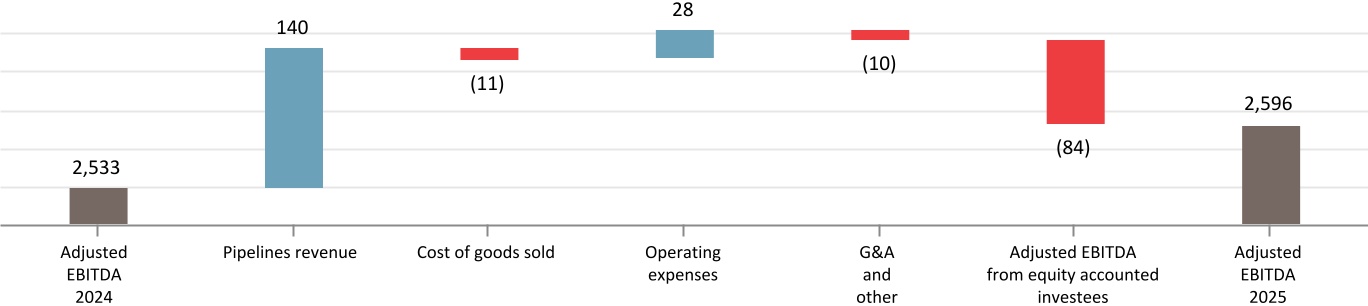
Financial and Operational Overview
| | | | | | | | | | | | | | | | | | | | | | | | | | | | | | | | | | | | | | |
| 3 Months Ended December 31 | 12 Months Ended December 31 |
| | |
| 2025 | 2024 | 2025 | 2024 |
| ($ millions, except where noted) | Volumes(3) | Earnings | Adjusted EBITDA(2) | Volumes(3) | Earnings | Adjusted EBITDA(2) | Volumes(3) | Earnings | Adjusted EBITDA(2) | Volumes(3) | Earnings | Adjusted EBITDA(2) |
Pipelines(4) | | | | | | | | | | | | |
| Conventional | 1,059 | | 317 | | 379 | | 1,034 | | 321 | | 373 | | 1,025 | | 1,223 | | 1,439 | | 1,001 | | 1,149 | | 1,370 | |
| Transmission | 705 | | 115 | | 193 | | 720 | | 160 | | 224 | | 717 | | 576 | | 891 | | 687 | | 592 | | 865 | |
Oil Sands &
Heavy Oil | 1,051 | | 38 | | 71 | | 1,036 | | 53 | | 89 | | 1,044 | | 139 | | 266 | | 1,023 | | 166 | | 298 | |
| | | | | | | | | | | | |
| Total | 2,815 | | 470 | | 643 | | 2,790 | | 534 | | 686 | | 2,786 | | 1,938 | | 2,596 | | 2,711 | | 1,907 | | 2,533 | |
(1) Includes inter-segment transactions. See Note 5 to the Consolidated Financial Statements.
(2) Refer to the "Non-GAAP & Other Financial Measures" section of this MD&A.
(3) Revenue volumes in mboe/d. See the "Abbreviations" section of this MD&A for definition.
(4) Includes values attributed to Pembina's conventional, transmission and oil sands and heavy oil assets within the Pipelines Division. Refer to Pembina's AIF for the year ended December 31, 2025.
Projects & New Developments(1)
The following table outlines the projects which have recently come into service within the Pipelines Division:
| | | | | |
| Significant Projects | In-service Date |
| Phase VIII Peace Pipeline Expansion | May 2024 |
| NEBC MPS Expansion | November 2024 |
|
(1) For further details on Pembina's significant assets, including definitions for capitalized terms used herein that are not otherwise defined, refer to Pembina's AIF for the year ended December 31, 2025 filed at www.sedarplus.ca (filed with the U.S. Securities and Exchange Commission at www.sec.gov under Form 40-F) and on Pembina's website at www.pembina.com.
The Pipelines Division continues to grow its transportation assets to service customer demand. The following outlines the projects and new developments within the Pipelines Division:
| | | | | | | | |
| Fox Creek-to-Namao Expansion | | |
Capital Budget: $200 million | In-service Date(1): Q1 2027 | Status: Recently sanctioned |
Pembina is developing an expansion of the Peace Pipeline system that, through the addition of three new midpoint pump stations and upgrades to the existing three pump stations, will add approximately 70,000 bpd of propane-plus capacity to the market delivery pipelines from Fox Creek, Alberta to Namao, Alberta, while also increasing operational and logistical flexibility. This expansion will increase the total capacity of the Peace and Northern Pipeline systems to approximately 1.2 mbpd. The project was sanctioned in December 2025. |
| | | | | | | | |
| Birch-to-Taylor Expansion | | |
Capital Budget: $310 million | In-service Date(1): Q4 2027 | Status: Recently sanctioned |
The Birch-to-Taylor Expansion includes a new 95-kilometre pipeline and facility upgrades that will add approximately 120,000 bpd of propane-plus and condensate capacity to that corridor. Plateau Pipe Line Ltd., a subsidiary of Pembina, has obtained all necessary permits to begin preliminary construction activities in 2026. |
Pembina Pipeline Corporation 2025 Annual Report 11
| | | | | | | | |
| Taylor-to-Gordondale Expansion | | |
Capital Budget: $115 million | In-service Date(1): Q1 2027 | Status: Recently sanctioned |
The Taylor-to-Gordondale Expansion will further accommodate growing volumes in northeast British Columbia and Alberta. Pembina and Plateau Pipe Line Ltd., a subsidiary of Pembina, are proceeding with the initial scope of this project, which includes new and upgraded pump stations downstream of Taylor, British Columbia and a new 16-kilometre pipeline connecting production in Alberta to the Gordondale pump station. |
(1) Subject to environmental and regulatory approvals. See the "Forward-Looking Statements & Information" section of this MD&A.
Pembina is proceeding with a phased approach to the Taylor-to-Gordondale Expansion, which is being optimized to meet customers' near-term transportation needs while maintaining Pembina's track record of disciplined capital investment. Pembina continues to evaluate additional scope under the Taylor-to-Gordondale Expansion, including an approximately 89 kilometer, 16-inch pipeline being proposed by Pouce Coupé Pipe Line Ltd., a subsidiary of Pembina, to connect mostly condensate volumes from Taylor, British Columbia to the Gordondale, Alberta area. On February 10, 2026, the CER issued a Certificate of Public Convenience and Necessity for the CER regulated Taylor-to-Gordondale Pipeline Project. This was the final federal regulatory approval required for the pipeline. Pembina will continue to evaluate the incremental scope in conjunction with the timing of customers' egress requirements.
12 Pembina Pipeline Corporation 2025 Annual Report
Facilities
Financial Overview for the Three Months Ended December 31
Results of Operations | | | | | | | | | | | | |
| ($ millions, except where noted) | 2025 | 2024 | Change | |
| | | | |
| | | | |
Facilities revenue(1) | 326 | | 320 | | 6 | | |
| | | | |
| | | | |
Operating expenses(1) | 153 | | 138 | | 15 | | |
Depreciation and amortization included in gross profit | 57 | | 55 | | 2 | | |
Share of profit from equity accounted investees | 74 | | 59 | | 15 | | |
| Gross profit | 190 | | 186 | | 4 | | |
| Earnings | 178 | | 177 | | 1 | | |
Adjusted EBITDA(2) | 366 | | 373 | | (7) | | |
Volumes(3) | 898 | | 877 | | 21 | | |
| | | | | | |
| Changes in Results | | |
| | |
| | |
Revenue(1) | | Consistent with prior period. Higher operating recoveries at the fractionation facilities within the Redwater Complex, largely offset by minor decreases in revenue across certain other Facilities assets. |
Operating expenses(1) | | Increase primarily due to higher operating expenses related to repairs and maintenance costs at the Redwater Complex in the fourth quarter of 2025 compared to the same period in 2024, the majority of which were recovered in revenue. |
| | |
| Share of profit from equity accounted investees | | Higher earnings from PGI due to an increase in volumes on certain PGI assets and the net impact of PGI's acquisition of a 50 percent working interest in Whitecap's Kaybob Complex in the fourth quarter of 2024. Additionally, there was lower other expense as the fourth quarter of 2024 was impacted by costs related to asset disposals, partially offset by lower revenue due to period specific capital recoveries that impacted certain PGI assets in the fourth quarter of 2024 with no similar impact in the same period in 2025. |
| Earnings | | Consistent with prior period. A higher share of profit from PGI, discussed above, was largely offset by minor decreases in revenue across certain other Facilities assets. |
Adjusted EBITDA(2) | | Consistent with prior period. Higher contributions from certain PGI assets related to an increase in volumes and the net positive impact of the acquisition of Whitecap's Kaybob Complex in the fourth quarter of 2024, were largely offset by minor decreases in revenue across certain other Facilities assets, and lower revenue due to period specific capital recoveries that impacted certain PGI assets in the fourth quarter of 2024 with no similar impact in the same period in 2025. Included in adjusted EBITDA is $198 million (2024: $193 million) related to PGI. |
| | |
Volumes(3) | | Increase is primarily due to higher volumes as a result of the acquisition of Whitecap's Kaybob Complex in the fourth quarter of 2024, higher volumes at the Dawson Assets due to higher natural gas prices, and higher volumes at the Duvernay Complex. This is partially offset by a decrease in Aux Sable volumes due to lower ethane margins. Volumes include 386 mboe/d (2024: 358 mboe/d) related to PGI. |
Change in Adjusted EBITDA ($ millions)(1)(2)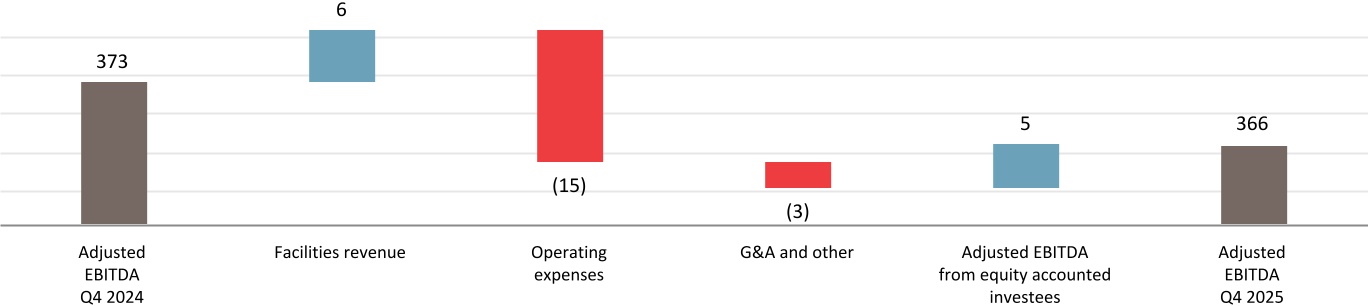
(1) Includes inter-segment transactions. See Note 5 to the Consolidated Financial Statements.
(2) Refer to the "Non-GAAP & Other Financial Measures" section of this MD&A.
(3) Revenue volumes in mboe/d. See the "Abbreviations" section of this MD&A for definition.
Pembina Pipeline Corporation 2025 Annual Report 13
Financial Overview for the Twelve Months Ended December 31
Results of Operations
| | | | | | | | | | | | |
($ millions, except where noted) | 2025 | 2024 | Change | |
| | | | |
| | | | |
Facilities revenue(1) | 1,228 | | 1,127 | | 101 | | |
| | | | |
| | | | |
Operating expenses(1) | 553 | | 474 | | 79 | | |
Depreciation and amortization included in gross profit | 209 | | 183 | | 26 | | |
Share of profit from equity accounted investees | 134 | | 231 | | (97) | | |
| Gross profit | 600 | | 701 | | (101) | | |
| Earnings | 562 | | 666 | | (104) | | |
Adjusted EBITDA(2) | 1,396 | | 1,347 | | 49 | | |
Volumes(3) | 871 | | 837 | | 34 | | |
| | | | | | |
| Changes in Results | | |
| | |
| | |
Revenue(1) | | Increase largely due to Pembina acquiring a controlling ownership interest in Aux Sable on April 1, 2024, combined with higher operating recoveries at the fractionation facilities within the Redwater Complex, partially offset by the impact of a planned outage at the Redwater Complex related to an asset upgrade in the second quarter of 2025. |
Operating expenses(1) | | Increase largely due to Pembina acquiring a controlling ownership interest in Aux Sable on April 1, 2024, combined with higher repairs and maintenance costs at the Redwater Complex, the majority of which were recovered in revenue, along with minor increases across multiple other operating costs. |
| Depreciation and amortization included in gross profit | | Higher largely due to Pembina acquiring a controlling ownership interest in Aux Sable on April 1, 2024, combined with an asset upgrade and associated retirement at the Redwater Complex in the second quarter of 2025, resulting in a planned outage during the same period. |
| | |
| | |
| Share of profit from equity accounted investees | | Decrease due to lower earnings from PGI largely the result of impairment of $146 million (net to Pembina, after tax) recognized on certain PGI assets. Additionally, lower revenue driven by outages at certain PGI assets in 2025 and third-party downstream restrictions impacting the Dawson Assets, contributed to a decrease in share of profit from PGI. This was partially offset by the recognition of a $23 million gain (net to Pembina, after tax) following the amendment of PGI's credit facility, gains recognized by PGI on interest rate derivative financial instruments in 2025 compared to losses in 2024, and lower other expense as 2024 was impacted by costs related to asset disposals. Additionally, higher contributions due to the Whitecap Transactions and higher volumes at the Duvernay Complex, contributed to the offsetting increase to share of profit from PGI. |
| Earnings | | Decrease primarily due to lower share of profit from PGI and higher depreciation and amortization expense. This was partially offset by the net positive impacts of Pembina acquiring a controlling ownership interest in Aux Sable on April 1, 2024. |
Adjusted EBITDA(2) | | Increase primarily due to the net positive impacts of Pembina acquiring a controlling ownership interest in Aux Sable on April 1, 2024, combined with higher contributions from PGI largely the result of the Whitecap Transactions and higher volumes at the Duvernay Complex. This was partially offset by outages at certain PGI assets in 2025 and third-party downstream restrictions impacting the Dawson Assets. Included in adjusted EBITDA is $735 million (2024: $709 million) related to PGI. |
Volumes(3) | | Higher largely due to Pembina acquiring a controlling ownership interest in Aux Sable on April 1, 2024, partially offset by a decrease in volumes due to lower ethane margins and lower utilization in 2025 compared to 2024 due to third-party restrictions and planned outages at the Channahon Facility in the second quarter of 2025. Additionally, higher volumes at the Redwater Complex and Younger were due to a planned outage and a rail strike impacting the Redwater Complex that occurred in the third quarter of 2024, which resulted in volume curtailments. Higher volumes on certain PGI assets due to the Whitecap Transactions and higher volumes at the Duvernay Complex, were largely offset by volume curtailments at certain PGI assets resulting from a turnaround that began in the second quarter of 2025 and continued into the third quarter, combined with third-party downstream restrictions impacting the Dawson Assets. Volumes include 364 mboe/d (2024: 358 mboe/d) related to PGI. |
(1) Includes inter-segment transactions. See Note 5 to the Consolidated Financial Statements.
(2) Refer to the "Non-GAAP & Other Financial Measures" section of this MD&A.
(3) Revenue volumes in mboe/d. See the "Abbreviations" section of this MD&A for definition.
14 Pembina Pipeline Corporation 2025 Annual Report
Change in Adjusted EBITDA ($ millions)(1)(2)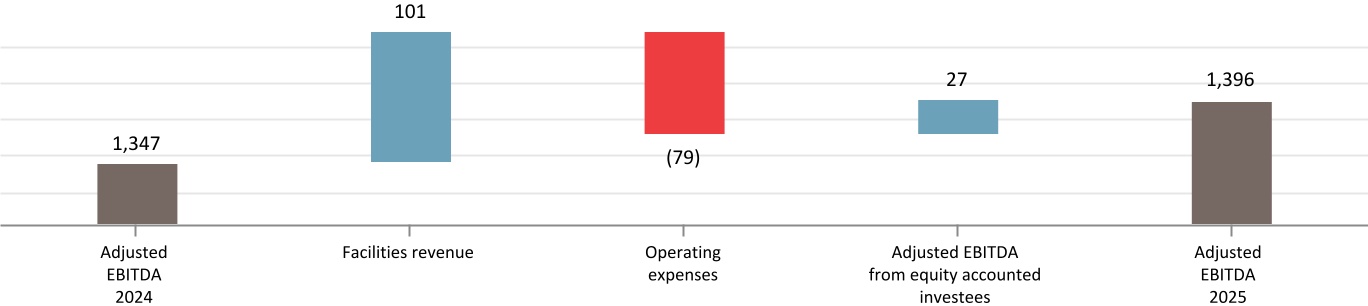
Financial and Operational Overview
| | | | | | | | | | | | | | | | | | | | | | | | | | | | | | | | | | | | | | |
| 3 Months Ended December 31 | 12 Months Ended December 31 |
| 2025 | 2024 | 2025 | 2024 |
| ($ millions, except where noted) | Volumes(3) | Earnings | Adjusted EBITDA(2) | Volumes(3) | Earnings | Adjusted EBITDA(2) | Volumes(3) |
Earnings | Adjusted EBITDA(2) | Volumes(3) | Earnings | Adjusted EBITDA(2) |
Facilities(4) | | | | | | | | | | | | |
| Gas Services | 631 | | 91 | | 226 | | 597 | | 77 | | 222 | | 610 | | 209 | | 849 | | 598 | | 299 | | 817 | |
| NGL Services | 267 | | 87 | | 140 | | 280 | | 100 | | 151 | | 261 | | 353 | | 547 | | 239 | | 367 | | 530 | |
| | | | | | | | | | | | |
| Total | 898 | | 178 | | 366 | | 877 | | 177 | | 373 | | 871 | | 562 | | 1,396 | | 837 | | 666 | | 1,347 | |
(1) Includes inter-segment transactions. See Note 5 to the Consolidated Financial Statements.
(2) Refer to the "Non-GAAP & Other Financial Measures" section of this MD&A.
(3) Revenue volumes in mboe/d. See the "Abbreviations" section of this MD&A for definition.
(4) Includes values attributed to Pembina's gas services and NGL services assets within the Facilities operating segment. For a description of Pembina's gas and NGL assets, refer to Pembina's AIF for the year ended December 31, 2025.
Projects & New Developments(1)
The Facilities Division continues to grow its natural gas and NGL processing and fractionation assets to service customer demand. The following outlines the projects and new developments within the Facilities Division:
| | | | | | | | |
| RFS IV | | |
Capital Budget: $525 million | | |
Revised Capital Cost: $500 million | In-service Date(2): Q2 2026 | Status: On time, trending under budget |
RFS IV is a 55,000 bpd propane-plus fractionator at the existing Redwater fractionation and storage complex (the "Redwater Complex"). The project includes additional rail loading capacity and will leverage the design, engineering, and operating best practices of the existing facilities at the Redwater Complex. With the addition of RFS IV, the fractionation capacity at the Redwater Complex will total 256,000 bpd. Pembina has entered into a lump-sum engineering, procurement and construction agreement in respect of the project, for more than 70 percent of the project cost. Engineering, procurement, and fabrication is substantially complete, while field construction has progressed to approximately 90 percent complete. |
| | | | | | | | |
| Wapiti Expansion | | |
Capital Budget: $140 million (net to Pembina) | In-service Date(2): End of Q1 2026 | Status: On time, trending on budget |
PGI is developing an expansion that will increase natural gas processing capacity at the Wapiti Plant by 115 MMcf/d (gross to PGI). The expansion opportunity is driven by strong customer demand supported by growing Montney production and is fully underpinned by long-term, take-or-pay contracts. The project includes a new sales gas pipeline and other related infrastructure. Commissioning is underway and the expansion is expected to be in-service at the end of the first quarter. |
| | | | | | | | |
| K3 Cogeneration Facility | | |
Capital Budget: $70 million (net to Pembina) | In-service Date(2): End of Q1 2026 | Status: On time, trending under budget |
PGI is developing a 28 MW cogeneration facility at its K3 Plant, which is expected to reduce overall operating costs by providing power and heat to the gas processing facility, while reducing customers' exposure to power prices. The K3 Cogeneration Facility is expected to fully supply the K3 Plant's power requirements, with excess power sold to the grid at market rates. Further, through the utilization of the cogeneration waste heat and the low-emission power generated, the project is expected to contribute to a reduction in annual emissions compliance costs at the K3 Plant. Commissioning is underway and the project is expected to be in-service at the end of the first quarter. |
Pembina Pipeline Corporation 2025 Annual Report 15
| | | | | | | | |
| Prince Rupert Terminal Optimization | | |
Capital Budget: $145 million | In-service Date(2): Mid-2028 | Status: Recently sanctioned |
| Pembina is optimizing its Prince Rupert Terminal ("PRT"), primarily through increasing storage capacity, that will allow PRT to accommodate medium gas carrier vessels. The PRT optimization is expected to expand access to additional markets with higher realized propane prices, while significantly reducing shipping costs per unit, thereby improving netbacks for Pembina and its customers. Earthworks at site are nearing completion, and engineering activities and procurement of long-lead equipment has commenced. |
(1) For further details on Pembina's significant assets, including definitions for capitalized terms used herein that are not otherwise defined, refer to Pembina's AIF for the year ended December 31, 2025 filed at www.sedarplus.ca (filed with the U.S. Securities and Exchange Commission at www.sec.gov under Form 40-F) and on Pembina's website at www.pembina.com.
(2) Subject to environmental and regulatory approvals. See the "Forward-Looking Statements & Information" section of this MD&A.
Pursuant to an agreement with Whitecap, PGI has committed to support infrastructure development in the Lator area, including a new battery and gathering laterals (the "Lator Infrastructure"), which PGI will own. PGI anticipates funding up to $400 million ($240 million net to Pembina) for the battery and gathering laterals within the first phase of the Lator Infrastructure development, with all gas volumes flowing to PGI's Musreau facility upon startup, which is expected in the fourth quarter of 2026, supporting long-term plant utilization. Site grading and piling installation for the battery was completed in the fourth quarter of 2025, and Pembina's pipeline execution scope is approximately 60 percent complete.
Pursuant to an agreement with Whitecap, PGI has committed to fund capital up to $300 million ($180 million net to Pembina) for battery and gathering infrastructure in the Gold Creek and Karr areas, which is expected to be in service in the second quarter of 2026. The gathering pipeline infrastructure has been completed and battery construction is approximately 50 percent complete.
Pursuant to an agreement with a Montney producer, PGI has committed to fund and acquire an under-construction battery and additional infrastructure (the "North Gold Creek Battery") in the Wapiti/North Gold Creek Montney area for a capital commitment up to $150 million ($90 million net to Pembina). The North Gold Creek Battery will be operated by the producer and highly contracted under a long-term, take-or-pay agreement. Pipeline installations are complete and all equipment has been installed at the North Gold Creek Battery, with electrical and instrumentation work progressing. The expected in-service date of the North Gold Creek Battery is the second quarter of 2026.
16 Pembina Pipeline Corporation 2025 Annual Report
Marketing & New Ventures
Financial Overview for the Three Months Ended December 31
Results of Operations | | | | | | | | | | | | |
| ($ millions, except where noted) | 2025 | 2024 | Change | |
Marketing & New Ventures revenue(1) | 985 | | 1,133 | | (148) | | |
Cost of goods sold(1) | 927 | | 919 | | 8 | | |
Net revenue(1)(2) | 58 | | 214 | | (156) | | |
Operating expenses(1) | 6 | | 12 | | (6) | | |
| Depreciation and amortization included in gross profit | 18 | | 17 | | 1 | | |
| Share of profit from equity accounted investees | 96 | | 74 | | 22 | | |
| Gross profit | 130 | | 259 | | (129) | | |
| Earnings | 115 | | 245 | | (130) | | |
Adjusted EBITDA(2) | 116 | | 234 | | (118) | | |
Crude oil sales volumes(3) | 77 | | 96 | | (19) | | |
NGL sales volumes(3) | 260 | | 252 | | 8 | | |
| | | | | | |
| Change in Results | | |
| | |
| | |
Net revenue(1)(2) | | Lower NGL net revenue from contracts with customers was driven primarily by lower NGL margins due to narrower WCSB and U.S. NGL frac spreads in the fourth quarter of 2025 compared to the same period in 2024. Crude net revenue from contracts with customers remained consistent for the fourth quarter of 2025 compared to the fourth quarter of 2024.
Lower revenue from risk management and other derivative contracts was primarily due to an unrealized loss on the embedded derivative arising from the Cedar LNG capacity commercial arrangement entered into during the fourth quarter of 2025 (refer to the "Other - Risk Management - Financial Instruments" section of this MD&A), lower realized gains on crude oil-based derivatives due to lower volumes and narrower crude oil price spreads, and unrealized losses on renewable power purchase agreements in the fourth quarter of 2025 compared to gains in the fourth quarter of 2024. These decreases were partially offset by gains on NGL-based derivatives in the fourth quarter of 2025 compared to losses in the same period of 2024. The fourth quarter of 2025 included unrealized losses on derivative instruments of $78 million (2024: $41 million loss) and realized gains on derivative instruments of $35 million (2024: $52 million gain). |
| | |
| | |
| | |
| | |
| | |
| Share of profit from equity accounted investees | | Increase largely due to a gain of $62 million (net to Pembina, pre-tax) recognized by Greenlight on the sale of land to a third-party potential customer in the fourth quarter of 2025, partially offset by lower share of profit from Cedar LNG due to lower unrealized gains on interest rate derivative financial instruments, offset in part by unrealized foreign exchange gains on U.S. dollar denominated debt recognized by Cedar LNG in the fourth quarter of 2025 compared to losses in the fourth quarter of 2024. |
| Earnings | | Decrease primarily due to narrower WCSB and U.S. NGL frac spreads in the fourth quarter of 2025 compared to the same period in 2024, and lower net revenue from risk management and other derivative contracts, discussed above. These decreases were partially offset by higher share of profit from Greenlight due to a gain on sale of land to a third-party potential customer, offset in part by lower share of profit from Cedar LNG. |
Adjusted EBITDA(2) | | Decrease largely due to narrower WCSB and U.S. NGL frac spreads in the fourth quarter of 2025 compared to the same period in 2024, as well as lower realized gains on crude oil-based derivatives due to lower volumes and narrower crude oil price spreads, partially offset by realized gains on NGL-based derivatives in the fourth quarter of 2025 compared to losses in the fourth quarter of 2024. |
Crude oil sales volumes(3) | | Lower primarily due to decreased blending opportunities. |
| | |
Change in Adjusted EBITDA ($ millions)(1)(2)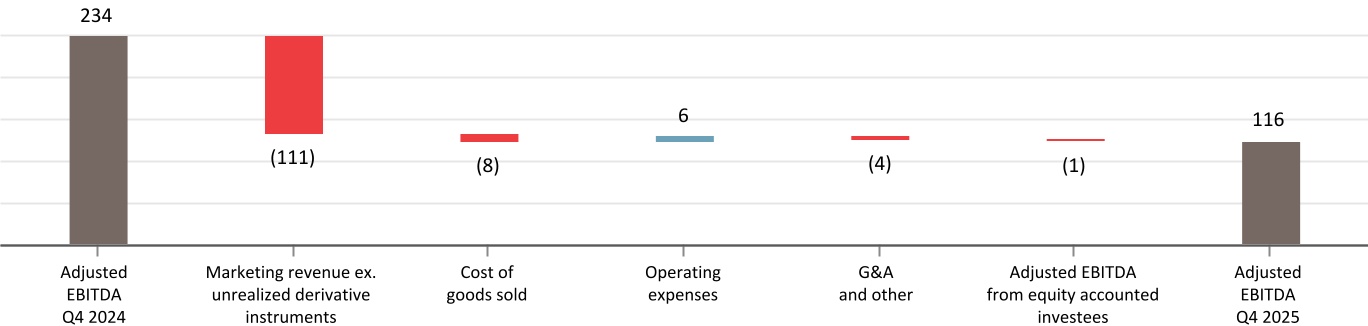
(1) Includes inter-segment transactions. See Note 5 to the Consolidated Financial Statements.
(2) Refer to the "Non-GAAP & Other Financial Measures" section of this MD&A.
(3) Marketed crude oil and NGL volumes in mboe/d. See the "Abbreviations" section of this MD&A for definition.
Pembina Pipeline Corporation 2025 Annual Report 17
Financial Overview for the Twelve Months Ended December 31
Results of Operations
| | | | | | | | | | | | |
| ($ millions, except where noted) | 2025 | 2024 | Change | |
Marketing & New Ventures revenue(1) | 4,065 | | 3,796 | | 269 | | |
Cost of goods sold(1) | 3,524 | | 3,198 | | 326 | | |
Net revenue(1)(2) | 541 | | 598 | | (57) | | |
Operating expenses(1) | 30 | | 25 | | 5 | | |
| Depreciation and amortization included in gross profit | 71 | | 64 | | 7 | | |
| Share of profit from equity accounted investees | 74 | | 55 | | 19 | | |
| Gross profit | 514 | | 564 | | (50) | | |
| Earnings | 457 | | 569 | | (112) | | |
Adjusted EBITDA(2) | 499 | | 724 | | (225) | | |
Crude oil sales volumes(3) | 93 | | 99 | | (6) | | |
NGL sales volumes(3) | 246 | | 228 | | 18 | | |
| | | | | | |
| Change in Results | | |
| | |
| | |
Net revenue(1)(2) | | Lower net revenue from contracts with customers was largely driven by lower NGL margins due to narrower WCSB and U.S. NGL frac spreads in 2025 compared to 2024. This was partially offset by Pembina acquiring a controlling ownership interest in Aux Sable on April 1, 2024 and no similar impact to the nine-day unplanned outage at Aux Sable in July 2024.
Higher revenue from risk management and other derivative contracts was primarily due to lower unrealized losses on renewable power purchase agreements, largely due to improved forward power prices, and unrealized gains on NGL-based derivatives in 2025, compared to losses in 2024. In addition, lower realized losses on NGL-based derivatives, contributed to an increase in net revenue. These increases were partially offset by lower realized gains on crude oil-based derivatives due to lower volumes and narrower crude oil price spreads and an unrealized loss on the embedded derivative arising from the Cedar LNG capacity commercial arrangement entered into during the fourth quarter of 2025 (refer to the "Other - Risk Management - Financial Instruments" section of this MD&A). The 2025 year included unrealized losses on derivative instruments of $37 million (2024: $170 million loss) and realized gains on derivative instruments of $133 million (2024: $241 million gain). |
| | |
| | |
| | |
| Share of profit from equity accounted investees | | Increase largely due to a gain of $62 million (net to Pembina, pre-tax) recognized by Greenlight on the sale of land to a third-party potential customer in the fourth quarter of 2025, combined with unrealized foreign exchange gains on U.S. dollar denominated debt recognized by Cedar LNG in 2025 compared to losses in 2024. These increases were partially offset by unrealized losses on interest rate derivative financial instruments recognized by Cedar LNG in 2025 compared to gains in 2024, as well as the results from Aux Sable from the first quarter of 2024, which are fully consolidated following Pembina acquiring a controlling ownership interest on April 1, 2024. |
| | |
| Earnings | | Decrease primarily due to narrower WCSB and U.S. NGL frac spreads in 2025 compared to 2024, as well as no similar gain to that recognized in the 2024 period associated with the derecognition of the provision related to financial assurances provided by Pembina which were assumed by Cedar LNG following the positive final investment decision in June 2024 in respect of the Cedar LNG project, a floating LNG export facility currently under construction (the "Cedar LNG Project"). This was partially offset by the net positive impacts of Pembina acquiring a controlling ownership interest in Aux Sable on April 1, 2024, higher share of profit from Greenlight, and higher revenue from risk management and other derivative contracts. |
Adjusted EBITDA(2) | | Decrease primarily due to narrower WCSB and U.S. NGL frac spreads in 2025 compared to 2024 and lower realized gains on crude oil-based derivatives due to lower volumes and narrower crude oil price spreads, partially offset by the net positive impacts of Pembina acquiring a controlling ownership interest in Aux Sable on April 1, 2024, and lower realized losses on NGL-based derivatives. |
| | |
NGL sales volumes(3) | | Increase due to higher WCSB ethane volumes, combined with higher ethane, propane, and butane volumes at Aux Sable largely due to the increase in Pembina's ownership interest in Aux Sable and no similar impact to the nine-day unplanned outage in July 2024. |
(1) Includes inter-segment transactions. See Note 5 to the Consolidated Financial Statements.
(2) Refer to the "Non-GAAP & Other Financial Measures" section of this MD&A.
(3) Marketed crude oil and NGL volumes in mboe/d. See the "Abbreviations" section of this MD&A for definition.
18 Pembina Pipeline Corporation 2025 Annual Report
Change in Adjusted EBITDA ($ millions)(1)(2)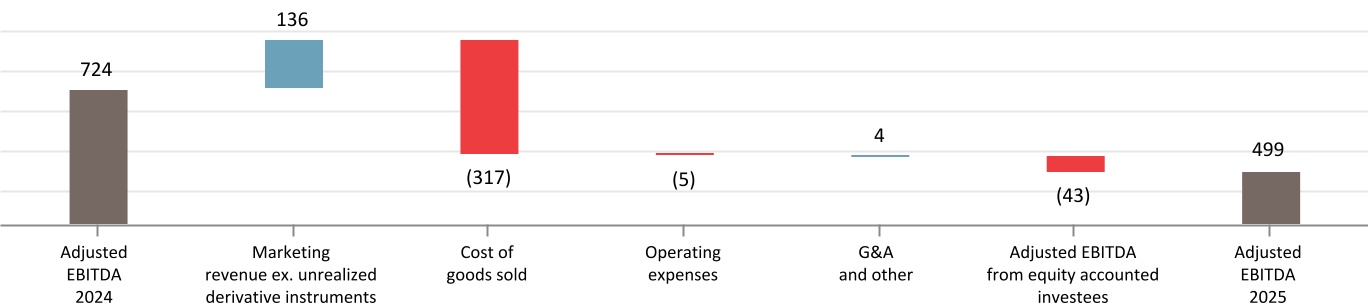
Financial and Operational Overview
| | | | | | | | | | | | | | | | | | | | | | | | | | | | | | | | | | | | | | |
| 3 Months Ended December 31 | 12 Months Ended December 31 |
| 2025 | 2024 | 2025 | 2024 |
| ($ millions, except where noted) | Volumes(3) | Earnings | Adjusted EBITDA(2) | Volumes(3) | Earnings | Adjusted EBITDA(2) | Volumes(3) | Earnings | Adjusted EBITDA(2) | Volumes(3) | Earnings | Adjusted EBITDA(2) |
Marketing & New Ventures(4) | | | | | | | | | | | | |
| Marketing | 337 | | 86 | | 122 | | 349 | | 174 | | 237 | | 339 | | 467 | | 521 | | 327 | | 510 | | 731 | |
New Ventures(5) | — | | 29 | | (6) | | — | | 71 | | (3) | | — | | (10) | | (22) | | — | | 59 | | (7) | |
| | | | | | | | | | | | |
| | | | | | | | | | | | |
| Total | 337 | | 115 | | 116 | | 349 | | 245 | | 234 | | 339 | | 457 | | 499 | | 327 | | 569 | | 724 | |
(1) Includes inter-segment transactions. See Note 5 to the Consolidated Financial Statements.
(2) Refer to the "Non-GAAP & Other Financial Measures" section of this MD&A.
(3) Marketed crude oil and NGL volumes in mboe/d. See the "Abbreviations" section of this MD&A for definition.
(4) Includes values attributed to Pembina's marketing activities and new ventures projects within the Marketing & New Ventures operating segment. For further details on Pembina's marketing activities and projects, refer to Pembina's AIF for the year ended December 31, 2025.
(5) All New Ventures projects have not yet commenced operations and therefore have no volumes.
Projects & New Developments(1)
The New Ventures group is responsible for the development of new large-scale, or value chain extending projects, including those that provide enhanced access to global markets and support a transition to a lower-carbon economy.
| | | | | | | | |
| Cedar LNG | | |
Capital Budget: U.S. $2 billion (net) | In-service Date: Late-2028 | Status: On time, on budget |
The Haisla Nation and Pembina are partners in Cedar LNG Partners LP ("Cedar LNG"), which is constructing the Cedar LNG Project, a floating LNG facility with a nameplate capacity of 3.3 million tonnes per annum ("mtpa"), located in the traditional territory of the Haisla Nation, on Canada's West Coast. The project is strategically positioned to leverage Canada's abundant natural gas supply and deliver a lower-carbon energy option to global markets. The facility will be powered by renewable electricity from BC Hydro, making it one of the lowest emitting LNG facilities in the world. At the end of December 2025, construction of the floating LNG vessel was over 35 percent complete. In addition, significant progress has been made towards the onshore scope of work, including completion of all horizontal directional drills on the Cedar Pipeline and clearing of the transmission line right-of-way. 2026 is expected to be the largest single capital investment year for the project, with a focus on progressing construction of the floating LNG vessel, completing the substation and mooring foundations at the marine terminal site, commencing installation of the transmission line, and achieving mechanical completion of the Cedar Pipeline. |
| Cedar LNG has secured a 20-year take-or-pay, fixed toll contract with ARC Resources Ltd. for 1.5 mtpa of LNG. Pembina previously signed a 20-year take-or-pay liquefaction tolling service agreement for 1.5 mtpa of LNG to support the final investment decision on Cedar LNG in June 2024 with the expectation of remarketing the capacity at a later stage. During the fourth quarter of 2025, Pembina announced a 20-year take-or-pay agreement with PETRONAS related to 1.0 mtpa of liquefaction capacity, and a 12-year take-or-pay agreement with Ovintiv related to 0.5 mtpa of liquefaction capacity at Cedar LNG, which completes Pembina's remarketing efforts. |
(1) For further details on Pembina's significant assets, including definitions for capitalized terms used herein that are not otherwise defined, refer to Pembina's AIF for the year ended December 31, 2025 filed at www.sedarplus.ca (filed with the U.S. Securities and Exchange Commission at www.sec.gov under Form 40-F) and on Pembina's website at www.pembina.com.
Pembina, and its partner Kineticor, an OPTrust portfolio company, continue to make significant progress towards the commercialization of the Greenlight Electricity Centre. The project is a proposed multi-phased natural gas-fired combined cycle power generation facility, to be located in Sturgeon County, Alberta, with a capacity of up to approximately 1,800 megawatts, designed to advance Alberta's innovation economy. In 2025, the partners secured a 907 MW power grid allocation, which was subsequently assigned to a potential customer, entered into an approximately $190 million (net to Pembina) purchase and sale agreement with the potential customer for land, and signed an agreement which provides certainty of availability and delivery timing for two turbines. Pembina and Kineticor continue to progress various workstreams including finalizing a commercial agreement, engineering, procurement and regulatory, and expect to make a final investment decision in the first half of 2026.
Pembina Pipeline Corporation 2025 Annual Report 19
Corporate and Income Tax
Financial Overview for the Three Months Ended December 31
Results of Operations
| | | | | | | | | | | | |
| ($ millions) | 2025 | 2024 | Change | |
| | | | |
| | | | |
Revenue(1)(2) | 11 | 11 | | — | | |
| General and administrative | 79 | 67 | 12 | | |
| Other expense | 21 | | 8 | | 13 | | |
| Gain on disposal of assets | (96) | | — | | (96) | | |
| | | | |
| Net finance costs | 135 | | 151 | | (16) | | |
| | | | |
| | | | |
| | | | |
| Earnings (loss) | (126) | | (212) | | 86 | | |
Adjusted EBITDA(3) | (50) | | (39) | | (11) | | |
| Income tax expense | 148 | | 172 | | (24) | | |
| | | | | | |
| Change in Results | | |
| | |
| General and administrative | | Increase largely due to higher long-term incentive costs, partially offset by lower non-compensation related general and administrative costs. |
| Other expense | | Increase largely due to restructuring costs incurred in the fourth quarter of 2025, partially offset by lower acquisition fees and integration costs compared to those incurred in the fourth quarter of 2024 following Pembina acquiring a controlling ownership interest in Alliance and Aux Sable on April 1, 2024. |
| Gain on disposal of assets | | Increased due to a pre-tax gain of $96 million related to the sale of land to a third-party potential customer of Greenlight in the fourth quarter of 2025. |
| | |
| Net finance costs | | Decrease primarily due to gains on foreign exchange in the fourth quarter of 2025 compared to losses in the fourth quarter of 2024, combined with higher interest income and lower interest expense on long‑term debt, driven by reduced costs on medium‑term notes, partially offset by higher interest expense associated with new debt issued in the fourth quarter of 2025. |
| Earnings (loss) | | Increase largely due to a gain recognized on the sale of land to a third-party potential customer of Greenlight, lower net finance costs, and lower acquisition fees and integration costs, partially offset by higher long-term incentive costs and restructuring costs. |
Adjusted EBITDA(3) | | Decrease largely due to higher long-term incentive costs, partially offset by lower non-compensation related general and administrative costs. |
| Income tax expense | | Decrease largely due to lower taxable earnings in the current period. |
| | |
(1) Excludes inter-segment eliminations.
(2) Primarily consists of fixed fee income related to shared service agreements with PGI.
(3) Refer to the "Non-GAAP & Other Financial Measures" section of this MD&A.
20 Pembina Pipeline Corporation 2025 Annual Report
Financial Overview for the Twelve Months Ended December 31
Results of Operations
| | | | | | | | | | | | |
| ($ millions) | 2025 | 2024 | Change | |
| | | | |
| | | | |
Revenue(1)(2) | 46 | 45 | | 1 | | |
General and administrative | 325 | | 305 | | 20 | | |
| Other expense | 20 | | 35 | | (15) | | |
| Gain on disposal of assets | (96) | | — | | (96) | | |
| Loss on acquisition | — | | 616 | | (616) | | |
| Net finance costs | 554 | | 518 | | 36 | | |
| Earnings (loss) | (750) | | (1,422) | | 672 | | |
Adjusted EBITDA(3) | (202) | | (196) | | (6) | | |
| | | | |
| | | | |
| Income tax expense (recovery) | 513 | | (154) | | 667 | | |
| | | | | | |
| Change in Results | | |
| | |
| General and administrative | | Increase largely due to higher long-term and short-term incentives costs and higher salaries and wages, partially offset by lower non-compensation related general and administrative costs. |
| Other expense | | Decrease largely due to lower acquisition fees and integration costs compared to those incurred in 2024 following Pembina acquiring a controlling ownership interest in Alliance and Aux Sable on April 1, 2024, partially offset by restructuring costs incurred in the fourth quarter of 2025. |
| Gain on disposal of assets | | Increase primarily due to a pre-tax gain of $96 million related to the sale of land to a third-party potential customer of Greenlight in the fourth quarter of 2025. |
| Loss on acquisition | | In the second quarter of 2024, Pembina recognized a $616 million loss from the disposition of Pembina's previous investments in the Alliance, Aux Sable, and NRGreen joint ventures following Pembina's acquisition of a controlling interest in the joint ventures, offset by a $626 million deferred tax recovery recognized from the acquisition, resulting in a net gain of $10 million. |
| Net finance costs | | Increase primarily due to lower interest income, along with higher interest expense on long‑term debt, resulting from a combination of additional borrowings in 2025 following Pembina acquiring a controlling ownership interest in Alliance and Aux Sable on April 1, 2024, and higher interest rates. This is partially offset by gains on foreign exchange in 2025 compared to losses in 2024. |
| Earnings (loss) | | Increase largely due to no similar loss recognized in 2025, compared to the loss recognized in the second quarter of 2024 following Pembina acquiring a controlling ownership interest in Alliance and Aux Sable on April 1, 2024, combined with a gain recognized on the sale of land to a third-party potential customer of Greenlight as well as lower acquisition fees and integration costs, discussed above. This was partially offset by higher net finance costs, long-term and short-term incentive costs, and restructuring costs. |
Adjusted EBITDA(3) | | Consistent with prior year. Higher general and administrative expenses were largely offset by lower other expenses not deducted in the calculation of adjusted EBITDA. |
| Income tax expense (recovery) | | Income tax expense in 2025 resulted primarily from the absence of items similar to those recognized in 2024. Those items included a deferred tax recovery in connection with Pembina's acquisition of a controlling ownership interest in Alliance and Aux Sable, as well as an adjustment in the tax basis of an investment in a partnership. Additionally, higher taxable earnings contributed to the tax expense in 2025. As a result, the effective tax rate for 2025 was 23 percent compared to an effective tax recovery rate of 9 percent in 2024. |
(1) Excludes inter-segment eliminations.
(2) Primarily consists of fixed fee income related to shared service agreements with PGI.
(3) Refer to the "Non-GAAP & Other Financial Measures" section of this MD&A.
Pembina Pipeline Corporation 2025 Annual Report 21
4. LIQUIDITY & CAPITAL RESOURCES
Available Sources of Liquidity
| | | | | | | | |
| | |
As at December 31 ($ millions) | 2025 | 2024 |
Working capital(1) | (806) | | (1,335) | |
Variable rate debt | | |
Senior unsecured credit facilities(2) | 1,305 | | 1,148 | |
| Interest rate swapped debt | — | | (360) | |
| | |
Total variable rate loans and borrowings outstanding (weighted average interest rate of 4.0% (2024: 5.2%)) | 1,305 | | 788 | |
Fixed rate debt | | |
| Senior unsecured medium-term notes | 10,350 | | 10,900 | |
| Interest rate swapped debt | — | | 360 | |
| | |
Total fixed rate loans and borrowings outstanding (weighted average interest rate of 4.5% (2024: 4.4%)) | 10,350 | | 11,260 | |
| Total loans and borrowings outstanding | 11,655 | | 12,048 | |
| Cash and unutilized debt facilities | 2,294 | | 2,518 | |
Subordinated hybrid notes (weighted average interest rate of 5.3% (2024: 4.8%)) | 1,025 | | 600 | |
| | |
(1) Current assets of $1.3 billion (December 31, 2024: $1.6 billion) less current liabilities of $2.1 billion (December 31, 2024: $2.9 billion). As at December 31, 2025, working capital included $600 million (December 31, 2024: $1.5 billion) associated with the current portion of long-term debt and $106 million (December 31, 2024: $141 million) in cash.
(2) Includes U.S. $250 million variable rate debt outstanding at December 31, 2025 (December 31, 2024: U.S. $250 million).
Pembina currently anticipates that its cash flow from operating activities, the majority of which is derived from fee-based contracts, will be more than sufficient to meet its operating obligations, to fund its dividends and to fund its capital expenditures in the short term and long term. Pembina expects to source funds required for debt maturities from cash, its credit facilities, and by accessing the capital markets, as required. Based on its successful access to financing in the capital markets over the past several years, Pembina expects to continue to have access to additional funds as required. Refer to "Risk Factors – General Risk Factors – Additional Financing and Capital Resources" in this MD&A and Note 23 to the Consolidated Financial Statements for more information. Management continues to monitor Pembina's liquidity and remains satisfied that the leverage employed in Pembina's capital structure is sufficient and appropriate given the characteristics and operations of the underlying asset base.
Management may adjust Pembina's capital structure as a result of changes in economic conditions or the risk characteristics of the underlying assets. To maintain or modify Pembina's capital structure in the future, Pembina may renegotiate debt terms, repay existing debt, seek new borrowings, issue additional equity or hybrid securities and/or repurchase or redeem additional common or preferred shares.
As at December 31, 2025, Pembina's credit facilities (collectively, the "Credit Facilities") consisted of: an unsecured $2.5 billion (December 31, 2024: $1.5 billion) revolving credit facility, which includes a $750 million (December 31, 2024: $750 million) accordion feature, which provides Pembina with the ability to increase the credit facility subject to lender approval, and matures in June 2030 (the "Revolving Facility"); an unsecured U.S. $250 million (December 31, 2024: U.S. $250 million) non-revolving term loan, which matures in April 2030; an unsecured $600 million (December 31, 2024: nil) non-revolving term loan ("Two-Year Term Loan") established in the fourth quarter of 2025, which matures in October 2027; and an operating facility of $50 million (December 31, 2024: $50 million), which matures in June 2026 and is typically renewed on an annual basis. During the fourth quarter of 2025, Pembina fully repaid the Canadian and U.S. term loans originally assumed from Alliance (December 31, 2024: $270 million and U.S. $240 million, respectively), prior to their contractual maturity dates in December 2025. The increase in the Revolving Facility reflects the cancellation of the $1.0 billion (December 31, 2024: $1.0 billion) sustainability-linked revolving credit facility in September 2025, which previously matured in June 2027, and its addition to the Revolving Facility.
22 Pembina Pipeline Corporation 2025 Annual Report
There are no mandatory principal repayments due over the term of the Credit Facilities. Pembina is required to meet certain specific and customary affirmative and negative financial covenants under the indenture governing its medium-term notes and the agreements governing its Credit Facilities, including a requirement to maintain certain financial ratios. See "Liquidity & Capital Resources – Covenants" below for more information.
Pembina is also subject to customary restrictions on its operations and activities under the indenture governing its medium-term notes and the agreements governing its Credit Facilities, including restrictions on the granting of security, incurring indebtedness and the sale of its assets.
Financing Activity
On April 2, 2025, Pembina completed an extension on its unsecured U.S. $250 million non-revolving term loan, which now matures in April 2030.
On June 6, 2025, Pembina closed a $200 million offering of Fixed-to-Fixed Rate Subordinated Notes, Series 2 (the "Series 2 Subordinated Notes") due June 6, 2055. The Series 2 Subordinated Notes bear interest at a rate of 5.95 percent, which will reset on June 6, 2035, and on every fifth anniversary thereafter, based on the five-year Government of Canada yield plus 2.713 percent, provided that the interest rate during any subsequent fixed rate period will not be less than 5.95 percent. Pembina's Series 2 Subordinated Notes are subject to optional redemption by Pembina from March 6, 2035 to June 6, 2035, and thereafter, on any interest payment date or any interest reset date, as applicable. Pembina may also redeem the Series 2 Subordinated Notes in certain other limited circumstances. Pembina used the net proceeds of the offering of the Series 2 Subordinated Notes to fund the redemption of its outstanding Cumulative Redeemable Rate Reset Class A Preferred Shares, Series 19 ("Series 19 Class A Preferred Shares") on June 30, 2025.
On July 23, 2025, Pembina announced the approval of amendments (the "Amendments") to the indenture governing Pembina's 4.80 percent Fixed-to-Fixed Rate Subordinated Notes, Series 1 (the "Series 1 Subordinated Notes") due January 25, 2081. The Amendments provided for, among other things, the exchange (the "Note Exchange") of all of the outstanding Series 1 Subordinated Notes for an equal principal amount of 4.80 percent Fixed-to-Fixed Rate Subordinated Notes, Series 3 of Pembina (the "Series 3 Subordinated Notes") due January 25, 2081. The Series 3 Subordinated Notes have the same economic terms as the Series 1 Subordinated Notes, including interest rate, interest payment dates, interest reset dates, maturity date and redemption provisions, but do not provide for an entitlement to delivery of preferred shares upon the occurrence of certain bankruptcy and related events. The Note Exchange was completed on July 25, 2025, following the execution of the supplemental indenture implementing the Amendments. The Series 3 Subordinated Notes rank equally in right of payment with the Series 2 Subordinated Notes. Pursuant to the mandatory redemption provisions attached to the Class A Preferred Shares, Series 2021-A (the "Series 2021-A Class A Preferred Shares"), in connection with the Note Exchange, on July 28, 2025, Pembina redeemed all of the issued and outstanding Series 2021-A Class A Preferred Shares (refer to the "Share Capital - Preferred Shares" section of this MD&A for further information).
On September 9, 2025, Pembina completed an extension on its $2.5 billion Revolving Facility, which now matures on June 1, 2030.
On October 10, 2025, Pembina closed a $225 million offering of Series 2 Subordinated Notes pursuant to a re-opening. Following closing of the offering of the Series 2 Subordinated Notes, $425 million aggregate principal amount of Series 2 Subordinated Notes are issued and outstanding. Pembina used the net proceeds of the offering to fund the redemption of its outstanding Cumulative Redeemable Rate Reset Class A Preferred Shares, Series 9 (the "Series 9 Class A Preferred Shares") on December 1, 2025 and for general corporate purposes.
Pembina Pipeline Corporation 2025 Annual Report 23
On October 31, 2025, Pembina closed a $600 million Two-Year Term Loan with certain existing lenders. The proceeds of the Two-Year Term Loan have been used to repay the $270 million term loan outstanding at Alliance, and existing amounts drawn under Pembina's $2.5 billion revolving credit facility. The Two-Year Term Loan has an initial term of two years and is pre-payable at the option of Pembina. The other terms and conditions of the Two-Year Term Loan, including financial covenants, are substantially similar to Pembina's $2.5 billion revolving credit facility.
Covenants
Pembina is subject to certain financial covenants under the indentures governing its medium-term notes and the agreements governing the Credit Facilities. As at December 31, 2025, Pembina was in compliance with those covenants (December 31, 2024: in compliance).
| | | | | | | | | | | | |
| Debt | Financial Covenant(1) | Ratio | Ratio as at December 31, 2025 | |
| Senior unsecured medium-term notes | Funded Debt to Capitalization | Maximum 0.70(2) | 0.40 | | |
| Credit facilities | Debt to Capital | Maximum 0.70(3) | 0.40 | | |
| | | | |
(1) Terms as defined in relevant agreements.
(2) Covenant must be met at the reporting date and filed within 90 days after the end of each fiscal year and within 10 business days after filing of the Consolidated Financial Statements.
(3) Covenant must be met at the reporting date and filed within 120 days after the end of each fiscal year and 60 days after each quarter.
Credit Risk
Pembina continues to actively monitor and reassess the creditworthiness of its counterparties. The majority of Pembina's credit exposure is to investment grade counterparties. Pembina assesses all high exposure counterparties during the on-boarding process and actively monitors credit limits and exposure across the business. Pembina may reduce or mitigate its exposure to certain counterparties where it is deemed warranted and permitted under contractual terms. Where warranted, financial assurances may be sought from counterparties to mitigate and reduce risk, and such assurances may include guarantees, letters of credit and cash collateral. Letters of credit totaling $249 million (December 31, 2024: $276 million) were held by Pembina as at December 31, 2025, primarily in respect of customer trade receivables.
Credit Ratings
The following information with respect to Pembina's credit ratings is provided as such information relates to Pembina's financing costs and liquidity. Specifically, credit ratings affect Pembina's ability to obtain short-term and long-term financing and the cost of such financing. A reduction in the current ratings of Pembina's debt by its rating agencies, particularly a downgrade below investment-grade ratings, could adversely affect Pembina's cost of financing and its access to sources of liquidity and capital. In addition, changes in credit ratings and the associated costs may affect Pembina's ability to enter into normal course derivative or hedging transactions. Credit ratings are intended to provide investors with an independent measure of the credit quality of any issues of securities. The credit ratings assigned by the rating agencies are not recommendations to purchase, hold or sell the securities, nor do the credit rating agencies comment on the market price or suitability for a particular investor. Any credit rating may not remain in effect for a given period of time or may be revised or withdrawn entirely by a rating agency in the future if, in its judgment, circumstances so warrant.
DBRS Limited ("DBRS") rates Pembina's senior unsecured medium-term notes 'BBB (high)'. DBRS has also assigned a debt rating of 'BBB (low)' to Pembina's Fixed-To-Fixed Rate Subordinated Notes and a rating of 'Pfd-3 (high)' for each issued series of Pembina's Class A Preferred Shares.
The long-term corporate credit rating assigned by S&P Global Ratings ("S&P") on Pembina is 'BBB'. S&P has also assigned a debt rating of 'BBB' to Pembina's senior unsecured medium-term notes, a debt rating of 'BB+' to Pembina's Fixed-to-Fixed Rate Subordinated Notes, and a rating of 'P-3 (High)' to each issued series of Pembina's Class A Preferred Shares.
Refer to "Description of the Capital Structure of Pembina – Credit Ratings" in the AIF for the year ended December 31, 2025 for further information.
24 Pembina Pipeline Corporation 2025 Annual Report
Commitments and Off-Balance Sheet Arrangements
Commitments
Pembina had the following contractual obligations outstanding as at December 31, 2025:
| | | | | | | | | | | | | | | | | |
Contractual Obligations(1) | Payments Due By Period |
| ($ millions) | Total | Less than 1 year | 1 – 3 years | 3 – 5 years | After 5 years |
Long-term debt(2) | 19,571 | | 1,254 | | 2,790 | | 2,791 | | 12,736 | |
Transportation and processing(3) | 11,312 | | 74 | | 216 | | 1,185 | | 9,837 | |
Leases(4) | 815 | | 113 | | 203 | | 144 | | 355 | |
Construction commitments(5) | 392 | | 361 | | 29 | | 2 | | — | |
Other commitments related to lease contracts(6) | 591 | | 44 | | 105 | | 158 | | 284 | |
| | | | | |
| Funding commitments, software, and other | 65 | | 46 | | 18 | | 1 | | — | |
| | | | | |
Total contractual obligations | 32,746 | | 1,892 | | 3,361 | | 4,281 | | 23,212 | |
(1)Pembina enters into product purchase agreements and power purchase agreements to secure supply for future operations. Purchase prices of both NGL and power are dependent on current market prices. Volumes and prices for NGL and power contracts cannot be reasonably determined, and therefore, an amount has not been included in the contractual obligations schedule. Product purchase agreements range from one to 15 years and involve the purchase of NGL products from producers. Assuming product is available, Pembina has secured between 26 and 175 mbpd of NGL each year up to and including 2040. Power purchase agreements range from one to 24 years and involve the purchase of power from electrical service providers. Pembina has secured up to 74 megawatts per day each year up to and including 2049.
(2)Includes loans and borrowings, subordinated hybrid notes and interest payments on Pembina's senior unsecured medium-term notes and subordinated hybrid notes. Excludes deferred financing costs.
(3)In 2024, Pembina signed two agreements relating to the Cedar LNG Project: (a) Liquefaction Tolling Services Agreement ("LTSA"); and, (b) Gas Supply Agreement ("GSA"). The LTSA is a 20-year take-or-pay fixed toll contract for 1.5 million mpta, while the GSA will allow for transport on the Coastal GasLink Pipeline of approximately 200 million MMcf/d of Canadian natural gas to Cedar LNG. These agreements represent a total commitment of approximately $10.6 billion, which will commence on in-service date of the Cedar LNG Project in late 2028. In 2025, Pembina contracted the rights to this respective liquefaction and transportation capacity to two third-party customers.
(4)Includes pipelines, facilities, terminals, rail, office space, land and vehicle leases.
(5)Excludes projects that are executed by equity accounted investees.
(6)Relates to expected variable lease payments excluded from the measurement of the lease liability, payments under lease contracts which have not yet commenced, and payments related to non-lease components in lessee lease contracts.
Contingencies
Pembina, including its subsidiaries and its investments in equity accounted investees, are subject to various legal and regulatory and tax proceedings, actions and audits arising in the normal course of business. Pembina represents its interests vigorously in all proceedings in which it is involved. Legal and administrative proceedings involving possible losses are inherently complex, and the Company applies significant judgment in estimating probable outcomes. As at December 31, 2025, there were no significant claims filed against Pembina for which management believes the resolution of any such actions or proceedings would have a material impact on Pembina's financial position or results of operations.
Off-Balance Sheet Arrangements
As at December 31, 2025, Pembina did not have any off-balance sheet arrangements that have, or are reasonably likely to have, a current or future effect on Pembina's financial condition, results of operations, liquidity or capital expenditures.
Letters of Credit
Pembina has provided letters of credit to various third parties in the normal course of conducting business. The letters of credit include financial guarantees to counterparties for product purchases and sales, transportation services, utilities, engineering and construction services. The letters of credit have not had, and are not expected to have, a material impact on Pembina's financial position, earnings, liquidity or capital resources. As at December 31, 2025, Pembina had $124 million (December 31, 2024: $209 million) in letters of credit issued.
Pembina Pipeline Corporation 2025 Annual Report 25
5. SHARE CAPITAL
Common Shares
On May 14, 2025, the Toronto Stock Exchange ("TSX") accepted the renewal of Pembina's normal course issuer bid (the "NCIB") that allows the Company to repurchase, at its discretion, up to five percent of the Company's outstanding common shares (representing approximately 29 million common shares) through the facilities of the TSX, the New York Stock Exchange and/or alternative Canadian trading systems or as otherwise permitted by applicable securities law, subject to certain restrictions on the number of common shares that may be purchased on a single day. The NCIB commenced on May 16, 2025 and will expire on the earlier of May 15, 2026, the date on which Pembina has acquired the maximum number of common shares allowable under the NCIB or the date on which Pembina otherwise decides not to make any further repurchases under the NCIB. No common shares were purchased by Pembina during the years ended December 31, 2025 and 2024.
Common Share Dividends
Common share dividends are payable if, as and when declared by Pembina's Board of Directors. The amount and frequency of dividends declared and payable is at the discretion of Pembina's Board of Directors, which considers earnings, cash flow, capital requirements, the financial condition of Pembina and other relevant factors when making its dividend determination.
Preferred Shares
On January 8, 2025, Pembina redeemed all of the approximately one million issued and outstanding Cumulative Redeemable Floating Rate Class A Preferred Shares, Series 22 ("Series 22 Class A Preferred Shares") at a redemption price of $25.50 per Series 22 Class A Preferred Share, plus all accrued and unpaid dividends thereon. Pembina had announced its intention to redeem the Series 22 Class A Preferred Shares during the fourth quarter of 2024 and, as a result, the equity was reclassified as a financial liability of approximately $26 million for the total redemption price in that same quarter.
On June 30, 2025, Pembina redeemed all of the eight million issued and outstanding Series 19 Class A Preferred Shares at a redemption price of $25.00 per Series 19 Class A Preferred Share. The total redemption price for the Series 19 Class A Preferred Shares was $200 million.
On July 28, 2025, in connection with the Note Exchange, Pembina redeemed all of the 600,000 issued and outstanding Series 2021-A Class A Preferred Shares, which were deliverable to holders of the Series 1 Subordinated Notes following the occurrence of certain bankruptcy and related events. The Series 2021-A Class A Preferred Shares were issued by Pembina to Computershare Trust Company of Canada to be held in trust to satisfy its obligations under the indenture governing the Series 1 Subordinated Notes.
On December 1, 2025, in connection with the October 10, 2025 offering of Series 2 Subordinated Notes, Pembina redeemed all of its outstanding Series 9 Class A Preferred Shares at a price equal to $25.00 per Series 9 Class A Preferred Share, for a total redemption price of $225 million.
Preferred Share Dividends
The holders of Pembina's Class A Preferred Shares are entitled to receive fixed or floating cumulative dividends, as applicable. Dividends on the Series 1, 3, 5, 7, and 21 Class A Preferred Shares are payable quarterly on the first day of March, June, September and December, if, as and when declared by the Board of Directors of Pembina. Dividends on the Series 15 and 17 Class A Preferred Shares are payable on the last day of March, June, September and December in each year, if, as and when declared by the Board of Directors of Pembina. Dividends on the Series 25 Class A Preferred Shares are payable on the 15th day of February, May, August and November in each year, if, as and when declared by the Board of Directors of Pembina.
26 Pembina Pipeline Corporation 2025 Annual Report
Outstanding Share Data
| | | | | |
| |
Issued and outstanding (thousands) | February 20, 2026 |
| Common shares | 581,231 | |
| |
Stock options(1) | 2,037 | |
| |
| Series 1 Class A Preferred Shares | 10,000 | |
| Series 3 Class A Preferred Shares | 6,000 | |
| Series 5 Class A Preferred Shares | 10,000 | |
| Series 7 Class A Preferred Shares | 10,000 | |
| |
| Series 15 Class A Preferred Shares | 8,000 | |
| Series 17 Class A Preferred Shares | 6,000 | |
| |
| Series 21 Class A Preferred Shares | 14,972 | |
| |
| Series 25 Class A Preferred Shares | 10,000 | |
| |
(1) Balance includes 1.76 million exercisable stock options.
6. CAPITAL EXPENDITURES
| | | | | | | | | | | | | | |
| 3 Months Ended December 31 | 12 Months Ended December 31 |
| ($ millions) | 2025 | 2024 | 2025 | 2024 |
| Pipelines | 146 | | 97 | | 362 | | 539 | |
| Facilities | 82 | | 127 | | 376 | | 345 | |
| Marketing & New Ventures | 6 | | 9 | | 20 | | 30 | |
| Corporate and other projects | 1 | | 9 | | 26 | | 41 | |
Total capital expenditures(1) | 235 | | 242 | | 784 | | 955 | |
(1) Includes $55 million for the three months ended December 31, 2025 (2024: $79 million) and $141 million for the twelve months ended December 31, 2025 (2024: $179 million) related to non-recoverable sustainment activities.
In both 2025 and 2024, Pipelines capital expenditures largely related to expansions to support volume growth in NEBC and investments in smaller growth projects. Additionally, 2024 capital expenditures were associated with Pembina's Phase VIII Peace Pipeline expansion, which was placed into service in May 2024. Facilities capital expenditures in both 2025 and 2024 primarily related to Redwater expansion projects. Marketing & New Ventures and Corporate capital expenditures during these periods related mainly to information technology infrastructure and systems development.
In both the fourth quarter and full year of 2025, the non-recoverable sustaining capital expenditure was primarily attributed to supporting safe and reliable operations.
Future capital expenditures for 2026 are estimated to be approximately $940 million and are primarily related to the construction of RFS IV, the Prince Rupert Terminal Optimization, the Fox Creek-to-Namao Peace Pipeline Expansion, spending to advance potential future projects, including preliminary construction activities to support optimized execution of the Birch-to-Taylor and Taylor-to-Gordondale expansions, and investments in smaller growth projects, including various laterals and terminals. Of the total future capital expenditure, approximately $210 million is designated for non-recoverable sustaining capital, which will continue to support safe and reliable operations.
For contributions to equity accounted investees, refer to the "Segment Results – Equity Accounted Investees Overview by Division" section of this MD&A.
Pembina Pipeline Corporation 2025 Annual Report 27
7. SELECTED QUARTERLY INFORMATION
Selected Quarterly Operating Information
| | | | | | | | | | | | | | | | | | | | | | | | | | | | | |
| (mboe/d) | 2025 | 2024 | |
| Q4 | Q3 | Q2 | Q1 | Q4 | Q3 | Q2 | Q1 | | | |
Volumes(1)(2) | | | | | | | | | | | |
Pipelines – transportation volumes | | | | | | | | | | | |
Conventional Pipelines | 1,059 | | 1,001 | | 1,006 | | 1,033 | | 1,034 | | 992 | | 969 | | 1,007 | | | | |
| Transmission Pipelines | 705 | | 699 | | 722 | | 740 | | 720 | | 713 | | 726 | | 588 | | | | |
| Oil Sands and Heavy Oil Pipelines | 1,051 | | 1,050 | | 1,040 | | 1,035 | | 1,036 | | 1,033 | | 1,021 | | 1,003 | | | | |
Facilities – processing and fractionation volumes | | | | | | | | | | | |
Gas Services | 631 | | 598 | | 590 | | 619 | | 597 | | 584 | | 599 | | 612 | | | | |
| NGL Services | 267 | | 262 | | 236 | | 277 | | 280 | | 226 | | 256 | | 193 | | | | |
| | | | | | | | | | | |
| Total revenue volumes | 3,713 | | 3,610 | | 3,594 | | 3,704 | | 3,667 | | 3,548 | | 3,571 | | 3,403 | | | | |
Marketing & New Ventures – sales volumes | | | | | | | | | | | |
| Marketed crude oil | 77 | | 111 | | 95 | | 88 | | 96 | | 117 | | 100 | | 80 | | | | |
| Marketed NGL | 260 | | 237 | | 207 | | 281 | | 252 | | 227 | | 219 | | 215 | | | | |
(1) Volumes in mboe/d. See the "Abbreviations" section of this MD&A for definition. Volumes for Pipelines and Facilities divisions are revenue volumes, which are physical volumes plus volumes recognized from take-or-pay commitments. Volumes for Marketing & New Ventures are marketed crude oil and NGL volumes.
(2) Includes Pembina's proportionate share of volumes from equity accounted investees.
Take-or-pay Contract Liabilities
| | | | | | | | | | | | | | | | | | | | | | | | | | | | | | | |
| ($ millions) | 2025 | 2024 | | | |
| Q4 | Q3 | Q2 | Q1 | Q4 | Q3 | Q2 | Q1 | | | | | |
Opening balance | 6 | | 9 | | 7 | | 1 | | 11 | | 12 | | 7 | | 1 | | | | | | |
Revenue deferred | 50 | | 51 | | 57 | | 58 | | 58 | | 67 | | 55 | | 52 | | | | | | |
| Revenue recognized | (55) | | (54) | | (55) | | (52) | | (68) | | (68) | | (50) | | (46) | | | | | | |
| | | | | | | | | | | | | |
| | | | | | | | | | | | | |
Ending take-or-pay contract liability balance | 1 | | 6 | | 9 | | 7 | | 1 | | 11 | | 12 | | 7 | | | | | | |
| | | | | | | | | | | | | |
Selected Quarterly Market Pricing
| | | | | | | | | | | | | | | | | | | | | | | | | | | | | | |
| 2025 | 2024 | |
| ($ average) | Q4 | Q3 | Q2 | Q1 | Q4 | Q3 | Q2 | Q1 | | | | |
WTI (USD/bbl) | 59.14 | | 64.93 | | 63.74 | | 71.42 | | 70.27 | | 75.10 | | 80.57 | | 76.96 | | | | | |
FX (USD/CAD) | 1.39 | | 1.38 | | 1.38 | | 1.43 | | 1.40 | | 1.36 | | 1.37 | | 1.35 | | | | | |
AECO Natural Gas (CAD/GJ) | 2.22 | | 0.94 | | 1.96 | | 1.92 | | 1.38 | | 0.77 | | 1.36 | | 1.94 | | | | | |
Station 2 Natural Gas (CAD/GJ) | 1.75 | | 0.45 | | 0.43 | | 1.22 | | 0.85 | | 0.47 | | 0.72 | | 2.45 | | | | | |
| Chicago Citygate Natural Gas (USD/mmbtu) | 3.43 | | 2.71 | | 2.99 | | 3.91 | | 2.71 | | 1.76 | | 1.60 | | 2.49 | | | | | |
Mt Belvieu Propane (USD/gal) | 0.66 | | 0.70 | | 0.79 | | 0.90 | | 0.77 | | 0.73 | | 0.75 | | 0.84 | | | | | |
| Alberta Power Pool (CAD/MWh) | 43.18 | | 51.53 | | 40.48 | | 40.30 | | 51.72 | | 55.23 | | 45.28 | | 98.89 | | | | | |
Pembina 20-day volume-weighted average share price at quarter end | 52.68 | | 54.11 | | 51.30 | | 55.90 | | 54.05 | | 55.19 | | 50.22 | | 47.54 | | | | | |
| | | | | | | | | | | | |
28 Pembina Pipeline Corporation 2025 Annual Report
Quarterly Financial Information
| | | | | | | | | | | | | | | | | | | | | | | | | | | | | | |
($ millions, except where noted) | 2025 | 2024 | |
| Q4 | Q3 | Q2 | Q1 | Q4 | Q3 | Q2 | Q1 | | | | |
| Revenue | 1,913 | | 1,791 | | 1,792 | | 2,282 | | 2,145 | | 1,844 | | 1,855 | | 1,540 | | | | | |
Net revenue(1) | 1,139 | | 1,211 | | 1,184 | | 1,343 | | 1,383 | | 1,259 | | 1,222 | | 912 | | | | | |
| Operating expenses | 241 | | 259 | | 235 | | 226 | | 270 | | 277 | | 240 | | 189 | | | | | |
| Share of profit (loss) from equity accounted investees | 171 | | (66) | | 74 | | 30 | | 133 | | (17) | | 61 | | 151 | | | | | |
| Gross profit | 827 | | 658 | | 780 | | 928 | | 1,024 | | 747 | | 815 | | 730 | | | | | |
Adjusted EBITDA(1) | 1,075 | | 1,034 | | 1,013 | | 1,167 | | 1,254 | | 1,019 | | 1,091 | | 1,044 | | | | | |
| Earnings | 489 | | 286 | | 417 | | 502 | | 572 | | 385 | | 479 | | 438 | | | | | |
Earnings per common share – basic (dollars) | 0.78 | | 0.43 | | 0.65 | | 0.80 | | 0.92 | | 0.60 | | 0.75 | | 0.74 | | | | | |
Earnings per common share – diluted (dollars) | 0.78 | | 0.43 | | 0.65 | | 0.80 | | 0.92 | | 0.60 | | 0.75 | | 0.73 | | | | | |
| Cash flow from operating activities | 861 | | 810 | | 790 | | 840 | | 902 | | 922 | | 954 | | 436 | | | | | |
Cash flow from operating activities per common share – basic (dollars) | 1.48 | | 1.39 | | 1.36 | | 1.45 | | 1.55 | | 1.59 | | 1.64 | | 0.79 | | | | | |
Adjusted cash flow from operating activities(1) | 731 | | 648 | | 698 | | 777 | | 922 | | 724 | | 837 | | 782 | | | | | |
Adjusted cash flow from operating activities per common share – basic (dollars)(1) | 1.26 | | 1.12 | | 1.20 | | 1.34 | | 1.59 | | 1.25 | | 1.44 | | 1.42 | | | | | |
Common shares outstanding (millions): | | | | | | | | | | | | |
| Weighted average – basic | 581 | | 581 | | 581 | | 581 | | 581 | | 580 | | 580 | | 549 | | | | | |
| Weighted average – diluted | 582 | | 582 | | 582 | | 582 | | 582 | | 581 | | 581 | | 550 | | | | | |
| End of period | 581 | | 581 | | 581 | | 581 | | 581 | | 580 | | 580 | | 549 | | | | | |
| Common share dividends declared | 412 | | 413 | | 412 | | 401 | | 401 | | 401 | | 400 | | 367 | | | | | |
Dividends per common share | 0.71 | | 0.71 | | 0.71 | | 0.69 | | 0.69 | | 0.69 | | 0.69 | | 0.67 | | | | | |
| Preferred share dividends declared | 32 | | 32 | | 35 | | 35 | | 34 | | 34 | | 33 | | 31 | | | | | |
| Capital expenditures | 235 | | 178 | | 197 | | 174 | | 242 | | 262 | | 265 | | 186 | | | | | |
| Contributions to equity accounted investees | 127 | | 108 | | 126 | | 50 | | — | | 124 | | 144 | | 103 | | | | | |
| Distributions from equity accounted investees | 148 | | 128 | | 136 | | 132 | | 131 | | 133 | | 123 | | 239 | | | | | |
| | | | | | | | | | | | |
| | | | | | | | | | | | |
| | | | | | | | | | | | |
| | | | | | | | | | | | |
(1) Refer to the "Non-GAAP & Other Financial Measures" section of this MD&A.
During the periods highlighted in the table above, there were new growth projects across Pembina's business being placed into service. The Company's financial and operating results have also been impacted by the volatility of commodity market prices, fluctuations in foreign exchange rates, and inflation. In addition to these factors, several other notable elements have impacted Pembina's financial and operating results during the specified periods above, including:
•a gain on the sale of land in the fourth quarter of 2025 involving both land held directly by Pembina and within the Greenlight joint venture, which resulted in a gain being recognized across two segments, within the Corporate Division ($96 million pre-tax gain) and included in share of profit from Greenlight in the Marketing & New Ventures Division ($62 million gain, net to Pembina, pre-tax);
•an impairment of $146 million (net to Pembina, after tax), recognized in the third quarter of 2025 within Pembina's equity accounted investee, related to certain PGI assets;
•contributions made by Pembina to PGI of $243 million in the full year of 2025, to partially fund growth capital projects;
•contributions made by Pembina to Cedar LNG of $241 million in 2024, to fund the Cedar LNG Project; and
•the completion of the Alliance and Aux Sable acquisition in the second quarter of 2024.
Pembina Pipeline Corporation 2025 Annual Report 29
8. SELECTED EQUITY ACCOUNTED INVESTEE INFORMATION
Loans and Borrowings of Equity Accounted Investees
Under equity accounting, the assets and liabilities of an investee are reported as a single line item in the Consolidated Statement of Financial Position, "Investments in Equity Accounted Investees". To assist readers' understanding and to evaluate the capitalization of Pembina's investments, loans and borrowings associated with investments in equity accounted investees are presented below based on Pembina's proportionate ownership in such investees, as at December 31, 2025. The loans and borrowings are presented and classified by the division in which the results for the investee are reported. Please refer to the "Abbreviations" section for a summary of Pembina's investments in equity accounted investees and the division in which their results are reported.
| | | | | | | | |
| | |
As at December 31 ($ millions)(1) | 2025 | 2024 |
| Pipelines | 16 | | 19 | |
| Facilities | 3,230 | | 2,941 | |
Marketing & New Ventures(2) | 616 | | 373 | |
| Total | 3,862 | | 3,333 | |
(1) Balances reflect Pembina's ownership percentage of the outstanding balance face value.
(2) Relates to the U.S. $2.7 billion senior unsecured construction/term loan facility entered into by Cedar LNG.
Cash and Cash Equivalents of Equity Accounted Investees
As at December 31, 2025, Pembina's ownership percentage of the cash balance associated with Pembina's investments in equity accounted investees totaled $100 million (December 31, 2024: $43 million) of which $67 million (December 31, 2024: nil) related to Greenlight, $20 million (December 31, 2024: $39 million) related to Cedar LNG, and $11 million (December 31, 2024: nil) related to PGI.
Financing Activities for Equity Accounted Investees
PGI
On March 21, 2025, pursuant to an amended and restated credit agreement, PGI exercised the accordion feature under its existing revolving credit facility and opened a new $500 million revolving credit facility, maturing on March 21, 2027. Concurrently, PGI reestablished a $500 million accordion under the credit facility.
Commitments to Equity Accounted Investees
Pembina has commitments to provide contributions to certain equity accounted investees based on its ownership interest. These contributions are determined and approved by the joint venture partners to fund operating budgets, growth capital, and significant projects development costs, including the Cedar LNG Project and Greenlight.
Credit Risk for Equity Accounted Investees
As at December 31, 2025, Pembina's various equity accounted investees held letters of credit totaling $157 million (December 31, 2024: $164 million) primarily in respect of obligations for engineering, procurement and construction.
30 Pembina Pipeline Corporation 2025 Annual Report
9. RELATED PARTY TRANSACTIONS
Pembina enters into transactions with related parties in the normal course of business and all transactions are measured at their exchange amount, unless otherwise noted. Pembina provides management and operational oversight services, on a fixed fee and cost recovery basis, to certain equity accounted investees. Pembina also contracts for services and capacity from certain of its equity accounted investees, advances funds to support operations and provides letters of credit, including financial guarantees.
A summary of the significant related party transactions and balances are as follows:
| | | | | | | | | | |
| | |
| | | | |
For the years ended December 31 ($ millions) | | | 2025 | 2024 |
| PGI | | | 242 | | 242 | |
| Cedar LNG | | | 19 | | 26 | |
Aux Sable(1) | | | — | | 32 | |
Alliance(1) | | | — | | 4 | |
Other(2) | | | — | | 2 | |
Total services provided(3) | | | 261 | | 306 | |
| PGI | | | 8 | | 8 | |
| | | | |
Alliance(1) | | | — | | 3 | |
| | | | |
| | | | |
| | | | |
| | | | |
| Total services received | | | 8 | | 11 | |
| | | | |
| | | | |
As at December 31 ($ millions) | | | 2025 | 2024 |
| | | | |
| PGI | | | 39 | | 34 | |
| Cedar LNG | | | 4 | | 2 | |
Greenlight(4) | | | 27 | | — | |
Other(2) | | | — | | 1 | |
| Trade receivables and other | | | 70 | | 37 | |
| | | | |
Right-of-use assets(5) | | | 32 | | — | |
Lease liabilities(5) | | | 32 | | — | |
(1) As of April 1, 2024, following the completion of Pembina's acquisition of a controlling interest in Alliance and Aux Sable, these entities became consolidated subsidiaries of Pembina and, as such, are no longer related parties.
(2) Other includes transactions with Grand Valley and ACG.
(3) Services provided by Pembina include payments made by Pembina on behalf of related parties.
(4) On November 5, 2025, Pembina issued a $27 million promissory note to Greenlight, with a 10.0 percent annual interest rate payable semi-annually, with an optional prepayment, and a maturity date of the earlier of five days after Greenlight's positive final investment decision or September 30, 2026.
(5) As at December 31, 2025, Pembina had a lease arrangement with PGI for the use of a natural gas storage asset. Under the terms of the agreement, Pembina recognized a right-of-use asset and a corresponding lease liability. The lease commenced on September 1, 2025 and has a term of 15 years. Lease payments are made on a monthly basis and are structured as a combination of a fixed fee and flow-through charges.
Pembina Pipeline Corporation 2025 Annual Report 31
10. ACCOUNTING POLICIES & ESTIMATES
Changes in Accounting Policies
The accounting policies used in preparing the Consolidated Financial Statements are described in Note 3 of Pembina's Consolidated Financial Statements. There were no new accounting standards or amendments to existing standards adopted in the year ended December 31, 2025 that have a material impact on Pembina's financial statements.
New Standards and Interpretations Not Yet Adopted
IFRS 18 Presentation and Disclosure in Financial Statements ("IFRS 18")
IFRS 18 was issued in April 2024 and effective January 1, 2027, with early application permitted. The standard introduces key changes to the structure of the statement of earnings and comprehensive income, required disclosures for certain management-defined performance measures, and aggregation and disaggregation of line items in the financial statements. Pembina is currently reviewing the impact of this standard on its Consolidated Financial Statements.
Critical Accounting Judgments and Estimates
The preparation of the Consolidated Financial Statements in conformity with IFRS requires management to make judgments, estimates, and assumptions that are based on facts and circumstances as at the date of the Consolidated Financial Statements, which could affect the reported amounts of assets, liabilities, income and expenses. Actual results may differ from these estimates.
Judgments, estimates, and underlying assumptions are reviewed on an ongoing basis. Revisions to accounting estimates are recognized in the period in which the estimates are revised and in any future periods affected. Information about estimates and judgments made in applying accounting policies that have the most significant effects on the amounts recognized in the to the Consolidated Financial Statements are described below.
Judgments
Assessment of Joint Control for Joint Arrangements
Joint arrangements represent arrangements where Pembina has joint control established by a contractual agreement. Joint arrangements give rise to either joint operations or joint ventures. The determination of joint control requires significant judgment about each party's substantive rights, exposure to variability of returns, and the power necessary for the party to affect its respective returns. Joint control exists when decisions about the relevant activities require the unanimous consent of the parties that control the arrangement collectively. Ownership percentage alone may not be a determinant of joint control.
Determination of Cash Generating Units in Assessment of Non-Financial Asset Impairments
For the purpose of impairment testing, assets that cannot be tested individually are grouped together into cash generating units ("CGUs"). CGUs are the smallest group of assets that generate cash inflows from the continued use of the related assets, and are largely independent from other assets. CGUs may incorporate integrated assets from multiple operating segments, which reflects the lowest level at which goodwill is monitored for management purposes. Goodwill acquired in a business combination is allocated to CGUs or groups of CGUs that are expected to benefit from the synergies of the combination. In determining CGUs, significant management judgment is required to assess what constitutes independent cash flows. When an impairment test is performed, the carrying value of a CGU or group of CGUs is compared to its recoverable amount. As such, the asset composition of a CGU or group of CGUs directly impacts both the carrying value and recoverability of the assets included therein.
32 Pembina Pipeline Corporation 2025 Annual Report
Performance Obligations in Revenue Arrangements
Pembina recognizes revenue equal to the consideration that it is entitled to for satisfying a performance obligation to a customer.
Performance obligations in Pembina's contracts with customers include:
•promises to perform or provide the right to transportation, liquefaction, fractionation, terminalling, storage services, and construction over a specified contractual term and/or for a specified volume of commodities; and
•promises to transfer control of commodities to the customer at a specified time periods and locations.
Certain contracts may arise that require Pembina to apply significant judgment when identifying the contract's performance obligations where (i) Pembina is providing both services and commodities; (ii) Pembina is providing services and purchasing commodities from the same counterparty; or (iii) Pembina is both purchasing and selling commodities from the same counterparty.
In contracts where Pembina performs service-type activities to enhance the value of a product and is either purchasing or selling the product, identification of the performance obligations in the contract will depend on whether Pembina or the customer has control of the product when Pembina performs the service activity. If Pembina controls a product while performing the service activity that enhances the product, the service activity is for Pembina’s benefit and is not considered a performance obligation. As a result, any fees that Pembina receives from a supplier for performing a service for Pembina’s benefit are treated as a reduction in the purchase price of the product rather than as revenue, or in the case of a product sales contract, any fees related to performing the service are allocated to the product sales revenue rather than separately recognizing service revenues.
Other situations may have Pembina purchasing and subsequently selling a product without ever obtaining control of that product or selling and then subsequently repurchasing a product without ever losing control of the product. In these cases, Management will determine whether the substance of the arrangement is to provide a service to a customer where the net proceeds will be recognized as service revenue, or to receive a service where the net proceeds will be recognized as a cost outside of revenue.
Assessment of Whether Recontracting Services Constitutes Net Settlement of the Original Supplier Agreement
When Pembina recontracts services received from a supplier to a separate customer, judgment is required to assess whether the arrangement constitutes a net settlement of the original supplier agreement. This evaluation involves analyzing the rights and obligations of all parties, the Company's continued exposure to risks under the supplier contract, and whether the Company provides incremental goods or services to the customer. The conclusion of the assessment determines whether the agreements are accounted for as financial instruments or under other standards, which can result in significantly different accounting outcomes.
Estimates
Recoverability of Non-Financial Assets
Non-financial assets, other than inventory, assets arising from employee benefits, and deferred tax assets, are assessed at each reporting date to determine whether there is any indication of impairment. If any such indication exists, the asset's recoverable amount is estimated.
Goodwill is assessed at each reporting date to determine whether there is any indication of impairment. In addition, goodwill is tested for impairment annually, or more frequently, if an impairment indicator exists.
Pembina Pipeline Corporation 2025 Annual Report 33
An impairment loss is recognized if the carrying amount of an asset, CGU or group of CGUs exceeds its estimated recoverable amount. The estimated recoverable amount is determined as the higher of value in use and fair value less costs of disposal, by using either the income (cash flow) approach or comparable market transactions, if available. When using the income approach, management is required to make significant estimates and assumptions concerning future cash flows, which are impacted by energy transition considerations, access to global markets, and business contracting assumptions. In addition, when determining the appropriate discount rate, management is required to make assumptions concerning the current industry and economic environment, as well as asset and cash-flow specific risk premiums.
These estimates and assumptions are susceptible to change and may differ from actual future developments. This estimation uncertainty could impact quantified recoverable amounts; and therefore, any related impairment charges, which may be material.
Impairment losses are recognized in earnings. Impairment losses recognized in respect of a CGU (group of CGUs) are allocated first to reduce the carrying amount of any goodwill allocated to the CGU (group of CGUs), and then to reduce the carrying amounts of the other assets in the CGU (group of CGUs) on a pro rata basis.
For non-financial assets, excluding goodwill, impairment losses recognized in prior periods are assessed at each reporting date for any indications that the loss has decreased or no longer exists. An impairment loss is reversed if there has been a change in the estimates used to determine the recoverable amount. An impairment loss is reversed only to the extent that the asset's carrying amount does not exceed the carrying amount that would have been determined, net of depreciation or amortization, if no impairment loss had been recognized. An impairment reversal is recognized in earnings under impairment (reversal) expense. An impairment loss in respect of goodwill is not reversed.
Goodwill that forms part of the carrying amount of an investment in an equity accounted investee is not recognized separately; and therefore, is not tested for impairment separately. Rather, the investment, including its respective goodwill, is tested for impairment as a single asset when there is objective evidence it may be impaired as a result of one or more events having occurred that could negatively impact the estimated future cash flows from the investment. If the investment does not generate cash flows that are largely independent of those from other Pembina assets, its carrying value is added to a CGU to which the investment relates.
Fair Value of Level 3 Derivative Instruments
Refer to the "Other - Risk Management - Financial Instruments" section of this MD&A for estimates used in the valuation of Level 3 derivative instruments.
34 Pembina Pipeline Corporation 2025 Annual Report
11. RISK FACTORS
Pembina's value proposition is based on balancing economic benefit against risk. Where appropriate, Pembina will seek to reduce risk. Pembina continually works to mitigate the impact of potential risks to its business by identifying all significant risks so that they can be appropriately managed. To assist with identifying and managing risk, Pembina has implemented a comprehensive risk management program. The risks that may affect the business and operations of Pembina and its operating subsidiaries are described below. Further, additional discussion about counterparty risk, market risk, liquidity risk and additional information on financial risk management can be found in Note 23 of the Consolidated Financial Statements.
Risks Inherent in Pembina's Business
Commodity Price and Volume Risk
Pembina's business is exposed to commodity price volatility and a substantial decline in the prices of these commodities could adversely affect its financial results.
Certain of the transportation contracts or tolling arrangements with respect to Pembina's pipeline assets do not include take-or-pay commitments from crude oil and natural gas producers and, as a result, Pembina is exposed to volume risk with respect to those assets. A decrease in volumes transported can directly and adversely affect Pembina's revenues and earnings. The demand for, and utilization of, Pembina's pipeline assets may be impacted by factors such as changing market fundamentals, capacity bottlenecks, operational incidents, regulatory restrictions, system maintenance, weather and increased competition. Market fundamentals, such as commodity prices and price differentials, natural gas and gasoline consumption, alternative energy sources and global supply disruptions outside of Pembina's control can impact both the supply of and demand for the commodities transported on Pembina's pipelines, which can, in turn, impact the demand for, and utilization of, Pembina's pipeline assets. See "Reserve Replacement, Throughput and Product Demand" below.
Pembina's Marketing business includes activities related to product storage, terminalling, and hub services. These activities expose Pembina to certain risks relating to fluctuations in commodity prices and, as a result, Pembina may experience volatility in revenue and impairments related to the book value of stored product. Primarily, Pembina enters into contracts to purchase and sell crude oil, condensate, NGL and natural gas at floating market prices and, as a result, the prices of products that are marketed by Pembina are subject to volatility as a result of factors such as seasonal demand changes, the actions of OPEC, extreme weather conditions (the severity of which could increase due to climate change), geopolitical events such as armed conflict and political instability, and developments relating thereto, market inventory levels, general economic conditions, the availability and price of transportation logistics, changes in commodity markets, the availability and pricing of alternate fuel sources and other factors. Pembina manages its risk exposure by balancing purchases and sales to secure less volatile margins; however, Pembina may be unsuccessful in securing such margins and may, at times, have unbalanced purchases and sales. Further, in certain situations, a producer or supplier could fail to deliver contracted volumes or could deliver in excess of contracted volumes, or a purchaser could purchase less than contracted volumes. Any of these circumstances could cause Pembina's purchases and sales to be unbalanced, which may increase Pembina's exposure to commodity price risks and could increase volatility in its revenue and cash flows. Notwithstanding Pembina's management of price and quality risk, marketing margins for commodities can vary and have varied significantly from period to period in the past. This variability could have an adverse effect on the results of Pembina's Marketing business and its overall results of operations. To assist in reducing this inherent variability in its Marketing business, Pembina has invested, and will continue to invest, in assets that have a fee-based revenue component.
Pembina Pipeline Corporation 2025 Annual Report 35
Pembina is also exposed to potential price declines and decreasing frac spreads between the time Pembina purchases NGL feedstock and sells NGL products. Frac spread is the difference between the revenue from the sale of NGL if removed from a gas stream and the value such NGL would have had if left in the gas stream and sold at natural gas prices. Frac spreads can change significantly from period to period depending on the relationship between NGL and natural gas prices (the "frac spread ratio"), absolute commodity prices, transport differentials and changes in the Canadian to U.S. dollar exchange rate. In addition, there is also a differential between NGL product prices and crude oil prices which can change margins realized for midstream products. The amount of profit or loss made on the extraction portion of the business will generally increase or decrease with frac spreads. This exposure could result in variability of cash flow generated by the Marketing business.
Regulation and Legislation
In addition to environmental and social considerations, regulatory authorities consider economic aspects of pipelines. There is legislation aimed at ensuring that producers have fair and reasonable opportunities to produce, process and market their reserves. For example, in certain instances, regulatory authorities may declare the operator of a pipeline to be a common carrier of crude oil, NGL or natural gas. In doing so, regulators establish conditions under which a pipeline must accept and carry product, including the tariffs that may be charged, and requires that operators cannot unduly discriminate between their customers. Additionally, producers and shippers may apply to the appropriate regulatory authorities for a review of tariffs in certain instances, and such tariffs may then be regulated if it is found that the tariffs are not just and reasonable. The potential for enhanced regulatory oversight of tariffs for pipelines, including the Alliance Pipeline (the tolls and tariffs of which are subject to enhanced CER oversight as a Group 1 company) and certain pipelines owned by Pembina's subsidiaries in British Columbia (the tolls and tariffs of which are subject to BCUC oversight), could result in tariff levels that are less favourable to Pembina and could impact the economic operation of such pipeline systems.
The AER is the primary regulatory body that oversees Pembina's Alberta-issued development permits, with some minor exceptions. Certain of Pembina's subsidiaries own pipelines in British Columbia, which are regulated by the BCER and the BCUC, and pipelines that cross provincial or international boundaries, which are regulated by the CER and/or the FERC and PHMSA. Certain of Pembina's operations and expansion projects are subject to additional regulations and, as Pembina's operations expand throughout Canada and North America, Pembina may be required to comply with the requirements of additional regulators and legislative bodies, including the Impact Assessment Agency of Canada (the "IAAC"), the BCEAO, the Ontario Energy Board, the Ontario Ministry of Natural Resources, the Ontario Ministry of the Environment, Conservation and Parks, the Saskatchewan Ministry of Energy and Resources and Regulatory Services (Oil and Gas) under Manitoba Department of Business, Mining, Trade and Job Creation.
In the U.S., FERC regulates interstate natural gas pipelines and the transportation of crude oil, NGL and refined products in interstate commerce. Under the NGA, FERC regulates the construction, extension, and abandonment of interstate natural gas pipelines and the rates, terms and conditions of service and other aspects of the business of interstate natural gas pipelines. Interstate natural gas pipelines' rates, terms and conditions of service are filed at FERC and publicly available. Under the ICA, FERC regulates the rates, terms and conditions of the transportation in interstate commerce of crude oil, NGL and refined products. Pipeline safety is regulated by the PHMSA, which sets standards for the design, construction, pressure testing, operation and maintenance, corrosion control, training and qualification of personnel, accident reporting and record keeping. The Office of Pipeline Safety, within the PHMSA, inspects and enforces the pipeline safety regulations across the U.S. All regulations and environmental, safety and economic compliance obligations are subject to change at the initiative of FERC, PHMSA or other United States Federal agencies with jurisdiction over aspects of the operations of pipelines, including environmental, economic and safety regulations. Changes by FERC in its regulations or policies could adversely impact Pembina's natural gas pipelines, making the construction, extension, expansion or abandonment of such pipelines more costly, causing delays in the permitting of such projects or impacting the likelihood of success of completion of such projects.
36 Pembina Pipeline Corporation 2025 Annual Report
Similarly, changes in FERC's regulations or policies could adversely impact the rates that Pembina's FERC-regulated pipelines are able to charge and how such pipelines do business, whether such pipelines are regulated by FERC pursuant to the NGA or the ICA. Pembina continually monitors existing, new and changing regulations in all jurisdictions in which it currently operates, or into which it may expand in the future, and the potential implications to its operations; however, Pembina cannot predict future regulatory changes, and any such compliance and regulatory changes in any one or multiple jurisdictions could have a material adverse impact on Pembina and its financial results.
Pursuant to the Impact Assessment Act (Canada) (the "IAA"), the IAAC is the authority responsible for conducting all federal impact assessments for certain designated projects under the IAA. Pursuant to the five-year review process mandated by the IAA, the federal government is currently reviewing the list of designated projects which are subject to mandatory assessment under the IAA, such as international and interprovincial pipelines of at least 75 kilometers in length. Based on the IAAC's 2024 discussion paper regarding its review of designated projects, it does not appear that the IAAC is considering any changes to the inclusion or types of pipelines that are currently listed as designated projects. The Minister of Environment and Climate Change Canada (the "Minister") may also designate a project as reviewable under the IAA. However, pursuant to recent amendments to the IAA as further discussed below, a potential for non-negligible adverse effects within federal jurisdiction must exist for the Minister to designate a project as reviewable.
The CER continues to oversee approved federal, interprovincial and international energy projects, with new projects being referred to a review panel under the IAA. The Strategic Assessment of Climate Change ("SACC") sets out the types of information that project proponents are required to file and how the information may be considered. The SACC and new guidance on a "best in class" approach to GHG emissions requirements, which guidance is yet to be released, are expected to strictly limit GHG emissions from IAA-regulated projects, in support of the federal government's net-zero by 2050 goal discussed under "Environmental Costs and Liabilities" below.
In 2023, the Supreme Court of Canada held that the IAA was, in significant part, unconstitutional. In response to this decision, the federal government amended the IAA pursuant to the Budget Implementation Act (2024, No. 1), which received royal assent in June 2024. The amendments narrow the scope of project effects that may trigger an assessment pursuant to the IAA. The amendments also permit the substitution of a federal impact assessment with equivalent assessment processes from another jurisdiction and clarify the public interest test to be applied when determining whether to allow a designated project to proceed. Relatively few projects have been subject to the federal impact assessment regime to date and Pembina continues to actively monitor developments in this area. To the extent these changes lengthen the review timeline for projects or expand the scope of the matters to be considered, the regime could materially impact the amount of time and capital resources required by Pembina to seek and obtain approval to construct and operate certain international or interprovincial pipelines or other projects designated pursuant to the IAA project list or ministerial designation powers under the IAA. In September 2025, the IAAC released a Red Tape Progress Report and announced that it is re-engineering its processes under the IAA to ensure that projects receive federal approvals in two years or less. The ongoing development of the CER Act and IAA regime could materially and directly impact Pembina's business and financial results, and could indirectly affect Pembina's business and financial results by impacting the financial condition and growth projects of its customers and, ultimately, production levels and throughput on Pembina's pipelines and in its facilities.
On June 24, 2024, the federal government amended the Competition Act (Canada) to address "greenwashing" by prohibiting representations to the public regarding the benefits that a business or business activity have on the environment and climate change when such statements are not substantiated. Pembina will continue to monitor this area for developments.
On November 27, 2025, the federal government and Alberta provincial government signed a Memorandum of Understanding ("Canada/Alberta MOU") which addressed, among other things, the oil and gas emissions cap, Pathways carbon capture and storage project, Oil Tanker Moratorium Act, applicability of the Clean Electricity Regulations in Alberta, and the development of a new bitumen pipeline from Alberta to the West Coast. See "Environmental Costs and Liabilities" below for further details regarding the potential impacts of the Canada/Alberta MOU on Pembina.
Pembina Pipeline Corporation 2025 Annual Report 37
In addition to the direct regulation of pipelines and midstream facilities, Pembina's business and operations are subject to, and may be adversely affected by changes in, environmental, health and safety laws and regulations, as described under "Environmental Costs and Liabilities" below. Pembina's business and financial condition may also be influenced by regulatory changes applicable to land sales, exploration, development and retail and consumer uses, and federal and foreign legislation affecting, in particular, foreign investment, through legislation such as the Competition Act (Canada), the Investment Canada Act (Canada) and equivalent legislation in foreign jurisdictions.
There can be no assurance that changes to regulatory and environmental laws or policies and government incentive programs relating to the pipeline or crude oil and natural gas industry, or unfavourable decisions of regulatory bodies or outcomes of regulatory hearings, will not adversely affect Pembina or the value of its securities.
See "Other Information Relating to Pembina's Business – Industry Regulation" in the AIF for the year ended December 31, 2025 for further information.
Operational Risks
Operational risks include, but are not limited to: pipeline leaks; the breakdown or failure of equipment, pipelines and facilities, information systems or processes; the compromise of information and control systems; the performance of equipment at levels below those originally intended (whether due to misuse, unexpected degradation or design, construction or manufacturing defects); releases at truck terminals, storage terminals and hubs; releases associated with the loading and unloading of potentially harmful substances onto rail cars and trucks; adverse sea conditions (including storms and rising sea levels) and releases or spills from shipping vessels loaded at Pembina's Vancouver Wharves or the Prince Rupert Terminal; failure to maintain adequate supplies of spare parts; operator error; labour disputes; disputes with interconnected facilities and carriers; operational disruptions or apportionment on third-party systems or refineries, which may prevent the full utilization of Pembina's facilities and pipelines; and catastrophic events, including, but not limited to, those related to climate change and extreme weather events, including fires, floods and other natural disasters, explosions, train derailments, earthquakes, widespread epidemics or pandemic outbreaks, acts of civil protest or disobedience, terrorism or sabotage, and other similar events, many of which are beyond the control of Pembina and all of which could result in operational disruptions, damage to assets, related releases or other environmental issues, and delays in construction, labour and materials. Pembina may also be exposed from time to time to additional operational risks not stated in the immediately preceding sentence. In addition, the consequences of any operational incident (including as a result of adverse sea conditions) at Vancouver Wharves and the Prince Rupert Terminal or involving a vessel receiving products from Vancouver Wharves or the Prince Rupert Terminal may be even more significant as a result of the complexities involved in addressing leaks and releases occurring in the ocean or along coastlines and/or the repair of marine terminals. Any leaks, releases or other incidents involving such vessels, or other similar operations along the West Coast, could result in significant harm to the environment, curtailment of, or disruptions of and/or delays in, offshore shipping activity in the affected areas, including Pembina's ability to effectively carry on operations at Vancouver Wharves and the Prince Rupert Terminal. The occurrence or continuance of any of the foregoing events could increase the cost of operating Pembina's assets and/or reduce revenue, or result in damages, claims or fines, environmental damages, personal injury or loss of life, all of which could adversely affect Pembina's operations, financial performance and/or reputation. Additionally, facilities and pipelines are reliant on electrical power for their operations. A failure or disruption within the local or regional electrical power supply or distribution or transmission systems could significantly affect ongoing operations. Further, a significant increase in the cost of power or fuel, whether through increased demand or otherwise, could have a materially negative effect on the level of profit realized in cases where the relevant contracts do not provide for recovery of such costs.
38 Pembina Pipeline Corporation 2025 Annual Report
Pembina is committed to preserving customer and shareholder value by proactively managing operational risk through safe and reliable operations. Operational leaders are responsible for the supervision of operational risk by ensuring appropriate policies, procedures and systems are in place within their business units and internal controls are operating efficiently. Pembina also has an extensive program to manage pipeline system integrity, which includes the development and use of in-line inspection tools and various other leak detection technologies. Pembina's maintenance, inspection, excavation and repair programs are focused on risk mitigation and, as such, integrity maintenance programs are developed and resources are directed to areas based on continual risk assessments and infrastructure is replaced or repaired as required to ensure that Pembina's assets are operated safely and reliably. Pembina carries insurance coverage with respect to some, but not all, casualty occurrences in amounts customary for similar business operations, which coverage may not be sufficient to compensate for all casualty occurrences. In addition, Pembina has a comprehensive Security Management Program designed to reduce security-related risks.
Competition
Pembina competes with other pipeline, midstream, marketing and gas processing, fractionation and handling/storage service providers in its service areas as well as other transporters of crude oil, NGL and natural gas. The introduction of competing transportation alternatives into Pembina's service areas could result in the reduction of throughput in Pembina's pipelines which could result in decreased revenues and profits for Pembina. Additionally, potential pricing differentials on the components of NGL may result in these components being transported by competing gas pipelines. Pembina is determined to meet, and believes that it is prepared for, these existing and potential competitive pressures, including through agreements which provide for areas of dedication over the geographic areas in which Pembina's pipeline infrastructure is located. In addition, competition from non-hydrocarbon based energy sources may have an adverse effect on the production of crude oil, NGL and natural gas and, as a result, on the demand for Pembina's services. Pembina also competes with other businesses for growth and business opportunities, including competition related to potential Greenfield development opportunities, which could impact its ability to grow through acquisitions and developments and could impact earnings and cash flow available to pay dividends and to service obligations under Pembina's debt securities and other debt obligations.
See "Description of Pembina's Business and Operations" in the AIF for the year ended December 31, 2025 for further information.
Reliance on Principal Customers
Pembina sells services and products to large customers within its area of operations and relies on several significant customers to purchase product for the Marketing business. As of December 31, 2025, one customer accounted for more than 10 percent of Pembina's revenue. If for any reason this customer, or any of the other significant customers, are unable to perform their obligations under the various agreements with Pembina, the revenue and operations of Pembina could be negatively impacted, which could also adversely affect the cash flow available for dividends and to service obligations under Pembina's debt securities and other debt obligations. See "General Risk Factors – Counterparty Credit Risk" below.
Pembina Pipeline Corporation 2025 Annual Report 39
Completion and Timing of Expansion Projects
The successful completion of Pembina's growth and expansion projects is dependent on a number of factors outside of Pembina's control, including the impact of general economic, business and market conditions, availability of capital on terms and rates acceptable to Pembina, receipt of regulatory approvals, reaching long-term commercial arrangements with customers in respect of certain portions of the expansions, construction schedules, commissioning difficulties or delays and costs that may change depending on supply, demand and/or inflation, labour, materials and equipment availability, contractor non-performance, acts of civil protest or disobedience, terrorism or sabotage, weather conditions, cost of engineering services, change in governments that granted the requisite regulatory approvals, and completion of third-party infrastructure projects that Pembina's projects rely upon. There is no certainty, nor can Pembina provide any assurance, that necessary regulatory approvals will be received on terms that maintain the expected return on investment associated with a specific project, or at all, or that satisfactory commercial arrangements with suppliers or customers will be entered into on a timely basis, or at all, or that third parties will comply with contractual obligations in a timely manner. Factors such as special interest group opposition, Indigenous, landowner and other stakeholder consultation requirements, civil protest or disobedience, changes in shipper support, and changes to the legislative or regulatory framework could all have an impact on meeting contractual and regulatory milestones. As a result, the cost estimates and completion dates for Pembina's major projects may change during different stages of the project. Greenfield and early stage projects face additional challenges, including securing leases, easements, rights-of-way, permits and/or licenses from landowners or governmental authorities allowing access for such purposes, as well as Indigenous consultation requirements. Accordingly, actual costs and construction schedules may vary from initial estimates and these differences can be significant, and certain projects may not proceed as planned, or at all. Further, there is a risk that maintenance will be required more often than currently planned or that significant maintenance capital projects could arise that were not previously anticipated.
Under most of Pembina's construction and operating agreements, the Company is obligated to construct the facilities and pipelines regardless of delays and cost increases and Pembina bears the risk for any cost overruns. Future agreements entered into with customers with respect to expansions may contain similar conditions. While Pembina is not currently aware of any significant undisclosed cost overruns with respect to its current projects at the date hereof, any such cost overruns may adversely affect the economics of particular projects, as well as Pembina's business operations and financial results, and could reduce Pembina's expected return on investment which could, in turn, reduce the level of cash available for dividends and to service obligations under Pembina's debt securities and other debt obligations.
See "General Risk Factors – Additional Financing and Capital Resources" and "Customer Contracts" below.
Urban Encroachment Near Leases and Rights of Way
Pembina operates certain assets in or near urban areas. Land use decisions made by municipal governments or other authorities may increase or introduce exposure to the public within defined emergency planning zones. Unmitigated, such exposure has the potential to increase the severity and likelihood of public safety impacts should a failure event occur. Urban encroachment may result in incremental capital expenditures to increase pipeline wall thickness and re-route pipelines so that emergency planning zones can be reduced in size or avoid areas of development. Operational pressures may also be required to be lowered, which reduces throughput on pipelines. These issues could impact the competitiveness of certain assets and Pembina's ability to meet customer demand.
40 Pembina Pipeline Corporation 2025 Annual Report
Reliance on Other Facilities and Third-Party Services
Certain of the Company's terminals, pipelines and rail activities are dependent upon their interconnections with other terminals, pipelines and rail networks and facilities owned and operated by third parties to reach end markets and as a significant source of supply for the Company's facilities. These connections are important to Pembina and its customers as they provide critical transportation routes, both from the perspective of delivering product to Pembina's facilities and providing product egress. Risks may be created as a result of: differences in pressures; specifications or capacities which affect operations; planned and unplanned outages or curtailments at third-party facilities that restrict deliveries to or from Pembina's facilities; and measurement and component balancing errors affecting product deliveries. As well, there may be issues with respect to scheduling and service delivery by third parties that affect Pembina's operations, such as the scheduling and availability of timely and reliable rail service by the railway companies on which Pembina relies to move product. Operational disruptions, apportionment, regulatory action and other events on third-party systems and infrastructure may prevent the full utilization of Pembina's facilities, require Pembina to spend additional capital, or otherwise negatively affect Pembina's operations.
Pembina is unable to control operations, events, decisions, regulatory actions or public perceptions with respect to third-party assets and facilities, making the mitigation of these risks challenging. Although Pembina employs strategies to assist in mitigating these risks, including having multiple connections, service arrangements or transportation alternatives available in order to provide flexibility during curtailments or interruptions, there is no assurance such strategies will be effective. Where such alternatives are not available or are not effective, Pembina's operations may be significantly affected.
Possible Failure to Realize Anticipated Benefits of Corporate Strategy
Pembina evaluates the value proposition for new investments, acquisitions and divestitures on an ongoing basis. Planning and investment analysis is highly dependent on accurate forecasting assumptions and, to the extent that these assumptions do not materialize, financial performance may be lower or more volatile than expected. Volatility in the economy, changes in cost estimates, failure to obtain regulatory approvals and permits, project scoping and risk assessment could result in decreased returns and loss of profits for Pembina.
As part of its ongoing strategy, Pembina may complete acquisitions of assets or other entities in the future. Achieving the benefits of completed and future acquisitions depends, in part, on successfully consolidating functions and integrating operations, procedures and personnel in a timely and efficient manner, as well as Pembina's ability to realize the anticipated growth opportunities and synergies from combining the acquired businesses and operations with those of Pembina. In particular, large scale acquisitions may involve significant pricing and integration risk. The integration of acquired businesses and entities requires the dedication of substantial management effort, time and resources, which may divert management's focus and resources from other strategic opportunities and from operational matters during this process. The integration process may also result in the loss of key employees and the disruption of ongoing business, customer and employee relationships, which may adversely affect Pembina's ability to achieve the anticipated benefits of any acquisitions. Acquisitions may also expose Pembina to additional risks, including risks relating to entry into markets or businesses in which Pembina has little or no direct prior experience, increased credit risks through the assumption of additional debt, costs and contingent liabilities and exposure to liabilities of the acquired business or assets.
As part of its value proposition evaluation, Pembina may also desire to divest assets to optimize its operations and financial performance. Pembina may, however, be unable to sell certain assets or, if Pembina is able to sell certain assets, it may not receive the optimal or desired amount of proceeds from such asset sales. Additionally, the timing to close any asset sales could be significantly different than Pembina's expected timeline.
See "General Risk Factors – Additional Financing and Capital Resources" below.
Pembina Pipeline Corporation 2025 Annual Report 41
Joint Ownership and Third-Party Operators
Certain of Pembina's assets are jointly owned and are governed by partnership or shareholder agreements entered into with third-parties. As a result, certain decisions relating to these assets require the approval of a simple majority of the owners, while others require supermajority or unanimous approval of the owners. In addition, certain of these assets are operated by unrelated third-party entities. The success of these assets is, to some extent, dependent on the effectiveness of the business relationship and decision-making among Pembina and the other joint owner(s) and the expertise and ability of any third-party operators to operate and maintain the assets. While Pembina believes that there are prudent governance and other contractual rights in place, there can be no assurance that Pembina will not encounter disputes with joint owners or that assets operated by third parties will perform as expected. Further, if a joint owner were to become insolvent, regulators may require Pembina to assume such joint owner's obligations and Pembina may face operational challenges during any insolvency proceedings, resulting in additional costs. Such events could impact operations or cash flows of these assets or cause them to not operate as Pembina expects which could, in turn, have a negative impact on Pembina's business operations and financial results, and could reduce Pembina's expected return on investment, thereby reducing the level of cash available for dividends and to service obligations under Pembina's debt securities and other debt obligations.
Agreements for joint ownership often contain restrictions on transferring an interest in an asset or an entity, including consent requirements and rights of first refusal. Such provisions may restrict Pembina's ability to transfer its interests in such assets or entities or to acquire a joint venture owner's interest in such assets or entities, and may also restrict Pembina's ability to maximize the value of a sale of its interest.
Reserve Replacement, Throughput and Product Demand
Pembina's pipeline revenue is based on a variety of tolling arrangements, including fee-for-service, cost-of-service agreements and market‑based tolls. As a result, certain pipeline revenue is heavily dependent upon throughput levels of crude oil, condensate, NGL and natural gas. Future throughput on crude oil, NGL and natural gas pipelines and replacement of crude oil and natural gas reserves in Pembina's service areas will be dependent upon the activities of producers operating in those areas as they relate to exploiting their existing reserve bases and exploring for and developing additional reserves, and technological improvements leading to increased recovery rates. Similarly, the volumes of natural gas processed through Pembina's gas processing assets depends on the production of natural gas in the areas serviced by the gas processing business and associated pipelines. Without reserve additions, or expansion of the service areas, volumes on such pipelines and in such facilities would decline over time as reserves are depleted. As crude oil and natural gas reserves are depleted, production costs may increase relative to the value of the remaining reserves in place, causing producers to shut-in production or seek out lower cost alternatives for transportation. If, as a result, the level of tolls collected by Pembina decreases, cash flow available for dividends to Shareholders and to service obligations under Pembina's debt securities and Pembina's other debt obligations could be adversely affected.
Over the long-term, the ability and willingness of shippers to continue production will also depend, in part, on the level of demand and prices for crude oil, condensate, NGL and natural gas in the markets served by the crude oil, NGL and natural gas pipelines and gas processing and gathering infrastructure in which Pembina has an interest. Producers may shut-in production at lower product prices or higher production costs.
Global economic events may continue to have a substantial impact on the prices of crude oil, condensate, NGL and natural gas. Pembina cannot predict the impact of future supply/demand or economic conditions, fuel conservation measures, alternative fuel requirements, governmental regulation or technological advances in fuel efficiency and energy generation in the energy and petrochemical industries or future demand for and prices of natural gas, crude oil, condensate and NGL. A lower commodity price environment will generally reduce drilling activity and, as a result, the demand for Pembina's assets and services could decline. Producers in the areas serviced by Pembina may not be successful in exploring for and developing additional reserves or achieving technological improvements to increase recovery rates and lower production costs during periods of lower commodity prices, which may also reduce demand for Pembina's assets and services.
42 Pembina Pipeline Corporation 2025 Annual Report
Future prices of these hydrocarbons are determined by supply and demand factors, including weather and general economic conditions as well as economic, political and other conditions in other crude oil and natural gas producing regions, all of which are beyond Pembina's control. The rate and timing of production from proven natural gas reserves tied into gas plants is at the discretion of producers and is subject to regulatory constraints. Producers have no obligation to produce from their natural gas reserves, which means production volumes are at the discretion of producers. Lower production volumes may increase the competition for natural gas supply at gas processing plants, which could result in higher shrinkage premiums being paid to natural gas producers. In addition, lower production volumes may lead to less demand for pipelines and processing capacity and could adversely impact Pembina's ability to re-contract on favourable terms with shippers as current agreements expire.
Customer Contracts
Throughput on Pembina's pipelines is governed by transportation contracts or tolling arrangements with various crude oil and natural gas producers. Pembina is party to numerous contracts of varying durations in respect of its gas gathering, processing and fractionation facilities as well as its terminalling and storage services. Any default by counterparties under such contracts or any expiration or early termination of such contracts or tolling arrangements without renewal or replacement, provided that such contracts are material to Pembina's business and operations, may have an adverse effect on Pembina's business and results from operations and there is no guarantee that any of the contracts that Pembina currently has in place will be renewed at the end of their term, including on terms favourable to Pembina, or replaced with other contracts in the event of early termination. Further, certain contracts associated with the services described above are comprised of a mixture of firm and non-firm commitments. The revenue that Pembina earns on non-firm or firm commitments without take-or-pay service is dependent on the volume of crude oil, condensate, NGL and natural gas produced by producers in the relevant geographic areas. Accordingly, lower production volumes in these areas, including for reasons such as low commodity prices, may have an adverse effect on Pembina's revenue, which could also adversely affect the cash flow available for dividends and to service obligations under Pembina's debt securities and other debt obligations.
See "Description of Pembina's Business and Operations" in the AIF for the year ended December 31, 2025 for further information.
Inflation
The general rate of inflation impacts the economies and business environments in which Pembina operates. In response to easing global inflationary pressures, major central banks, including the Bank of Canada and the U.S. Federal Reserve, decreased benchmark interest rates multiple times throughout 2025 and, although inflation trended downward in 2025, inflationary pressures may increase in the future, resulting in central banks raising interest rates in the future. While many of Pembina's pipeline transportation agreements and facilities agreements contain provisions protecting against inflation by adjusting pricing based on changes in the consumer price index or other similar figures, increased inflation and any economic conditions resulting from governmental attempts to reduce future increases in inflation, including the imposition of higher interest rates or wage and price controls, may negatively impact levels of demand for Pembina's services and cost of inputs, and could, accordingly, have a negative impact on Pembina's business, financial condition and results of operations. Higher interest rates as a result of inflation could negatively impact the Company's borrowing costs, which could, in turn, have a negative impact on Pembina's cash flow and ability to service obligations under its debt securities and other debt obligations, and impact Pembina's ability to sanction new projects.
Risks Relating to Natural Gas and NGL Composition
Each of Pembina's gas processing facilities is designed to process natural gas and NGL feedstock within a certain range of composition specifications. The facilities may require modification to operate efficiently if the composition of the natural gas or NGL being processed changes significantly. The configuration of each of Pembina's gas processing facilities may not be optimal for efficient operation in the future if a change in inlet natural gas or NGL composition is outside a plant’s acceptable range of composition specifications.
Pembina Pipeline Corporation 2025 Annual Report 43
Pembina monitors plant throughput, natural gas and NGL composition, third-party system performance and industry development activity in the production areas surrounding its facilities on an ongoing basis. This information is used to assist with ongoing operational decisions, bringing on new production and new customers, evaluating expansion opportunities and assessing opportunities to modify or add new services to accept the inlet gas and NGL in the areas surrounding its facilities.
Risks Relating to Leases and Rights of Way Access
Certain Pembina facilities and associated infrastructure are located on lands leased or licensed from third parties and such leases and licenses must be renewed from time to time. Failure to renew the leases or licenses on terms acceptable to Pembina could significantly reduce the operations of such facilities and could result in related decommissioning costs for Pembina, pursuant to the terms of such leases or licenses. Successful development of new pipelines or extensions to existing pipelines depends in part on securing leases, easements, rights-of-way, permits and/or licenses from landowners or governmental authorities allowing access for such purposes. The process of securing rights-of-way or similar access is becoming more complex, particularly in more densely populated, environmentally sensitive and other areas. The inability to secure such rights-of-way or similar access could have an adverse effect on Pembina's operations and financial results.
Reputation
Reputational risk is the potential risk that market- or company-specific events, or other factors, could result in the deterioration of Pembina's reputation with key stakeholders. Pembina's business and operations, projects and growth opportunities require us to have strong relationships with key stakeholders, including local communities, Indigenous communities and other groups directly impacted by the Company's activities, as well as governments and government agencies.
The potential for deterioration of Pembina's reputation exists in many business decisions, which may negatively impact Pembina's business and the value of its securities. Reputational risk cannot be managed in isolation from other forms of risk. Credit, market, operational, insurance, liquidity, environmental, regulatory and legal, and technology risks, among others, must all be managed effectively to safeguard Pembina's reputation. Pembina's reputation could also be impacted by the actions and activities of other companies operating in the energy industry, particularly other energy infrastructure providers, over which Pembina has no control. In particular, Pembina's reputation could be impacted by negative publicity related to pipeline incidents, expansion plans or new projects or due to opposition from civilians or organizations opposed to energy, oil sands and pipeline development and, particularly, with transportation of production from oil sands producing regions. Further, Pembina's reputation could be negatively impacted by changing public attitudes towards climate change and the perceived causes thereof, over which the Company has no control. Negative impacts resulting from a compromised reputation, whether caused by Pembina's actions or otherwise, could include revenue loss, reduction in customer base, delays in obtaining regulatory approvals with respect to growth projects, reduced access to capital or decreased value of Pembina's securities and reduced insurance capacity and coverage.
Environmental Costs and Liabilities
Pembina's operations, facilities and petroleum product shipments are subject to extensive national, regional and local environmental, health and safety laws and regulations governing, among other things, discharges to air, land and water, the handling and storage of petroleum products and hazardous materials, waste disposal, the protection of employee health, safety and the environment, and the investigation and remediation of contamination. Pembina's facilities may experience incidents, malfunctions or other unplanned events that may result in spills or emissions and/or result in personal injury, fines, penalties, other sanctions or property damage. Pembina may also incur liability for environmental contamination associated with past and present activities and properties.
44 Pembina Pipeline Corporation 2025 Annual Report
Pembina's pipelines and facilities must maintain a number of environmental and other permits from various governmental authorities in order to operate, and Pembina's facilities are subject to inspection and audit from time to time. Failure to maintain compliance with regulatory and permit requirements could result in operational interruptions, fines or penalties, or the need to install additional pollution control technology. Licenses and permits must be renewed from time to time and there is no guarantee that a license or permit will be renewed on the same or similar conditions as it was initially granted. There can be no assurance that Pembina will be able to obtain all licenses, permits, registrations, approvals and authorizations that may be required to conduct operations that it may wish to undertake. Further, if at any time regulatory authorities deem any of Pembina's pipelines or facilities unsafe or not in compliance with applicable laws or regulations, they may order such facilities to be shut down. Certain significant environmental legislative initiatives that may materially impact Pembina's business and financial results and condition are outlined below.
In 2021, the federal government enacted the Canadian Net-Zero Emissions Accountability Act, which legislated a federal commitment to achieve net-zero GHG emissions by 2050 and a nearer-term target of the federal government's Nationally Determined Contribution under the Paris Climate Agreement, which currently is a 40 to 50 percent GHG emissions reduction by 2030. The upstream crude oil and natural gas industry is expected to contribute a significant amount of the reduction needed to achieve these goals. In 2023, the federal government released its "2023 Progress Report on the 2030 Emissions Reduction Plan" and highlighted the importance of new regulatory changes, such as the implementation of an oil and gas emissions cap and methane reduction requirements, to Canada's success in reaching long-term climate targets.
The federal government's net-zero strategy includes a number of specific measures described below, but is also expected to affect the decision-making of all federal government bodies, including federal regulators, consistent with, for instance, the application of the SACC to projects subject to the IAA, as described above. However, given the Supreme Court of Canada's holding that the IAA was substantially unconstitutional in 2023, the implementation of many of these measures is expected to be subject to challenge. In addition, on November 9, 2025, the federal government announced its new Climate Competitiveness Strategy which unveiled the government's intention to strengthen or clarify certain existing climate policies, such as industrial carbon pricing, greenwashing regulations and methane regulations, and potentially eliminate other policies, such as the oil and gas emissions cap that was scheduled to take effect in 2030. The policy changes under the Climate Competitiveness Strategy are yet to take effect.
The federal government has mandated a pan-Canadian carbon price pursuant to the GGPPA. On June 5, 2025, the federal government introduced Bill C-4 to repeal the portion of the GGPPA pertaining to the consumer-facing carbon price, which was reduced to $0 per tonne on April 1, 2025. The federal government, however, has maintained its industrial Output-Based Pricing System ("Federal OBPS"). The carbon price is $95 per tonne in 2025, rising by $15 per tonne per year until 2030 to a price of $170 per tonne. The GGPPA establishes a set of minimum national standards for carbon pricing in Canada, which standards apply to provinces that otherwise fail to impose equally stringent provincial carbon pricing measures. The 2030 Emissions Reduction Plan stated that the federal government will explore ways to maintain the carbon price against future legislative changes. The increasing carbon price and any potential future amendments to the GGPPA may impose additional costs on the operations of Pembina and Pembina's customers.
On November 4, 2025, the federal government announced that it will take steps to strengthen the Federal OBPS, such as by developing a long term price trajectory past 2030 and imposing the federal backstop where provincial systems fall short of the federal equivalency benchmark.
Pembina Pipeline Corporation 2025 Annual Report 45
The Technology Innovation and Emissions Reduction Regulation ("TIER") is Alberta's output-based carbon pricing regime for large emitters. The TIER facilitates emissions reductions for facilities that emitted 100,000 tonnes of GHGs or more in 2016 or any subsequent year. The TIER also allows facilities emitting less than 100,000 tonnes of GHGs but more than 2,000 tonnes of GHGs to opt-in as a regulated facility. Facilities which are subject to the TIER are exempt from the Federal OBPS carbon price included in the GGPPA as they have been deemed equivalent. In May 2025, the government of Alberta announced that it will pause its industrial carbon price at $95 per tonne instead of increasing to $110 per tonne in 2026. However, pursuant to the Canada/Alberta MOU, the federal government committed to work with Alberta in developing a new industrial carbon pricing agreement by April 1, 2026 that increases the price stringency of the TIER regime so that it better aligns with the GGPPA’s industrial carbon price. Amendments to the TIER came into force on January 1, 2023 and include, among other things, the addition of emissions associated with flaring to the regulated emissions of aggregate oil and gas facilities and the annual tightening of emission reduction benchmarks. On September 16, 2025, the Province of Alberta announced that the TIER will be amended to recognize on-site emissions reductions investments as a way for entities to meet their compliance obligations, thereby introducing a new compliance method. Based on an June 2025 Discussion Document, it is anticipated that half of an entity's expenditures on eligible projects can be considered towards TIER compliance. The Discussion Document also lists potential eligible projects, such as retrofitting stationary equipment for increased energy efficiency, low carbon fuel production for internal facility use, carbon capture and storage and heat recovery and certain study-based projects that support an eligible project.
As at December 31, 2025, Pembina had eleven TIER large final emitter facilities, including the Alberta section of the Alliance Pipeline, and five TIER aggregate facilities. At present, the operational and financial impacts of TIER are anticipated to increase over the next five years, due to annual increases in the stringency of emissions performance benchmarks. As more facilities expand and increase production, it is anticipated that additional facilities will become subject to the TIER. The potential costs and benefits to Pembina of those facilities under the TIER are continuing to be assessed.
In British Columbia, an output-based pricing system ("B.C. OBPS") was introduced on April 1, 2024, replacing the Clean B.C. Industrial Incentive Program. The B.C. OBPS ensures that there is a price incentive for industrial emitters to reduce GHG emissions, while also seeking to promote innovation and protect competitiveness. Pembina has four facilities subject to the B.C. OBPS, including the B.C. section of the Alliance Pipeline. The financial impacts of this new program on Pembina and its facilities are still being determined.
In Saskatchewan, an output-based performance standards ("SK OBPS") program came into effect in 2019. Pembina has four facilities subject to the SK OBPS, including the Saskatchewan section of the Alliance Pipeline, which became covered under this program in 2023. Similar to the B.C. OBPS, it is an intensity-based program in which covered facilities are required to meet an established intensity benchmark. The SK OBPS program was expanded in 2020 and updated in 2023, covering more industrial sectors including the natural gas pipeline sector. Facilities which are subject to the SK OBPS are exempt from the Federal OBPS carbon price included in the GGPPA as they have been deemed equivalent. This may change as in April 2025, the government of Saskatchewan set the rate of its provincial industrial carbon price to $0 per tonne. While the federal government has announced its intention to impose the Federal OBPS backstop in provinces that fall short of the equivalency requirements, it is currently unclear when and how the federal government will do so. Pembina will continue to monitor changes regarding the industrial carbon price. The financial impacts of the SK OBPS program on Pembina and its facilities are expected to increase over the next five years.
46 Pembina Pipeline Corporation 2025 Annual Report
The federal Regulations Respecting Reduction in the Release of Methane and Certain Volatile Organic Compounds (Upstream Oil and Gas Sector) ("Federal Methane Regulations"), which require reduction of fugitive and vented gas emissions from the upstream oil and gas sector, came into force on January 1, 2020. Draft amendments to the Federal Methane Regulations were released on December 16, 2023 ("Amended Federal Methane Regulations"). The Amended Federal Methane Regulations, which the federal government described as "enhanced methane regulations" in November 2025, include enhanced reduction targets, an annual third-party inspection requirement and a performance-based option as an alternative pathway to compliance. The Amended Federal Methane Regulations are planned to take effect in 2027 and apply across the sector by 2030, and may impose additional costs on the operations of Pembina and Pembina's customers.
By an equivalency agreement with the federal government, which originally came into force October 26, 2020, the Federal Methane Regulations do not currently apply in Alberta. The federal and Alberta governments entered into a new equivalency agreement prior to the October 26, 2025 expiry date of the original agreement. The new agreement will be in place until 2030. Pursuant to the Canada/Alberta MOU, the parties agreed to enter into a new methane equivalency agreement on or before April 1, 2026, with a 2035 target date and a new 75% reduction target relative to 2014 emissions levels. The Federal Methane Regulations apply in Ontario and Manitoba but not currently, due to equivalency agreements similar to that in effect in Alberta, in British Columbia or Saskatchewan.
2024 was the second compliance period for the federal Clean Fuel Regulations, which requires all producers and importers of gasoline and diesel in Canada to reduce or offset the carbon intensity of the fuels they produce or import. The Clean Fuel Regulations are intended to facilitate a decrease in the carbon intensity of gasoline and diesel used in Canada by approximately 15 percent below 2016 levels by 2030. On November 4, 2025, the federal government announced that it will make "targeted updates" to the Clean Fuel Regulations. The potential costs and benefits of the Clean Fuel Regulations and any "targeted updates" thereto to Pembina and its customers are continuing to be assessed.
In late 2024, the federal government released proposed regulations that, if adopted, would impose a cap on GHG emissions from the upstream oil and gas sector and the LNG sector. The proposed regulations would establish a cap-and-trade system for prescribed activities, such as onshore and offshore oil and gas production, oil sands production and upgrading, natural gas production and processing, and the production of LNG. GHG emissions from certain activities will be capped while emissions of GHGs from specified industrial activities will be prohibited, unless the operator registers in accordance with the regulations. The proposed regulations contemplate reducing emissions from the oil and gas sector by 35 percent below 2019 levels by 2030 to 2032. The federal government completed public consultations regarding the draft regulations and originally announced that it anticipated publishing the final regulations in 2025. However, on November 4, 2025, the federal government announced that, pursuant to its new Climate Competitive Strategy, the GHG emissions cap may no longer be necessary. Additionally, pursuant to the Canada/Alberta MOU, the federal government stated that it will not implement the oil and gas emissions cap in consideration for the mutual commitments agreed to in the Canada/Alberta MOU.
Additionally, the federal government released the Clean Electricity Regulations on December 17, 2024, which sets limits on the amount of CO2 that is emitted during the generation of electricity from fossil fuels. Pursuant to the Canada/Alberta MOU, the federal government suspended the Clean Electricity Regulations in Alberta pending a new industrial carbon pricing agreement to be executed by April 1, 2026. Upon completion of the new industrial carbon pricing agreement and factoring all other measures of the Canada/Alberta MOU to the satisfaction of both parties, the federal government will place the Clean Electricity Regulations in Alberta on hold.
The Government of Alberta, in its climate change legislation and guidelines, has legislated an overall cap on oil sands GHG emissions. The legislated emissions cap on oil sands operations has been set to a maximum of 100 megatonnes of CO2e in any year, which excludes new upgrading capacity and existing upgrader expansions, up to a combined maximum of 10 million tonnes of CO2e, and the electricity portion of cogeneration. This legislated cap may limit oil sands production growth in the future, and its interaction with the proposed federal oil and gas sector emissions cap is unknown at this time.
Pembina Pipeline Corporation 2025 Annual Report 47
Pembina is subject to regulation by the AER under the AER's liability management framework. Since 2021, the AER has been in the process of phasing-out its former liability management regime, which included the LLR Program and LMR. In February 2025, the AER announced amendments to the Oil and Gas Conservation Rules, Pipeline Rules and various AER Directives to formally eliminate the LMR and LLR.
Pembina is subject to regulation by the BCER under the Permittee Capability Assessment program ("PCA Program"), which became effective in 2022. The PCA Program is similar to the intent of the AER's Directive 088 to assess licensees holistically. It assesses the overall risk of the licensee by examining both financial health measures and deemed liabilities. Licensees are then required to provide security deposits or reduce their deemed liabilities such that their assessed risk under the PCA Program is reduced to zero in a given year. Failure to do so may restrict the licensee's ability to transfer licenses or result in enforcement action by the BCER. Pursuant to the Energy Statutes Amendment Act, 2022 (British Columbia), the BCER has broadened authority to impose liability for cleanup, restoration and management of oil and gas infrastructure sites on directors and/or officers of a current or former permittee, or on a "responsible person", which is broadly defined to include those holding a legal or beneficial interest in petroleum or natural gas rights, production or profits associated with the oil and gas activity at issue, among others. As of June 1, 2024, the PCA Program was expanded to include dormant facilities and pipelines.
Directive 088, which came into force on December 1, 2021, institutes a holistic assessment regime with several different regulatory tools not limited to the current use of security deposits. The new holistic liability management framework includes Licencee Capability Assessments (which replaces the LLR Program), Licensee Special Actions, a process to address legacy and post-closure sites, and an expanded mandate of the Orphan Well Association. The new regime, which applies to licence transfers, also includes the Inventory Reduction Program.
Policy reviews relating to climate change, liability management and other environmental issues are ongoing in the jurisdictions in which Pembina operates. Through active participation with industry associations and direct engagement with regulatory bodies, Pembina will continue to monitor and assess for material impacts to Pembina's business as regulations and policies continue to be developed.
While Pembina believes its current operations are in material compliance with applicable environmental, health and safety laws, there can be no assurance that substantial costs or liabilities will not be incurred as a result of non-compliance with such laws. Moreover, it is possible that other developments, such as changes in environmental, health and safety laws, regulations and enforcement policies thereunder, including with respect to climate change, claims for damages to persons or property resulting from Pembina's operations, and the discovery of pre-existing environmental liabilities in relation to Pembina's existing or future properties or operations, could result in significant costs and liabilities to Pembina. If Pembina is not able to recover the resulting costs or increased costs through insurance or increased tolls, cash flow available to pay dividends to Shareholders and to service obligations under Pembina's debt securities and Pembina's other debt obligations could be adversely affected.
Changes in environmental, health and safety regulations and legislation, including with respect to climate change, may also impact Pembina's customers and could result in crude oil and natural gas development and production becoming uneconomical, which would impact throughput and revenue on Pembina's systems and in its facilities.
See "Risks Inherent in Pembina's Business – Reserve Replacement, Throughput and Product Demand" above.
While Pembina maintains insurance for damage caused by seepage or pollution from its pipelines or facilities in an amount it considers prudent and in accordance with industry standards, certain provisions of such insurance may limit the availability thereof in respect of certain occurrences unless they are discovered within fixed time periods, which typically range from 72 hours to 30 days. Although Pembina believes it has adequate pipeline monitoring systems in place to monitor for a significant spill of product, if Pembina is unaware of a problem or is unable to locate the problem within the relevant time period, insurance coverage may lapse and may not be available.
48 Pembina Pipeline Corporation 2025 Annual Report
Abandonment Costs
Pembina is responsible for compliance with all applicable laws and regulations regarding the dismantling, decommissioning, environmental, reclamation and remediation activities associated with abandonment of its pipeline systems and other assets at the end of their economic life, and these abandonment costs may be significant. An accounting provision is made for the estimated cost of site restoration and such cost is either capitalized in the relevant asset category or applied directly to profit and loss. A provision is recognized if, as a result of a past event, Pembina has a present legal or constructive obligation that can be reliably estimated, and it is probable that an outflow of economic benefits will be required to settle the obligation. Pembina's estimates of the costs of such abandonment or decommissioning could be materially different than the actual costs incurred. For more information with respect to Pembina's estimated net present value of decommissioning obligations, see Note 15 to the Consolidated Financial Statements.
The proceeds from the disposition of certain assets, including in respect of certain pipeline systems and line fill, may be available to offset abandonment costs. Pembina may, in the future, determine it prudent or be required by applicable laws or regulations to establish and fund additional reclamation funds to provide for payment of future abandonment costs. Such reserves could decrease cash flow available to pay for dividends to Shareholders and to service obligations under Pembina's debt securities and Pembina's other debt obligations.
To the best of its knowledge, Pembina has complied in all material respects with CER requirements relative to its wholly-owned CER-regulated pipelines for abandonment funding and has completed the compliance-based filings that are required under the applicable CER rules and regulations regarding the abandonment of its pipeline systems and assets. Pembina also has ownership in CER-regulated pipelines including in respect of the Alliance Pipeline, the Tupper pipelines and the Kerrobert pipeline. Pembina, and its joint venture partner, in the case of the Tupper pipelines, is responsible for the abandonment funding and the submission of the CER-compliance based filings for those CER-regulated pipelines. Every five years, the CER reviews the amount of funds that companies must set aside to pay for future abandonment of their pipeline systems. Most recently, the CER completed a review of the abandonment funding calculations and obligations on March 27, 2024. Pembina continues to complete the annual reporting as required by the CER and meet the funding obligations imposed by the CER.
Operating and Capital Costs
The operating and capital costs of Pembina's assets may vary considerably from current and forecasted values and rates and represent significant components of the cost of providing service. In general, as equipment ages, costs associated with such equipment may increase over time. In addition, operating and capital costs may increase as a result of a number of factors beyond Pembina's control, including general economic, business and market conditions and supply, demand and/or inflation in respect of required goods and/or services. Dividends may be reduced if significant increases in operating or capital costs are incurred and this may also impact the ability of Pembina to service obligations under its debt securities and other debt obligations.
Although certain operating costs are recaptured through the tolls charged on natural gas volumes processed and crude oil and NGL transported, respectively, to the extent such tolls escalate, producers may seek lower cost alternatives or stop production of their crude oil and/or natural gas.
Pembina Pipeline Corporation 2025 Annual Report 49
Hedging Activities
The Company utilizes financial derivative instruments as part of its overall risk management strategy to assist in managing the exposure to commodity price, interest rate, cost of power and foreign exchange risks. As an example of commodity price mitigation, the Company actively fixes a portion of its exposure to fractionation margins through the use of derivative financial instruments. Additionally, Pembina's Marketing business is also exposed to variability in quality, time and location differentials for various products, and financial instruments may be used to offset the Company's exposures to these differentials. However, these hedging arrangements may expose the Company to risk of financial loss in certain circumstances and there is no guarantee that such hedging arrangements and other efforts to manage market and inventory risks will generate profits or mitigate all of the market and inventory risk associated with Pembina's business. Further, certain hedging arrangements may limit the benefit the Company would otherwise receive from increases in commodity price, decreases in interest rates and changes in foreign exchange rates, and may expose Pembina to credit risks associated with counterparties with whom the Company has contracts. The Company does not trade financial instruments for speculative purposes. Commodity price fluctuations and volatility can also impact producer activity and throughput in Pembina's infrastructure, which is discussed in more detail above.
For more information with respect to Pembina's financial instruments and financial risk management program, see Note 23 to the Consolidated Financial Statements.
Risks Relating to NGL by Rail
Pembina's operations include rail loading, offloading and terminalling facilities. Pembina relies on railroads and trucks to distribute its products for customers and to transport raw materials to its processing facilities. Costs for environmental damage, damage to property and/or personal injury in the event of a railway incident involving hydrocarbons have the potential to be significant. At this time, the Railway Safety Act (Canada), which governs the operation of railway equipment, does not contemplate regulatory enforcement proceedings against shippers, but consignors and shippers may be subject to regulatory proceedings under the Transportation of Dangerous Goods Act (Canada), which specifies, among other things, the obligations of shippers to identify and classify dangerous goods, select appropriate equipment and prepare shipping documentation. While the Canada Transportation Act was amended in 2015 to preclude railway companies from shifting liability for third-party claims to shippers by tariff publication alone, major Canadian railways have adopted standard contract provisions designed to implement such a shift. Under various environmental statutes in both Canada and the U.S., Pembina could be held responsible for environmental damage caused by hydrocarbons loaded at its facilities or being carried on its leased rail cars. Pembina partially mitigates this risk by securing insurance coverage, but such insurance coverage may not be adequate in the event of an incident.
Railway incidents in Canada and the U.S. have prompted regulatory bodies to initiate reviews of transportation rules and publish various directives. Regulators in Canada and the U.S. have begun to phase-in more stringent engineering standards for tank cars used to move hydrocarbon products, which require all North American tank cars carrying crude oil or ethanol to be retrofitted and all tank cars carrying flammable liquids to be compliant in accordance with the required regulatory timelines. In addition, in 2020, the Government of Canada directed industry to review and update the rules regarding the transportation of crude oil and liquefied petroleum gas. While most legislative and regulatory changes apply directly to railway companies, costs associated with retrofitting locomotives and rail cars, implementing safety systems, increased inspection and reporting requirements may be indirectly passed on to Pembina through increased freight rates and car leasing costs. In addition, regulators in Canada and the U.S. have implemented changes that impose obligations directly on consignors and shippers, such as Pembina, relating to the certification of product, equipment procedures and emergency response procedures.
In the event that Pembina is ultimately held liable for any damages resulting from its activities relating to transporting NGL by rail, for which insurance is not available, or increased costs or obligations are imposed on Pembina as a result of new regulations, this could have an impact on Pembina's business, operations and prospects and could impact earnings and cash flow available to pay dividends and to service obligations under Pembina's debt securities and other debt obligations.
50 Pembina Pipeline Corporation 2025 Annual Report
Risks Related to Diluent Usage in the Oil Sands
Oil sands production continues to rely on diluent (primarily condensate) blending to enable transportation of bitumen to markets via pipeline or rail. A shortage, or increase in the price, of diluent may cause oil sands producers' transportation costs to increase, which may result in less demand for the Company's services and have a negative impact on Pembina's financial performance and cash flows. Further, oil sands producers continue to invest in and evaluate technologies and methodologies to reduce the volume of diluent required for product transport. Constraints of diluent supply in the market or increases in diluent costs may accelerate such producers' investments in diluent replacement technologies. A material reduction in diluent demand from oil sands producers, whether as a result of decreased supply, or increased prices, of diluent or due to the successful implementation of diluent reduction technologies, could reduce volumes shipped on Pembina's pipeline assets and reduce demand for capacity at certain of Pembina's facilities particularly for fractionation services, which could, in either case, have a negative impact on Pembina's financial performance and cash flows.
Risk Factors Relating to the Securities of Pembina
Dilution of Shareholders
Pembina is authorized to issue, among other classes of shares, an unlimited number of Common Shares for consideration on terms and conditions as established by the Board of Directors without the approval of Shareholders in certain instances. Existing Shareholders have no pre-emptive rights in connection with such further issuances. Any issuance of Common Shares may have a dilutive effect on existing Shareholders.
Risk Factors Relating to the Activities of Pembina and the Ownership of Securities
The following is a list of certain risk factors relating to the activities of Pembina and the ownership of its securities:
•the level of Pembina's indebtedness from time to time could impair Pembina's ability to obtain additional financing on a timely basis to take advantage of business opportunities that may arise, which may have an adverse effect on the value of Pembina's securities;
•the uncertainty of future dividend payments by Pembina and the level thereof, as Pembina's dividend practices and the funds available for the payment of dividends from time to time will be dependent upon, among other things, operating cash flow generated by Pembina and its subsidiaries, financial requirements for Pembina's operations, the execution of its growth strategy and the satisfaction of solvency tests imposed by the ABCA for the declaration and payment of dividends;
•Pembina may make future acquisitions or may enter into financings or other transactions involving the issuance of securities of Pembina which may be dilutive to the holders of Pembina's securities;
•the inability of Pembina to manage growth effectively, and realize the anticipated growth opportunities from acquisitions and new projects, could have an adverse impact on Pembina's business, operations and prospects, which may also have an adverse effect on the value of Pembina's securities; and
•the market value of the Common Shares may deteriorate materially if Pembina is unable to maintain its cash dividend practices or make cash dividends in the future.
Pembina Pipeline Corporation 2025 Annual Report 51
Market Value of Common Shares and Other Securities
Pembina cannot predict at what price the Common Shares, Class A Preferred Shares or other securities issued by Pembina will trade in the future. Common Shares, Class A Preferred Shares and other securities of Pembina will not necessarily trade at values determined solely by reference to the underlying value of Pembina's assets. One of the factors that may influence the market price of the Common Shares and the Class A Preferred Shares is the annual dividend yield of such securities. An increase in interest rates may lead holders and/or purchasers of Common Shares or Class A Preferred Shares to demand a higher annual dividend yield, which could adversely affect the market price of the Common Shares or Class A Preferred Shares. In addition, the market price for Common Shares, Class A Preferred Shares and other securities of Pembina may be affected by announcements of new developments, changes in Pembina's operating results, failure to meet analysts' expectations, changes in credit ratings, changes in general market conditions, fluctuations in the market for equity or debt securities and other factors beyond the control of Pembina. There can be no assurance that the market price of the Common Shares, Class A Preferred Shares and other securities of Pembina will not experience significant fluctuations in the future, including fluctuations that are unrelated to Pembina's performance. For these reasons, investors should not rely on past trends in the price of Common Shares, Class A Preferred Shares or other securities issued by Pembina to predict the future price of Common Shares or Class A Preferred Shares or Pembina's financial results.
Accordingly, holders are encouraged to obtain independent legal, tax and investment advice with respect to the holding of Common Shares or Class A Preferred Shares and other securities issued by Pembina.
General Risk Factors
Health and Safety
The operation of Pembina's business is subject to hazards of gathering, processing, transporting, fractionating, storing and marketing hydrocarbon products. Such hazards include, but are not limited to: blowouts; fires; explosions; gaseous leaks, including sour gas; migration of harmful substances; oil spills; corrosion; and acts of vandalism and terrorism. These hazards may interrupt operations, impact Pembina's reputation, cause loss of life or personal injury to the Company's workers or contractors, result in loss of or damage to equipment, property, information technology systems, related data and control systems or cause environmental damage that may include polluting water, land or air. Further, several of the Company's pipeline systems and related assets are operated in close proximity to populated areas and a major incident could result in injury or loss of life to members of the public. A public safety incident could also result in reputational damage to the Company, material repair costs or increased costs of operating and insuring Pembina's assets.
Cybersecurity
Pembina's technology infrastructure, technologies and data are becoming increasingly integrated. Such integration creates a risk that the failure of one system, including due to factors such as telecommunication failures, cyber-terrorism, security breaches and intentional or inadvertent user misuse or error, could lead to failure of other systems which may also have an impact on the Company's physical assets and its ability to safely operate such assets. Furthermore, Pembina and its third-party vendors collect and store sensitive data in the ordinary course of business, including personal identification information of employees as well as proprietary business information and that of the Company's customers, suppliers, investors and other stakeholders. Notable cybersecurity threats include unauthorized access to information technology systems due to hacking, viruses, cyber phishing attacks and other causes that can result in service disruptions, system failures and unauthorized access to confidential business information. Due to Pembina's high level of technological integration, such an attack on the information technology systems of one segment or asset of Pembina could have a material adverse effect on the broader business, operations or financial results of the Company.
52 Pembina Pipeline Corporation 2025 Annual Report
A breach in the security or failure of Pembina's information technology could result in operational outages, delays, damage to assets or the environment, reputational harm, increased vulnerability to fraud or extortion, lost profits, compromised or otherwise unusable internal systems, lost data and other adverse outcomes for which Pembina could be held liable, all of which could adversely affect Pembina's reputation, business, operations or financial results. As a result of a cyber-attack or security breach, Pembina could also be liable under laws that protect the privacy of personal information or subject to regulatory penalties.
As a result of the critical nature of energy infrastructure and Pembina's use of information systems and other digital technologies to control its assets, Pembina faces an increased risk of cyber-attacks. Cyber threat actors have attacked and threatened to attack energy infrastructure, and various government agencies have increasingly stressed that these attacks are targeting critical infrastructure, and are increasing in sophistication, magnitude, and frequency. New cybersecurity legislation, regulations and orders have been recently implemented or proposed resulting in additional actual and anticipated regulatory oversight and compliance requirements, which is expected to require significant internal and external resources. Pembina cannot predict the potential impact to its business of potential future legislation, regulations or orders relating to cybersecurity.
Furthermore, media reports about a cyber-attack or other significant security incident affecting the Company, whether accurate or not, or, under certain circumstances, Pembina's failure to make adequate or timely disclosures to the public, law enforcement, other regulatory agencies or affected individuals following any such event, whether due to delayed discovery or otherwise, could negatively impact its operating results and result in other negative consequences, including damage to Pembina's reputation or competitiveness, harm to its relationships with customers, partners, suppliers and other third parties, interruption to its management, remediation or increased protection costs, significant litigation or regulatory action, fines or penalties, all of which could materially adversely affect the Company's business, operations, reputation or financial results.
Artificial Intelligence
Pembina's infrastructure, technologies and data may integrate the use of artificial intelligence ("AI"), which presents certain risks, challenges and unintended consequences that could impact Pembina's business and operations. AI algorithms and training methodologies may be flawed, and dependence on AI for decision-making, without adequate safeguards, could introduce operational vulnerabilities by generating inaccurate outcomes or unintended results based on deficiencies in underlying data. The use of AI also carries inherent risks related to data privacy and cybersecurity, including the potential for intended or unintended transmission of proprietary or sensitive information. AI tools may rely on datasets that include content subject to license, copyright, trademark, patent or other intellectual property protections, raising potential compliance concerns. The legal and regulatory framework for AI remains uncertain and under development, with potential liability risks related to breaches of intellectual property or privacy rights. As new AI laws and regulations develop, Pembina's obligation to comply could result in significant costs, impact its business or limit the incorporation of certain AI capabilities into its operations.
Pembina Pipeline Corporation 2025 Annual Report 53
Additional Financing and Capital Resources
The timing and amount of Pembina's capital expenditures and contributions to equity accounted investees, and the ability of Pembina to repay or refinance existing debt as it becomes due, directly affects the amount of cash available for Pembina to pay dividends. Future acquisitions, expansions of Pembina's assets, other capital expenditures and the repayment or refinancing of existing debt as it becomes due may be financed from sources such as cash generated from operations, the issuance of additional Common Shares, Class A Preferred Shares or other securities (including debt securities) of Pembina and borrowings. Dividends may be reduced, or even eliminated, at times when significant capital or other expenditures are made. There can be no assurance that sufficient capital will be available on terms acceptable to Pembina, or at all, to make additional investments, fund future expansions or make other required capital expenditures. During periods of weakness in the global economy, and, in particular, the commodity-related industry sectors, Pembina may experience restricted access to capital and increased borrowing costs. The ability of Pembina to raise capital depends on, among other factors, the overall state of capital markets, Pembina's credit rating, investor demand for investments in the energy industry generally and demand for Pembina's securities specifically. To the extent that external sources of capital, including the proceeds from the issuance of additional Common Shares, Class A Preferred Shares or other securities or the availability of additional credit facilities, become limited or unavailable on acceptable terms, or at all, due to credit market conditions or otherwise, Pembina's ability to make the necessary capital investments to maintain or expand its operations, to repay outstanding debt or to invest in assets, as the case may be, may be impaired. To the extent Pembina is required to use operating cash flow to finance capital expenditures or acquisitions or to repay existing debt as it becomes due, the level of dividends payable may be reduced.
Counterparty Credit Risk
Counterparty credit risk represents the financial loss Pembina may experience if a counterparty to a financial instrument or commercial agreement fails to meet its contractual obligations to Pembina in accordance with the terms and conditions of such instruments or agreements with Pembina. Counterparty credit risk arises primarily from Pembina's trade and other receivables, finance lease receivables, advances to related parties and derivative financial instruments.
Pembina continues to closely monitor and reassess the creditworthiness of its counterparties, including financial institutions. Pembina may reduce or mitigate its exposure to certain counterparties where it is deemed warranted and permitted under contractual terms. Pembina manages counterparty credit risk through established credit management techniques, including conducting comprehensive financial and other assessments on all high exposure new counterparties. Pembina utilizes various sources of financial, credit and business information in assessing the creditworthiness of a counterparty, including external credit ratings, where available, and, in other cases, detailed financial statement analysis in order to generate an internal credit rating based on quantitative and qualitative factors. The establishment of counterparty exposure limits is governed by a Board-designated counterparty exposure limit matrix which represents the maximum dollar amounts of counterparty exposure by debt rating that can be approved for a particular counterparty. While Pembina takes active steps to monitor and manage its counterparty credit risk, its credit procedures and policies cannot completely eliminate counterparty credit risk and Pembina cannot predict to what extent Pembina's business would be impacted by deteriorating conditions in the economy, including possible declines in the creditworthiness of its customers, vendors or counterparties. Further, it is possible that payment or performance defaults from these parties, if significant, could adversely affect Pembina's earnings, cash flows and financial results.
Financial assurances from counterparties may include guarantees, letters of credit and cash. As at December 31, 2025, letters of credit totalling approximately $249 million (2024: $276 million) were held primarily in respect of customer trade receivables.
54 Pembina Pipeline Corporation 2025 Annual Report
Pembina has typically collected its receivables in full. As at December 31, 2025, approximately 98 percent (2024: 99 percent) of receivables were current. Pembina has a general lien and a continuing and first priority security interest in, and a secured charge on, all of a shipper's petroleum products in its custody. The risk of non-collection is considered to be low and no material impairment of trade and other receivables has been made as of the date hereof.
Pembina monitors and manages its concentration of counterparty credit risk on an ongoing basis. Pembina also evaluates counterparty risk from the perspective of future exposure with existing or new counterparties that support future capital expansion projects. Pembina believes these measures are prudent and allow for effective management of its counterparty credit risk but there is no certainty that they will protect Pembina against all material losses. As part of its ongoing operations, Pembina must balance its market and counterparty credit risks when making business decisions.
Debt Service
As at December 31, 2025, Pembina had exposure to floating interest rates on approximately $1,305 million (2024: $788 million) in debt. Pembina may enter into certain derivative financial instruments to manage the Company's exposure to floating interest rates.
Pembina and its subsidiaries are permitted to borrow funds to finance the purchase of pipelines and other energy infrastructure assets, to fund capital expenditures or other financial obligations or expenditures in respect of such assets and for working capital purposes. Amounts paid in respect of interest and principal on debt incurred in respect of those assets reduce the amount of cash flow available for dividends on the Common Shares and Class A Preferred Shares. Pembina is also required to meet certain financial covenants under the indentures governing its medium-term notes and the agreements governing the credit facilities, and is subject to customary restrictions on its operations and activities, including restrictions on the granting of security, incurring indebtedness and the sale of its assets.
The lenders under Pembina's credit facilities have been provided with guarantees and subordination agreements. If Pembina becomes unable to pay its debt service charges or otherwise commits an event of default, payments to the lenders under its credit facilities will rank in priority to dividends.
Although Pembina believes its existing credit facilities are sufficient for its immediate liquidity requirements, there can be no assurance that the amount available thereunder will be adequate for the future financial obligations of Pembina or that additional funds will be able to be obtained on terms acceptable to Pembina, or at all.
Credit Ratings
Rating agencies regularly evaluate Pembina and base their ratings of Pembina's long-term and short-term debt and Class A Preferred Shares on a number of factors. These factors include Pembina's financial strength as well as factors not entirely within Pembina's control, including conditions affecting the industry in which Pembina operates generally and the wider state of the economy. A credit rating downgrade could also limit Pembina’s access to debt and preferred share markets.
Pembina's borrowing costs and ability to raise funds are also directly impacted by its credit ratings. Credit ratings may also be important to suppliers or counterparties when they seek to engage in certain transactions with Pembina. A credit rating downgrade may impair Pembina's ability to enter into arrangements with suppliers or counterparties, engage in certain transactions, limit Pembina's access to private and public credit markets or increase the costs of borrowing under its existing credit facilities. There can be no assurance that one or more of Pembina's credit ratings will not be downgraded.
Pembina Pipeline Corporation 2025 Annual Report 55
Reliance on Management, Key Individuals and a Skilled Workforce
Pembina is dependent on senior management and directors of the Company in respect of the governance, administration and management of all matters relating to Pembina and its operations and administration. The loss of the services of key individuals could have a detrimental effect on Pembina and the Company might not be able to find replacements on a timely basis or with the same level of skill and experience. In addition, Pembina's operations require the retention and recruitment of a skilled workforce, including engineers, technical personnel and other professionals. Pembina competes with other companies in the energy industry for this skilled workforce. If the Company is unable to retain current employees and/or recruit new employees of comparable skill, knowledge and experience, Pembina's business and operations could be negatively impacted. The costs associated with retaining and recruiting key individuals and a skilled workforce could adversely affect Pembina's business opportunities and financial results and there is no assurance that Pembina will continue to attract and retain all personnel necessary for the development and operation of its business.
Indigenous Land Claims and Consultation Obligations
Indigenous people have claimed title and rights to a considerable portion of the lands in western Canada. The successful assertion of Indigenous title or other Indigenous rights claims may have an adverse effect on western Canadian crude oil and natural gas production or oil sands development and may result in reduced demand for Pembina's assets and infrastructure that service those areas, which could have a material adverse effect on Pembina's business and operations.
In Canada, the federal and provincial governments (the "Crown") have a duty to consult and, when appropriate, accommodate Indigenous peoples when the interests of the Indigenous peoples may be affected by a Crown action or decision. Crown actions include the decision to issue a regulatory approval relating to activities that may impact Indigenous rights, interests or lands. The Crown may rely on steps undertaken by a regulatory agency to fulfill its duty to consult and accommodate in whole or in part. Therefore, the processes established by regulatory bodies, such as the AER, the BCER, the BCEAO and the CER, often include an assessment of Indigenous rights claims and consultation obligations. While the Crown holds ultimate responsibility for ensuring consultation is adequate, this issue is often a major aspect of regulatory permitting processes. If a regulatory body, or the Crown itself, determines that the duty to consult has not been appropriately discharged relative to the issuance of regulatory approvals required by Pembina, the issuance of such approvals may be delayed or denied, thereby impacting Pembina's Canadian operations.
As described in "Regulation and Legislation" above, the CER Act, IAA, and associated amendments to the Fisheries Act (Canada) and the Canadian Navigable Waters Act (Canada) replaced previously applicable regimes in 2019. A number of the federal regulatory process amendments pertained to the participation of Indigenous groups and the protection of Indigenous and treaty rights. The now-current legislation generally codifies existing law and practice with respect to these matters. For example, decision makers are now expressly required to consider the effects (positive or negative) of a proposed project on constitutionally-protected Indigenous rights, as well as Indigenous peoples themselves, and ensure that consultation is undertaken during the planning phase of impact assessment processes. The legislation also creates a larger role for Indigenous governing bodies in the impact assessment process (enabling the delegation of certain aspects of the impact assessment process to such groups) and requires decision makers to consider Indigenous traditional knowledge in certain cases.
56 Pembina Pipeline Corporation 2025 Annual Report
The federal government is advancing recognition of Indigenous rights across Canada. As part of these efforts, the federal government enacted the United Nations Declaration on the Rights of Indigenous Peoples Act ("UNDRIP") on June 21, 2021, with the purpose of affirming the application of the UNDRIP in Canadian law. The federal government published its UNDRIP Action Plan on June 21, 2023, which is comprised of 181 guiding measures spanning the 2023-2028 period. Until 2025, courts had not determined whether UNDRIP creates new substantive rights that might impact development activities, such as those of Pembina or its customers. However, on February 19, 2025, the Federal Court of Canada in Kebaowek First Nation v. Canadian Nuclear Laboratories, 2025 FC 319 determined that UNDRIP must guide the Crown's analysis of the scope of the duty to consult and accommodate. According to the Federal Court, the Crown must interpret the duty to consult through the more rigorous informed, prior and free consent standard set out in UNDRIP, which operates as an added “layer” to existing constitutional obligations. In its decision, the Federal Court acknowledged the importance of this decision as one of the first to test Canada’s commitments to implement the principles set out in UNDRIP and decide how these principles can aid the interpretation of Canadian law. In May 2025, the Crown appealed this decision to the Federal Court of Appeal. The Federal Court has not issued a decision on the appeal.
Structurally similar legislation to UNDRIP, the Declaration on the Rights of Indigenous Peoples Act ("DRIPA"), was enacted by British Columbia in 2019. The DRIPA is just one piece of the Government of British Columbia's strategy to include greater First Nation involvement in regulatory decision-making. The recognition of Indigenous rights is also facilitated by the renewed British Columbia Environmental Assessment Act (the "EA Act") that came into force in late 2019. The EA Act is designed as a "consent-based" environmental assessment model and is intended to support reconciliation with Indigenous peoples and the implementation of the UNDRIP. The legislation requires the BCEAO to seek participating Indigenous groups' consent with respect to, among other things, the decision to issue an environmental assessment certificate to a given project. While the EA Act does not strictly require consent in most cases, the legislation creates significant participation opportunities for Indigenous groups during environmental assessments. Furthermore, the Government of British Columbia is beginning to explore bilateral "Consent Decision-Making Agreements" under the DRIPA which require First Nation consent for certain resource development projects, including having completed two of such agreements since June 6, 2022. These developments may increase the time required to obtain regulatory approvals or the risk of such approvals and thereby impact Pembina's operations in British Columbia.
Pembina continues to actively monitor the development of the regulations required to facilitate the implementation of the UNDRIP Act, DRIPA, EA Act and the impact that other federal and provincial government initiatives on Indigenous rights may have on its business.
In addition, Pembina is monitoring the impact of judgments of the Supreme Court of British Columbia with respect to First Nation claims as well as similar developments in Alberta, including the judgment in favour of the Blueberry River First Nation ("BRFN") against the Province of British Columbia relating to the cumulative impact of industrial development within the BRFN treaty area, the judgment in favour of Saik'uz First Nation and Stellat'en First Nation in nuisance against the Crown and private company Rio Tinto Alcan Inc., and the judgment in favour of the Gitxaala Nation and Ehattesahet First Nation requiring consultation prior to staking mineral claims. Pembina is also monitoring the appeal proposed by British Columbia, the City of Richmond and the Musqueam First Nation of the September 2025 decision of the Supreme Court of British Columbia that determined that the Crown had unjustifiably infringed the Cowichan Nation’s Aboriginal title by issuing fee simple land grants to third parties.
Pembina Pipeline Corporation 2025 Annual Report 57
These judgments have contributed and may further contribute to the acceleration of the Government of British Columbia's imposition of additional requirements to obtain regulatory approvals for developing pipelines or associated facilities, and in some instances restrictions on those approvals, and could cause delays, suspensions, or deferrals in the development of such facilities. The recent judgments may also impact the current and future activities of producers operating in British Columbia and cause them to decrease production, which could, in turn, reduce such producers' demand for Pembina's existing pipeline capacity and processing assets, and may have an adverse effect on Pembina's business. On January 18, 2023, the Government of British Columbia and BRFN announced that they had entered into the Blueberry River First Nations Implementation Agreement in response to the BRFN decision. The agreement creates a framework for how resource development may continue within the BRFN claim area, which includes, among other things, limiting new surface disturbances from oil and gas development in BRFN's claim area to 750 hectares per year while a long-term cumulative effects management regime is developed and implemented. The Government of British Columbia has also reached interim agreements with four other Treaty 8 First Nations which commit to a similar development of a revised approach to environmental assessment in their territories. Duncan's First Nation in Alberta has also filed a claim similar to that of BRFN regarding cumulative impacts in Northwestern Alberta. Pembina continues to actively monitor regulatory developments relating to Indigenous claims in British Columbia and Alberta; however, Pembina cannot predict future regulatory changes that may arise to address the Court's decisions in these or future cases and any such regulatory changes could impact the operations of Pembina and Pembina's customers.
Potential Conflicts of Interest
Shareholders and other securityholders of Pembina are dependent on senior management and the directors of Pembina for the governance, administration and management of Pembina. Certain directors and officers of Pembina may be directors or officers of entities in competition to Pembina or may be directors or officers of certain entities in which Pembina holds an equity investment in. As such, certain directors or officers of Pembina may encounter conflicts of interest in the administration of their duties with respect to Pembina. Pembina mitigates this risk by requiring directors and officers to disclose the existence of potential conflicts in accordance with Pembina's Code of Ethics Policy and in accordance with the ABCA.
Litigation
In the course of their business, Pembina and its various subsidiaries and affiliates may be subject to lawsuits and other claims, including with respect to Pembina's growth or expansion projects. In recent years, there has been an increase in climate and disclosure-related litigation against governments as well as companies involved in the energy industry and there is no assurance that Pembina will not be impacted by such litigation, or by other legal proceedings. Defence and settlement costs associated with such lawsuits and claims may be substantial, even with respect to lawsuits and claims that have no merit. Due to the inherent uncertainty of the litigation process, the resolution of any particular legal or other proceeding may have a material adverse effect on the financial position or operating results of Pembina.
Changes in Tax Legislation
Tax legislation that Pembina is subject to may be amended (or the interpretation of such legislation may change), retroactively or prospectively, resulting in tax consequences that materially differ from those contemplated by Pembina in the jurisdictions in which Pembina has operations, which may create a risk of non-compliance and re-assessment. While Pembina believes that its tax filing positions are appropriate and supportable, it is possible that governing tax authorities may: (i) amend tax legislation (or its interpretation of such legislation may change), or (ii) successfully challenge Pembina's interpretation of tax legislation, either of which could expose Pembina to additional tax liabilities and may affect Pembina's estimate of current and future income taxes and could have an adverse effect on the financial condition and prospects of Pembina and the distributable cash flow available to pay dividends and to service obligations under Pembina's debt securities and other debt obligations.
58 Pembina Pipeline Corporation 2025 Annual Report
Foreign Exchange Risk
Pembina's cash flows, including a portion of its commodity-related cash flows and certain cash flows from U.S.-based infrastructure assets, are subject to currency risk, arising from the denomination of specific cash flows in U.S. dollars. Additionally, a portion of Pembina's capital expenditures, and contributions or loans to Pembina's U.S.-based investments in equity accounted investees, may be denominated in U.S. dollars. Pembina monitors, assesses and responds to these foreign currency risks using an active risk management program, which may include the exchange of foreign currency for domestic currency at a fixed rate.
Political Uncertainty
Political and social events and decisions made in Canada, the U.S. and elsewhere, including changes to federal, provincial, state or municipal governments in Canada and the U.S., may create future uncertainty on international and national financial and economic markets. This uncertainty may impact the energy industry in Canada and may have an adverse effect on Pembina's business and financial results.
A Canadian federal election occurred in 2025. Canadians returned the governing Liberal Party of Canada to power as a minority government, but under a new Prime Minister. The new government has announced its intention to transform Canada into an "energy superpower," including through the expansion of oil and gas production and exports. Following the election, the government introduced legislation to officially repeal the federal consumer-based carbon tax and announced plans to modify the federal industrial OBPS regime. It is unclear whether regulations proposed, but not yet enacted, under the previous government, such as the oil and gas emissions cap regulation, will take effect. Pembina continues to monitor changes to the federal government's climate change policy and how such changes will impact Pembina’s business activities. For example, the federal government stated in November 2025 that it will not implement the oil and gas emissions cap in consideration for the mutual commitments agreed to in the Canada/Alberta MOU.
Policy changes at the provincial level are also a source of uncertainty. For example, the Government of Alberta introduced various legislative changes pertaining to the generation and transmission of electricity in 2024 and has indicated additional changes are forthcoming. Such changes have created uncertainty with respect to the pace and requirements of future renewables development in Alberta, which could impact renewables projects that Pembina's customers or partners have under development, which might in turn impact, among other things, progress on GHG emissions reduction efforts. Pembina continues to evaluate the impact of any potential changes on its business and to monitor new developments.
Tariffs and Trade Policies
Pembina's business could be adversely affected by the imposition of new tariffs or changes to existing tariffs and export or import restrictions. A significant portion of Pembina's revenue is derived from the transportation, processing and marketing of hydrocarbons produced in Canada, and many of Pembina's Canadian customers rely on access, through Pembina's and third party pipelines and facilities, to U.S. markets for the sale of their products. In addition, although a significant portion of Pembina's assets and operations are located in Canada, Pembina also owns and operates assets in the United States. Further, Pembina's Marketing business markets products to customers in both the U.S. and to customers in Canada.
Accordingly, the introduction of new trade policies or barriers, including the imposition of new tariffs, duties or other trade restrictions on Canadian hydrocarbon products exported to the U.S., or the imposition of new or retaliatory tariffs, duties or trade restrictions on hydrocarbon products imported into Canada from the U.S., could result in a decrease in, or increase the volatility of, commodity prices and/or price differentials which could, in turn, reduce the demand for Pembina's services and have an adverse effect on Pembina's business, financial condition and results of operations.
Pembina Pipeline Corporation 2025 Annual Report 59
Tariffs imposed by the Canada and U.S. governments on energy exports varied throughout 2025. On March 4, 2025, the U.S. announced a 10 percent tariff on oil and gas imports from Canada. However, a few days later, the U.S. implemented a tariff exemption for all energy imports from Canada that are compliant with the Canada-United States-Mexico Agreement ("CUSMA"). On August 1, 2025, the U.S. increased the tariff on imports from Canada that are not compliant with the CUSMA to 35 percent. Canada did not include energy imports from the U.S. as part of its counter tariff measures. In 2026, Canada, the U.S. and Mexico are scheduled to review the CUSMA pursuant to its five-year review provision. Pembina continues to monitor developments in Canada-U.S. trade relations closely. However, the Company cannot predict the full impact that changing government policies, legislation or trade disputes may have on its business, financial condition and results of operations.
Risks Relating to Breach of Confidentiality
Pembina regularly enters into confidentiality agreements with third parties prior to the disclosure of any confidential information when discussing potential business relationships or other transactions. Breaches of confidentiality could subject Pembina to competitive risk and may cause significant damage to its business. There is no assurance that, in the event of a breach of confidentiality, Pembina will be able to obtain equitable remedies from a court of competent jurisdiction in a timely manner, if at all, in order to prevent or mitigate any damage to its business that such a breach of confidentiality may cause.
Concentration of Assets in the Western Canadian Sedimentary Basin
The majority of Pembina's assets are concentrated in the WCSB, which leaves the Company exposed to the economic conditions of that area. Pembina mitigates this risk through a diversity of business activities within the area and by owning and operating assets in the U.S.
Impacts of Geopolitical Events
While Pembina's operations, based solely in North America, have not been directly impacted to date, global or international geopolitical events such as armed conflict and political instability, including political uncertainty in certain South American countries, the ongoing conflicts in the Middle East and between Ukraine and Russia, and international responses thereto, may have potential wide-ranging consequences for global market volatility and economic conditions, including energy and commodity prices, which may, in turn, increase inflationary pressures and interest rates. The short-, medium- and long-term implications of any such geopolitical events, including potential direct and indirect impacts on Pembina which could have a material and adverse effect on Pembina's business, financial condition and results of operations, are difficult to predict with any certainty. Depending on their extent, duration, and severity, such geopolitical events may have the effect of heightening many of the other risks described herein, including, without limitation, the risks relating to Pembina's exposure to commodity prices; the successful completion of Pembina's growth and expansion projects, including the expected return on investment thereof; supply chains and Pembina's ability to obtain required equipment, materials or labour; cybersecurity risks; inflationary pressures; and restricted access to capital and increased borrowing costs as a result of increased interest rates.
Modern Slavery Act
In 2024, the Fighting Against Forced Labour and Child Labour in Supply Chain Act came into force in Canada. Pursuant to the legislation, any company that is subject to reporting requirements, including Pembina, is required to conduct certain due diligence on its supply chains and to file an annual report accordingly. While Pembina is currently unaware of any forced or child labour in any of its supply chains, the increased scrutiny on the supply chains of Canadian companies could uncover the risk or existence of forced or child labour in a supply chain to which Pembina has a connection, which could negatively impact Pembina's reputation. In 2026, Pembina will be submitting its third report.
60 Pembina Pipeline Corporation 2025 Annual Report
Internal Controls
Effective internal controls are necessary for Pembina to provide reliable financial reports, manage its risk exposure and help prevent fraud. Although Pembina undertakes numerous procedures to help ensure the reliability of its financial reports, including those imposed by Canadian and U.S. securities laws, Pembina cannot be certain that such measures will ensure that it will maintain adequate control over financial processes and reporting. If Pembina or its independent auditors discover a material weakness, the disclosure of that fact, even if quickly remedied, could reduce the market's confidence in Pembina and its financial statements and negatively impact the trading price of the Common Shares or Class A Preferred Shares.
Risks Related to Climate Change
Risks Relating to Changing Investor Sentiment in the Oil and Gas Industry
A number of factors, including the concerns of the effects of the use of fossil fuels on climate change, concerns of the impact of oil and gas operations on the environment, concerns of environmental damage relating to spills of petroleum products during transportation and concerns of Indigenous rights, have affected certain investors' sentiments towards investing in the oil and gas industry. As a result of these concerns, some investors have announced that they are no longer willing to fund or invest in oil and gas properties or companies and/or are reducing the amount of such investments over time. Additionally, companies across all sectors have been subjected to a heightened level of awareness and scrutiny from institutional, retail and public investors with respect to their ESG practices and, as such, issuers are increasingly being required to develop and implement more robust ESG policies, practices and disclosures. Developing and implementing such policies and practices and preparing such disclosures can involve significant costs and require a significant time commitment from the Board of Directors, management and employees. Failure to implement the policies and practices expected by investors may result in such investors reducing their investment in Pembina or not investing in Pembina at all. Any reduction in the investor base interested or willing to invest in the oil and gas industry and, more specifically, Pembina may result in limits on Pembina's ability to access capital, increases to the cost of capital, a downgrade in Pembina's credit ratings and outlooks, and a decrease in the price and liquidity of Pembina's securities even if Pembina's operating results, underlying asset values or prospects have not changed.
In May 2025, Pembina published its 2024 Sustainability Report which highlights certain of Pembina's ESG policies and practices, including, but not limited to, energy transition and climate, employee well-being and culture, health and safety, responsible asset management and Indigenous and community engagement. However, certain investors of Pembina may not be satisfied with the degree and/or speed at which Pembina is implementing and bolstering its ESG policies and practices. If Pembina is unable to meet such investors' expectations, Pembina's business, as well as its reputation, could be adversely affected. Additionally, Pembina may be subject to increased potential liability in connection with its ESG-related disclosures pursuant to legislation restricting "greenwashing", including the interpretation of any such legislation. See "Risk Factors – Risks Inherent to Pembina's Business – Regulation and Legislation".
Energy Market Transition
Changing consumer preferences, new technologies, government regulation or other external factors may lead to an acceleration away from fossil-based sources of energy, including energy derived from crude oil and natural gas, to renewable and other alternative sources of energy. This may lead to lower global demand for crude oil and natural gas and related commodities and, in turn, may lead to lower prices for crude oil, natural gas and NGL and related commodities. This could negatively impact the Company's producing customers and lead to less demand for Pembina's services, which could negatively impact the revenue the Company receives from, and the value of, its pipelines, facilities and other infrastructure assets, the useful life of those assets and accelerate the timing of decommissioning.
Pembina Pipeline Corporation 2025 Annual Report 61
In addition, Pembina may invest in opportunities related to an energy transition, which may involve investments in businesses, operations or assets relating to renewable or other alternative forms of energy. Such investments may involve certain risks and uncertainties in addition to those identified herein in respect of Pembina's existing businesses, operations and assets, including the obligation to comply with additional regulatory and other legal requirements associated with such businesses, operations or assets and the potential requirement for additional sources of capital to make, develop and/or maintain such investments and Pembina's ability to access such sources of capital. In the event Pembina were to complete such investments, there can be no guarantee that Pembina will realize a return on those investments or businesses, operations or assets that is similar to the returns it receives in respect of its existing business, operations and assets or that would offset any loss in revenue from, or the value of, the Company's existing pipeline, facilities and other infrastructure assets resulting from the impact of the potential energy transition. As a result, any such investment could reduce the level of cash available for dividends and to service obligations under Pembina's debt securities and other debt obligations and may also negatively impact the trading price of Pembina's securities.
Greenhouse Gas Emissions and Targets
Among other sustainability goals, Pembina has committed to reducing GHG emissions intensity of its operations by 30 percent by 2030 (based on a 2019 baseline year). The Company's ability to lower GHG emissions in respect of its 2030 emissions intensity reduction target is subject to numerous risks and uncertainties, and Pembina's actions taken to implement these objectives may also expose the Company to certain additional and/or heightened financial and operational risks. A reduction in GHG emissions intensity relies on, among other things, Pembina's ability to implement and improve energy efficiency at all facilities, future development and growth opportunities, development and deployment of new technologies, investment in lower-carbon power and transition to greater use of renewable and lower emission energy sources. In the event that the Company is unable to implement these strategies and technologies as planned without negatively impacting its expected operations or business plans, or in the event that such strategies or technologies do not perform as expected, the Company may be unable to meet its GHG emissions intensity reduction targets or goals on the current timelines, or at all.
Other risks and uncertainties that may impact the Company's ability to lower GHG emissions in respect of its 2030 emissions intensity reduction target include customer contracts and regulatory uncertainty. Emissions reduction projects are not developed in isolation of the long-term contracts underpinning Pembina’s commercial structure. Many capital expenditures require approvals or participation from customers, sometimes subject to stringent pay-back requirements. For Pembina, advancing credible emissions reduction projects requires commercial engagement and customer support, adding complexity and risk to its decarbonization planning. In addition, the Company continues to monitor evolving climate change policies and carbon pricing regulations across the jurisdictions in which we operate. Emerging and duplicative regulations, permitting ambiguity, and slow-moving or restrictive incentive programs can negatively impact the pace and scale of decarbonization investment, creating a competitive disadvantage for Canadian projects relative to jurisdictions with established incentive programs. Government action to create efficient regulation and maximize value of clean growth incentives will be critical to the success of the energy transition in Canada and a balanced, responsible, and competitive regulatory regime is required to support investment in decarbonization, particularly for new and emerging clean growth industries. Certainty of carbon policies and incentives impact the return profile and competitiveness of decarbonization projects and can vary significantly. Lack of certainty brings additional complexity to the evaluation of decarbonization opportunities.
In addition, achieving the Company's GHG emissions intensity reductions target and goals could require significant capital expenditures and resources, with the potential that the costs required to achieve such target and goals materially differ from Pembina's original estimates and expectations. In addition, while the intent is to improve efficiency and increase the use of renewable and lower-carbon energy, the shift in resources and focus towards GHG emissions reduction could have a negative impact on Pembina's operating results. The overall final cost of investing in and implementing a GHG emissions intensity reduction strategy and technologies in furtherance of such strategy, and the resultant change in the deployment of the Company's resources and focus, could have a material adverse effect on Pembina's business, financial condition and results of operations.
62 Pembina Pipeline Corporation 2025 Annual Report
Risks Relating to Weather Conditions
Weather conditions (including those associated with climate change) can affect the demand for and price of natural gas and NGL. As a result, changes in weather patterns may affect Pembina's gas processing business. For example, colder winter temperatures generally increase demand for natural gas and NGL used for heating which tends to result in increased throughput volume on the Alliance Pipeline and at the Company's gas processing facilities and higher prices in the processing and storage businesses. Pembina has capacity to handle any such increased volume of throughput and storage at its facilities to meet changes in seasonal demand; however, at any given time, processing and storage capacity is finite.
Weather conditions (including those associated with climate change) may impact Pembina's ability to complete capital projects, repairs or facility turnarounds on time, potentially resulting in delays and increased costs. Weather may also affect access to Pembina's facilities, and the operations and projects of Pembina's customers or shippers, which may impact the supply and/or demand for Pembina's services. With respect to construction activities, in areas where construction can be conducted in non-winter months, Pembina attempts to schedule its construction timetables so as to minimize potential delays due to cold winter weather.
Changes and/or extreme variability in weather patterns, including with respect to the impact on the geophysical environment, as well as increases in the frequency of extreme weather events, such as floods, cyclones, hurricanes, droughts and forest fires, increases the potential risk for Pembina's assets, including operational disruptions, transportation difficulties, supply chain disruptions, employee safety incidents, and damage to assets, which may result in lower revenues, higher costs or project delays.
See also "Risk Factors – Risks Inherent in Pembina's Business – Environmental Costs and Liabilities"; and "Risk Factors – Risks Inherent in Pembina's Business – Reputation".
Pembina Pipeline Corporation 2025 Annual Report 63
12. NON-GAAP & OTHER FINANCIAL MEASURES
Throughout this MD&A, Pembina has disclosed certain financial measures and ratios that are not specified, defined or determined in accordance with GAAP and which are not disclosed in Pembina's financial statements. Non-GAAP financial measures either exclude an amount that is included in, or include an amount that is excluded from, the composition of the most directly comparable financial measure specified, defined and determined in accordance with GAAP. These non-GAAP financial measures and non-GAAP ratios, together with financial measures and ratios specified, defined and determined in accordance with GAAP, are used by management to evaluate the performance and cash flows of Pembina and its businesses and to provide additional useful information respecting Pembina's financial performance and cash flows to investors and analysts.
In this MD&A, Pembina has disclosed the following non-GAAP financial measures and non-GAAP ratios: net revenue, earnings before interest, taxes, depreciation, and amortization ("adjusted EBITDA"), adjusted EBITDA per common share, adjusted EBITDA from equity accounted investees, adjusted cash flow from operating activities and adjusted cash flow from operating activities per common share.
Non-GAAP financial measures and non-GAAP ratios disclosed in this MD&A do not have any standardized meaning under IFRS and may not be comparable to similar financial measures disclosed by other issuers. The financial measures and ratios should not, therefore, be considered in isolation or as a substitute for, or superior to, measures and ratios of Pembina's financial performance, or cash flows specified, defined or determined in accordance with IFRS, including revenue, earnings, share of profit from equity accounted investees and cash flow from operating activities.
Except as otherwise described herein, these non-GAAP financial measures and non-GAAP ratios are calculated on a consistent basis from period to period. Specific reconciling items may only be relevant in certain periods.
Below is a description of each non-GAAP financial measure and non-GAAP ratio disclosed in this MD&A, together with, as applicable, disclosure of: the most directly comparable financial measure that is specified, defined and determined in accordance with GAAP to which each non-GAAP financial measure relates; a quantitative reconciliation of each non-GAAP financial measure to such directly comparable GAAP financial measure; the composition of each non-GAAP financial measure and non-GAAP ratio; an explanation of how each non-GAAP financial measure and non-GAAP ratio provides useful information to investors and the additional purposes, if any, for which management uses each non-GAAP financial measure and non-GAAP ratio; and an explanation of the reason for any change in the label or composition of each non-GAAP financial measure and non-GAAP ratio from what was previously disclosed.
64 Pembina Pipeline Corporation 2025 Annual Report
Net Revenue
Net revenue is a non-GAAP financial measure which is defined as total revenue less cost of goods sold. Management believes that net revenue provides investors with a single measure to indicate the margin on sales before non-product operating expenses that is comparable between periods. Management utilizes net revenue to compare consecutive results, to aggregate revenue generated by each of the Company's divisions and to set comparable objectives. The most directly comparable financial measure to net revenue that is specified, defined and determined in accordance with GAAP and disclosed in Pembina's financial statements is revenue.
| | | | | | | | | | | | | | | | | | | | | | | | | | | | | | | | |
| 3 Months Ended December 31 | Pipelines | Facilities | Marketing &
New Ventures | Corporate &
Inter-segment Eliminations | Total |
| ($ millions) |
| 2025 | 2024 | 2025 | 2024 | 2025 | 2024 | 2025 | 2024 | 2025 | 2024 |
| Revenue | 871 | | 948 | | 326 | | 320 | | 985 | | 1,133 | | (269) | | (256) | | 1,913 | | 2,145 | |
Cost of goods sold | 14 | | 5 | | — | | — | | 927 | | 919 | | (167) | | (162) | | 774 | | 762 | |
| Net revenue | 857 | | 943 | | 326 | | 320 | | 58 | | 214 | | (102) | | (94) | | 1,139 | | 1,383 | |
| | | | | | | | | | | | | | | | | | | | | | | | | | | | | | | | |
| 12 Months Ended December 31 | Pipelines | Facilities | Marketing &
New Ventures | Corporate &
Inter-segment Eliminations | Total |
| ($ millions) |
| 2025 | 2024 | 2025 | 2024 | 2025 | 2024 | 2025 | 2024 | 2025 | 2024 |
| Revenue | 3,521 | | 3,386 | | 1,228 | | 1,127 | | 4,065 | | 3,796 | | (1,036) | | (925) | | 7,778 | | 7,384 | |
Cost of goods sold | 51 | | 40 | | — | | — | | 3,524 | | 3,198 | | (674) | | (630) | | 2,901 | | 2,608 | |
| Net revenue | 3,470 | | 3,346 | | 1,228 | | 1,127 | | 541 | | 598 | | (362) | | (295) | | 4,877 | | 4,776 | |
Adjusted EBITDA and Adjusted EBITDA per Common Share
Adjusted EBITDA is a non-GAAP financial measure and is calculated as earnings before net finance costs, income taxes, depreciation and amortization (included in gross profit and general and administrative expense), and unrealized gains or losses from derivative instruments. The exclusion of unrealized gains or losses from derivative instruments eliminates the non-cash impact of such gains or losses.
Adjusted EBITDA also includes adjustments to earnings for non-controlling interest, losses (gains) on disposal of assets, transaction costs incurred in respect of acquisitions, dispositions and restructuring, impairment charges or reversals in respect of goodwill, intangible assets, investments in equity accounted investees and property, plant and equipment, certain non-cash provisions and other amounts not reflective of ongoing operations. These additional adjustments are made to exclude various non-cash and other items that are not reflective of ongoing operations. Following completion of Pembina acquiring a controlling ownership interest in Alliance and Aux Sable on April 1, 2024, Pembina revised the definition of adjusted EBITDA to deduct earnings for the 14.6 percent non-controlling interest in the Aux Sable U.S. operations. Pembina's subsequent acquisition of the remaining interest in Aux Sable's U.S. operations in the third quarter of 2024 resulted in all of Aux Sable's results being included in the adjusted EBITDA calculation beginning on August 1, 2024.
Management believes that adjusted EBITDA provides useful information to investors as it is an important indicator of Pembina's ability to generate liquidity through cash flow from operating activities and equity accounted investees. Management also believes that adjusted EBITDA provides an indicator of operating income generated from capital expenditures, which includes operational finance income and gains from lessor lease arrangements. Adjusted EBITDA is also used by investors and analysts for assessing financial performance and for the purpose of valuing Pembina, including calculating financial and leverage ratios. Management utilizes adjusted EBITDA to set objectives and as a key performance indicator of the Company's success. Pembina presents adjusted EBITDA as management believes it is a measure frequently used by analysts, investors and other stakeholders in evaluating the Company's financial performance. The most directly comparable financial measure to adjusted EBITDA that is specified, defined and determined in accordance with GAAP and disclosed in Pembina's financial statements is earnings.
Adjusted EBITDA per common share is a non-GAAP ratio which is calculated by dividing adjusted EBITDA by the weighted average number of common shares outstanding.
Pembina Pipeline Corporation 2025 Annual Report 65
| | | | | | | | | | | | | | | | | | | | | | | | | | | | | | | | | | | | | | | | | |
| 3 Months Ended December 31 | Pipelines | Facilities | Marketing &
New Ventures | Corporate &
Inter-segment Eliminations | Income Taxes | Total | | | |
| ($ millions, except per share amounts) | | | |
| 2025 | | 2024 | | 2025 | | 2024 | | 2025 | | 2024 | | 2025 | | 2024 | | 2025 | | 2024 | | 2025 | | 2024 | | | | |
| | | | | | | | | | | | | | | |
Earnings (loss) | 470 | | 534 | | 178 | | 177 | | 115 | | 245 | | (126) | | (212) | | (148) | | (172) | | 489 | | 572 | | | | |
| | | | | | | | | | | | | | | |
| Adjustments for: | | | | | | | | | | | | | | | |
| Income tax expense | | | | | | | | | 148 | | 172 | | 148 | | 172 | | | | |
| Adjustments to share of profit (loss) from equity accounted investees | — | | — | | 126 | | 136 | | (97) | | (74) | | — | | — | | | | 29 | | 62 | | | | |
| Net finance costs | 8 | | 5 | | 4 | | 2 | | 1 | | 5 | | 135 | | 151 | | | | 148 | | 163 | | | | |
| Depreciation and amortization | 164 | | 148 | | 57 | | 55 | | 18 | | 17 | | 17 | | 15 | | | | 256 | | 235 | | | | |
Unrealized loss from derivative instruments | — | | — | | — | | — | | 78 | | 41 | | — | | — | | | | 78 | | 41 | | | | |
| | | | | | | | | | | | | | | |
| | | | | | | | | | | | | | | |
| | | | | | | | | | | | | | | |
| Transaction and integration costs in respect of acquisitions | — | | — | | — | | — | | — | | — | | — | | 7 | | | | — | | 7 | | | | |
| Restructuring costs | — | | — | | — | | — | | — | | — | | 15 | | — | | | | 15 | | — | | | | |
| (Gain) loss on disposal of assets | — | | (1) | | — | | — | | 1 | | — | | (96) | | — | | | | (95) | | (1) | | | | |
| Other non-cash provisions | 1 | | — | | 1 | | 3 | | — | | — | | 5 | | — | | | | 7 | | 3 | | | | |
| Adjusted EBITDA | 643 | | 686 | | 366 | | 373 | | 116 | | 234 | | (50) | | (39) | | — | | — | | 1,075 | | 1,254 | | | | |
Adjusted EBITDA per common share – basic (dollars) | | | | | | | | | | | 1.85 | 2.16 | | | |
| | | | | | | | | | | | | | | | | | | | | | | | | | | | | | | | | | | | | | |
| 12 Months Ended December 31 | Pipelines | Facilities | Marketing &
New Ventures | Corporate &
Inter-segment Eliminations | Income Taxes | Total |
| ($ millions, except per share amounts) |
| 2025 | | 2024 | | 2025 | | 2024 | | 2025 | | 2024 | | 2025 | | 2024 | | 2025 | | 2024 | | 2025 | | 2024 | |
| | | | | | | | | | | | |
| Earnings (loss) | 1,938 | | 1,907 | | 562 | | 666 | | 457 | | 569 | | (750) | | (1,422) | | (513) | | 154 | | 1,694 | | 1,874 | |
| | | | | | | | | | | | |
| Adjustments for: | | | | | | | | | | | | |
| Income tax expense (recovery) | | | | | | | | | 513 | | (154) | | 513 | | (154) | |
| Adjustments to share of profit (loss) from equity accounted investees | 3 | | 46 | | 610 | | 486 | | (78) | | (16) | | — | | — | | | | 535 | | 516 | |
| Net finance costs | 27 | | 24 | | 13 | | 10 | | 8 | | 9 | | 554 | | 518 | | | | 602 | | 561 | |
| Depreciation and amortization | 643 | | 560 | | 209 | | 183 | | 71 | | 64 | | 64 | | 55 | | | | 987 | | 862 | |
| Unrealized (gain) loss from derivative instruments | — | | — | | — | | — | | 37 | | 170 | | — | | — | | | | 37 | | 170 | |
| Loss on acquisition | — | | — | | — | | — | | — | | — | | — | | 616 | | | | — | | 616 | |
| Derecognition of insurance contract provision | — | | — | | — | | — | | — | | (34) | | — | | — | | | | — | | (34) | |
| Transaction and integration costs in respect of acquisition | — | | — | | — | | — | | — | | — | | 5 | | 25 | | | | 5 | | 25 | |
| Restructuring costs | — | | — | | — | | — | | — | | — | | 15 | | — | | | | 15 | | — | |
Non-controlling interest(1) | — | | — | | — | | — | | — | | (12) | | — | | — | | | | — | | (12) | |
| (Gain) loss on disposal of assets | (18) | | (13) | | — | | (1) | | 1 | | (7) | | (96) | | — | | | | (113) | | (21) | |
| Other non-cash provisions | 3 | | 9 | | 2 | | 3 | | 3 | | (19) | | 6 | | 12 | | | | 14 | | 5 | |
| Adjusted EBITDA | 2,596 | | 2,533 | | 1,396 | | 1,347 | | 499 | | 724 | | (202) | | (196) | | — | | — | | 4,289 | | 4,408 | |
Adjusted EBITDA per common share – basic (dollars) | | | | | | | | | | | 7.38 | | 7.69 | |
(1) Presented net of adjusting items.
66 Pembina Pipeline Corporation 2025 Annual Report
Adjusted EBITDA from Equity Accounted Investees
In accordance with IFRS, Pembina's joint ventures are accounted for using equity accounting. Under equity accounting, the assets and liabilities of the investment are presented net in a single line item in the Consolidated Statement of Financial Position, "Investments in Equity Accounted Investees". Earnings from investments in equity accounted investees are recognized in a single line item in the Consolidated Statement of Earnings and Comprehensive Income "Share of Profit from Equity Accounted Investees". The adjustments made to earnings, in adjusted EBITDA above, are also made to share of profit from investments in equity accounted investees. Cash contributions and distributions from investments in equity accounted investees represent Pembina's share paid and received in the period to and from the investments in equity accounted investees.
To assist in understanding and evaluating the performance of these investments, Pembina is supplementing the IFRS disclosure with non-GAAP proportionate consolidation of Pembina's interest in the investments in equity accounted investees. Pembina's proportionate interest in equity accounted investees has been included in adjusted EBITDA.
| | | | | | | | | | | | | | | | | | | | | | | | | | | | |
| 3 Months Ended December 31 | Pipelines | Facilities | Marketing &
New Ventures | | Total |
| ($ millions) |
| 2025 | | 2024 | | 2025 | | 2024 | | 2025 | | 2024 | | | | 2025 | | 2024 | |
Share of profit from equity accounted investees | 1 | | — | | 74 | | 59 | | 96 | | 74 | | | | 171 | | 133 | |
| Adjustments to share of profit (loss) from equity accounted investees: | | | | | | | | | | |
| Net finance costs (income) | — | | — | | 32 | | 37 | | (35) | | (74) | | | | (3) | | (37) | |
| Income tax expense | — | | — | | 27 | | 23 | | — | | — | | | | 27 | | 23 | |
| Depreciation and amortization | — | | — | | 63 | | 66 | | — | | — | | | | 63 | | 66 | |
| Unrealized loss (gain) on commodity-related derivative financial instruments | — | | — | | 3 | | (3) | | — | | — | | | | 3 | | (3) | |
| | | | | | | | | | |
| | | | | | | | | | |
| Gain on disposal of assets | — | | — | | — | | — | | (62) | | — | | | | (62) | | — | |
| | | | | | | | | | |
| | | | | | | | | | |
| Transaction costs incurred in respect of acquisitions and non-cash provisions | — | | — | | 1 | | 13 | | — | | — | | | | 1 | | 13 | |
| Total adjustments to share of profit (loss) from equity accounted investees | — | | — | | 126 | | 136 | | (97) | | (74) | | | | 29 | | 62 | |
| | | | | | | | | | |
| Adjusted EBITDA from equity accounted investees | 1 | | — | | 200 | | 195 | | (1) | | — | | | | 200 | | 195 | |
| | | | | | | | | | | | | | | | | | | | | | | | | | | | |
| 12 Months Ended December 31 | Pipelines | Facilities | Marketing &
New Ventures | | Total |
| ($ millions) |
| 2025 | | 2024 | | 2025 | | 2024 | | 2025 | 2024 | | | | 2025 | | 2024 | |
Share of profit from equity accounted investees | 1 | | 42 | | 134 | | 231 | | 74 | | 55 | | | | 209 | | 328 | |
| Adjustments to share of profit (loss) from equity accounted investees: | | | | | | | | | | |
| Net finance costs (income) | 1 | | 7 | | 113 | | 175 | | (16) | | (23) | | | | 98 | | 159 | |
| Income tax expense | — | | — | | 46 | | 73 | | — | | — | | | | 46 | | 73 | |
| Depreciation and amortization | 2 | | 39 | | 254 | | 221 | | — | | 7 | | | | 256 | | 267 | |
| Unrealized loss on commodity-related derivative financial instruments | — | | — | | 4 | | 2 | | — | | — | | | | 4 | | 2 | |
| | | | | | | | | | |
| | | | | | | | | | |
| Gain on disposal of assets | — | | — | | (2) | | — | | (62) | | — | | | | (64) | | — | |
| Impairment expense | — | | — | | 193 | | — | | — | | — | | | | 193 | | — | |
| | | | | | | | | | |
| Other non-cash provisions | — | | — | | 2 | | 15 | | — | | — | | | | 2 | | 15 | |
| Total adjustments to share of profit (loss) from equity accounted investees | 3 | | 46 | | 610 | | 486 | | (78) | | (16) | | | | 535 | | 516 | |
| | | | | | | | | | |
| Adjusted EBITDA from equity accounted investees | 4 | | 88 | | 744 | | 717 | | (4) | | 39 | | | | 744 | | 844 | |
Pembina Pipeline Corporation 2025 Annual Report 67
Adjusted Cash Flow from Operating Activities and Adjusted Cash Flow from Operating Activities per Common Share
Adjusted cash flow from operating activities is a non-GAAP measure which is defined as cash flow from operating activities adjusting for the change in non-cash operating working capital, adjusting for current tax and share-based compensation payments, and deducting distributions to non-controlling interests and preferred share dividends paid. Adjusted cash flow from operating activities deducts distributions to non-controlling interest and preferred share dividends paid because they are not attributable to common shareholders. The calculation has been modified to exclude current tax expense and accrued share-based payment expense, and to include the impact of cash paid for taxes and share-based compensation, as it allows management to better assess the obligations discussed below.
Management believes that adjusted cash flow from operating activities provides comparable information to investors for assessing financial performance during each reporting period. Management utilizes adjusted cash flow from operating activities to set objectives and as a key performance indicator of the Company's ability to meet interest obligations, dividend payments and other commitments. Adjusted cash flow from operating activities per common share is a non-GAAP financial ratio which is calculated by dividing adjusted cash flow from operating activities by the weighted average number of common shares outstanding.
Following completion of Pembina acquiring a controlling ownership interest in Alliance and Aux Sable on April 1, 2024, Pembina revised the definition of adjusted cash flow from operating activities to deduct distributions related to non-controlling interest in the Aux Sable U.S. operations. On August 1, 2024, Pembina acquired the remaining interest in Aux Sable's U.S. operations.
| | | | | | | | | | | | | | |
| 3 Months Ended December 31 | 12 Months Ended December 31 |
| | |
| ($ millions, except per share amounts) | 2025 | 2024 | 2025 | 2024 |
| Cash flow from operating activities | 861 | 902 | 3,301 | 3,214 |
Cash flow from operating activities per common share – basic (dollars) | 1.48 | | 1.55 | | 5.68 | | 5.61 | |
| Add (deduct): | | | | |
| Change in non-cash operating working capital | (164) | | 73 | | (221) | | 43 | |
| Current tax expense | (94) | | (73) | | (432) | | (261) | |
| Taxes paid, net of foreign exchange | 189 | | 52 | | 346 | | 404 | |
| Accrued share-based payment expense | (29) | | (3) | | (95) | | (82) | |
| Share-based compensation payment | — | | 5 | | 89 | | 91 | |
| Preferred share dividends paid | (32) | | (34) | | (134) | | (132) | |
| Distributions to non-controlling interest | — | | — | | — | | (12) | |
| Adjusted cash flow from operating activities | 731 | | 922 | | 2,854 | | 3,265 | |
Adjusted cash flow from operating activities per common share – basic (dollars) | 1.26 | | 1.59 | | 4.91 | | 5.70 | |
68 Pembina Pipeline Corporation 2025 Annual Report
13. OTHER
Selected Annual Financial Information
| | | | | | | | | | | |
| ($ millions, except where noted) | 2025 | | 2024 | 2023(1) |
| Revenue | 7,778 | | 7,384 | | 6,331 | |
| Earnings | 1,694 | | 1,874 | | 1,776 | |
Per common share - basic (dollars) | 2.67 | | 3.00 | | 3.00 | |
Per common share - diluted (dollars) | 2.66 | | 3.00 | | 2.99 | |
| Total assets | 35,555 | | 35,967 | | 32,618 | |
Total non-current liabilities | 16,719 | | 15,549 | | 13,584 | |
Common share dividends declared ($ per share) | 2.82 | | 2.74 | | 2.66 | |
| Preferred share dividends declared | 134 | | 132 | | 120 | |
(1) Comparative 2023 period has been adjusted. Refer to Pembina's audited consolidated financial statements as at and for the year ended December 31, 2024.
See the "Quarterly Financial Information" section for the factors impacting the years ended December 31, 2025 and 2024. The increase in revenues, earnings and earnings per common share (basic and diluted) between 2024 and 2023 was largely due to the net impacts of Pembina acquiring a controlling interest in Alliance and Aux Sable on April 1, 2024, combined with no similar impact in 2024 of the Northern Pipeline system outage and the wildfires in Alberta and British Columbia that affected 2023. These factors were partially offset by no similar impairment reversal to that recognized in 2023 related to the reactivation of the Nipisi Pipeline, combined with higher net finance costs.
Risk Management
Pembina's risk management strategies, policies and limits, ensure risks and exposures are aligned to its business strategy and risk tolerance. Pembina's Board of Directors is responsible for providing risk management oversight at Pembina and oversees how management monitors compliance with Pembina's risk management policies and procedures and reviews the adequacy of this risk framework in relation to the risks faced by Pembina.
Pembina has exposure to counterparty credit risk, liquidity risk and market risk. Pembina utilizes derivative instruments to stabilize the results of its business and, as at December 31, 2025, the Company has entered into certain financial derivative contracts in order to manage commodity price, cost of power, and foreign exchange risk. Pembina has also entered into power purchase agreements to secure cost-competitive renewable energy, fix the price for a portion of the power Pembina consumes, and reduce its emissions.
Financial Instruments
Fair Values
The fair value of financial instruments utilizes a variety of valuation inputs. When measuring fair value, Pembina uses observable market data to the greatest extent possible. Depending on the nature of these valuation inputs, financial instruments are categorized as follows:
a. Level 1
Level 1 fair values are based on inputs that are unadjusted observable quoted prices from active markets for identical assets or liabilities as at the measurement date.
Pembina Pipeline Corporation 2025 Annual Report 69
b. Level 2
Level 2 fair values are based on inputs, other than quoted market prices included in Level 1, that are either directly or indirectly observable. Level 2 fair value inputs include quoted forward market prices, time value, and broker quotes that are observable for the duration of the financial instrument's contractual term. These inputs are often adjusted for factors specific to the asset or liability, such as, location differentials and credit risk.
Financial instruments that utilize Level 2 fair valuation inputs include derivatives arising from physical commodity forward contracts, commodity swaps and options, and forward interest rate and foreign-exchange swaps. In addition, Pembina's loans and borrowings utilize Level 2 fair valuation inputs, whereby the valuation technique is based on discounted future interest and principal payments using the current market interest rates of instruments with similar terms.
c. Level 3
Level 3 fair values utilize inputs that are not based on observable market data. Rather, various valuation techniques are used to develop inputs.
Financial instruments that utilize Level 3 fair valuation inputs include the following:
i.Power Purchase Agreements: Pembina's long-term power purchase agreements have given rise to embedded derivative instruments. The fair value of these embedded derivatives are measured using discounted projected cash flow models. The key unobservable inputs in the valuation include forecasted power prices from EDC Associates Ltd. and management estimates of renewable wind power pricing discounts. The power purchase agreements have a maturity date ranging from 2040 to 2041 and a notional that ranges from 100 MW to 105 MW of renewable energy capacity. The forecasted power prices, before applying the forecasted wind power pricing discount, range from $52.54 per MWh to $77.36 per MWh (2024: $46.69 MWh to $76.03 MWh). Lastly, the forecasted wind power pricing discount applied ranges from 50 percent to 67 percent (2024: 42 percent to 68 percent).
ii.Cedar LNG Capacity Commercial Arrangement: Pembina's provision of Cedar LNG transportation and liquefaction capacity to a third-party customer has given rise to an embedded derivative instrument with option features. The fair-value of this embedded derivative is measured using Black-Scholes option modelling, using a notional of 1.0 million tonnes of LNG per annum for a term of 20 years. The term commences when Cedar LNG becomes commercially operational. The key unobservable inputs in the valuation include: (a) the forecasted spread between the forward global Japan Korea Marker LNG index and the forward AECO natural gas index; and, (b) the forecasted volatility of such commodity prices. The forecasted spread between these market pricing indices ranges from $6.32 per MMBtu to $9.03 per MMBtu (in U.S. dollars). Lastly, the forecasted average volatility of such commodity prices is 18 percent.
The fair valuation of embedded derivative instruments is judged to be a significant management estimate. The respective assumptions and inputs are susceptible to change and may differ from actual future developments. This estimation uncertainty could materially impact the quantified fair value; and therefore, the gains and losses on derivative financial instruments.
70 Pembina Pipeline Corporation 2025 Annual Report
The carrying values of financial assets and liabilities in relation to their respective fair values, together with their appropriate fair value categorization are illustrated in the table below. Certain other non-derivative financial instruments measured at amortized cost, including cash and cash equivalents, trade receivables and other, trade payables and other, and other liabilities have been excluded since their carrying values are judged to approximate their fair values due to their nature and short maturity. These instruments would be categorized as Level 2 in the fair value hierarchy.
| | | | | | | | | | | | | | | | | | | | | | | | | | | |
| 2025 | 2024 |
| As at December 31 | Carrying
Value | Fair Value | Carrying Value | Fair Value | |
| ($ millions) | Level 1 | Level 2 | Level 3 | Level 1 | Level 2 | Level 3 | |
Financial assets carried at fair value | | | | | | | | | |
Derivative financial instruments(1) | 128 | | — | | 14 | | 114 | | 13 | | — | | 13 | | — | | |
| | | | | | | | | |
| | | | | | | | | |
| | | | | | | | | |
| | | | | | | | | |
| | | | | | | | | |
| | | | | | | | | |
Financial liabilities carried at fair value | | | | | | | | | |
Derivative financial instruments(1) | 138 | | — | | 9 | | 129 | | 159 | | — | | 42 | | 117 | | |
| | | | | | | | | |
Financial liabilities carried at amortized cost | | | | | | | | | |
Long-term debt(2) | 12,688 | | — | | 12,708 | | — | | 12,656 | | — | | 12,649 | | — | | |
(1) At December 31, 2025, all derivative financial instruments are carried at fair value through earnings. At December 31, 2024, all derivative financial instruments are carried at fair value through earnings, except for $5 million in interest rate derivative financial assets that were designated as cash flow hedge and matured on March 31, 2025.
(2) Carrying value of current and non-current balances. Includes loans and borrowings and subordinated notes.
Gains and Losses from Derivative Instruments
| | | | | | | | | | |
| | |
| For the years ended December 31 | | | | |
| ($ millions) | | | 2025 | 2024 |
| Derivative instruments held at fair value through earnings | | | | |
| Realized gain recorded in revenue from risk management and other derivative contracts | | | | |
Commodity-related gain | | | (133) | | (241) | |
| | | | |
| Unrealized (gain) loss recorded in revenue from risk management and other derivative contracts | | | | |
| Commodity-related (gain) loss | | | (25) | | 170 | |
| Cedar LNG capacity commercial arrangement embedded derivative loss | | | 62 | | — | |
| | | | |
| | | | |
| Derivative instruments in hedging relationships | | | | |
Interest rate loss recorded in other comprehensive income(1) | | | 4 | | 10 | |
| | | | |
| | | | |
(1) Unrealized losses or gains for designated cash flow hedges are recognized in impact of hedging activities in the Consolidated Statements of Earnings and Comprehensive Income, with realized losses or gains being reclassified to net finance costs. The movement in other comprehensive income relates to realized losses on interest rate forward swaps, which matured on March 31, 2025. A gain of $4 million was recognized during the first quarter of 2025, prior to the maturity date, that was reclassified to net finance costs (2024: $17 million realized gain). No losses or gains have been recognized in net income relating to discontinued cash flow hedges.
Alliance Negotiated Settlement
On September 15, 2025, the CER approved the negotiated settlement between Alliance Pipeline Limited Partnership ("Alliance") and shippers and interested parties on the Canadian portion of the Alliance Pipeline. The Alliance Negotiated Settlement includes a revised toll schedule, effective November 1, 2025, which is expected to reduce long-term firm tolls on a volume weighted average basis and introduces a 10-year toll option. The agreement also includes a revenue-sharing mechanism for seasonal and interruptible transportation services and provides shippers with a one-time term extension option. Pembina anticipates the Alliance Negotiated Settlement to result in an annual reduction in long-term firm service revenue over the next 10 years, plus impacts from the new revenue-sharing provision, which will depend on future commodity prices. The settlement outcome approved by the CER was within the expected range of outcomes used in the impairment test performed in the first quarter of 2025.
Tax Regulations
The One Big Beautiful Bill Act was enacted in the United States on July 4, 2025. Pembina has assessed the impact of this legislation and does not anticipate any material impact to Pembina.
Pembina Pipeline Corporation 2025 Annual Report 71
Pension Plan
Pembina maintains defined contribution plans and defined benefit pension plans for employees and retirees. The defined benefit plans include a funded registered plan for all qualified employees and an unfunded supplemental retirement plan for those employees affected by the Canada Revenue Agency maximum pension limits. At the end of 2025, the pension plans carried a net asset of $37 million (2024: net asset of $8 million). At December 31, 2025, plan obligations amounted to $294 million (2024: $284 million) compared to plan assets of $331 million (2024: $292 million). In 2025, the pension plans' expense was $31 million (2024: $29 million). Pembina's contributions to the pension plans totaled $17 million in 2025 (2024: $18 million).
Disclosure Controls and Procedures and Internal Control over Financial Reporting
Disclosure Controls and Procedures
Pembina maintains disclosure controls and procedures ("DC&P") designed to provide reasonable assurance that information required to be disclosed in Pembina's annual filings, interim filings and other reports filed or submitted by it under applicable securities laws is recorded, processed, summarized and reported accurately and in the time periods specified under such securities laws, and include controls and procedures designed to ensure such information is accumulated and communicated to Pembina's management, including its certifying officers, as appropriate to allow timely decisions regarding required disclosure. As at December 31, 2025, an evaluation of the effectiveness of the design and operation of Pembina's DC&P, as defined in Rule 13a – 15(e) and 15(d) – 15(e) under the United States Securities Exchange Act of 1934, as amended (the "Exchange Act") and National Instrument 52-109 Certification of Disclosure in Issuer's Annual and Interim Filings ("NI 52-109"), was carried out by management, including the President and Chief Executive Officer ("CEO") and the Chief Financial Officer ("CFO"). Based on the evaluation, the CEO and CFO have concluded that the design and operation of Pembina's DC&P were effective as at December 31, 2025 to ensure that material information relating to Pembina is made known to the CEO and CFO by others.
It should be noted that while the CEO and CFO believe that Pembina's DC&P provide a reasonable level of assurance that they are effective, they do not expect that Pembina's DC&P will prevent all errors or fraud. A control system, no matter how well conceived or operated, can provide only reasonable, not absolute, assurance that the objectives of the control system are met.
Management's Annual Report on Internal Control over Financial Reporting
Pembina maintains internal control over financial reporting which is designed to provide reasonable assurance regarding the reliability of financial reporting and the preparation of financial statements for external purposes in accordance with IFRS.
Management is responsible for establishing and maintaining adequate internal control over financial reporting, as defined in Rule 13a – 15(e) and 15(d) – 15(e) under the Exchange Act and NI 52-109.
Under the supervision and with the participation of our CEO and our CFO, management has conducted an evaluation of the effectiveness of our internal control over financial reporting, as at December 31, 2025 based on the framework set forth in Internal Control – Integrated Framework issued in 2013 by the Committee of Sponsoring Organizations of the Treadway Commission ("COSO"). Based on management's assessment as at December 31, 2025, the CEO and CFO have concluded that Pembina's internal control over financial reporting is effective.
Due to its inherent limitations, internal control over financial reporting is not intended to provide absolute assurance that a misstatement of Pembina's financial statements would be prevented or detected. Further, the evaluation of the effectiveness of internal control over financial reporting was made as at a specific date, and continued effectiveness in future periods is subject to the risks that controls may become inadequate.
72 Pembina Pipeline Corporation 2025 Annual Report
The effectiveness of internal control over financial reporting as at December 31, 2025 was audited by KPMG LLP, an independent registered public accounting firm, as stated in their Report of Independent Registered Public Accounting Firm, which is included in the Consolidated Financial Statements.
Changes in Internal Control over Financial Reporting
Pembina previously excluded controls, policies and procedures associated with the Alliance, Aux Sable, and NRGreen joint ventures (the "Acquirees") controlling interests in which were acquired on April 1, 2024, from the Company's evaluation of the effectiveness of its internal control over financial reporting, as permitted under applicable securities laws in Canada and the United States. Effective April 1, 2025, the controls, policies and procedures of the Acquirees came into scope of Pembina's internal control over financial reporting and have been incorporated into Pembina's evaluation of the effectiveness thereof. Other than the integration of the controls, policies and procedures of the Acquirees in the second quarter of 2025, there has been no change in Pembina's internal control over financial reporting that occurred during the year ended December 31, 2025 that has materially affected, or are reasonably likely to materially affect, Pembina's internal control over financial reporting.
Pembina Pipeline Corporation 2025 Annual Report 73
14. ABBREVIATIONS
The following is a list of abbreviations that may be used in this MD&A:
| | | | | |
Other | |
| AECO | Alberta Energy Company benchmark price for natural gas |
B.C. | British Columbia |
GAAP | Canadian generally accepted accounting principles |
IFRS | International Financial Reporting Standards |
| |
| |
NGL | Natural gas liquids |
| LNG | Liquefied natural gas |
U.S. | United States |
WCSB | Western Canadian Sedimentary Basin |
Deep cut | Ethane-plus capacity extraction gas processing capabilities |
Shallow cut | Sweet gas processing with propane and/or condensate-plus extraction capabilities |
| |
| |
Volumes | Volumes for Pipelines and Facilities are revenue volumes, defined as physical volumes plus volumes from take-or-pay commitments. Volumes for Marketing & New Ventures are marketed crude oil and NGL volumes. Volumes are stated in mboe/d, with natural gas volumes converted to mboe/d from MMcf/d at a 6:1 ratio, and also include revenue volumes from Pembina's equity accounted investees. |
| Frac spreads | The margin between the value of extracted NGLs and the cost of the natural gas used to produce them. |
| | | | | | | | | | | | | |
Measurement | | | | | |
bpd | barrels per day | mtpa | million tonnes per annum | | |
mbbls | thousands of barrels | MMcf/d | millions of cubic feet per day | | |
mbpd | thousands of barrels per day | MMBtu | million British thermal units | | |
mmbpd | millions of barrels per day | bcf/d | billions of cubic feet per day | | |
mmbbls | millions of barrels | km | kilometer | | |
mboe/d | thousands of barrels of oil equivalent per day | MW | Megawatt | | |
mmboe/d | millions of barrels of oil equivalent per day | MWh | Megawatt hour | | |
| | | | | | | |
| Regulators & Acts | | | |
| ABCA | Business Corporations Act (Alberta) | | |
| AER | Alberta Energy Regulator | | |
| BCEAO | British Columbia Environmental Assessment Office | | |
| BCER | British Columbia Energy Regulator | | |
| BCUC | British Columbia Utilities Commission | | |
| CER | Canadian Energy Regulator | | |
| FERC | United States Federal Energy Regulatory Commission | | |
| GGPPA | Greenhouse Gas Pollution Pricing Act (Canada) | | |
| ICA | Interstate Commerce Act of 1887 (United States) | | |
| NGA | Natural Gas Act of 1938 (United States) | | |
| OPEC | Organization of the Petroleum Exporting Countries | | |
| PHMSA | Pipeline and Hazardous Material Safety Administration | | |
| IAAC | Impact Assessment Agency of Canada | | |
| | | |
74 Pembina Pipeline Corporation 2025 Annual Report
| | | | | |
Investments in Equity Accounted Investees | |
| Pipelines: | |
| Grand Valley | 75 percent interest in Grand Valley 1 Limited Partnership wind farm |
| Alliance | Prior to the completion of Pembina acquiring a controlling ownership interest in Alliance on April 1, 2024, Pembina owned a 50 percent interest in Alliance Pipeline Limited Partnership, Alliance Pipeline L.P., and NRGreen Power Limited Partnership |
| Facilities: | |
| PGI | 60 percent interest in Pembina Gas Infrastructure Inc., a premier gas processing entity in western Canada serving customers throughout the Montney and Duvernay trends from central Alberta to northeast British Columbia |
| Fort Corp | 50 percent interest in Fort Saskatchewan Ethylene Storage Limited Partnership and Fort Saskatchewan Ethylene Storage Corporation |
| Marketing & New Ventures: | |
| Cedar LNG | 49.9 percent interest in Cedar LNG Partners LP and the proposed floating LNG facility in Kitimat, British Columbia, Canada |
| ACG | 50 percent interest in Alberta Carbon Grid Heartland Limited Partnership and the proposed Heartland carbon dioxide transportation and sequestration system. |
| Greenlight | 50 percent interest in the Greenlight Electricity Centre Limited Partnership, which is developing a gas-fired combined cycle power generation facility to be located in Alberta’s Industrial Heartland. |
| Aux Sable | Prior to the completion of Pembina acquiring a controlling ownership interest in Aux Sable on April 1, 2024, Pembina owned an ownership interest of an approximate 42.7 percent in Aux Sable U.S. and 50 percent in Aux Sable Canada, which includes an NGL fractionation facility and gas processing capacity near Chicago, Illinois and other natural gas and NGL processing facilities, logistics and distribution assets in the U.S. and Canada, and transportation contracts on Alliance. |
| |
Readers are referred to the AIF for the year ended December 31, 2025 for additional descriptions, which is available at www.sedarplus.ca, www.sec.gov and through Pembina's website at www.pembina.com.
Pembina Pipeline Corporation 2025 Annual Report 75
15. FORWARD-LOOKING STATEMENTS & INFORMATION
In the interest of providing Pembina's security holders and potential investors with information regarding Pembina, including management's assessment of the Company's future plans and operations, certain statements contained in this MD&A constitute forward-looking statements or forward-looking information (collectively, "forward-looking statements"). Forward-looking statements are typically identified by words such as "anticipate", "continue", "estimate", "expect", "may", "will", "project", "should", "could", "would", "believe", "plan", "intend", "design", "target", "undertake", "view", "indicate", "maintain", "explore", "entail", "schedule", "objective", "strategy", "likely", "potential", "outlook", "aim", "purpose", "goal" and similar expressions suggesting future events or future performance.
By their nature, such forward-looking statements involve known and unknown risks, uncertainties and other factors that may cause actual results or events to differ materially from those anticipated in such forward-looking statements. Pembina believes the expectations reflected in those forward-looking statements are reasonable but no assurance can be given that these expectations will prove to be correct and such forward-looking statements included in this MD&A should not be unduly relied upon. These forward-looking statements speak only as of the date of this MD&A.
In particular, this MD&A contains forward-looking statements pertaining to the following:
•future levels and sustainability of cash dividends that Pembina intends to pay to its shareholders and anticipated dividend payment dates;
•planning, construction, locations, capital expenditure and funding estimates, schedules, regulatory and environmental applications and anticipated approvals, expected capacity, incremental volumes, contractual arrangements, in-service dates, sources of product, activities, benefits and operations with respect to new construction of, or expansions on existing, pipelines, systems, gas services facilities, processing and fractionation facilities, terminalling, storage and hub facilities and other facilities or energy infrastructure, as well as the impact of Pembina's new projects on its future financial performance;
•future pipeline, processing, fractionation, and storage facility and system operations;
•treatment under existing and proposed governmental laws, policies and regulations, including those relating to taxes, the environmental, tariffs and project assessments;
•potential changes or amendments to existing or proposed governmental laws, policies and regulations;
•Pembina's strategy and the development and expected timing of new business initiatives and growth opportunities and the impact thereof;
•increased processing capacity and fractionation capacity due to increased oil and gas industry activity and new connections and other initiatives on Pembina's pipelines and at Pembina's facilities;
•expected future cash flows and the sufficiency thereof, financial strength, sources of and access to funds, future contractual obligations, future financing options, availability of capital for capital expenditures, operating obligations, debt maturities, letters of credit and the use of proceeds from financings;
•Pembina's capital structure, including the sufficiency of the amount of leverage employed therein and future actions that may be taken with respect thereto, including expectations regarding the repurchase or redemption of common shares or other securities, repayments of existing debt, new borrowings, equity or hybrid securities issuances and the timing thereof;
•potential actions undertaken by Pembina to mitigate counterparty risk;
•tolls and tariffs, and processing, transportation, fractionation, storage and services commitments and contracts;
•the outcomes and effectiveness of Pembina's DC&P and ICFR;
•the expected demand for, and prices and inventory levels of, crude oil and other petroleum products, including NGL;
•the development, in-service dates and anticipated benefits of Pembina's new projects and developments, including RFS IV, the Wapiti Expansion, the K3 Cogeneration Facility, the Taylor-to-Gordondale Expansion, the Fox Creek-to-Namao Expansion, Birch-to-Taylor Expansion, Prince Rupert Terminal Optimization, the Greenlight Electricity Centre and the Cedar LNG Project, including the timing thereof and certain costs related thereto;
•expectations in respect of PGI's infrastructure development commitments, including the amounts and timing thereof;
•the Lator Infrastructure, including the anticipated amount of funding by PGI in the first phase and expected startup date;
•the expected in-service date of the North Gold Creek Battery;
•the expected costs, timing and impact of the Alliance Negotiated Settlement; and
•the impact of current and future market conditions on Pembina.
Various factors or assumptions are typically applied by Pembina in drawing conclusions or making the forecasts, projections, predictions or estimations set out in forward-looking statements based on information currently available to Pembina. These factors and assumptions include, but are not limited to:
•oil and gas industry exploration and development activity levels and the geographic region of such activity;
•the success of Pembina's operations;
•prevailing commodity prices, interest rates, carbon prices, tax rates, exchange rates and inflation rates;
•the ability of Pembina to maintain current credit ratings;
•the availability and cost of capital to fund future capital requirements relating to existing assets, projects and the repayment or refinancing existing debt as it becomes due;
•future operating costs, including geotechnical and integrity costs being consistent with historical costs;
•oil and gas industry compensation levels remaining consistent with historical levels;
•in respect of current developments, expansions, planned capital expenditures, completion dates and capacity expectations: that third parties will provide any necessary support; that any third-party projects relating to Pembina's growth projects will be sanctioned and completed as expected; that any required commercial agreements can be reached; that all required regulatory and environmental approvals can be obtained on acceptable terms in a timely manner; that there are no supply chain disruptions impacting Pembina's ability to obtain required equipment, materials or labour; that counterparties will comply with contracts in a timely manner; that there are no unforeseen events preventing the performance of contracts or the completion of the relevant facilities, and that there are no unforeseen material costs relating to the facilities which are not recoverable from customers;
•in respect of the stability of Pembina's dividends: prevailing commodity prices, margins and exchange rates; that Pembina's future results of operations will be consistent with past performance and management expectations in relation thereto; the continued availability of capital at attractive prices to fund future capital requirements relating to existing assets and projects, including but not limited to future capital expenditures relating to expansion, upgrades and maintenance shutdowns; the success of growth projects; future operating costs; that counterparties to agreements will continue to perform their obligations in a timely manner; that there are no unforeseen events preventing the performance of contracts; and that there are no unforeseen material construction or other costs related to current growth projects; current operations or the repayment or refinancing of existing debt as it becomes due;
•the inputs used by Pembina's management in the fair valuation of embedded derivative instruments remaining consistent;
•prevailing regulatory, tax and environmental laws and regulations and tax pool utilization; and
•the amount of future liabilities relating to lawsuits and environmental incidents and the availability of coverage under Pembina's insurance policies (including in respect of Pembina's business interruption insurance policy).
The actual results of Pembina could differ materially from those anticipated in these forward-looking statements as a result of the material risk factors set forth below:
•the regulatory environment and decisions, including the outcome of regulatory hearings, and Indigenous and landowner consultation requirements;
•the impact of competitive entities and pricing;
•reliance on third parties to successfully operate and maintain certain assets;
•labour and material shortages;
•reliance on key relationships and agreements and the outcome of stakeholder engagement;
•the strength and operations of the oil and natural gas production industry and related commodity prices;
•non-performance or default by counterparties to agreements which Pembina or one or more of its subsidiaries has entered into in respect of its business;
•actions by joint venture partners or other partners which hold interests in certain of Pembina's assets;
•actions by governmental or regulatory authorities including changes in tax laws and treatment, the imposition of new tariffs or other changes in international trade policies or relations, changes in royalty rates, regulatory decisions, changes in regulatory processes or increased environmental regulation;
•fluctuations in operating results;
•adverse general economic and market conditions, including potential recessions in Canada, North America and worldwide, resulting in changes, or prolonged weaknesses, as applicable, in interest rates, foreign currency exchange rates, inflation rates, commodity prices, supply/demand trends and overall industry activity levels;
•constraints on, or the unavailability of adequate infrastructure;
•the political environment and public opinion in North America and elsewhere, including changes in trade relations between Canada and the U.S.;
•ability to access various sources of debt and equity capital on acceptable terms;
•adverse changes in credit ratings;
•counterparty credit risk;
•operating risks, including the amount of future liabilities related to pipelines spills and other environmental incidents;
•technology and security risks, including cyber-security risks;
•natural catastrophes; and
•the other factors discussed under "Risk Factors" herein and in the AIF for the year ended December 31, 2025, which are available at www.sedarplus.ca, www.sec.gov and through Pembina's website at www.pembina.com.
These factors should not be construed as exhaustive. Unless required by law, Pembina does not undertake any obligation to publicly update or revise any forward-looking statements, whether as a result of new information, future events or otherwise. Management approved the 2026 capital expenditure guidance contained herein as of the date of this MD&A. The purpose of the 2026 capital expenditure guidance is to assist readers in understanding Pembina's expected future capital expenditures, and this information may not be appropriate for other purposes. Any forward-looking statements contained herein are expressly qualified by this cautionary statement.
76 Pembina Pipeline Corporation 2025 Annual Report
| | | | | |
| CONSOLIDATED FINANCIAL STATEMENTS AND NOTES |
| |
Table of Contents | |
| |
| |
| |
| |
| |
| |
| |
| |
| |
| |
| |
| |
| |
| |
| |
| |
| |
| |
| |
| |
| |
| |
| |
| |
| |
| |
| |
| |
| |
| |
| |
| |
| |
| |
| |
| |
| |
| |
| |
| |
| |
| |
| |
Pembina Pipeline Corporation 2025 Annual Report 77
MANAGEMENT'S REPORT
The audited consolidated financial statements of Pembina Pipeline Corporation (the "Company" or "Pembina") are the responsibility of Pembina's management. The financial statements have been prepared in accordance with International Financial Reporting Standards as issued by the International Accounting Standards Board, using management's best estimates and judgments, where appropriate.
Management is responsible for the reliability and integrity of the financial statements, the notes to the financial statements and other financial information contained in this report. In the preparation of these financial statements, estimates are sometimes necessary because a precise determination of certain assets and liabilities is dependent on future events. Management believes such estimates have been based on careful judgments and have been properly reflected in the accompanying financial statements.
Management's Assessment of Internal Control over Financial Reporting
Management is responsible for establishing and maintaining disclosure controls and procedures ("DC&P") and internal control over financial reporting, as defined in Rule 13a – 15(e) and 15(d) – 15(e) under the United States Securities Exchange Act of 1934, as amended (the "Exchange Act") and National Instrument 52-109 Certification of Disclosure in Issuers' Annual and Interim Filings.
Under the supervision and with the participation of the President and Chief Executive Officer ("CEO") and the Chief Financial Officer ("CFO"), management has conducted an evaluation of Pembina's internal control over financial reporting based on the framework set forth in Internal Control – Integrated Framework issued in 2013 by the Committee of Sponsoring Organizations of the Treadway Commission ("COSO"). Based on management's assessment as at December 31, 2025, the CEO and CFO have concluded that Pembina's internal control over financial reporting is effective.
Due to its inherent limitations, internal control over financial reporting is not intended to provide absolute assurance that a misstatement of Pembina's financial statements would be prevented or detected. Further, the evaluation of the effectiveness of internal control over financial reporting was made as at a specific date, and continued effectiveness in future periods is subject to the risks that controls may become inadequate.
The Board of Directors of Pembina (the "Board") is responsible for ensuring management fulfills its responsibilities for financial reporting and internal control. The Board is assisted in exercising its responsibilities through the Audit Committee, which consists of five non-management directors. The Audit Committee meets periodically with management and the internal and external auditors to satisfy itself that management's responsibilities are properly discharged, to review the financial statements and to recommend approval of the financial statements to the Board.
KPMG LLP, the independent auditors, have audited Pembina's consolidated financial statements and the effectiveness of internal control over financial reporting as of December 31, 2025 in accordance with the standards of the Public Company Accounting Oversight Board (United States). The independent auditors have full and unrestricted access to the Audit Committee to discuss their audit and their related findings.
78 Pembina Pipeline Corporation 2025 Annual Report
Changes in Internal Control over Financial Reporting
Pembina previously excluded controls, policies and procedures associated with the Alliance, Aux Sable, and NRGreen joint ventures (the "Acquirees") controlling interests in which were acquired on April 1, 2024, from the Company's evaluation of the effectiveness of its internal control over financial reporting, as permitted under applicable securities laws in Canada and the United States. Effective April 1, 2025, the controls, policies and procedures of the Acquirees came into scope of Pembina's internal control over financial reporting and have been incorporated into Pembina's evaluation of the effectiveness thereof. Other than the integration of the controls, policies and procedures of the Acquirees in the second quarter of 2025, there has been no change in Pembina's internal control over financial reporting that occurred during the year ended December 31, 2025 that has materially affected, or are reasonably likely to materially affect, Pembina's internal control over financial reporting.
| | | | | |
"J. Scott Burrows" J. Scott Burrows President and Chief Executive Officer | "Cameron J. Goldade" Cameron J. Goldade Chief Financial Officer |
February 26, 2026
Pembina Pipeline Corporation 2025 Annual Report 79
REPORT OF INDEPENDENT REGISTERED PUBLIC ACCOUNTING FIRM
To the Shareholders and Board of Directors of Pembina Pipeline Corporation
Opinion on the Consolidated Financial Statements
We have audited the accompanying consolidated statements of financial position of Pembina Pipeline Corporation (the Company) as at December 31, 2025 and 2024, the related consolidated statements of earnings and comprehensive income, changes in equity, and cash flows for each of the years then ended, and the related notes (collectively, the consolidated financial statements). In our opinion, the consolidated financial statements present fairly, in all material respects, the financial position of the Company as at December 31, 2025 and 2024, and the financial performance and its cash flows for each of the years then ended, in conformity with International Financial Reporting Standards (IFRS) as issued by the International Accounting Standards Board (IASB).
We also have audited, in accordance with the standards of the Public Company Accounting Oversight Board (United States) (PCAOB), the Company's internal control over financial reporting as at December 31, 2025, based on criteria established in Internal Control – Integrated Framework (2013) issued by the Committee of Sponsoring Organizations of the Treadway Commission, and our report dated February 26, 2026 expressed an unqualified opinion on the effectiveness of the Company's internal control over financial reporting.
Basis for Opinion
These consolidated financial statements are the responsibility of the Company's management. Our responsibility is to express an opinion on these consolidated financial statements based on our audits. We are a public accounting firm registered with the PCAOB and are required to be independent with respect to the Company in accordance with the U.S. federal securities laws and the applicable rules and regulations of the Securities and Exchange Commission and the PCAOB.
We conducted our audits in accordance with the standards of the PCAOB. Those standards require that we plan and perform the audit to obtain reasonable assurance about whether the consolidated financial statements are free of material misstatement, whether due to error or fraud. Our audits included performing procedures to assess the risks of material misstatement of the consolidated financial statements, whether due to error or fraud, and performing procedures that respond to those risks. Such procedures included examining, on a test basis, evidence regarding the amounts and disclosures in the consolidated financial statements. Our audits also included evaluating the accounting principles used and significant estimates made by management, as well as evaluating the overall presentation of the consolidated financial statements. We believe that our audits provide a reasonable basis for our opinion.
Critical Audit Matters
The critical audit matters communicated below are matters arising from the current period audit of the consolidated financial statements that were communicated or required to be communicated to the audit committee and that: (1) relate to accounts or disclosures that are material to the consolidated financial statements and (2) involved our especially challenging, subjective, or complex judgments. The communication of critical audit matters does not alter in any way our opinion on the consolidated financial statements, taken as a whole, and we are not, by communicating the critical audit matters below, providing separate opinions on the critical audit matters or on the accounts or disclosures to which they relate.
80 Pembina Pipeline Corporation 2025 Annual Report
Evaluation of the recoverable amount of Pembina Gas Infrastructure Inc.
As discussed in Note 10, the Company's equity method investment in Pembina Gas Infrastructure Inc. ("PGI") as of December 31, 2025 was $3,578 million. As discussed in Note 3 the Company records its share of PGI's profit or loss and comprehensive income, which includes any impairment losses. PGI is required to estimate the recoverable amount of its goodwill at least annually, or whenever PGI identifies an impairment indicator. PGI calculated the recoverable amount in its annual goodwill impairment test using a fair value less cost to sell approach based on a discounted cash flow model. No impairment loss was recognized by PGI for the year ended December 31, 2025.
We identified the evaluation of the recoverable amount of PGI as a critical audit matter. A high degree of subjective auditor judgment was required to evaluate the projected cash flows of the assets, and after-tax discount rate assumptions used to discount the projected cash flows.
The following are the primary procedures we performed to address this critical audit matter. We evaluated the design and tested the operating effectiveness of certain internal controls related to the determination of the projected cash flows of the assets, and after-tax discount rate assumptions used to discount the projected cash flows. We compared PGI's historical projected cash flows of the assets to actual historical results to assess PGI's ability to accurately forecast. We evaluated PGI's projected cash flows of the assets, by comparing to actual historical results. In addition, we involved valuation professionals with specialized skills and knowledge, who assisted in:
•testing the recoverable amount for PGI using the investee's projected cash flows of the assets, and after-tax discount rate, and comparing the result to the investee's calculated recoverable amount
•evaluating the after-tax discount rate used in the valuation by comparing the inputs against publicly available market data for comparable entities and assessing the resulting after-tax discount rate
•evaluating the historical and projected cash flow multiples implied in the valuation by comparing them to publicly available historical and projected cash flow multiples for comparable entities.
Evaluation of the recoverable amount of the Alliance cash generating unit
As discussed in Note 3(f), non-financial assets are assessed at each reporting date to determine whether there is any indication of impairment. If any such indication exists, the asset's recoverable amount is estimated. As discussed in Note 8, the Canada Energy Regulator had initiated a toll review of the Alliance Canada pipeline assets in late 2024. As the toll review continued into the first quarter of 2025, the Company performed an impairment test for the Cash-Generating Unit ("CGU") that includes the Alliance Canada assets. The recoverable amount was determined using a fair value less costs of disposal approach by discounting the projected cash flows, including probability weighted settlement outcomes for the Alliance Canada assets. The recoverable amount of the CGU exceeded the carrying value of $6.3 billion as of March 31, 2025 and as a result, no impairment was recognized.
We identified the evaluation of the recoverable amount of the CGU as a critical audit matter. A high degree of subjective auditor judgment was required to evaluate the method to estimate commodity price assumptions used in the determination of the projected cash flows of the assets, and after-tax discount rate assumptions used to discount the projected cash flows.
The following are the primary procedures we performed to address this critical audit matter. We evaluated the design and tested the operating effectiveness of certain internal controls related to the method used to estimate the commodity price assumptions used in the projected cash flows of the assets, and the after-tax discount rate assumptions used to discount the projected cash flows. We evaluated the Company's method for estimating forecasted commodity prices. In addition, we involved valuation professionals with specialized skills and knowledge, who assisted in:
•evaluating the after-tax discount rate used in the valuation by comparing the inputs against publicly available market data for comparable entities and assessing the resulting after-tax discount rate
Pembina Pipeline Corporation 2025 Annual Report 81
•evaluating the historical and projected cash flow multiples implied in the valuation by comparing them to publicly available historical and projected cash flow multiples for comparable entities
Evaluation of the Cedar LNG capacity commercial arrangement
As discussed in Note 3(b), the Company's material accounting policy requires embedded derivatives in other financial instruments or other contracts (host contracts) to be recorded separately if the following criteria are met: (a) the economic characteristics and risks are not closely related to the host contract; (b) a separate instrument with the same terms as the embedded derivative would meet the definition of a derivative; and, (c) the host contract is not measured at fair value through profit or loss. If a separable option-based embedded derivative in a revenue contract has a fair value at contract inception, a corresponding contract asset or liability is attributed to the revenue contract that results in a decrease or increase, respectively, to revenue as the future services are provided. As described in Note 23, the Company's provision of Cedar LNG transportation and liquefaction capacity to a third-party customer (the "contractual agreement") has given rise to an embedded derivative instrument with option features. The fair value of this embedded derivative was measured using Black-Scholes option modelling. The key unobservable inputs in the valuation include forward commodity pricing and volatility in commodity prices. As described in Note 18, the Company recognized a contract liability at contract inception equal to the fair value of the embedded derivative of $176 million.
We identified the assessment of the embedded derivative and its fair value measurement as a critical audit matter. A high degree of auditor judgment was required to evaluate the application of the Company's material accounting policy over the contractual arrangement and the embedded derivative, and to evaluate the appropriateness of management's selection of the valuation model and the appropriateness of the related forward commodity pricing and volatility assumptions used to measure the fair value of the embedded derivative.
The following are the primary procedures we performed to address this critical audit matter. We evaluated the design and tested the operating effectiveness of certain internal controls related to the application of the accounting policy to the contractual arrangement and embedded derivative, the selection of the valuation model, and the forward commodity pricing and volatility assumptions used in measuring the fair value of the embedded derivative. We evaluated the initial recognition of the host contract and its embedded derivative by examining the terms and conditions of the host contract, considering its economic characteristics and risks, and comparing the results to the related requirements of IFRS. We assessed the model used to determine the fair value of the embedded derivative by comparing the model and its calculations to the contractual agreement. We evaluated the Company's method and data used to estimate unobservable forward commodity prices. In addition, we involved financial instrument valuation professionals with specialized skills and knowledge, who assisted in:
•evaluating the Company's selection of the Black-Scholes model to estimate the fair value of the embedded derivative
•testing the appropriateness of the Company's forward volatility assumption,
•testing the Company's calculation of the fair value of the embedded derivative using the Black-Scholes pricing model.
/s/ KPMG LLP
Chartered Professional Accountants
We have served as the Company's auditor since 1997.
Calgary, Canada
February 26, 2026
82 Pembina Pipeline Corporation 2025 Annual Report
REPORT OF INDEPENDENT REGISTERED PUBLIC ACCOUNTING FIRM
To the Shareholders and Board of Directors of Pembina Pipeline Corporation
Opinion on Internal Control Over Financial Reporting
We have audited Pembina Pipeline Corporation's (the Company) internal control over financial reporting as at December 31, 2025, based on criteria established in Internal Control – Integrated Framework (2013) issued by the Committee of Sponsoring Organizations of the Treadway Commission. In our opinion, the Company maintained, in all material respects, effective internal control over financial reporting as at December 31, 2025, based on criteria established in Internal Control – Integrated Framework (2013) issued by the Committee of Sponsoring Organizations of the Treadway Commission.
We also have audited, in accordance with the standards of the Public Company Accounting Oversight Board (United States) (PCAOB), the consolidated statements of financial position of the Company as at December 31, 2025 and 2024, the related consolidated statements of earnings and comprehensive income, changes in equity, and cash flows for each of the years then ended, and the related notes (collectively, the consolidated financial statements), and our report dated February 26, 2026 expressed an unqualified opinion on those consolidated financial statements.
Basis for Opinion
The Company's management is responsible for maintaining effective internal control over financial reporting and for its assessment of the effectiveness of internal control over financial reporting, included in the accompanying Management's Annual Report on Internal Control over Financial Reporting on page 78 of Management's Discussion and Analysis. Our responsibility is to express an opinion on the Company's internal control over financial reporting based on our audit. We are a public accounting firm registered with the PCAOB and are required to be independent with respect to the Company in accordance with the U.S. federal securities laws and the applicable rules and regulations of the Securities and Exchange Commission and the PCAOB. We conducted our audit in accordance with the standards of the PCAOB. Those standards require that we plan and perform the audit to obtain reasonable assurance about whether effective internal control over financial reporting was maintained in all material respects. Our audit of internal control over financial reporting included obtaining an understanding of internal control over financial reporting, assessing the risk that a material weakness exists, and testing and evaluating the design and operating effectiveness of internal control based on the assessed risk. Our audit also included performing such other procedures as we considered necessary in the circumstances. We believe that our audit provides a reasonable basis for our opinion.
Definition and Limitations of Internal Control Over Financial Reporting
A company's internal control over financial reporting is a process designed to provide reasonable assurance regarding the reliability of financial reporting and the preparation of financial statements for external purposes in accordance with generally accepted accounting principles. A company's internal control over financial reporting includes those policies and procedures that (1) pertain to the maintenance of records that, in reasonable detail, accurately and fairly reflect the transactions and dispositions of the assets of the company; (2) provide reasonable assurance that transactions are recorded as necessary to permit preparation of financial statements in accordance with generally accepted accounting principles, and that receipts and expenditures of the company are being made only in accordance with authorizations of management and directors of the company; and (3) provide reasonable assurance regarding prevention or timely detection of unauthorized acquisition, use, or disposition of the company's assets that could have a material effect on the financial statements.
Pembina Pipeline Corporation 2025 Annual Report 83
Because of its inherent limitations, internal control over financial reporting may not prevent or detect misstatements. Also, projections of any evaluation of effectiveness to future periods are subject to the risk that controls may become inadequate because of changes in conditions, or that the degree of compliance with the policies or procedures may deteriorate.
/s/ KPMG LLP
Chartered Professional Accountants
Calgary, Canada
February 26, 2026
84 Pembina Pipeline Corporation 2025 Annual Report
CONSOLIDATED STATEMENTS OF FINANCIAL POSITION
| | | | | | | | | | |
| | | | |
| | | | |
As at December 31 ($ millions) | | 2025 | 2024 | |
Assets
Current assets | | | | |
| Cash and cash equivalents | | 106 | | 141 | | |
Trade receivables and other (Note 6) | | 836 | | 1,005 | | |
Income tax receivable (Note 11) | | 19 | | 113 | | |
| | | | |
Inventory (Note 7) | | 284 | | 301 | | |
Derivative financial instruments (Note 23) | | 14 | | 13 | | |
| | | | |
| | 1,259 | | 1,573 | | |
| Non-current assets | | | | |
Property, plant and equipment (Note 8) | | 22,550 | | 22,738 | | |
Intangible assets and goodwill (Note 9) | | 6,345 | | 6,528 | | |
Investments in equity accounted investees (Note 10) | | 4,344 | | 4,267 | | |
Right-of-use assets (Note 13) | | 526 | | 530 | | |
Finance lease receivables (Note 13) | | 239 | | 223 | | |
| | | | |
Derivative financial instruments (Note 23) | | 114 | | — | | |
| Other assets | | 178 | | 108 | | |
| | | | |
| | 34,296 | | 34,394 | | |
| Total assets | | 35,555 | | 35,967 | | |
Liabilities and equity
Current liabilities | | | | |
Trade payables and other (Note 12) | | 1,321 | | 1,202 | | |
Loans and borrowings (Note 14) | | 600 | | 1,525 | | |
| Lease liabilities | | 83 | | 89 | | |
Contract liabilities (Note 18) | | 39 | | 43 | | |
| | | | |
Derivative financial instruments (Note 23) | | 22 | | 49 | | |
| | | | |
| | | | |
| | | | |
| | 2,065 | | 2,908 | | |
| Non-current liabilities | | | | |
Loans and borrowings (Note 14) | | 11,066 | | 10,535 | | |
| | | | |
Subordinated hybrid notes (Note 14) | | 1,022 | | 596 | | |
| Lease liabilities | | 539 | | 576 | | |
Decommissioning provision (Note 15) | | 540 | | 426 | | |
Contract liabilities (Note 18) | | 305 | | 255 | | |
| | | | |
| | | | |
Deferred tax liabilities (Note 11) | | 2,957 | | 2,868 | | |
Derivative financial instruments (Note 23) | | 116 | | 110 | | |
| Other liabilities | | 174 | | 183 | | |
| | 16,719 | | 15,549 | | |
| Total liabilities | | 18,784 | | 18,457 | | |
| | | | |
| | | | |
| | | | |
| | | | |
| | | | |
| | | | |
| | | | |
| Total equity | | 16,771 | | 17,510 | | |
| Total liabilities and equity | | 35,555 | | 35,967 | | |
| | | | |
| | | | |
| | | | |
| | | | |
See accompanying notes to the audited consolidated financial statements
| | | | | | | | |
| Approved on behalf of the Board of Directors: | | |
| | |
"Maureen E. Howe" Maureen E. Howe Director | | "Henry W. Sykes" Henry W. Sykes Director |
Pembina Pipeline Corporation 2025 Annual Report 85
CONSOLIDATED STATEMENTS OF EARNINGS AND COMPREHENSIVE INCOME
| | | | | | | | | | |
| | | |
| | |
| For the years ended December 31 | | | | |
| ($ millions, except per share amounts) | | | 2025 | 2024 |
Revenue (Note 18) | | | 7,778 | | 7,384 |
Cost of sales (Note 5) | | | 4,794 | | 4,396 |
Share of profit from equity accounted investees (Note 10) | | | 209 | | 328 | |
| | | | |
| Gross profit | | | 3,193 | | 3,316 | |
| General and administrative | | | 477 | | 444 | |
| Other expense (income) | | | 20 | | (4) | |
| Gain on disposal of assets | | | (113) | | (21) | |
| Loss on acquisition | | | — | | 616 | |
| | | | |
| Results from operating activities | | | 2,809 | | 2,281 | |
Net finance costs (Note 19) | | | 602 | | 561 | |
| Earnings before income tax | | | 2,207 | | 1,720 | |
| Current tax expense | | | 432 | | 261 | |
| Deferred tax expense (recovery) | | | 81 | | (415) | |
Income tax expense (recovery) (Note 11) | | | 513 | | (154) | |
| Earnings | | | 1,694 | | 1,874 | |
| Earnings attributable to: | | | | |
| Shareholders | | | 1,694 | | 1,864 | |
| Non-controlling interest | | | — | | 10 | |
| | | | |
Other comprehensive (loss) income, net of tax (Note 22) | | | | |
| | | | |
| Exchange (loss) gain on translation of foreign operations | | | (272) | | 436 | |
| Impact of hedging activities | | | 6 | | (37) | |
Re-measurement of defined benefit asset or liability (Note 20) | | | 32 | | 21 | |
| Other comprehensive (loss) income, net of tax | | | (234) | | 420 | |
| Total comprehensive income attributable to shareholders | | | 1,460 | | 2,294 | |
| Comprehensive income attributable to: | | | | |
| Shareholders | | | 1,460 | | 2,284 | |
| Non-controlling interest | | | — | | 10 | |
| | | | |
Earnings attributable to common shareholders, net of preferred share dividends | | | 1,550 | | 1,721 | |
Earnings per common share – basic (dollars) (Note 17) | | | 2.67 | | 3.00 | |
Earnings per common share – diluted (dollars) (Note 17) | | | 2.66 | | 3.00 | |
Weighted average number of common shares (millions) | | | | |
| Basic | | | 581 | | 573 | |
| Diluted | | | 582 | | 574 | |
|
|
See accompanying notes to the audited consolidated financial statements
86 Pembina Pipeline Corporation 2025 Annual Report
CONSOLIDATED STATEMENTS OF CHANGES IN EQUITY
| | | | | | | | | | | | | | | | | | | | | | | | |
| | Attributable to Shareholders of the Company | | Total Equity |
($ millions) | | Common Share Capital | Preferred Share Capital | Deficit | AOCI(1) | Total | Non-Controlling Interest |
| December 31, 2024 | | 17,008 | | 2,164 | | (2,303) | | 641 | | 17,510 | | — | | 17,510 | |
Total comprehensive income (loss) | | | | | | | | |
Earnings | | — | | — | | 1,694 | | — | | 1,694 | | — | | 1,694 | |
Other comprehensive loss (Note 22) | | — | | — | | — | (234) | | (234) | | — | | (234) | |
| | | | | | | | |
| | | | | | | | |
| | | | | | | | |
| | | | | | | | |
Total comprehensive income (loss) | | — | | — | | 1,694 | | (234) | | 1,460 | | — | | 1,460 | |
Transactions with shareholders of the Company (Note 16) | | | | | | |
| | | | | | | | |
Part VI.1 tax on preferred shares | | — | | (10) | | — | | — | | (10) | | — | | (10) | |
| | | | | | | | |
Preferred shares redemption | | — | | (425) | | — | | — | | (425) | | — | | (425) | |
| | | | | | | | |
Share-based payment transactions | | 8 | | — | | — | | — | | 8 | | — | | 8 | |
Dividends declared – common | | — | | — | | (1,638) | | — | | (1,638) | | — | | (1,638) | |
Dividends declared – preferred | | — | | — | | (134) | | — | | (134) | | — | | (134) | |
| | | | | | | | |
| | | | | | | | |
| | | | | | | | |
| | | | | | | | |
| | | | | | | | |
| Total transactions with shareholders of the Company | | 8 | | (435) | | (1,772) | | — | | (2,199) | | — | | (2,199) | |
| December 31, 2025 | | 17,016 | | 1,729 | | (2,381) | | 407 | | 16,771 | | — | | 16,771 | |
| | | | | | | | |
| December 31, 2023 | | 15,765 | | 2,199 | | (2,372) | | 221 | | 15,813 | | — | | 15,813 | |
Total comprehensive income | | | | | | | | |
Earnings | | — | — | | 1,864 | | — | 1,864 | | 10 | | 1,874 | |
Other comprehensive income (Note 22) | | — | — | — | 420 | | 420 | | — | | 420 | |
| | | | | | | | |
| | | | | | | | |
| Total comprehensive income | | — | — | | 1,864 | | 420 | | 2,284 | | 10 | | 2,294 | |
Transactions with shareholders of the Company (Note 16) | | | | | | |
Common shares issued, net of issue costs | | 1,230 | | — | | — | — | 1,230 | | — | | 1,230 | |
Part VI.1 tax on preferred shares | | — | | (9) | | — | | — | | (9) | | — | | (9) | |
| | | | | | | | |
| | | | | | | | |
Share-based payment transactions | | 13 | | — | | — | | — | | 13 | | — | | 13 | |
Dividends declared – common | | — | | — | | (1,569) | | — | | (1,569) | | — | | (1,569) | |
Dividends declared – preferred | | — | | — | | (132) | | — | | (132) | | — | | (132) | |
Dividend equivalent payment – subscription receipts | | — | | — | | (20) | | — | | (20) | | — | | (20) | |
| Preferred shares reclassified to trade payables and other | | — | | (26) | | — | | — | | (26) | | — | | (26) | |
| Distributions to non-controlling interests | | — | | — | | — | | — | | — | | (12) | | (12) | |
| Non-controlling interest recognized on acquisition | | — | | — | | — | | — | | — | | 148 | | 148 | |
| Purchase of non-controlling interest | | — | | — | | (74) | | — | | (74) | | (146) | | (220) | |
| Total transactions with shareholders of the Company | | 1,243 | | (35) | | (1,795) | | — | | (587) | | (10) | | (597) | |
| December 31, 2024 | | 17,008 | | 2,164 | | (2,303) | | 641 | | 17,510 | | — | | 17,510 | |
|
| | | | | |
|
(1) Accumulated Other Comprehensive Income ("AOCI").
See accompanying notes to the audited consolidated financial statements
Pembina Pipeline Corporation 2025 Annual Report 87
CONSOLIDATED STATEMENTS OF CASH FLOWS
| | | | | | | | | | |
| | | |
| | |
| For the years ended December 31 | | | | |
| ($ millions) | | | 2025 | 2024 |
| Cash provided by (used in) | | | | |
| Operating activities | | | | |
| Earnings | | | 1,694 | | 1,874 | |
| Adjustments for items not involving cash: | | | | |
| | | | |
Share of profit from equity accounted investees (Note 10) | | | (209) | | (328) | |
| | | | |
| Depreciation and amortization | | | 987 | | 862 | |
| Loss on acquisition | | | — | | 616 | |
Unrealized loss from derivative instruments (Note 23) | | | 37 | | 170 | |
Net finance costs (Note 19) | | | 602 | | 561 | |
Share-based compensation expense (Note 21) | | | 94 | | 84 | |
Income tax expense (recovery) (Note 11) | | | 513 | | (154) | |
| Gain on asset disposal | | | (113) | | (21) | |
| | | | |
| Derecognition of insurance contract provision | | | — | | (34) | |
| Cash items paid or received: | | | | |
Distributions from equity accounted investees (Note 10) | | | 544 | | 626 | |
Net interest paid (Note 19) | | | (583) | | (502) | |
| Share-based compensation payment | | | (89) | | (91) | |
| | | | |
| | | | |
| | | | |
| | | | |
| Taxes paid | | | (346) | | (404) | |
| Change in non-cash operating working capital | | | 221 | | (43) | |
Net change in contract liabilities (Note 18) | | | (24) | | (3) | |
| Other | | | (27) | | 1 | |
Cash flow from operating activities | | | 3,301 | | 3,214 | |
| Financing activities | | | | |
Net increase (decrease) in bank borrowings (Note 14) | | | 191 | | (274) | |
| | | | |
| | | | |
Proceeds from issuance of long-term debt, net of issue costs (Note 14) | | | 1,021 | | 2,733 | |
Proceeds from subscription receipts (Note 16) | | | — | | 1,228 | |
| Repayment of long-term debt | | | (1,154) | | (1,009) | |
| Repayment of lease liability | | | (84) | | (78) | |
| | | | |
| | | | |
| Issuance of common shares on exercise of options | | | 6 | | 11 | |
| | | | |
| | | | |
Redemption of preferred shares (Note 16) | | | (451) | | — | |
Common share dividends paid (Note 16) | | | (1,638) | | (1,569) | |
Preferred share dividends paid (Note 16) | | | (134) | | (132) | |
| | | | |
| Distributions to non-controlling interest | | | — | | (12) | |
| Purchase of non-controlling interest | | | — | | (220) | |
| Cash flow (used in) from financing activities | | | (2,243) | | 678 | |
| Investing activities | | | | |
| Capital expenditures | | | (784) | | (955) | |
Contributions to equity accounted investees (Note 10) | | | (410) | | (371) | |
| | | | |
Acquisition net of cash acquired (Note 4) | | | — | | (2,620) | |
| | | | |
| | | | |
| | | | |
| | | | |
| | | | |
| Proceeds from sale of assets | | | 139 | | 38 | |
Interest paid during construction (Note 19) | | | (28) | | (26) | |
Advances to related parties (Note 26) | | | (27) | | — | |
| | | | |
Return of capital from equity accounted investees (Note 10) | | | — | | 63 | |
| | | | |
| | | | |
| Changes in non-cash investing working capital and other | | | 20 | | (42) | |
| | | | |
| | | | |
| | | | |
| | | | |
| | | | |
| | | | |
| Cash flow used in investing activities | | | (1,090) | | (3,913) | |
| Change in cash and cash equivalents | | | (32) | | (21) | |
| | | | |
| Effect of movement in exchange rates on cash held | | | (3) | | 11 | |
| Cash and cash equivalents, beginning of period | | | 141 | | 151 | |
| Cash and cash equivalents, end of period | | | 106 | | 141 | |
| | | | |
| | | | |
|
|
See accompanying notes to the audited consolidated financial statements
88 Pembina Pipeline Corporation 2025 Annual Report
NOTES TO THE CONSOLIDATED FINANCIAL STATEMENTS
1. REPORTING ENTITY
Pembina Pipeline Corporation ("Pembina" or the "Company") is a Calgary-based, leading transportation and midstream service provider serving North America's energy industry. The audited consolidated financial statements ("Consolidated Financial Statements") include the accounts of Pembina, its subsidiary companies, partnerships and any investments in associates and joint arrangements as at and for the year ended December 31, 2025.
Pembina owns an extensive network of strategically located assets which include hydrocarbon liquids and natural gas pipelines, gas gathering and processing facilities, oil and natural gas liquids infrastructure and logistics services, and an export terminals business. Pembina's network of strategically located assets and commercial operations along the majority of the hydrocarbon value chain allow it to offer a full spectrum of midstream and marketing services to the energy sector.
2. BASIS OF PREPARATION
The Consolidated Financial Statements are presented in Canadian dollars, Pembina's functional currency, with all values presented in millions, unless otherwise indicated.
The Consolidated Financial Statements have been prepared in accordance with International Financial Reporting Standards ("IFRS") as issued by the International Accounting Standards Board ("IASB"). The material accounting policies applied in preparation of the Consolidated Financial Statements are set out below in Note 3 and have been applied consistently to all periods presented.
The Consolidated Financial Statements were authorized for issue by Pembina's Board of Directors on February 26, 2026.
a. Basis of Measurement
The Consolidated Financial Statements have been prepared on a historical cost basis with some exceptions, as detailed in the accounting policies set out below.
b. Basis of Consolidation
These Consolidated Financial Statements include the results of the Company and its subsidiaries together with its interests in joint arrangements.
i) Subsidiaries
Subsidiaries are entities, including unincorporated entities such as partnerships, controlled by Pembina. The financial results of subsidiaries are included in the Consolidated Financial Statements from the date that control commences until the date when control ceases. Balances and transactions, including any revenue and expenses, with or between subsidiaries have been eliminated in preparing the Consolidated Financial Statements.
For the acquisition of a controlling ownership interest in Alliance and Aux Sable on April 1, 2024, Pembina elected to measure its initial carrying value of the non-controlling interests equal to the proportionate value of the net assets that the non-controlling interests relate to. Non-controlling interests are recognized as a component of equity and are subsequently increased by the proportionate amount of net income or contributions attributable to the non-controlling interest, and decreased by any distributions paid. After initial recognition, if a non-controlling interest is acquired, the non-controlling interest is derecognized. Differences between the carrying amount of the non-controlling interest and the consideration paid are recognized directly in retained earnings, and are not recognized in earnings.
Pembina Pipeline Corporation 2025 Annual Report 89
ii) Joint Arrangements
Joint arrangements represent arrangements where Pembina has joint control established by a contractual agreement. Joint arrangements give rise to either joint operations or joint ventures. The determination of joint control requires significant judgment about each party's substantive rights, exposure to variability of returns, and the power necessary for the party to affect its respective returns. Joint control exists when decisions about the relevant activities require the unanimous consent of the parties that control the arrangement collectively. Ownership percentage alone may not be a determinant of joint control.
Joint Operations
Pembina recognizes its direct right to the assets, liabilities, revenues and expenses of joint operations and its share of any jointly held or incurred assets, liabilities, revenues and expenses from the date that joint control commences until the date that joint control ceases.
Joint Ventures and the Equity Method
Joint ventures are accounted for using the equity method of accounting. The acquisition of interests in a joint venture that is a business are measured and recorded using the acquisition method. Other acquisitions of interests in a joint venture are measured and recorded at cost. Joint ventures are adjusted thereafter for any change in the Company's share of the investees' net assets.
Pembina's Consolidated Financial Statements include its share of the equity accounted investees' profit or loss and comprehensive income until the date that joint control ceases. When Pembina's share of losses exceeds its interest in an equity accounted investee, the carrying amount of that interest, including any long-term investments, is reduced to nil, and the recognition of further losses is discontinued except to the extent that Pembina has an obligation or has made payments on behalf of the investee. Distributions from and contributions to investments in equity accounted investees are recognized when received or paid.
Unrealized gains arising from transactions with joint ventures are eliminated against the investment to the extent of Pembina's interest in the investee. However, unrealized gains that arise in a circumstance where the Company has contributed a business to a joint venture are fully recognized. Losses are eliminated in the same way as unrealized gains, but only to the extent that there is no evidence of impairment.
Business Combinations Achieved in Stages
When Pembina acquires control of investees that it previously had joint control or significant influence of, the previously recognized equity investment is remeasured to fair value and recorded as an in-substance disposition, with a corresponding gain or loss recognized for the difference between the fair value and the carrying value on the acquisition date. An allocation of goodwill is included in the carrying value of the net assets disposed, however, the derecognition of deferred tax liabilities previously recognized by Pembina on its investment in the investees is excluded from the measurement of the gain or loss and presented separately.
When measuring the acquired assets, assumed liabilities, non-controlling interests, and goodwill acquired in a business combination achieved in stages, the fair value of Pembina's ownership in the investees as well as the fair value of the other previous relationships with the investees are included as part of the consideration paid in exchange for the business.
90 Pembina Pipeline Corporation 2025 Annual Report
iii) Foreign Currency
For each subsidiary and joint venture, Pembina determines the entity's respective functional currency. The assets and liabilities of these entities, whose functional currencies are other than Canadian dollars, are translated into Canadian dollars at the foreign exchange rate as at the reporting date, while revenues and expenses are translated using average monthly foreign exchange rates. Foreign exchange differences arising on translation of these entities are included in exchange gain (loss) on translation of foreign operations in other comprehensive income. Judgments are required concerning the entity's economic environment in which it operates and the nature of the cash flows that materialize, with consideration given to the currency that influences sales prices, financing activities, the country whose competitive forces and regulatory environment has the most influence, and the currency that most significantly impacts operating costs and economics.
c. Use of Estimates and Judgments
The preparation of the Consolidated Financial Statements in conformity with IFRS requires management to make judgments, estimates, and assumptions that are based on facts and circumstances as at the date of the Consolidated Financial Statements, which could affect the reported amounts of assets, liabilities, income and expenses. Actual results may differ from these estimates.
Judgments, estimates, and underlying assumptions are reviewed on an ongoing basis. Revisions to accounting estimates are recognized in the period in which the estimates are revised and in any future periods affected. Information about estimates and judgments made in applying accounting policies that have the most significant effects on the amounts recognized in the financial statements is included in the following notes:
Judgments
•Note 2(b)(ii): Assessment of joint control for joint arrangements;
•Note 3(f)(ii): The determination of cash generating units ("CGUs") in the assessment of non-financial asset impairments;
•Note 3(i): Identification of performance obligations in revenue arrangements; and
•Note 3(b)(v): Assessment of whether recontracting services constitutes net settlement of the original supplier agreement.
Estimates
•Note 3(f)(ii): Recoverability of non-financial assets; and
•Note 23: Fair value of Level 3 derivative instruments.
3. MATERIAL ACCOUNTING POLICIES
a. Inventories
Inventories are measured at the lower of cost and net realizable value and consist primarily of crude oil, natural gas liquids ("NGL") and spare parts that are expected to be used within one year of the financial reporting date. The cost of inventories is determined using the weighted average costing method and includes direct purchase costs and when applicable, costs of production, extraction, fractionation, and transportation. All changes in the measurement of inventories are reflected in earnings.
b. Financial Instruments
Financial assets and liabilities are offset and the net amount presented in the Consolidated Statement of Financial Position when, and only when, Pembina has a legal right to offset the amounts and intends either to settle on a net basis or to realize the asset and settle the liability simultaneously.
Pembina Pipeline Corporation 2025 Annual Report 91
i) Non-Derivative Financial Assets
Pembina initially recognizes trade receivables, loan receivables and cash deposits on the date that they are originated. All other financial assets are recognized on the trade date at which Pembina becomes a party to the contractual provisions of the instrument.
Pembina derecognizes a financial asset when the contractual rights to the cash flows from the asset expire, or it transfers the rights to receive the contractual cash flows and the related risks and rewards of ownership in a transaction with a third party. Any remaining interest of a transferred financial asset is recognized as a separate asset or liability. On derecognition, the difference between the carrying amount and the consideration received is recognized in earnings.
Pembina classifies non-derivative financial assets into the following categories:
Financial Assets at Amortized Cost
A financial asset is classified in this category if the asset is held for the intention of collecting contractual cash flows on specified dates that are solely payments of principal and interest. At initial recognition, financial assets at amortized cost are recognized at fair value plus directly attributable transaction costs. After initial recognition, these financial assets are recorded at amortized cost using the effective interest method less any expected credit losses and impairment loss allowances. Pembina's non-derivative financial assets measured at amortized cost include cash and cash equivalents, trade receivables and other, and other assets.
Financial Assets at Fair Value Through Other Comprehensive Income
A financial asset is classified in this category if the asset is held for the intention of both collecting contractual cash flows and selling financial assets.
ii) Non-Derivative Financial Liabilities
Pembina's non-derivative financial liabilities are comprised of trade payables and other, loans and borrowings, and other liabilities.
Pembina initially recognizes non-derivative financial liabilities at fair value less any directly attributable transaction costs, on the trade date at which Pembina becomes a party to the contractual provisions of the instrument. After initial recognition these financial liabilities are measured at amortized cost using the effective interest method.
Pembina derecognizes a financial liability when its contractual obligations are discharged, cancelled or expire. On derecognition, the difference between the carrying value of the liability and the consideration paid, including any non-cash assets transferred or liabilities assumed, is recognized in earnings.
Pembina records a modification or exchange of an existing liability as a derecognition of the original financial liability if the terms are substantially different, assessing both qualitative and quantitative factors. In doing so, the original instrument is derecognized with any extinguishment gain or loss recognized in net finance expense, and the modified or exchanged instrument is accounted for as a new instrument.
If the expected cashflows of an existing non-derivative liability are modified but the modification is not treated as a derecognition, Pembina adjusts the gross carrying amount of the liability to the present value of the estimated contractual cash flows using the instrument's original effective interest rate, with the difference recorded in earnings. However, if contractual cashflows include variable market interest payments, such as Pembina's revolving credit facilities, the effective interest rate on the instrument is revised at the same time as the revision to the estimated cashflows resulting in no change to the carrying value of the financial liability.
92 Pembina Pipeline Corporation 2025 Annual Report
iii) Common Share Capital
Common shares and share options arising from share-based payment transactions are classified as equity. When the company repurchases its own common shares, share capital is reduced by the average carrying value of the shares repurchased. The excess of the purchase price over the average carrying value is recognized as an increase in deficit. Shares are cancelled upon repurchase.
iv) Preferred Share Capital
Preferred shares are classified as equity because they bear discretionary dividends and do not contain any obligations to deliver cash or other financial assets. Pembina’s preferred shares include a redemption option that allow Pembina to call the instrument. If Pembina provides a redemption notice to the preferred shareholders, the instrument is reclassified from equity to be a financial liability until the redemption amount is paid and the shares are cancelled.
v) Derivative and Hedge Accounting
Contracts that meet the definition of a derivative instrument are recorded at fair value through earnings. This includes contracts for the delivery of commodities or services where the contract or underlying commodity being delivered is net cash settleable, unless the Company has (a) applied the "own use" (or "normal purchase normal sale") scope exemption, or (b) the derivative instrument has formally been designated as a hedging instrument.
To assess whether the own-use scope exemption is appropriate, Pembina uses judgment to evaluate whether (a) the transaction is reasonable in relation to the business needs; and (b) the business has the intent to deliver or take delivery of the underlying item or commodity. Application of the own use scope exemption is reviewed each reporting period to assess whether the qualifying factors continue to be met.
When Pembina recontracts services received from a supplier to a separate customer, judgment is required to assess whether the arrangement constitutes a net settlement of the original supplier agreement. This evaluation involves analyzing the rights and obligations of all parties, the Company's continued exposure to risks under the supplier contract, and whether the Company provides incremental goods or services to the customer. The conclusion of the assessment determines whether the agreements are accounted for as financial instruments or under other standards, which can result in significantly different accounting outcomes.
Derivative instruments that arise from financial contracts do not qualify for the own use scope exemption as such transactions do not result in physical settlement or delivery of the underlying item or commodity. Rather, these arrangements form part of Pembina's risk management strategy, whereby derivative instruments are used to assist in managing exposure to commodity prices, interest rates, and foreign exchange rates.
All unrealized and realized gains and losses from physical derivative instruments and commodity-related financial derivative instruments (purchases, sales, and related foreign exchange instruments) are recorded on a net basis in revenue as Revenue from risk management and other derivative contracts. All unrealized and realized gains and losses from non-commodity related financial instruments (interest rate and foreign exchange instruments) are included in Net finance costs.
Embedded derivatives in other financial instruments or other contracts (host contracts) are recorded separately if the following criteria are met: (a) The economic characteristics and risks are not closely related to the host contract; (b) a separate instrument with the same terms as the embedded derivative would meet the definition of a derivative; and, (c) the host contract is not measured at fair value through profit or loss. The embedded derivative can be formally designated as a hedging instrument or recorded at fair value, with changes in fair value recorded in earnings (see Note 23 Financial Instruments & Risk Management). If a separable option-based embedded derivative in a revenue contract has a fair value at contract inception, a corresponding contract asset or liability is attributed to the revenue contract that results in a decrease or increase, respectively, to revenue as the future services are provided (see Note 18(b) Revenue - Contract Liabilities).
Pembina Pipeline Corporation 2025 Annual Report 93
Derivative instruments executed for risk management purposes may be designated as hedging instruments. At the inception and formal designation of the hedge relationship, Pembina documents the following: The relationship between the hedging instrument and hedged item; the related risk management strategy and objectives; the nature of the risk being hedged; and, how the Company will assess whether the hedging relationship meets the hedge effectiveness requirements on an ongoing basis. Hedge accounting is discontinued prospectively when the hedging relationship no longer qualifies for hedge accounting, or the hedging instrument is sold or terminated.
All derivative instruments that have been formally designated as hedging instruments are accounted for and classified as either: (a) cash flow hedges; or (b) net investment hedges. For both classifications, the effective portion of gains or losses is recognized and accumulated in 'other comprehensive income' ("OCI"), while any ineffective portion is recognized immediately in earnings. For Pembina's cash flow hedges, the amount accumulated in OCI is reclassified into earnings when the hedged forecasted transaction occurs. For net investment hedges, the amount accumulated in OCI is reclassified to earnings on disposal of the foreign operation.
c. Property, Plant and Equipment
Items of property, plant and equipment are measured initially at cost, or at fair value if acquired as part of a business combination or have been transferred from a customer. Such a fair value is determined using either (a) comparable and observable market values when available, (b) an income approach, or (c) the depreciated replacement cost valuation method.
Depreciation is measured on a straight line or declining balance basis over the useful life of the asset, commencing when an asset is placed into service, and is included in cost of sales and general and administrative expense. Estimated useful lives are based on management's assumptions, such as, an asset's economic life and physical life, which can include the relevant commodity reserves in a particular production area that the asset serves. Assets are also assessed to determine whether they may have significant components with different useful lives. Estimated useful lives and depreciation methods are reviewed annually and are subject to revision based on new or additional information. Pembina has assessed the residual values of depreciable assets to be insignificant.
d. Intangible Assets and Goodwill
Intangible assets that are acquired individually are initially measured at cost or measured at fair value if acquired as part of a business combination. Intangible assets other than goodwill are amortized straight-line over their estimated remaining useful life, based on their remaining carrying value. Amortization expense is included in cost of sales and general and administrative expense. Finite intangible assets include purchase and sales contracts and other, customer relationships and certain software costs.
Amortization methods, useful lives and residual values are reviewed annually and adjusted if appropriate. Goodwill is not amortized.
e. Leases
A specific asset is the subject of a lease if a contract conveys the right to control the use of that identified asset for a period of time in exchange for consideration. This determination is made at inception of a contract, on the acquisition date if acquired as part of a business combination, or when the terms and conditions of the contract are amended.
At inception or on reassessment of a contract that contains a lease component, Pembina allocates contract consideration to the lease and non-lease components based on the components' relative stand-alone prices. The consideration allocated to the lease components is recognized in accordance with the policies for lessee and lessor leases, as described below. The consideration allocated to non-lease components is recognized in accordance with the nature of the non-lease component.
94 Pembina Pipeline Corporation 2025 Annual Report
i) Lessee
The lease liability is initially measured at the present value of the lease payments, discounted using the rate Pembina would be required to pay to borrow over a similar term with a similar security to obtain an asset of a similar value to the right-of-use asset, or using the interest rate implicit in the lease if readily determinable. Lease payments used in the calculation of the lease liability exclude variable payments unless those payments are in-substance fixed. Lease payments in an optional renewal period are included in the lease liability if Pembina is reasonably certain to exercise such an option. Management applies its best estimate with respect to the likelihood of exercising renewal, extension and termination options in determining the lease term. The lease liability is subsequently increased by interest expense and decreased by lease payments made.
The lease liability is remeasured when there is a change in future lease payments arising from a previously-variable payment becoming in-substance fixed, or a change in the assessment of whether a purchase option, extension option or termination option is reasonably certain to be exercised. A corresponding adjustment is made to the right-of-use asset when a liability is remeasured, or the adjustment is recorded in earnings if the right-of-use asset has been reduced to zero. Right-of-use assets are initially recognized at an amount equal to the lease liability, then subsequently depreciated over the lease term on a straight-line basis and adjusted for any lease liability remeasurements. The right-of-use assets are included in the respective CGUs for the purposes of impairment testing.
Pembina has elected to apply the recognition exemptions for short-term and low value leases. Pembina recognizes lease payments associated with these leases as an expense on a straight-line basis over the lease term.
ii) Lessor
Lessor leases are classified as either operating leases or finance leases according to the substance of the contract at contract inception. Leases transferring substantially all of the risks incidental to asset ownership are classified as finance leases, while all other leases are classified as operating leases. Subleases are classified as either operating or finance leases in reference to the right-of-use asset arising from the head lease.
Finance lease receivables acquired in a business combination are initially recognized at an amount equal to the fair value of the underlying leased assets. Finance lease receivables outside of a business combination are initially measured at the net present value of the future lease payments and the unguaranteed residual values of the underlying assets, discounted using the interest rate implicit in the lease.
Lessor lease income is generated from physical assets in the normal course of operations and recognized in revenue starting from the commencement date of a lease. The timing and amount of the lease income depends on the classification of the lease and characteristics of the cashflows.
Lease payments received for finance leases include both the finance income and a principal repayment of the finance lease receivable. The finance income on the finance lease receivable is recognized using the interest rate implicit in the lease and recognized in lease income. Payments related to the principal repayment are not recognized in earnings and are classified as investing cashflows in the Consolidated Statements of Cash Flows.
Lease payments from operating leases are recognized in lease income on a straight-line basis and are fully recognized in earnings and operating cash flows in the Consolidated Statements of Cash Flows. When the timing of lease income for operating leases differs from when Pembina is entitled to the associated lease payment, a deferred lease asset or liability is recognized in the Consolidated Statement of Financial Position.
Variable lease income represents lease payments that were uncertain and are excluded from measurement of a finance lease receivable and are comprised of non-minimum charges based on customer-usage. Variable lease income is recognized in the period the uncertainty is resolved.
Pembina Pipeline Corporation 2025 Annual Report 95
f. Impairment
i) Non-Derivative Financial Assets
Impairment of financial assets carried at amortized cost is assessed using the lifetime expected credit loss of the financial asset at initial recognition and throughout the life of the financial asset. However, if credit risk has not increased significantly since initial recognition, impairment is assessed at the 12-month expected credit loss of the financial asset at the reporting date.
Impairment losses are recognized in earnings and reflected as a reduction in the related financial asset.
ii) Non-Financial Assets
Non-financial assets, other than inventory, assets arising from employee benefits, and deferred tax assets, are assessed at each reporting date to determine whether there is any indication of impairment. If any such indication exists, the asset's recoverable amount is estimated.
Goodwill is assessed at each reporting date to determine whether there is any indication of impairment. In addition, goodwill is tested for impairment annually, or more frequently, if an impairment indicator exists.
For the purpose of impairment testing, assets that cannot be tested individually are grouped together into CGUs. CGUs are the smallest group of assets that generate cash inflows from the continued use of the related assets, and are largely independent from other assets. CGUs may incorporate integrated assets from multiple operating segments, which reflects the lowest level at which goodwill is monitored for management purposes. Goodwill acquired in a business combination is allocated to CGUs or groups of CGUs that are expected to benefit from the synergies of the combination. In determining CGUs, significant management judgment is required to assess what constitutes independent cash flows. When an impairment test is performed, the carrying value of a CGU or group of CGUs is compared to its recoverable amount. As such, the asset composition of a CGU or group of CGUs directly impacts both the carrying value and recoverability of the assets included therein.
An impairment loss is recognized if the carrying amount of an asset, CGU or group of CGUs exceeds its estimated recoverable amount. The estimated recoverable amount is determined as the higher of value in use and fair value less costs of disposal, by using either the income (cash flow) approach or comparable market transactions, if available. When using the income approach, management is required to make significant estimates and assumptions concerning future cash flows, which are impacted by energy transition considerations, access to global markets, and business contracting assumptions. In addition, when determining the appropriate discount rate, management is required to make assumptions concerning the current industry and economic environment, as well as asset and cash-flow specific risk premiums.
These estimates and assumptions are susceptible to change and may differ from actual future developments. This estimation uncertainty could impact quantified recoverable amounts; and therefore, any related impairment charges, which may be material.
Impairment losses are recognized in earnings. Impairment losses recognized in respect of a CGU (group of CGUs) are allocated first to reduce the carrying amount of any goodwill allocated to the CGU (group of CGUs), and then to reduce the carrying amounts of the other assets in the CGU (group of CGUs) on a pro rata basis.
For non-financial assets, excluding goodwill, impairment losses recognized in prior periods are assessed at each reporting date for any indications that the loss has decreased or no longer exists. An impairment loss is reversed if there has been a change in the estimates used to determine the recoverable amount. An impairment loss is reversed only to the extent that the asset's carrying amount does not exceed the carrying amount that would have been determined, net of depreciation or amortization, if no impairment loss had been recognized. An impairment reversal is recognized in earnings under impairment (reversal) expense. An impairment loss in respect of goodwill is not reversed.
96 Pembina Pipeline Corporation 2025 Annual Report
Goodwill that forms part of the carrying amount of an investment in an equity accounted investee is not recognized separately; and therefore, is not tested for impairment separately. Rather, the investment, including its respective goodwill, is tested for impairment as a single asset when there is objective evidence it may be impaired as a result of one or more events having occurred that could negatively impact the estimated future cash flows from the investment. If the investment does not generate cash flows that are largely independent of those from other Pembina assets, its carrying value is added to a CGU to which the investment relates.
g. Employee Benefits
i) Defined Benefit Pension Plans
Pembina's net obligation in respect of defined benefit pension plans is calculated separately for each plan by estimating the amount of future benefit that employees have earned in return for their service in the current and prior periods, discounted to determine its present value, less the fair value of any plan assets. The discount rate used to determine the present value is established by referencing market yields on high-quality corporate bonds on the measurement date with cash flows that match the timing and amount of expected benefits.
The calculation of the defined benefit obligation is performed each reporting period; however, the calculation of the actuarial funding valuation is performed, at a minimum, every three years by a qualified actuary using the actuarial cost method. The actuarial valuation is prepared using management's best estimates with respect to longevity, discount and inflation rates, compensation increases, market returns on plan assets, retirement and termination rates. When the calculation results in a benefit to Pembina, the recognized asset is limited to the present value of economic benefits available in the form of future expenses payable from the plan, any future refunds from the plan or reductions in future contributions to the plan.
Pembina recognizes all actuarial gains and losses arising from defined benefit plans in other comprehensive income and expenses related to defined benefit plans in earnings.
ii) Share-Based Payment Transactions
For equity settled share-based payment plans ("options"), the fair value of the share-based payment at grant date is recognized as an expense, with a corresponding increase in equity, over the period that the employees unconditionally become entitled to the awards. The amount recognized as an expense is adjusted to reflect the number of awards for which the related service and non-market vesting conditions are expected to be met, such that the amount ultimately recognized as an expense is based on the number of awards that meet the related service conditions at the vesting date.
The fair value of options are measured using the Black-Scholes formula on grant date. Measurement inputs include share price on measurement date, exercise price of the option, expected volatility (based on weighted average historic volatility), weighted average expected life of the option (based on historical experience and general option holder behavior), expected dividends, expected forfeitures and the risk-free interest rate (based on government bonds). Service and performance conditions attached to the transactions are not taken into account in determining fair value. The fair value of the long-term share unit award incentive plan and associated distribution units are measured based on the volume-weighted average price of Pembina's shares for the 20 days ending of the relevant financial year.
For cash settled share-based payment plans, the fair value of the amount payable to employees is recognized as an expense with a corresponding increase in liabilities, over the period that the employees unconditionally become entitled to payment. The liability is remeasured at each reporting date and at settlement date. The fair value is determined by using a model that takes into account the extent to which the employees have rendered services or performance conditions to date, and other market conditions which may impact the number of awards expected to be earned and vest. Any changes in the fair value of the liability are recognized as an expense in earnings.
Pembina Pipeline Corporation 2025 Annual Report 97
h. Provisions
A provision is recognized if, as a result of a past event, Pembina has a present legal or constructive obligation that can be estimated reliably, and it is probable that an outflow of economic resources will be required to settle the obligation. With regards to these potential obligations, Pembina considers environmental laws, regulations and interpretations by regulatory authorities in determining expected cash flows.
Provisions are measured at each reporting date based on the best estimate of the settlement amount. Where the effect of the time value of money is material, provisions are discounted at a pre-tax rate that reflects current market assessments of the time value of money and the risks specific to the liability. The unwinding of the discount rate is recognized as accretion in finance costs.
i) Decommissioning Provision
Pembina's activities give rise to certain dismantling, decommissioning, environmental reclamation, and remediation obligations at the end of an asset's economic life. Decommissioning costs are recognized as part of the cost of the relevant asset. The unwinding of the discount is expensed as incurred and recognized in net finance costs. To measure the decommissioning provision, estimated future expected cash flows, including assumptions concerning inflation and anticipated changes in environmental laws and regulations, are discounted using a credit-adjusted risk-free rate. Changes in the estimated future expected cash flows used in measuring the decommissioning provision are added to or deducted from the cost of the respective asset to which the decommissioning provision relates.
i. Revenue
Pembina recognizes revenue equal to the consideration that it is entitled to for satisfying a performance obligation to a customer.
Performance obligations in Pembina's contracts with customers include:
•promises to perform or provide the right to transportation, liquefaction, fractionation, terminalling, storage services, and construction over a specified contractual term and/or for a specified volume of commodities; and
•promises to transfer control of commodities to the customer at a specified time periods and locations.
Certain contracts may arise that require Pembina to apply significant judgment when identifying the contract's performance obligations where (i) Pembina is providing both services and commodities; (ii) Pembina is providing services and purchasing commodities from the same counterparty; or (iii) Pembina is both purchasing and selling commodities from the same counterparty.
In contracts where Pembina performs service-type activities to enhance the value of a product and is either purchasing or selling the product, identification of the performance obligations in the contract will depend on whether Pembina or the customer has control of the product when Pembina performs the service activity. If Pembina controls a product while performing the service activity that enhances the product, the service activity is for Pembina’s benefit and is not considered a performance obligation. As a result, any fees that Pembina receives from a supplier for performing a service for Pembina’s benefit are treated as a reduction in the purchase price of the product rather than as revenue, or in the case of a product sales contract, any fees related to performing the service are allocated to the product sales revenue rather than separately recognizing service revenues.
Other situations may have Pembina purchasing and subsequently selling a product without ever obtaining control of that product or selling and then subsequently repurchasing a product without ever losing control of the product. In these cases, Management will determine whether the substance of the arrangement is to provide a service to a customer where the net proceeds will be recognized as service revenue, or to receive a service where the net proceeds will be recognized as a cost outside of revenue.
98 Pembina Pipeline Corporation 2025 Annual Report
For the Alliance Pipeline, Pembina is required to share a portion of fee-for-service and take-or-pay revenue earned on competitively priced volumes above minimum volume thresholds with customers who have take-or-pay contracts. This shared revenue is recorded as a reduction to the associated revenue, such that net revenue only reflects Pembina's portion that it retains. The portion payable to firm shippers is recognized as a refund liability.
Pembina disaggregates its revenue streams from contacts with customers into three categories based on the nature of the revenue generating activity and the certainty of the associated cashflows to be received from the customer. Information about the nature of the services provided, consideration received, and timing of the satisfaction of performance obligations for each category is discussed below.
i) Take-or-Pay
Transportation, liquefaction, and other services
Under take-or-pay contracts, Pembina offers transportation, liquefaction, fractionation, terminalling, and storage services that are either provided directly by Pembina or Pembina provides its right to use such services to the customer. In a take-or-pay contract, Pembina is entitled to a minimum fee for the firm service promised to a customer over the contract period, regardless of actual volumes transported, liquified, fractionated, terminalled, or stored. This minimum fee is either a set fee for an annual minimum volume, or an annual minimum revenue requirement. In addition, the minimum fee may include variable consideration for operating or capital costs incurred by Pembina that are recovered from the customer. Estimating the variable consideration to be recognized involves judgment, particularly in assessing the risk of a significant revenue reversal. For contracts where management has identified multiple performance obligations, management estimates the stand-alone selling price of each performance obligation taking into consideration the location and volume of goods and services being provided, the market environment, and customer specific considerations.
Pembina satisfies its performance obligations and recognizes revenue for services under take-or-pay commitments when volumes are transported, liquefied, terminalled, stored, or capacity utilized. Make-up rights may arise when a customer does not fulfill their minimum volume commitment in a certain period but is allowed to use the delivery of past or future volumes to meet this commitment. These make-up rights are subject to expiry and have varying conditions associated with them. When contract terms allow a customer to exercise their make-up rights using firm volume commitments, revenue is not recognized until these make-up rights are used, expire, or management determines breakage has occurred. If Pembina bills a customer for unused service in an earlier period and the customer utilizes available make-up rights, Pembina records a refund liability for the amount to be returned to the customer through an annual adjustment process. For contracts where no make-up rights exist, revenue is recognized to take-or-pay levels once Pembina has an enforceable right to payment for the take-or-pay volumes. Make-up rights generally expire within a contract year and substantially all the related contract years follow the calendar year.
As a result of deferring revenue related to customer underutilization until the earlier of when the customer uses the volumes or the customers' make-up rights expire, a portion of cashflows received from the customer in early quarters of the year is deferred and not recognized in revenue until later quarters, although there is no impact on cash flows received from the customers.
When up-front payments or non-cash consideration is received in exchange for future services to be performed, revenue is deferred as a contract liability and recognized over the period the performance obligation is expected to be satisfied. Non- cash consideration is measured at fair value when received.
Pembina Pipeline Corporation 2025 Annual Report 99
Operating services
When a contract has the effect of providing the customer with a lease over a Pembina-owned transportation, terminalling, or storage asset, Pembina remains responsible for operating and maintaining the asset over the contract term. Pembina’s promise to provide a service of operating a leased asset is a stand-ready performance obligation. Fixed fees earned for operating services are recognized evenly over the contract term and variable flow-through fees, including capital maintenance and turnaround charges, are recognized in the period the services are performed. When the timing of payments received in exchange for the services performed differs from when the work is performed and the revenue recognized, a contract asset or liability is recognized in the Consolidated Statement of Financial Position.
ii) Fee-for-Service
Fee-for-service revenue includes firm contracted revenue that is not subject to take-or-pay commitments and interruptible service. Pembina satisfies its performance obligations for transportation, liquefaction, fractionation, terminalling, and storage as volumes of product are transported, liquefied, fractionated, terminalled, or capacity utilized. Revenue is based on a contracted fee and consideration is variable with respect to volumes. Payment is generally due in the month following Pembina's provision of service and revenue is recognized as the performance obligation is satisfied.
iii) Product Sales
Pembina's performance obligation in a product sale is to transfer control of a distinct product or products to the customer. Pembina satisfies its performance obligation on product sales and recognizes the associated revenue when the customer obtains control of the product, which may differ from when legal title or physical custody transfers. The determination of control requires judgments in determining who has the rights to direct the use of and obtain substantially all the remaining economic benefits from the specified product. Such judgments consider the specific nature and purposes of the product in relation to Pembina's operations and business model, the location and point of sale, and what purpose the product serves for the customer.
Product sale contracts that are concluded to be derivative instruments and that settle by physical delivery of the underlying commodity are not accounted for as revenue from contracts with customers. Rather, such derivative instruments are recorded on a net basis in revenue as 'Revenue from risk management and other derivative contracts'.
j. Income Tax
Income tax expense comprises current and deferred tax. Current and deferred taxes are recognized in earnings except to the extent that they relate to a business combination, or items that are recognized directly in equity or in other comprehensive income.
Deferred tax is recognized in respect of temporary differences between the carrying amounts of assets and liabilities for financial reporting purposes and the amounts used for taxation purposes. Deferred tax is not recognized for:
•Temporary differences relating to investments in subsidiaries and joint arrangements to the extent that it is probable that they will not reverse in the foreseeable future; and,
•Taxable temporary differences arising on the initial recognition of goodwill.
The measurement of deferred tax reflects the tax consequences that would follow the manner in which Pembina expects, at the end of the reporting period, to recover or settle the carrying amount of its assets and liabilities.
Deferred tax is measured at the tax rates that are expected to be applied to temporary differences when they reverse, based on the laws that have been enacted or substantively enacted by the reporting date.
100 Pembina Pipeline Corporation 2025 Annual Report
Deferred tax assets and liabilities are offset only if there is a legally enforceable right to offset, and they relate to income taxes levied by the same taxation authority on either: i) the same taxable entity; or ii) different taxable entities where the intent is to settle current tax liabilities and assets on a net basis, or where tax liabilities and assets will be realized simultaneously in each future period.
The calculation of the deferred tax asset or liability is based on assumptions about the timing of many taxable events and the enacted or substantively enacted rates anticipated to be applicable to income in the years in which temporary differences are expected to be realized or reversed. Deferred income tax assets are recognized to the extent that it is probable that the deductible temporary differences will be recoverable in future periods and estimates and judgment are used in assessing the recognition. Deferred tax assets are reviewed at each reporting date and are reduced to the extent that it is no longer probable that the related tax benefit will be realized. Estimates including, but not limited to, the timing of reversal and future taxability may differ on actual realization and may result in an income tax charge or credit in future periods.
In determining the amount of current and deferred tax, Pembina considers income tax exposures and whether additional taxes and interest may be due. This assessment relies on estimates and assumptions and may involve a series of judgments about future events. New information may become available that causes Pembina to change its judgment regarding the adequacy of existing tax liabilities, such changes to tax liabilities will impact tax expense in the period that such a determination is made.
k. Segment Reporting
An operating segment is a component of Pembina that engages in business activities from which it may earn revenues and incur expenses, including revenues and expenses that relate to transactions with any of the Company's other components. All operating segments' operating results are reviewed regularly by Pembina's President and Chief Executive Officer ("CEO"), Chief Financial Officer ("CFO") and other Officers to make decisions about resources to be allocated to the segment and assess its performance, and for which discrete financial information is available.
Segment results that are reported to the CEO, CFO and other Officers include items directly attributable to a segment as well as those that can be allocated on a reasonable basis.
l. New Standards and Interpretations Not Yet Adopted
Pembina continually monitors for new accounting standards and amendments to existing accounting standards issued by the IASB. The new standards or amendments are not expected to have a material impact to Pembina’s financial statements except for the items outlined below.
i) IFRS 18 Presentation and Disclosure in Financial Statements ("IFRS 18")
IFRS 18 was issued in April 2024 and effective January 1, 2027, with early application permitted. The standard introduces key changes to the structure of the statement of earnings and comprehensive income, required disclosures for certain management-defined performance measures, and aggregation and disaggregation of line items in the financial statements. Pembina is currently reviewing the impact of this standard on its Consolidated Financial Statements.
Pembina Pipeline Corporation 2025 Annual Report 101
4. ACQUISITION
On April 1, 2024, Pembina completed the acquisition of Enbridge Inc.'s interests in the Alliance, Aux Sable, and NRGreen joint ventures (the "Acquirees") for an aggregate purchase price of $2.8 billion, net of $327 million of assumed debt, representing Enbridge's proportionate share of the indebtedness of Alliance (the "Alliance/Aux Sable Acquisition"). Pembina's completion of the Alliance/Aux Sable Acquisition resulted in an in-substance disposition at fair value of $2.6 billion for the Company's previous investments, which were accounted for under the equity method of accounting at $2.8 billion, as well as allocated goodwill of $380 million, resulting in a loss on disposition of $616 million. The loss was offset by a deferred tax recovery of $626 million. The loss on disposition and the deferred tax recovery were recorded in the Consolidated Statement of Earnings and Comprehensive Income for the year ended December 31, 2024. The fair value of the previously held equity investment in the Acquirees is included as a component of the purchase price.
Following the Acquisition, Pembina owned all equity interests in Alliance, Aux Sable's Canadian operations and NRGreen businesses, and an 85.4 percent interest in Aux Sable's U.S. operations. Pembina made no adjustments to the purchase price allocation during the first quarter of 2025 and finalized it as at March 31, 2025.
The final purchase price allocation is based on assessed fair values and is as follows:
| | | | | | | | | | | | | | | | | |
| As at April 1, 2024 | Previously reported | Adjustments | Final | | | | | | |
| ($ millions) | in Q2 2024 | | | |
| Purchase Price Consideration | | | | |
| Cash (net of cash acquired) | 2,620 | | — | | 2,620 | | |
| Equity investment in Acquirees | 2,562 | | — | | 2,562 | | |
| Other | 12 | | — | | 12 | | |
| 5,194 | | — | | 5,194 | | |
| Fair Value of Net Assets Acquired | | | | |
| Current assets | 240 | | — | | 240 | | |
| Property, plant and equipment | 6,339 | | 6 | | 6,345 | | |
| Other long-term assets | 38 | | 19 | | 57 | | |
| Goodwill | 805 | | (2) | | 803 | | | | | | | |
| Current liabilities | (219) | | (17) | | (236) | | | | | | | |
| Long-term debt | (596) | | — | | (596) | | | | | | | |
| Deferred tax liabilities | (937) | | 1 | | (936) | | | | | | | |
| Provisions | (52) | | — | | (52) | | | | | | | |
| Other long-term liabilities | (276) | | (7) | | (283) | | | | | | | |
| Non-controlling interest in Aux Sable's U.S. operations | (148) | | — | | (148) | | | | | | | |
| 5,194 | | — | | 5,194 | | | | | | | |
The fair value of Pembina's previous equity investment in the Acquirees was determined based on the negotiated purchase price paid to Enbridge, adjusted for identified control synergies measured using a discounted cash flow model. Goodwill of $803 million recognized on the transaction is a result of deferred taxes recognized on the transaction, which are recorded at the Company's effective tax rate without discounting. Pembina recognized $24 million in acquisition-related expenses. All acquisition-related expenses have been expensed as incurred and are included in other expenses in the Consolidated Financial Statements.
On August 1, 2024, Pembina acquired the remaining 14.6 percent interest in Aux Sable's U.S. operations from certain subsidiaries of The Williams Companies for U.S. $160 million. Pembina's subsequent acquisition of the non-controlling interest was recorded directly in equity.
102 Pembina Pipeline Corporation 2025 Annual Report
5. OPERATING SEGMENTS
Pembina determines its reportable segments based on the nature of operations and includes three operating segments: Pipelines, Facilities and Marketing & New Ventures.
The Pipelines segment includes conventional, oil sands and transmission pipeline systems, crude oil storage and terminalling business and related infrastructure serving various markets and basins across North America.
The Facilities segment includes fractionation facilities and related infrastructure, and a liquefied propane export facility on Canada's West Coast. In addition, all NGL transported along the Alliance Pipeline are extracted through the Pembina operated Channahon Facility at the terminus. These facilities provide Pembina's customers with natural gas and NGL services that are fully accessible to Pembina's other strategically located assets and pipeline systems. The Facilities segment also includes a bulk marine terminal in the Port of Vancouver, Canada.
The Marketing & New Ventures segment undertakes value-added commodity marketing activities including buying and selling products, commodity arbitrage, and optimizing storage opportunities, by contracting capacity on Pembina's and various third-party pipelines and utilizing Pembina's rail fleet and rail logistics capabilities. Marketing & New Ventures activities also include identifying commercial opportunities to further develop other Pembina assets, to optimize Pembina's existing rights to services provided by other parties, and to develop value chain extending projects. Pembina's Marketing business also includes sales of products from Aux Sable's NGL extraction facility near Chicago, Illinois and other natural gas and NGL processing facilities, logistics and distribution assets in the United States and Canada.
The financial results of the operating segments are included below. Performance is measured based on results from operating activities, as included in the internal management reports that are reviewed by Pembina's CEO, CFO and other Officers. These results are used to measure performance as management believes that such information is the most relevant in evaluating results of certain segments relative to other entities that operate within these industries. Inter-segment transactions are recorded at market value and eliminated under corporate and inter-segment eliminations.
| | | | | | | | | | | | | | | | | |
| For the year ended December 31, 2025 | Pipelines(1) | Facilities | Marketing & New Ventures(2) | Corporate & Inter-segment Eliminations | Total |
|
| ($ millions) |
| Revenue from external customers | 3,316 | | 357 | | 4,059 | | 46 | | 7,778 | |
| Inter-segment revenue | 205 | | 871 | | 6 | | (1,082) | | — | |
Total revenue(3) | 3,521 | | 1,228 | | 4,065 | | (1,036) | | 7,778 | |
Operating expenses(4) | 804 | | 553 | | 30 | | (426) | | 961 | |
| Cost of goods sold | 51 | | — | | 3,524 | | (674) | | 2,901 | |
| Depreciation and amortization included in gross profit | 641 | | 209 | | 71 | | 11 | | 932 | |
| Cost of sales | 1,496 | | 762 | | 3,625 | | (1,089) | | 4,794 | |
| Share of profit from equity accounted investees | 1 | | 134 | | 74 | | — | | 209 | |
| | | | | |
| | | | | |
| Gross profit | 2,026 | | 600 | | 514 | | 53 | | 3,193 | |
| Depreciation included in general and administrative | 2 | | — | | — | | 53 | | 55 | |
Other general and administrative(4) | 82 | | 23 | | 45 | | 272 | | 422 | |
| | | | | |
| | | | | |
| Other (income) expense | (5) | | 2 | | 3 | | 20 | | 20 | |
| (Gain) loss on disposal of assets | (18) | | — | | 1 | | (96) | | (113) | |
| | | | | |
Results from operating activities | 1,965 | | 575 | | 465 | | (196) | | 2,809 | |
| Net finance costs | 27 | | 13 | | 8 | | 554 | | 602 | |
Earnings (loss) before tax | 1,938 | | 562 | | 457 | | (750) | | 2,207 | |
| Income tax expense | — | | — | | — | | — | | 513 | |
| Earnings (loss) | 1,938 | | 562 | | 457 | | (750) | | 1,694 | |
Capital expenditures | 362 | | 376 | | 20 | | 26 | | 784 | |
| Contributions to equity accounted investees | — | | 243 | | 168 | | — | | 411 | |
Pembina Pipeline Corporation 2025 Annual Report 103
| | | | | | | | | | | | | | | | | |
| For the year ended December 31, 2024 | Pipelines(1) | Facilities | Marketing & New Ventures(2) | Corporate & Inter-segment Eliminations | Total |
|
|
| ($ millions) |
| Revenue from external customers | 3,185 | | 358 | | 3,796 | | 45 | | 7,384 | |
| Inter-segment revenue | 201 | | 769 | | — | | (970) | | — | |
Total revenue(3) | 3,386 | | 1,127 | | 3,796 | | (925) | | 7,384 | |
Operating expenses(4) | 832 | | 474 | | 25 | | (355) | | 976 | |
| Cost of goods sold | 40 | | — | | 3,198 | | (630) | | 2,608 | |
| Depreciation and amortization included in gross profit | 557 | | 183 | | 64 | | 8 | | 812 | |
| Cost of sales | 1,429 | | 657 | | 3,287 | | (977) | | 4,396 | |
| Share of profit from equity accounted investees | 42 | | 231 | | 55 | | — | | 328 | |
| | | | | |
| | | | | |
| Gross profit | 1,999 | | 701 | | 564 | | 52 | | 3,316 | |
| Depreciation included in general and administrative | 3 | | — | | — | | 47 | | 50 | |
Other general and administrative(4) | 65 | | 23 | | 48 | | 258 | | 394 | |
| | | | | |
| | | | | |
| Other expense (income) | 13 | | 3 | | (55) | | 35 | | (4) | |
| Gain on disposal of assets | (13) | | (1) | | (7) | | — | | (21) | |
| Loss on acquisition | — | | — | | — | | 616 | | 616 | |
| Results from operating activities | 1,931 | | 676 | | 578 | | (904) | | 2,281 | |
| Net finance costs | 24 | | 10 | | 9 | | 518 | | 561 | |
| Earnings (loss) before tax | 1,907 | | 666 | | 569 | | (1,422) | | 1,720 | |
| Income tax recovery | — | | — | | — | | — | | (154) | |
| Earnings (loss) | 1,907 | | 666 | | 569 | | (1,422) | | 1,874 | |
| Capital expenditures | 539 | | 345 | | 30 | | 41 | | 955 | |
| Contributions to equity accounted investees | 5 | | 124 | | 242 | | — | | 371 | |
(1) Pipelines revenue includes $506 million (2024: $501 million) associated with U.S. pipeline revenue.
(2) Marketing & New Ventures includes revenue of $1.1 billion (2024: $845 million) associated with U.S. midstream sales.
(3) During 2025, one customer accounted for 10 percent or more of total revenues with $849 million reported throughout all segments. During 2024, no customer accounted for 10 percent or more of total gross profit reported throughout all segments.
(4) Pembina incurred $651 million (2024: $576 million) of employee costs, of which $372 million (2024: $329 million) was recorded in operating expenses and $279 million (2024: $247 million) in general and administrative expenses. Employee costs include salaries, benefits and share-based compensation.
Geographical Information
Non-Current Assets
| | | | | | | | |
For the years ended December 31 | | |
($ millions) | 2025 | 2024 |
| Canada | 27,874 | | 27,701 | |
| United States | 6,269 | | 6,685 | |
Total non-current assets(1) | 34,143 | | 34,386 | |
(1) Excludes derivative financial instruments and post-employment benefit assets.
6. TRADE RECEIVABLES AND OTHER
| | | | | | | | |
As at December 31 | | |
($ millions) | 2025 | 2024 |
| Trade and accrued receivables from customers | 686 | | 844 | |
| Other receivables | 46 | | 89 | |
| | |
| Prepayments | 34 | | 35 | |
| | |
| | |
Related party receivables (Note 26) | 70 | | 37 | |
| Total trade receivables and other | 836 | | 1,005 | |
7. INVENTORY
| | | | | | | | |
As at December 31 | | |
($ millions) | 2025 | 2024 |
| Crude oil and NGL | 124 | | 149 | |
| Materials, supplies and other | 160 | | 152 | |
| Total inventory | 284 | | 301 | |
104 Pembina Pipeline Corporation 2025 Annual Report
8. PROPERTY, PLANT AND EQUIPMENT
| | | | | | | | | | | | | | | | | | | | |
| ($ millions) | Land and Land Rights | Pipelines | Facilities and Equipment | Cavern Storage and Other | Assets Under Construction | Total |
| Cost | | | | | | |
| Balance at December 31, 2023 | 480 | | 9,613 | | 7,048 | | 2,027 | | 588 | | 19,756 | |
| | | | | | |
| Additions and transfers | 4 | | 452 | | 416 | | 141 | | (79) | | 934 | |
| Change in decommissioning provision | — | | 8 | | 21 | | 4 | | — | | 33 | |
Acquisition (Note 4) | 200 | | 4,538 | | 1,509 | | 41 | | 57 | | 6,345 | |
| | | | | | |
| Foreign exchange | 12 | | 216 | | 105 | | 2 | | 5 | | 340 | |
| Dispositions and other | (2) | | (38) | | (4) | | (94) | | (6) | | (144) | |
| | | | | | |
| Balance at December 31, 2024 | 694 | | 14,789 | | 9,095 | | 2,121 | | 565 | | 27,264 | |
| Additions and transfers | (2) | | 77 | | 208 | | 54 | | 444 | | 781 | |
| | | | | | |
| Change in decommissioning provision | — | | 44 | | 33 | | 2 | | — | | 79 | |
| | | | | | |
| | | | | | |
| | | | | | |
| Foreign exchange | (8) | | (160) | | (80) | | (2) | | (2) | | (252) | |
| | | | | | |
| Dispositions and other | (34) | | (25) | | (42) | | (36) | | (6) | | (143) | |
| | | | | | |
| Balance at December 31, 2025 | 650 | | 14,725 | | 9,214 | | 2,139 | | 1,001 | | 27,729 | |
| | | | | | |
| Depreciation | | | | | | |
| Balance at December 31, 2023 | 38 | | 2,083 | | 1,316 | | 521 | | — | | 3,958 | |
| Depreciation | 8 | | 268 | | 259 | | 92 | | — | | 627 | |
| | | | | | |
| | | | | | |
| | | | | | |
| | | | | | |
| Dispositions and other | 1 | | (16) | | 19 | | (63) | | — | | (59) | |
| Balance at December 31, 2024 | 47 | | 2,335 | | 1,594 | | 550 | | — | | 4,526 | |
| | | | | | |
| | | | | | |
| | | | | | |
| | | | | | |
| Depreciation | 9 | | 311 | | 302 | | 82 | | — | | 704 | |
| Transfers | (1) | | 15 | | 4 | | (18) | | — | | — | |
| | | | | | |
| Dispositions and other | — | | (23) | | (25) | | (3) | | — | | (51) | |
| Balance at December 31, 2025 | 55 | | 2,638 | | 1,875 | | 611 | | — | | 5,179 | |
| | | | | | |
| Carrying amounts | | | | | | |
| Balance at December 31, 2024 | 647 | | 12,454 | | 7,501 | | 1,571 | | 565 | | 22,738 | |
| Balance at December 31, 2025 | 595 | | 12,087 | | 7,339 | | 1,528 | | 1,001 | | 22,550 | |
| | | | | | |
| Assets subject to operating leases | | | | | | |
| Balance at December 31, 2024 | 43 | | 649 | | 564 | | 111 | | — | | 1,367 | |
| Balance at December 31, 2025 | 42 | | 635 | | 535 | | 123 | | — | | 1,335 | |
Property, Plant and Equipment Under Construction
For the year ended December 31, 2025, included in additions and transfers are capitalized borrowing costs related to the construction of new pipelines or facilities amounting to $27 million (2024: $23 million), with capitalization rates ranging from 4.55 percent to 4.63 percent (2024: 4.45 percent to 4.75 percent).
Depreciation
Pipeline assets, facilities and equipment are depreciated using the straight-line method with remaining useful life of one to 75 years with the majority of assets depreciated over 40 years. Cavern storage and other assets are depreciated using the straight-line method over five to 40 years with the majority of assets depreciated over 40 years. These rates are established to depreciate remaining net book value over the shorter of their useful lives or economic lives.
Pembina Pipeline Corporation 2025 Annual Report 105
Alliance Negotiated Settlement
On December 12, 2024, Pembina announced that the Canada Energy Regulatory ("CER") had initiated a toll review of the Alliance Canada pipeline assets. As the toll review continued into the first quarter of 2025, Pembina performed an impairment test during that quarter for the CGU that includes the Alliance Canada assets. The test determined that the recoverable amount of the CGU exceeded the carrying value of $6.3 billion as of March 31, 2025 and as a result, no impairment was recognized.
The recoverable amount calculated in the first quarter of 2025, was determined using a fair value less costs of disposal approach by discounting the projected future cash flows, including probability-weighted settlement outcomes for the Alliance Canada assets (Level 3). The recoverable amount was sensitive to changes in key assumptions, including the outcome of the CER toll review, and the after-tax discount rate of 7.9 percent used to discount the projected cash flows and changes in the commodity price environment. A 1.1 percent increase in the discount rate would have reduced the recoverable amount of the CGU to its carrying value.
At the time the impairment test was performed, the recoverable amount was also sensitive to possible changes to the estimated outcome of the CER toll review. On September 15, 2025, the CER approved the negotiated settlement (the "Alliance Negotiated Settlement") between Alliance Pipeline Limited Partnership ("Alliance") and shippers and interested parties on the Canadian portion of the Alliance Pipeline. The settlement outcome approved by the CER was within the expected range of outcomes used in the impairment test performed in the first quarter of 2025.
106 Pembina Pipeline Corporation 2025 Annual Report
9. INTANGIBLE ASSETS AND GOODWILL
| | | | | | | | | | | | | | | | | | |
| | Intangible Assets | |
| ($ millions) | Goodwill | Purchase and Sale Contracts and Other | Customer Relationships | | Total | Total Goodwill & Intangible Assets |
| Cost | | | | | | |
| Balance at December 31, 2023 | 4,551 | | 296 | | 1,826 | | | 2,122 | | 6,673 | |
| Additions | — | | 30 | | 28 | | | 58 | | 58 | |
Acquisition (Note 4) | 803 | | — | | — | | | — | | 803 | |
| Dispositions and other | (380) | | (2) | | (38) | | | (40) | | (420) | |
| Foreign exchange | 50 | | — | | 61 | | | 61 | | 111 | |
| Balance at December 31, 2024 | 5,024 | | 324 | | 1,877 | | | 2,201 | | 7,225 | |
| Additions | — | | 29 | | — | | | 29 | | 29 | |
| | | | | | |
| Dispositions and other | — | | (6) | | — | | | (6) | | (6) | |
| Foreign exchange | (36) | | — | | (35) | | | (35) | | (71) | |
| Balance at December 31, 2025 | 4,988 | | 347 | | 1,842 | | | 2,189 | | 7,177 | |
| | | | | | |
| Amortization | | | | | | |
| Balance at December 31, 2023 | — | | 48 | | 560 | | | 608 | | 608 | |
| Amortization | — | | 17 | | 99 | | | 116 | | 116 | |
| | | | | | |
| | | | | | |
| Dispositions and other | — | | — | | (27) | | | (27) | | (27) | |
| Balance at December 31, 2024 | — | | 65 | | 632 | | | 697 | | 697 | |
| Amortization | — | | 22 | | 120 | | | 142 | | 142 | |
| Dispositions and other | — | | 1 | | (8) | | | (7) | | (7) | |
| | | | | | |
| | | | | | |
| Balance at December 31, 2025 | — | | 88 | | 744 | | | 832 | | 832 | |
| | | | | | |
| Carrying amounts | | | | | | |
| | | | | | |
| Balance at December 31, 2024 | 5,024 | | 259 | | 1,245 | | | 1,504 | | 6,528 | |
| Balance at December 31, 2025 | 4,988 | | 259 | | 1,098 | | | 1,357 | | 6,345 | |
Intangible assets have a finite useful life and are amortized using the straight-line method over five to 50 years.
The aggregate carrying amount of goodwill allocated to each operating segment is as follows:
| | | | | | | | |
| As at December 31 | 2025 | 2024 |
| ($ millions) |
| Pipelines | 3,057 | | 3,089 | |
| Facilities | 440 | | 442 | |
| Marketing & New Ventures | 1,491 | | 1,493 | |
| | |
| Total goodwill | 4,988 | | 5,024 | |
Goodwill Impairment Testing
For the purpose of impairment testing, goodwill is allocated to Pembina's operating segments which represent the groups of CGUs at which goodwill is monitored for management purposes. Annually, impairment testing for goodwill is performed in the fourth quarter.
Pembina Pipeline Corporation 2025 Annual Report 107
The goodwill test was performed and no impairment was identified as it was determined that the recoverable amount for each operating segment exceeded the carrying amount, including goodwill. The recoverable amount was determined using a fair value less costs of disposal approach by discounting each operating segment's expected future cash flows (Level 3). The key assumptions that impact the recoverable amount include the following:
•Cash flows for the first five years are projected based on past experience, actual operating results and the business plan approved by management. Cash flows for Pipelines and Facilities incorporate assumptions regarding contracted volumes and rates, which are based on market expectations. In addition, revenue and cost of product projections for Marketing & New Ventures incorporate assumptions regarding commodity volumes and pricing, which are sensitive to changes in the commodity price environment.
•Cash flows for the remaining years of the useful lives of the assets within each operating segment are extrapolated for periods up to 74 years (2024: 75 years) using a long-term growth rate, except where contracted, long-term cash flows indicate that no growth rate should be applied or a specific reduction in cash flows is more appropriate.
•After-tax discount rates are applied in determining the recoverable amount of operating segments. Discount rates are estimated based on the risk free rate and average cost of debt, targeted debt to equity ratio, in addition to estimates of the specific operating segment's equity risk premium, size premium, projection risk, asset risk, and betas.
For each operating segment, key assumptions and discount rate sensitivity are presented below:
| | | | | | | | | | | | |
| Operating Segments |
| As at December 31, 2025 | Pipelines | Facilities | | Marketing &
New Ventures |
| | | | |
| Key assumptions used | | | | |
Average annual pre-tax cash flow ($ millions) | 2,162 | | 1,908 | | | 890 | |
| After-tax discount rate | 5.8 | % | 5.9 | % | | 8.3 | % |
| Long-term growth rate | 1.6 | % | 2.2 | % | | 2.3 | % |
| Incremental change in rates that would result in carrying value equal to recoverable amount | | | | |
Increase in after-tax discount rate(1) | 350 bps | 440 bps | | 1,680 bps |
|
| | | | |
(1) Presented in basis points ("bps").
108 Pembina Pipeline Corporation 2025 Annual Report
10. INVESTMENTS IN EQUITY ACCOUNTED INVESTEES
| | | | | | | | | | | | | | | | | | | | |
| Ownership Interest at December 31 (percent) | Share of Profit from Equity Investments | Investment in Equity Accounted
Investees at December 31 |
For the years ended December 31 |
| ($ millions) | 2025 | 2024 | 2025 | 2024 | 2025 | 2024 |
PGI(1) | 60 | 60 | 131 | | 227 | | 3,578 | | 3,740 | |
| Cedar LNG | 49.9 | 49.9 | 14 | | 22 | | 591 | | 430 | |
Alliance(2) | 100 | 100 | — | | 42 | | — | | — | |
Aux Sable(2) | 100 | 100 | — | | 33 | | — | | — | |
Greenlight(3) | 50 | — | 60 | | — | | 82 | | — | |
| | | | | | |
| | | | | | |
Other(4) | 50 - 75 | 50 - 75 | 4 | | 4 | | 93 | | 97 | |
| Total | | | 209 | | 328 | | 4,344 | | 4,267 | |
(1) PGI share of profit for the twelve months ended December 31, 2025, includes an impairment of a single CGU and an impairment of an asset within PGI of $146 million (net to Pembina, after tax), due to contract expirations and future utilization uncertainty.
(2) On April 1, 2024, Pembina completed its acquisition of Enbridge's interests in the Alliance, Aux Sable, and NRGreen joint ventures. On August 1, 2024, Pembina acquired the remaining non-controlling interest in Aux Sable's U.S. operations.
(3) In the first quarter of 2025, Pembina entered into agreements for a 50 percent interest in the Greenlight Electricity Centre Limited Partnership, which is developing a power generation facility to serve data centre customers.
(4) Other includes Pembina's interest in Grand Valley, Fort Corp and Alberta Carbon Grid Heartland Limited Partnership and the proposed Heartland carbon dioxide transportation and sequestration system ("ACG").
Investments in equity accounted investees include the unamortized differences between the purchase price and the underlying net book value of the investee's assets and liabilities at the purchase date, which is comprised of $1.1 billion (2024: $1.1 billion) in goodwill and $(0.4) billion (2024: $(0.4) billion) in property, plant and equipment and intangible assets.
Sale of Land
During the fourth quarter of 2025, Pembina completed the sale of land to Greenlight, a related party, for proceeds of $21 million and a gain of $6 million. Greenlight subsequently sold land, including land acquired from Pembina, to a third-party potential customer for a pre-tax gain of $62 million (net to Pembina).
Distributions and Contributions
The following table summarizes distributions from and contributions to Pembina's investments in equity accounted investees:
| | | | | | | | | | | | | | |
| For the years ended December 31 | Distributions(1) | Contributions |
| ($ millions) | 2025 | 2024 | 2025 | 2024 |
| PGI | 534 | | 505 | | 243 | | 124 | |
| Cedar LNG | — | | — | | 147 | | 241 | |
| Alliance | — | | 80 | | — | | 5 | |
| Aux Sable | — | | 31 | | — | | 1 | |
| Greenlight | — | | — | | 21 | | — | |
| | | | |
| | | | |
| | | | |
| | | | |
Other(2) | 10 | | 10 | | — | | — | |
| Total | 544 | | 626 | | 411 | | 371 | |
(1) Distributions exclude returns of capital. In 2025, Pembina received no return of capital from Cedar LNG (2024: $63 million from Cedar LNG).
(2) Other includes Pembina's interest in Grand Valley, Fort Corp, and ACG.
Distributions received from equity accounted investees, excluding returns of capital, are included in operating activities in the Consolidated Statement of Cash Flows.
Contributions made to and returns of capital received from investments in equity accounted investees are included in investing activities in the Consolidated Statement of Cash Flows.
Financing Activities for Equity Accounted Investees
PGI
On March 21, 2025, pursuant to an amended and restated credit agreement, PGI exercised the accordion feature under its existing revolving credit facility and opened a new $500 million revolving credit facility, maturing on March 21, 2027. Concurrently, PGI reestablished a $500 million accordion under the credit facility.
Pembina Pipeline Corporation 2025 Annual Report 109
Summarized Financial Information
Financial information for Pembina's equity accounted investees is presented (at 100 percent) in the following tables and is prepared under the financial reporting framework adopted by each equity accounted investee (IFRS except for Alliance, Aux Sable, and Grand Valley which are in accordance with U.S. GAAP). Differences between the equity accounted investee's earnings (loss) and earnings attributable to Pembina relate to the different accounting standards applied and amortization of the excess of the purchase price over the underlying net book value of the investee's assets and liabilities at the purchase date.
| | | | | | | | | | | | | | | | |
For the year ended December 31, 2025 ($ millions) | PGI | Cedar LNG | | | Greenlight | Other(1) |
| Earnings and Comprehensive Income | | | | | | |
| Revenue | 1,678 | | — | | | | — | | 40 | |
| Expenses | (460) | | (6) | | | | (3) | | (16) | |
Depreciation and amortization | (396) | | — | | | | — | | (15) | |
| Impairment expense | (322) | | — | | | | — | | — | |
| Interest expense | (237) | | — | | | | (1) | | (1) | |
| Finance income and other | 49 | | 34 | | | | — | | — | |
| Gain on land sale | — | | — | | | | 124 | | — | |
| Income tax expense | (77) | | — | | | | — | | — | |
| Earnings | 235 | | 28 | | | | 120 | | 8 | |
| Earnings attributable to Pembina | 131 | | 14 | | | | 60 | | 4 | |
| | | | | | | | | | | | | | | | |
As at December 31, 2025 ($ millions) | PGI | Cedar LNG | | | Greenlight | Other(1) |
| Statements of Financial Position | | | | | | |
| Cash and cash equivalents | 18 | | 41 | | | | 133 | | 4 | |
| Other current assets | 529 | | 12 | | | | 9 | | 4 | |
| Non-current assets | 13,364 | | 2,725 | | | | 82 | | 75 | |
| Current trade, other payables and provisions | 249 | | 260 | | | | 9 | | 3 | |
| Other current liabilities | 100 | | 41 | | | | — | | 3 | |
| Non-current trade, other payables and provisions | 145 | | 1 | | | | — | | — | |
| Other non-current liabilities | 7,432 | | 1,551 | | | | 54 | | 19 | |
(1) Other includes Pembina's interest in Grand Valley, Fort Corp, and ACG.
110 Pembina Pipeline Corporation 2025 Annual Report
| | | | | | | | | | | | | | | | | |
For the year ended December 31, 2024 ($ millions) | PGI | Cedar LNG | Alliance(1) | Aux Sable(1) | Other(3) |
| Earnings and Comprehensive Income | | | | | |
| Revenue | 1,676 | | — | | 252 | | 329 | | 44 | |
| Expenses | (522) | | (3) | | (81) | | (238) | | (20) | |
Depreciation and amortization | (368) | | — | | (40) | | (13) | | (14) | |
| | | | | |
| Interest expense | (253) | | — | | (11) | | — | | (1) | |
| Finance (costs) income and other | (39) | | 47 | | 2 | | — | | (1) | |
| Income tax expense | (122) | | — | | — | | — | | — | |
| Earnings | 372 | | 44 | | 122 | | 78 | | 8 | |
| Earnings attributable to Pembina | 227 | | 22 | | 42 | | 33 | | 4 | |
| | | | | | | | | | | | | | | | | |
As at December 31, 2024 ($ millions) | PGI | Cedar LNG | Alliance(2) | Aux Sable(2) | Other(3) |
| Statements of Financial Position | | | | | |
| Cash and cash equivalents | — | | 79 | | — | | — | | 4 | |
| Other current assets | 501 | | 3 | | — | | — | | 5 | |
| Non-current assets | 13,033 | | 1,665 | | — | | — | | 86 | |
| Current trade, other payables and provisions | 210 | | 7 | | — | | — | | 3 | |
| Other current liabilities | 47 | | — | | — | | — | | 3 | |
| Non-current trade, other payables and provisions | 129 | | — | | — | | — | | — | |
| Other non-current liabilities | 6,913 | | 1,048 | | — | | — | | 22 | |
(1) The accounting for the results of all Alliance, Aux Sable, and NRGreen businesses changed from the equity method of accounting to being fully consolidated and incorporated into Pembina's financial results commencing April 1, 2024. As such, the numbers presented reflect only the results for the three months ended March 31, 2024.
(2) As at December 31, 2024, Pembina holds 100 percent equity ownership in all Alliance, Aux Sable, and NRGreen businesses.
(3) Other includes Pembina's interest in Grand Valley, Fort Corp, and ACG.
PGI Goodwill Impairment Testing
At each reporting date, Pembina determines whether there is objective evidence that its equity accounted investments are impaired. For the period ended December 31, 2025, it was determined that there is no objective evidence indicating that Pembina's equity accounted investments are impaired. Pembina's assessment of whether there is objective evidence the equity accounted investment in PGI is impaired is sensitive to a decrease in PGI's projected cash flows, a decrease in the long-term growth rate, or an increase in the after-tax discount rate, any of which could be objective evidence that Pembina's equity accounted investment in PGI is impaired. Pembina also believes an impairment expense recognized by PGI as a result of its annual goodwill impairment test would provide objective evidence that Pembina's equity accounted investment in PGI is impaired.
PGI performed its annual goodwill impairment test in the third quarter of 2025 calculating the recoverable amount based on the fair value less cost to sell. No impairment expense was recognized.
There is measurement uncertainty associated with PGI's annual impairment test. The key assumptions used by PGI that impact the recoverable amount were the projected cash flows for the remaining useful life of the assets, the after-tax discount rate and the long-term growth rate. The following table provides sensitivities to reasonably possible changes in each estimate that could result in an impairment of PGI's goodwill.
| | | | | | | | | | | | | | |
| | |
As at December 31 | 2025 | 2024 |
| Actual | Increase (decrease) required for impairment | Actual | Increase (decrease) required for impairment |
| Key assumptions used | | | | |
Average annual pre-tax cash flow ($ millions)(1) | 1,303 | | (20.8 | %) | 1,232 | | (6.0 | %) |
| After-tax discount rate | 6.9 | % | 230 | bps | 7.6 | % | 60 | bps |
| Long-term growth rate | 1.9 | % | (470) | bps | 1.8 | % | (90) | bps |
(1) Average annual forecasted pre-tax cash flows represent 100 percent of PGI's forecasted cash flows.
Pembina Pipeline Corporation 2025 Annual Report 111
11. INCOME TAXES
| | | | | | | | | | | | | | |
| Deferred Income Tax Expense (Recovery) | Deferred Income Tax Liability (Asset) |
| For the years ended December 31 | As at December 31 |
| ($ millions) | 2025 | 2024 | 2025 | 2024 |
| Derivative financial instruments | (15) | | (39) | | (33) | | (25) | |
| | | | |
| Share-based payments | (2) | | 3 | | (38) | | (36) | |
| Provisions | (30) | | (9) | | (136) | | (106) | |
| Benefit of loss carryforwards | 8 | | 23 | | (679) | | (687) | |
| Other deductible temporary differences | 25 | | 66 | | (91) | | (107) | |
| Property, plant and equipment | 128 | | 85 | | 3,454 | | 3,326 | |
| Employee benefits | (3) | | (3) | | 9 | | 2 | |
| Intangible assets | 1 | | 9 | | 270 | | 269 | |
| Investments in equity accounted investees | 49 | | (635) | | 200 | | 151 | |
| | | | |
| Taxable limited partnership income deferral | (80) | | 85 | | 1 | | 81 | |
| | | | |
Total net deferred income tax expense (recovery) and liabilities(1) | 81 | | (415) | | 2,957 | | 2,868 | |
(1) As at December 31, 2025, there were no deferred income tax liabilities related to acquisitions (2024: $936 million deferred income tax liability).
Reconciliation of Effective Tax Rate | | | | | | | | |
For the years ended December 31 | | |
($ millions, except as noted) | 2025 | 2024 |
| Earnings before income tax | 2,207 | | 1,720 | |
Canadian statutory tax rate (percent) | 23.3 | | 23.8 | |
| Income tax at statutory rate | 514 | | 409 | |
| Tax rate changes and foreign rate differential | 29 | | 4 | |
| Changes in estimate and other | 10 | | (24) | |
| | |
| Permanent items | (10) | | (1) | |
| | |
| Income in equity accounted investee | (30) | | (54) | |
| Acquisition impact | — | | (488) | |
| Income tax expense (recovery) | 513 | | (154) | |
The increase in the effective tax rate from (9.0) percent to 23.2 percent is primarily due to the deferred tax liability derecognition in prior year in connection with Pembina acquiring a controlling ownership interest in Alliance and Aux Sable.
Income Tax Expense
| | | | | | | | |
For the years ended December 31 | | |
($ millions) | 2025 | 2024 |
| Current tax expense | 432 | | 261 | |
| Deferred tax expense (recovery) | | |
| Origination and reversal of temporary differences | 58 | | (476) | |
| Tax rate changes on deferred tax balances | 16 | | (1) | |
| Decrease in tax loss carry forward | 7 | | 62 | |
| Total deferred tax expense (recovery) | 81 | | (415) | |
| Total income tax expense (recovery) | 513 | | (154) | |
Deferred Tax Items Recovered Directly in Equity
| | | | | | | | |
For the years ended December 31 | | |
($ millions) | 2025 | 2024 |
| Preferred share issue costs | (1) | | (1) | |
Other comprehensive (loss) income (Note 22): | | |
| | |
| Change in fair value of net investment hedges | (7) | | 5 | |
| | |
| Remeasurements of defined benefit liability or asset | (10) | | (7) | |
| Deferred tax items recovered directly in equity | (18) | | (3) | |
112 Pembina Pipeline Corporation 2025 Annual Report
Pembina has temporary differences associated with its investments in subsidiaries. At December 31, 2025, Pembina had not recorded a deferred tax asset or liability for these temporary differences (2024: nil) as Pembina controls the timing of the reversal and it is not probable that the temporary differences will reverse in the foreseeable future.
At December 31, 2025, Pembina had U.S. $1.6 billion (2024: U.S. $1.7 billion) of U.S. tax losses that do not expire and $34 million (2024: $32 million) of Canadian tax losses that will expire after 2034. Pembina has determined that it is probable that future taxable profits will be sufficient to utilize these losses. The gross amount of deductible temporary differences for which no deferred tax asset is recognized as at December 31, 2025 is $57 million (2024: $57 million).
12. TRADE PAYABLES AND OTHER
| | | | | | | | |
As at December 31 | | |
($ millions) | 2025 | 2024 |
| Trade payables | 559 | | 530 | |
| Other payables & accrued liabilities | 662 | | 672 | |
| | |
Alliance refundable liability(1) | 100 | | — | |
| Total trade payables and other | 1,321 | | 1,202 | |
(1) Represents a refundable liability following the Alliance Negotiated Settlement.
Pembina Pipeline Corporation 2025 Annual Report 113
13. LEASES
Lessee Leases
Pembina enters into arrangements to secure access to assets necessary for operating the business. Leased (right-of-use) assets include terminals, rail, buildings, land and other assets. Total cash outflows related to leases were $117 million for the year ended December 31, 2025 (2024: $110 million).
Right-of-Use Assets
| | | | | | | | | | | | | | | | | |
| ($ millions) | Terminals | Rail | Buildings | Land & Other | Total |
Balance at January 1, 2023 | 158 | | 146 | | 113 | | 106 | | 523 | |
| Additions and adjustments | — | | 32 | | — | | 24 | | 56 | |
| | | | | |
| | | | | |
Acquisition (Note 4) | 12 | | 1 | | — | | 15 | | 28 | |
| Depreciation | (14) | | (35) | | (15) | | (13) | | (77) | |
| | | | | |
| Balance at December 31, 2024 | 156 | | 144 | | 98 | | 132 | | 530 | |
| Additions and adjustments | 23 | | 27 | | 1 | | 28 | | 79 | |
| | | | | |
| | | | | |
| Depreciation | (11) | | (36) | | (15) | | (21) | | (83) | |
| | | | | |
| Balance at December 31, 2025 | 168 | | 135 | | 84 | | 139 | | 526 | |
Lessor Leases
Pembina has entered into contracts for the use of its assets that have resulted in lease treatment for accounting purposes. Assets under operating leases include pipelines, terminals and storage assets. See Note 8 for carrying value of property, plant and equipment under operating leases. Assets under finance leases include pipelines, terminals, and storage assets.
Maturity of Lease Receivables
| | | | | | | | | | | | | | |
| | |
| As at December 31 | 2025 | 2024 |
| ($ millions) | Operating Leases | Finance Leases | Operating Leases | Finance Leases |
| Less than one year | 177 | | 32 | | 186 | | 30 | |
| One to two years | 164 | | 34 | | 168 | | 31 | |
| Two to three years | 149 | | 34 | | 160 | | 31 | |
| Three to four years | 142 | | 34 | | 145 | | 31 | |
| Four to five years | 106 | | 35 | | 139 | | 32 | |
| More than five years | 342 | | 292 | | 450 | | 294 | |
| Total undiscounted lease receipts | 1,080 | | 461 | | 1,248 | | 449 | |
| Unearned finance income on lease receipts | | (238) | | | (241) | |
| Discounted unguaranteed residual value | | 23 | | | 21 | |
| Finance lease receivable | | 246 | | | 229 | |
Less current portion(1) | | (7) | | | (6) | |
| Total non-current | | 239 | | | 223 | |
(1) Included in trade receivables and other on the Consolidated Statement of Financial Position.
114 Pembina Pipeline Corporation 2025 Annual Report
14. LONG-TERM DEBT
This note provides information about the contractual terms of Pembina's interest-bearing long-term debt, which is measured at amortized cost.
Carrying Value, Terms and Conditions, and Debt Maturity Schedule
| | | | | | | | | | | | | | | | | |
| | | | Carrying Value |
($ millions) | Authorized at December 31, 2025 | Nominal Interest Rate | Year of Maturity | December 31, 2025 | December 31, 2024 |
| Variable rate debt | | | | | |
Senior unsecured credit facilities(1)(2) | 3,493 | | 4.00(3) | Various(1) | 1,305 | | 1,148 | |
| Fixed rate debt | | | | | |
| Senior unsecured medium-term notes series 3 | 450 | | 4.75 | 2043 | 450 | | 450 | |
| Senior unsecured medium-term notes series 4 | 600 | | 4.81 | 2044 | 600 | | 600 | |
| Senior unsecured medium-term notes series 5 | — | | 3.54 | 2025 | — | | 550 | |
| Senior unsecured medium-term notes series 6 | 600 | | 4.24 | 2027 | 600 | | 600 | |
| Senior unsecured medium-term notes series 7 | 600 | | 3.71 | 2026 | 600 | | 600 | |
| | | | | |
| Senior unsecured medium-term notes series 9 | 550 | | 4.74 | 2047 | 550 | | 550 | |
| Senior unsecured medium-term notes series 10 | 650 | | 4.02 | 2028 | | 650 | | 650 | |
| Senior unsecured medium-term notes series 11 | 800 | | 4.75 | 2048 | | 800 | | 800 | |
| Senior unsecured medium-term notes series 12 | 650 | | 3.62 | 2029 | | 650 | | 650 | |
| Senior unsecured medium-term notes series 13 | 700 | | 4.54 | 2049 | | 700 | | 700 | |
| Senior unsecured medium-term notes series 15 | 600 | | 3.31 | 2030 | 600 | | 600 | |
| Senior unsecured medium-term notes series 16 | 400 | | 4.67 | 2050 | 400 | | 400 | |
| Senior unsecured medium-term notes series 17 | 500 | | 3.53 | 2031 | 500 | | 500 | |
| Senior unsecured medium-term notes series 18 | 500 | | 4.49 | 2051 | 500 | | 500 | |
| | | | | |
| Senior unsecured medium-term notes series 20 | 750 | | 5.02 | 2032 | 750 | | 750 | |
| Senior unsecured medium-term notes series 21 | 600 | | 5.21 | 2034 | 600 | | 600 | |
| Senior unsecured medium-term notes series 22 | 750 | | 5.67 | 2054 | 750 | | 750 | |
| Senior unsecured medium-term notes series 23 | 650 | | 5.22 | 2033 | 650 | | 650 | |
| Total fixed rate loans and borrowings outstanding | | | | 10,350 | | 10,900 | |
| Deferred financing costs | | | | 11 | | 12 | |
| Total loans and borrowings | | | | 11,666 | | 12,060 | |
| Less current portion loans and borrowings | | | | (600) | | (1,525) | |
| Total non-current loans and borrowings | | | | 11,066 | | 10,535 | |
Fixed-to-fixed rate subordinated notes | | | | | |
| Subordinated notes, series 1 | — | | 4.80 | 2081 | — | | 596 | |
| Subordinated notes, series 2 | 425 | | 5.95 | 2055 | 425 | | — | |
| Subordinated notes, series 3 | 600 | | 4.80 | 2081 | 600 | | — | |
| | | | 1,025 | | 596 | |
| Deferred financing costs | | | | (3) | | — | |
| Total fixed-to-fixed rate subordinated notes | | | | 1,022 | | 596 | |
(1) Pembina's unsecured credit facilities include a $2.5 billion revolving facility that matures in June 2030, an unsecured $600 million non-revolving term loan that matures in October 2027, and a $50 million operating facility that matures in June 2026, which is typically renewed on an annual basis. During the fourth quarter of 2025, Pembina fully repaid the Canadian and U.S. term loans originally assumed from Alliance (December 31, 2024: $270 million and U.S. $240 million, respectively), prior to their contractual maturity dates in December 2025. The $2.5 billion revolving facility reflects the cancellation of the $1.0 billion sustainability-linked revolving credit facility in September 2025, which previously matured in June 2027, and its addition into the Revolving Facility.
(2) Includes U.S. $250 million variable rate debt outstanding at December 31, 2025 (2024: U.S. $250 million). The U.S. dollar denominated non-revolving term loan is designated as a hedge of the Company's net investment in selected foreign operations with a U.S. dollar functional currency.
(3) The nominal interest rate is the weighted average of all drawn credit facilities based on Pembina's credit rating at December 31, 2025. Borrowings under the credit facilities bear interest at prime rates, the Canadian Overnight Repo Rate Average ("CORRA"), or the USD Secured Overnight Financing Rate ("SOFR"), plus applicable margins.
Pembina Pipeline Corporation 2025 Annual Report 115
On April 2, 2025, Pembina completed an extension on its unsecured U.S. $250 million non-revolving term loan, which now matures in April 2030.
On June 6, 2025, Pembina closed a $200 million offering of Fixed-to-Fixed Rate Subordinated Notes, Series 2 (the "Series 2 Subordinated Notes") due June 6, 2055. The Series 2 Subordinated Notes bear interest at a rate of 5.95 percent, which will reset on June 6, 2035, and on every fifth anniversary thereafter, based on the five-year Government of Canada yield plus 2.713 percent, provided that the interest rate during any subsequent fixed rate period will not be less than 5.95 percent. Pembina's Series 2 Subordinated Notes are subject to optional redemption by Pembina from March 6, 2035 to June 6, 2035, and thereafter, on any interest payment date or any interest reset date, as applicable. Pembina may also redeem the Series 2 Subordinated Notes in certain other limited circumstances. Pembina used the net proceeds of the offering of the Series 2 Subordinated Notes to fund the redemption of its outstanding Cumulative Redeemable Rate Reset Class A Preferred Shares, Series 19 ("Series 19 Class A Preferred Shares") on June 30, 2025.
On July 23, 2025, Pembina announced the approval of amendments (the "Amendments") to the indenture governing Pembina's 4.80 percent Fixed-to-Fixed Rate Subordinated Notes, Series 1 (the "Series 1 Subordinated Notes") due January 25, 2081. The Amendments provided for, among other things, the exchange (the "Note Exchange") of all of the outstanding Series 1 Subordinated Notes for an equal principal amount of 4.80 percent Fixed-to-Fixed Rate Subordinated Notes, Series 3 of Pembina (the "Series 3 Subordinated Notes") due January 25, 2081. The Series 3 Subordinated Notes have the same economic terms as the Series 1 Subordinated Notes, including interest rate, interest payment dates, interest reset dates, maturity date and redemption provisions, but do not provide for an entitlement to delivery of preferred shares upon the occurrence of certain bankruptcy and related events. The Note Exchange was completed on July 25, 2025, following the execution of the supplemental indenture implementing the Amendments. The Series 3 Subordinated Notes rank equally in right of payment with the Series 2 Subordinated Notes. Pursuant to the mandatory redemption provisions attached to the Class A Preferred Shares, Series 2021-A (the "Series 2021-A Class A Preferred Shares"), in connection with the Note Exchange, on July 28, 2025, Pembina redeemed all of the issued and outstanding Series 2021-A Class A Preferred Shares (refer to the "Share Capital - Preferred Shares" section of this MD&A for further information).
On September 9, 2025, Pembina completed an extension on its $2.5 billion Revolving Facility, which now matures on June 1, 2030.
On October 10, 2025, Pembina closed a $225 million offering of Series 2 Subordinated Notes pursuant to a re-opening. Following closing of the offering of the Series 2 Subordinated Notes, $425 million aggregate principal amount of Series 2 Subordinated Notes are issued and outstanding. Pembina used the net proceeds of the offering to fund the redemption of its outstanding Cumulative Redeemable Rate Reset Class A Preferred Shares, Series 9 (the "Series 9 Class A Preferred Shares") on December 1, 2025 and for general corporate purposes.
On October 31, 2025, Pembina closed a $600 million Two-Year Term Loan with certain existing lenders. The proceeds of the Two-Year Term Loan have been used to repay the $270 million term loan outstanding at Alliance, and existing amounts drawn under Pembina's $2.5 billion revolving credit facility. The Two-Year Term Loan has an initial term of two years and is pre-payable at the option of Pembina. The other terms and conditions of the Two-Year Term Loan, including financial covenants, are substantially similar to Pembina's $2.5 billion revolving credit facility.
For more information about Pembina's exposure to interest rate, foreign currency and liquidity risk, see Note 23 Financial Instruments & Risk Management.
116 Pembina Pipeline Corporation 2025 Annual Report
Covenants
Pembina is subject to certain financial covenants under its medium-term note indentures and credit facilities agreements and complies with all financial covenants as of December 31, 2025. Pembina's financial covenants under the indenture governing its medium-term notes and the agreements governing the credit facilities include the following:
| | | | | | | | | | |
| Debt | Financial Covenant(1) | Ratio | | |
| Senior unsecured medium-term notes | Funded Debt to Capitalization | Maximum 0.70(2) | | |
| Credit facilities | Debt to Capital | Maximum 0.70(3) | | |
| | | | |
(1) Terms as defined in relevant agreements.
(2) Covenant must be met at the reporting date and filed within 90 days after the end of each fiscal year and within 10 business days after filing of the Consolidated Financial Statements.
(3) Covenant must be met at the reporting date and filed within 120 days after the end of each fiscal year and 60 days after each quarter.
15. DECOMMISSIONING PROVISION
The decommissioning provision reflects the discounted cash flows expected to be incurred to decommission Pembina's pipelines, facilities and equipment, cavern storage, and other assets, including estimated environmental reclamation and remediation costs.
The undiscounted cash flows at the time of decommissioning are calculated using an estimated timing of economic outflows over the next 83 years, with the majority estimated at 48 years. The estimated economic lives of the underlying assets form the basis for determining the timing of economic outflows. Pembina applied credit-adjusted risk-free rates of 4.6 percent to 5.6 percent (2024: 4.6 percent to 5.5 percent) and an inflation rate of 2.3 percent (2024: 2.3 percent).
| | | | | | | | | |
| ($ millions) | 2025 | 2024 | |
| Balance at January 1 | 432 | | 342 | | |
| Unwinding of discount rate | 25 | | 20 | | |
| Change in rates | (8) | | 49 | | |
| Provisions settled in the period | (8) | | (10) | | |
Acquisition (Note 4) | — | | 52 | | |
| Disposition | (19) | | (17) | | |
| | | |
| | | |
| Change in cost estimates and other | 126 | | (4) | | |
| Total | 548 | | 432 | | |
Current portion of provision(1) | 8 | | 6 | | |
Balance at December 31 | 540 | | 426 | | |
| | | |
| | | |
(1) Included in trade payables and other on the Consolidated Statement of Financial Position.
Pembina collects funds from shippers for future abandonment costs for CER pipelines. Funds collected from shippers are set aside in trusts and are eligible to be withdrawn for abandonment activities related to the applicable CER pipelines. The funds collected from shippers are reported within revenue and a reimbursement right is recorded within other assets. As at December 31, 2025, Pembina's reimbursement right is valued at $36 million (2024: $20 million).
Pembina Pipeline Corporation 2025 Annual Report 117
16. SHARE CAPITAL
Pembina is authorized to issue an unlimited number of common shares, without par value, 254,850,850 Class A preferred shares, issuable in series and an unlimited number of Class B preferred shares. The holders of the common shares are entitled to receive notice of, attend and vote at any meeting of the shareholders of Pembina, receive dividends declared and share in the remaining property of Pembina upon distribution of the assets of Pembina among its shareholders for the purpose of winding-up its affairs.
Common Share Capital
| | | | | | | | |
| ($ millions, except as noted) | Number of Common Shares (millions) | Common Share Capital |
| Balance at December 31, 2023 | 549 | | 15,765 | |
| Issued in connection with subscription receipts conversion, net of issue costs | 30 | | 1,230 | |
| | |
| | |
Share-based payment transactions(1) | 2 | | 13 | |
| | |
| Balance at December 31, 2024 | 581 | | 17,008 | |
| | |
| | |
Share-based payment transactions(1) | — | | 8 | |
| | |
| Balance at December 31, 2025 | 581 | | 17,016 | |
(1) Exercised options are settled by issuing the net number of common shares equivalent to the gain upon exercise.
Share Repurchase Program
On May 14, 2025, the Toronto Stock Exchange ("TSX") accepted the renewal of Pembina's normal course issuer bid (the "NCIB") that allows the Company to repurchase, at its discretion, up to five percent of the Company's outstanding common shares (representing approximately 29 million common shares) through the facilities of the TSX, the New York Stock Exchange and/or alternative Canadian trading systems or as otherwise permitted by applicable securities law, subject to certain restrictions on the number of common shares that may be purchased on a single day. The NCIB commenced on May 16, 2025 and will expire on the earlier of May 15, 2026, the date on which Pembina has acquired the maximum number of common shares allowable under the NCIB or the date on which Pembina otherwise decides not to make any further repurchases under the NCIB. No common shares were purchased by Pembina during the years ended December 31, 2025 and 2024.
Preferred Share Capital
| | | | | | | | |
| ($ millions, except as noted) | Number of Preferred Shares (millions) | Preferred Share Capital |
| Balance at December 31, 2023 | 93 | | 2,199 | |
| Class A, Series 22 Preferred shares reclassification | — | | (26) | |
| Part VI.1 tax | — | | (9) | |
| Balance at December 31, 2024 | 93 | | 2,164 | |
| Class A, Series 9 Preferred Shares redeemed | (9) | | (225) | |
| | |
| Class A, Series 19 Preferred Shares redeemed | (8) | | (200) | |
| Class A, Series 22 Preferred Shares redeemed | (1) | | — | |
| Part VI.1 tax | — | | (10) | |
| Balance at December 31, 2025 | 75 | | 1,729 | |
On January 8, 2025, Pembina redeemed all of the approximately one million issued and outstanding Cumulative Redeemable Floating Rate Class A Preferred Shares, Series 22 ("Series 22 Class A Preferred Shares") at a redemption price of $25.50 per Series 22 Class A Preferred Share, plus all accrued and unpaid dividends thereon. Pembina had announced its intention to redeem the Series 22 Class A Preferred Shares during the fourth quarter of 2024 and, as a result, the equity was reclassified as a financial liability of approximately $26 million for the total redemption price in that same quarter.
118 Pembina Pipeline Corporation 2025 Annual Report
On June 30, 2025, Pembina redeemed all of the eight million issued and outstanding Series 19 Class A Preferred Shares at a redemption price of $25.00 per Series 19 Class A Preferred Share. The total redemption price for the Series 19 Class A Preferred Shares was $200 million.
On July 28, 2025, in connection with the Note Exchange, Pembina redeemed all of the 600,000 issued and outstanding Series 2021-A Class A Preferred Shares, which were deliverable to holders of the Series 1 Subordinated Notes following the occurrence of certain bankruptcy and related events. The Series 2021-A Class A Preferred Shares were issued by Pembina to Computershare Trust Company of Canada to be held in trust to satisfy its obligations under the indenture governing the Series 1 Subordinated Notes.
On December 1, 2025, in connection with the October 10, 2025 offering of Series 2 Subordinated Notes, Pembina redeemed all of its outstanding Series 9 Class A Preferred Shares at a price equal to $25.00 per Series 9 Class A Preferred Share, for a total redemption price of $225 million.
Dividends
The following dividends were declared and paid by Pembina:
| | | | | | | | |
| 12 Months Ended December 31 | | |
| | |
| ($ millions) | 2025 | 2024 |
| Common shares | | |
| Common share | 1,638 | 1,569 | |
| Class A preferred shares | | |
| Series 1 Class A Preferred Share | 16 | 16 |
| Series 3 Class A Preferred Share | 9 | 8 |
| Series 5 Class A Preferred Share | 17 | 14 |
| Series 7 Class A Preferred Share | 15 | 11 |
| Series 9 Class A Preferred Share | 10 | 10 |
| | |
| | |
| Series 15 Class A Preferred Share | 12 | | 12 | |
| Series 17 Class A Preferred Share | 10 | | 9 | |
| Series 19 Class A Preferred Share | 5 | | 9 | |
| Series 21 Class A Preferred Share | 24 | | 24 | |
| | |
| Series 22 Class A Preferred Share | — | | 3 | |
| | |
| Series 25 Class A Preferred Share | 16 | | 16 | |
| 134 | 132 |
| | |
| | |
| | |
| | |
| | |
| | |
| | |
On February 26, 2026, Pembina announced that its Board of Directors had declared a common share cash dividend for the first quarter of 2026 of $0.71 per share to be paid on March 31, 2026, to shareholders of record on March 16, 2026.
Pembina's Board of Directors also declared quarterly dividends for Pembina's Class A preferred shares on January 20, 2026 as outlined in the following table:
| | | | | | | | | | | |
| Series | Record Date | Payable Date | Dividend Amount ($ millions) |
| Series 1, 3, 5, 7, and 21 | February 2, 2026 | March 2, 2026 | 20 | |
| Series 15 and 17 | March 16, 2026 | March 31, 2026 | 5 | |
| Series 25 | February 2, 2026 | February 17, 2026 | 4 | |
| | | 29 | |
Pembina Pipeline Corporation 2025 Annual Report 119
17. EARNINGS PER COMMON SHARE
Basic Earnings Per Common Share
The calculation of basic earnings per common share at December 31, 2025 was based on the earnings attributable to common shareholders of $1.6 billion (2024: $1.7 billion) and a weighted average number of common shares outstanding of 581 million (2024: 573 million).
Diluted Earnings Per Common Share
The calculation of diluted earnings per common share at December 31, 2025 was based on earnings attributable to common shareholders of $1.6 billion(1) (2024: $1.7 billion(1)), and a weighted average number of common shares outstanding after adjustment for the effects of all dilutive potential common shares of 582 million (2024: 574 million).
Earnings Attributable to Common Shareholders
| | | | | | | | |
For the years ended December 31 | | |
($ millions) | 2025 | 2024 |
| Earnings attributable to common shareholders | 1,694 | | 1,864 | |
| Dividends on preferred shares | (144) | | (143) | |
| | |
| | |
| Basic and diluted earnings attributable to common shareholders | 1,550 | | 1,721 | |
| | |
| | |
Weighted Average Number of Common Shares
| | | | | | | | |
| (In millions of shares, except as noted) | 2025 | 2024 |
| Issued common shares at January 1 | 581 | | 549 | |
| | |
| Effect of shares issued on exercise of options | — | | 1 | |
| | |
| Effect of subscription receipt issuance | — | | 23 | |
| | |
| Basic weighted average number of common shares at December 31 | 581 | | 573 | |
| | |
| | |
Dilutive effect of share options on issue(1) | 1 | | 1 | |
| Diluted weighted average number of common shares at December 31 | 582 | | 574 | |
| | |
| Basic earnings per common share (dollars) | 2.67 | | 3.00 | |
| Diluted earnings per common share (dollars) | 2.66 | | 3.00 | |
(1) The average market value of Pembina's shares for purposes of calculating the dilutive effect of share options for the years ended December 31, 2025 and 2024 was based on quoted market prices for the period during which the options were outstanding.
120 Pembina Pipeline Corporation 2025 Annual Report
18. REVENUE
Revenue has been disaggregated into categories to reflect how the nature, timing and uncertainty of revenue and cash flows are affected by economic factors.
a.Revenue Disaggregation
| | | | | | | | | | | | | | | | | | | | | | | | | | | | | | | | | | |
| For the years ended December 31 | 2025 | 2024 | | |
| Pipelines | Facilities | Marketing & New Ventures | Corporate | Total | Pipelines | Facilities | Marketing & New Ventures | Corporate | Total | | |
| ($ millions) | | |
| | | | |
| | | | | | | | | | | |
| | |
Take-or-pay(1) | 2,553 | | 208 | | 12 | | — | | 2,773 | | 2,422 | | 209 | | 5 | | — | | 2,636 | | | |
Fee-for-service(1) | 542 | | 81 | | 150 | | — | | 773 | | 512 | | 85 | | 138 | | — | | 735 | | | |
Product sales(2) | 6 | | — | | 3,783 | | — | | 3,789 | | 2 | | — | | 3,569 | | — | | 3,571 | | | |
| Revenue from contracts with customers | 3,101 | | 289 | | 3,945 | | — | | 7,335 | | 2,936 | | 294 | | 3,712 | | — | | 6,942 | | | |
| Realized gain from derivative instruments | — | | — | | 133 | | — | | 133 | | — | | — | | 241 | | — | | 241 | | | |
| Unrealized loss from derivative instruments | — | | — | | (37) | | — | | (37) | | — | | — | | (170) | | — | | (170) | | | |
Revenue from risk management and other derivative contracts | — | | — | | 96 | | — | | 96 | | — | | — | | 71 | | — | | 71 | | | |
| | | | | | | | | | | | |
| | | | | | | | | | | | |
| | | | | | | | | | | | |
| Lease income | 187 | | 43 | | 5 | | — | | 235 | | 223 | | 40 | | 4 | | — | | 267 | | | |
Shared service revenue(3) and other | 28 | | 25 | | 13 | | 46 | | 112 | | 26 | | 24 | | 9 | | 45 | | 104 | | | |
| Total external revenue | 3,316 | | 357 | | 4,059 | | 46 | | 7,778 | | 3,185 | | 358 | | 3,796 | | 45 | | 7,384 | | | |
(1) Revenue recognized over time.
(2) Revenue recognized at a point in time.
(3) Includes $55 million of fixed fee income in 2025 (2024: $58 million) related to shared service agreements with joint ventures.
b.Contract Liabilities
Significant changes in the contract liabilities balances during the period are as follows:
| | | | | | | | | | | | | | | | | | | | |
| | |
| For the years ended December 31 | 2025 | 2024 |
($ millions) | Take-or-Pay | Other Contract Liabilities | Total
Contract Liabilities | Take-or-Pay | Other Contract Liabilities | Total
Contract Liabilities |
| Opening balance | 1 | | 297 | | 298 | | 1 | | 158 | | 159 | |
Additions (net in the period)(1) | — | | 186 | | 186 | | — | | 49 | | 49 | |
| Alliance/Aux Sable Acquisition | — | | — | | — | | — | | 144 | | 144 | |
Revenue recognized from contract liabilities(2) | — | | (43) | | (43) | | — | | (44) | | (44) | |
Transfers to trade payables and other(3) | — | | (97) | | (97) | | — | | — | | — | |
| Disposition | — | | — | | — | | — | | (10) | | (10) | |
Closing balance | 1 | | 343 | | 344 | | 1 | | 297 | | 298 | |
Less current portion(4) | (1) | | (38) | | (39) | | (1) | | (42) | | (43) | |
| Ending balance | — | | 305 | | 305 | | — | | 255 | | 255 | |
(1) For the year ended December 31, 2025, additions include $176 million resulting from the initial valuation of an embedded derivative in the Company's contract to provide the right to use Pembina's Cedar LNG transportation and liquefaction capacity (refer to Note 3(b)(v) and Note 23 - Fair Values).
(2) Recognition of revenue related to performance obligations satisfied in the period that were included in the opening balance of contract liabilities.
(3) Represents a refundable liability transferred to trade payables and other in the third quarter of 2025, following the Alliance Negotiated Settlement.
(4) Represents cash collected under take-or-pay contracts which will be recognized within one year as the customer chooses to ship, process, or otherwise forego the associated service.
Contract liabilities depict Pembina's obligation to perform services in the future for cash and non-cash consideration which have been received from customers. Contract liabilities include up-front payments or non-cash consideration received from customers for future services. Contract liabilities also include consideration received from customers for take-or-pay commitments where the customer has a make-up right to ship or process future volumes under a firm contract. These amounts are non-refundable should the customer not use its make-up rights.
Pembina Pipeline Corporation 2025 Annual Report 121
c.Revenue Allocated to Remaining Performance Obligations
Pembina's existing long-term contracts with customers have given rise to wholly unsatisfied or partially unsatisfied performance obligations. These contracts exist primarily for long-term service contracts on Pembina's operating assets, or the recontracting of Pembina's capacity provided by another party, and exclude commodity marketing contracts that are typically short-term in nature. The remaining performance obligations on the long-term contracts represent revenue and cash flows that Pembina has contracted, but not yet earned.
Revenue to be recognized in future periods for the remaining performance obligations will be a combination of variable and fixed consideration. Variable consideration is often dependent on the future volumes of the related good or service to be provided, flow-through charges, commodity market prices, make-up-rights, and other factors. Although variable consideration is a significant component of Pembina's future revenues, it is often driven by factors outside Pembina's influence, and therefore future periods are materially constrained.
After constraining the variable consideration, the remaining fixed consideration related to the future performance obligations does not provide an accurate representation of, or meaningful correlation to Pembina's future take-or-pay revenues, total revenues, gross margin, or earnings. In addition, the results of contracted leasing arrangements, which also have revenue components, are a significant component to the future performance of Pembina but are excluded from revenue allocated to remaining performance obligations. Given the nature of Pembina's contractual revenue arrangements discussed above, the amount of revenue allocated to the remaining performance obligations are not representative of Pembina's future revenues and cash-flows, and has not been disclosed.
19. NET FINANCE COSTS
| | | | | | | | | | |
| | | |
| | |
| For the years ended December 31 | | | | |
($ millions) | | | 2025 | 2024 |
| Interest expense on financial liabilities measured at amortized cost: | | | | |
| Loans and borrowings | | | 515 | | 514 | |
| Subordinated hybrid notes | | | 39 | | 29 | |
| Leases | | | 33 | | 32 | |
| Interest income | | | (11) | | (46) | |
| Unwinding of discount rate | | | 25 | | 20 | |
| | | | |
| Foreign exchange losses and other | | | 1 | | 12 | |
| Net finance costs | | | 602 | | 561 | |
Net interest paid of $611 million (2024: $528 million) includes interest paid during construction and capitalized of $28 million (2024: $26 million).
122 Pembina Pipeline Corporation 2025 Annual Report
20. PENSION PLAN
| | | | | | | | |
As at December 31 | | |
($ millions) | 2025 | 2024 |
| Registered defined benefit net asset | (53) | | (23) | |
| Supplemental defined benefit net obligation | 16 | | 15 | |
| | |
| Net employee benefit assets | (37) | | (8) | |
Pembina maintains defined contribution plans and non-contributory defined benefit pension plans covering its employees. Pembina contributes five to 10 percent of an employee's salary to the defined contribution plan, until the employee's age plus years of service equals 50, at which time they become eligible for the defined benefit plans. Pembina ended eligibility for new entrants to the defined benefit plan as of January 1, 2021. Pembina recognized $17 million in expense for the defined contribution plan during the year (2024: $16 million). The defined benefit plans include a funded registered plan for all eligible employees and an unfunded supplemental retirement plan for those employees affected by the Canada Revenue Agency maximum pension limits. The defined benefit plans are administered by separate pension funds that are legally separated from Pembina. Benefits under the plans are based on the length of service and the annual average best three years of earnings during the last 10 years of service of the employee. Benefits paid out of the plans are not indexed. Pembina measures its accrued benefit obligations and the fair value of plan assets for accounting purposes as at December 31 of each year. The most recent actuarial funding valuation was at December 31, 2024. The defined benefit plans expose Pembina to actuarial risks such as longevity risk, interest rate risk, and market (investment) risk.
Defined Benefit Obligations
| | | | | | | | | | | | | | |
| As at December 31 | 2025 | 2024 |
| ($ millions) | Registered Plans | Supplemental Plan | Registered Plan | Supplemental Plan |
| Present value of unfunded obligations | — | | 16 | | — | | 15 | |
| Present value of funded obligations | 278 | | — | | 269 | | — | |
| Total present value of obligations | 278 | | 16 | | 269 | | 15 | |
| Fair value of plan assets | 331 | | — | | 292 | | — | |
| Recognized defined benefit assets (obligations) | 53 | | (16) | | 23 | | (15) | |
Pembina funds the defined benefit obligation plans in accordance with government regulations by contributing to trust funds administered by an independent trustee. The funds are invested primarily in equities and bonds. Defined benefit plan contributions totaled $17 million for the year ended December 31, 2025 (2024: $18 million).
Pembina has determined that, in accordance with the terms and conditions of the defined benefit plans, and in accordance with statutory requirements of the plans, the present value of refunds or reductions in future contributions is not lower than the balance of the total fair value of the plan assets less the total present value of obligations. As such, no decrease in the defined benefit asset is necessary at December 31, 2025 (2024: nil).
Registered Defined Benefit Pension Plan Assets Comprise
| | | | | | | | |
As at December 31 | | |
(Percent) | 2025 | 2024 |
| Equity securities | 63 | | 61 | |
| Debt | 33 | | 34 | |
| Other | 4 | | 5 | |
| 100 | | 100 | |
Pembina Pipeline Corporation 2025 Annual Report 123
Movement in the Present Value of the Defined Benefit Pension Obligation
| | | | | | | | | | | | | | |
| 2025 | 2024 |
| ($ millions) | Registered Plans | Supplemental Plan | Registered Plan | Supplemental Plan |
| Defined benefits obligations at January 1 | 269 | | 15 | | 250 | | 14 | |
| Benefits paid by the plan | (18) | | (1) | | (15) | | (1) | |
| Current service costs | 30 | | 1 | | 28 | | 1 | |
| Interest expense | 13 | | 1 | | 11 | | 1 | |
| | | | |
| Actuarial gain in other comprehensive income | (16) | | — | | (5) | | — | |
| Defined benefit obligations at December 31 | 278 | | 16 | | 269 | | 15 | |
Movement in the Present Value of Registered Defined Benefit Pension Plan Assets | | | | | | | | |
($ millions) | 2025 | 2024 |
| Fair value of plan assets at January 1 | 292 | | 255 | |
| Contributions paid into the plan | 17 | | 18 | |
| Benefits paid by the plan | (18) | | (15) | |
| Return on plan assets | 26 | | 22 | |
| | |
| Interest income | 14 | | 12 | |
| Fair value of registered plan assets at December 31 | 331 | | 292 | |
Expense Recognition in Earnings
| | | | | | | | |
For the years ended December 31 | | |
($ millions) | 2025 | 2024 |
| Registered Plan | | |
| Current service costs | 30 | | 29 | |
| Interest on obligation | 13 | | 11 | |
| Interest on plan assets | (14) | | (12) | |
| 29 | | 28 | |
The expense is recognized in the following line items in the Consolidated Statement of Comprehensive Income:
| | | | | | | | |
For the years ended December 31 | | |
($ millions) | 2025 | 2024 |
| Registered Plan | | |
| Operating expenses | 16 | | 15 | |
| General and administrative expense | 13 | | 13 | |
| 29 | | 28 | |
Expense recognized for the Supplemental Plan was less than $2 million for each of the years ended December 31, 2025 and 2024.
Actuarial Gains and Losses Recognized in Other Comprehensive Income
| | | | | | | | | | | | | | | | | | | | |
| 2025 | 2024 |
| ($ millions) | Registered Plans | Supplemental Plan | Total | Registered Plan | Supplemental Plan | Total |
| Balance at January 1 | 13 | | 1 | | 14 | | (8) | | 1 | | (7) | |
| Remeasurements: | | | | | | |
| | | | | | |
| | | | | | |
| Financial assumptions | 10 | | — | | 10 | | 2 | | — | | 2 | |
| Experience adjustments | 3 | | — | | 3 | | 2 | | — | | 2 | |
| Return on plan assets excluding interest income | 19 | | — | | 19 | | 17 | | — | | 17 | |
| Recognized gain during the period after tax | 32 | | — | | 32 | | 21 | | — | | 21 | |
| Balance at December 31 | 45 | | 1 | | 46 | | 13 | | 1 | | 14 | |
124 Pembina Pipeline Corporation 2025 Annual Report
Principal actuarial assumptions used:
| | | | | | | | |
| As at December 31 | | |
| (weighted average percent) | 2025 | 2024 |
| Discount rate | 5.0 | | 4.7 | |
| Future pension earning increases | 4.0 | | 4.0 | |
Assumptions regarding future mortality are based on published statistics and mortality tables. The current longevities underlying the values of the liabilities in the defined plans are as follows:
| | | | | | | | |
As at December 31 | | |
(years) | 2025 | 2024 |
| Longevity at age 65 for current pensioners | | |
| Males | 22 | 22 |
| Females | 25 | 24 |
| Longevity at age 65 for current member aged 45 | | |
| Males | 23 | 23 |
| Females | 25 | 25 |
The calculation of the defined benefit obligation is sensitive to the discount rate, compensation increases, retirements and termination rates as set out above. A change in the estimated discount rate of five percent by 100 basis points at December 31, 2025 is considered reasonably possible in the next financial year. An increase by 100 basis points would result in a $32 million reduction to the obligation whereas, a decrease would lead to a $40 million increase to the obligation.
Pembina expects to contribute $19 million to the defined benefit plans in 2026.
21. SHARE-BASED PAYMENTS
At December 31, 2025, Pembina has the following share-based payment arrangements:
Share Option Plan (Equity-Settled)
Pembina maintains a share option plan under which eligible employees were previously granted options to purchase shares of Pembina. Effective May 2024, Pembina ceased granting any new options under this plan. All options outstanding as at December 31, 2025 relate to grants made prior to May 2024 and will continue to be governed by their original terms until expiry. No new options will be granted in future periods.
Long-Term Share Unit Award Incentive Plan (Cash-Settled)
Pembina has a long-term share unit award incentive plan. Under the share-based compensation plan, awards of restricted ("RSU") and performance ("PSU") share units are made to officers and employees. The plan results in participants receiving cash compensation based on the value of the underlying notional shares granted under the plan. Payments are based on the trading value of Pembina's common shares plus notional dividends and performance of Pembina.
Pembina also has a deferred share unit ("DSU") plan. Under the DSU plan, directors are required to take at least 50 percent of total director compensation as DSUs, until such time that they have met certain share ownership guidelines. A DSU is a notional share that has the same value as one Pembina common share. Its value changes with Pembina's share price. DSUs do not have voting rights but they accrue dividends as additional DSU units, at the same rate as dividends paid on Pembina's common shares. DSUs are paid out when a director retires from the board and are redeemed for cash using the weighted average trading price of common shares on the Toronto Stock Exchange ("TSX") for the last five trading days before the redemption date, multiplied by the number of DSUs the director holds.
Pembina Pipeline Corporation 2025 Annual Report 125
Terms and Conditions of Share Option Plan and Share Unit Award Incentive Plan
Share Option Plan
Share options vest one-third on the first anniversary of the grant date, one-third on the second anniversary of the grant date and one-third on the third anniversary of the grant date and have a contractual life of seven years.
Long-Term Share Unit Award Incentive Plan(1)
The total long-term share unit awards granted to Officers, Board of Directors, and employees during the year were as follows:
| | | | | | | | | | | | | | |
Grant year (thousands of units) | PSUs (2) | RSUs (2) | DSUs | Total |
| 2024 | 780 | | 1,359 | | 32 | | 2,171 | |
| 2025 | 672 | | 1,194 | | 27 | | 1,893 | |
(1) Distribution units are granted in addition to RSU and PSU grants based on notional accrued dividends.
(2) Contractual life of 3 years.
PSUs vest on the third anniversary of the grant date. RSUs vest one-third on the first anniversary of the grant date, one-third on the second anniversary of the grant date and one-third on the third anniversary of the grant date. Actual units awarded are based on the trading value of the shares and performance of Pembina.
Disclosure of Share Option Plan
The number and weighted average exercise prices of share options is as follows:
| | | | | | | | |
| (thousands of options, except as noted) | Number of Options | Weighted Average Exercise Price (dollars) |
| Balance at December 31, 2023 | 10,682 | | $42.38 |
| Granted | 165 | | $50.46 |
Exercised(1) | (6,519) | | $42.90 |
| Forfeited | (37) | | $46.02 |
| Expired | (119) | | $44.80 |
| Balance at December 31, 2024 | 4,172 | | $41.78 |
| | |
Exercised(1) | (1,481) | | $41.31 |
| Forfeited | (9) | | $45.19 |
| Expired | (48) | | $44.15 |
| Balance at December 31, 2025 | 2,634 | | $41.99 |
(1) Exercise represents the net number of common shares equivalent to the employee's gain upon exercise.
As of December 31, 2025, the following options are outstanding:
| | | | | | | | | | | |
(thousands of options, except as noted) Exercise Price (dollars) | Options Outstanding at December 31, 2025 | Options Exercisable | Weighted Average Remaining Life (years) |
| $26.83 – $37.03 | 440 | | 440 | | 2 |
| $37.04 – $37.50 | 610 | | 610 | | 2 |
| $37.51 – $45.50 | 597 | | 583 | | 2 |
| $45.51 – $48.08 | 457 | | 301 | | 3 |
| $48.09 – $50.46 | 530 | | 421 | | 2 |
| Total | 2,634 | | 2,355 | | 2 |
Options are exercised regularly throughout the year. Therefore, the weighted average share price during the year of $55.20 (2024: $51.47) is representative of the weighted average share price at the date of exercise.
126 Pembina Pipeline Corporation 2025 Annual Report
Expected volatility is estimated by considering historic average share price volatility. The weighted average inputs used in the measurement of the fair values at grant date of share options are the following:
Share Options Granted
| | | | | | | | | | |
For the years ended December 31 (dollars, except as noted) | 2025 | | 2024 | |
| | | | |
| Weighted average | | | | |
| Fair value at grant date | — | | | 6.96 | | |
| | | | |
| | | | |
Expected volatility (percent) | — | | | 25.1 | | |
Expected option life (years) | — | | 3.67 | |
| Expected annual dividends per option | — | | | 2.74 | | |
Expected forfeitures (percent) | — | | | 7.2 | | |
Risk-free interest rate (based on government bonds) (percent) | — | | | 3.9 | | |
Disclosure of Long-Term Share Unit Award Incentive Plan
The long-term share unit award incentive plans were valued using the volume weighted average price for the 20 days ending December 31, 2025 of $52.68 (2024: $54.05). Actual payment may differ from the amount valued based on market price and company performance.
Employee Expenses
| | | | | | | | |
For the years ended December 31 | | |
| ($ millions) | 2025 | 2024 |
| Share option plan, equity settled | 2 | | 3 |
| Long-term share unit award incentive plan | 92 | | 81 |
| | |
| Share-based compensation expense | 94 | | 84 |
| | |
| Total carrying amount of liabilities for cash settled arrangements | 165 | | 158 |
| Total intrinsic value of liability for vested benefits | 98 | | 105 | |
22. ACCUMULATED OTHER COMPREHENSIVE INCOME
| | | | | | | | | | | | | | |
| ($ millions) | Currency Translation Reserve | Cash Flow Hedge Reserve | Pension and other Post-Retirement Benefit Plan Adjustments(2) | Total |
| Balance at December 31, 2023 | 211 | | 18 | | (8) | | 221 | |
| Other comprehensive gain before hedging activities | 436 | | — | | 21 | | 457 | |
Other comprehensive loss resulting from hedging activities(1) | (27) | | (10) | | — | | (37) | |
| | | | |
| | | | |
| | | | |
| | | | |
| | | | |
| Balance at December 31, 2024 | 620 | | 8 | | 13 | | 641 | |
| Other comprehensive (loss) gain before hedging activities | (272) | | — | | 32 | | (240) | |
Other comprehensive gain (loss) resulting from hedging activities, net of tax(1) | 14 | | (8) | | — | | 6 | |
| | | | |
| | | | |
| Balance at December 31, 2025 | 362 | | — | | 45 | | 407 | |
(1) Amounts relate to hedges of the Company's net investment in foreign operations (reported in Currency Translation Reserve) and interest rate forward swaps (reported in Cash Flow Hedge Reserve) (Note 23), which matured on March 31, 2025. At December 31, 2025, the other comprehensive loss resulting from hedging activities for interest rate forward swaps includes a realized gain of $4 million that was reclassified to net finance costs (2024: $17 million realized gain).
(2) Pension and other Post-Retirement Benefit Plan Adjustments will not be reclassified into earnings.
Pembina Pipeline Corporation 2025 Annual Report 127
23. FINANCIAL INSTRUMENTS & RISK MANAGEMENT
Risk Management Overview
Pembina has exposure to counterparty credit risk, liquidity risk, and market risk. Pembina recognizes that effective management of these risks is a critical success factor in managing organization and shareholder value.
Risk management strategies, policies, and limits ensure risks and exposures are aligned to Pembina's business strategy and risk tolerance. Pembina's Board of Directors is responsible for providing risk management oversight and oversees how management monitors compliance with the organization's risk management policies and procedures. In addition, the Board of Directors reviews the adequacy of this risk framework in relation to the risks faced by Pembina. Internal audit personnel assist the Board of Directors in its oversight role by monitoring and evaluating the effectiveness of the organization's risk management system.
Counterparty Credit Risk
Counterparty credit risk represents the financial loss Pembina may experience if a counterparty to a financial instrument or commercial agreement fails to meet its contractual obligations to Pembina in accordance with the terms and conditions of such instruments or agreements with Pembina. Counterparty credit risk arises primarily from Pembina's trade and other receivables, finance lease receivables, advances to related parties and derivative financial instruments.
Pembina manages counterparty credit risk through established credit management techniques. These techniques include conducting comprehensive financial and other assessments of new high exposure counterparties, regular reviews of existing counterparties to monitor their creditworthiness, setting exposure limits, monitoring exposures against these limits, entering into master netting arrangements, and obtaining financial assurances where warranted. Pembina utilizes various sources of financial, credit and business information in assessing the creditworthiness of a counterparty. This information includes external credit ratings, where available, and in other cases, detailed financial statement analysis in order to generate an internal credit rating based on quantitative and qualitative factors. The Board of Directors has approved a counterparty exposure limit matrix which establishes the maximum exposure that can be approved for a counterparty based on debt rating. Pembina continues to closely monitor and reassess the creditworthiness of its counterparties, which has resulted in Pembina reducing or mitigating its exposure to certain counterparties where it was deemed warranted and permitted under contractual terms.
Financial assurances from counterparties may include guarantees, letters of credit and cash. As at December 31, 2025, letters of credit totalling approximately $249 million (2024: $276 million) were held primarily in respect of customer trade receivables.
Pembina typically has collected its trade receivables in full and at December 31, 2025, 98 percent were current (2024: 99 percent). Management defines current as outstanding accounts receivable under 30 days past due. Pembina has a general lien and a continuing and first priority security interest in, and a secured charge on, all of a shipper's petroleum products in its custody.
At December 31, the aging of trade and other receivables was as follows:
| | | | | | | | |
| ($ millions) | 2025 | 2024 |
| 31-60 days past due | 1 | | 1 | |
| Greater than 61 days past due | 2 | | 2 | |
| | |
| 3 | | 3 | |
Pembina measures the lifetime expected credit loss at initial recognition and throughout the life of a customer trade receivable. The lifetime expected credit loss is determined based on Pembina's historical default rates, adjusted for forward-looking estimates. Management believes that customer trade receivables past due by greater than 30 days are fully collectible based on historical default rates.
128 Pembina Pipeline Corporation 2025 Annual Report
Expected credit losses on finance lease receivables are determined using a probability-weighted estimate of credit losses, measured as the present value of all expected cash shortfalls, discounted at the interest rates implicit in the leases, using reasonable and supportable information about past events, current conditions, and forecasts of future economic conditions. Pembina considers the risk of default relating to lease receivables low based on its assessment of individual counterparty credit risk through the established credit management techniques as discussed above.
Pembina monitors and manages its concentration of counterparty credit risk on an ongoing basis. Pembina believes these measures minimize its counterparty credit risk, but there is no certainty that they will protect it against all material losses. As part of its ongoing operations, Pembina must balance its market and counterparty credit risks when making business decisions.
Liquidity Risk
Liquidity risk is the risk Pembina will not be able to meet its financial obligations as they come due. The following are the contractual maturities of financial liabilities, including estimated interest payments.
| | | | | | | | | | | | | | | | | | | | |
| | | Outstanding Balances Due by Period |
| As at December 31, 2025 | Carrying Amount | Expected Cash Flows | Less Than
1 Year | 1 - 3 Years | 3 - 5 Years | More Than 5 Years |
| ($ millions) |
| Trade payables and other | 1,321 | | 1,321 | | 1,321 | | — | | — | | — | |
| | | | | | |
| Loans and borrowings | 11,666 | | 18,020 | | 1,059 | | 2,681 | | 2,683 | | 11,597 | |
| Subordinated hybrid notes | 1,022 | | 1,409 | | 54 | | 108 | | 108 | | 1,139 | |
| | | | | | |
| Derivative financial liabilities | 138 | | 139 | | 22 | | 22 | | 20 | | 75 | |
| Lease liabilities | 622 | | 815 | | 113 | | 203 | | 144 | | 355 | |
| | | | | | |
Pembina manages its liquidity risk by forecasting cash flows over a 12-month rolling time period to identify financing requirements. These financing requirements are then addressed through a combination of credit facilities and through access to capital markets, if required.
Market Risk
Pembina's results are subject to movements in commodity prices, foreign exchange, and interest rates. A formal Risk Management Program, which includes policies and procedures, has been designed to mitigate these risks.
a. Commodity Price Risk
Certain of the transportation contracts or tolling arrangements with respect to Pembina's pipeline assets do not include take-or-pay commitments from crude oil and natural gas producers and, as a result, Pembina is exposed to volume risk with respect to those assets. A decrease in volumes transported can directly and adversely affect Pembina's revenues and earnings. The demand for, and utilization of, Pembina's pipeline assets may be impacted by factors such as changing market fundamentals, capacity bottlenecks, operational incidents, regulatory restrictions, system maintenance, weather and increased competition. Market fundamentals, such as commodity prices and price differentials, natural gas and gasoline consumption, alternative energy sources and global supply disruptions outside of Pembina's control can impact both the supply of and demand for the commodities transported on Pembina's pipelines, which can, in turn, impact the demand for, and utilization of, Pembina's pipeline assets.
Pembina's Marketing business includes activities related to product storage, terminalling, and hub services. These activities expose Pembina to certain risks relating to fluctuations in commodity prices and, as a result, Pembina may experience volatility in revenue and impairments related to the book value of stored product. Primarily, Pembina enters into contracts to purchase and sell crude oil, condensate, NGL, power and natural gas at floating market prices. As a result, the prices of products that are marketed by Pembina are subject to volatility due to factors such as seasonal demand changes, extreme weather conditions, market inventory levels, general economic conditions, changes in global markets and other factors. Pembina manages its risk exposure by balancing purchases and sales to secure less volatile margins.
Pembina Pipeline Corporation 2025 Annual Report 129
Notwithstanding Pembina's management of price and quality risk, marketing margins for commodities can vary and have varied significantly from period to period in the past. This variability could have an adverse effect on the results of Pembina's Marketing business and its overall results of operations. To assist in reducing this inherent variability in its Marketing business, Pembina has invested, and will continue to invest, in assets that have a fee-based revenue component.
Pembina is also exposed to potential price declines and decreasing frac spreads between the time Pembina purchases NGL feedstock and sells NGL products. Frac spread is the difference between the revenue from the sale of NGL if removed from a gas stream and the value such NGL would have had if left in the gas stream and sold at natural gas prices. Frac spreads can change significantly from period to period depending on the relationship between NGL and natural gas prices (the "frac spread ratio"), absolute commodity prices, transport differentials and changes in the Canadian to U.S. dollar exchange rate. In addition, there is also a differential between NGL product prices and crude oil prices which can change margins realized for midstream products. The amount of profit or loss made on the extraction portion of the business will generally increase or decrease with frac spreads. This exposure could result in variability of cash flow generated by the Marketing business.
Pembina’s commercial arrangements relating to its Cedar LNG capacity have given rise to commodity price risk exposure. These commercial arrangements have led to Pembina contracting its Cedar LNG capacity to third-party customers. Such contracting has incorporated, but not exclusively, pricing mechanisms that include spreads between global LNG and Canadian natural gas market pricing. The related pricing mechanism may result in additional cash flows to Pembina if spreads rise above specified thresholds, but in no instances will the pricing mechanism result in a reduction of cash flows. The pricing spread is subject to volatility, particularly in the context of the global LNG market, which is undergoing significant change and rebalancing. The inherent market exposure could result in variability of cash flow and earnings.
Pembina utilizes financial derivative instruments as part of its overall risk management strategy to assist in managing the exposure to commodity price, interest rate, cost of power, and foreign exchange risk. As an example of commodity price mitigation, Pembina actively fixes a portion of its exposure to frac spread margins through the use of derivative financial instruments. Pembina has also entered into power purchase agreements to secure cost-competitive renewable energy, fix the price for a portion of the power Pembina consumes, and reduce its emissions. Pembina's Marketing business is exposed to variability in quality, time and location differentials for various products, and financial instruments may be used to offset Pembina's exposures to these differentials.
The following table shows the impact on earnings if the underlying forward commodity prices of the derivative financial instruments increased or decreased by 15 percent, with other variables held constant.
| | | | | | | | | | | |
| As at December 31, 2025 | | 15 Percent | 15 Percent |
($ millions) | | Price Increase | Price Decrease |
Crude oil(1) | | (5) | | 5 | |
| Natural gas | | 8 | | (8) | |
NGL(2) | | (19) | | 19 | |
(1) Includes condensate.
(2) Includes propane and butane.
b. Foreign Exchange Risk
Certain of Pembina's cash flows, namely a portion of its commodity-related cash flows, certain cash flows from U.S. infrastructure assets, are subject to currency risk, arising from the denomination of specific cash flows in U.S. dollars. Additionally, a portion of Pembina's capital expenditures and loans to wholly-owned U.S. entities, may be denominated in U.S. dollars. Furthermore, the value of the investment in U.S. dollar denominated subsidiaries will fluctuate with changes in exchange rates when translated into Pembina's functional currency.
Pembina monitors, assesses and responds to these foreign currency risks using an active risk management program, which may include the issuance of U.S. dollar debt, and exchange of foreign currency for domestic currency at a fixed rate.
130 Pembina Pipeline Corporation 2025 Annual Report
The following table shows the impact on earnings if the underlying foreign exchange risk rate of the derivative financial instruments increased or decreased by $0.10, with other variables held constant.
| | | | | | | | | | | |
| As at December 31, 2025 | | $0.10 | $0.10 |
($ millions) | | Rate Increase | Rate Decrease |
| U.S. to Canadian dollars | | (10) | | 10 | |
c. Interest Rate Risk
Interest bearing financial liabilities include Pembina's debt and lease liabilities. Pembina has floating interest rate debt in the form of its Credit Facilities, which subjects Pembina to interest rate risk. Pembina monitors and assesses variable interest rate risk and responds to this risk by issuing long-term debt with fixed interest rates or by entering into interest rate swaps.
Pembina's U.S. drawings on its Credit Facilities have variable rate components that reference the U.S. SOFR. Pembina's Canadian dollar drawings on its Credit Facilities have variable rate components that reference the CORRA.
At the reporting date, the interest rate profile of Pembina's interest-bearing financial instruments was:
| | | | | | | | |
| As at December 31 | | |
($ millions) | 2025 | 2024 |
| Carrying amounts of financial liability | | |
Fixed rate instruments(1) | 12,005 | | 12,173 | |
Variable rate instruments(2) | 1,305 | | 1,148 | |
| 13,310 | | 13,321 | |
(1) Includes lease liabilities and subordinated hybrid notes.
(2) At December 31, 2025, there were no financial derivative contracts designated as cash flow hedging instruments. At December 31, 2024, this includes financial derivative contracts designated as cash flow hedging instruments, fixing the interest rates on U.S. $250 million of variable rate debt.
Cash Flow Sensitivity Analysis for Variable Rate Instruments
The following table shows the impact on earnings if interest rates at the reporting date would have increased or decreased by 100 basis points, with other variables held constant.
| | | | | | | | |
As at December 31, 2025 | 100 Basis Point | 100 Basis Point |
| ($ millions) | Increase | Decrease |
| Variable rate instruments | 9 | | (9) | |
Fair Values
The fair value of financial instruments utilizes a variety of valuation inputs. When measuring fair value, Pembina uses observable market data to the greatest extent possible. Depending on the nature of these valuation inputs, financial instruments are categorized as follows:
a. Level 1
Level 1 fair values are based on inputs that are unadjusted observable quoted prices from active markets for identical assets or liabilities as at the measurement date.
b. Level 2
Level 2 fair values are based on inputs, other than quoted market prices included in Level 1, that are either directly or indirectly observable. Level 2 fair value inputs include quoted forward market prices, time value, and broker quotes that are observable for the duration of the financial instrument's contractual term. These inputs are often adjusted for factors specific to the asset or liability, such as, location differentials and credit risk.
Financial instruments that utilize Level 2 fair valuation inputs include derivatives arising from physical commodity forward contracts, commodity swaps and options, and forward interest rate and foreign-exchange swaps. In addition, Pembina's loans and borrowings utilize Level 2 fair valuation inputs, whereby the valuation technique is based on discounted future interest and principal payments using the current market interest rates of instruments with similar terms.
Pembina Pipeline Corporation 2025 Annual Report 131
c. Level 3
Level 3 fair values utilize inputs that are not based on observable market data. Rather, various valuation techniques are used to develop inputs.
Financial instruments that utilize Level 3 fair valuation inputs include the following:
i.Power Purchase Agreements: Pembina's long-term power purchase agreements have given rise to embedded derivative instruments. The fair value of these embedded derivatives are measured using discounted projected cash flow models. The key unobservable inputs in the valuation include forecasted power prices from EDC Associates Ltd. and management estimates of renewable wind power pricing discounts. The power purchase agreements have a maturity date ranging from 2040 to 2041 and a notional that ranges from 100 megawatt ("MW") to 105 MW of renewable energy capacity. The forecasted power prices, before applying the forecasted wind power pricing discount, range from $52.54 per megawatt hour ("MWh") to $77.36 per MWh (2024: $46.69 MWh to $76.03 MWh). Lastly, the forecasted wind power pricing discount applied ranges from 50 percent to 67 percent (2024: 42 percent to 68 percent).
ii.Cedar LNG Capacity Commercial Arrangement: Pembina's provision of Cedar LNG transportation and liquefaction capacity to a third-party customer has given rise to an embedded derivative instrument with option features. The fair-value of this embedded derivative is measured using Black-Scholes option modelling, using a notional of 1.0 million tonnes of LNG per annum for a term of 20 years. The term commences when Cedar LNG becomes commercially operational. The key unobservable inputs in the valuation include: (a) the forecasted spread between the forward global Japan Korea Marker LNG index and the forward Alberta Energy Company ("AECO") natural gas index; and, (b) the forecasted volatility of such commodity prices. The forecasted spread between these market pricing indices ranges from $6.32 per Million British Thermal Units ("MMBtu") to $9.03 per MMBtu (in U.S. dollars). Lastly, the forecasted average volatility of such commodity prices is 18 percent.
The fair valuation of embedded derivative instruments is judged to be a significant management estimate. The respective assumptions and inputs are susceptible to change and may differ from actual future developments. This estimation uncertainty could materially impact the quantified fair value; and therefore, the gains and losses on derivative financial instruments.
The following table illustrates the sensitivity of Level 3 derivative financial instruments:
| | | | | | | | | | | | | | | | | |
| As at December 31 | | 2025 | 2024 |
| ($ millions) | | Earnings Increase | Earnings Decrease | Earnings Increase | Earnings Decrease |
| Power purchase agreements | Forward power prices and renewable wind power pricing discounts (+/-10 percent) | 54 | | (54) | | 53 | | (53) | |
| Cedar LNG capacity commercial arrangement | Forward commodity pricing (+/-10 percent) and volatility in commodity prices (+/-5 percent) | 184 | | (102) | | — | | — | |
132 Pembina Pipeline Corporation 2025 Annual Report
The carrying values of financial assets and liabilities in relation to their respective fair values, together with their appropriate fair value categorization are illustrated in the table below. Certain other non-derivative financial instruments measured at amortized cost, including cash and cash equivalents, trade receivables and other, trade payables and other, and other liabilities have been excluded since their carrying values are judged to approximate their fair values due to their nature and short maturity. These instruments would be categorized as Level 2 in the fair value hierarchy.
| | | | | | | | | | | | | | | | | | | | | | | | | | | |
| December 31, 2025 | December 31, 2024 |
| Carrying
Value | Fair Value | Carrying
Value | Fair Value | |
| ($ millions) | Level 1 | Level 2 | Level 3 | Level 1 | Level 2 | Level 3 | |
| | | |
| | | | | |
| | | | | | | |
Financial assets carried at fair value | | | | | | | | | |
Derivative financial instruments(1) | 128 | | — | | 14 | | 114 | | 13 | | — | | 13 | | — | | |
| | | | | | | | | |
| | | | | | | | | |
| | | | | | | | | |
| | | | | | | | | |
| | | | | | | | | |
| | | | | | | | | |
Financial liabilities carried at fair value | | | | | | | | | |
Derivative financial instruments(1) | 138 | | — | | 9 | | 129 | | 159 | | — | | 42 | | 117 | | |
| | | | | | | | | |
Financial liabilities carried at amortized cost | | | | | | | | | |
Long-term debt(2) | 12,688 | | — | | 12,708 | | — | | 12,656 | | — | | 12,649 | | — | | |
(1) At December 31, 2025, all derivative financial instruments are carried at fair value through earnings. At December 31, 2024, all derivative financial instruments are carried at fair value through earnings, except for $5 million in interest rate derivative financial assets that were designated as cash flow hedge and matured on March 31, 2025.
(2) Carrying value of current and non-current balances. Includes loans and borrowings and subordinated notes.
Changes in fair value of the derivative net liabilities classified as Level 3 in the fair value hierarchy were as follows:
| | | | | | | | |
| For the year ended December 31 | | |
| ($ millions) | 2025 | 2024 |
| Level 3 derivative net (liability) asset at January 1 | (117) | | 15 | |
| | |
| | |
| | |
| | |
New contracts added(1) | 176 | | — | |
| | |
Loss from power purchase agreements embedded derivatives(2) | (12) | | (132) | |
Loss from Cedar LNG capacity commercial arrangement embedded derivative(2) | (62) | | — | |
Level 3 derivative net liability at December 31 | (15) | | (117) | |
(1) Relates to Cedar LNG’s embedded derivative arising from the Cedar LNG capacity commercial arrangement entered into during the fourth quarter of 2025.
(2) Net realized and unrealized loss included in Revenue from risk management and derivative contracts (see Note 18 Revenue).
There were no transfers into or out of Level 3 during the year ended December 31, 2025.
Hedge Accounting
a. Net Investment Hedges
Pembina has designated certain U.S. dollar denominated debt as a hedge of the Company's net investment in U.S. dollar denominated subsidiaries and investments in equity accounted investees. This hedging activity is in aid of Pembina’s risk management strategy for foreign exchange risk. The designated debt has been assessed as having no ineffectiveness as the U.S. dollar denominated debt has an equal and opposite exposure to U.S. dollar fluctuations. The designated debt is recorded in loans and borrowings on the Consolidated Statements of Financial Position and all related gains and losses are recorded directly in other comprehensive income.
The details of the U.S. dollar denominated debt are as follows:
| | | | | | | | |
| | |
For the years ended December 31 ($ millions) | 2025 | 2024 |
Notional amount of U.S. debt designated (in U.S. dollars) | 250 | | 250 | |
| Carrying value of U.S. debt designated | 343 | | 360 | |
| Maturity date | 2030 | 2025 |
Pembina Pipeline Corporation 2025 Annual Report 133
b. Cash Flow Hedges
Pembina had designated interest rate forward swaps as hedging instruments to manage interest rate risk exposure related to Credit Facilities. The designated interest rate forward swaps were recorded in derivative financial instruments on the Consolidated Statements of Financial Position and all related gains or losses were recorded directly in other comprehensive income, with realized gains or losses reclassified to net finance costs. The interest rate forward swaps matured on March 31, 2025.
There was no interest rate forward swap derivative instrument as at December 31, 2025. The interest rate forward swap derivative instruments as at December 31, 2024 had a notional amount of $360 million, a carrying value of $5 million, and a 2025 maturity date.
Gains and Losses from Derivative Instruments
| | | | | | | | | | |
| | |
For the years ended December 31 | | | | |
| ($ millions) | | | 2025 | 2024 |
| Derivative instruments held at fair value through earnings | | | | |
| Realized gain recorded in revenue from risk management and other derivative contracts | | | | |
Commodity-related gain | | | (133) | | (241) | |
| | | | |
| Unrealized (gain) loss recorded in revenue from risk management and other derivative contracts | | | | |
| Commodity-related (gain) loss | | | (25) | | 170 | |
| Cedar LNG capacity commercial arrangement embedded derivative loss | | | 62 | | — | |
| | | | |
| | | | |
| Derivative instruments in hedging relationships | | | | |
Interest rate loss recorded in other comprehensive income(1) | | | 4 | | 10 | |
(1) Unrealized losses or gains for designated cash flow hedges are recognized in impact of hedging activities in the Consolidated Statements of Earnings and Comprehensive Income, with realized losses or gains being reclassified to net finance costs. The movement in other comprehensive income relates to realized losses on interest rate forward swaps, which matured on March 31, 2025. A gain of $4 million was recognized during the first quarter of 2025, prior to the maturity date, that was reclassified to net finance costs (2024: $17 million realized gain). No losses or gains have been recognized in net income relating to discontinued cash flow hedges.
24. CAPITAL MANAGEMENT
Pembina's objective when managing capital is to ensure a strong financial position and a stable stream of dividends to shareholders that is sustainable over the long term. Pembina manages its capital structure based on requirements arising from significant capital development activities, the risk characteristics of its underlying asset base and changes in economic conditions. Pembina manages its capital structure and short-term financing requirements using non-GAAP measures, including the ratios of debt to adjusted EBITDA, debt to total enterprise value, adjusted cash flow to debt, debt to equity, and rating agency metrics such as funds from operations to debt. The metrics are used to measure Pembina's financial leverage and measure the strength of Pembina's balance sheet. Pembina remains satisfied that the leverage currently employed in its capital structure is appropriate given the characteristics and operations of the underlying asset base.
Pembina maintains a capital structure that allows it to finance its day-to-day cash requirements through its operations, without requiring external sources of capital. Pembina funds its operating commitments, short-term capital spending as well as its dividends to shareholders through this cash flow, while new borrowing and equity issuances are primarily reserved for the support of specific significant development activities. The capital structure of Pembina consists of shareholder's equity, comprised of common and preferred equity, and long-term debt. Long-term debt is comprised of bank credit facilities, unsecured notes, and subordinated hybrid notes.
Note 16 of these financial statements shows the change in share capital for the year ended December 31, 2025.
134 Pembina Pipeline Corporation 2025 Annual Report
25. GROUP ENTITIES
Significant Subsidiaries
| | | | | | | | | | | |
As at December 31 | | Ownership Interest |
(percentages) | Jurisdiction | 2025 | 2024 |
| Pembina Pipeline | Alberta | 100 | | 100 | |
| Pembina Empress NGL Partnership | Alberta | 100 | | 100 | |
| | | |
| | | |
| Pembina Holding Canada L.P. | Alberta | 100 | | 100 | |
| Pembina Infrastructure and Logistics L.P. | Alberta | 100 | | 100 | |
| Pembina Midstream Limited Partnership | Alberta | 100 | | 100 | |
| Pembina Oil Sands Pipeline L.P. | Alberta | 100 | | 100 | |
| Aux Sable Liquid Products L.P. | Delaware U.S. | 100 | | 100 | |
| Alliance Pipeline Limited Partnership | Alberta | 100 | | 100 | |
| Alliance Pipeline L.P. | Delaware U.S. | 100 | | 100 | |
| Pembina Cochin LLC | Delaware U.S. | 100 | | 100 | |
| | | |
| | | |
| | | |
| | | |
| | | |
| | | |
| | | |
| | | |
| | | |
| | | |
Pembina Pipeline Corporation 2025 Annual Report 135
26. RELATED PARTIES
Pembina enters into transactions with related parties in the normal course of business and all transactions are measured at their exchange amount, unless otherwise noted. Pembina provides management and operational oversight services, on a fixed fee and cost recovery basis, to certain equity accounted investees. Pembina also contracts for services and capacity from certain of its equity accounted investees, advances funds to support operations and provides letters of credit, including financial guarantees.
A summary of the significant related party transactions and balances are as follows:
| | | | | | | | | | |
| | |
| | | | |
For the years ended December 31 ($ millions) | | | 2025 | 2024 |
| PGI | | | 242 | | 242 | |
| Cedar LNG | | | 19 | | 26 | |
Aux Sable(1) | | | — | | 32 | |
Alliance(1) | | | — | | 4 | |
| | | | |
Other(2) | | | — | | 2 | |
Total services provided(3) | | | 261 | | 306 | |
| PGI | | | 8 | | 8 | |
Alliance(1) | | | — | | 3 | |
| Total services received | | | 8 | | 11 | |
| | | | |
As at December 31 ($ millions) | | | 2025 | 2024 |
| | | | |
| | | | |
| PGI | | | 39 | | 34 | |
| Cedar LNG | | | 4 | | 2 | |
Greenlight(4) | | | 27 | | — | |
Other(2) | | | — | | 1 | |
| Trade receivables and other | | | 70 | | 37 | |
| | | | |
Right-of-use assets(5) | | | 32 | | — | |
Lease liabilities(5) | | | 32 | | — | |
(1) As of April 1, 2024, following the completion of Pembina's acquisition of a controlling interest in Alliance and Aux Sable, these entities became consolidated subsidiaries of Pembina and, as such, are no longer related parties.
(2) Other includes transactions with Grand Valley and ACG.
(3) Services provided by Pembina include payments made by Pembina on behalf of related parties.
(4) On November 5, 2025, Pembina issued a $27 million promissory note to Greenlight, with a 10.0 percent annual interest rate payable semi-annually, with an optional prepayment, and a maturity date of the earlier of five days after Greenlight's positive final investment decision or September 30, 2026.
(5) As at December 31, 2025, Pembina had a lease arrangement with PGI for the use of a natural gas storage asset. Under the terms of the agreement, Pembina recognized a right-of-use asset and a corresponding lease liability. The lease commenced on September 1, 2025 and has a term of 15 years. Lease payments are made on a monthly basis and are structured as a combination of a fixed fee and flow-through charges.
Key Management Personnel and Director Compensation
Key management consists of Pembina's directors and certain key officers.
Compensation
In addition to short-term employee benefits, including salaries, director fees and short-term incentives, Pembina also provides key management personnel with share-based compensation, contributes to post employment pension plans and provides car allowances, parking and business club memberships.
Key management personnel compensation comprised:
| | | | | | | | |
For the years ended December 31 | | |
($ millions) | 2025 | 2024 |
| Short-term employee benefits | 16 | | 11 | |
Share-based compensation and other(1) | 26 | | 13 | |
| Total compensation of key management | 42 | | 24 | |
(1) Includes termination benefits.
136 Pembina Pipeline Corporation 2025 Annual Report
Transactions
Key management personnel and directors of Pembina control less than one percent of the voting common shares of Pembina (consistent with the prior year). Certain directors and key management personnel also hold Pembina preferred shares. Dividend payments received for the common and preferred shares held are commensurate with other non-related holders of those instruments.
Certain officers are subject to employment agreements in the event of termination without just cause or change of control.
Post-Employment Benefit Plans
Pembina has significant influence over the pension plans for the benefit of their respective employees. No balance payable is outstanding at December 31, 2025 (2024: nil).
| | | | | | | | | | | |
| ($ millions) | | Transaction Value Years Ended December 31 |
| Post-employment benefit plan | Transaction | 2025 | 2024 |
| Defined benefit plan | Funding | 17 | | 18 | |
Pembina Pipeline Corporation 2025 Annual Report 137
27. COMMITMENTS AND CONTINGENCIES
Commitments
Pembina was committed for the following amounts under its contracts and arrangements as at December 31, 2025:
| | | | | | | | | | | | | | | | | |
Contractual Obligations(1) | Payments Due by Period |
| ($ millions) | Total | Less than 1 year | 1 – 3 years | 3 – 5 years | After 5 years |
Transportation and processing(2) | 11,312 | | 74 | | 216 | | 1,185 | | 9,837 | |
Construction commitments(3) | 392 | | 361 | | 29 | | 2 | | — | |
Other commitments related to lease contracts(4) | 591 | | 44 | | 105 | | 158 | | 284 | |
| | | | | |
Funding commitments, software, and other | 65 | | 46 | | 18 | | 1 | | — | |
| | | | | |
| | | | | |
Total contractual obligations | 12,360 | | 525 | | 368 | | 1,346 | | 10,121 | |
(1)Pembina enters into product purchase agreements and power purchase agreements to secure supply for future operations. Purchase prices of both NGL and power are dependent on current market prices. Volumes and prices for NGL and power contracts cannot be reasonably determined, and therefore, an amount has not been included in the contractual obligations schedule. Product purchase agreements range from one to 15 years and involve the purchase of NGL products from producers. Assuming product is available, Pembina has secured between 26 and 175 mbpd of NGL each year up to and including 2040. Power purchase agreements range from one to 24 years and involve the purchase of power from electrical service providers. Pembina has secured up to 74 megawatts per day each year up to and including 2049.
(2)In 2024, Pembina signed two agreements relating to the Cedar LNG Project: (a) Liquefaction Tolling Services Agreement ("LTSA"); and, (b) Gas Supply Agreement ("GSA"). The LTSA is a 20-year take-or-pay fixed toll contract for 1.5 million mpta, while the GSA will allow for transport on the Coastal GasLink Pipeline of approximately 200 million MMcf/d of Canadian natural gas to Cedar LNG. These agreements represent a total commitment of approximately $10.6 billion, which will commence on in-service date of the Cedar LNG Project in late 2028. In 2025, Pembina contracted the rights to this respective liquefaction and transportation capacity to two third-party customers.
(3)Excludes projects that are executed by equity accounted investees.
(4)Relates to expected variable lease payments excluded from the measurement of the lease liability, payments under lease contracts which have not yet commenced, and payments related to non-lease components in lessee lease contracts.
Commitments to Equity Accounted Investees
Pembina has commitments to provide contributions to certain equity accounted investees based on its ownership interest. These contributions are determined and approved by the joint venture partners to fund operating budgets, growth capital, and significant projects development costs, including the Cedar LNG Project and Greenlight.
Contingencies
Pembina, including its subsidiaries and its investments in equity accounted investees, are subject to various legal and regulatory and tax proceedings, actions and audits arising in the normal course of business. Pembina represents its interests vigorously in all proceedings in which it is involved. Legal and administrative proceedings involving possible losses are inherently complex, and the Company applies significant judgment in estimating probable outcomes. As at December 31, 2025, there were no significant claims filed against Pembina for which management believes the resolution of any such actions or proceedings would have a material impact on Pembina's financial position or results of operations.
Letters of Credit
Pembina has provided letters of credit to various third parties in the normal course of conducting business. The letters of credit include financial guarantees to counterparties for product purchases and sales, transportation services, utilities, engineering and construction services. The letters of credit have not had and are not expected to have a material impact on Pembina's financial position, earnings, liquidity or capital resources. As at December 31, 2025, Pembina had $124 million (December 31, 2024: $209 million) in letters of credit issued.
138 Pembina Pipeline Corporation 2025 Annual Report
| | | | | |
| |
HEAD OFFICE Pembina Pipeline Corporation Suite 4000, 585 - 8th Avenue SW Calgary, Alberta T2P 1G1 AUDITORS KPMG LLP Chartered Professional Accountants Calgary, Alberta TRUSTEE, REGISTRAR & TRANSFER AGENT Computershare Trust Company of Canada Suite 600, 530 - 8th Avenue SW Calgary, Alberta T2P 3S8 1.800.564.6253 STOCK EXCHANGE Pembina Pipeline Corporation Toronto Stock Exchange listing symbols for: COMMON SHARES PPL PREFERRED SHARES PPL.PR.A, PPL.PR.C, PPL.PR.E, PPL.PR.G, PPL.PR.O, PPL.PR.Q, PPL.PF.A and PPL.PF.E New York Stock Exchange listing symbol for: COMMON SHARES PBA INVESTOR INQUIRIES PHONE 403.231.3156 FAX 403.237.0254 TOLL FREE 1.855.880.7404 EMAIL investor-relations@pembina.com WEBSITE www.pembina.com |