
Second Quarter 2025 Earnings July 24, 2025 Chris Cartwright, President and CEO Todd Cello, CFO Exhibit 99.2
2@ Copyright 2025 TransUnion, its subsidiaries and/or affiliates. All Rights Reserved. Non-GAAP Financial InformationForward-Looking Statements This presentation contains forward-looking statements within the meaning of the Private Securities Litigation Reform Act of 1995. These statements are based on the current beliefs and expectations of TransUnion’s management and are subject to significant risks and uncertainties. Actual results may differ materially from those described in the forward-looking statements. Factors that could cause TransUnion’s actual results to differ materially from those described in the forward-looking statements include: macroeconomic effects and changes in market conditions, including the impact of tariffs, inflation, risk of recession and industry trends and adverse developments in the debt, consumer credit and financial services markets, including the impact on the carrying value of our assets in all of the markets where we operate; our ability to provide competitive services and prices; our ability to retain or renew existing agreements with large or long-term customers; our ability to maintain the security and integrity of our data; our ability to deliver services timely without interruption; our ability to maintain our access to data sources; government regulation and changes in the regulatory environment; litigation or regulatory proceedings; our approach to the use of artificial intelligence; our ability to effectively manage our costs; our efforts to execute our transformation plan and achieve the anticipated benefits and savings; our ability to maintain effective internal control over financial reporting or disclosure controls and procedures; economic and political stability in the United States and risks associated with the international markets where we operate; our ability to effectively develop and maintain strategic alliances and joint ventures; our ability to timely develop new services and the market’s willingness to adopt our new services; our ability to manage and expand our operations and keep up with rapidly changing technologies; our ability to acquire businesses, successfully secure financing for our acquisitions, timely consummate our acquisitions, successfully integrate the operations of our acquisitions, control the costs of integrating our acquisitions and realize the intended benefits of such acquisitions; our ability to protect and enforce our intellectual property, trade secrets and other forms of unpatented intellectual property; our ability to defend our intellectual property from infringement claims by third parties; the ability of our outside service providers and key vendors to fulfill their obligations to us; further consolidation in our end-customer markets; the increased availability of free or inexpensive consumer information; losses against which we do not insure; risks related to our indebtedness, including our ability to make timely payments of principal and interest and our ability to satisfy covenants in the agreements governing our indebtedness; our ability to maintain our liquidity; our dividend payments and dividend rate; share repurchase plans; our reliance on key management personnel; changes in tax laws or adverse outcomes resulting from examination of our tax returns; and other one-time events and other factors that can be found in our Annual Report on Form 10-K for the year ended December 31, 2024, and any subsequent Quarterly Report on Form 10-Q or Current Report on Form 8-K, which are filed with the Securities and Exchange Commission and are available on TransUnion’s website (www.transunion.com/tru) and on the Securities and Exchange Commission’s website (www.sec.gov). TransUnion undertakes no obligation to publicly release the result of any revisions to these forward-looking statements to reflect the impact of events or circumstances that may arise after the date of this presentation. This investor presentation includes certain non-GAAP measures that are more fully described in the appendices to the presentation. Exhibit 99.1, “Press release of TransUnion dated July 24, 2025, announcing results for the quarter ended June 30, 2025,” under the heading ‘Non-GAAP Financial Measures,’” furnished to the Securities and Exchange Commission on July 24, 2025. These financial measures should be reviewed in conjunction with the relevant GAAP financial measures and are not presented as alternative measures of GAAP. Other companies in our industry may define or calculate these measures differently than we do, limiting their usefulness as comparative measures. Because of these limitations, these non-GAAP financial measures should not be considered in isolation or as substitutes for performance measures calculated in accordance with GAAP. Reconciliations of these non-GAAP financial measures to their most directly comparable GAAP financial measures for each of the periods included in this presentation are included in the Appendices at the back of this investor presentation.
3@ Copyright 2025 TransUnion, its subsidiaries and/or affiliates. All Rights Reserved. Second quarter highlights and market perspectives1 Strategic priorities and spotlight on Trusted Call Solutions2 Second quarter 2025 financial results3 Third quarter and full-year 2025 guidance4
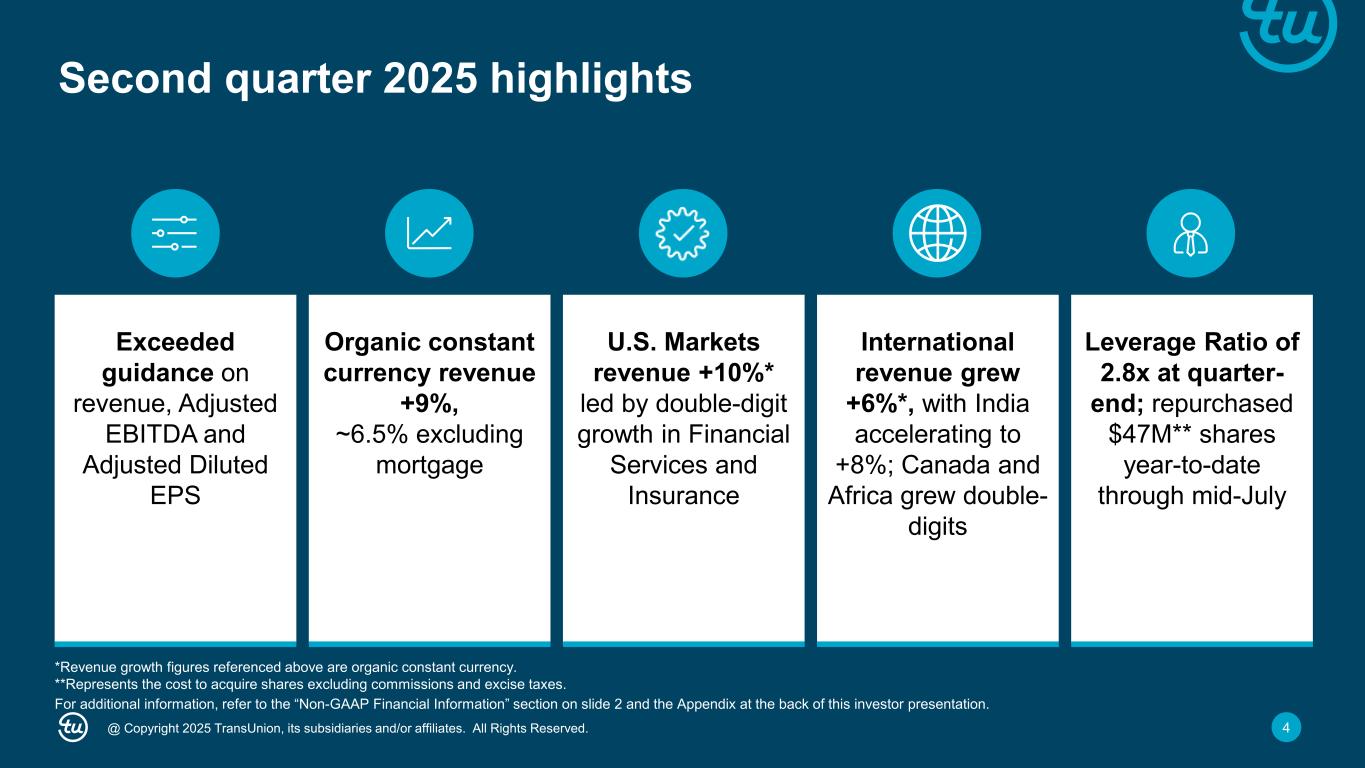
4@ Copyright 2025 TransUnion, its subsidiaries and/or affiliates. All Rights Reserved. *Revenue growth figures referenced above are organic constant currency. **Represents the cost to acquire shares excluding commissions and excise taxes. International revenue grew +6%*, with India accelerating to +8%; Canada and Africa grew double- digits U.S. Markets revenue +10%* led by double-digit growth in Financial Services and Insurance Organic constant currency revenue +9%, ~6.5% excluding mortgage Exceeded guidance on revenue, Adjusted EBITDA and Adjusted Diluted EPS Leverage Ratio of 2.8x at quarter- end; repurchased $47M** shares year-to-date through mid-July For additional information, refer to the “Non-GAAP Financial Information” section on slide 2 and the Appendix at the back of this investor presentation. Second quarter 2025 highlights
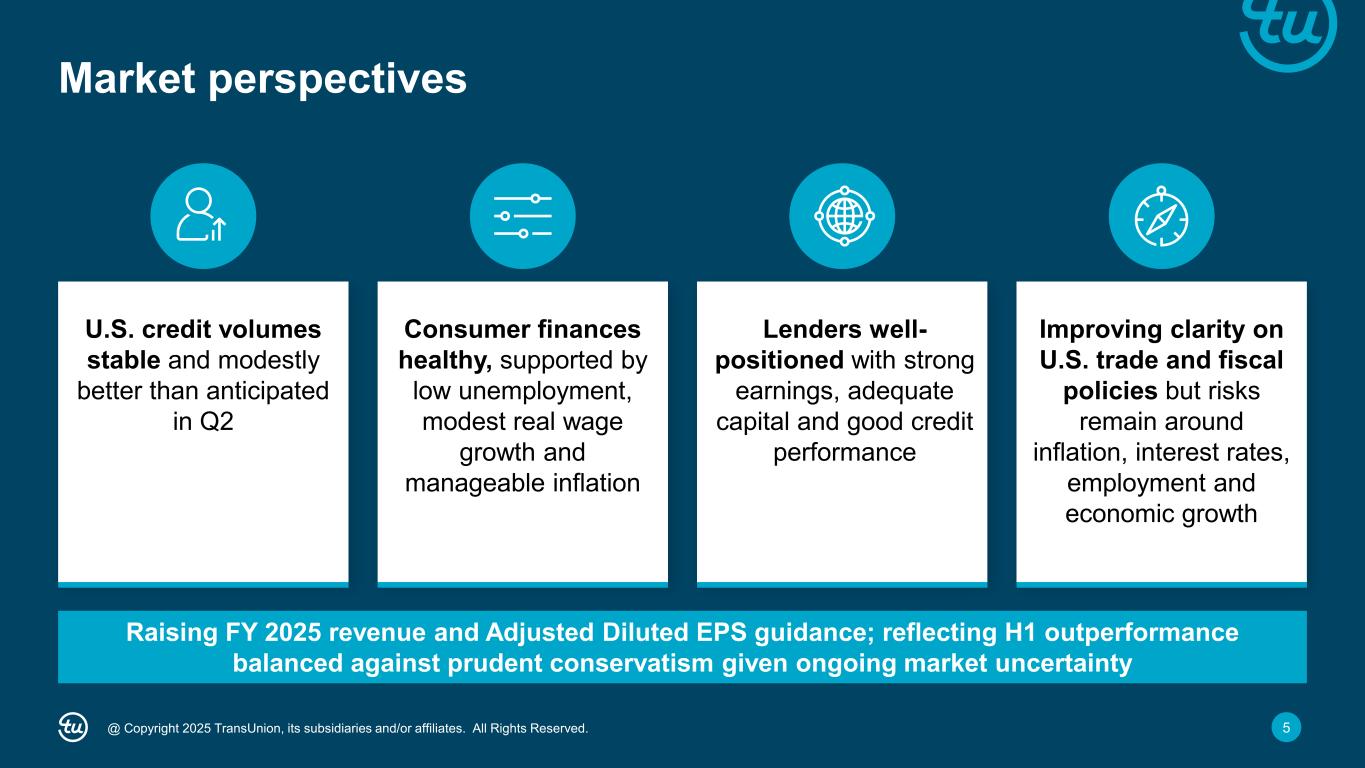
5@ Copyright 2025 TransUnion, its subsidiaries and/or affiliates. All Rights Reserved. U.S. credit volumes stable and modestly better than anticipated in Q2 Improving clarity on U.S. trade and fiscal policies but risks remain around inflation, interest rates, employment and economic growth Lenders well- positioned with strong earnings, adequate capital and good credit performance Consumer finances healthy, supported by low unemployment, modest real wage growth and manageable inflation Raising FY 2025 revenue and Adjusted Diluted EPS guidance; reflecting H1 outperformance balanced against prudent conservatism given ongoing market uncertainty Market perspectives

6@ Copyright 2025 TransUnion, its subsidiaries and/or affiliates. All Rights Reserved. Celebrating 25th anniversary of partnering to shape India’s financial ecosystem Credit Conference: Hosted 2,500+ clients, 100+ CEOs – Presentations from CEOs, industry veterans and RBI Deputy Governor – 10 thematic sessions focused on lending, insurance, consumer experience Launched 6 products and 4 thought-leadership reports – Enhanced versions of our flagship scores and ranks – Reports on key lending segments, some in partnership with leading industry bodies India is a multi-decade growth story for TransUnion – Supportive macroeconomic and regulatory environment – Experiencing a gradual pace of credit volume recovery – as anticipated – Continue to believe the business can deliver 20%+ growth over the medium term
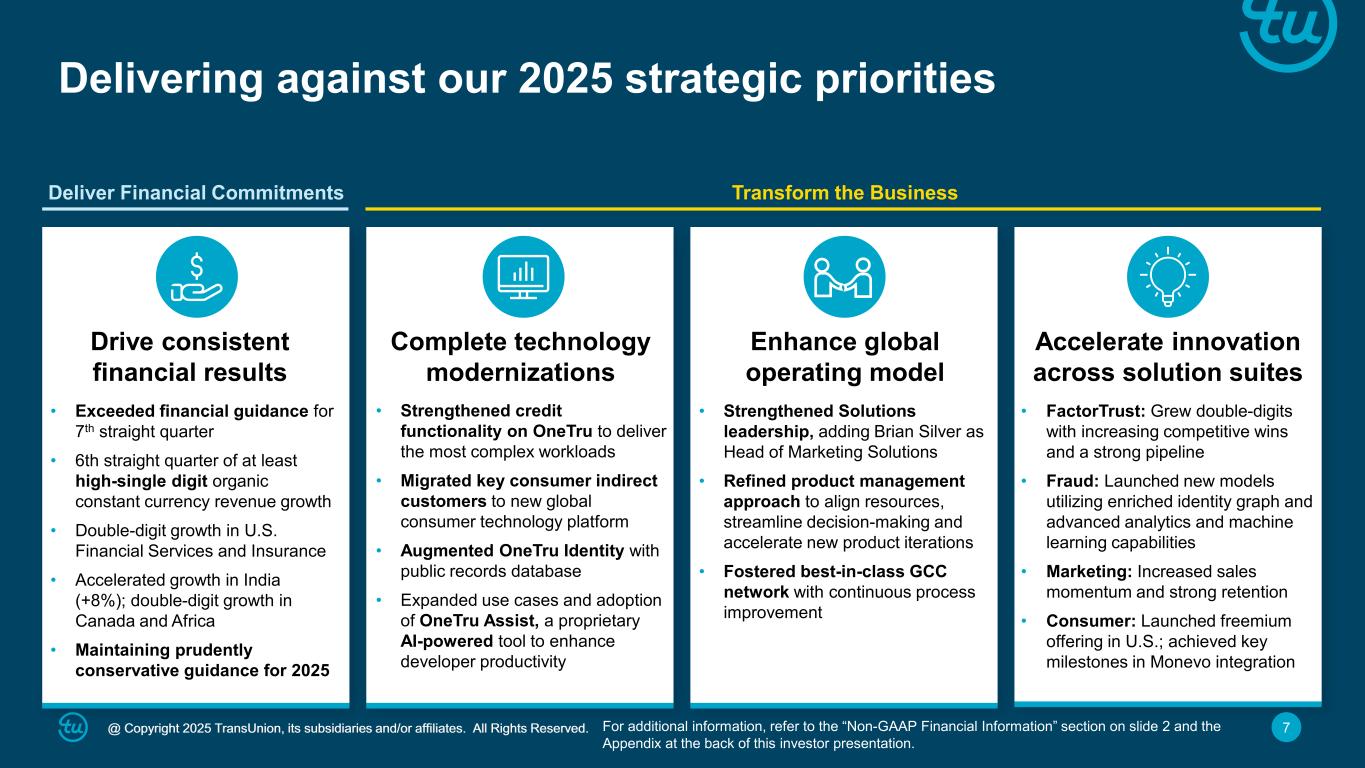
7@ Copyright 2025 TransUnion, its subsidiaries and/or affiliates. All Rights Reserved. Drive consistent financial results Complete technology modernizations Accelerate innovation across solution suites Enhance global operating model Delivering against our 2025 strategic priorities Transform the BusinessDeliver Financial Commitments • Exceeded financial guidance for 7th straight quarter • 6th straight quarter of at least high-single digit organic constant currency revenue growth • Double-digit growth in U.S. Financial Services and Insurance • Accelerated growth in India (+8%); double-digit growth in Canada and Africa • Maintaining prudently conservative guidance for 2025 • FactorTrust: Grew double-digits with increasing competitive wins and a strong pipeline • Fraud: Launched new models utilizing enriched identity graph and advanced analytics and machine learning capabilities • Marketing: Increased sales momentum and strong retention • Consumer: Launched freemium offering in U.S.; achieved key milestones in Monevo integration • Strengthened credit functionality on OneTru to deliver the most complex workloads • Migrated key consumer indirect customers to new global consumer technology platform • Augmented OneTru Identity with public records database • Expanded use cases and adoption of OneTru Assist, a proprietary AI-powered tool to enhance developer productivity • Strengthened Solutions leadership, adding Brian Silver as Head of Marketing Solutions • Refined product management approach to align resources, streamline decision-making and accelerate new product iterations • Fostered best-in-class GCC network with continuous process improvement For additional information, refer to the “Non-GAAP Financial Information” section on slide 2 and the Appendix at the back of this investor presentation.
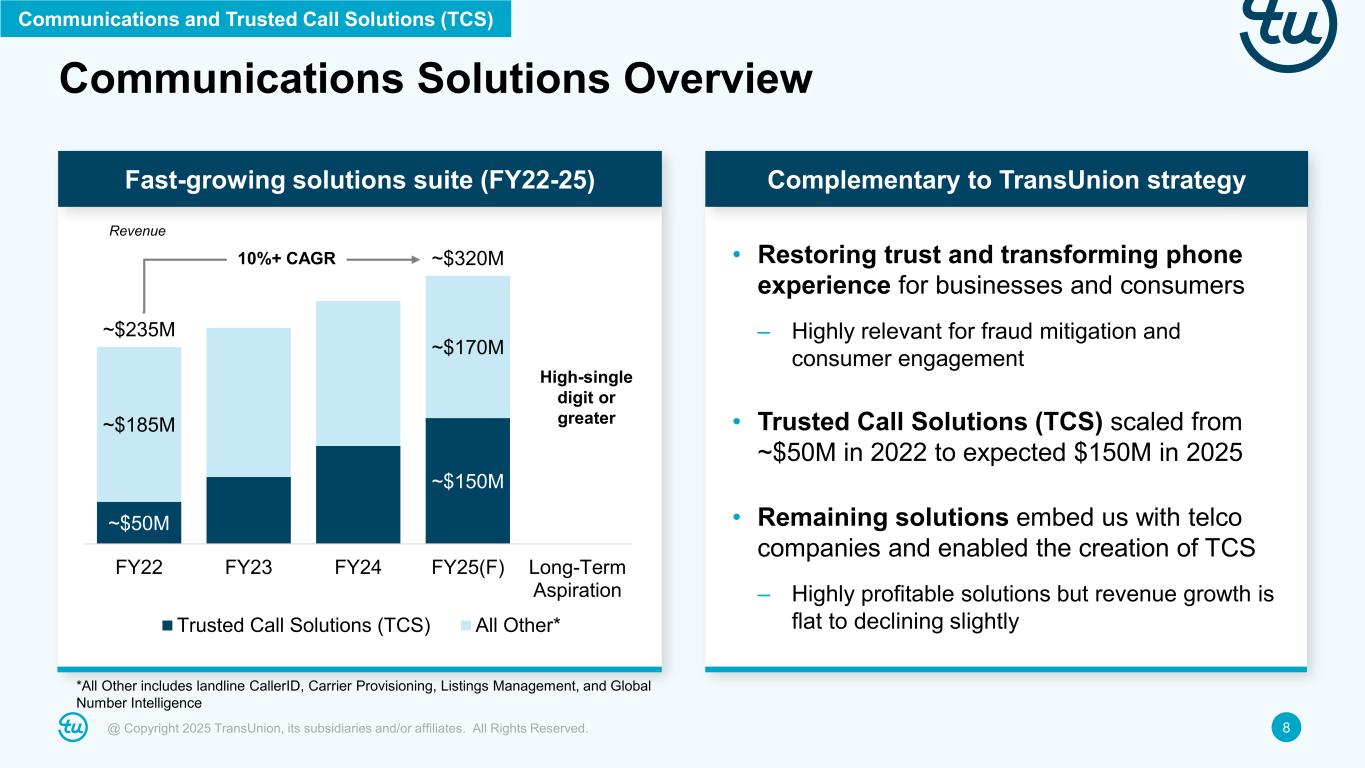
8@ Copyright 2025 TransUnion, its subsidiaries and/or affiliates. All Rights Reserved. ~$50M ~$150M ~$185M ~$170M ~$235M ~$320M FY22 FY23 FY24 FY25(F) Long-Term Aspiration Trusted Call Solutions (TCS) All Other* • Restoring trust and transforming phone experience for businesses and consumers – Highly relevant for fraud mitigation and consumer engagement • Trusted Call Solutions (TCS) scaled from ~$50M in 2022 to expected $150M in 2025 • Remaining solutions embed us with telco companies and enabled the creation of TCS – Highly profitable solutions but revenue growth is flat to declining slightly Communications Solutions Overview Fast-growing solutions suite (FY22-25) Complementary to TransUnion strategy *All Other includes landline CallerID, Carrier Provisioning, Listings Management, and Global Number Intelligence Communications and Trusted Call Solutions (TCS) 10%+ CAGR High-single digit or greater Revenue
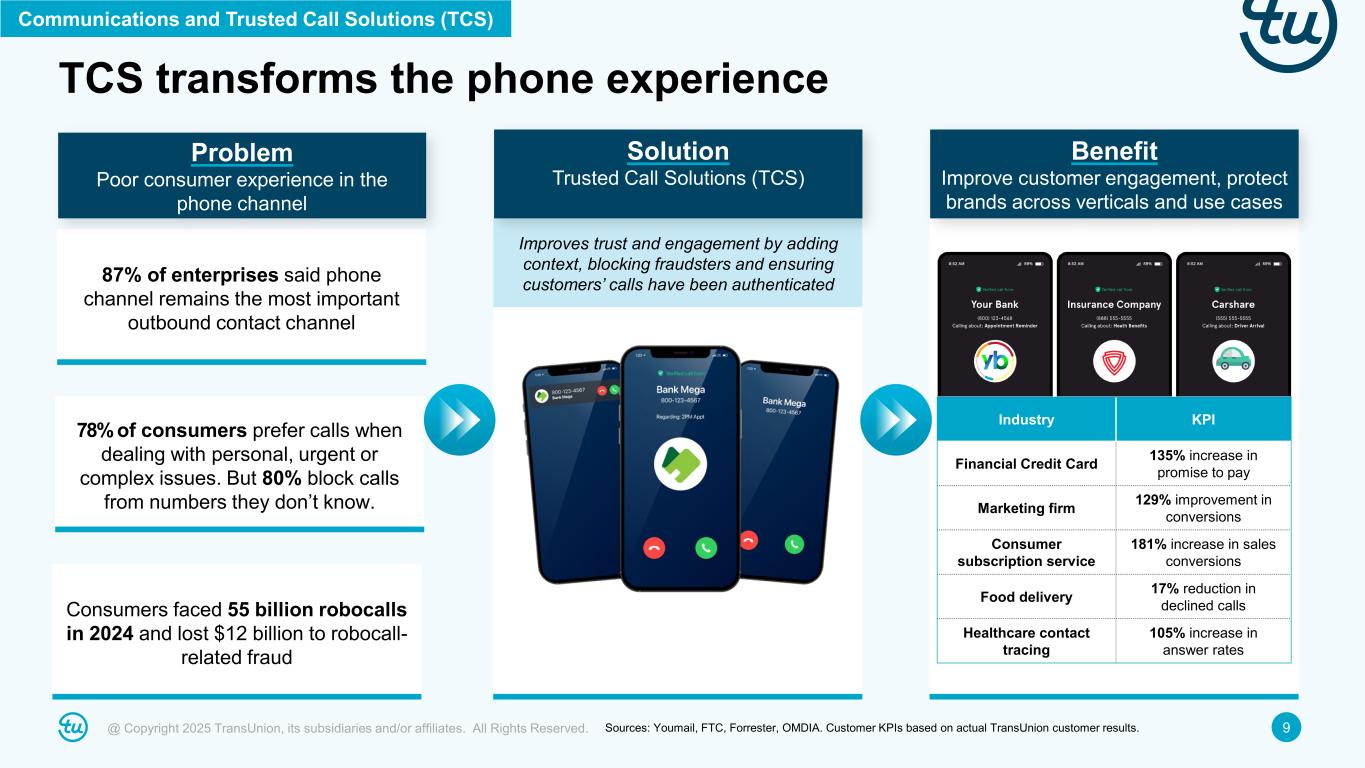
9@ Copyright 2025 TransUnion, its subsidiaries and/or affiliates. All Rights Reserved. TCS transforms the phone experience Solution Trusted Call Solutions (TCS) Improves trust and engagement by adding context, blocking fraudsters and ensuring customers’ calls have been authenticated87% of enterprises said phone channel remains the most important outbound contact channel Problem Poor consumer experience in the phone channel Consumers faced 55 billion robocalls in 2024 and lost $12 billion to robocall- related fraud 78% of consumers prefer calls when dealing with personal, urgent or complex issues. But 80% block calls from numbers they don’t know. Industry KPI Financial Credit Card 135% increase in promise to pay Marketing firm 129% improvement in conversions Consumer subscription service 181% increase in sales conversions Food delivery 17% reduction in declined calls Healthcare contact tracing 105% increase in answer rates Benefit Improve customer engagement, protect brands across verticals and use cases Communications and Trusted Call Solutions (TCS) Sources: Youmail, FTC, Forrester, OMDIA. Customer KPIs based on actual TransUnion customer results.
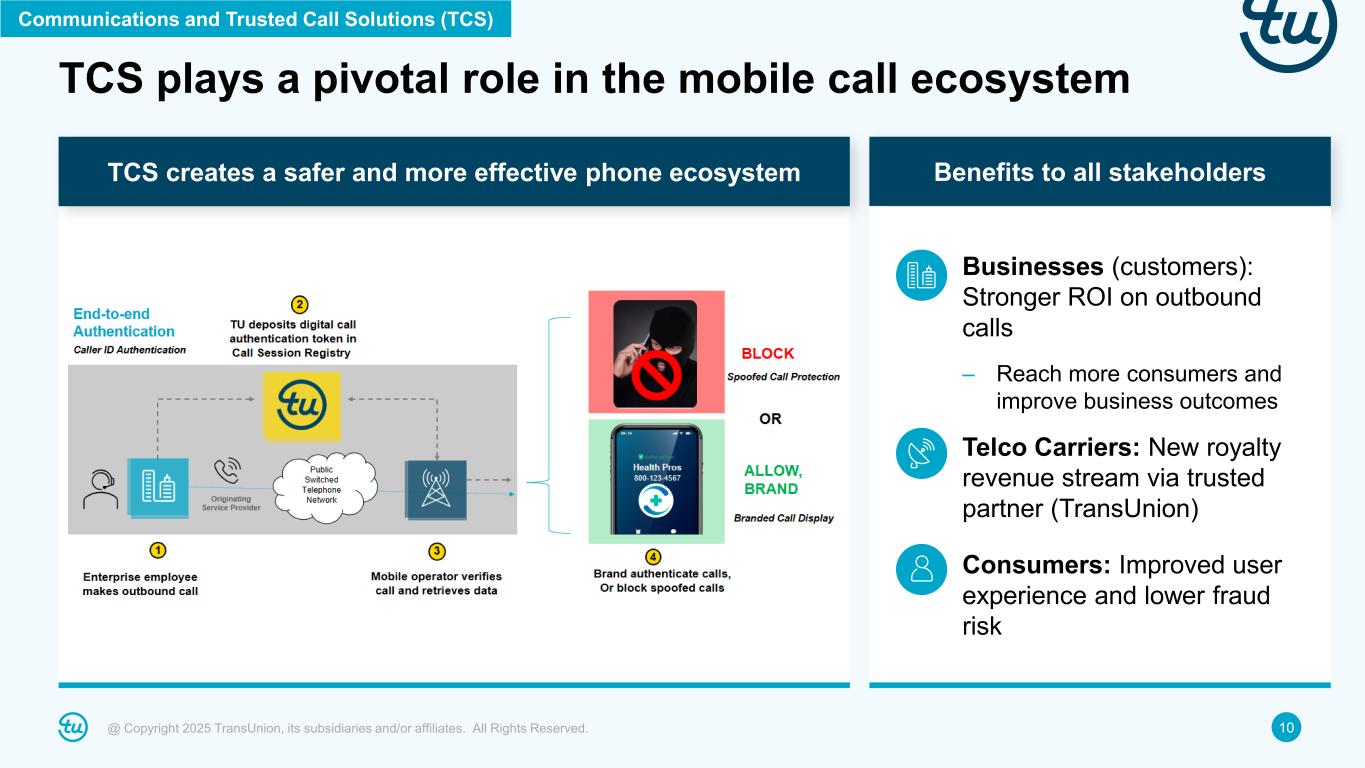
10@ Copyright 2025 TransUnion, its subsidiaries and/or affiliates. All Rights Reserved. TCS plays a pivotal role in the mobile call ecosystem TCS creates a safer and more effective phone ecosystem Benefits to all stakeholders • Businesses (customers): Stronger ROI on outbound calls – Reach more consumers and improve business outcomes • Telco Carriers: New royalty revenue stream via trusted partner (TransUnion) • Consumers: Improved user experience and lower fraud risk Communications and Trusted Call Solutions (TCS)
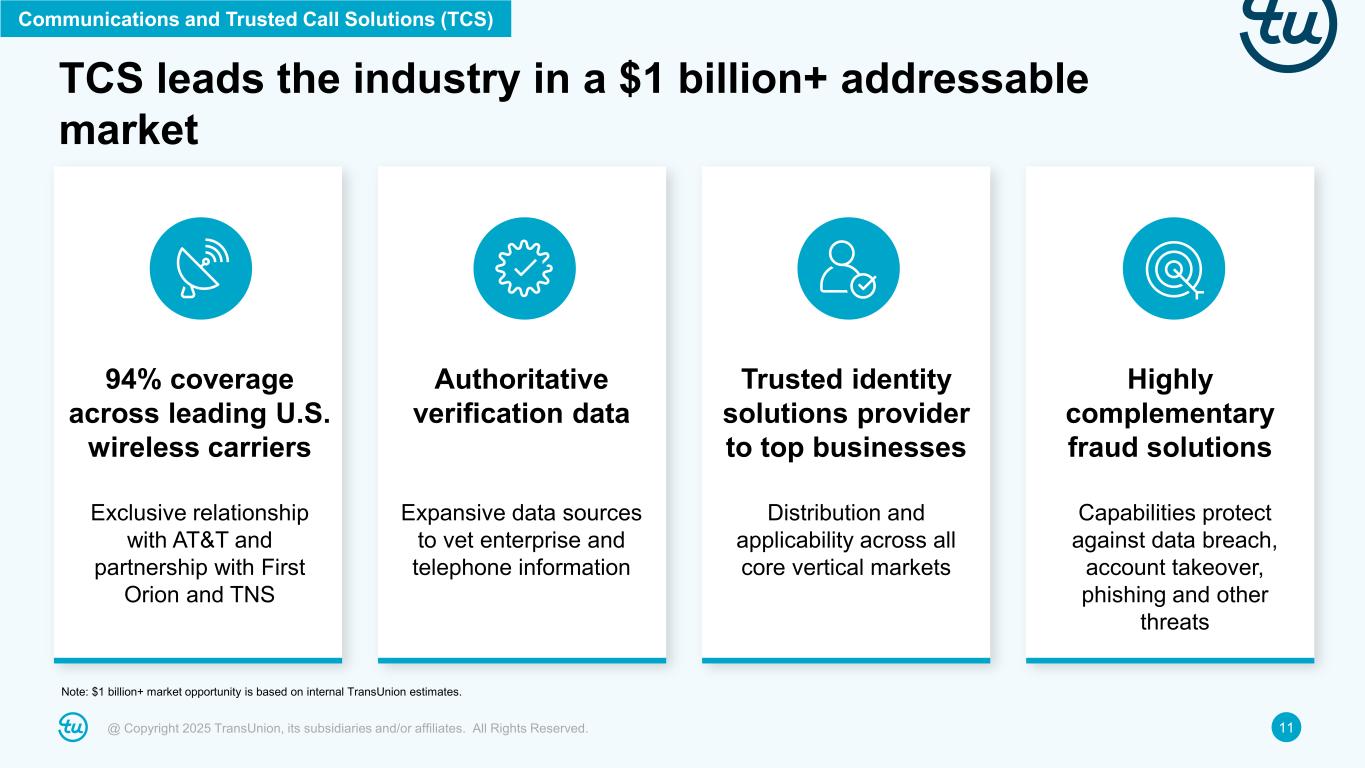
11@ Copyright 2025 TransUnion, its subsidiaries and/or affiliates. All Rights Reserved. 94% coverage across leading U.S. wireless carriers Trusted identity solutions provider to top businesses Highly complementary fraud solutions Exclusive relationship with AT&T and partnership with First Orion and TNS Capabilities protect against data breach, account takeover, phishing and other threats Distribution and applicability across all core vertical markets Authoritative verification data Expansive data sources to vet enterprise and telephone information Communications and Trusted Call Solutions (TCS) TCS leads the industry in a $1 billion+ addressable market Note: $1 billion+ market opportunity is based on internal TransUnion estimates.
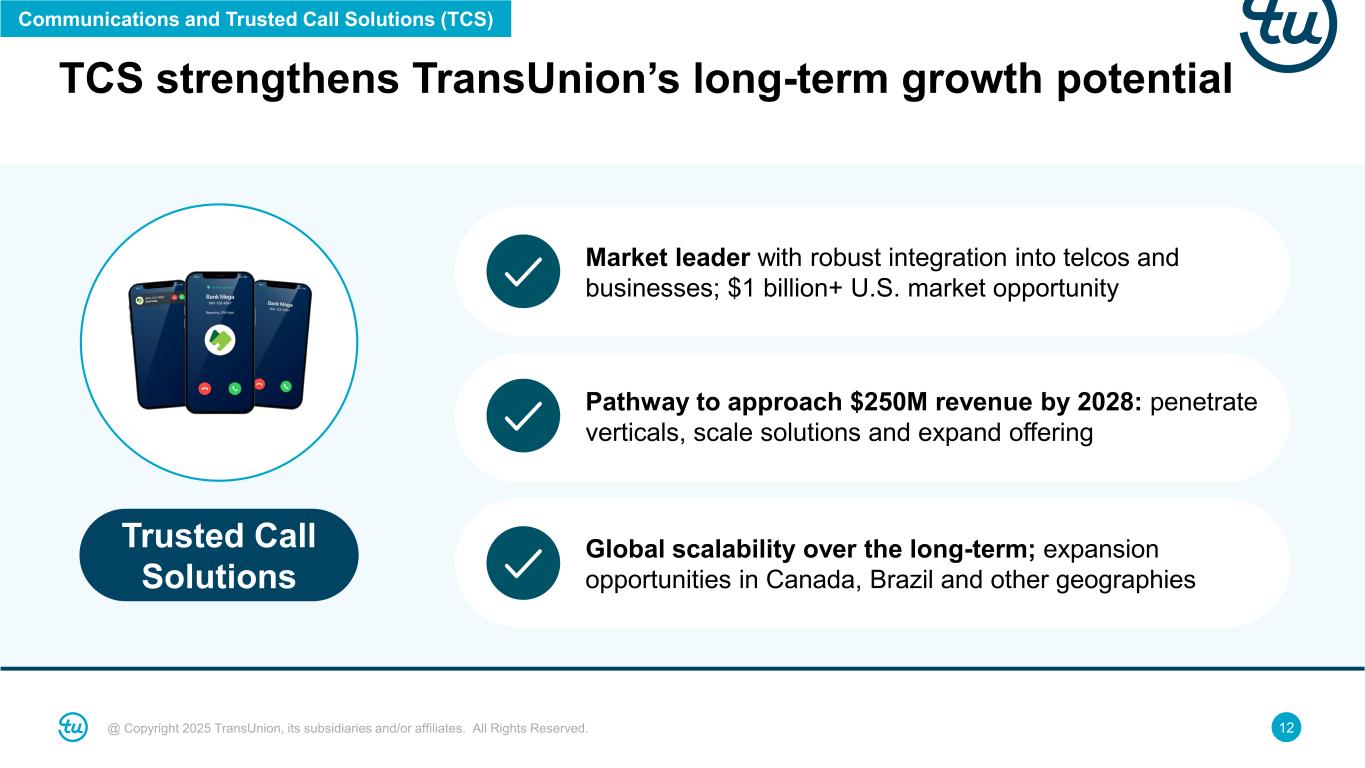
12@ Copyright 2025 TransUnion, its subsidiaries and/or affiliates. All Rights Reserved. TCS strengthens TransUnion’s long-term growth potential Trusted Call Solutions Market leader with robust integration into telcos and businesses; $1 billion+ U.S. market opportunity Pathway to approach $250M revenue by 2028: penetrate verticals, scale solutions and expand offering Global scalability over the long-term; expansion opportunities in Canada, Brazil and other geographies Communications and Trusted Call Solutions (TCS)
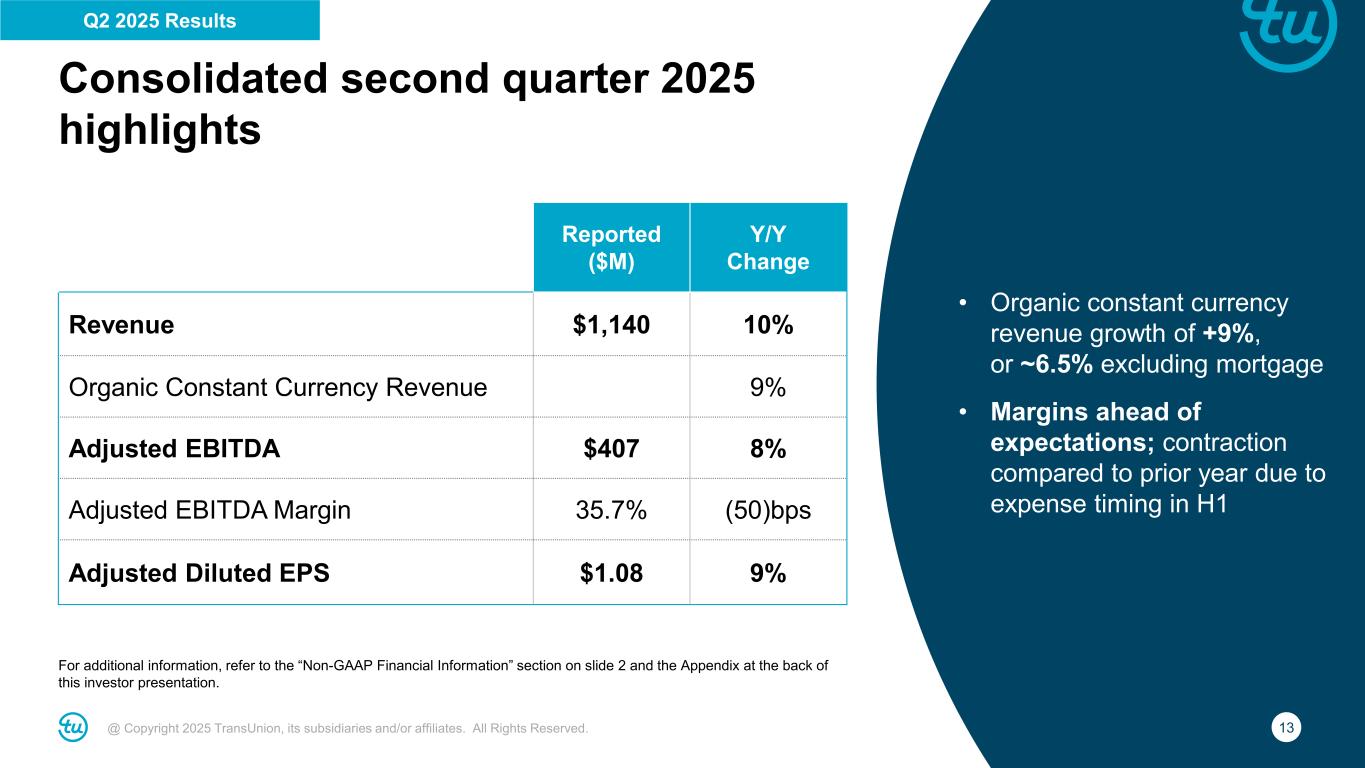
13@ Copyright 2025 TransUnion, its subsidiaries and/or affiliates. All Rights Reserved. Consolidated second quarter 2025 highlights For additional information, refer to the “Non-GAAP Financial Information” section on slide 2 and the Appendix at the back of this investor presentation. Reported ($M) Y/Y Change Revenue $1,140 10% Organic Constant Currency Revenue 9% Adjusted EBITDA $407 8% Adjusted EBITDA Margin 35.7% (50)bps Adjusted Diluted EPS $1.08 9% • Organic constant currency revenue growth of +9%, or ~6.5% excluding mortgage • Margins ahead of expectations; contraction compared to prior year due to expense timing in H1 Q2 2025 Results
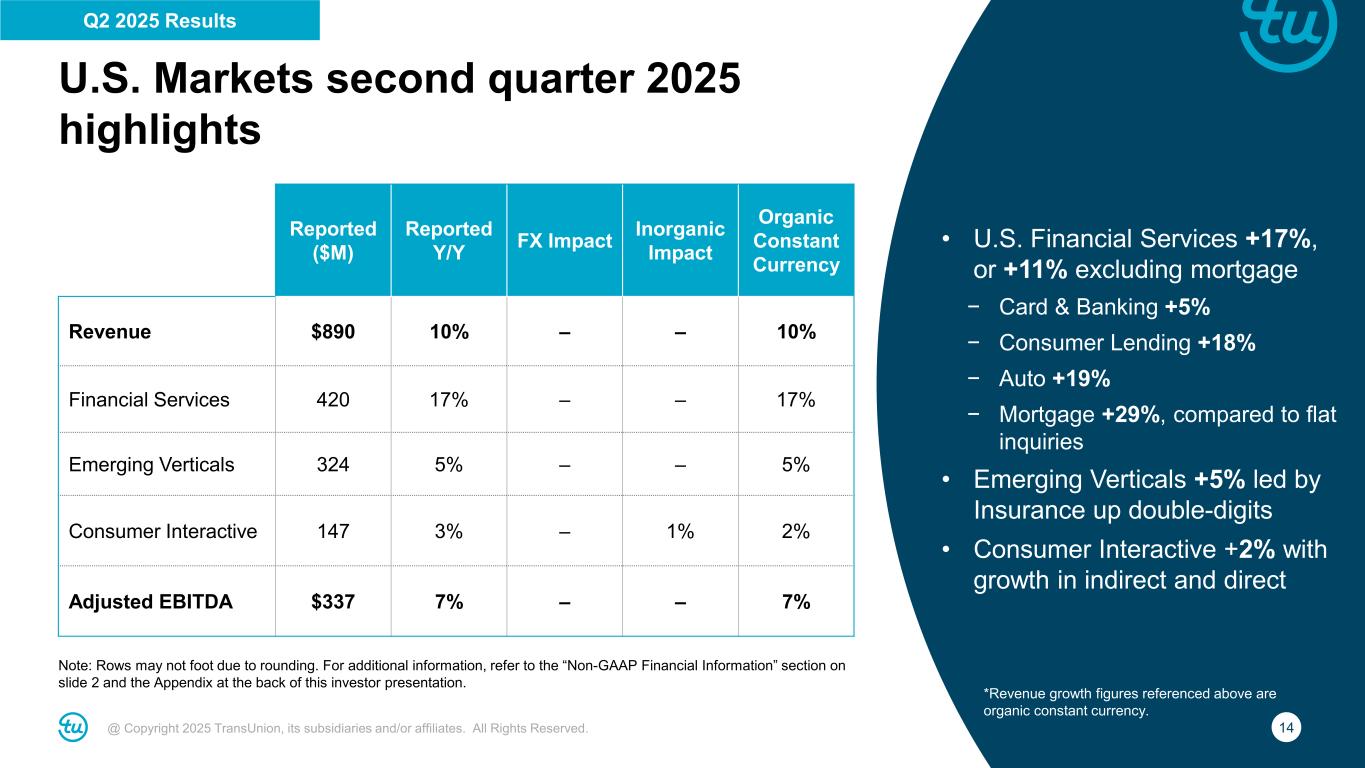
14@ Copyright 2025 TransUnion, its subsidiaries and/or affiliates. All Rights Reserved. U.S. Markets second quarter 2025 highlights Note: Rows may not foot due to rounding. For additional information, refer to the “Non-GAAP Financial Information” section on slide 2 and the Appendix at the back of this investor presentation. • U.S. Financial Services +17%, or +11% excluding mortgage − Card & Banking +5% − Consumer Lending +18% − Auto +19% − Mortgage +29%, compared to flat inquiries • Emerging Verticals +5% led by Insurance up double-digits • Consumer Interactive +2% with growth in indirect and direct Reported ($M) Reported Y/Y FX Impact Inorganic Impact Organic Constant Currency Revenue $890 10% – – 10% Financial Services 420 17% – – 17% Emerging Verticals 324 5% – – 5% Consumer Interactive 147 3% – 1% 2% Adjusted EBITDA $337 7% – – 7% Q2 2025 Results *Revenue growth figures referenced above are organic constant currency.
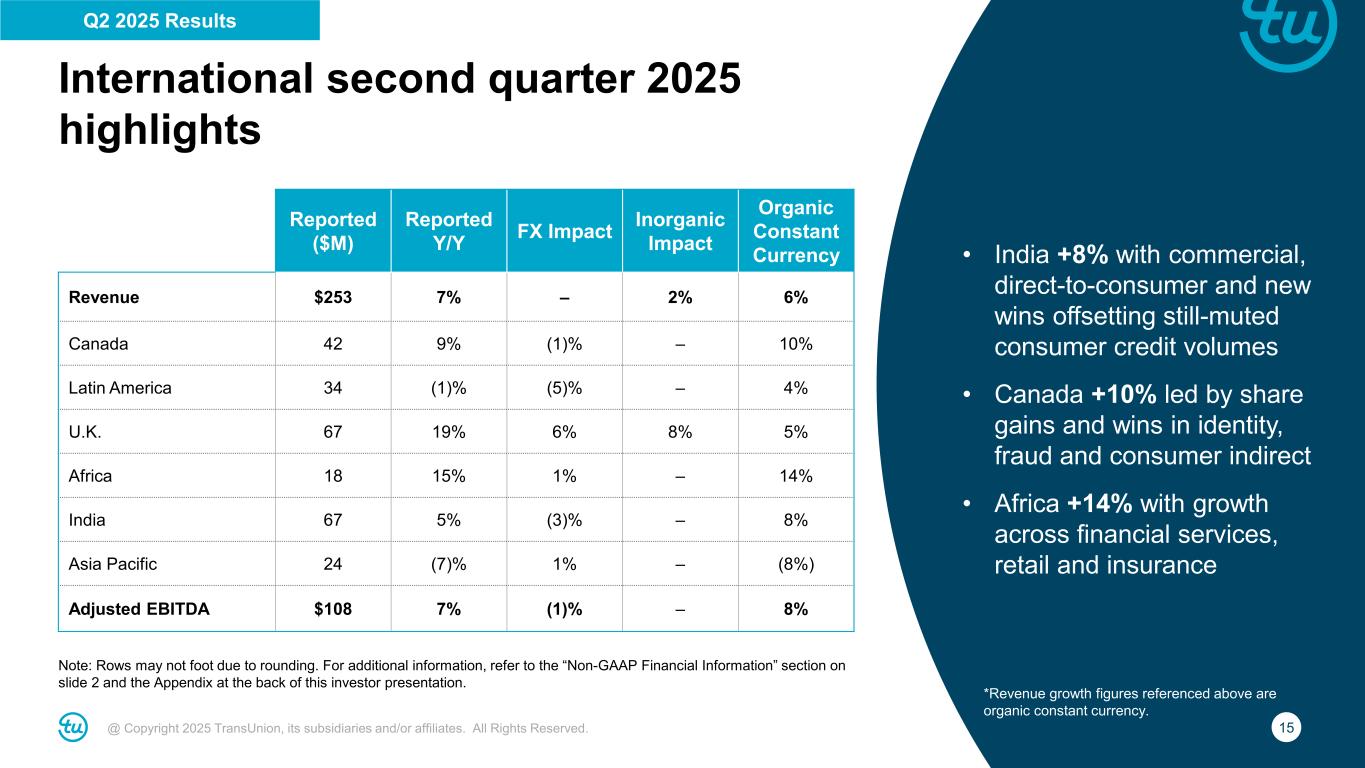
15@ Copyright 2025 TransUnion, its subsidiaries and/or affiliates. All Rights Reserved. International second quarter 2025 highlights Note: Rows may not foot due to rounding. For additional information, refer to the “Non-GAAP Financial Information” section on slide 2 and the Appendix at the back of this investor presentation. • India +8% with commercial, direct-to-consumer and new wins offsetting still-muted consumer credit volumes • Canada +10% led by share gains and wins in identity, fraud and consumer indirect • Africa +14% with growth across financial services, retail and insurance Reported ($M) Reported Y/Y FX Impact Inorganic Impact Organic Constant Currency Revenue $253 7% – 2% 6% Canada 42 9% (1)% – 10% Latin America 34 (1)% (5)% – 4% U.K. 67 19% 6% 8% 5% Africa 18 15% 1% – 14% India 67 5% (3)% – 8% Asia Pacific 24 (7)% 1% – (8%) Adjusted EBITDA $108 7% (1)% – 8% *Revenue growth figures referenced above are organic constant currency. Q2 2025 Results
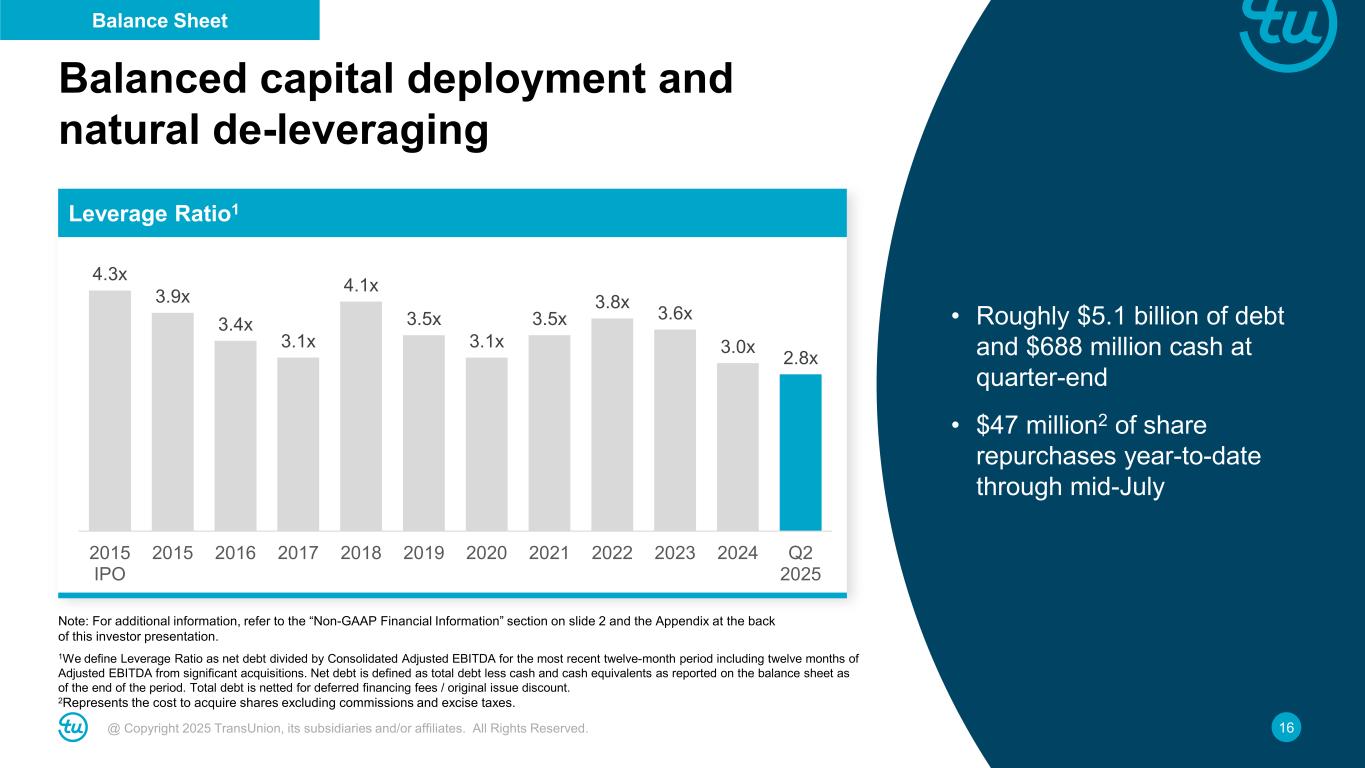
16@ Copyright 2025 TransUnion, its subsidiaries and/or affiliates. All Rights Reserved. 1We define Leverage Ratio as net debt divided by Consolidated Adjusted EBITDA for the most recent twelve-month period including twelve months of Adjusted EBITDA from significant acquisitions. Net debt is defined as total debt less cash and cash equivalents as reported on the balance sheet as of the end of the period. Total debt is netted for deferred financing fees / original issue discount. 2Represents the cost to acquire shares excluding commissions and excise taxes. Note: For additional information, refer to the “Non-GAAP Financial Information” section on slide 2 and the Appendix at the back of this investor presentation. Balanced capital deployment and natural de-leveraging Leverage Ratio1 4.3x 3.9x 3.4x 3.1x 4.1x 3.5x 3.1x 3.5x 3.8x 3.6x 3.0x 2.8x 2015 IPO 2015 2016 2017 2018 2019 2020 2021 2022 2023 2024 Q2 2025 Balance Sheet • Roughly $5.1 billion of debt and $688 million cash at quarter-end • $47 million2 of share repurchases year-to-date through mid-July
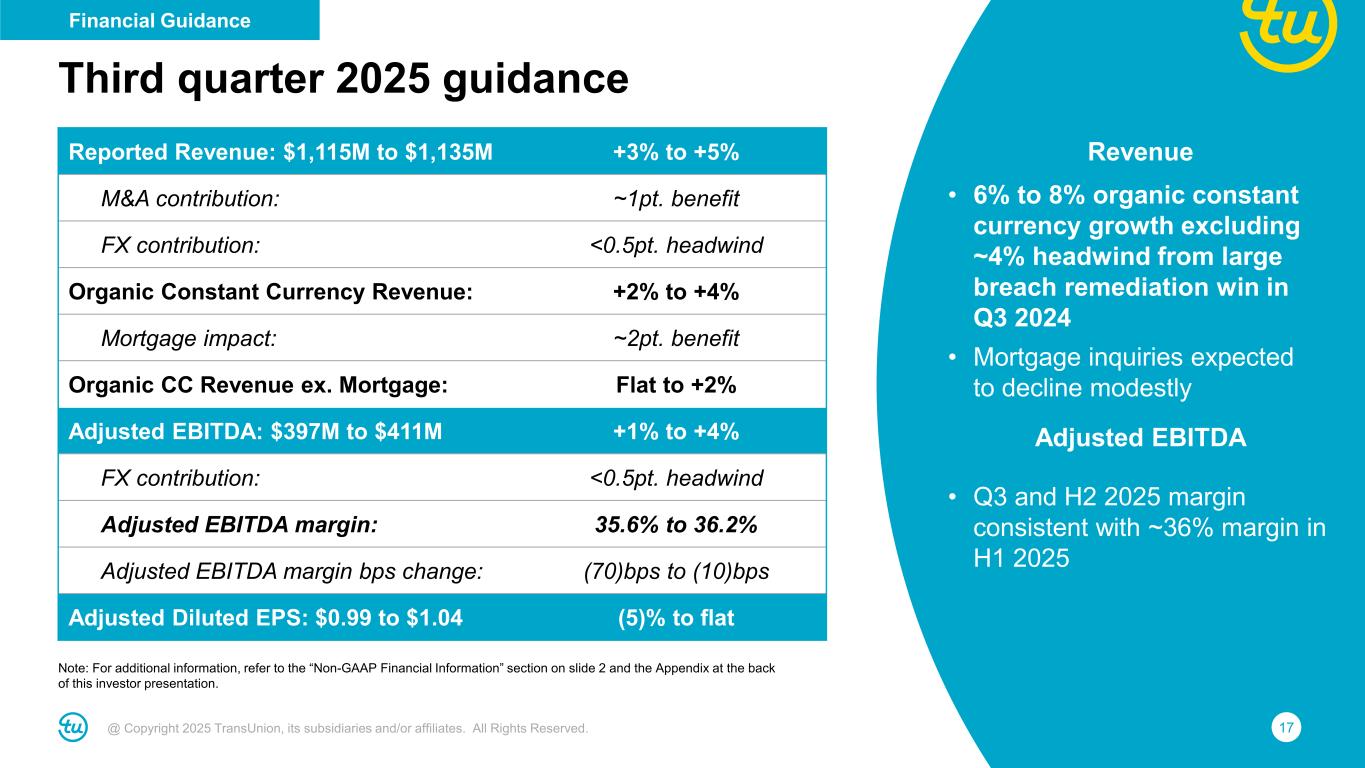
17@ Copyright 2025 TransUnion, its subsidiaries and/or affiliates. All Rights Reserved. Reported Revenue: $1,115M to $1,135M +3% to +5% M&A contribution: ~1pt. benefit FX contribution: <0.5pt. headwind Organic Constant Currency Revenue: +2% to +4% Mortgage impact: ~2pt. benefit Organic CC Revenue ex. Mortgage: Flat to +2% Adjusted EBITDA: $397M to $411M +1% to +4% FX contribution: <0.5pt. headwind Adjusted EBITDA margin: 35.6% to 36.2% Adjusted EBITDA margin bps change: (70)bps to (10)bps Adjusted Diluted EPS: $0.99 to $1.04 (5)% to flat Third quarter 2025 guidance Note: For additional information, refer to the “Non-GAAP Financial Information” section on slide 2 and the Appendix at the back of this investor presentation. Financial Guidance Revenue • 6% to 8% organic constant currency growth excluding ~4% headwind from large breach remediation win in Q3 2024 • Mortgage inquiries expected to decline modestly Adjusted EBITDA • Q3 and H2 2025 margin consistent with ~36% margin in H1 2025
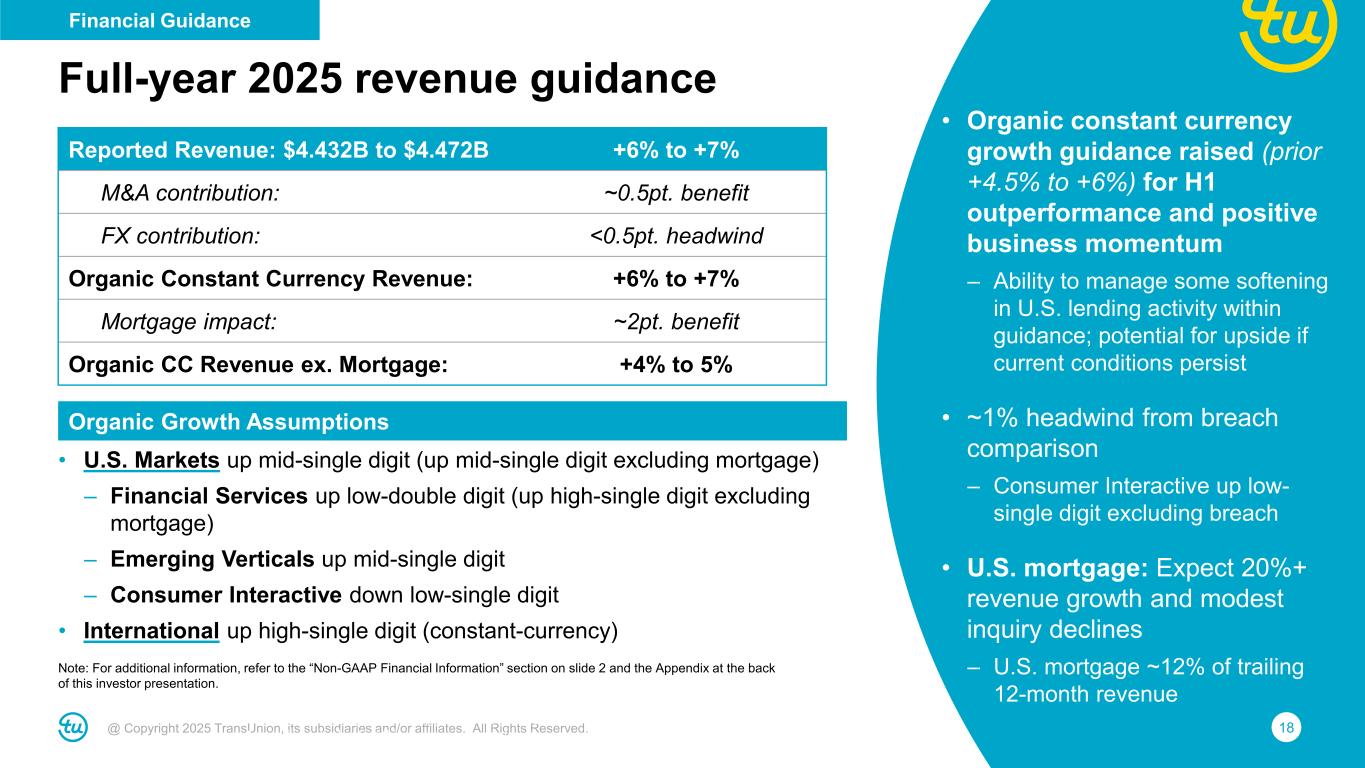
18@ Copyright 2025 TransUnion, its subsidiaries and/or affiliates. All Rights Reserved. • Organic constant currency growth guidance raised (prior +4.5% to +6%) for H1 outperformance and positive business momentum – Ability to manage some softening in U.S. lending activity within guidance; potential for upside if current conditions persist • ~1% headwind from breach comparison – Consumer Interactive up low- single digit excluding breach • U.S. mortgage: Expect 20%+ revenue growth and modest inquiry declines – U.S. mortgage ~12% of trailing 12-month revenue Note: For additional information, refer to the “Non-GAAP Financial Information” section on slide 2 and the Appendix at the back of this investor presentation. Full-year 2025 revenue guidance Reported Revenue: $4.432B to $4.472B +6% to +7% M&A contribution: ~0.5pt. benefit FX contribution: <0.5pt. headwind Organic Constant Currency Revenue: +6% to +7% Mortgage impact: ~2pt. benefit Organic CC Revenue ex. Mortgage: +4% to 5% Organic Growth Assumptions • U.S. Markets up mid-single digit (up mid-single digit excluding mortgage) – Financial Services up low-double digit (up high-single digit excluding mortgage) – Emerging Verticals up mid-single digit – Consumer Interactive down low-single digit • International up high-single digit (constant-currency) Note: For additional information, refer to the “Non-GAAP Financial Information” section on slide 2 and the Appendix at the back of this investor presentation. Financial Guidance
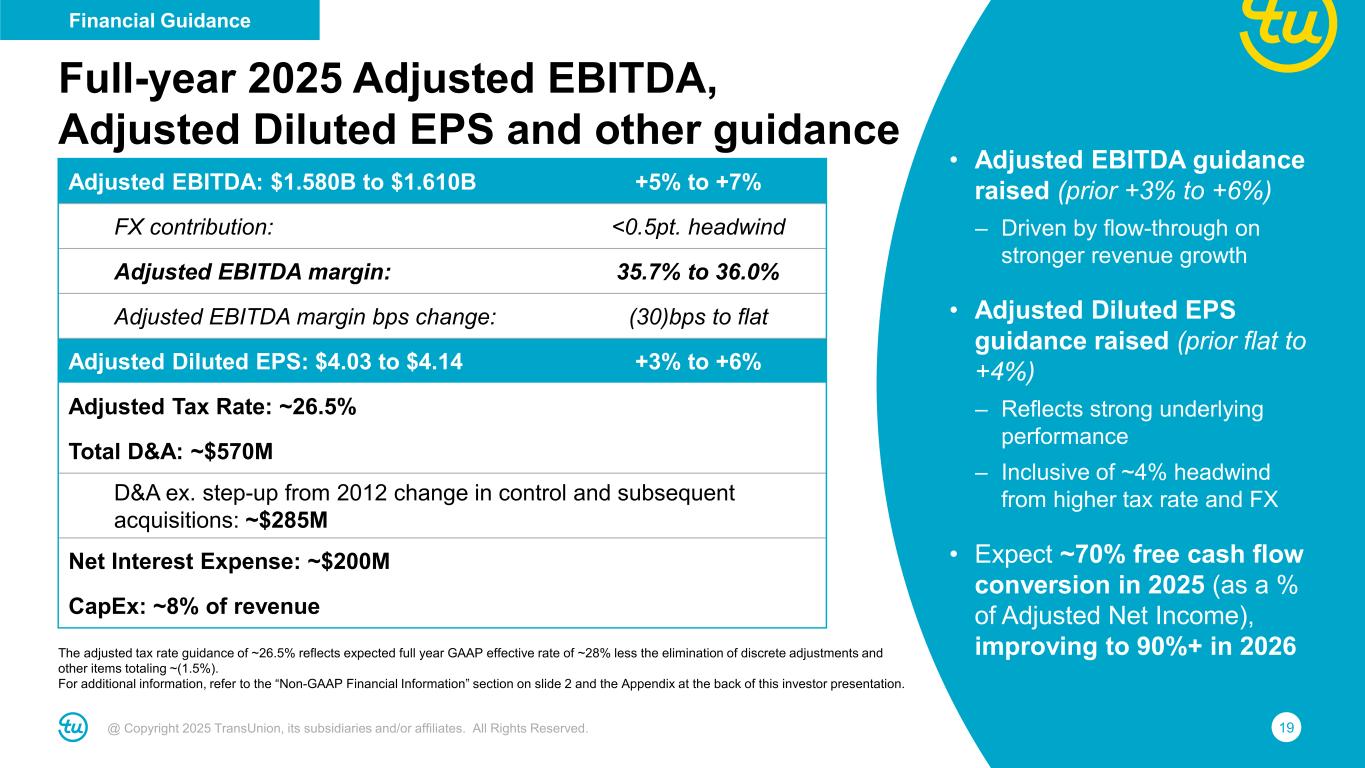
19@ Copyright 2025 TransUnion, its subsidiaries and/or affiliates. All Rights Reserved. The adjusted tax rate guidance of ~26.5% reflects expected full year GAAP effective rate of ~28% less the elimination of discrete adjustments and other items totaling ~(1.5%). For additional information, refer to the “Non-GAAP Financial Information” section on slide 2 and the Appendix at the back of this investor presentation. Full-year 2025 Adjusted EBITDA, Adjusted Diluted EPS and other guidance Adjusted EBITDA: $1.580B to $1.610B +5% to +7% FX contribution: <0.5pt. headwind Adjusted EBITDA margin: 35.7% to 36.0% Adjusted EBITDA margin bps change: (30)bps to flat Adjusted Diluted EPS: $4.03 to $4.14 +3% to +6% Adjusted Tax Rate: ~26.5% Total D&A: ~$570M D&A ex. step-up from 2012 change in control and subsequent acquisitions: ~$285M Net Interest Expense: ~$200M CapEx: ~8% of revenue Financial Guidance • Adjusted EBITDA guidance raised (prior +3% to +6%) – Driven by flow-through on stronger revenue growth • Adjusted Diluted EPS guidance raised (prior flat to +4%) – Reflects strong underlying performance – Inclusive of ~4% headwind from higher tax rate and FX • Expect ~70% free cash flow conversion in 2025 (as a % of Adjusted Net Income), improving to 90%+ in 2026
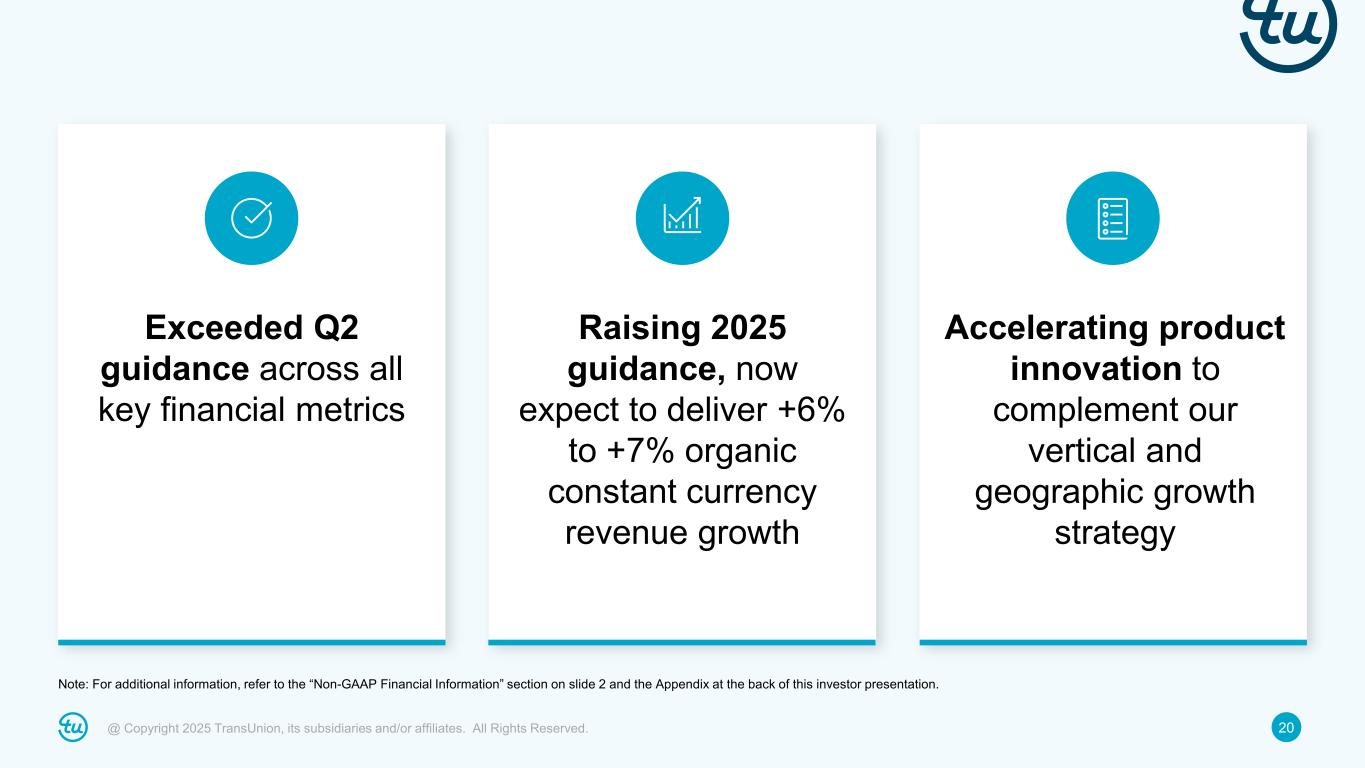
20@ Copyright 2025 TransUnion, its subsidiaries and/or affiliates. All Rights Reserved. Raising 2025 guidance, now expect to deliver +6% to +7% organic constant currency revenue growth Exceeded Q2 guidance across all key financial metrics Accelerating product innovation to complement our vertical and geographic growth strategy Note: For additional information, refer to the “Non-GAAP Financial Information” section on slide 2 and the Appendix at the back of this investor presentation.

21@ Copyright 2025 TransUnion, its subsidiaries and/or affiliates. All Rights Reserved. Q&A
22@ Copyright 2025 TransUnion, its subsidiaries and/or affiliates. All Rights Reserved. Appendices and Non-GAAP Reconciliations
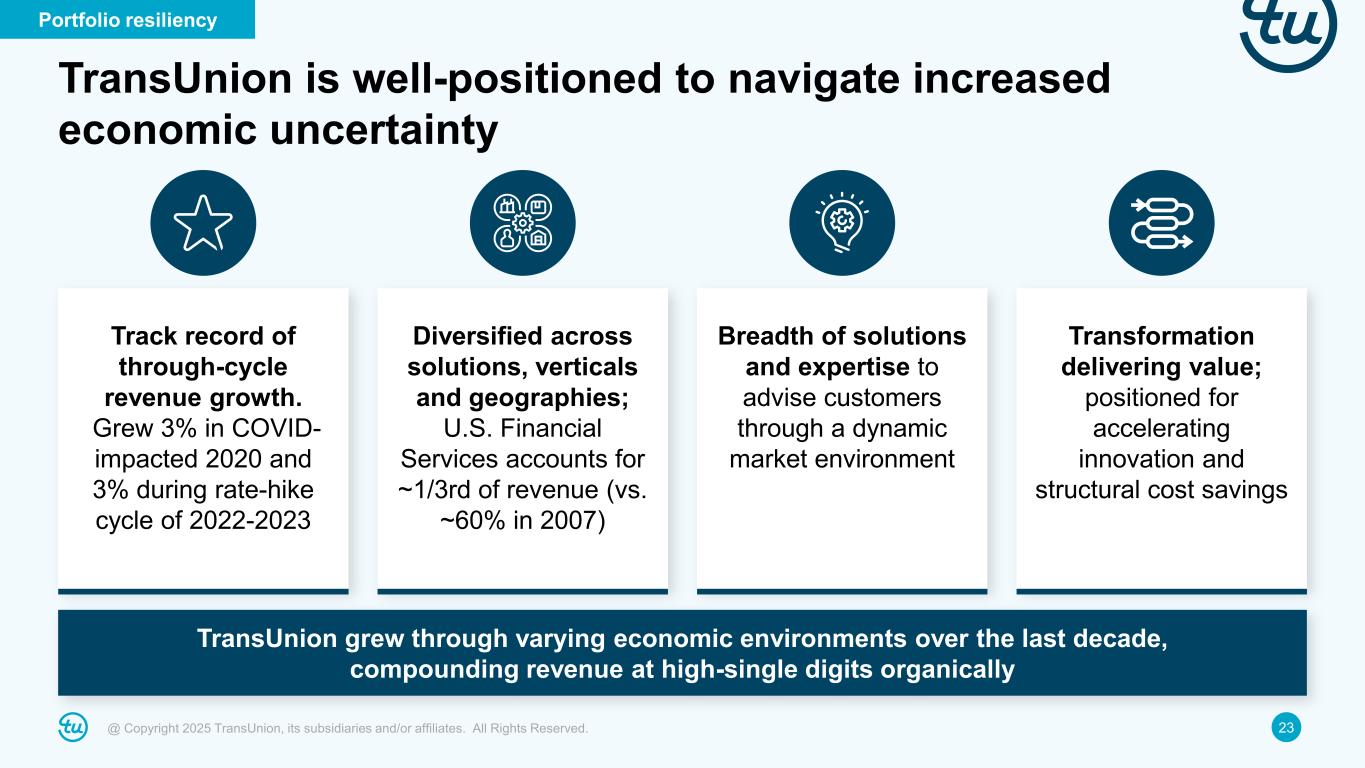
23@ Copyright 2025 TransUnion, its subsidiaries and/or affiliates. All Rights Reserved. TransUnion is well-positioned to navigate increased economic uncertainty Track record of through-cycle revenue growth. Grew 3% in COVID- impacted 2020 and 3% during rate-hike cycle of 2022-2023 Transformation delivering value; positioned for accelerating innovation and structural cost savings Breadth of solutions and expertise to advise customers through a dynamic market environment Diversified across solutions, verticals and geographies; U.S. Financial Services accounts for ~1/3rd of revenue (vs. ~60% in 2007) Portfolio resiliency TransUnion grew through varying economic environments over the last decade, compounding revenue at high-single digits organically
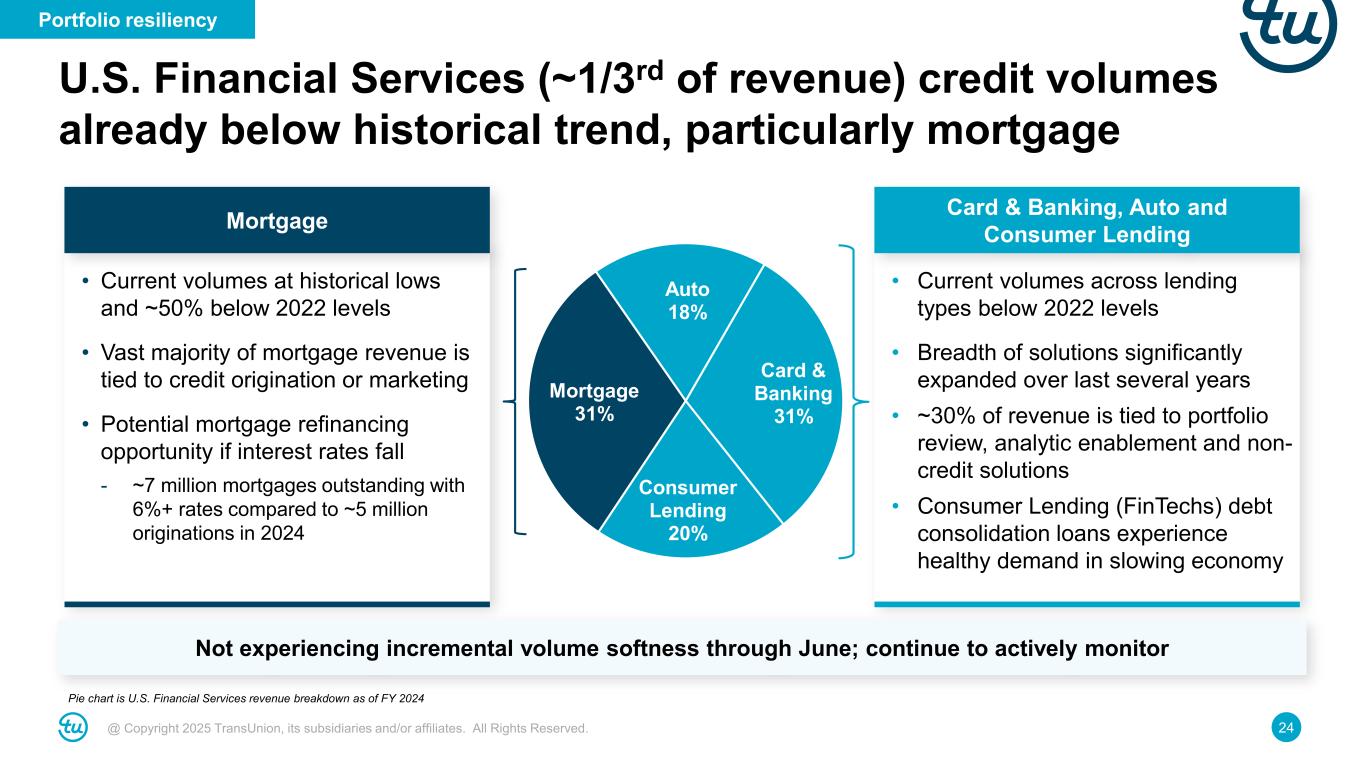
24@ Copyright 2025 TransUnion, its subsidiaries and/or affiliates. All Rights Reserved. U.S. Financial Services (~1/3rd of revenue) credit volumes already below historical trend, particularly mortgage Portfolio resiliency Card & Banking 31% Consumer Lending 20% Mortgage 31% Auto 18% Not experiencing incremental volume softness through June; continue to actively monitor • Current volumes at historical lows and ~50% below 2022 levels • Vast majority of mortgage revenue is tied to credit origination or marketing • Potential mortgage refinancing opportunity if interest rates fall - ~7 million mortgages outstanding with 6%+ rates compared to ~5 million originations in 2024 Mortgage • Current volumes across lending types below 2022 levels • Breadth of solutions significantly expanded over last several years • ~30% of revenue is tied to portfolio review, analytic enablement and non- credit solutions • Consumer Lending (FinTechs) debt consolidation loans experience healthy demand in slowing economy Card & Banking, Auto and Consumer Lending Pie chart is U.S. Financial Services revenue breakdown as of FY 2024
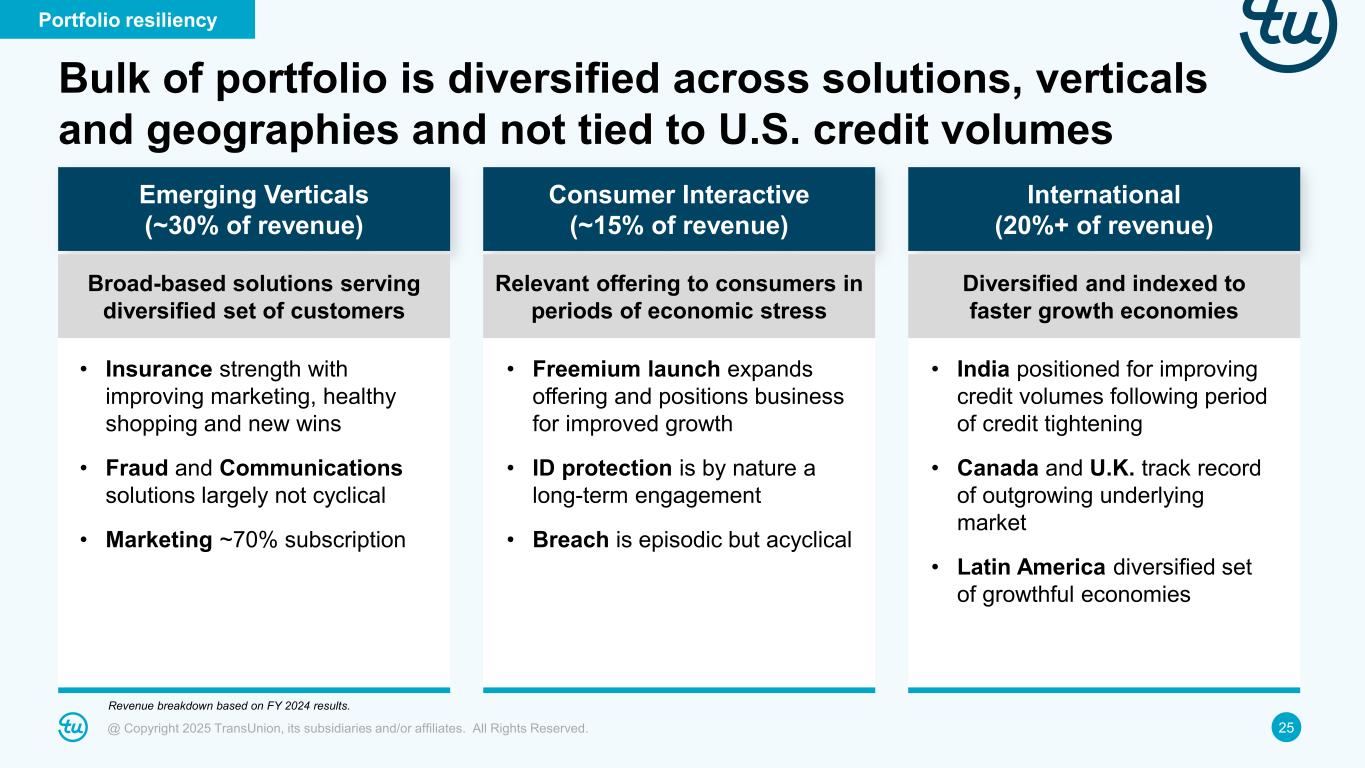
25@ Copyright 2025 TransUnion, its subsidiaries and/or affiliates. All Rights Reserved. Bulk of portfolio is diversified across solutions, verticals and geographies and not tied to U.S. credit volumes Emerging Verticals (~30% of revenue) • Insurance strength with improving marketing, healthy shopping and new wins • Fraud and Communications solutions largely not cyclical • Marketing ~70% subscription Consumer Interactive (~15% of revenue) • Freemium launch expands offering and positions business for improved growth • ID protection is by nature a long-term engagement • Breach is episodic but acyclical International (20%+ of revenue) • India positioned for improving credit volumes following period of credit tightening • Canada and U.K. track record of outgrowing underlying market • Latin America diversified set of growthful economies Portfolio resiliency Diversified and indexed to faster growth economies Relevant offering to consumers in periods of economic stress Broad-based solutions serving diversified set of customers Revenue breakdown based on FY 2024 results.
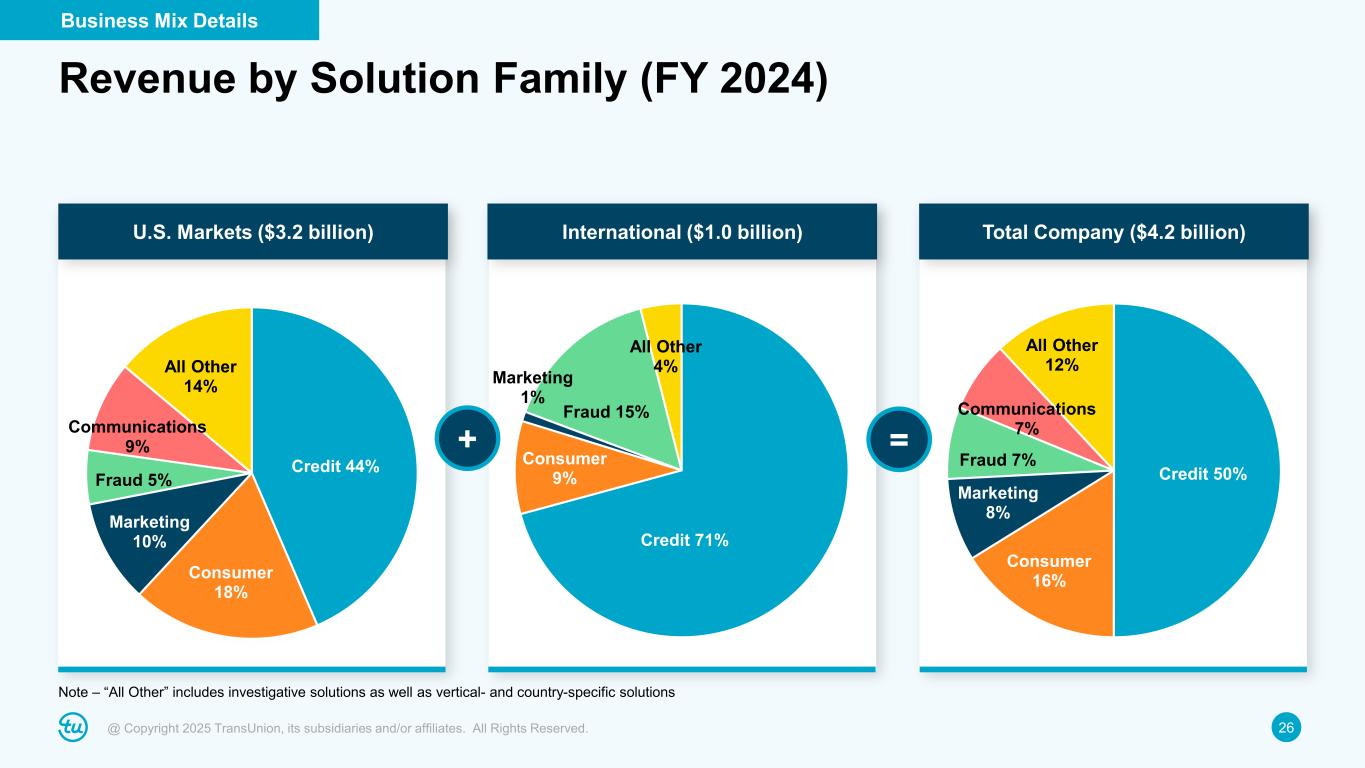
26@ Copyright 2025 TransUnion, its subsidiaries and/or affiliates. All Rights Reserved. Credit 50% Consumer 16% Marketing 8% Fraud 7% Communications 7% All Other 12% Credit 44% Consumer 18% Marketing 10% Fraud 5% Communications 9% All Other 14% Credit 71% Consumer 9% Marketing 1% Fraud 15% All Other 4% Note – “All Other” includes investigative solutions as well as vertical- and country-specific solutions + = U.S. Markets ($3.2 billion) International ($1.0 billion) Total Company ($4.2 billion) Revenue by Solution Family (FY 2024) Business Mix Details
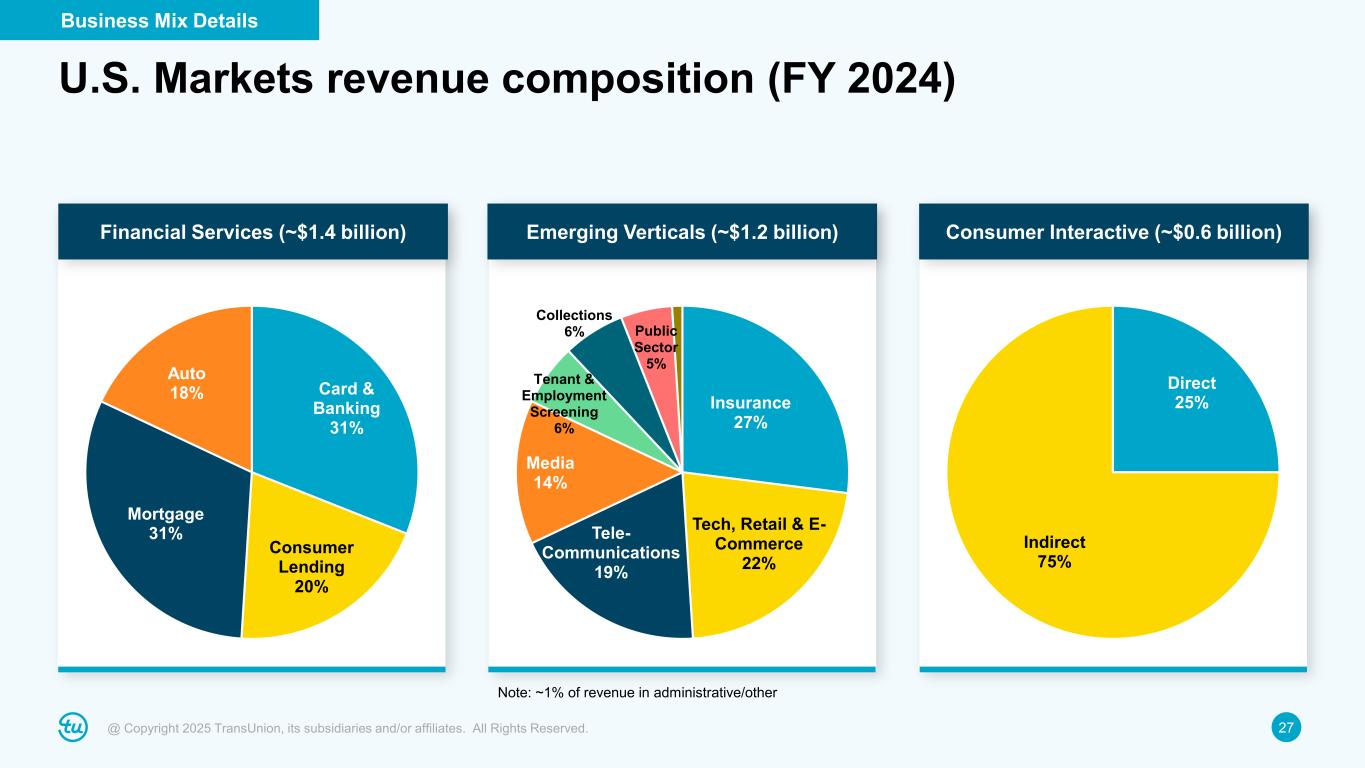
27@ Copyright 2025 TransUnion, its subsidiaries and/or affiliates. All Rights Reserved. U.S. Markets revenue composition (FY 2024) Card & Banking 31% Consumer Lending 20% Mortgage 31% Auto 18% Insurance 27% Tech, Retail & E- Commerce 22% Tele- Communications 19% Media 14% Tenant & Employment Screening 6% Collections 6% Public Sector 5% Direct 25% Indirect 75% Note: ~1% of revenue in administrative/other Financial Services (~$1.4 billion) Emerging Verticals (~$1.2 billion) Consumer Interactive (~$0.6 billion) Business Mix Details
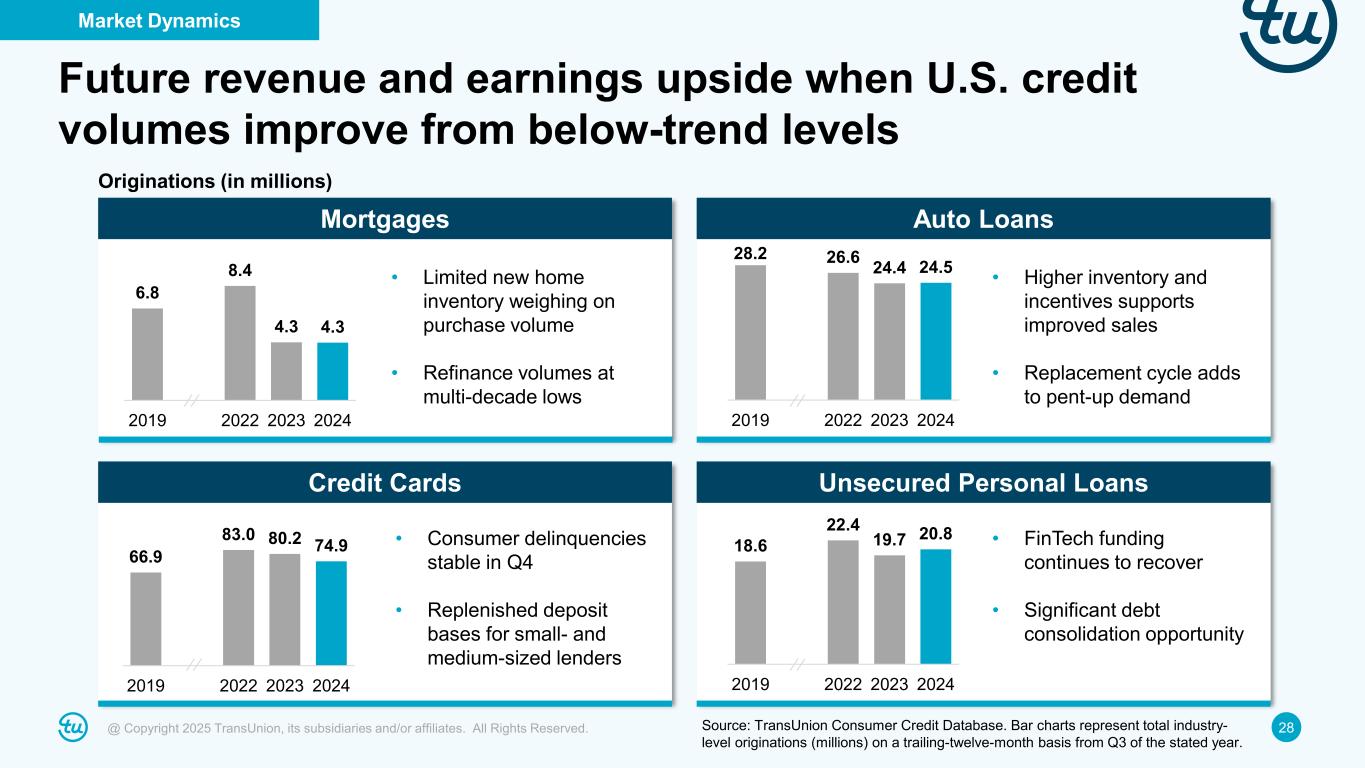
28@ Copyright 2025 TransUnion, its subsidiaries and/or affiliates. All Rights Reserved. Future revenue and earnings upside when U.S. credit volumes improve from below-trend levels Mortgages Auto Loans Credit Cards Unsecured Personal Loans 6.8 8.4 4.3 4.3 2019 2022 2023 2024 28.2 26.6 24.4 24.5 2019 2022 2023 2024 66.9 83.0 80.2 74.9 2019 2022 2023 2024 18.6 22.4 19.7 20.8 2019 2022 2023 2024 Source: TransUnion Consumer Credit Database. Bar charts represent total industry- level originations (millions) on a trailing-twelve-month basis from Q3 of the stated year. • Limited new home inventory weighing on purchase volume • Refinance volumes at multi-decade lows • Higher inventory and incentives supports improved sales • Replacement cycle adds to pent-up demand • FinTech funding continues to recover • Significant debt consolidation opportunity • Consumer delinquencies stable in Q4 • Replenished deposit bases for small- and medium-sized lenders Originations (in millions) Market Dynamics
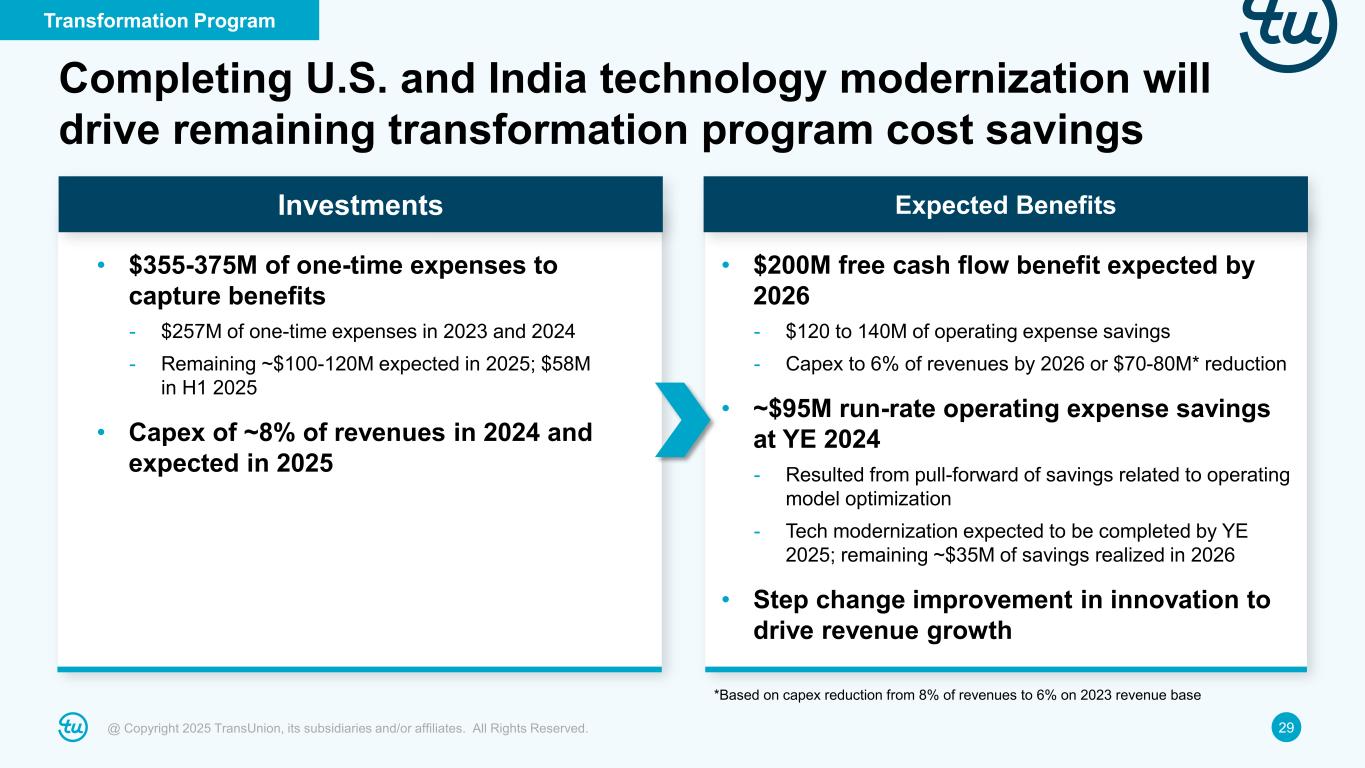
29@ Copyright 2025 TransUnion, its subsidiaries and/or affiliates. All Rights Reserved. • $355-375M of one-time expenses to capture benefits - $257M of one-time expenses in 2023 and 2024 - Remaining ~$100-120M expected in 2025; $58M in H1 2025 • Capex of ~8% of revenues in 2024 and expected in 2025 • $200M free cash flow benefit expected by 2026 - $120 to 140M of operating expense savings - Capex to 6% of revenues by 2026 or $70-80M* reduction • ~$95M run-rate operating expense savings at YE 2024 - Resulted from pull-forward of savings related to operating model optimization - Tech modernization expected to be completed by YE 2025; remaining ~$35M of savings realized in 2026 • Step change improvement in innovation to drive revenue growth *Based on capex reduction from 8% of revenues to 6% on 2023 revenue base Investments Expected Benefits Completing U.S. and India technology modernization will drive remaining transformation program cost savings Transformation Program
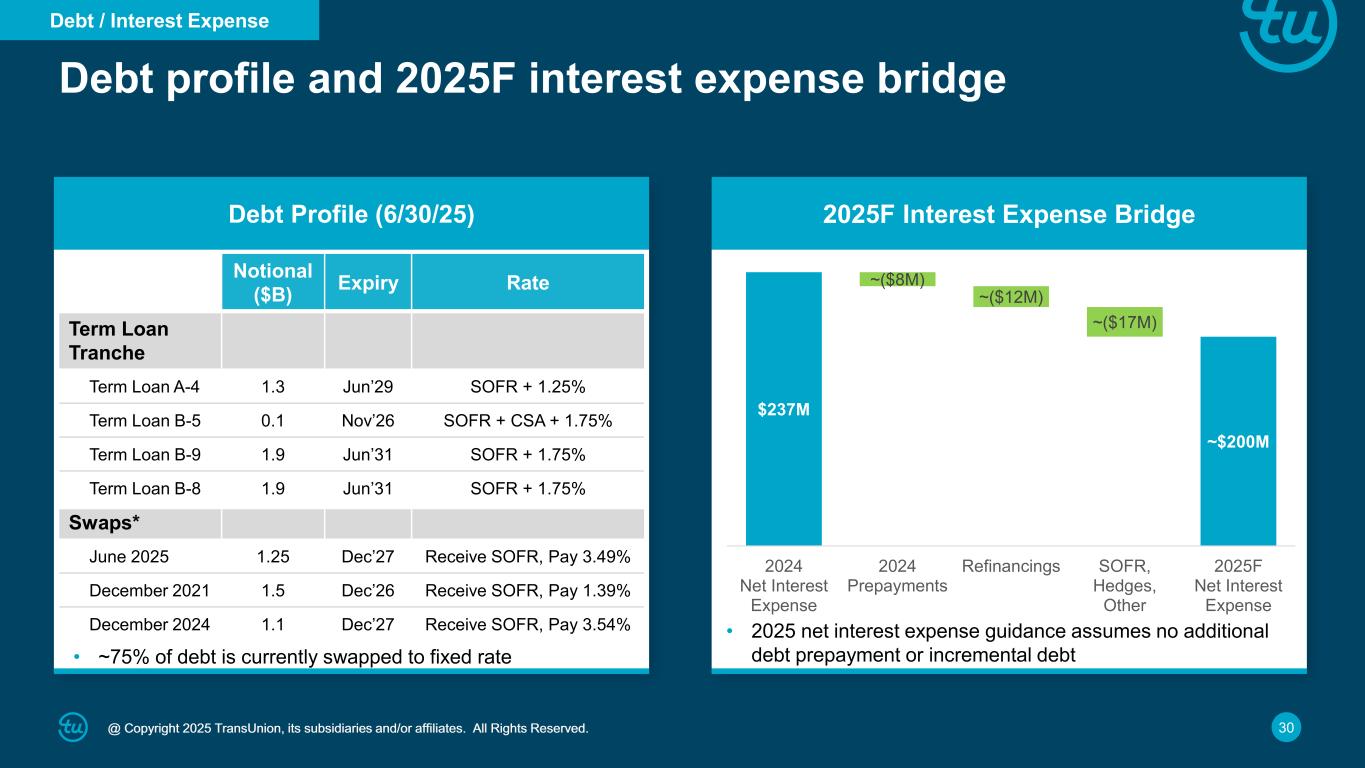
30@ Copyright 2025 TransUnion, its subsidiaries and/or affiliates. All Rights Reserved. Debt profile and 2025F interest expense bridge Debt Profile (6/30/25) 2025F Interest Expense Bridge Notional ($B) Expiry Rate Term Loan Tranche Term Loan A-4 1.3 Jun’29 SOFR + 1.25% Term Loan B-5 0.1 Nov’26 SOFR + CSA + 1.75% Term Loan B-9 1.9 Jun’31 SOFR + 1.75% Term Loan B-8 1.9 Jun’31 SOFR + 1.75% Swaps* June 2025 1.25 Dec’27 Receive SOFR, Pay 3.49% December 2021 1.5 Dec’26 Receive SOFR, Pay 1.39% December 2024 1.1 Dec’27 Receive SOFR, Pay 3.54% • ~75% of debt is currently swapped to fixed rate • 2025 net interest expense guidance assumes no additional debt prepayment or incremental debt $237M ~$200M ~($8M) ~($12M) ~($17M) 2024 Net Interest Expense 2024 Prepayments Refinancings SOFR, Hedges, Other 2025F Net Interest Expense Debt / Interest Expense
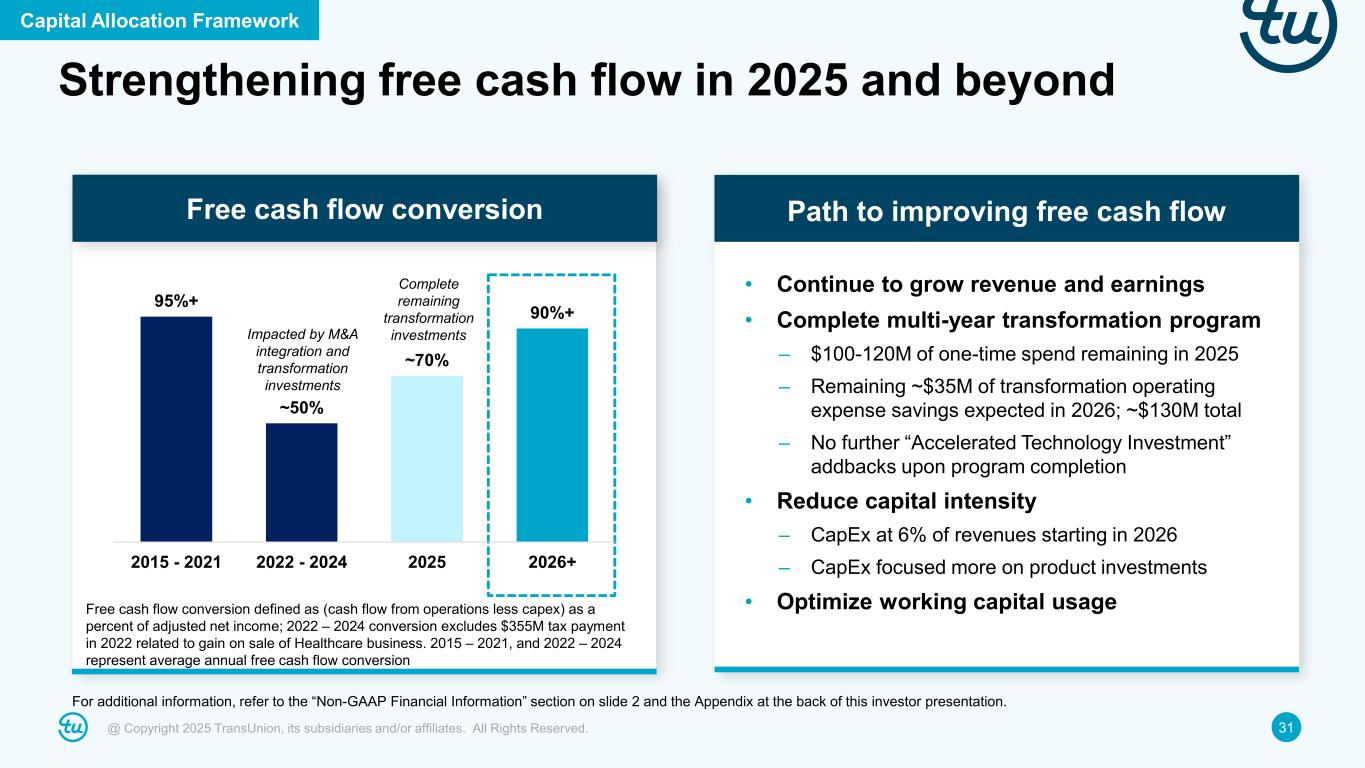
31@ Copyright 2025 TransUnion, its subsidiaries and/or affiliates. All Rights Reserved. Strengthening free cash flow in 2025 and beyond For additional information, refer to the “Non-GAAP Financial Information” section on slide 2 and the Appendix at the back of this investor presentation. Path to improving free cash flow Free cash flow conversion defined as (cash flow from operations less capex) as a percent of adjusted net income; 2022 – 2024 conversion excludes $355M tax payment in 2022 related to gain on sale of Healthcare business. 2015 – 2021, and 2022 – 2024 represent average annual free cash flow conversion • Continue to grow revenue and earnings • Complete multi-year transformation program – $100-120M of one-time spend remaining in 2025 – Remaining ~$35M of transformation operating expense savings expected in 2026; ~$130M total – No further “Accelerated Technology Investment” addbacks upon program completion • Reduce capital intensity – CapEx at 6% of revenues starting in 2026 – CapEx focused more on product investments • Optimize working capital usage Capital Allocation Framework Free cash flow conversion Impacted by M&A integration and transformation investments Complete remaining transformation investments 95%+ ~50% ~70% 90%+ 2015 - 2021 2022 - 2024 2025 2026+
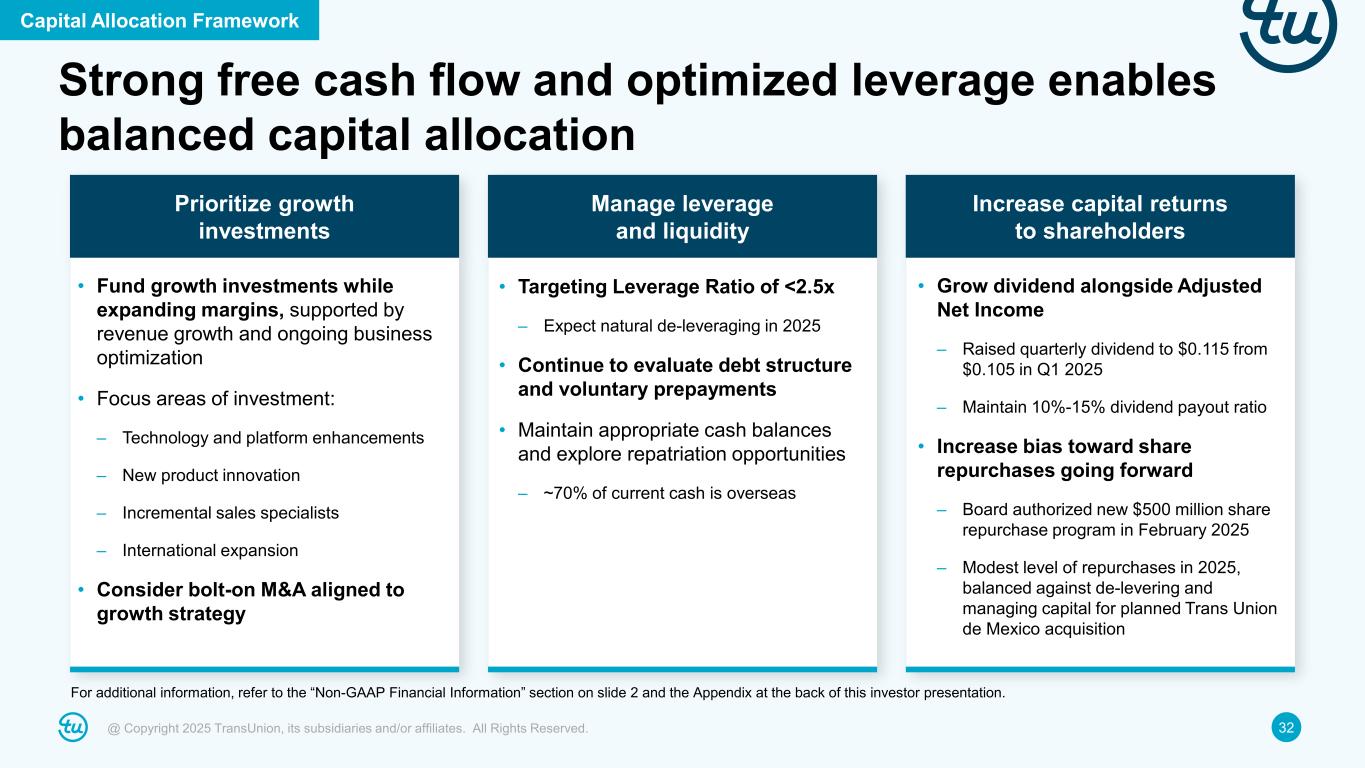
32@ Copyright 2025 TransUnion, its subsidiaries and/or affiliates. All Rights Reserved. Strong free cash flow and optimized leverage enables balanced capital allocation Capital Allocation Framework For additional information, refer to the “Non-GAAP Financial Information” section on slide 2 and the Appendix at the back of this investor presentation. Prioritize growth investments • Fund growth investments while expanding margins, supported by revenue growth and ongoing business optimization • Focus areas of investment: – Technology and platform enhancements – New product innovation – Incremental sales specialists – International expansion • Consider bolt-on M&A aligned to growth strategy Manage leverage and liquidity • Targeting Leverage Ratio of <2.5x – Expect natural de-leveraging in 2025 • Continue to evaluate debt structure and voluntary prepayments • Maintain appropriate cash balances and explore repatriation opportunities – ~70% of current cash is overseas Increase capital returns to shareholders • Grow dividend alongside Adjusted Net Income – Raised quarterly dividend to $0.115 from $0.105 in Q1 2025 – Maintain 10%-15% dividend payout ratio • Increase bias toward share repurchases going forward – Board authorized new $500 million share repurchase program in February 2025 – Modest level of repurchases in 2025, balanced against de-levering and managing capital for planned Trans Union de Mexico acquisition
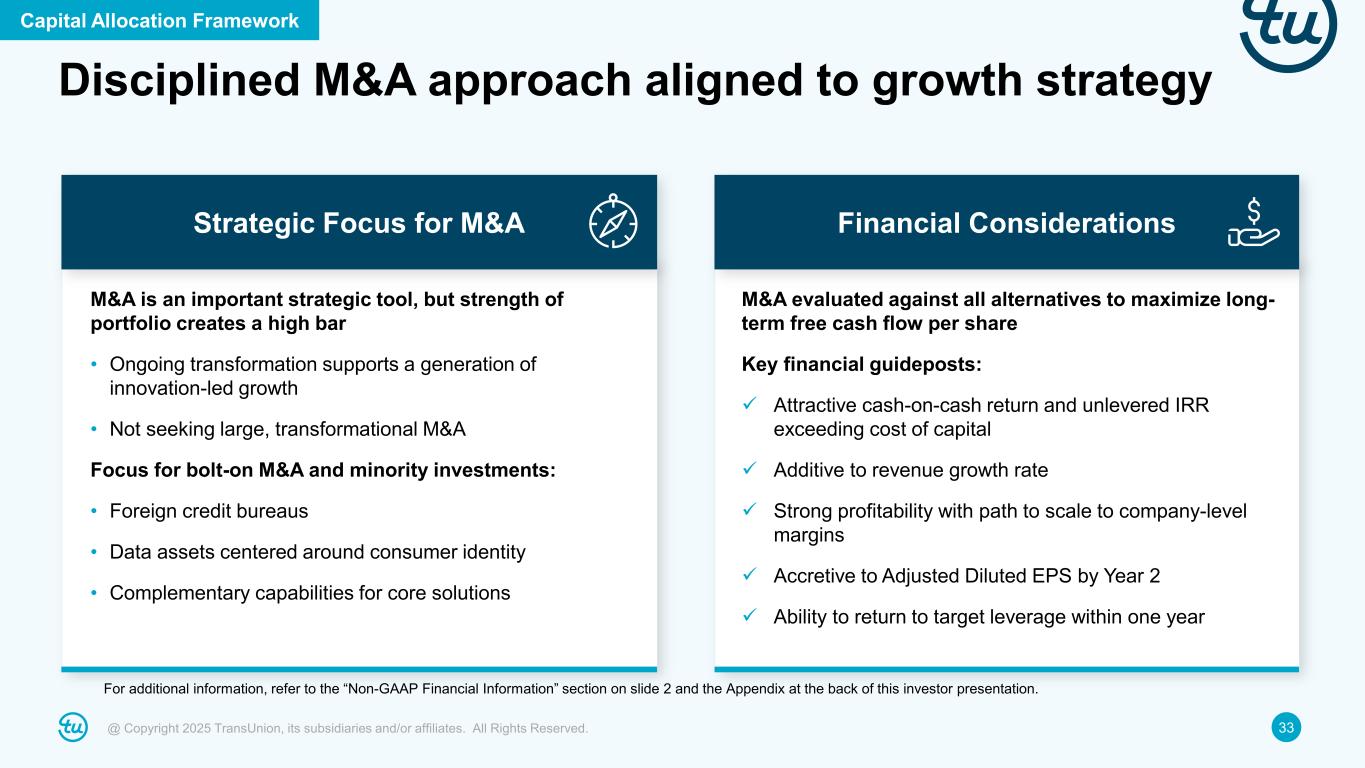
33@ Copyright 2025 TransUnion, its subsidiaries and/or affiliates. All Rights Reserved. Disciplined M&A approach aligned to growth strategy Strategic Focus for M&A M&A is an important strategic tool, but strength of portfolio creates a high bar • Ongoing transformation supports a generation of innovation-led growth • Not seeking large, transformational M&A Focus for bolt-on M&A and minority investments: • Foreign credit bureaus • Data assets centered around consumer identity • Complementary capabilities for core solutions Capital Allocation Framework For additional information, refer to the “Non-GAAP Financial Information” section on slide 2 and the Appendix at the back of this investor presentation. Financial Considerations M&A evaluated against all alternatives to maximize long- term free cash flow per share Key financial guideposts: Attractive cash-on-cash return and unlevered IRR exceeding cost of capital Additive to revenue growth rate Strong profitability with path to scale to company-level margins Accretive to Adjusted Diluted EPS by Year 2 Ability to return to target leverage within one year
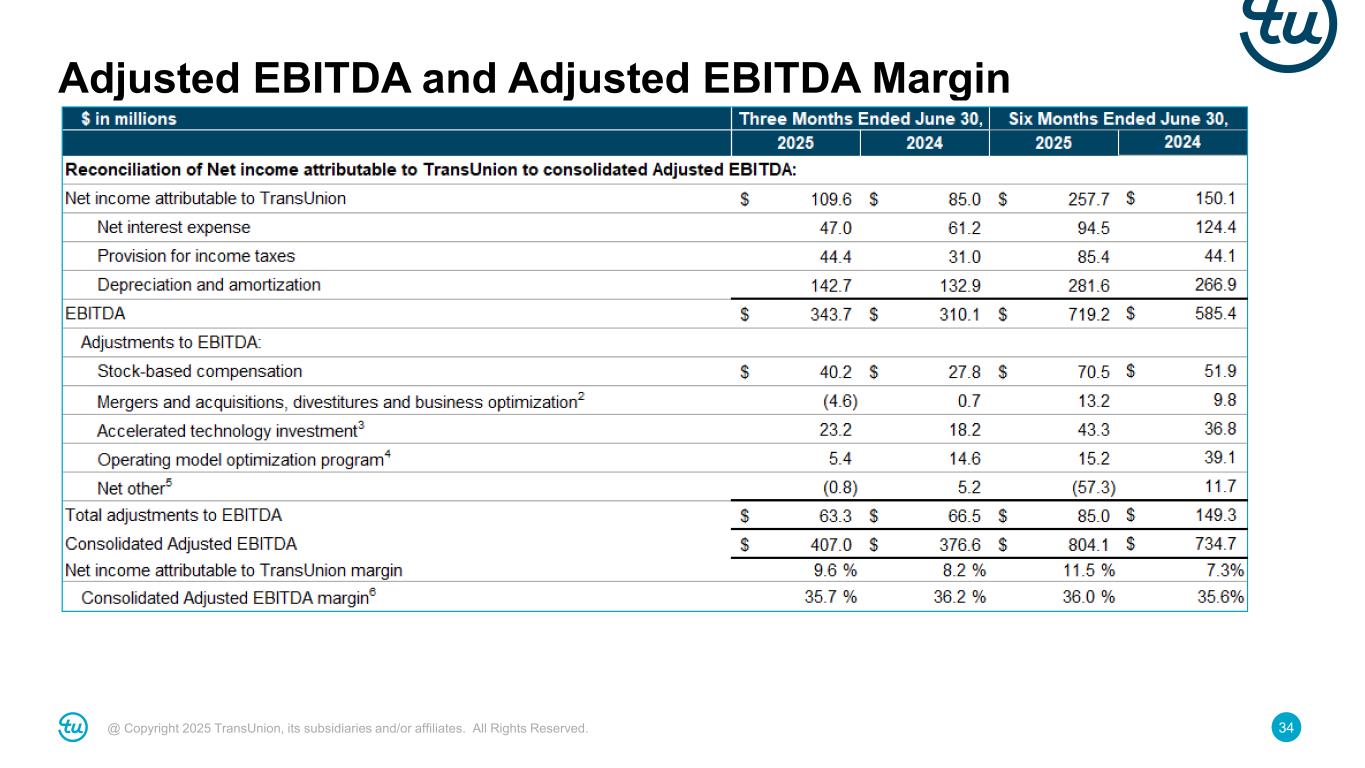
34@ Copyright 2025 TransUnion, its subsidiaries and/or affiliates. All Rights Reserved. Adjusted EBITDA and Adjusted EBITDA Margin
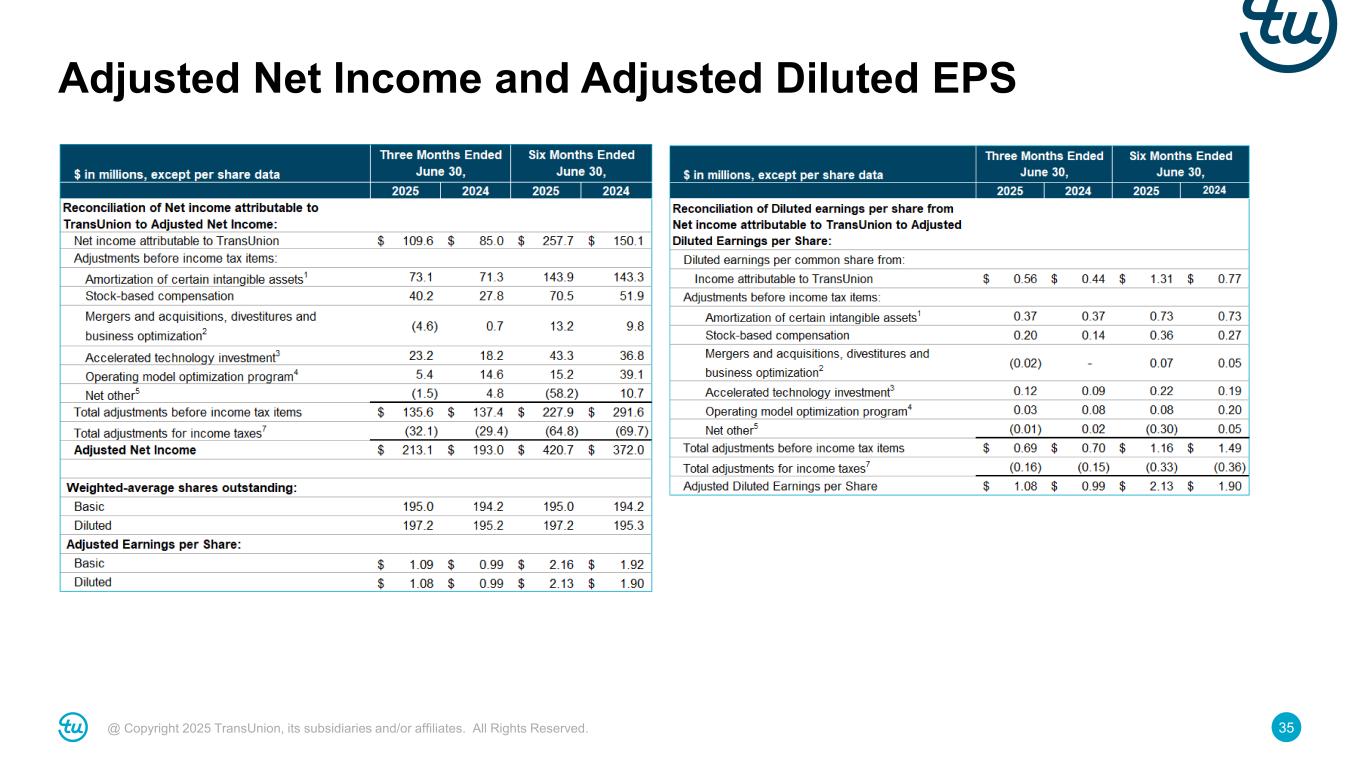
35@ Copyright 2025 TransUnion, its subsidiaries and/or affiliates. All Rights Reserved. Adjusted Net Income and Adjusted Diluted EPS
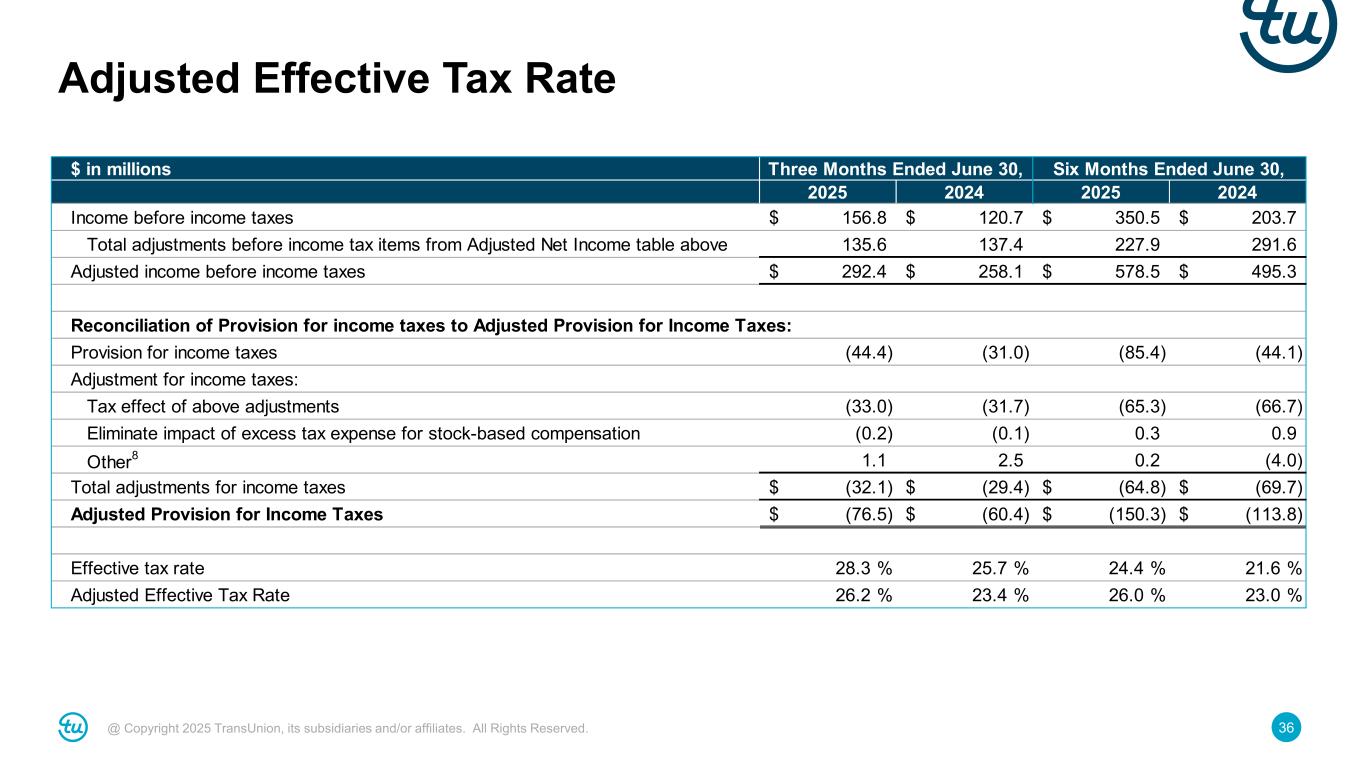
36@ Copyright 2025 TransUnion, its subsidiaries and/or affiliates. All Rights Reserved. Adjusted Effective Tax Rate $ in millions 2025 2024 2025 2024 Income before income taxes 156.8$ 120.7$ 350.5$ 203.7$ Total adjustments before income tax items from Adjusted Net Income table above 135.6 137.4 227.9 291.6 Adjusted income before income taxes 292.4$ 258.1$ 578.5$ 495.3$ Reconciliation of Provision for income taxes to Adjusted Provision for Income Taxes: Provision for income taxes (44.4) (31.0) (85.4) (44.1) Adjustment for income taxes: Tax effect of above adjustments (33.0) (31.7) (65.3) (66.7) Eliminate impact of excess tax expense for stock-based compensation (0.2) (0.1) 0.3 0.9 Other8 1.1 2.5 0.2 (4.0) Total adjustments for income taxes (32.1)$ (29.4)$ (64.8)$ (69.7)$ Adjusted Provision for Income Taxes (76.5)$ (60.4)$ (150.3)$ (113.8)$ Effective tax rate 28.3 % 25.7 % 24.4 % 21.6 % Adjusted Effective Tax Rate 26.2 % 23.4 % 26.0 % 23.0 % Three Months Ended June 30, Six Months Ended June 30,
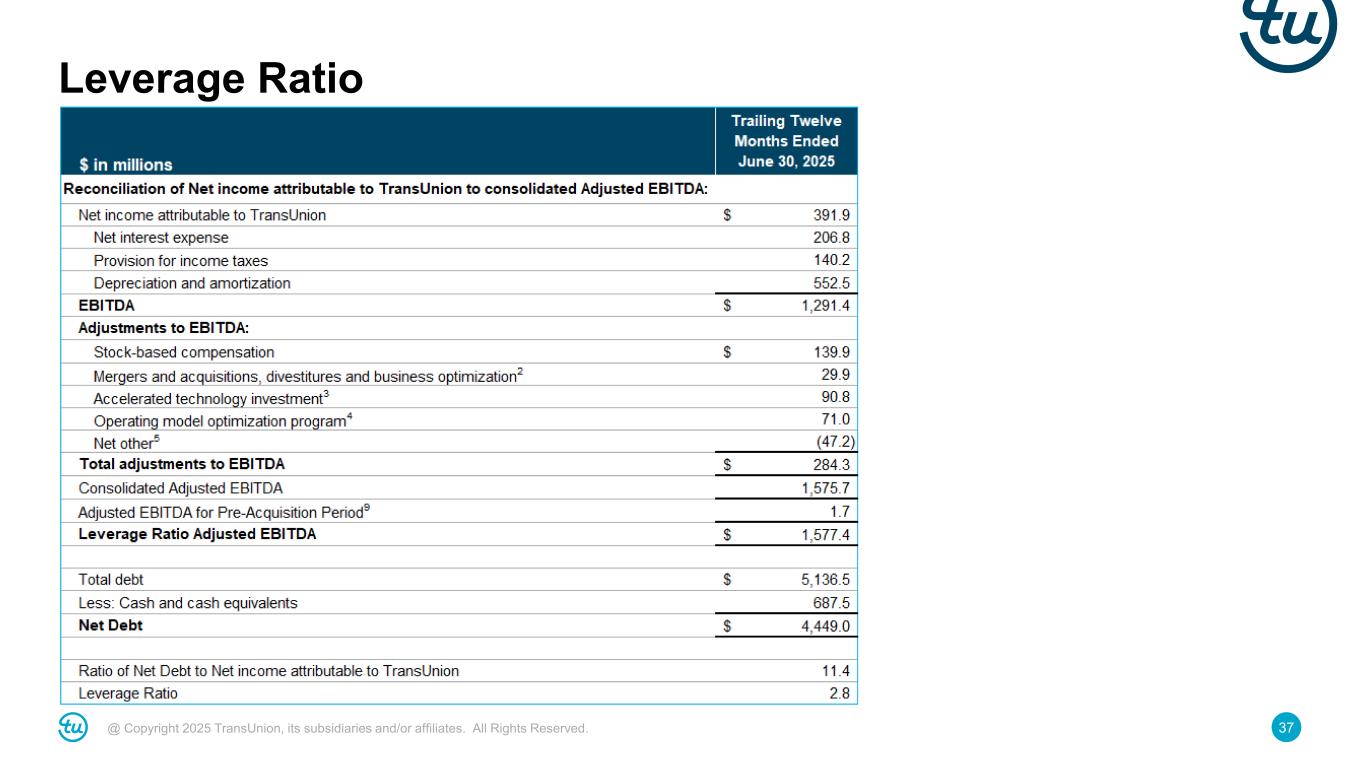
37@ Copyright 2025 TransUnion, its subsidiaries and/or affiliates. All Rights Reserved. Leverage Ratio
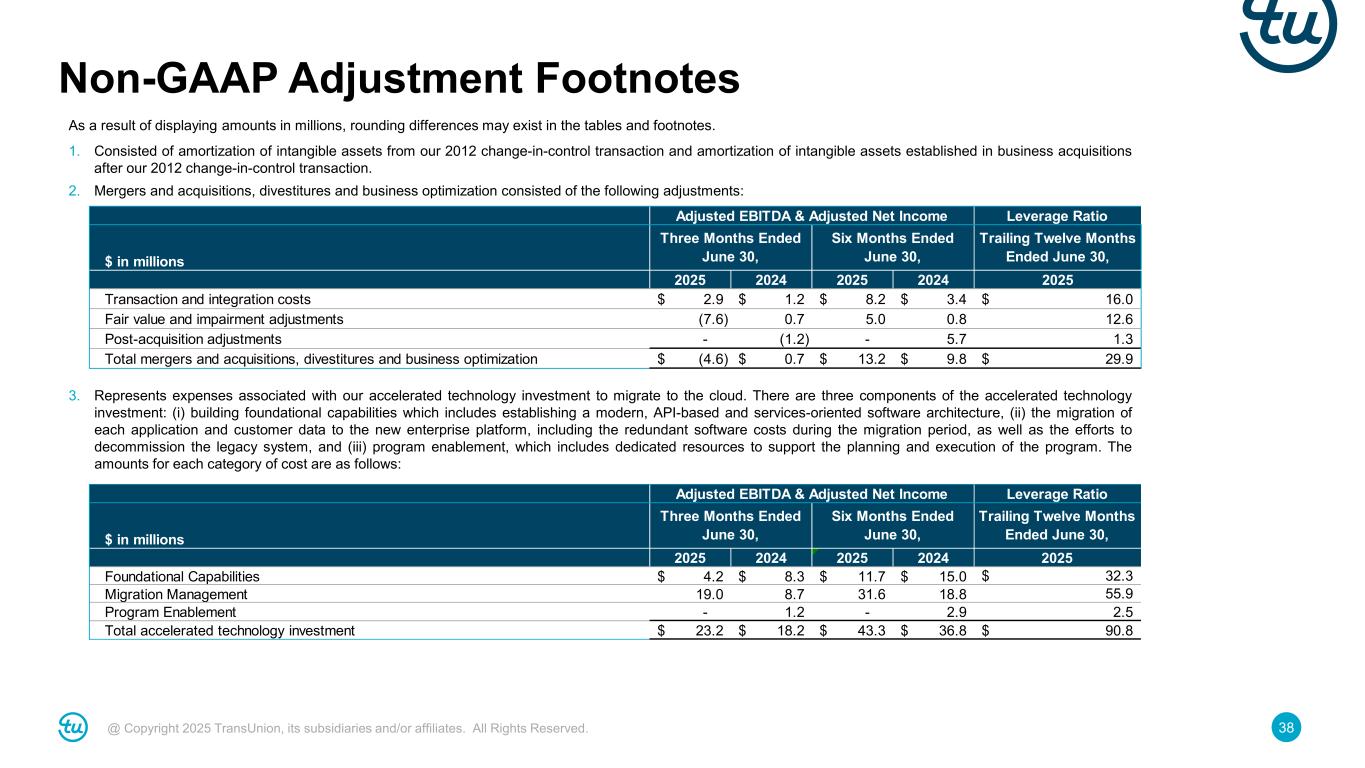
38@ Copyright 2025 TransUnion, its subsidiaries and/or affiliates. All Rights Reserved. Non-GAAP Adjustment Footnotes As a result of displaying amounts in millions, rounding differences may exist in the tables and footnotes. 1. Consisted of amortization of intangible assets from our 2012 change-in-control transaction and amortization of intangible assets established in business acquisitions after our 2012 change-in-control transaction. 2. Mergers and acquisitions, divestitures and business optimization consisted of the following adjustments: 3. Represents expenses associated with our accelerated technology investment to migrate to the cloud. There are three components of the accelerated technology investment: (i) building foundational capabilities which includes establishing a modern, API-based and services-oriented software architecture, (ii) the migration of each application and customer data to the new enterprise platform, including the redundant software costs during the migration period, as well as the efforts to decommission the legacy system, and (iii) program enablement, which includes dedicated resources to support the planning and execution of the program. The amounts for each category of cost are as follows: $ in millions 2025 2024 2025 2024 Transaction and integration costs 2.9$ 1.2$ 8.2$ 3.4$ Fair value and impairment adjustments (7.6) 0.7 5.0 0.8 Post-acquisition adjustments - (1.2) - 5.7 Total mergers and acquisitions, divestitures and business optimization (4.6)$ 0.7$ 13.2$ 9.8$ 1.3 29.9$ Three Months Ended June 30, Six Months Ended June 30, Trailing Twelve Months Ended June 30, 2025 16.0$ 12.6 Adjusted EBITDA & Adjusted Net Income Leverage Ratio $ in millions 2025 2024 2025 2024 Foundational Capabilities 4.2$ 8.3$ 11.7$ 15.0$ Migration Management 19.0 8.7 31.6 18.8 Program Enablement - 1.2 - 2.9 Total accelerated technology investment 23.2$ 18.2$ 43.3$ 36.8$ 2025 32.3$ 55.9 2.5 90.8$ Adjusted EBITDA & Adjusted Net Income Leverage Ratio Three Months Ended June 30, Six Months Ended June 30, Trailing Twelve Months Ended June 30,
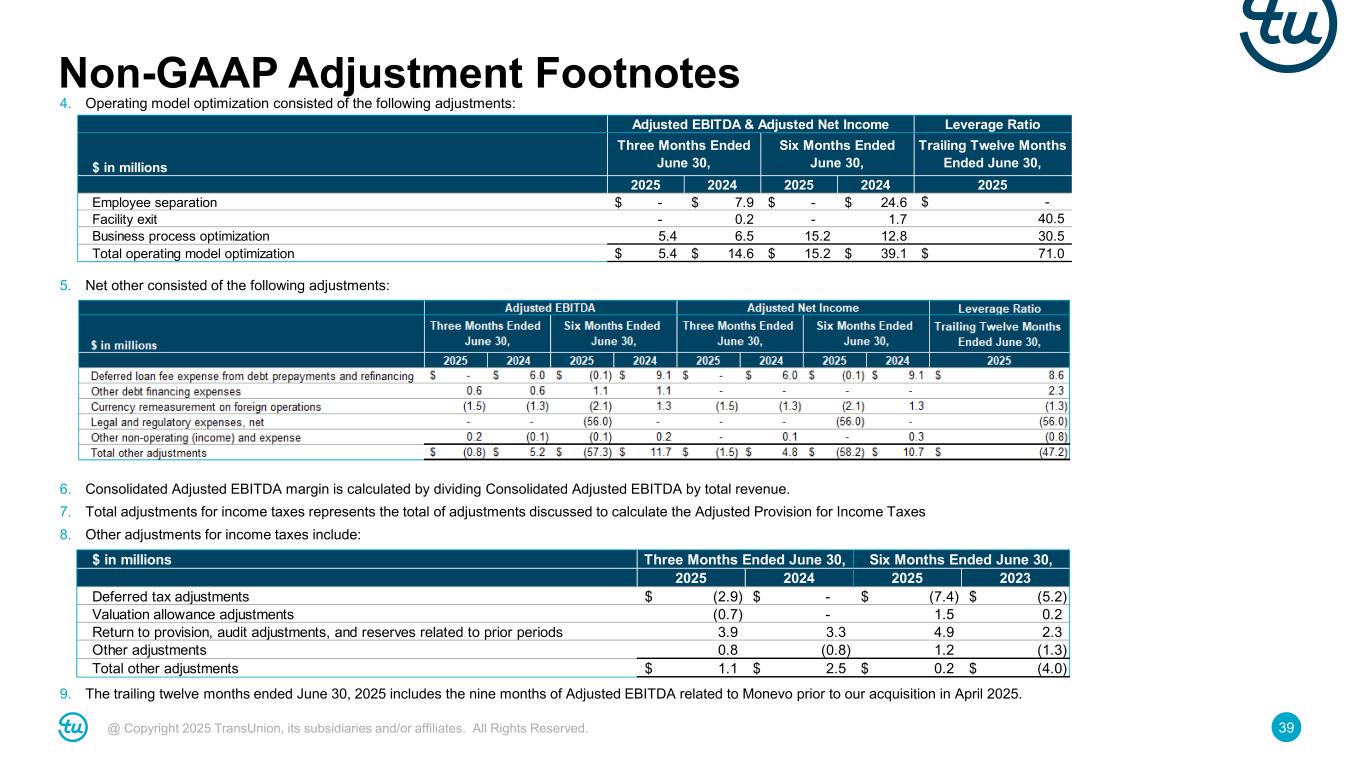
39@ Copyright 2025 TransUnion, its subsidiaries and/or affiliates. All Rights Reserved. Non-GAAP Adjustment Footnotes 4. Operating model optimization consisted of the following adjustments: 5. Net other consisted of the following adjustments: 6. Consolidated Adjusted EBITDA margin is calculated by dividing Consolidated Adjusted EBITDA by total revenue. 7. Total adjustments for income taxes represents the total of adjustments discussed to calculate the Adjusted Provision for Income Taxes 8. Other adjustments for income taxes include: 9. The trailing twelve months ended June 30, 2025 includes the nine months of Adjusted EBITDA related to Monevo prior to our acquisition in April 2025. $ in millions 2025 2024 2025 2024 Employee separation -$ 7.9$ -$ 24.6$ Facility exit - 0.2 - 1.7 Business process optimization 5.4 6.5 15.2 12.8 Total operating model optimization 5.4$ 14.6$ 15.2$ 39.1$ Adjusted EBITDA & Adjusted Net Income Leverage Ratio Three Months Ended June 30, Six Months Ended June 30, Trailing Twelve Months Ended June 30, 2025 -$ 40.5 30.5 71.0$ $ in millions 2025 2024 2025 2023 Deferred tax adjustments (2.9)$ -$ (7.4)$ (5.2)$ Valuation allowance adjustments (0.7) - 1.5 0.2 Return to provision, audit adjustments, and reserves related to prior periods 3.9 3.3 4.9 2.3 Other adjustments 0.8 (0.8) 1.2 (1.3) Total other adjustments 1.1$ 2.5$ 0.2$ (4.0)$ Three Months Ended June 30, Six Months Ended June 30,
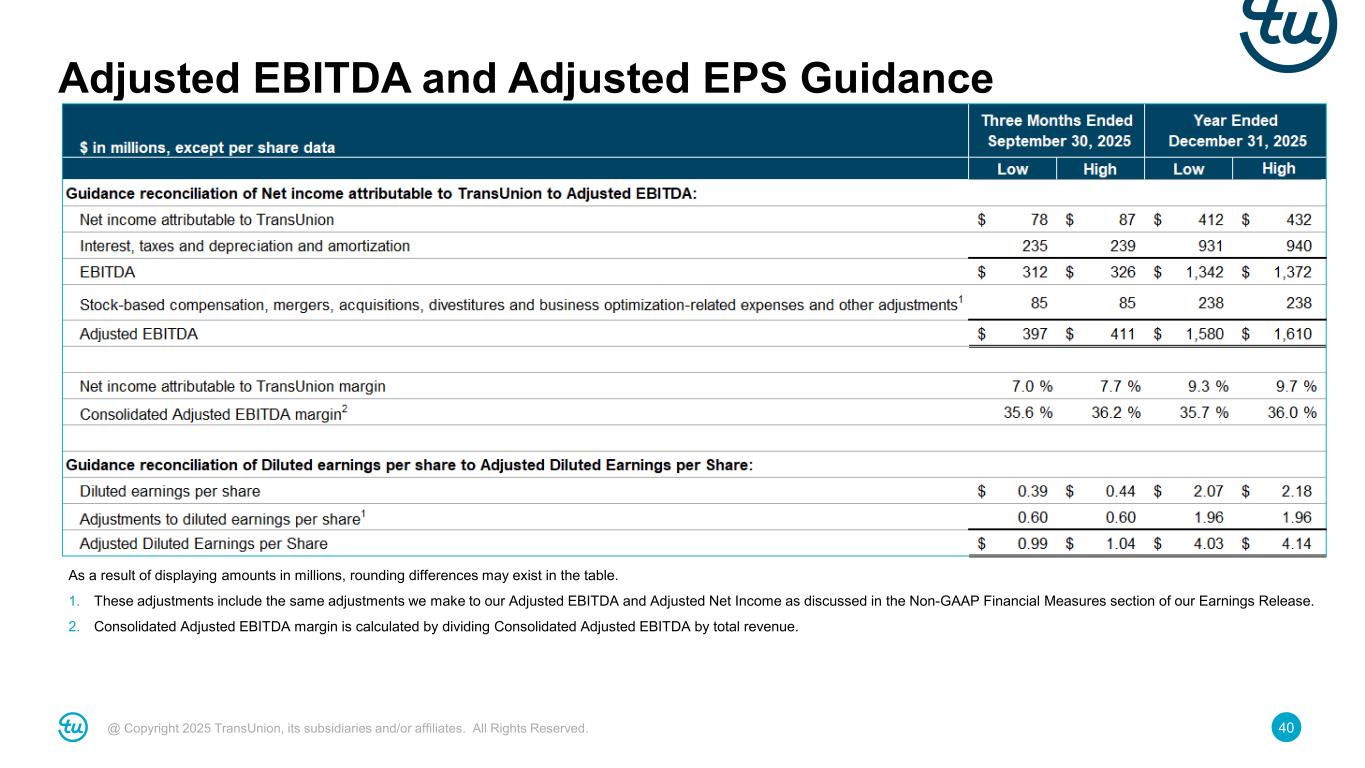
40@ Copyright 2025 TransUnion, its subsidiaries and/or affiliates. All Rights Reserved. Adjusted EBITDA and Adjusted EPS Guidance As a result of displaying amounts in millions, rounding differences may exist in the table. 1. These adjustments include the same adjustments we make to our Adjusted EBITDA and Adjusted Net Income as discussed in the Non-GAAP Financial Measures section of our Earnings Release. 2. Consolidated Adjusted EBITDA margin is calculated by dividing Consolidated Adjusted EBITDA by total revenue.