
Third Quarter 2025 Earnings October 23, 2025 Chris Cartwright, President and CEO Todd Cello, CFO .2
2@ Copyright 2025 TransUnion, its subsidiaries and/or affiliates. All Rights Reserved. Non-GAAP Financial InformationForward-Looking Statements This presentation contains forward-looking statements within the meaning of the Private Securities Litigation Reform Act of 1995. These statements are based on the current beliefs and expectations of TransUnion’s management and are subject to significant risks and uncertainties. Actual results may differ materially from those described in the forward-looking statements. Factors that could cause TransUnion’s actual results to differ materially from those described in the forward-looking statements include: macroeconomic effects and changes in market conditions, including the impact of tariffs, inflation, risk of recession and industry trends and adverse developments in the debt, consumer credit and financial services markets, including the impact on the carrying value of our assets in all of the markets where we operate; our ability to provide competitive services and prices; our ability to retain or renew existing agreements with large or long-term customers; our ability to maintain the security and integrity of our data; our ability to deliver services timely without interruption; uncertainty related to FICO’s new Mortgage Direct License Program; our ability to maintain our access to data sources; government regulation and changes in the regulatory environment; litigation or regulatory proceedings; our approach to the use of artificial intelligence; our ability to effectively manage our costs; our efforts to execute our transformation plan and achieve the anticipated benefits and savings; our ability to maintain effective internal control over financial reporting or disclosure controls and procedures; economic and political stability in the United States and risks associated with the international markets where we operate; our ability to effectively develop and maintain strategic alliances and joint ventures; our ability to timely develop new services and the market’s willingness to adopt our new services; our ability to manage and expand our operations and keep up with rapidly changing technologies; our ability to acquire businesses, successfully secure financing for our acquisitions, timely consummate our acquisitions, successfully integrate the operations of our acquisitions, control the costs of integrating our acquisitions and realize the intended benefits of such acquisitions; our ability to protect and enforce our intellectual property, trade secrets and other forms of unpatented intellectual property; our ability to defend our intellectual property from infringement claims by third parties; the ability of our outside service providers and key vendors to fulfill their obligations to us; further consolidation in our end-customer markets; the increased availability of free or inexpensive consumer information; losses against which we do not insure; risks related to our indebtedness, including our ability to make timely payments of principal and interest and our ability to satisfy covenants in the agreements governing our indebtedness; our ability to maintain our liquidity; our dividend payments and dividend rate; share repurchase plans; our reliance on key management personnel; changes in tax laws or adverse outcomes resulting from examination of our tax returns; and other one- time events and other factors that can be found in our Annual Report on Form 10-K for the year ended December 31, 2024, and any subsequent Quarterly Report on Form 10-Q or Current Report on Form 8-K, which are filed with the Securities and Exchange Commission and are available on TransUnion’s website (www.transunion.com/tru) and on the Securities and Exchange Commission’s website (www.sec.gov). TransUnion undertakes no obligation to publicly release the result of any revisions to these forward-looking statements to reflect the impact of events or circumstances that may arise after the date of this presentation. This investor presentation includes certain non-GAAP measures that are more fully described in the appendices to the presentation. , “Press release of TransUnion dated October 23, 2025, announcing results for the quarter ended September 30, 2025,” under the heading ‘Non-GAAP Financial Measures,’” furnished to the Securities and Exchange Commission on October 23, 2025. These financial measures should be reviewed in conjunction with the relevant GAAP financial measures and are not presented as alternative measures of GAAP. Other companies in our industry may define or calculate these measures differently than we do, limiting their usefulness as comparative measures. Because of these limitations, these non-GAAP financial measures should not be considered in isolation or as substitutes for performance measures calculated in accordance with GAAP. Reconciliations of these non-GAAP financial measures to their most directly comparable GAAP financial measures for each of the periods included in this presentation are included in the Appendices at the back of this investor presentation.
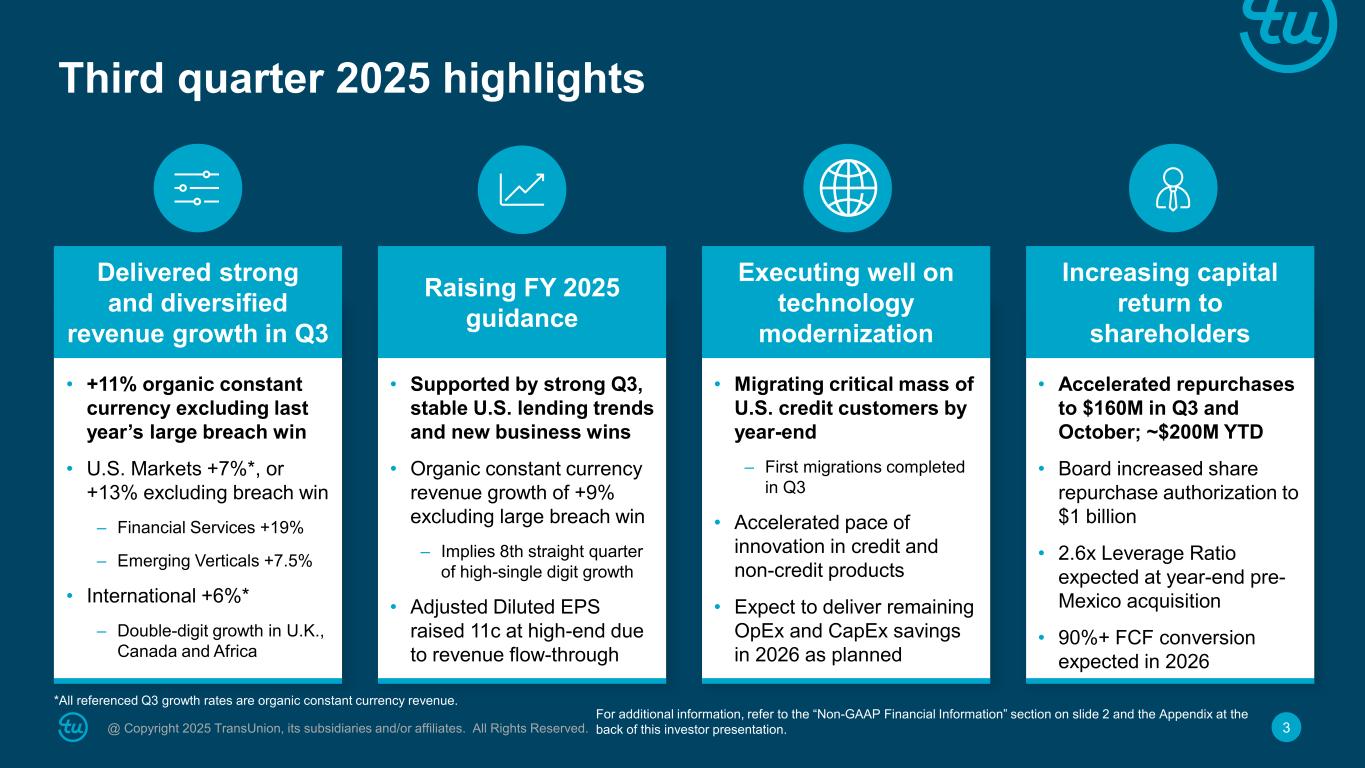
3@ Copyright 2025 TransUnion, its subsidiaries and/or affiliates. All Rights Reserved. Delivered strong and diversified revenue growth in Q3 Raising FY 2025 guidance Executing well on technology modernization Increasing capital return to shareholders • +11% organic constant currency excluding last year’s large breach win • U.S. Markets +7%*, or +13% excluding breach win – Financial Services +19% – Emerging Verticals +7.5% • International +6%* – Double-digit growth in U.K., Canada and Africa • Supported by strong Q3, stable U.S. lending trends and new business wins • Organic constant currency revenue growth of +9% excluding large breach win – Implies 8th straight quarter of high-single digit growth • Adjusted Diluted EPS raised 11c at high-end due to revenue flow-through • Migrating critical mass of U.S. credit customers by year-end – First migrations completed in Q3 • Accelerated pace of innovation in credit and non-credit products • Expect to deliver remaining OpEx and CapEx savings in 2026 as planned • Accelerated repurchases to $160M in Q3 and October; ~$200M YTD • Board increased share repurchase authorization to $1 billion • 2.6x Leverage Ratio expected at year-end pre- Mexico acquisition • 90%+ FCF conversion expected in 2026 Third quarter 2025 highlights *All referenced Q3 growth rates are organic constant currency revenue. For additional information, refer to the “Non-GAAP Financial Information” section on slide 2 and the Appendix at the back of this investor presentation.
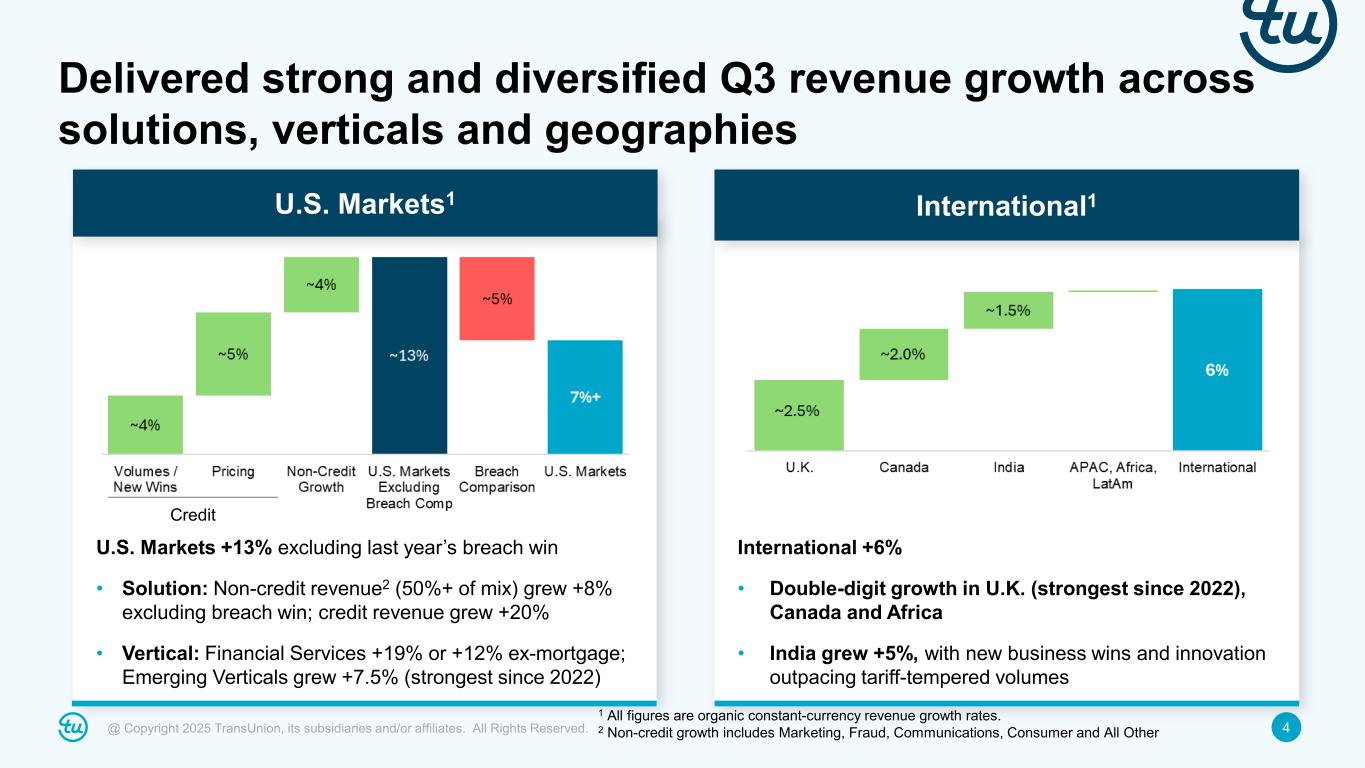
4@ Copyright 2025 TransUnion, its subsidiaries and/or affiliates. All Rights Reserved. Delivered strong and diversified Q3 revenue growth across solutions, verticals and geographies 1 All figures are organic constant-currency revenue growth rates. 2 Non-credit growth includes Marketing, Fraud, Communications, Consumer and All Other Credit U.S. Markets +13% excluding last year’s breach win • Solution: Non-credit revenue2 (50%+ of mix) grew +8% excluding breach win; credit revenue grew +20% • Vertical: Financial Services +19% or +12% ex-mortgage; Emerging Verticals grew +7.5% (strongest since 2022) International +6% • Double-digit growth in U.K. (strongest since 2022), Canada and Africa • India grew +5%, with new business wins and innovation outpacing tariff-tempered volumes International1U.S. Markets1
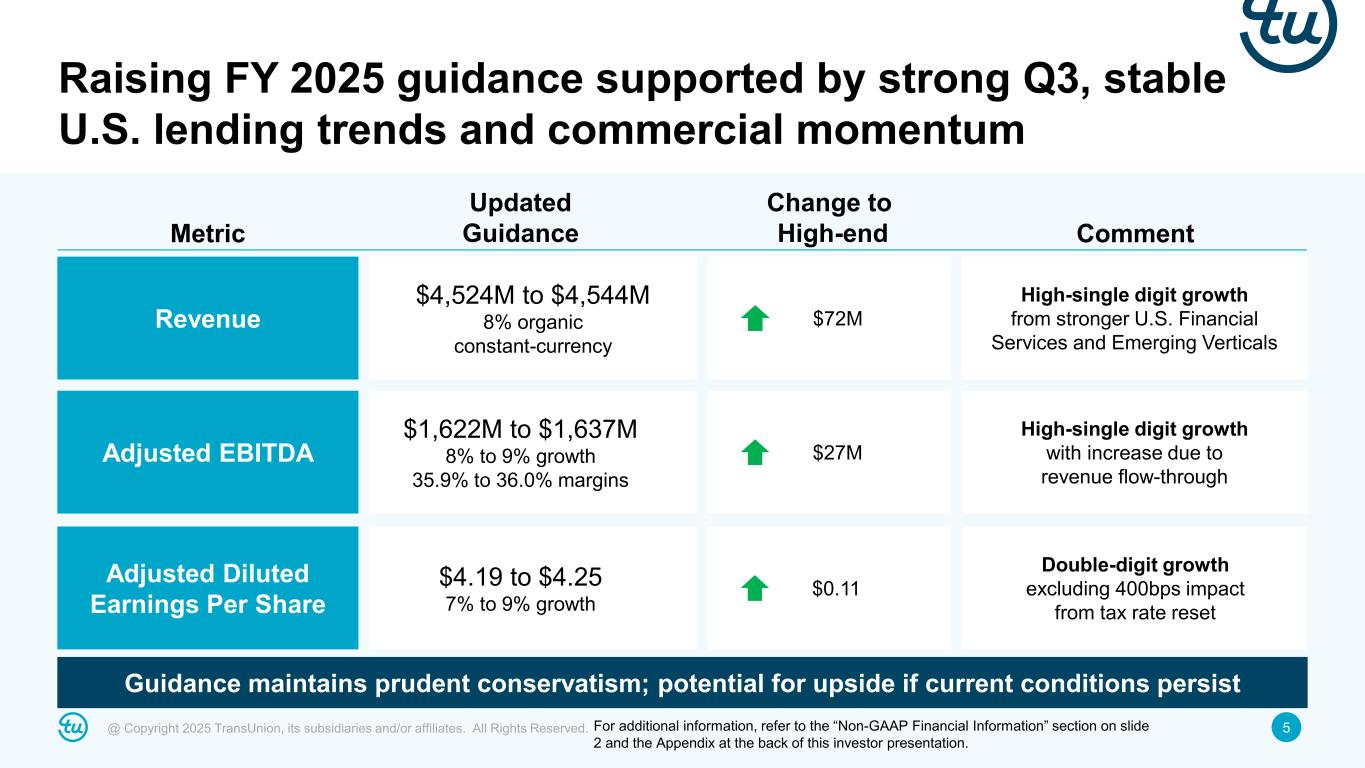
5@ Copyright 2025 TransUnion, its subsidiaries and/or affiliates. All Rights Reserved. Revenue Adjusted EBITDA Adjusted Diluted Earnings Per Share Metric Updated Guidance Change to High-end Comment $4,524M to $4,544M 8% organic constant-currency $1,622M to $1,637M 8% to 9% growth 35.9% to 36.0% margins $4.19 to $4.25 7% to 9% growth $72M $27M $0.11 High-single digit growth from stronger U.S. Financial Services and Emerging Verticals High-single digit growth with increase due to revenue flow-through Double-digit growth excluding 400bps impact from tax rate reset Raising FY 2025 guidance supported by strong Q3, stable U.S. lending trends and commercial momentum Guidance maintains prudent conservatism; potential for upside if current conditions persist For additional information, refer to the “Non-GAAP Financial Information” section on slide 2 and the Appendix at the back of this investor presentation.
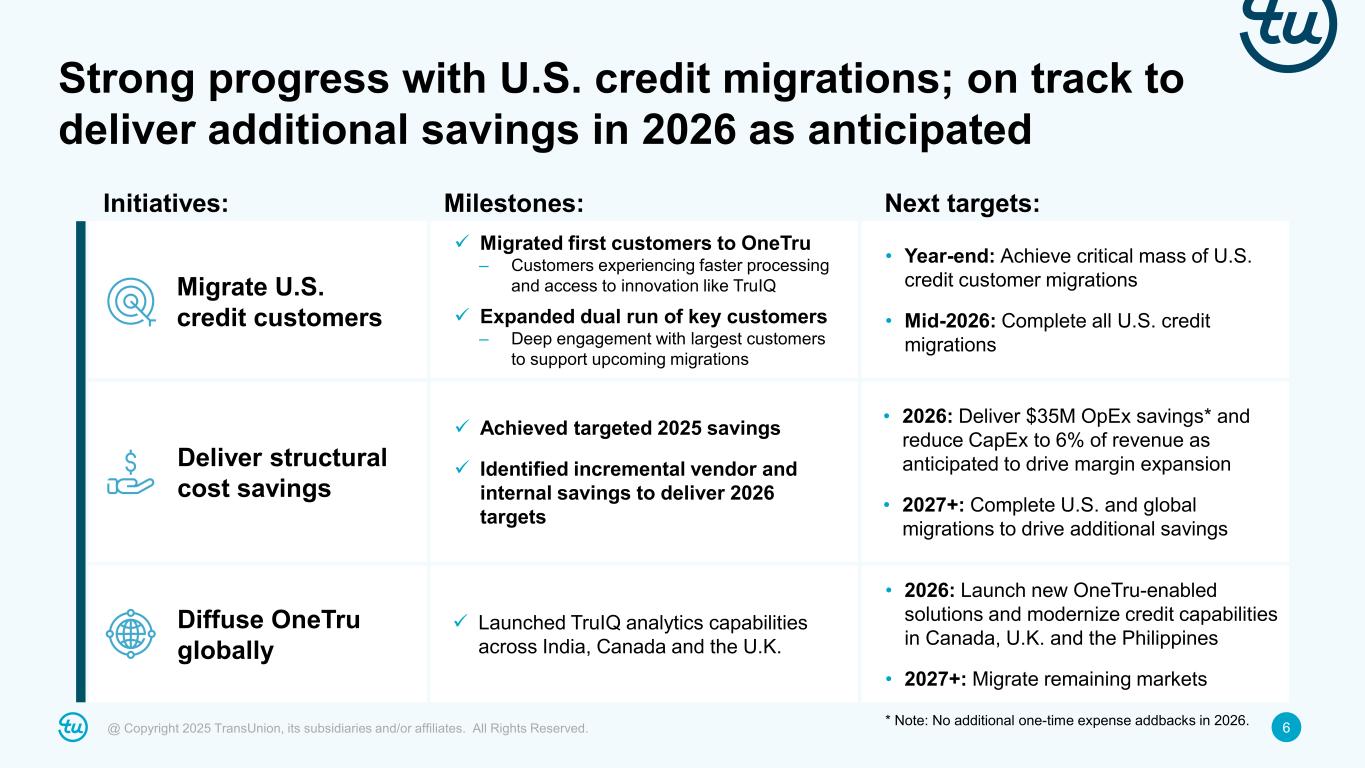
6@ Copyright 2025 TransUnion, its subsidiaries and/or affiliates. All Rights Reserved. Migrate U.S. credit customers Milestones: Next targets: Strong progress with U.S. credit migrations; on track to deliver additional savings in 2026 as anticipated Initiatives: Migrated first customers to OneTru – Customers experiencing faster processing and access to innovation like TruIQ Expanded dual run of key customers – Deep engagement with largest customers to support upcoming migrations • Year-end: Achieve critical mass of U.S. credit customer migrations • Mid-2026: Complete all U.S. credit migrations Diffuse OneTru globally Launched TruIQ analytics capabilities across India, Canada and the U.K. • 2026: Launch new OneTru-enabled solutions and modernize credit capabilities in Canada, U.K. and the Philippines • 2027+: Migrate remaining markets Deliver structural cost savings Achieved targeted 2025 savings Identified incremental vendor and internal savings to deliver 2026 targets • 2026: Deliver $35M OpEx savings* and reduce CapEx to 6% of revenue as anticipated to drive margin expansion • 2027+: Complete U.S. and global migrations to drive additional savings * Note: No additional one-time expense addbacks in 2026.
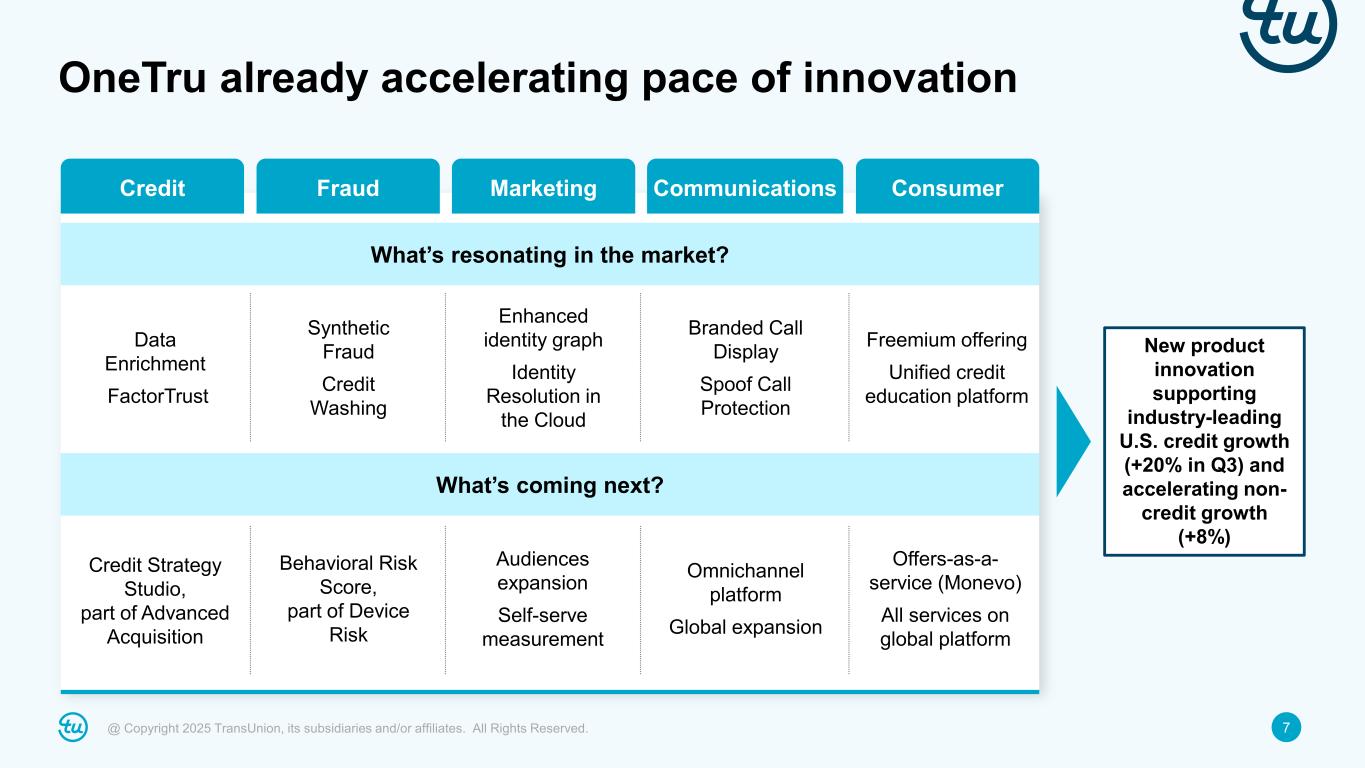
7@ Copyright 2025 TransUnion, its subsidiaries and/or affiliates. All Rights Reserved. What’s resonating in the market? What’s coming next? Synthetic Fraud Credit Washing Enhanced identity graph Identity Resolution in the Cloud Credit Strategy Studio, part of Advanced Acquisition Behavioral Risk Score, part of Device Risk Audiences expansion Self-serve measurement Branded Call Display Spoof Call Protection Omnichannel platform Global expansion Freemium offering Unified credit education platform Offers-as-a- service (Monevo) All services on global platform OneTru already accelerating pace of innovation New product innovation supporting industry-leading U.S. credit growth (+20% in Q3) and accelerating non- credit growth (+8%) Data Enrichment FactorTrust MarketingFraudCredit Communications Consumer
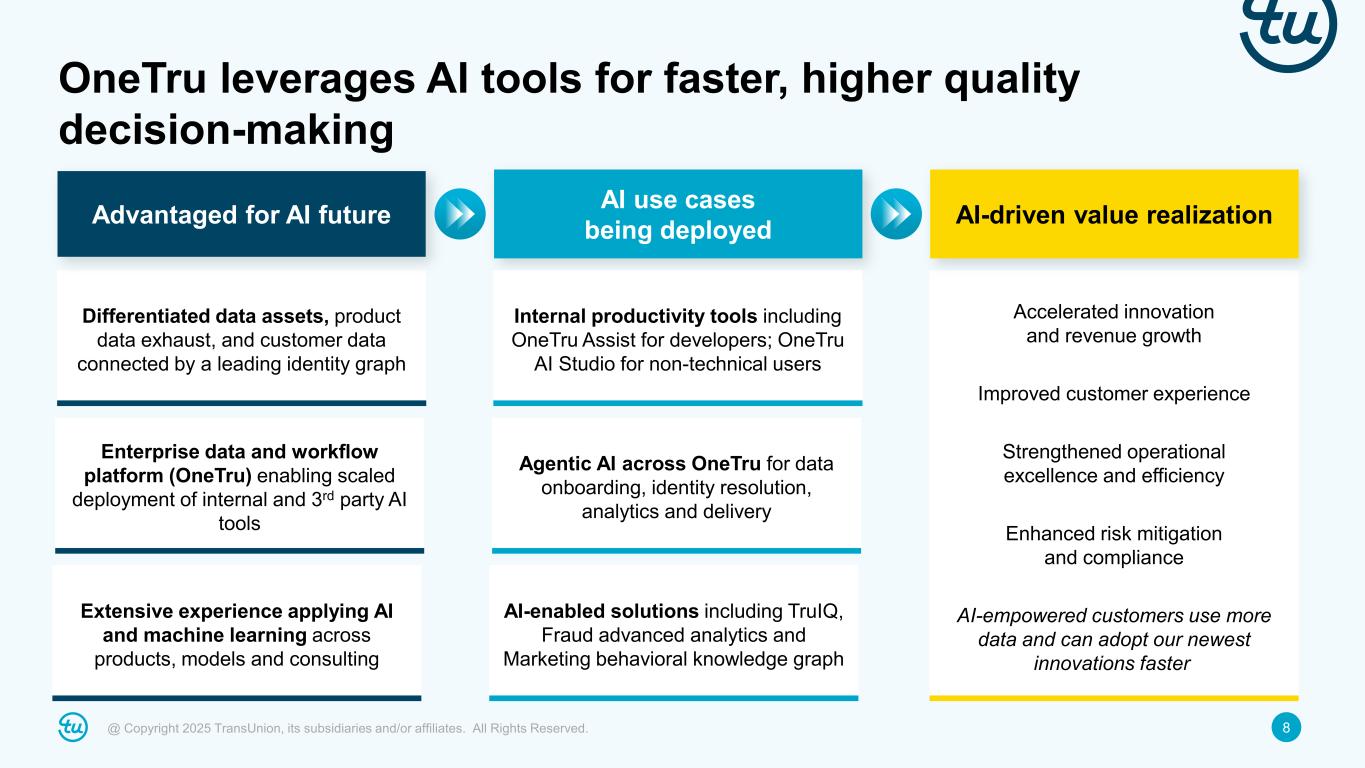
8@ Copyright 2025 TransUnion, its subsidiaries and/or affiliates. All Rights Reserved. AI use cases being deployed Differentiated data assets, product data exhaust, and customer data connected by a leading identity graph Advantaged for AI future Extensive experience applying AI and machine learning across products, models and consulting Enterprise data and workflow platform (OneTru) enabling scaled deployment of internal and 3rd party AI tools Accelerated innovation and revenue growth Improved customer experience Strengthened operational excellence and efficiency Enhanced risk mitigation and compliance AI-empowered customers use more data and can adopt our newest innovations faster AI-driven value realization Internal productivity tools including OneTru Assist for developers; OneTru AI Studio for non-technical users AI-enabled solutions including TruIQ, Fraud advanced analytics and Marketing behavioral knowledge graph Agentic AI across OneTru for data onboarding, identity resolution, analytics and delivery OneTru leverages AI tools for faster, higher quality decision-making
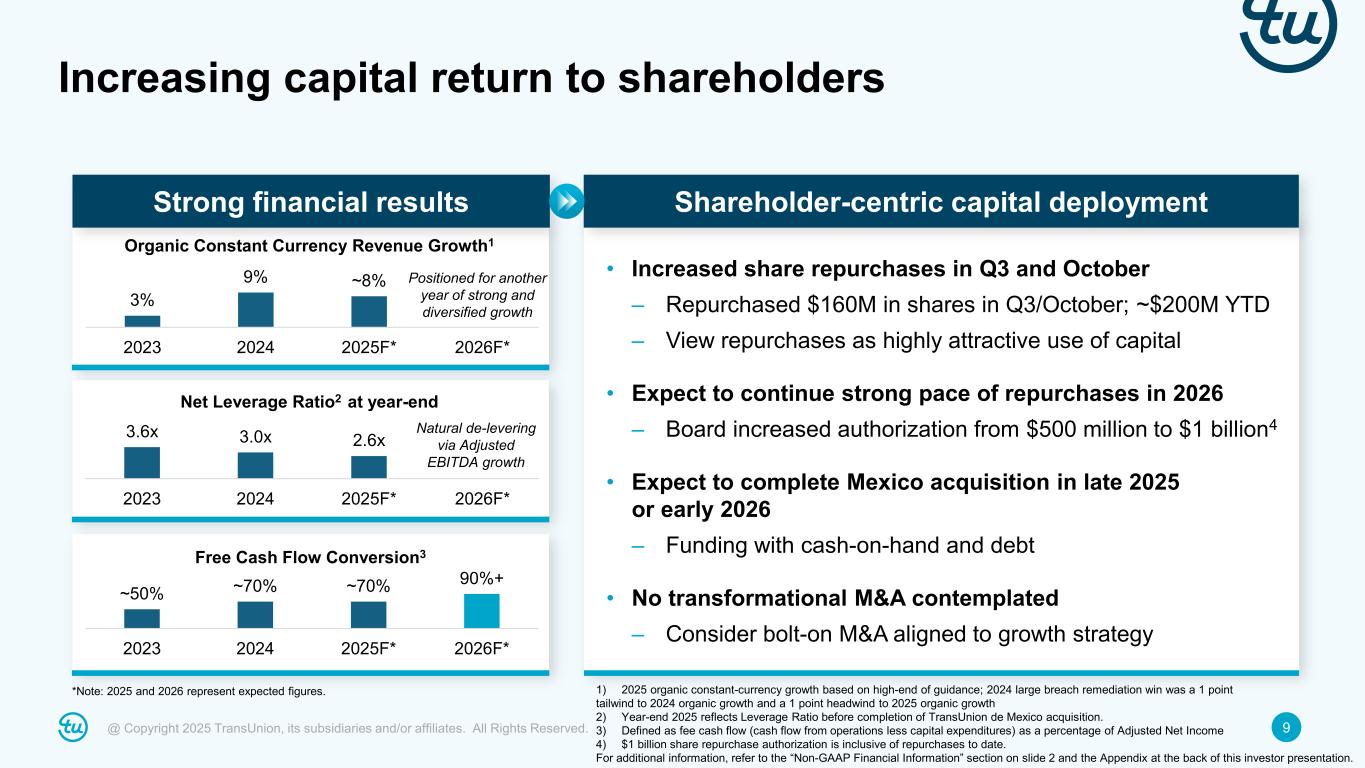
9@ Copyright 2025 TransUnion, its subsidiaries and/or affiliates. All Rights Reserved. Strong financial results • Increased share repurchases in Q3 and October – Repurchased $160M in shares in Q3/October; ~$200M YTD – View repurchases as highly attractive use of capital • Expect to continue strong pace of repurchases in 2026 – Board increased authorization from $500 million to $1 billion4 • Expect to complete Mexico acquisition in late 2025 or early 2026 – Funding with cash-on-hand and debt • No transformational M&A contemplated – Consider bolt-on M&A aligned to growth strategy 3% 9% ~8% 2023 2024 2025F* 2026F* Organic Constant Currency Revenue Growth1 3.6x 3.0x 2.6x 2023 2024 2025F* 2026F* Net Leverage Ratio2 at year-end ~50% ~70% ~70% 90%+ 2023 2024 2025F* 2026F* Free Cash Flow Conversion3 1) 2025 organic constant-currency growth based on high-end of guidance; 2024 large breach remediation win was a 1 point tailwind to 2024 organic growth and a 1 point headwind to 2025 organic growth 2) Year-end 2025 reflects Leverage Ratio before completion of TransUnion de Mexico acquisition. 3) Defined as fee cash flow (cash flow from operations less capital expenditures) as a percentage of Adjusted Net Income 4) $1 billion share repurchase authorization is inclusive of repurchases to date. For additional information, refer to the “Non-GAAP Financial Information” section on slide 2 and the Appendix at the back of this investor presentation. Shareholder-centric capital deployment Natural de-levering via Adjusted EBITDA growth Positioned for another year of strong and diversified growth Increasing capital return to shareholders *Note: 2025 and 2026 represent expected figures.
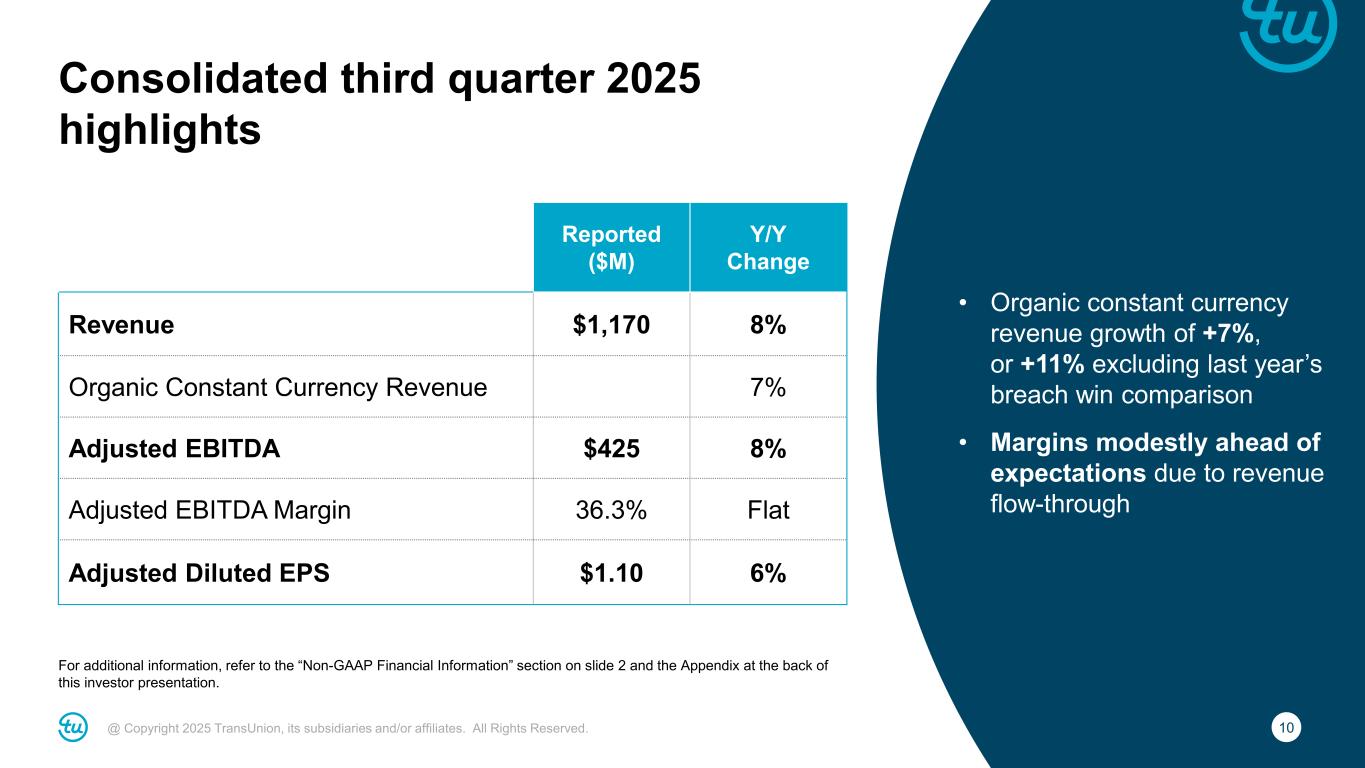
10@ Copyright 2025 TransUnion, its subsidiaries and/or affiliates. All Rights Reserved. Consolidated third quarter 2025 highlights For additional information, refer to the “Non-GAAP Financial Information” section on slide 2 and the Appendix at the back of this investor presentation. Reported ($M) Y/Y Change Revenue $1,170 8% Organic Constant Currency Revenue 7% Adjusted EBITDA $425 8% Adjusted EBITDA Margin 36.3% Flat Adjusted Diluted EPS $1.10 6% • Organic constant currency revenue growth of +7%, or +11% excluding last year’s breach win comparison • Margins modestly ahead of expectations due to revenue flow-through
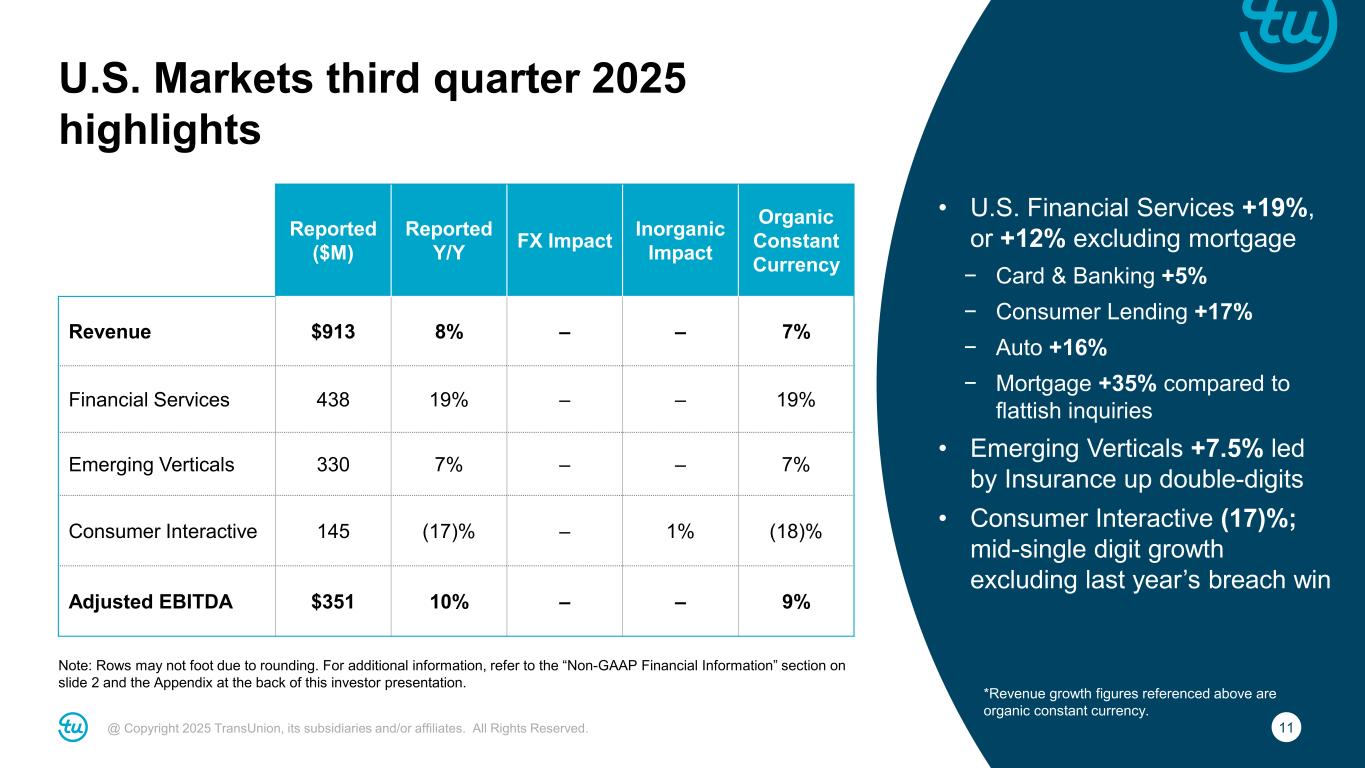
11@ Copyright 2025 TransUnion, its subsidiaries and/or affiliates. All Rights Reserved. U.S. Markets third quarter 2025 highlights Note: Rows may not foot due to rounding. For additional information, refer to the “Non-GAAP Financial Information” section on slide 2 and the Appendix at the back of this investor presentation. • U.S. Financial Services +19%, or +12% excluding mortgage − Card & Banking +5% − Consumer Lending +17% − Auto +16% − Mortgage +35% compared to flattish inquiries • Emerging Verticals +7.5% led by Insurance up double-digits • Consumer Interactive (17)%; mid-single digit growth excluding last year’s breach win Reported ($M) Reported Y/Y FX Impact Inorganic Impact Organic Constant Currency Revenue $913 8% – – 7% Financial Services 438 19% – – 19% Emerging Verticals 330 7% – – 7% Consumer Interactive 145 (17)% – 1% (18)% Adjusted EBITDA $351 10% – – 9% *Revenue growth figures referenced above are organic constant currency.
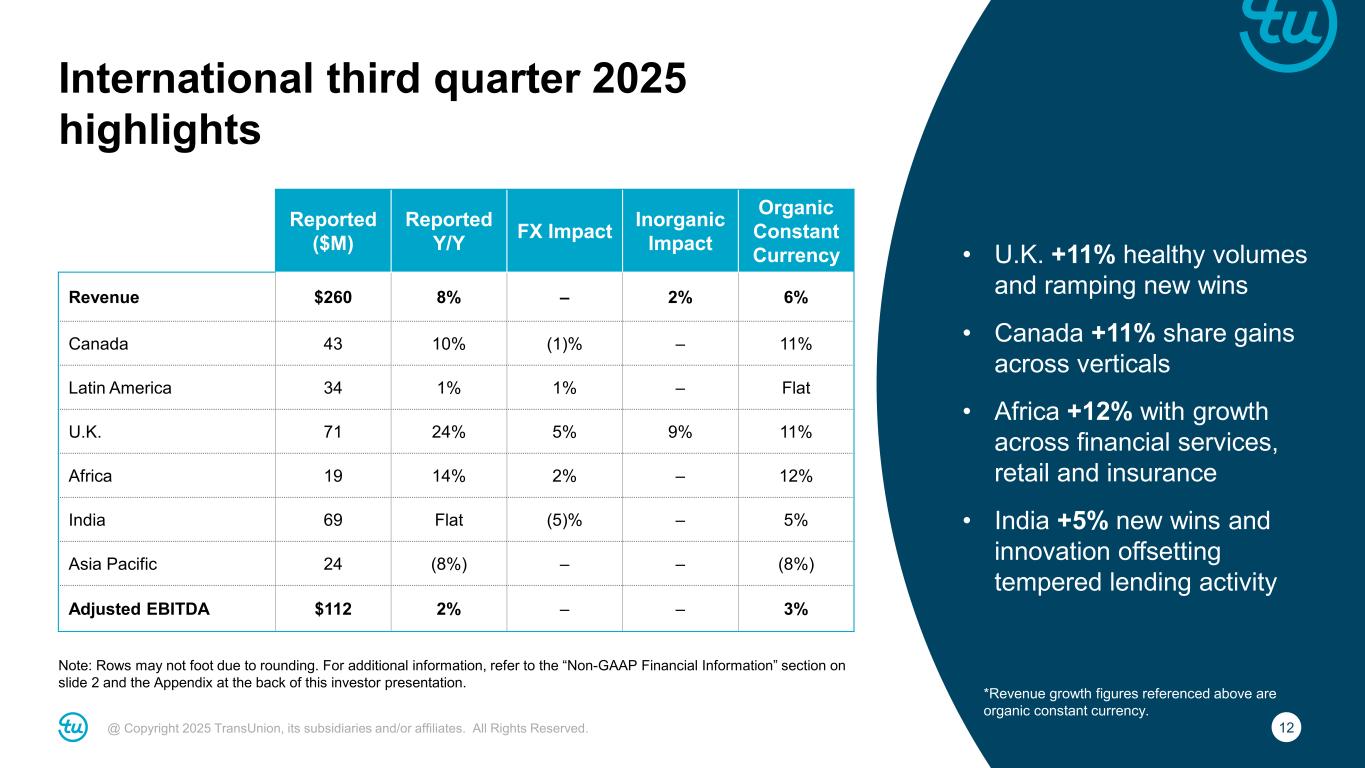
12@ Copyright 2025 TransUnion, its subsidiaries and/or affiliates. All Rights Reserved. International third quarter 2025 highlights Note: Rows may not foot due to rounding. For additional information, refer to the “Non-GAAP Financial Information” section on slide 2 and the Appendix at the back of this investor presentation. • U.K. +11% healthy volumes and ramping new wins • Canada +11% share gains across verticals • Africa +12% with growth across financial services, retail and insurance • India +5% new wins and innovation offsetting tempered lending activity Reported ($M) Reported Y/Y FX Impact Inorganic Impact Organic Constant Currency Revenue $260 8% – 2% 6% Canada 43 10% (1)% – 11% Latin America 34 1% 1% – Flat U.K. 71 24% 5% 9% 11% Africa 19 14% 2% – 12% India 69 Flat (5)% – 5% Asia Pacific 24 (8%) – – (8%) Adjusted EBITDA $112 2% – – 3% *Revenue growth figures referenced above are organic constant currency.
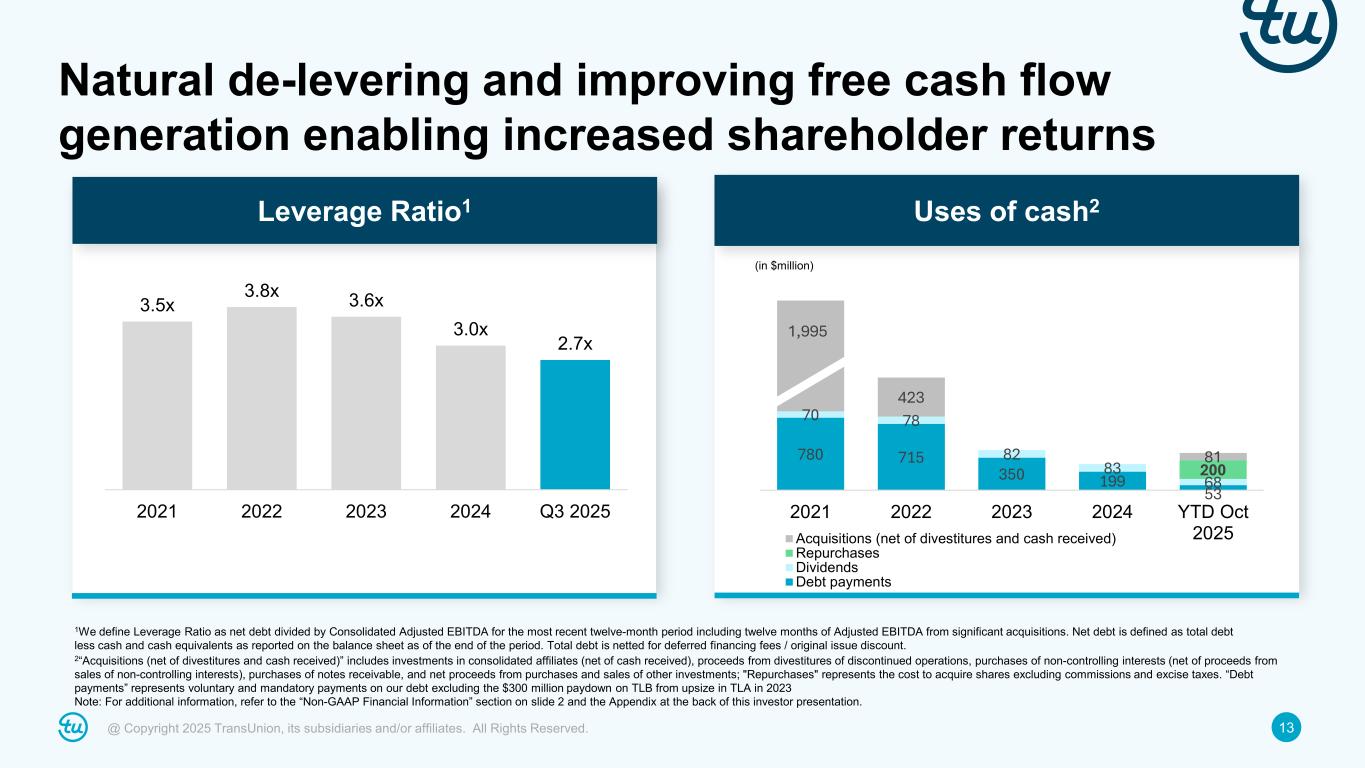
13@ Copyright 2025 TransUnion, its subsidiaries and/or affiliates. All Rights Reserved. Natural de-levering and improving free cash flow generation enabling increased shareholder returns Uses of cash2 Leverage Ratio1 1We define Leverage Ratio as net debt divided by Consolidated Adjusted EBITDA for the most recent twelve-month period including twelve months of Adjusted EBITDA from significant acquisitions. Net debt is defined as total debt less cash and cash equivalents as reported on the balance sheet as of the end of the period. Total debt is netted for deferred financing fees / original issue discount. 2“Acquisitions (net of divestitures and cash received)” includes investments in consolidated affiliates (net of cash received), proceeds from divestitures of discontinued operations, purchases of non-controlling interests (net of proceeds from sales of non-controlling interests), purchases of notes receivable, and net proceeds from purchases and sales of other investments; "Repurchases" represents the cost to acquire shares excluding commissions and excise taxes. “Debt payments” represents voluntary and mandatory payments on our debt excluding the $300 million paydown on TLB from upsize in TLA in 2023 Note: For additional information, refer to the “Non-GAAP Financial Information” section on slide 2 and the Appendix at the back of this investor presentation. 3.5x 3.8x 3.6x 3.0x 2.7x 2021 2022 2023 2024 Q3 2025 780 715 350 199 53 70 78 82 83 68 200 1,995 423 81 2021 2022 2023 2024 YTD Oct 2025Acquisitions (net of divestitures and cash received) Repurchases Dividends Debt payments (in $million)
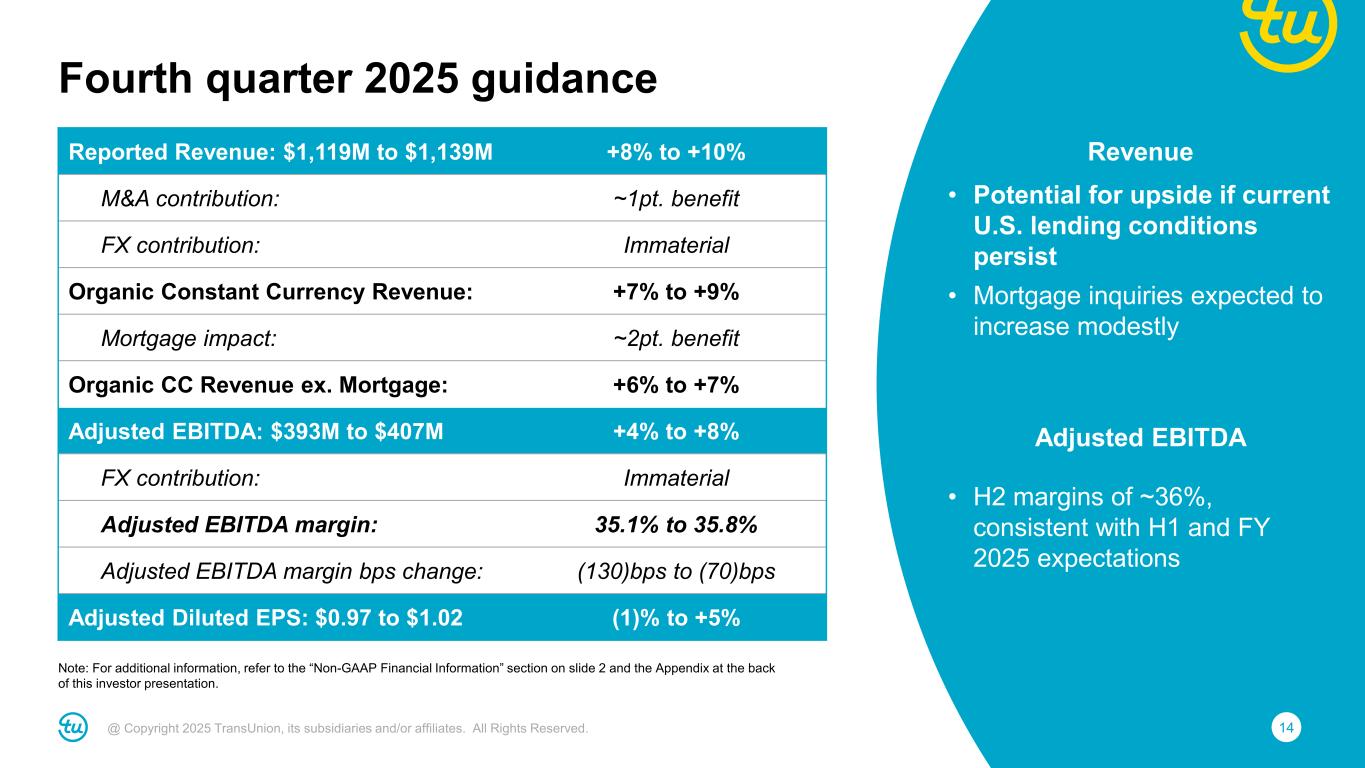
14@ Copyright 2025 TransUnion, its subsidiaries and/or affiliates. All Rights Reserved. Reported Revenue: $1,119M to $1,139M +8% to +10% M&A contribution: ~1pt. benefit FX contribution: Immaterial Organic Constant Currency Revenue: +7% to +9% Mortgage impact: ~2pt. benefit Organic CC Revenue ex. Mortgage: +6% to +7% Adjusted EBITDA: $393M to $407M +4% to +8% FX contribution: Immaterial Adjusted EBITDA margin: 35.1% to 35.8% Adjusted EBITDA margin bps change: (130)bps to (70)bps Adjusted Diluted EPS: $0.97 to $1.02 (1)% to +5% Fourth quarter 2025 guidance Note: For additional information, refer to the “Non-GAAP Financial Information” section on slide 2 and the Appendix at the back of this investor presentation. Revenue • Potential for upside if current U.S. lending conditions persist • Mortgage inquiries expected to increase modestly Adjusted EBITDA • H2 margins of ~36%, consistent with H1 and FY 2025 expectations
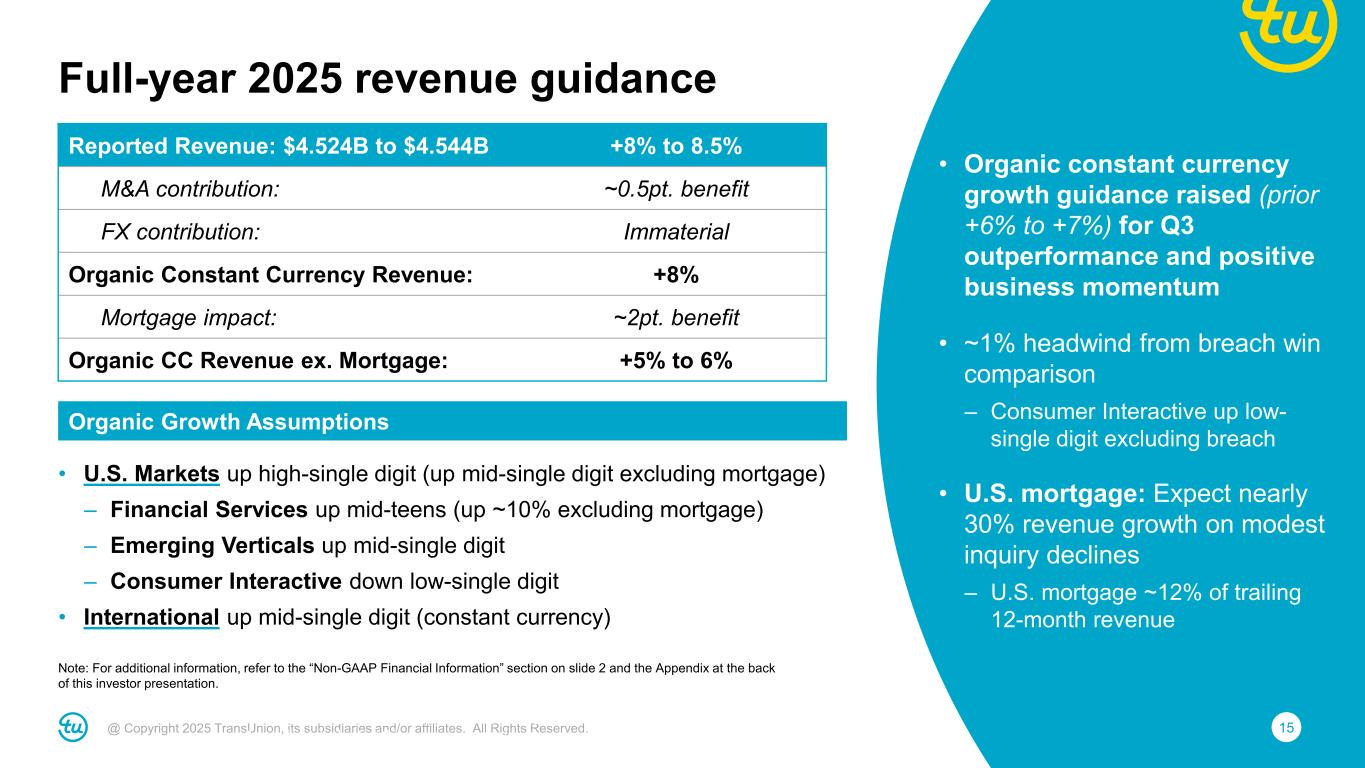
15@ Copyright 2025 TransUnion, its subsidiaries and/or affiliates. All Rights Reserved. • Organic constant currency growth guidance raised (prior +6% to +7%) for Q3 outperformance and positive business momentum • ~1% headwind from breach win comparison – Consumer Interactive up low- single digit excluding breach • U.S. mortgage: Expect nearly 30% revenue growth on modest inquiry declines – U.S. mortgage ~12% of trailing 12-month revenue Note: For additional information, refer to the “Non-GAAP Financial Information” section on slide 2 and the Appendix at the back of this investor presentation. Full-year 2025 revenue guidance Reported Revenue: $4.524B to $4.544B +8% to 8.5% M&A contribution: ~0.5pt. benefit FX contribution: Immaterial Organic Constant Currency Revenue: +8% Mortgage impact: ~2pt. benefit Organic CC Revenue ex. Mortgage: +5% to 6% Organic Growth Assumptions • U.S. Markets up high-single digit (up mid-single digit excluding mortgage) – Financial Services up mid-teens (up ~10% excluding mortgage) – Emerging Verticals up mid-single digit – Consumer Interactive down low-single digit • International up mid-single digit (constant currency) Note: For additional information, refer to the “Non-GAAP Financial Information” section on slide 2 and the Appendix at the back of this investor presentation.
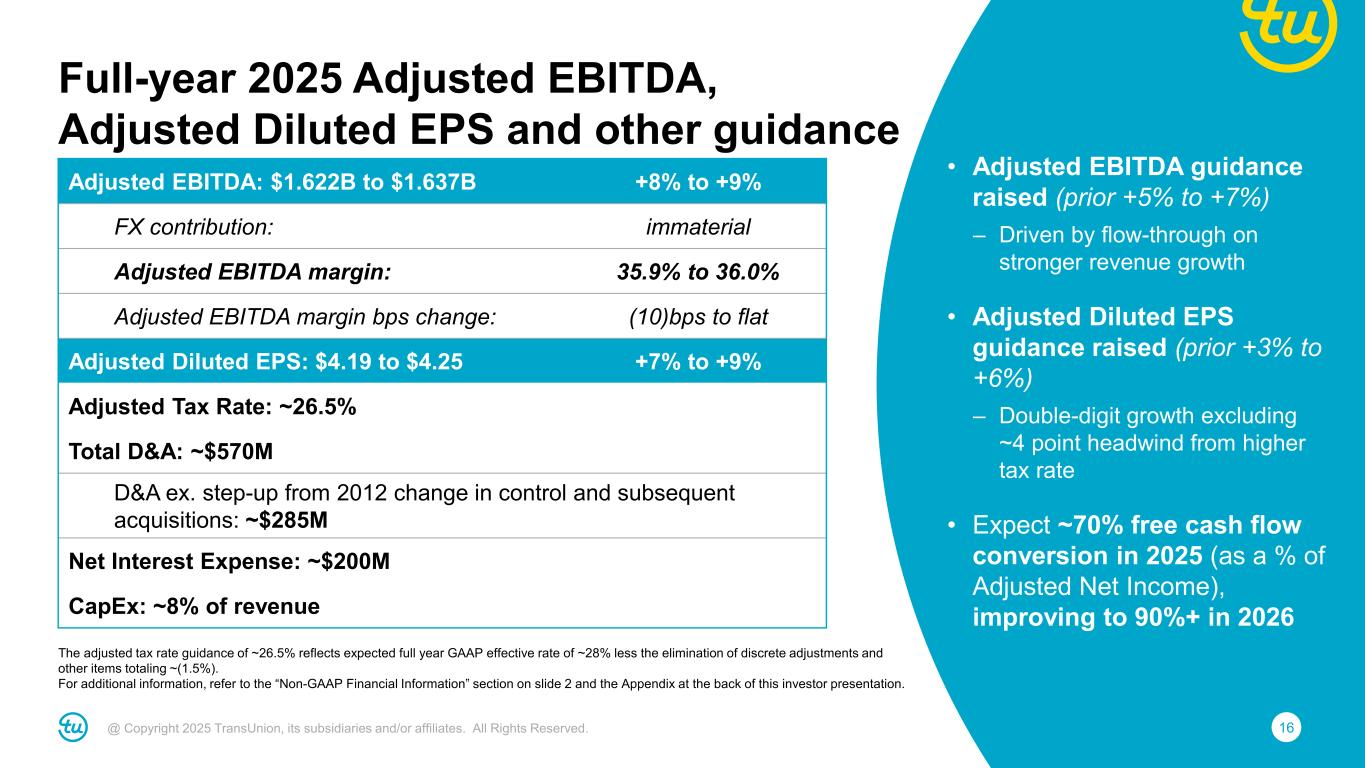
16@ Copyright 2025 TransUnion, its subsidiaries and/or affiliates. All Rights Reserved. The adjusted tax rate guidance of ~26.5% reflects expected full year GAAP effective rate of ~28% less the elimination of discrete adjustments and other items totaling ~(1.5%). For additional information, refer to the “Non-GAAP Financial Information” section on slide 2 and the Appendix at the back of this investor presentation. Full-year 2025 Adjusted EBITDA, Adjusted Diluted EPS and other guidance Adjusted EBITDA: $1.622B to $1.637B +8% to +9% FX contribution: immaterial Adjusted EBITDA margin: 35.9% to 36.0% Adjusted EBITDA margin bps change: (10)bps to flat Adjusted Diluted EPS: $4.19 to $4.25 +7% to +9% Adjusted Tax Rate: ~26.5% Total D&A: ~$570M D&A ex. step-up from 2012 change in control and subsequent acquisitions: ~$285M Net Interest Expense: ~$200M CapEx: ~8% of revenue • Adjusted EBITDA guidance raised (prior +5% to +7%) – Driven by flow-through on stronger revenue growth • Adjusted Diluted EPS guidance raised (prior +3% to +6%) – Double-digit growth excluding ~4 point headwind from higher tax rate • Expect ~70% free cash flow conversion in 2025 (as a % of Adjusted Net Income), improving to 90%+ in 2026
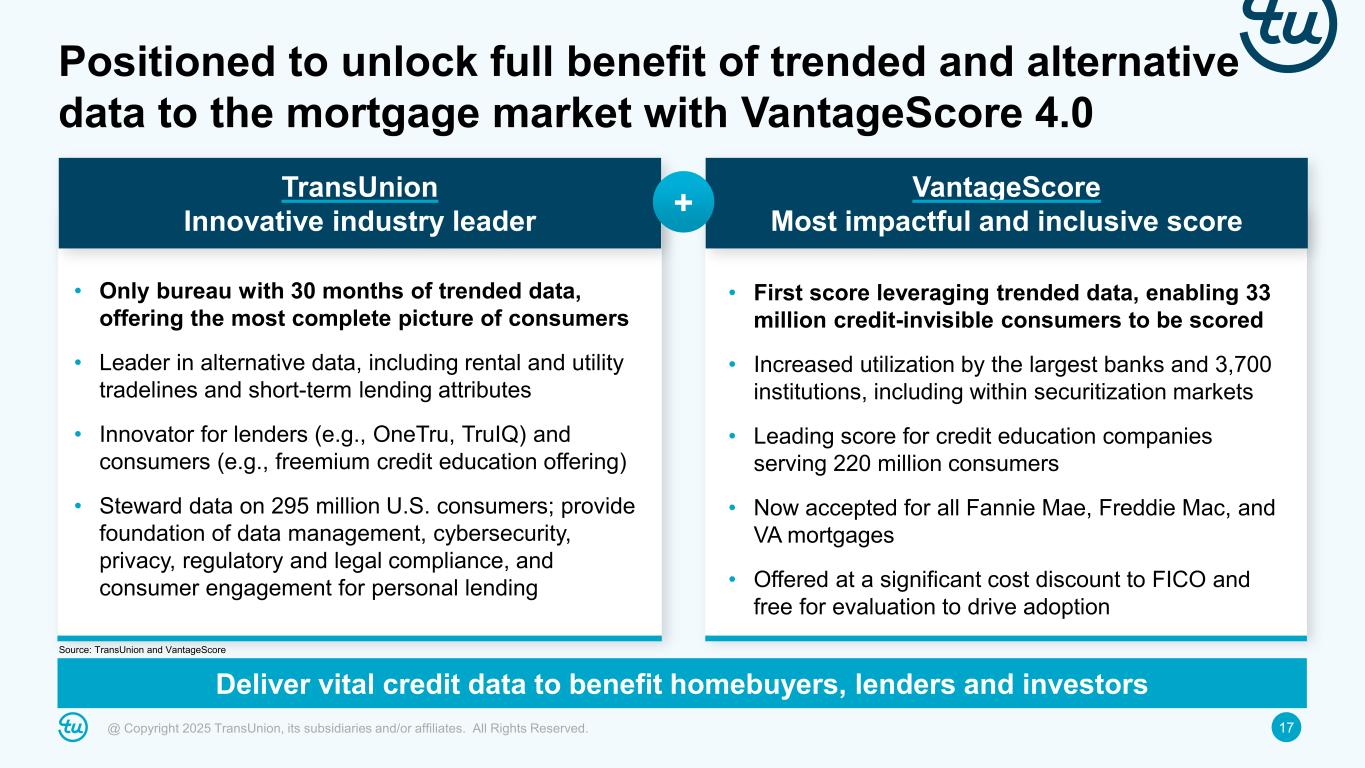
17@ Copyright 2025 TransUnion, its subsidiaries and/or affiliates. All Rights Reserved. • Only bureau with 30 months of trended data, offering the most complete picture of consumers • Leader in alternative data, including rental and utility tradelines and short-term lending attributes • Innovator for lenders (e.g., OneTru, TruIQ) and consumers (e.g., freemium credit education offering) • Steward data on 295 million U.S. consumers; provide foundation of data management, cybersecurity, privacy, regulatory and legal compliance, and consumer engagement for personal lending • First score leveraging trended data, enabling 33 million credit-invisible consumers to be scored • Increased utilization by the largest banks and 3,700 institutions, including within securitization markets • Leading score for credit education companies serving 220 million consumers • Now accepted for all Fannie Mae, Freddie Mac, and VA mortgages • Offered at a significant cost discount to FICO and free for evaluation to drive adoption TransUnion Innovative industry leader VantageScore Most impactful and inclusive score Positioned to unlock full benefit of trended and alternative data to the mortgage market with VantageScore 4.0 + Deliver vital credit data to benefit homebuyers, lenders and investors Source: TransUnion and VantageScore
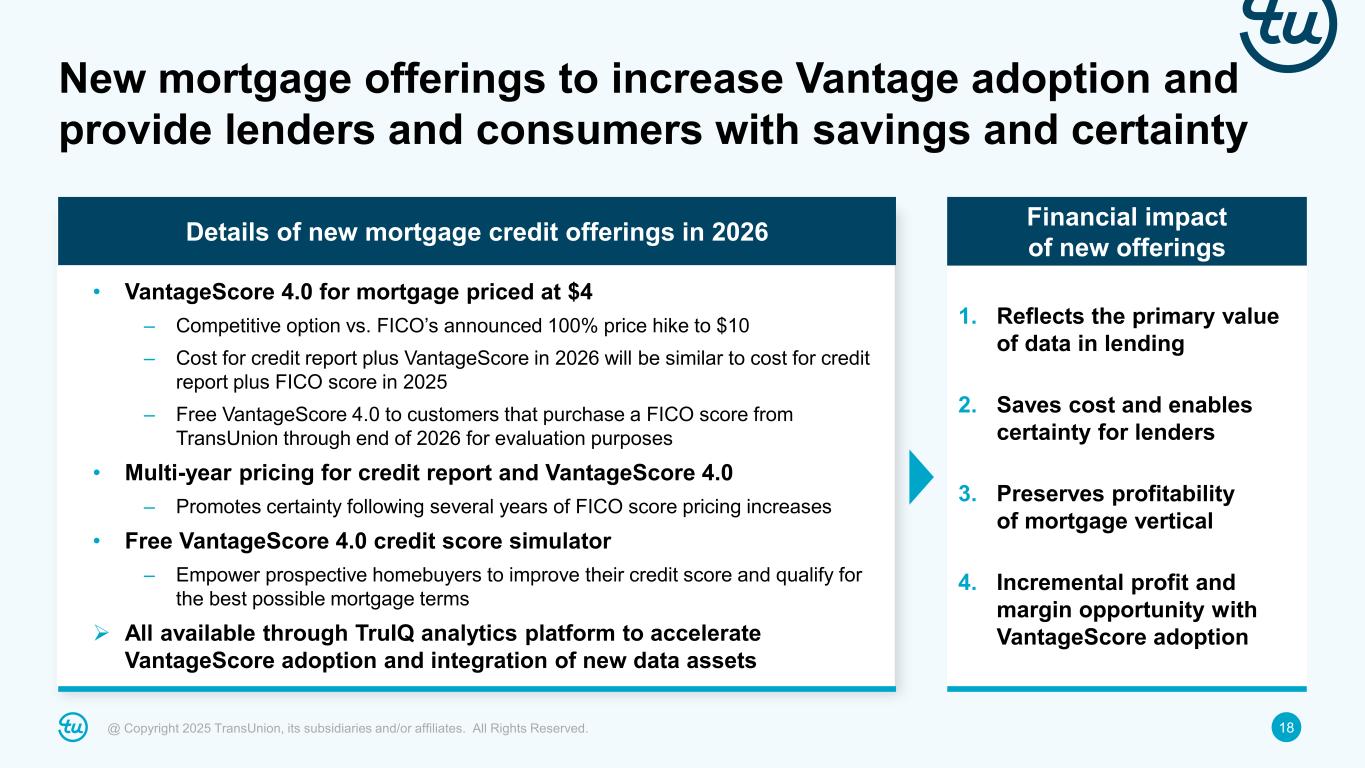
18@ Copyright 2025 TransUnion, its subsidiaries and/or affiliates. All Rights Reserved. • VantageScore 4.0 for mortgage priced at $4 – Competitive option vs. FICO’s announced 100% price hike to $10 – Cost for credit report plus VantageScore in 2026 will be similar to cost for credit report plus FICO score in 2025 – Free VantageScore 4.0 to customers that purchase a FICO score from TransUnion through end of 2026 for evaluation purposes • Multi-year pricing for credit report and VantageScore 4.0 – Promotes certainty following several years of FICO score pricing increases • Free VantageScore 4.0 credit score simulator – Empower prospective homebuyers to improve their credit score and qualify for the best possible mortgage terms All available through TruIQ analytics platform to accelerate VantageScore adoption and integration of new data assets New mortgage offerings to increase Vantage adoption and provide lenders and consumers with savings and certainty Financial impact of new offeringsDetails of new mortgage credit offerings in 2026 1. Reflects the primary value of data in lending 2. Saves cost and enables certainty for lenders 3. Preserves profitability of mortgage vertical 4. Incremental profit and margin opportunity with VantageScore adoption
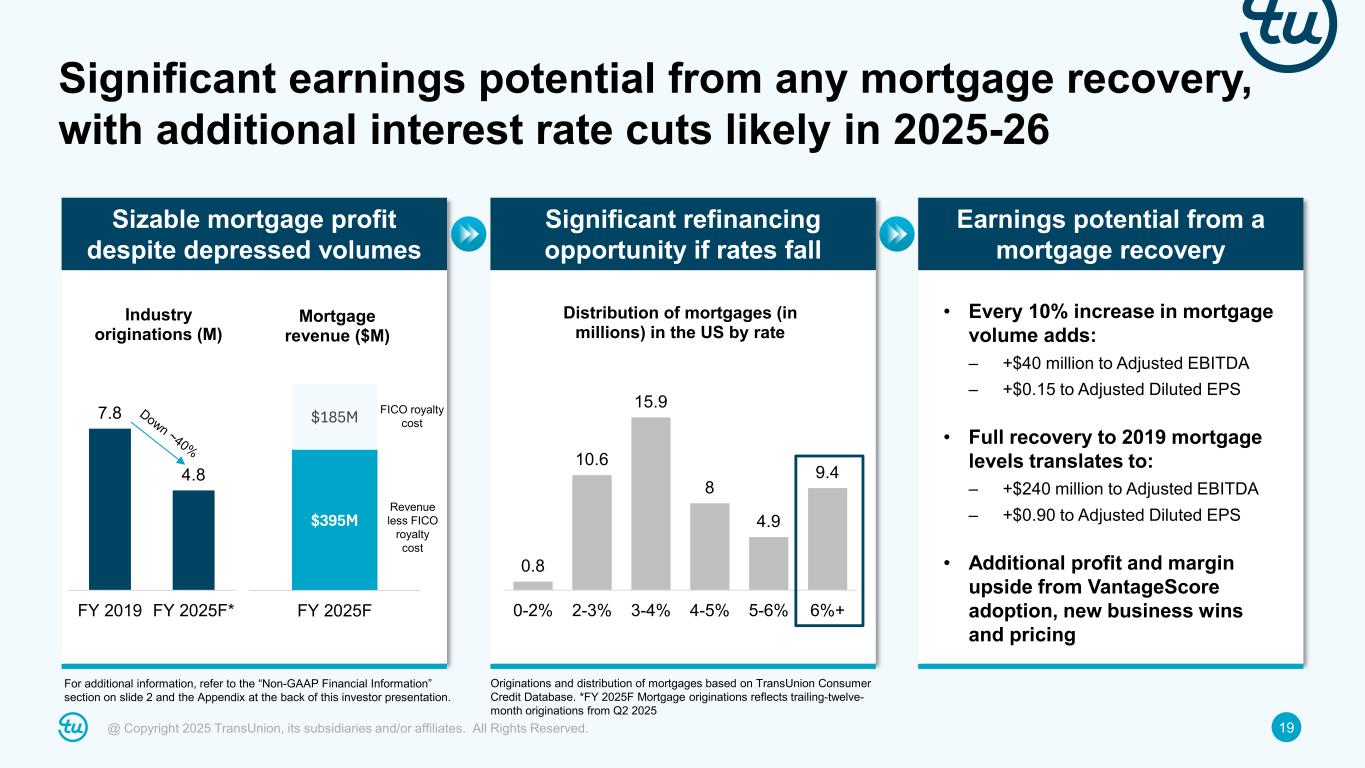
19@ Copyright 2025 TransUnion, its subsidiaries and/or affiliates. All Rights Reserved. Significant earnings potential from any mortgage recovery, with additional interest rate cuts likely in 2025-26 Sizable mortgage profit despite depressed volumes Originations and distribution of mortgages based on TransUnion Consumer Credit Database. *FY 2025F Mortgage originations reflects trailing-twelve- month originations from Q2 2025 7.8 4.8 FY 2019 FY 2025F* Industry originations (M) $395M $185M FY 2025F Mortgage revenue ($M) Significant refinancing opportunity if rates fall 0.8 10.6 15.9 8 4.9 9.4 0-2% 2-3% 3-4% 4-5% 5-6% 6%+ Distribution of mortgages (in millions) in the US by rate Earnings potential from a mortgage recovery • Every 10% increase in mortgage volume adds: – +$40 million to Adjusted EBITDA – +$0.15 to Adjusted Diluted EPS • Full recovery to 2019 mortgage levels translates to: – +$240 million to Adjusted EBITDA – +$0.90 to Adjusted Diluted EPS • Additional profit and margin upside from VantageScore adoption, new business wins and pricing FICO royalty cost Revenue less FICO royalty cost For additional information, refer to the “Non-GAAP Financial Information” section on slide 2 and the Appendix at the back of this investor presentation.
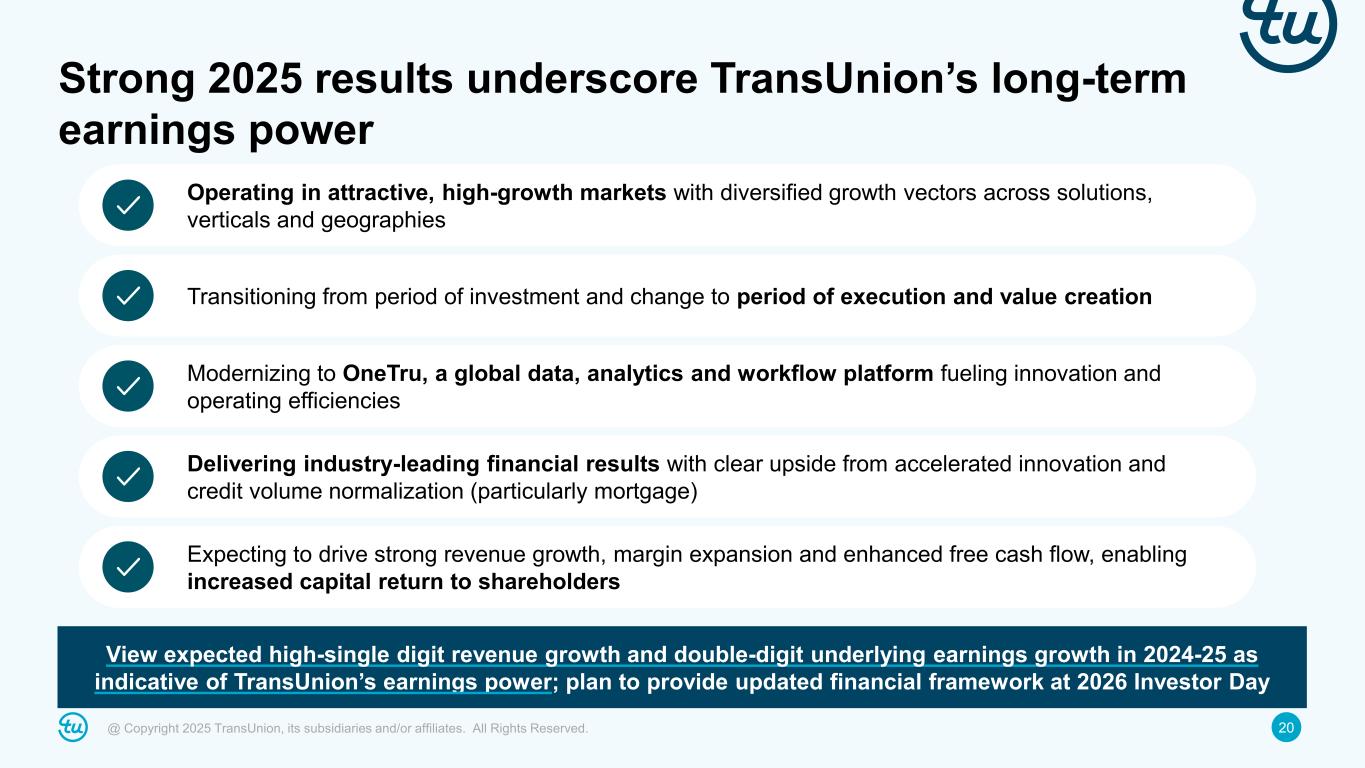
20@ Copyright 2025 TransUnion, its subsidiaries and/or affiliates. All Rights Reserved. Strong 2025 results underscore TransUnion’s long-term earnings power Operating in attractive, high-growth markets with diversified growth vectors across solutions, verticals and geographies Transitioning from period of investment and change to period of execution and value creation Modernizing to OneTru, a global data, analytics and workflow platform fueling innovation and operating efficiencies Delivering industry-leading financial results with clear upside from accelerated innovation and credit volume normalization (particularly mortgage) Expecting to drive strong revenue growth, margin expansion and enhanced free cash flow, enabling increased capital return to shareholders View expected high-single digit revenue growth and double-digit underlying earnings growth in 2024-25 as indicative of TransUnion’s earnings power; plan to provide updated financial framework at 2026 Investor Day

21@ Copyright 2025 TransUnion, its subsidiaries and/or affiliates. All Rights Reserved. Q&A
22@ Copyright 2025 TransUnion, its subsidiaries and/or affiliates. All Rights Reserved. Appendices and Non-GAAP Reconciliations
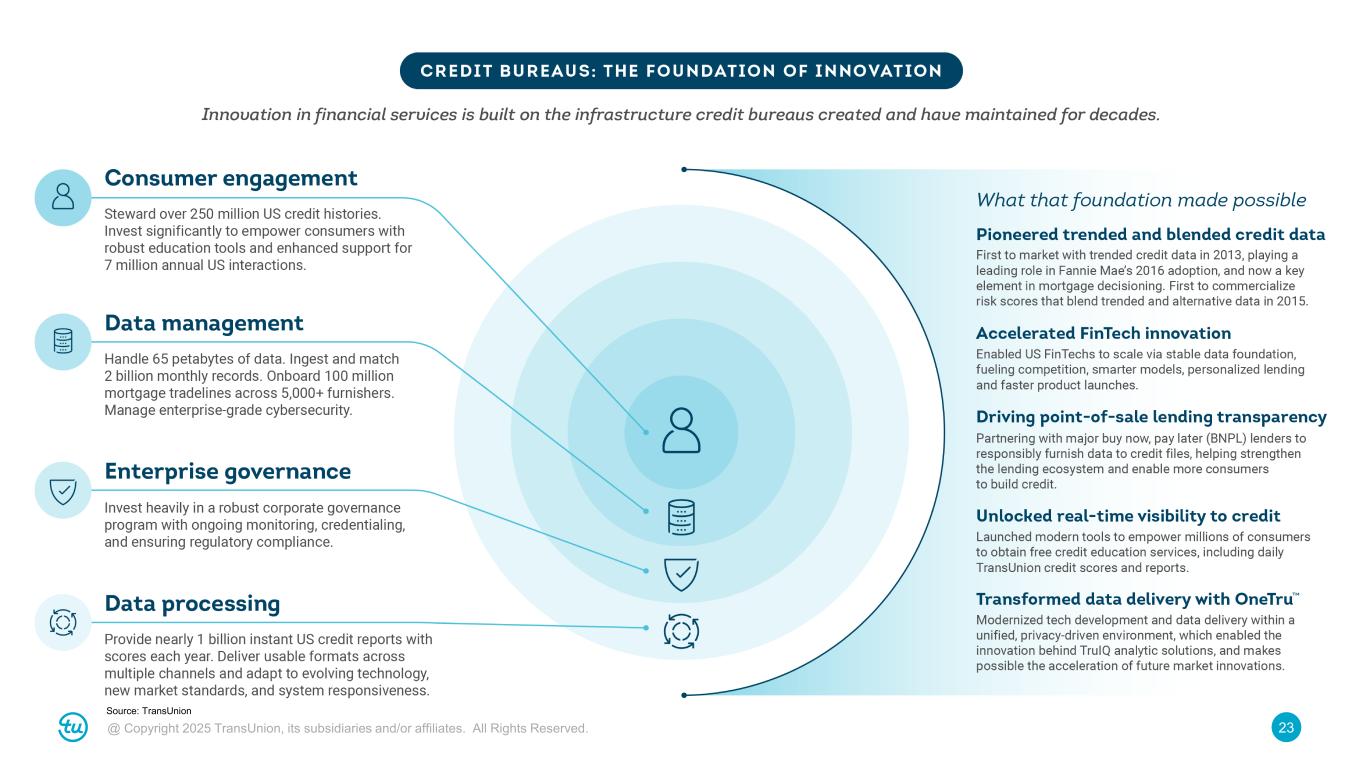
23@ Copyright 2025 TransUnion, its subsidiaries and/or affiliates. All Rights Reserved. Source: TransUnion
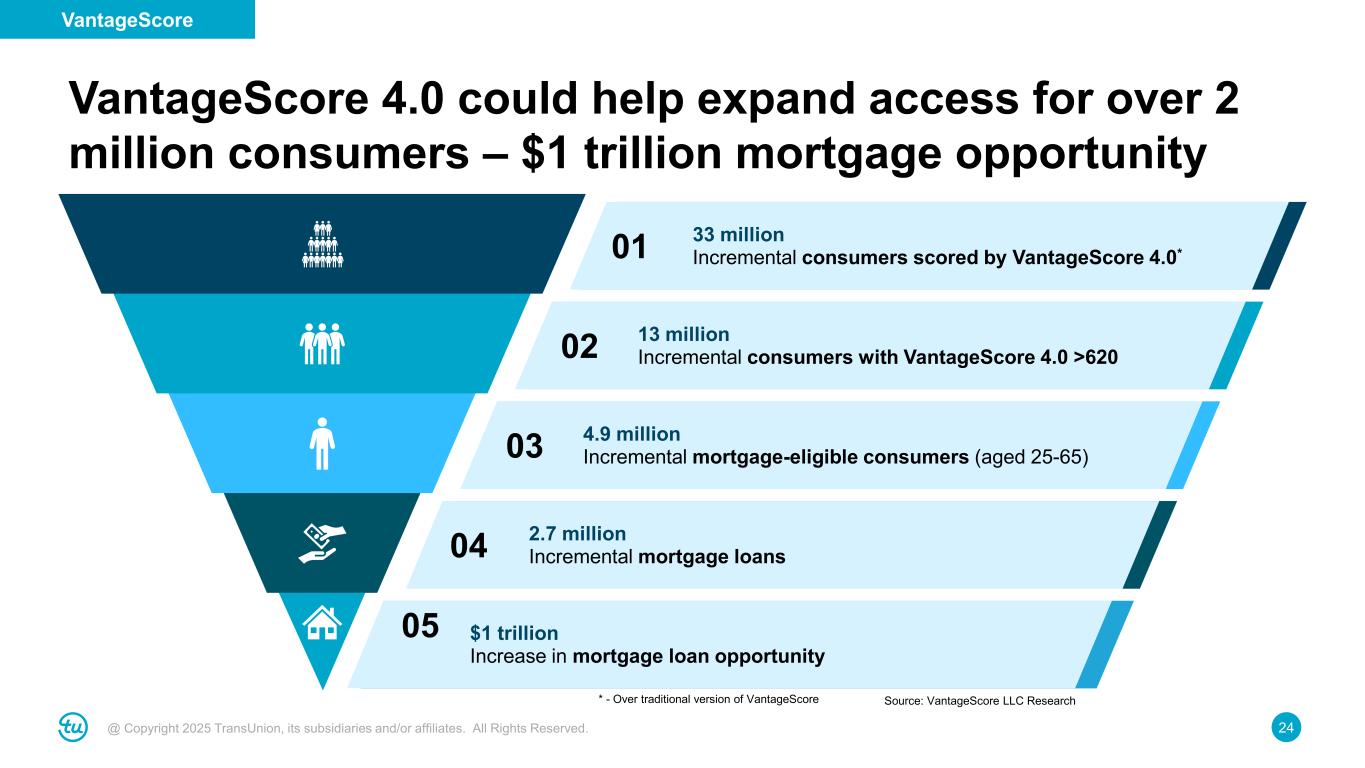
24@ Copyright 2025 TransUnion, its subsidiaries and/or affiliates. All Rights Reserved. VantageScore 4.0 could help expand access for over 2 million consumers – $1 trillion mortgage opportunity 33 million Incremental consumers scored by VantageScore 4.0* 13 million Incremental consumers with VantageScore 4.0 >620 4.9 million Incremental mortgage-eligible consumers (aged 25-65) 2.7 million Incremental mortgage loans $1 trillion Increase in mortgage loan opportunity 01 02 03 04 05 Source: VantageScore LLC Research* - Over traditional version of VantageScore VantageScore
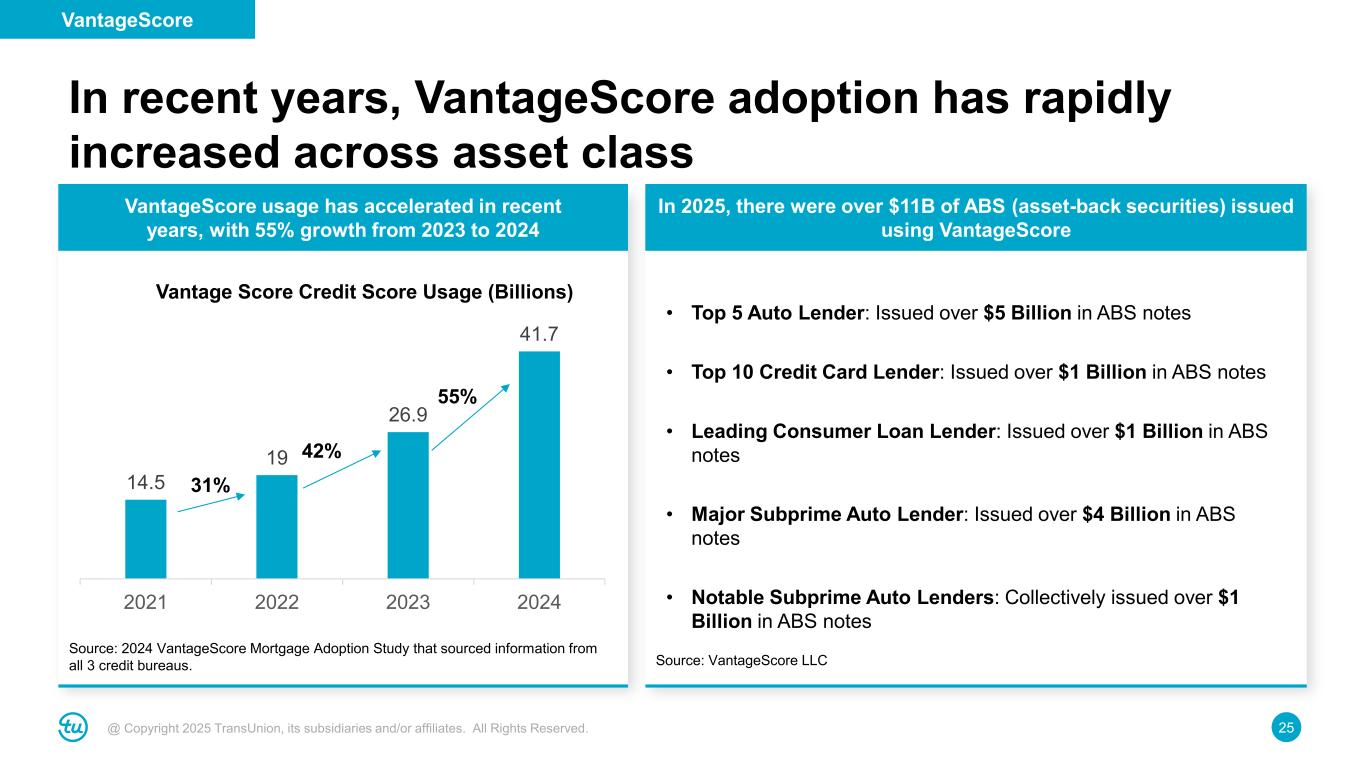
25@ Copyright 2025 TransUnion, its subsidiaries and/or affiliates. All Rights Reserved. In recent years, VantageScore adoption has rapidly increased across asset class VantageScore usage has accelerated in recent years, with 55% growth from 2023 to 2024 In 2025, there were over $11B of ABS (asset-back securities) issued using VantageScore 14.5 19 26.9 41.7 2021 2022 2023 2024 Vantage Score Credit Score Usage (Billions) 31% 42% 55% Source: 2024 VantageScore Mortgage Adoption Study that sourced information from all 3 credit bureaus. Source: VantageScore LLC • Top 5 Auto Lender: Issued over $5 Billion in ABS notes • Top 10 Credit Card Lender: Issued over $1 Billion in ABS notes • Leading Consumer Loan Lender: Issued over $1 Billion in ABS notes • Major Subprime Auto Lender: Issued over $4 Billion in ABS notes • Notable Subprime Auto Lenders: Collectively issued over $1 Billion in ABS notes VantageScore
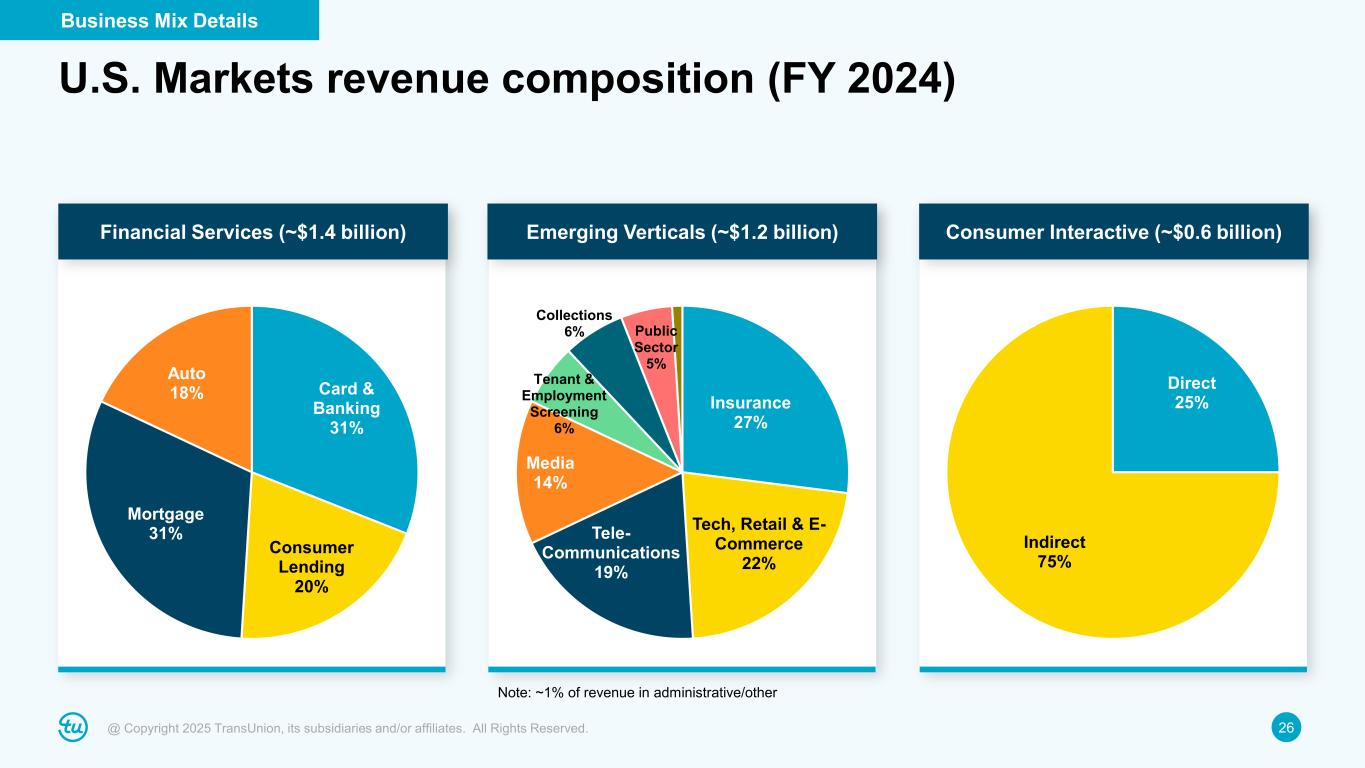
26@ Copyright 2025 TransUnion, its subsidiaries and/or affiliates. All Rights Reserved. U.S. Markets revenue composition (FY 2024) Card & Banking 31% Consumer Lending 20% Mortgage 31% Auto 18% Insurance 27% Tech, Retail & E- Commerce 22% Tele- Communications 19% Media 14% Tenant & Employment Screening 6% Collections 6% Public Sector 5% Direct 25% Indirect 75% Note: ~1% of revenue in administrative/other Financial Services (~$1.4 billion) Emerging Verticals (~$1.2 billion) Consumer Interactive (~$0.6 billion) Business Mix Details
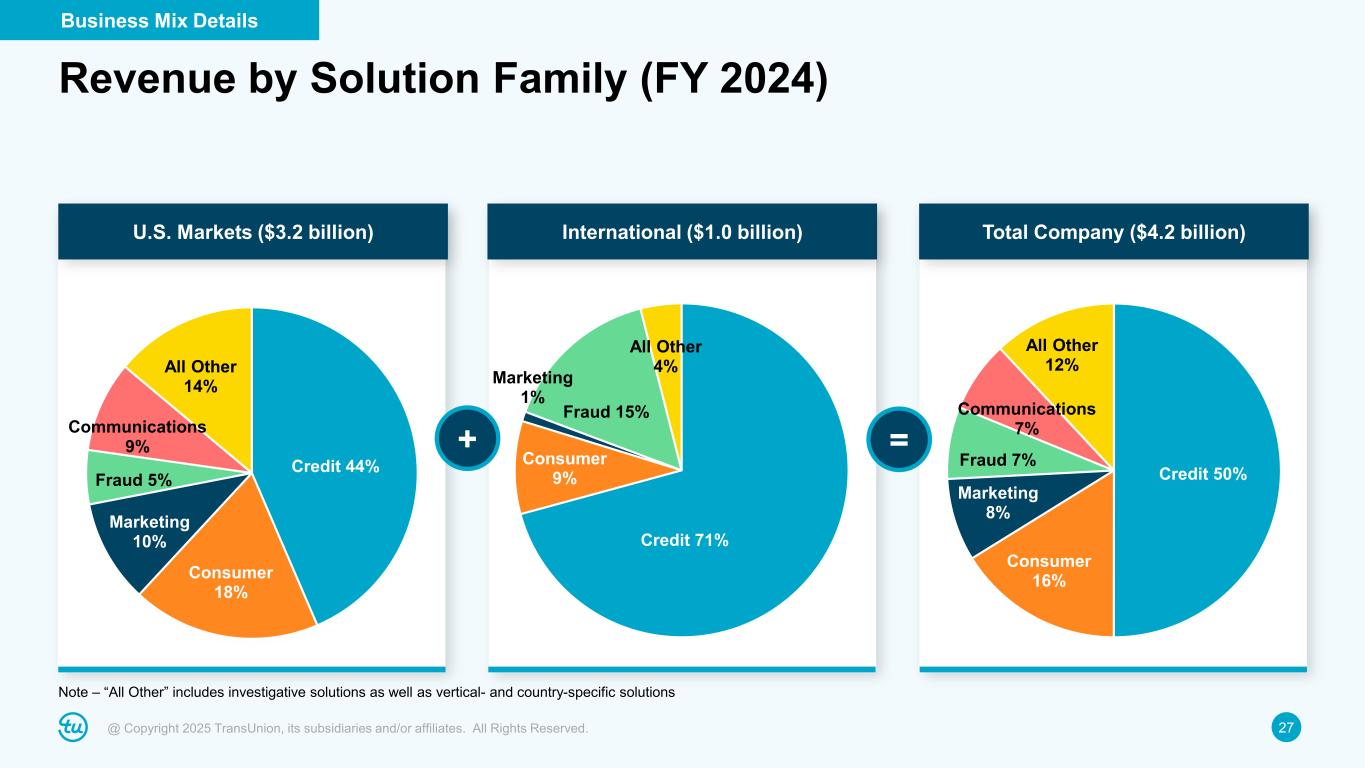
27@ Copyright 2025 TransUnion, its subsidiaries and/or affiliates. All Rights Reserved. Credit 50% Consumer 16% Marketing 8% Fraud 7% Communications 7% All Other 12% Credit 44% Consumer 18% Marketing 10% Fraud 5% Communications 9% All Other 14% Credit 71% Consumer 9% Marketing 1% Fraud 15% All Other 4% Note – “All Other” includes investigative solutions as well as vertical- and country-specific solutions + = U.S. Markets ($3.2 billion) International ($1.0 billion) Total Company ($4.2 billion) Revenue by Solution Family (FY 2024) Business Mix Details
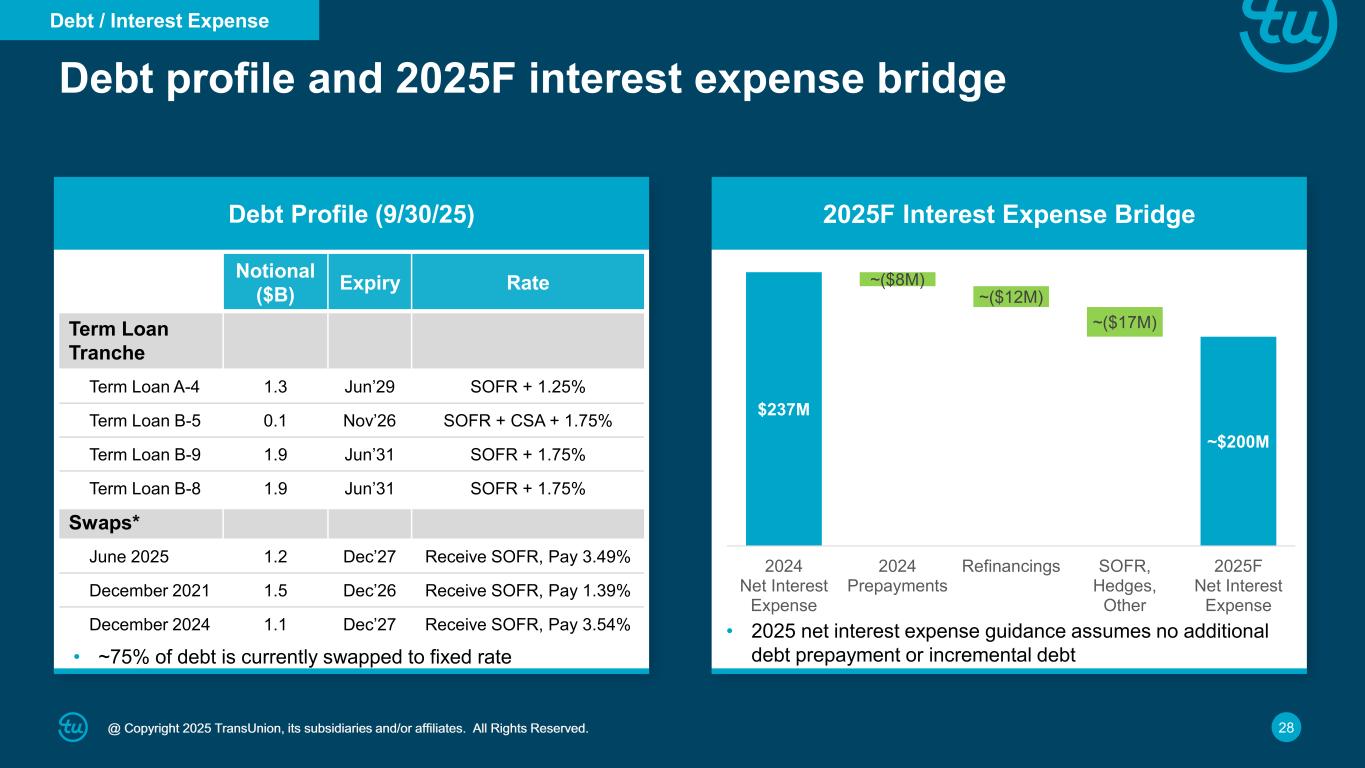
28@ Copyright 2025 TransUnion, its subsidiaries and/or affiliates. All Rights Reserved. Debt profile and 2025F interest expense bridge Debt Profile (9/30/25) 2025F Interest Expense Bridge Notional ($B) Expiry Rate Term Loan Tranche Term Loan A-4 1.3 Jun’29 SOFR + 1.25% Term Loan B-5 0.1 Nov’26 SOFR + CSA + 1.75% Term Loan B-9 1.9 Jun’31 SOFR + 1.75% Term Loan B-8 1.9 Jun’31 SOFR + 1.75% Swaps* June 2025 1.2 Dec’27 Receive SOFR, Pay 3.49% December 2021 1.5 Dec’26 Receive SOFR, Pay 1.39% December 2024 1.1 Dec’27 Receive SOFR, Pay 3.54% • ~75% of debt is currently swapped to fixed rate • 2025 net interest expense guidance assumes no additional debt prepayment or incremental debt $237M ~$200M ~($8M) ~($12M) ~($17M) 2024 Net Interest Expense 2024 Prepayments Refinancings SOFR, Hedges, Other 2025F Net Interest Expense Debt / Interest Expense
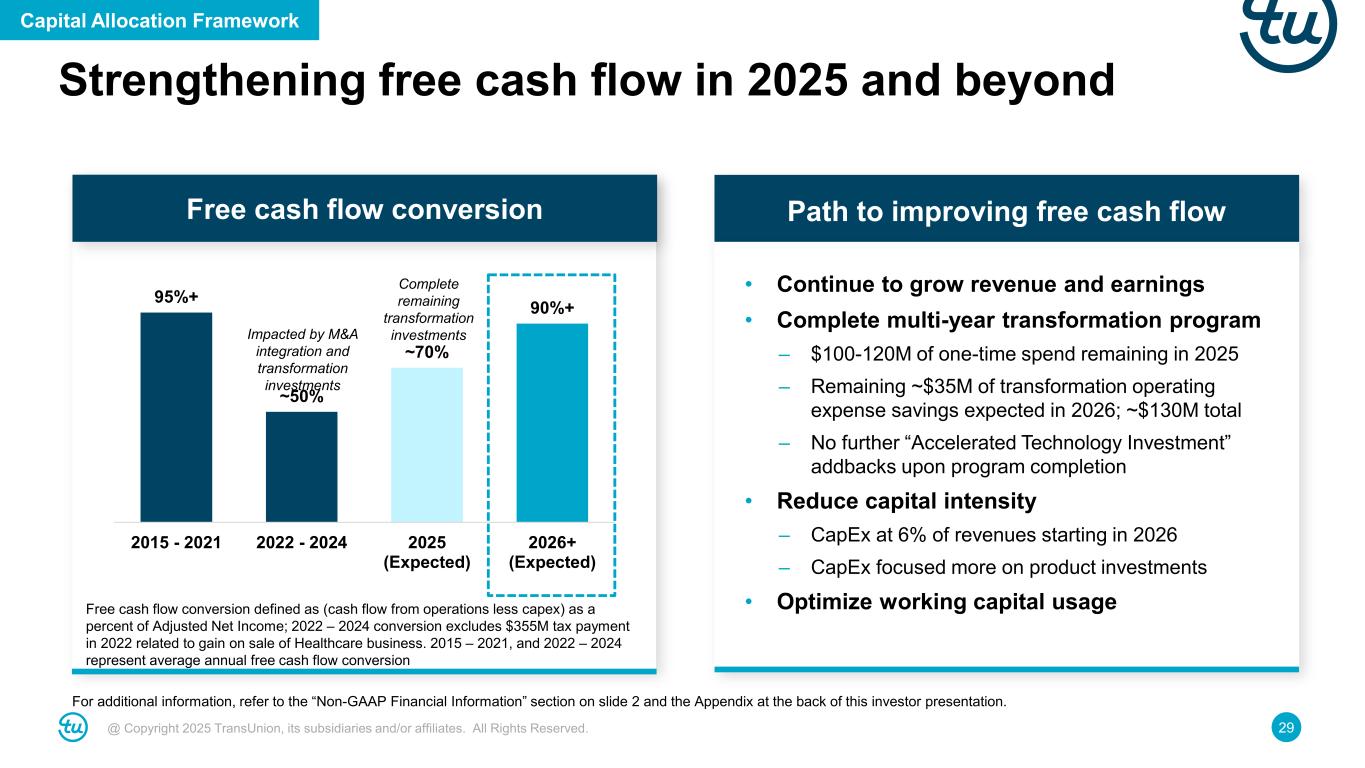
29@ Copyright 2025 TransUnion, its subsidiaries and/or affiliates. All Rights Reserved. Strengthening free cash flow in 2025 and beyond For additional information, refer to the “Non-GAAP Financial Information” section on slide 2 and the Appendix at the back of this investor presentation. Path to improving free cash flow Free cash flow conversion defined as (cash flow from operations less capex) as a percent of Adjusted Net Income; 2022 – 2024 conversion excludes $355M tax payment in 2022 related to gain on sale of Healthcare business. 2015 – 2021, and 2022 – 2024 represent average annual free cash flow conversion • Continue to grow revenue and earnings • Complete multi-year transformation program – $100-120M of one-time spend remaining in 2025 – Remaining ~$35M of transformation operating expense savings expected in 2026; ~$130M total – No further “Accelerated Technology Investment” addbacks upon program completion • Reduce capital intensity – CapEx at 6% of revenues starting in 2026 – CapEx focused more on product investments • Optimize working capital usage Capital Allocation Framework Free cash flow conversion Impacted by M&A integration and transformation investments Complete remaining transformation investments 95%+ ~50% ~70% 90%+ 2015 - 2021 2022 - 2024 2025 (Expected) 2026+ (Expected)
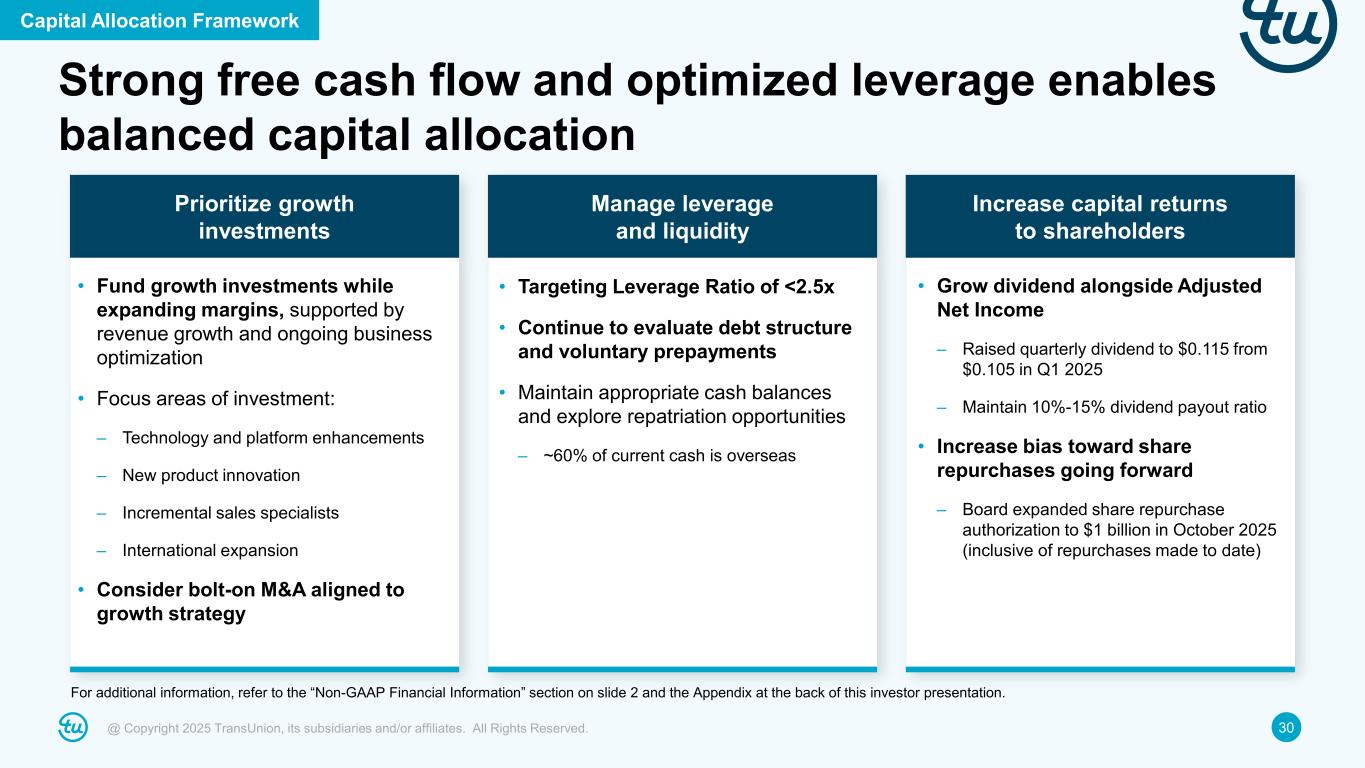
30@ Copyright 2025 TransUnion, its subsidiaries and/or affiliates. All Rights Reserved. Strong free cash flow and optimized leverage enables balanced capital allocation Capital Allocation Framework For additional information, refer to the “Non-GAAP Financial Information” section on slide 2 and the Appendix at the back of this investor presentation. Prioritize growth investments • Fund growth investments while expanding margins, supported by revenue growth and ongoing business optimization • Focus areas of investment: – Technology and platform enhancements – New product innovation – Incremental sales specialists – International expansion • Consider bolt-on M&A aligned to growth strategy Manage leverage and liquidity • Targeting Leverage Ratio of <2.5x • Continue to evaluate debt structure and voluntary prepayments • Maintain appropriate cash balances and explore repatriation opportunities – ~60% of current cash is overseas Increase capital returns to shareholders • Grow dividend alongside Adjusted Net Income – Raised quarterly dividend to $0.115 from $0.105 in Q1 2025 – Maintain 10%-15% dividend payout ratio • Increase bias toward share repurchases going forward – Board expanded share repurchase authorization to $1 billion in October 2025 (inclusive of repurchases made to date)
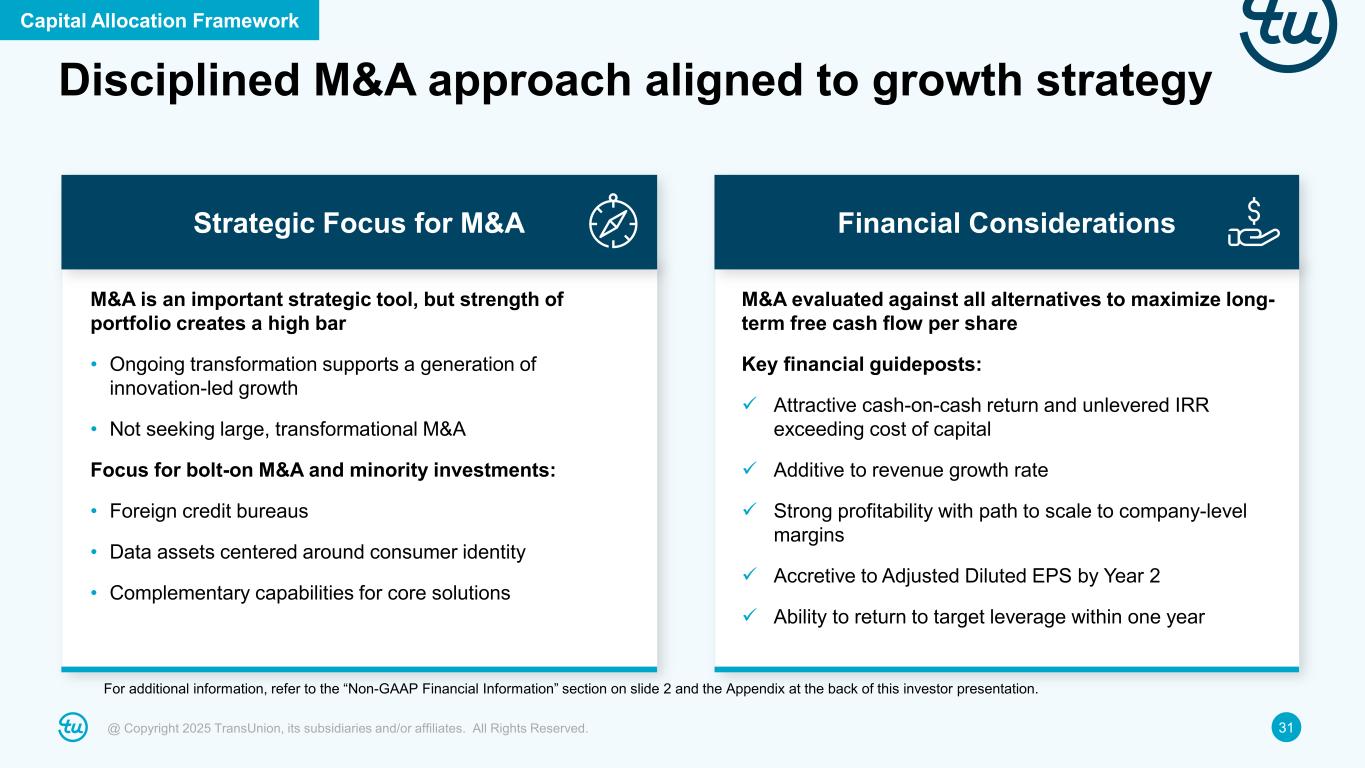
31@ Copyright 2025 TransUnion, its subsidiaries and/or affiliates. All Rights Reserved. Disciplined M&A approach aligned to growth strategy Strategic Focus for M&A M&A is an important strategic tool, but strength of portfolio creates a high bar • Ongoing transformation supports a generation of innovation-led growth • Not seeking large, transformational M&A Focus for bolt-on M&A and minority investments: • Foreign credit bureaus • Data assets centered around consumer identity • Complementary capabilities for core solutions Capital Allocation Framework For additional information, refer to the “Non-GAAP Financial Information” section on slide 2 and the Appendix at the back of this investor presentation. Financial Considerations M&A evaluated against all alternatives to maximize long- term free cash flow per share Key financial guideposts: Attractive cash-on-cash return and unlevered IRR exceeding cost of capital Additive to revenue growth rate Strong profitability with path to scale to company-level margins Accretive to Adjusted Diluted EPS by Year 2 Ability to return to target leverage within one year
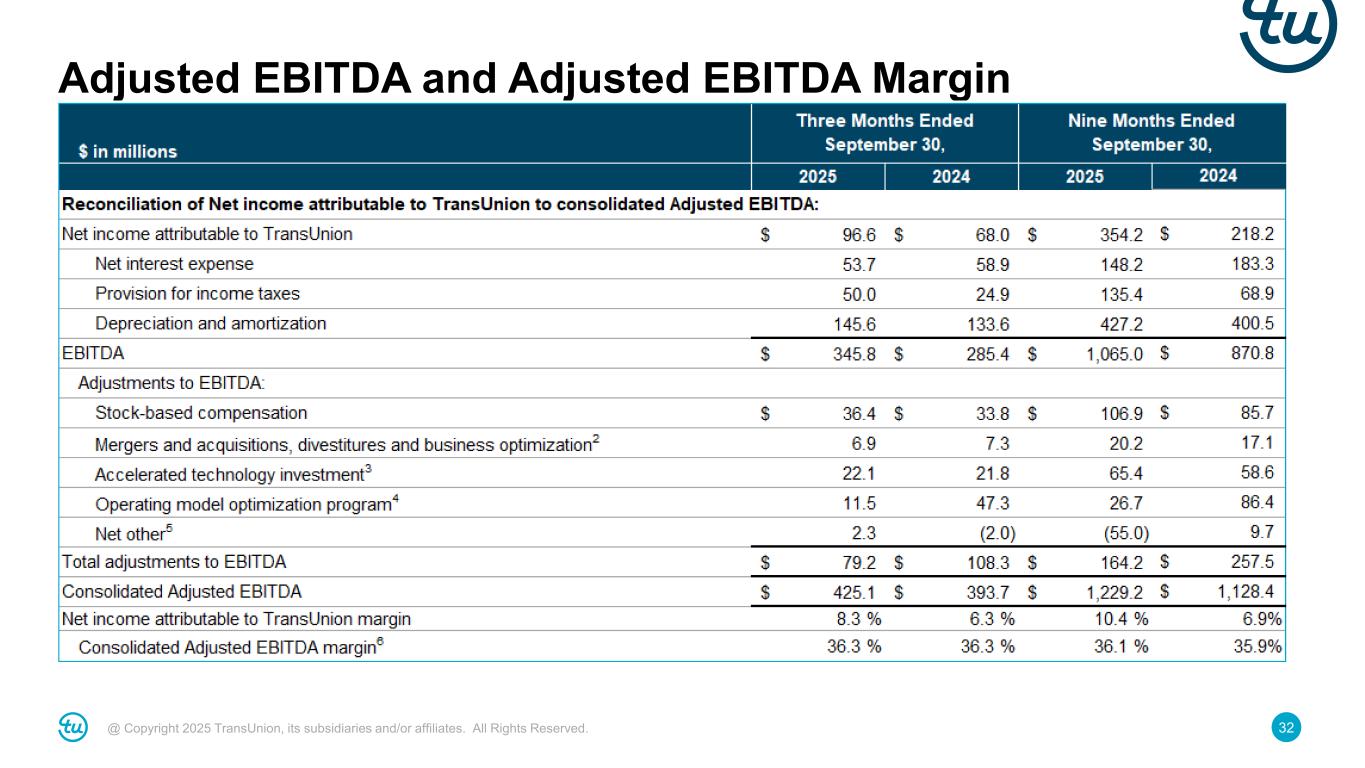
32@ Copyright 2025 TransUnion, its subsidiaries and/or affiliates. All Rights Reserved. Adjusted EBITDA and Adjusted EBITDA Margin
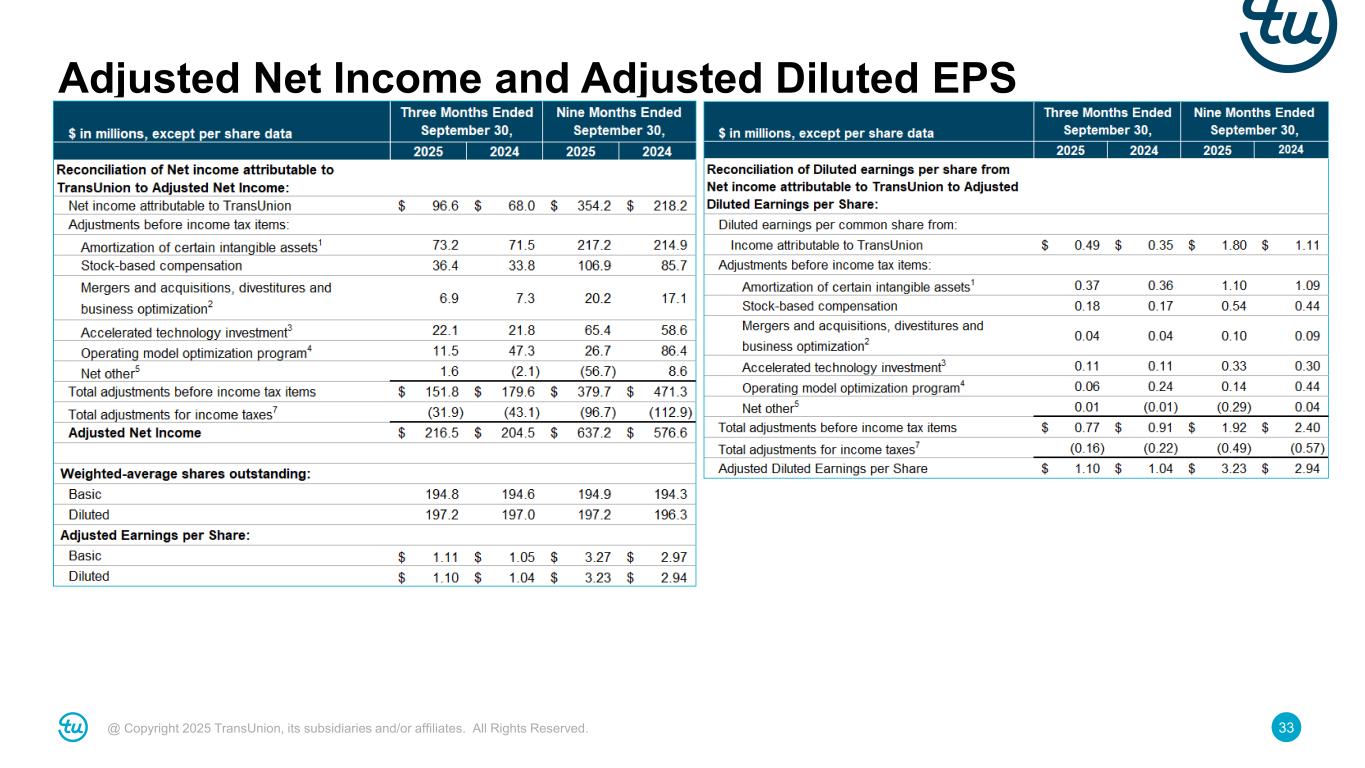
33@ Copyright 2025 TransUnion, its subsidiaries and/or affiliates. All Rights Reserved. Adjusted Net Income and Adjusted Diluted EPS
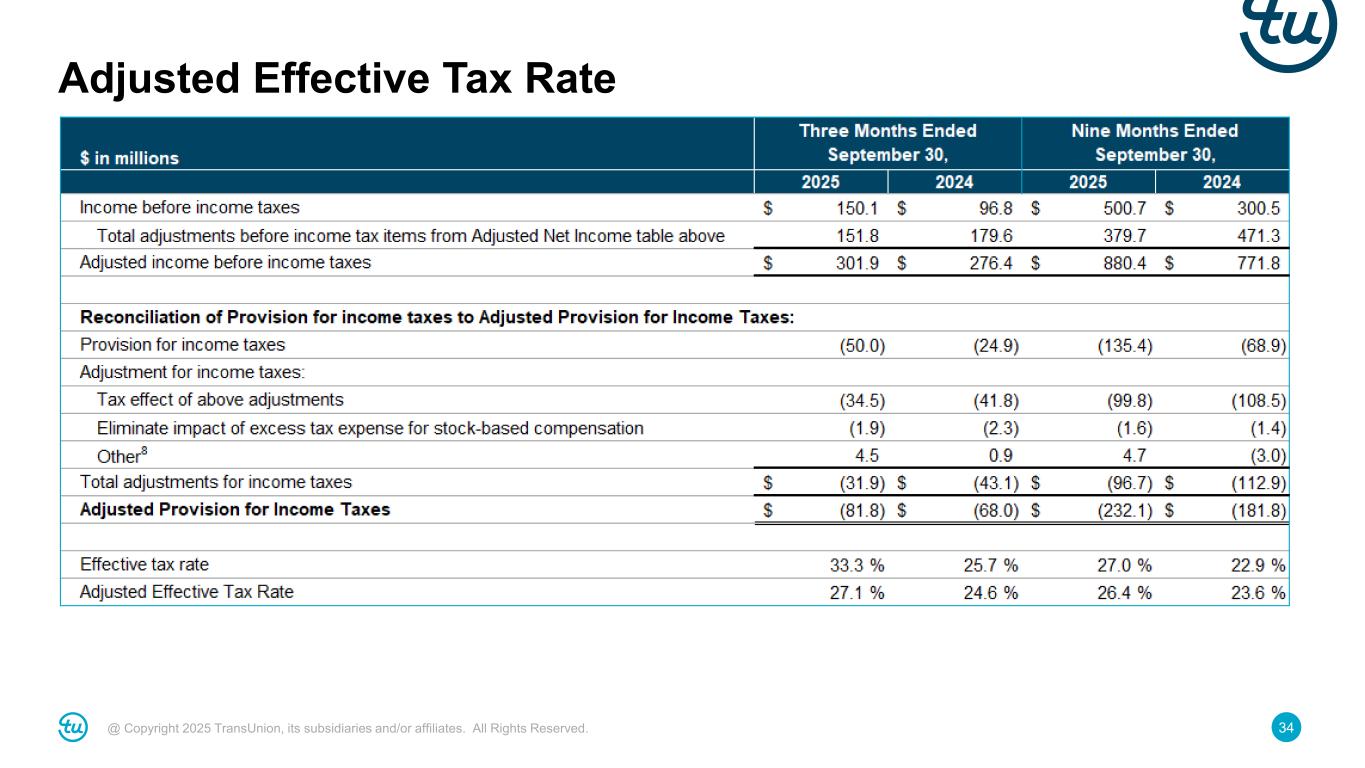
34@ Copyright 2025 TransUnion, its subsidiaries and/or affiliates. All Rights Reserved. Adjusted Effective Tax Rate
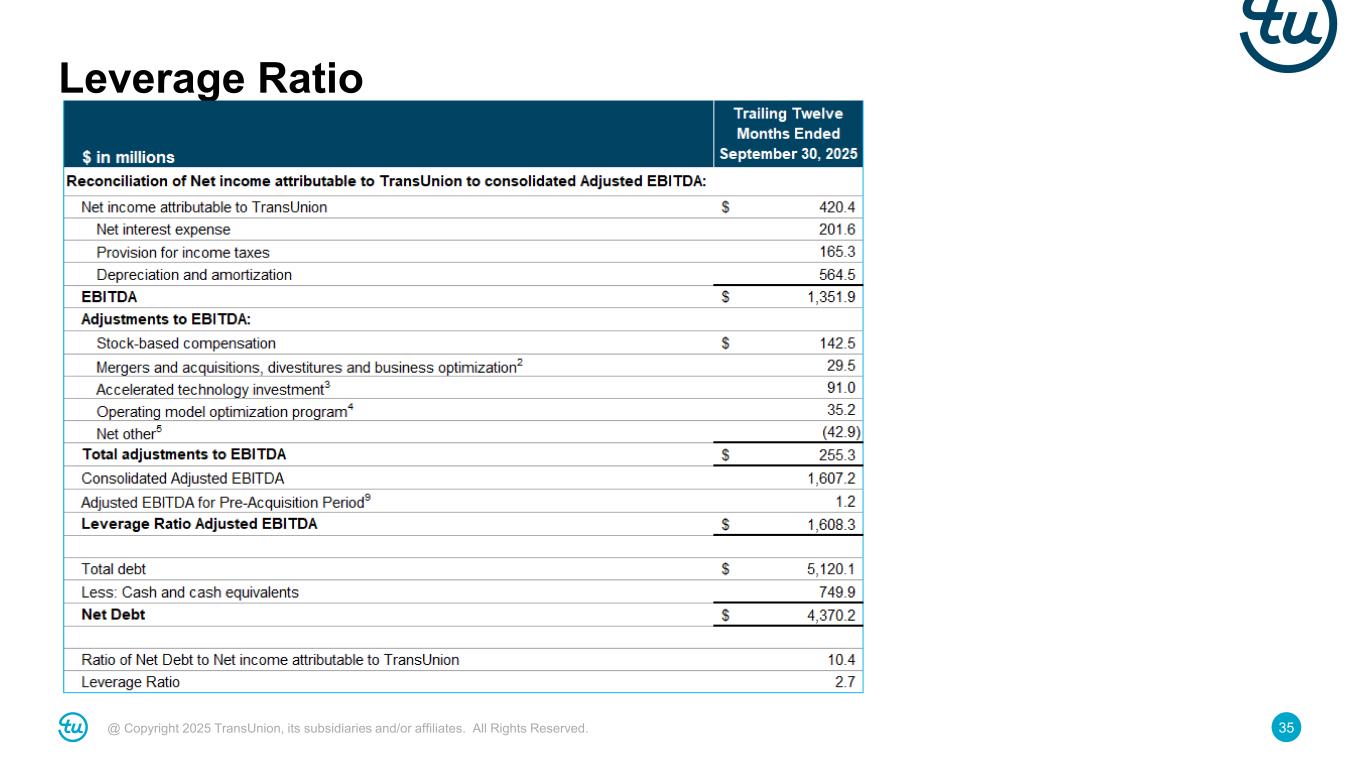
35@ Copyright 2025 TransUnion, its subsidiaries and/or affiliates. All Rights Reserved. Leverage Ratio
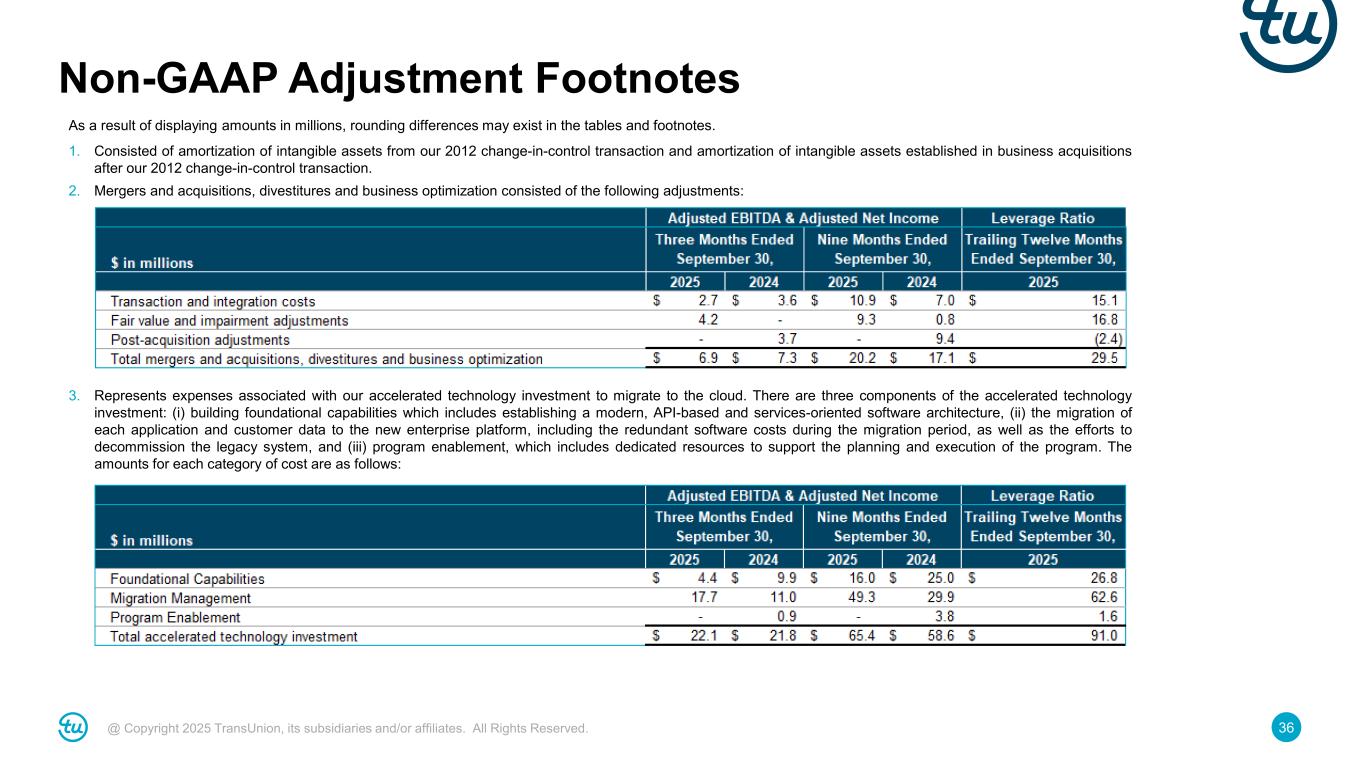
36@ Copyright 2025 TransUnion, its subsidiaries and/or affiliates. All Rights Reserved. Non-GAAP Adjustment Footnotes As a result of displaying amounts in millions, rounding differences may exist in the tables and footnotes. 1. Consisted of amortization of intangible assets from our 2012 change-in-control transaction and amortization of intangible assets established in business acquisitions after our 2012 change-in-control transaction. 2. Mergers and acquisitions, divestitures and business optimization consisted of the following adjustments: 3. Represents expenses associated with our accelerated technology investment to migrate to the cloud. There are three components of the accelerated technology investment: (i) building foundational capabilities which includes establishing a modern, API-based and services-oriented software architecture, (ii) the migration of each application and customer data to the new enterprise platform, including the redundant software costs during the migration period, as well as the efforts to decommission the legacy system, and (iii) program enablement, which includes dedicated resources to support the planning and execution of the program. The amounts for each category of cost are as follows:
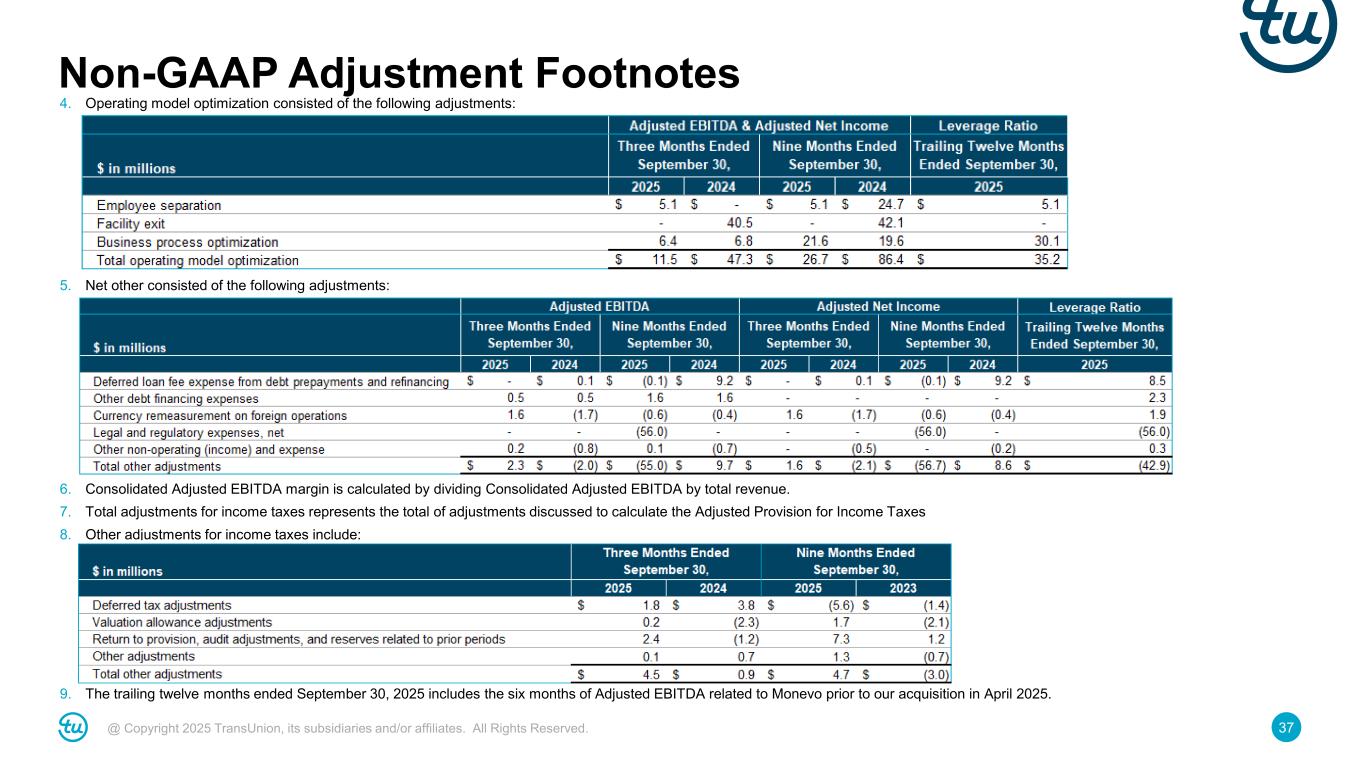
37@ Copyright 2025 TransUnion, its subsidiaries and/or affiliates. All Rights Reserved. Non-GAAP Adjustment Footnotes 4. Operating model optimization consisted of the following adjustments: 5. Net other consisted of the following adjustments: 6. Consolidated Adjusted EBITDA margin is calculated by dividing Consolidated Adjusted EBITDA by total revenue. 7. Total adjustments for income taxes represents the total of adjustments discussed to calculate the Adjusted Provision for Income Taxes 8. Other adjustments for income taxes include: 9. The trailing twelve months ended September 30, 2025 includes the six months of Adjusted EBITDA related to Monevo prior to our acquisition in April 2025.
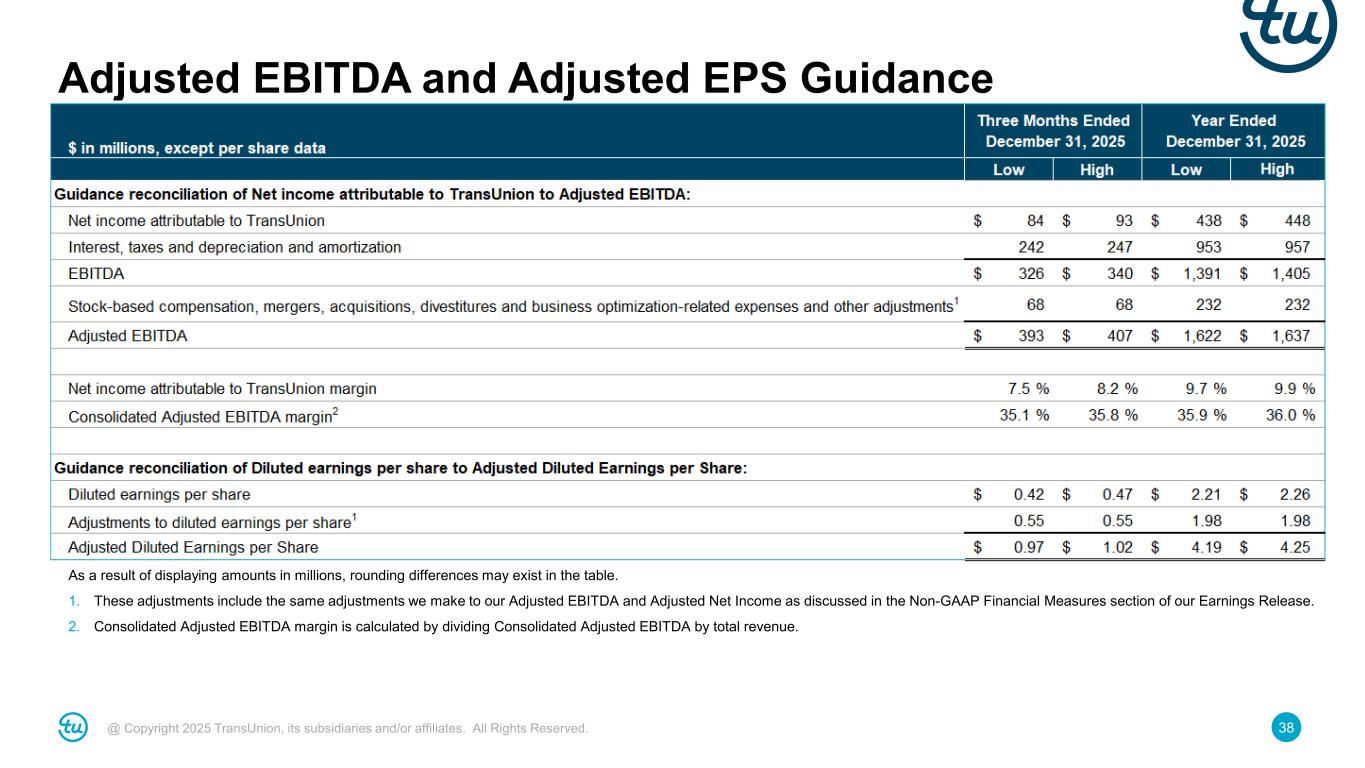
38@ Copyright 2025 TransUnion, its subsidiaries and/or affiliates. All Rights Reserved. Adjusted EBITDA and Adjusted EPS Guidance As a result of displaying amounts in millions, rounding differences may exist in the table. 1. These adjustments include the same adjustments we make to our Adjusted EBITDA and Adjusted Net Income as discussed in the Non-GAAP Financial Measures section of our Earnings Release. 2. Consolidated Adjusted EBITDA margin is calculated by dividing Consolidated Adjusted EBITDA by total revenue.