.2
SUNOCO LP Investor Presentation November 2025
.2
SUNOCO LP Investor Presentation November 2025
Forward-Looking Statements This presentation contains “forward-looking statements” within the meaning of the federal securities laws, including Section 27A of the Securities Act of 1933, as amended, and Section 21E of the Securities Exchange Act of 1934, as amended. In this context, forward-looking statements often address future business and financial events, conditions, expectations, plans or ambitions, and often include, but are not limited to, words such as “believe,” “expect,” “may,” “will,” “should,” “could,” “would,” “anticipate,” “estimate,” “intend,” “plan,” “seek,” “see,” “target” or similar expressions, or variations or negatives of these words, but not all forward-looking statements include such words. Forward-looking statements by their nature address matters that are, to different degrees, uncertain, such as statements about the anticipated benefits of the acquisition of Parkland Corporation (the “Transaction”). All such forward-looking statements are based upon current plans, estimates, expectations and ambitions that are subject to risks, uncertainties and assumptions, many of which are beyond the control of Sunoco LP (“Sunoco” or “SUN”) that could cause actual results to differ materially from those expressed in such forward-looking statements. Important risk factors that may cause such a difference include, but are not limited to: the ability of Sunoco to integrate the business of Parkland Corporation (“Parkland”) successfully and to achieve anticipated synergies and value creation; the tax treatment, unforeseen liabilities, future capital expenditures, revenues, expenses, earnings, synergies, economic performance, indebtedness, financial condition, losses, prospects, business and management strategies for the management, expansion and growth of the combined company’s operations, including the possibility that any of the anticipated benefits of the transaction will not be realized or will not be realized within the expected time period; potential litigation relating to the transaction that could be instituted against Sunoco, SunocoCorp LLC, Parkland and/or their respective current or former directors; the risk that disruptions from the transaction will harm Sunoco’s business, including current plans and operations and that management’s time and attention will be diverted on transaction-related issues; potential adverse reactions or changes to business relationships, including with employees, suppliers, customers, competitors or credit rating agencies, resulting from the completion of the transaction; rating agency actions and Sunoco’s ability to access short-and long-term debt markets on a timely and affordable basis; dilution caused by Sunoco’s issuance of additional units representing limited partner interests in connection with the transaction; fees, costs and expenses and the possibility that the transaction may be more expensive to complete than anticipated; and those risks described in Item 1A of Sunoco’s Annual Report on Form 10-K, filed with the Securities and Exchange Commission (the “SEC”) on February 14, 2025, and in Item 1A of Sunoco’s Quarterly Report on Form 10-Q for the quarter ended June 30, 2025, filed with the SEC on August 7, 2025. Those disclosures are incorporated by reference in this presentation. While the list of factors presented here is considered representative, no such list should be considered to be a complete statement of all potential risks and uncertainties. Unlisted factors may present significant additional obstacles to the realization of forward-looking statements. Readers are cautioned not to place undue reliance on this forward-looking information, which is as of the date of this presentation. Sunoco does not intend to update these statements unless required by the securities laws to do so, and Sunoco undertakes no obligation to publicly release the result of any revisions to any such forward-looking statements that may be made to reflect events or circumstances after the date of this presentation. This presentation includes certain non-GAAP financial measures as defined under SEC Regulation G. Adjusted EBITDA (“AEBITDA”) is defined as earnings before net interest expense, income taxes, depreciation, amortization and accretion expense, non-cash unit-based compensation expense, gains and losses on disposal of assets, non-cash impairment charges, losses on extinguishment of debt, unrealized gains and losses on commodity derivatives, inventory valuation adjustments, and certain other operating expenses reflected in net income that Sunoco does not believe are indicative of ongoing core operations. Distributable Cash Flow, as adjusted (“DCF”), is defined as AEBITDA less cash interest expense, including the accrual of interest expense related to Sunoco’s long-term debt which is paid on a semi-annual basis, current income tax expense, maintenance capital expenditures and other non-cash adjustments. For DCF, certain transaction-related adjustments and non-recurring expenses are excluded. Free Cash Flow, as adjusted (“FCF”) is defined as DCF less distributions and incentive distribution rights. This presentation includes the forward-looking non-GAAP measures of FCF and synergies. Due to the forward-looking nature of the aforementioned non-GAAP financial measures, management cannot reliably or reasonably predict certain of the necessary components of the most directly comparable forward-looking GAAP measures without unreasonable effort, due to the inherent difficulty in quantifying certain amounts due to a variety of factors, including the unpredictability of commodity price movements and future charges or reversals outside the normal course of business which may be significant. Accordingly, Sunoco is unable to present a quantitative reconciliation of such forward-looking non-GAAP financial measures to their most directly comparable forward-looking GAAP financial measures. Sunoco Investor Relations Contact Information Scott Grischow Brian Brungardt, CFA Senior Vice President – Finance, Treasurer Director – Investor Relations (214) 840-5660 (214) 840-5437 scott.grischow@sunoco.com brian.brungardt@sunoco.com 2
Investment Overview
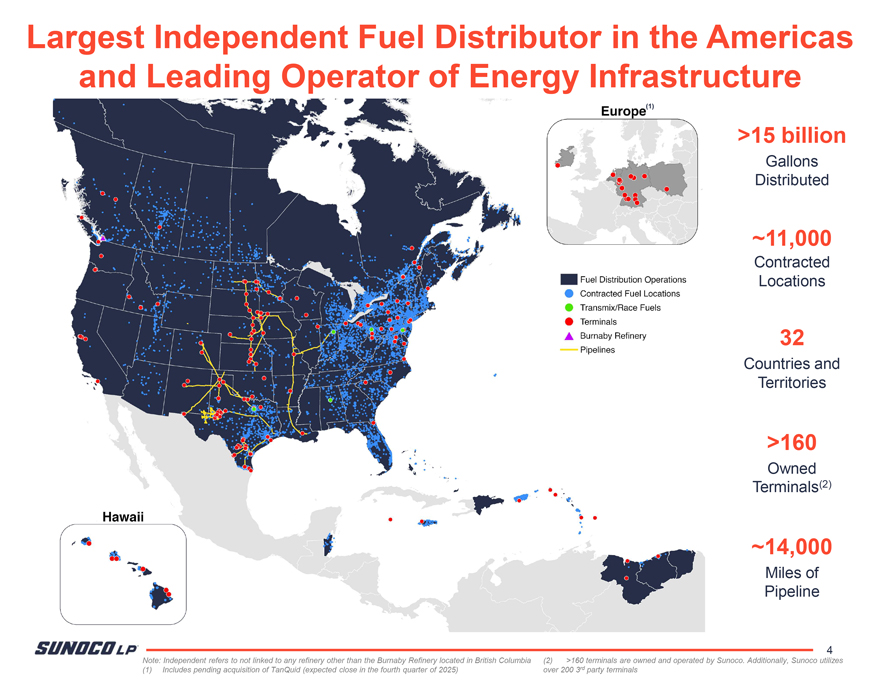
Largest Independent Fuel Distributor in the Americas and Leading Operator of Energy Infrastructure (1) Europe >15 billion Gallons Distributed ~11,000 Contracted Fuel Distribution Operations Locations e Contracted Fuel Locations e Transmix/Race Fuels e Terminals _.. Burnaby Refinery 32 Pipelines Countries and Territories >160 Owned ., .. Terminals(2) ., : ‘ · ‘ .. Hawaii ·. I’ ~14,000 Miles of Pipeline SUNDCDLP. 4 Note: Independent refers to not linked to any refinery other than the Burnaby Refinery located in British Columbia (2) >160 terminals are owned and operated by Sunoco. Additionally, Sunoco utilizes (1) Includes pending acquisition of TanQuid (expected close in the fourth quarter of 2025) over 200 3rd party terminals
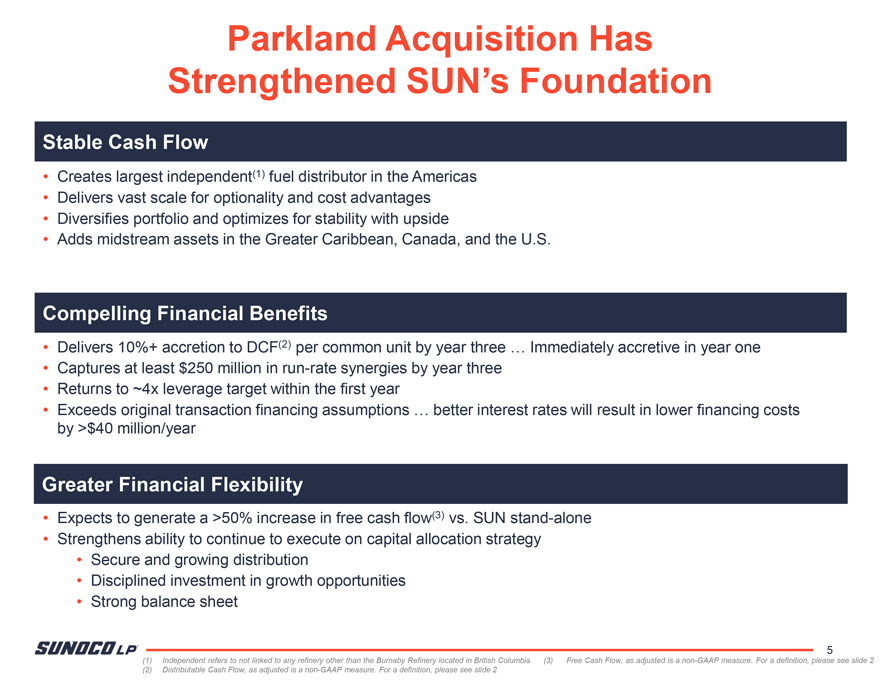
Parkland Acquisition Has Strengthened SUN’s Foundation Stable Cash Flow Creates largest independent(1) fuel distributor in the Americas Delivers vast scale for optionality and cost advantages Diversifies portfolio and optimizes for stability with upside Adds midstream assets in the Greater Caribbean, Canada, and the U.S. Compelling Financial Benefits Delivers 10%+ accretion to DCF(2) per common unit by year three … Immediately accretive in year one Captures at least $250 million in run-rate synergies by year three Returns to ~4x leverage target within the first year Exceeds original transaction financing assumptions … better interest rates will result in lower financing costs by >$40 million/year Greater Financial Flexibility Expects to generate a >50% increase in free cash flow(3) vs. SUN stand-alone Strengthens ability to continue to execute on capital allocation strategy Secure and growing distribution Disciplined investment in growth opportunities Strong balance sheet 5 (1) Independent refers to not linked to any refinery other than the Burnaby Refinery located in British Columbia (3) Free Cash Flow, as adjusted is a non-GAAP measure. For a definition, please see slide 2 (2) Distributable Cash Flow, as adjusted is a non-GAAP measure. For a definition, please see slide 2
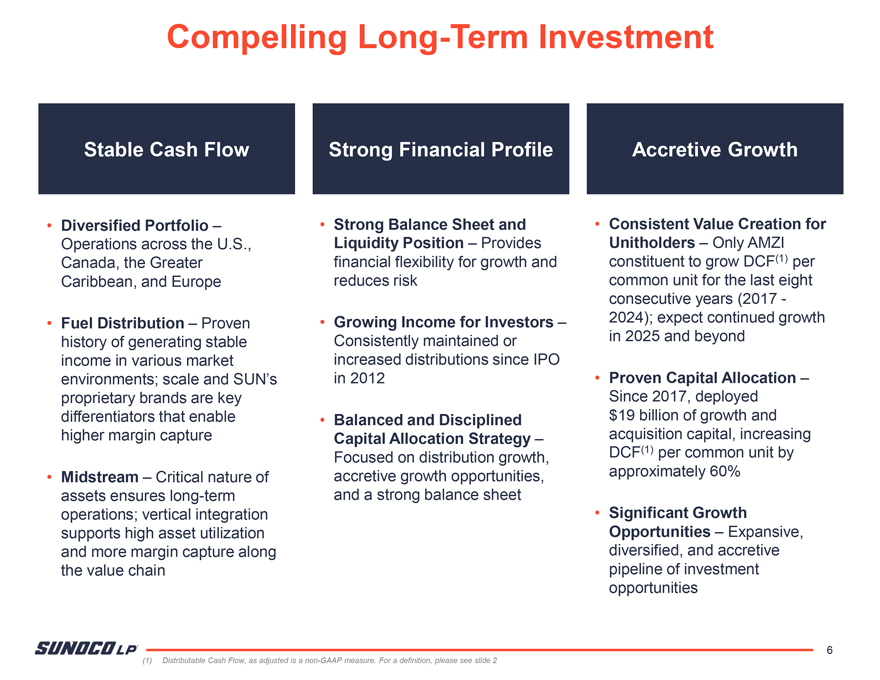
Compelling Long-Term Investment Stable Cash Flow Strong Financial Profile Accretive Growth Diversified Portfolio – Strong Balance Sheet and Consistent Value Creation for Operations across the U.S., Liquidity Position – Provides Unitholders – Only AMZI Canada, the Greater financial flexibility for growth and constituent to grow DCF(1) per Caribbean, and Europe reduces risk common unit for the last eight consecutive years (2017 Fuel Distribution – Proven Growing Income for Investors – 2024); expect continued growth history of generating stable Consistently maintained or in 2025 and beyond income in various market increased distributions since IPO environments; scale and SUN’s in 2012 Proven Capital Allocation –proprietary brands are key Since 2017, deployed differentiators that enable Balanced and Disciplined $19 billion of growth and higher margin capture Capital Allocation Strategy – acquisition capital, increasing DCF(1) per common unit by Focused on distribution growth, approximately 60% Midstream – Critical nature of accretive growth opportunities, assets ensures long-term and a strong balance sheet operations; vertical integration Significant Growth supports high asset utilization Opportunities – Expansive, and more margin capture along diversified, and accretive the value chain pipeline of investment opportunities 6 (1) Distributable Cash Flow, as adjusted is a non-GAAP measure. For a definition, please see slide 2
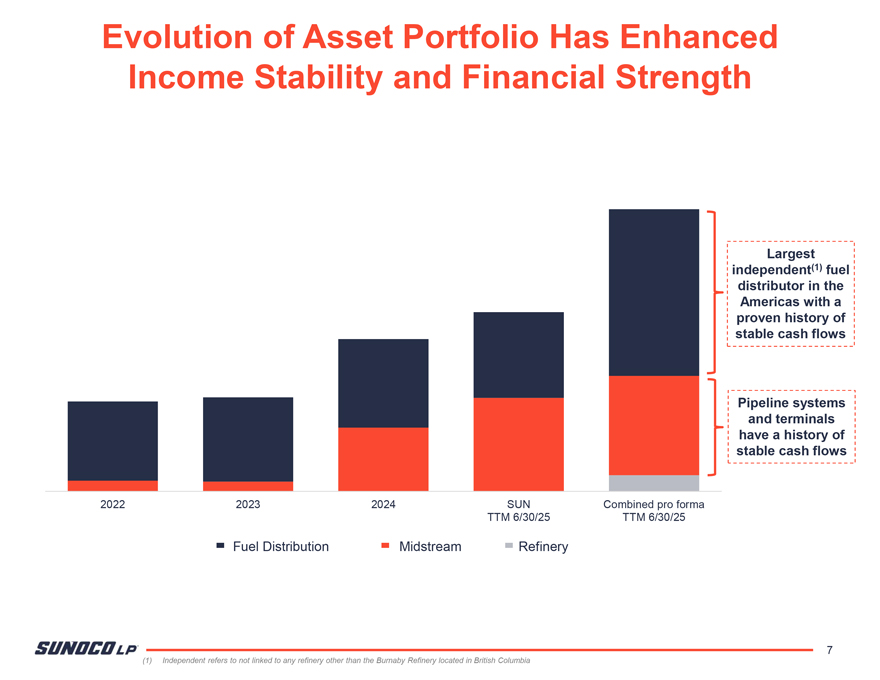
Evolution of Asset Portfolio Has Enhanced Income Stability and Financial Strength Largest independent(1) fuel distributor in the Americas with a proven history of stable cash flows Pipeline systems and terminals have a history of stable cash flows 2022 2023 2024 SUN Combined pro forma TTM 6/30/25 TTM 6/30/25 Fuel Distribution Midstream Refinery 7 (1) Independent refers to not linked to any refinery other than the Burnaby Refinery located in British Columbia
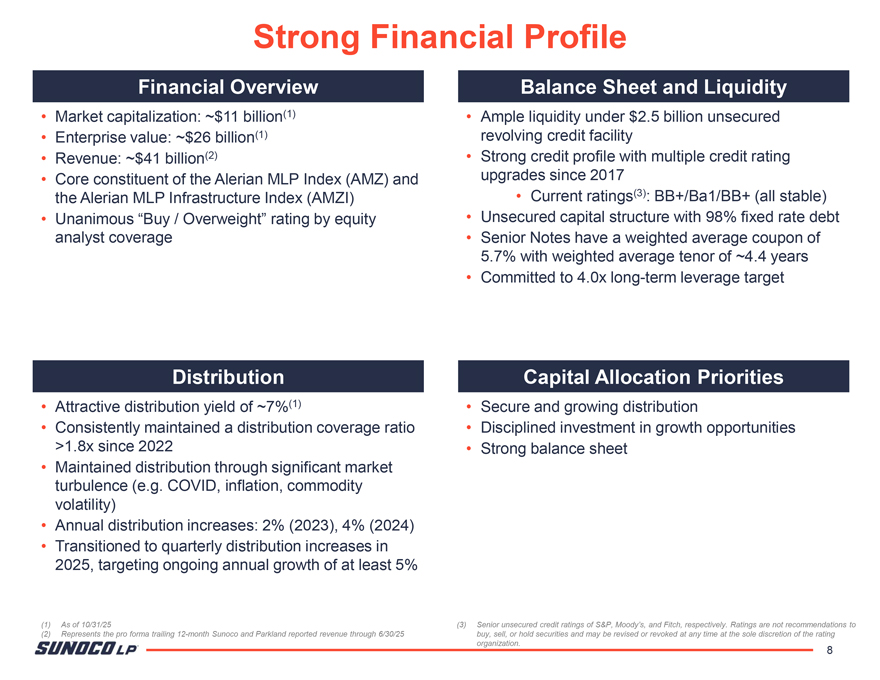
Strong Financial Profile Financial Overview Balance Sheet and Liquidity Market capitalization: ~$11 billion(1) Ample liquidity under $2.5 billion unsecured Enterprise value: ~$26 billion(1) revolving credit facility Revenue: ~$41 billion(2) Strong credit profile with multiple credit rating Core constituent of the Alerian MLP Index (AMZ) and upgrades since 2017 the Alerian MLP Infrastructure Index (AMZI) Current ratings(3): BB+/Ba1/BB+ (all stable) Unanimous “Buy / Overweight” rating by equity Unsecured capital structure with 98% fixed rate debt analyst coverage Senior Notes have a weighted average coupon of 5.7% with weighted average tenor of ~4.4 years Committed to 4.0x long-term leverage target Distribution Capital Allocation Priorities Attractive distribution yield of ~7%(1) Secure and growing distribution Consistently maintained a distribution coverage ratio Disciplined investment in growth opportunities >1.8x since 2022 Strong balance sheet Maintained distribution through significant market turbulence (e.g. COVID, inflation, commodity volatility) Annual distribution increases: 2% (2023), 4% (2024) Transitioned to quarterly distribution increases in 2025, targeting ongoing annual growth of at least 5% (1) As of 10/31/25 (3) Senior unsecured credit ratings of S&P, Moody’s, and Fitch, respectively. Ratings are not recommendations to (2) Represents the pro forma trailing 12-month Sunoco and Parkland reported revenue through 6/30/25 buy, sell, or hold securities and may be revised or revoked at any time at the sole discretion of the rating organization. 8
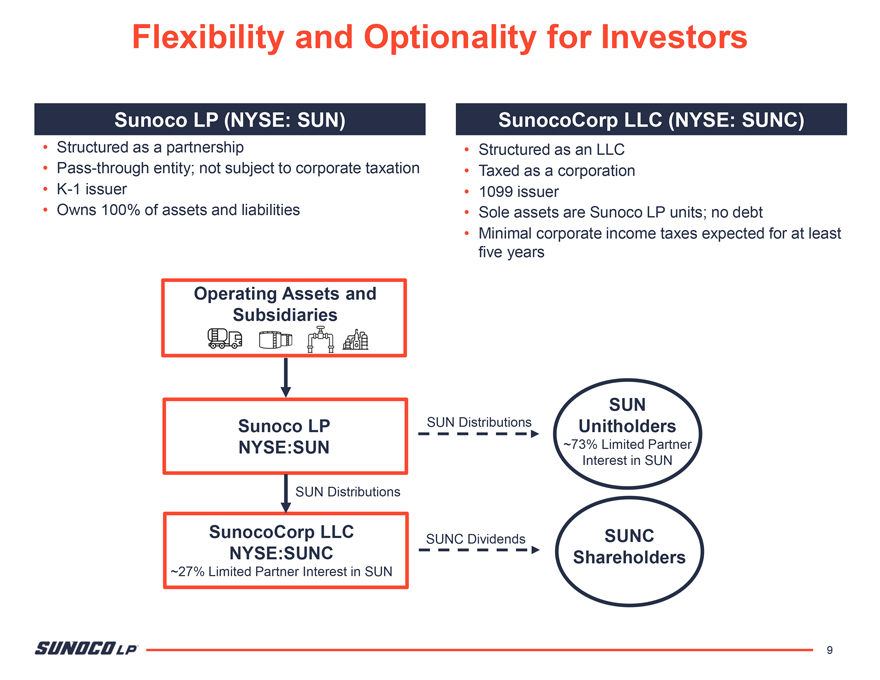
Flexibility and Optionality for Investors Sunoco LP (NYSE: SUN) SunocoCorp LLC (NYSE: SUNC) Structured as a partnership Structured as an LLC Pass-through entity; not subject to corporate taxation Taxed as a corporation K-1 issuer 1099 issuer Owns 100% of assets and liabilities Sole assets are Sunoco LP units; no debt Minimal corporate income taxes expected for at least five years Operating Assets and Subsidiaries SUN Sunoco LP SUN Distributions Unitholders NYSE:SUN ~73% Limited Partner Interest in SUN SUN Distributions SunocoCorp LLC SUNC Dividends SUNC NYSE:SUNC Shareholders ~27% Limited Partner Interest in SUN 9
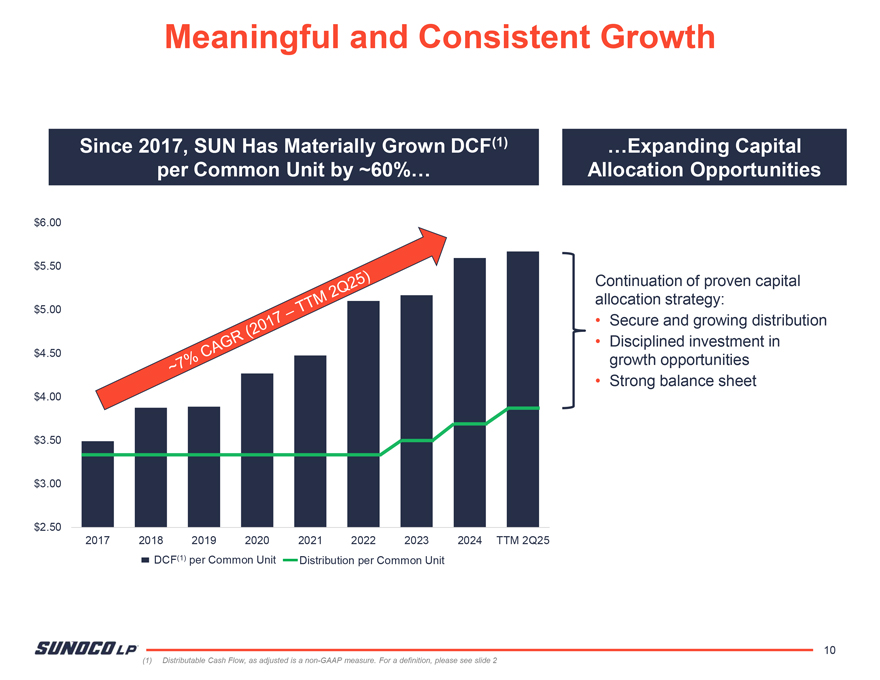
Meaningful and Consistent Growth Since 2017, SUN Has Materially Grown DCF(1) …Expanding Capital per Common Unit by ~60%… Allocation Opportunities $6.00 $5.50 Continuation of proven capital allocation strategy: $5.00 Secure and growing distribution $4.50 Disciplined investment in growth opportunities Strong balance sheet $4.00 $3.50 $3.00 $2.50 2017 2018 2019 2020 2021 2022 2023 2024 TTM 2Q25 DCF(1) per Common Unit Distribution per Common Unit 10 (1) Distributable Cash Flow, as adjusted is a non-GAAP measure. For a definition, please see slide 2
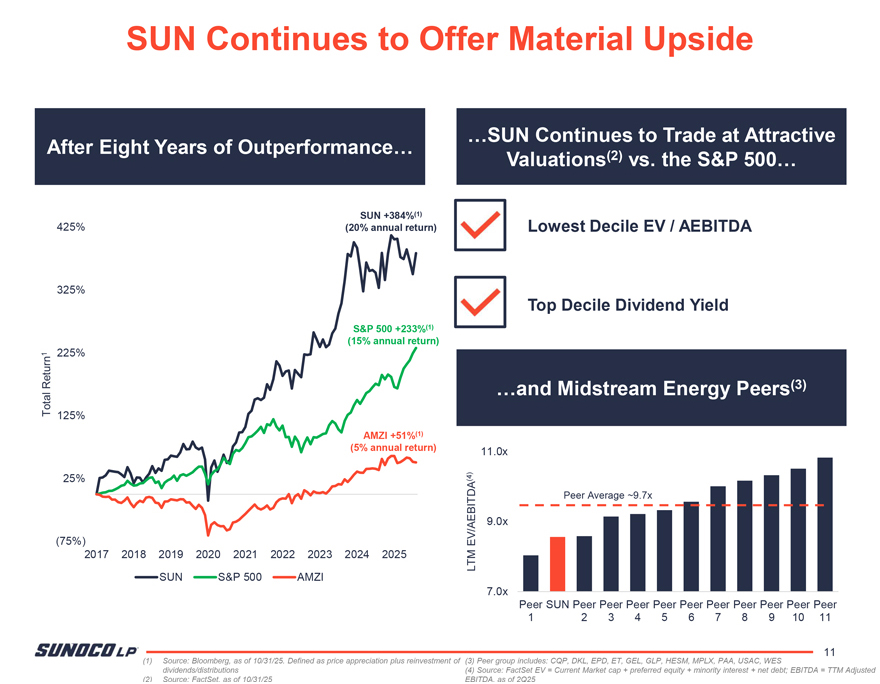
SUN Continues to Offer Material Upside …SUN Continues to Trade at Attractive After Eight Years of Outperformance… (2) Valuations vs. the S&P 500… SUN +384%(1) 425% (20% annual return) Lowest Decile EV / AEBITDA 325% Top Decile Dividend Yield S&P 500 +233%(1) (15% annual return) 1 Return 225% …and Midstream Energy Peers(3) Total 125% AMZI +51%(1) (5% annual return) 11.0x 25% (4) Peer Average ~9.7x 9.0x (75%) EV/AEBITDA 2017 2018 2019 2020 2021 2022 2023 2024 2025 LTM SUN S&P 500 AMZI 7.0x Peer SUN Peer Peer Peer Peer Peer Peer Peer Peer Peer Peer 1 2 3 4 5 6 7 8 9 10 11 (1) Source: Bloomberg, as of 10/31/25. Defined as price appreciation plus reinvestment of (3) Peer group includes: CQP, DKL, EPD, ET, GEL, GLP, HESM, MPLX, PAA, USAC, WES 11 dividends/distributions (4) Source: FactSet EV = Current Market cap + preferred equity + minority interest + net debt; EBITDA = TTM Adjusted

Business Segments
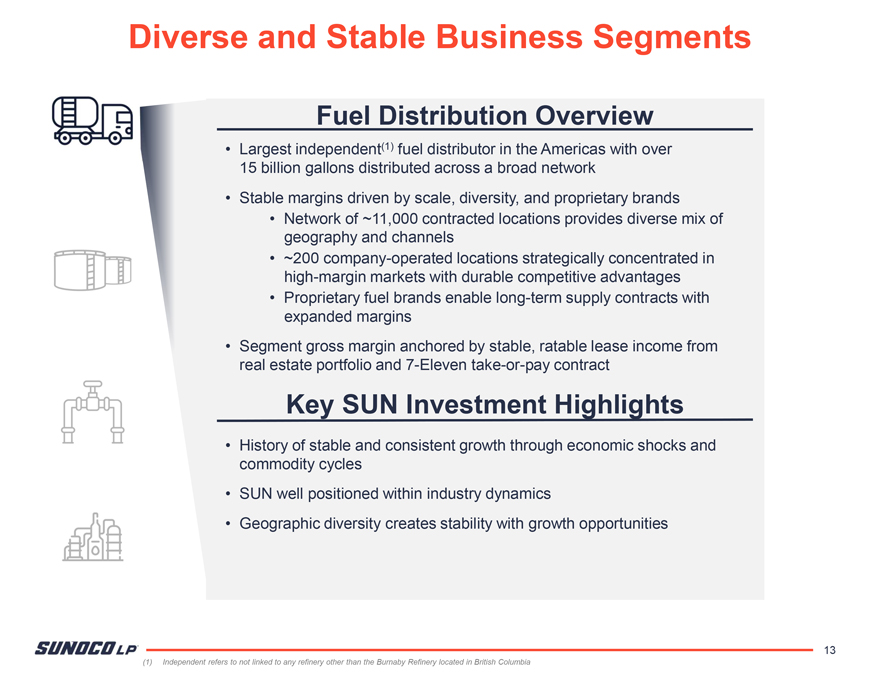
Diverse and Stable Business Segments Fuel Distribution Overview Largest independent(1) fuel distributor in the Americas with over 15 billion gallons distributed across a broad network Stable margins driven by scale, diversity, and proprietary brands Network of ~11,000 contracted locations provides diverse mix of geography and channels ~200 company-operated locations strategically concentrated in high-margin markets with durable competitive advantages Proprietary fuel brands enable long-term supply contracts with expanded margins Segment gross margin anchored by stable, ratable lease income from real estate portfolio and 7-Eleven take-or-pay contract Key SUN Investment Highlights History of stable and consistent growth through economic shocks and commodity cycles SUN well positioned within industry dynamics Geographic diversity creates stability with growth opportunities 13 (1) Independent refers to not linked to any refinery other than the Burnaby Refinery located in British Columbia
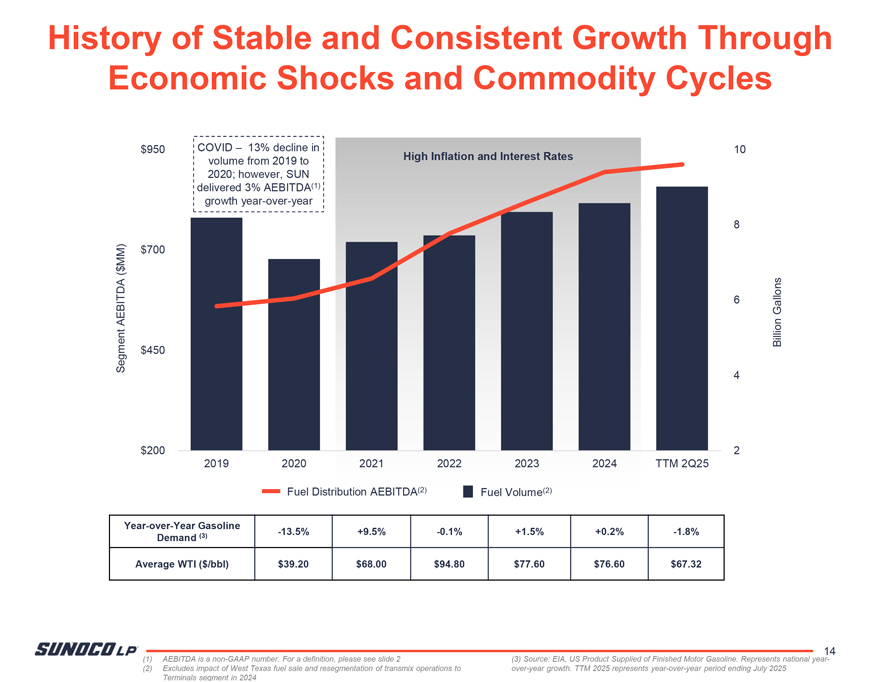
History of Stable and Consistent Growth Through Economic Shocks and Commodity Cycles $950 COVID – 13% decline in 10 volume from 2019 to High Inflation and Interest Rates 2020; however, SUN delivered 3% AEBITDA(1) growth year-over-year 8 MM) $700 ( $ 6 Gallons AEBITDA Billion Segment $450 4 $200 2 2019 2020 2021 2022 2023 2024 TTM 2Q25 Fuel Distribution AEBITDA(2) Fuel Volume(2) Year-over-Year Gasoline (3) -13.5% +9.5% -0.1% +1.5% +0.2% -1.8% Demand Average WTI ($/bbl) $39.20 $68.00 $94.80 $77.60 $76.60 $67.32 (1) AEBITDA is a non-GAAP number. For a definition, please see slide 2 (3) Source: EIA, US Product Supplied of Finished Motor Gasoline. Represents national year- 14 (2) Excludes impact of West Texas fuel sale and resegmentation of transmix operations to over-year growth. TTM 2025 represents year-over-year period ending July 2025
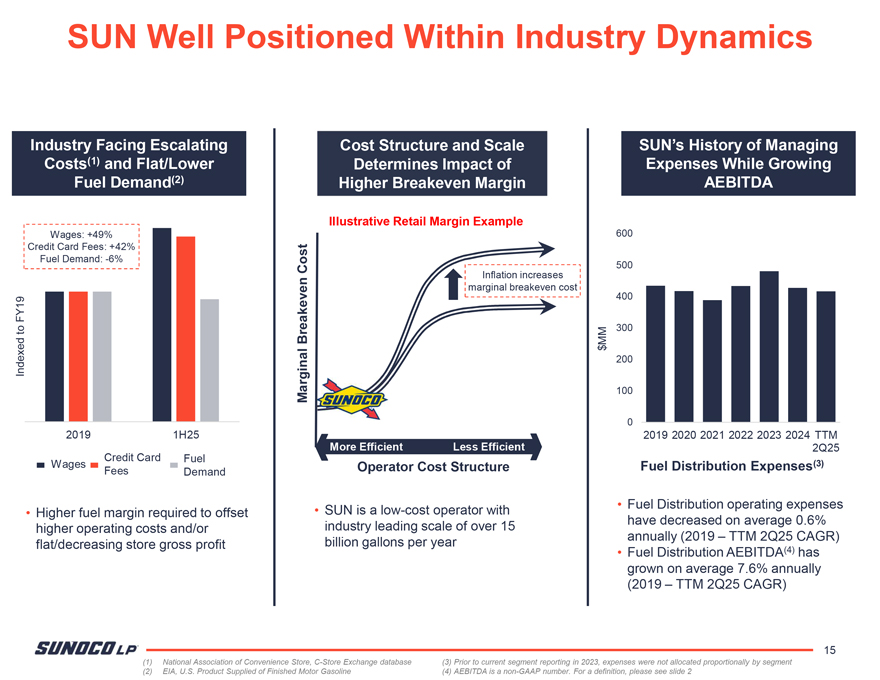
SUN Well Positioned Within Industry Dynamics Industry Facing Escalating Cost Structure and Scale SUN’s History of Managing Costs(1) and Flat/Lower Determines Impact of Expenses While Growing Fuel Demand(2) Higher Breakeven Margin AEBITDA Illustrative Retail Margin Example Wages: +49% 600 Credit Card Fees: +42% Fuel Demand: -6% Cost 500 Inflation increases marginal breakeven cost 400 FY19 300 to Breakeven MM $ Indexed 200 Marginal 100 0 2019 1H25 2019 2020 2021 2022 2023 2024 TTM Credit Card More Efficient Less Efficient 2Q25 Fuel Wages Operator Cost Structure Fuel Distribution Expenses(3) Fees Demand SUN is a low-cost operator with Fuel Distribution operating expenses Higher fuel margin required to offset industry leading scale of over 15 have decreased on average 0.6% higher operating costs and/or billion gallons per year annually (2019 – TTM 2Q25 CAGR) flat/decreasing store gross profit (4) Fuel Distribution AEBITDA has grown on average 7.6% annually (2019 – TTM 2Q25 CAGR) 15 (1) National Association of Convenience Store, C-Store Exchange database (3) Prior to current segment reporting in 2023, expenses were not allocated proportionally by segment (2) EIA, U.S. Product Supplied of Finished Motor Gasoline (4) AEBITDA is a non-GAAP number. For a definition, please see slide 2
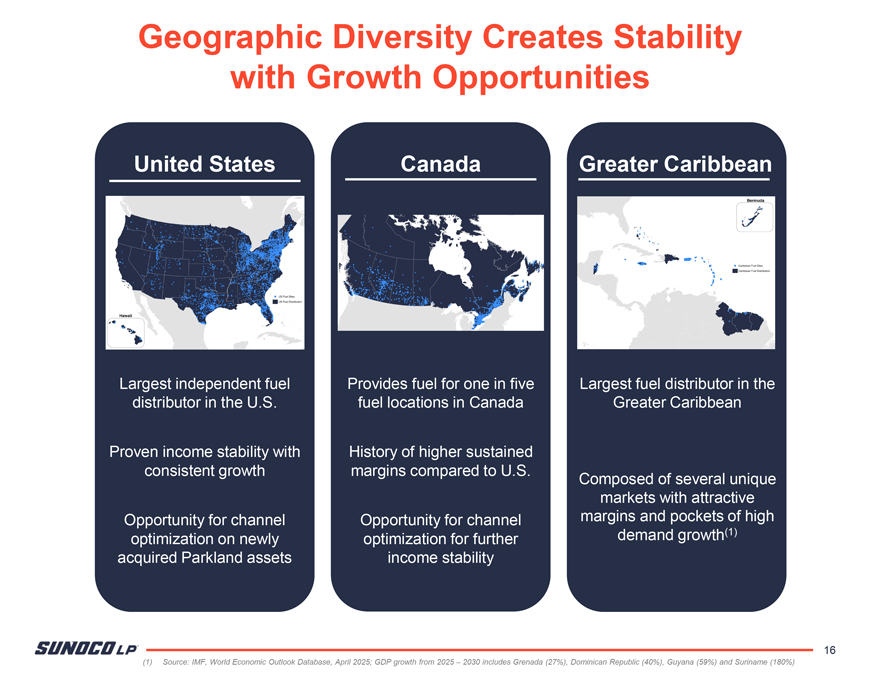
Geographic Diversity Creates Stability with Growth Opportunities United States Canada Greater Caribbean Largest independent fuel Provides fuel for one in five Largest fuel distributor in the distributor in the U.S. fuel locations in Canada Greater Caribbean Proven income stability with History of higher sustained consistent growth margins compared to U.S. Composed of several unique markets with attractive Opportunity for channel Opportunity for channel margins and pockets of high optimization on newly optimization for further demand growth(1) acquired Parkland assets income stability 16
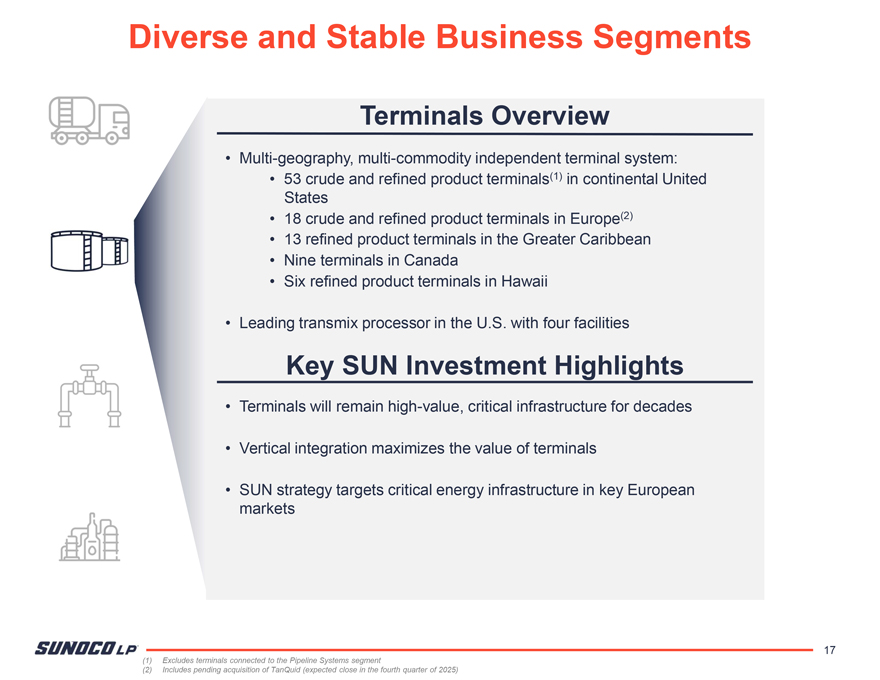
Diverse and Stable Business Segments Terminals Overview Multi-geography, multi-commodity independent terminal system: 53 crude and refined product terminals(1) in continental United States 18 crude and refined product terminals in Europe(2) 13 refined product terminals in the Greater Caribbean Nine terminals in Canada Six refined product terminals in Hawaii Leading transmix processor in the U.S. with four facilities Key SUN Investment Highlights Terminals will remain high-value, critical infrastructure for decades Vertical integration maximizes the value of terminals SUN strategy targets critical energy infrastructure in key European markets 17 (1) Excludes terminals connected to the Pipeline Systems segment (2) Includes pending acquisition of TanQuid (expected close in the fourth quarter of 2025)
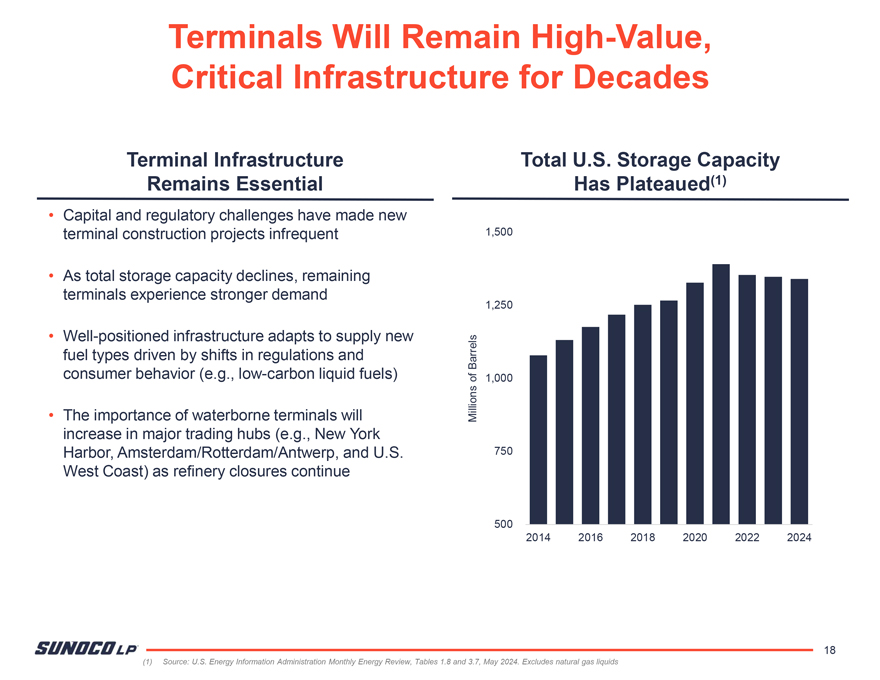
Terminals Will Remain High-Value, Critical Infrastructure for Decades Terminal Infrastructure Total U.S. Storage Capacity Remains Essential Has Plateaued(1) Capital and regulatory challenges have made new terminal construction projects infrequent 1,500 As total storage capacity declines, remaining terminals experience stronger demand 1,250 Well-positioned infrastructure adapts to supply new fuel types driven by shifts in regulations and Barrels consumer behavior (e.g., low-carbon liquid fuels) of 1,000 The importance of waterborne terminals will Millions increase in major trading hubs (e.g., New York Harbor, Amsterdam/Rotterdam/Antwerp, and U.S. 750 West Coast) as refinery closures continue 500 2014 2016 2018 2020 2022 2024 18 (1) Source: U.S. Energy Information Administration Monthly Energy Review, Tables 1.8 and 3.7, May 2024. Excludes natural gas liquids
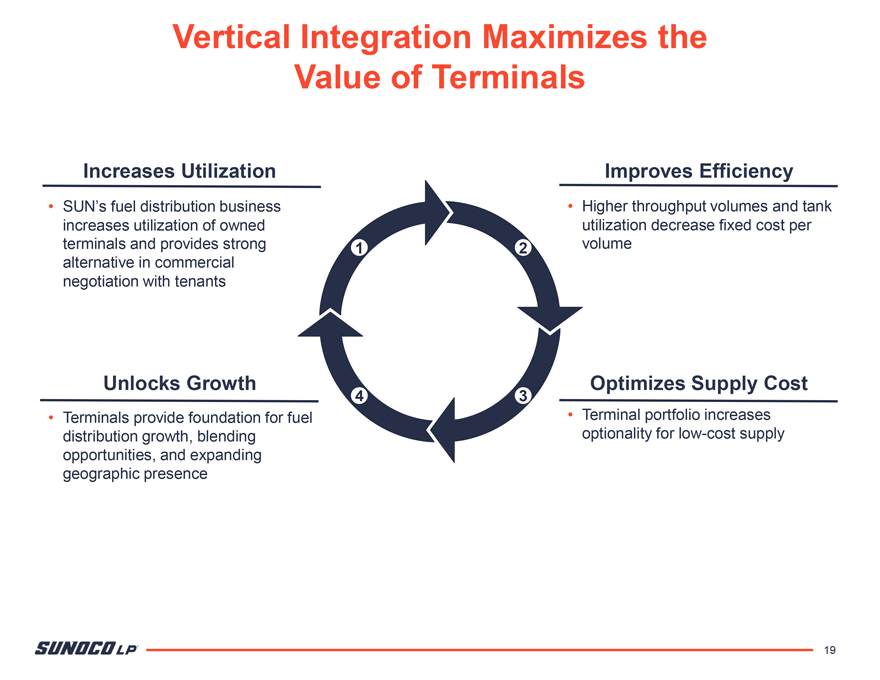
Vertical Integration Maximizes the Value of Terminals Increases Utilization Improves Efficiency SUN’s fuel distribution business Higher throughput volumes and tank increases utilization of owned utilization decrease fixed cost per terminals and provides strong 1 2 volume alternative in commercial negotiation with tenants Unlocks Growth Optimizes Supply Cost 4 3 Terminals provide foundation for fuel Terminal portfolio increases distribution growth, blending optionality for low-cost supply opportunities, and expanding geographic presence 19
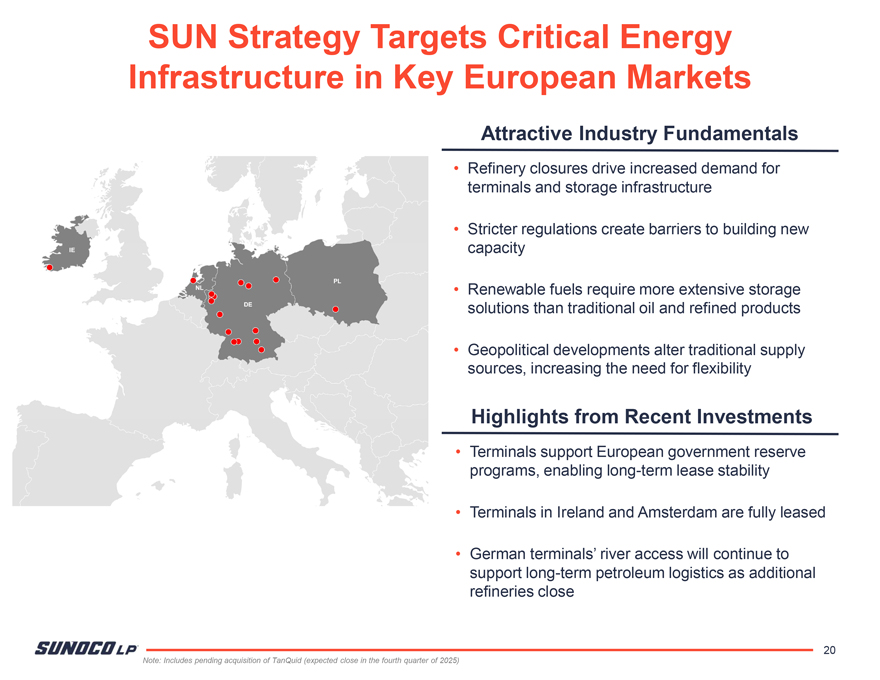
SUN Strategy Targets Critical Energy Infrastructure in Key European Markets Attractive Industry Fundamentals Refinery closures drive increased demand for terminals and storage infrastructure Stricter regulations create barriers to building new capacity Renewable fuels require more extensive storage solutions than traditional oil and refined products Geopolitical developments alter traditional supply sources, increasing the need for flexibility Highlights from Recent Investments Terminals support European government reserve programs, enabling long-term lease stability Terminals in Ireland and Amsterdam are fully leased German terminals’ river access will continue to support long-term petroleum logistics as additional refineries close 20 Note: Includes pending acquisition of TanQuid (expected close in the fourth quarter of 2025)
Diverse and Stable Business Segments Pipeline Systems Overview ~6,000 miles of refined product pipeline ~6,000 miles of crude oil pipeline ~2,000 miles of ammonia pipeline Joint ventures with Energy Transfer: J.C. Nolan Distillate Pipeline and Permian Basin Crude Gathering System 69 pipeline connected terminals Key SUN Investment Highlights Pipeline systems will remain high-value, critical infrastructure for decades Critical energy infrastructure pipeline systems – refined products, crude, and ammonia Joint venture with Energy Transfer is a highly efficient Permian platform 21
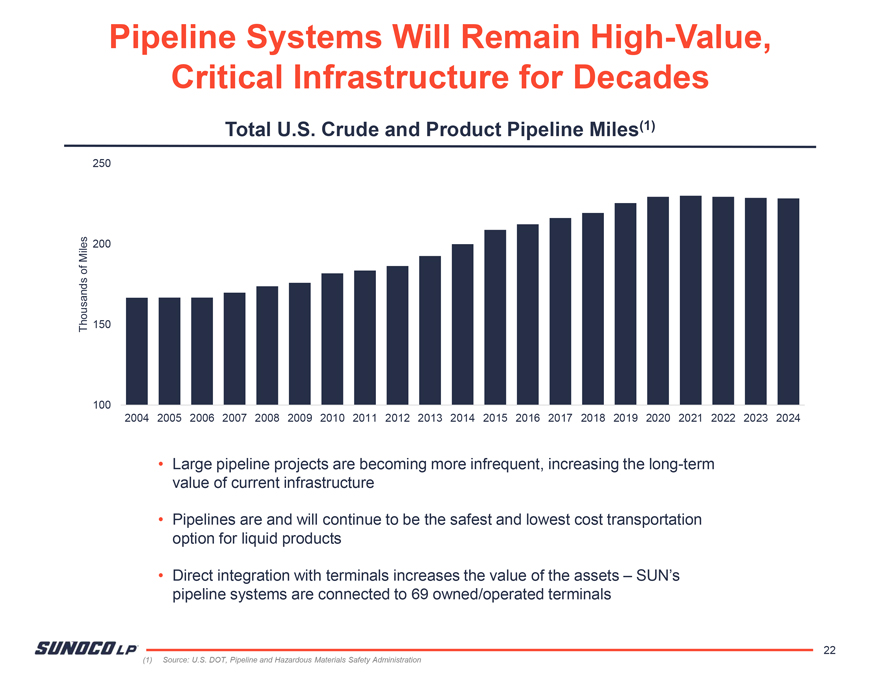
Pipeline Systems Will Remain High-Value, Critical Infrastructure for Decades Total U.S. Crude and Product Pipeline Miles(1) 250 Miles 200 of Thousands 150 100 2004 2005 2006 2007 2008 2009 2010 2011 2012 2013 2014 2015 2016 2017 2018 2019 2020 2021 2022 2023 2024 Large pipeline projects are becoming more infrequent, increasing the long-term value of current infrastructure Pipelines are and will continue to be the safest and lowest cost transportation option for liquid products Direct integration with terminals increases the value of the assets – SUN’s pipeline systems are connected to 69 owned/operated terminals 22 (1) Source: U.S. DOT, Pipeline and Hazardous Materials Safety Administration
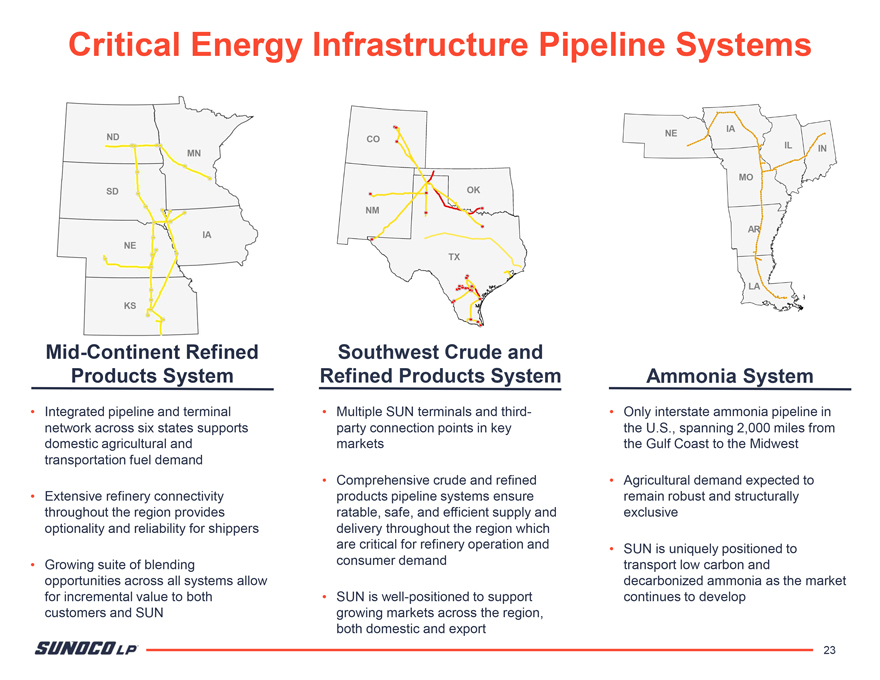
Critical Energy Infrastructure Pipeline Systems IA ND NE CO MN IL IN MO SD OK NM AR IA NE TX LA KS Mid-Continent Refined Southwest Crude and Products System Refined Products System Ammonia System Integrated pipeline and terminal Multiple SUN terminals and third- Only interstate ammonia pipeline in network across six states supports party connection points in key the U.S., spanning 2,000 miles from domestic agricultural and markets the Gulf Coast to the Midwest transportation fuel demand Comprehensive crude and refined Agricultural demand expected to Extensive refinery connectivity products pipeline systems ensure remain robust and structurally throughout the region provides ratable, safe, and efficient supply and exclusive optionality and reliability for shippers delivery throughout the region which are critical for refinery operation and SUN is uniquely positioned to Growing suite of blending consumer demand transport low carbon and opportunities across all systems allow decarbonized ammonia as the market for incremental value to both SUN is well-positioned to support continues to develop customers and SUN growing markets across the region, both domestic and export 23
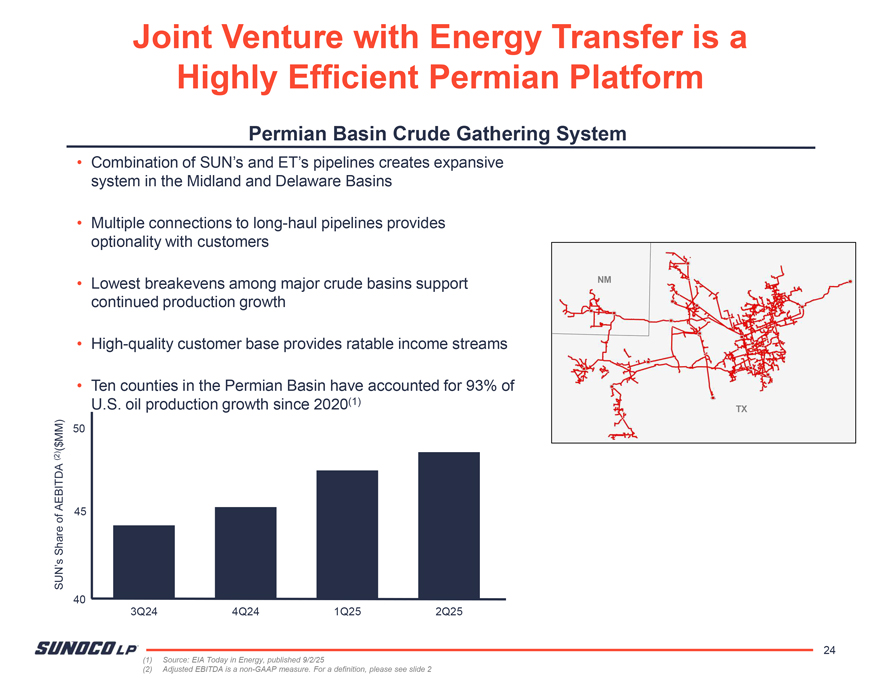
Joint Venture with Energy Transfer is a Highly Efficient Permian Platform Permian Basin Crude Gathering System Combination of SUN’s and ET’s pipelines creates expansive system in the Midland and Delaware Basins Multiple connections to long-haul pipelines provides optionality with customers Lowest breakevens among major crude basins support NM continued production growth High-quality customer base provides ratable income streams Ten counties in the Permian Basin have accounted for 93% of U.S. oil production growth since 2020(1) TX MM) 50 ( $ (2) AEBITDA 45 of Share SUN’s 40 3Q24 4Q24 1Q25 2Q25 24 (1) Source: EIA Today in Energy, published 9/2/25 (2) Adjusted EBITDA is a non-GAAP measure. For a definition, please see slide 2
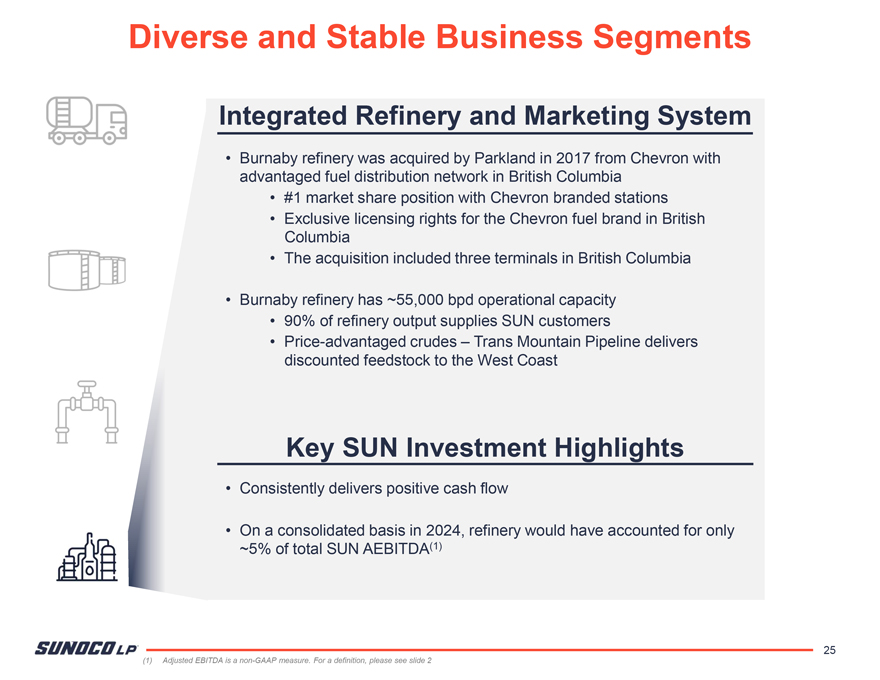
Diverse and Stable Business Segments Integrated Refinery and Marketing System Burnaby refinery was acquired by Parkland in 2017 from Chevron with advantaged fuel distribution network in British Columbia #1 market share position with Chevron branded stations Exclusive licensing rights for the Chevron fuel brand in British Columbia The acquisition included three terminals in British Columbia Burnaby refinery has ~55,000 bpd operational capacity 90% of refinery output supplies SUN customers Price-advantaged crudes – Trans Mountain Pipeline delivers discounted feedstock to the West Coast Key SUN Investment Highlights Consistently delivers positive cash flow On a consolidated basis in 2024, refinery would have accounted for only ~5% of total SUN AEBITDA(1) 25 (1) Adjusted EBITDA is a non-GAAP measure. For a definition, please see slide 2
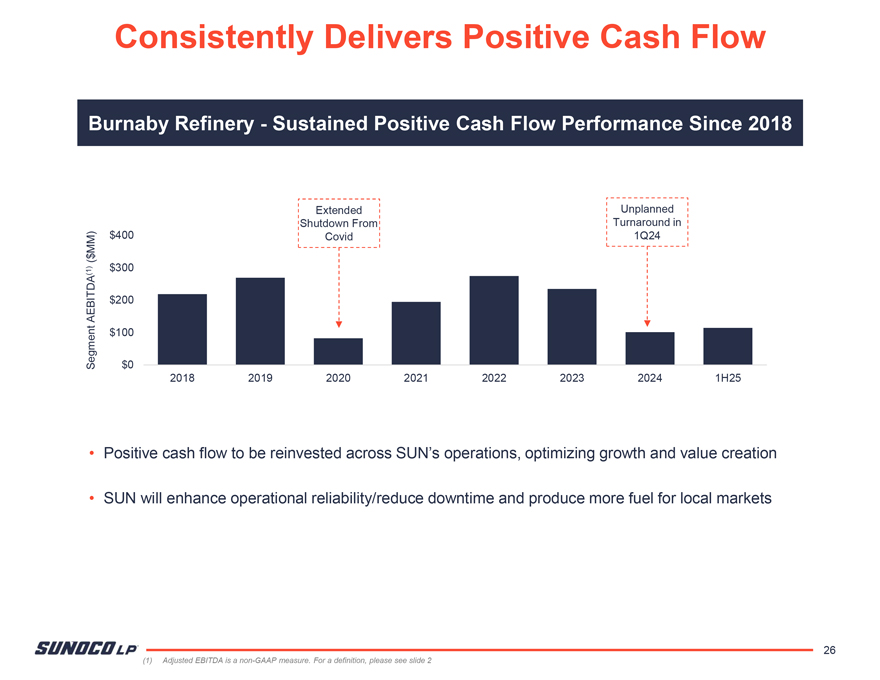
Consistently Delivers Positive Cash Flow Burnaby Refinery Sustained Positive Cash Flow Performance Since 2018 Extended Unplanned Shutdown From Turnaround in MM) $400 Covid 1Q24 ( $ (1) $300 AEBITDA $200 $100 Segment $0 2018 2019 2020 2021 2022 2023 2024 1H25 Positive cash flow to be reinvested across SUN’s operations, optimizing growth and value creation SUN will enhance operational reliability/reduce downtime and produce more fuel for local markets 26 (1) Adjusted EBITDA is a non-GAAP measure. For a definition, please see slide 2
Future Growth Opportunities
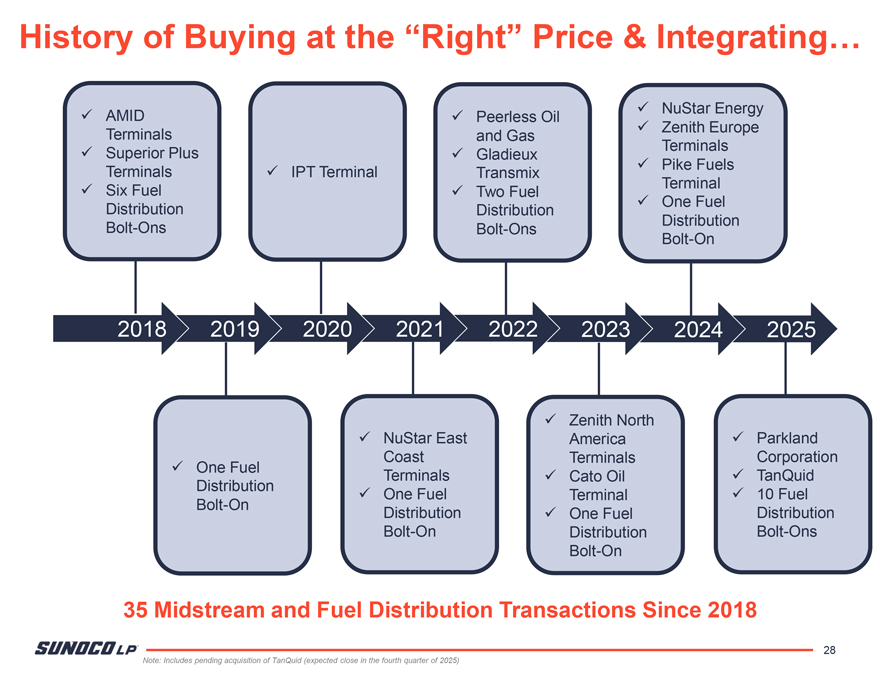
History of Buying at the “Right” Price & Integrating… NuStar Energy AMID Peerless Oil Zenith Europe Terminals and Gas Terminals Superior Plus Gladieux Pike Fuels Terminals IPT Terminal Transmix Terminal Six Fuel Two Fuel One Fuel Distribution Distribution Distribution Bolt-Ons Bolt-Ons Bolt-On 2018 2019 2020 2021 2022 2023 2024 2025 Zenith North NuStar East America Parkland Coast Terminals Corporation One Fuel Terminals Cato Oil TanQuid Distribution One Fuel Terminal 10 Fuel Bolt-On Distribution One Fuel Distribution Bolt-On Distribution Bolt-Ons Bolt-On 35 Midstream and Fuel Distribution Transactions Since 2018 28 Note: Includes pending acquisition of TanQuid (expected close in the fourth quarter of 2025)
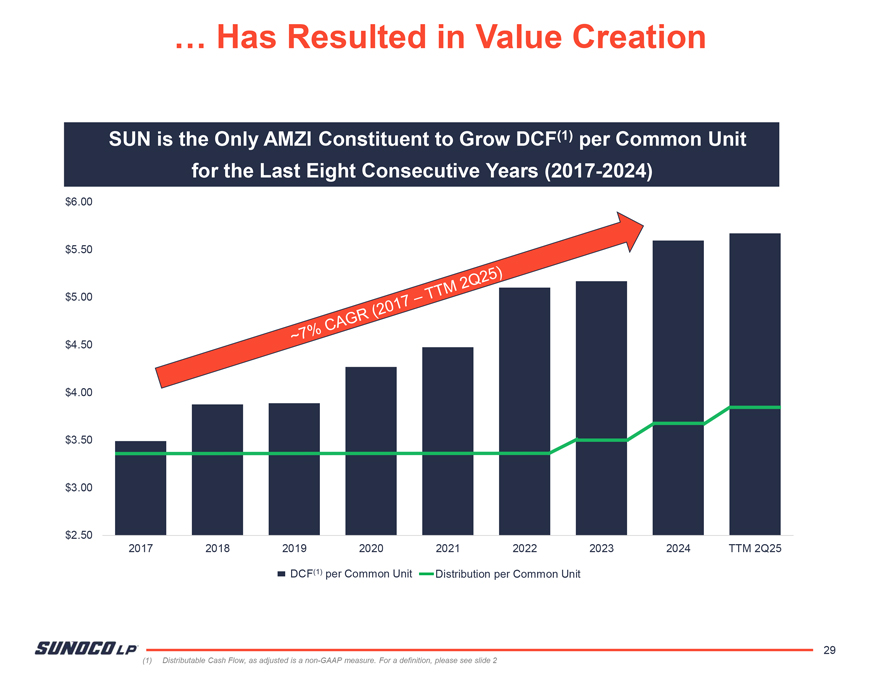
… Has Resulted in Value Creation SUN is the Only AMZI Constituent to Grow DCF(1) per Common Unit for the Last Eight Consecutive Years (2017-2024) $6.00 $5.50 $5.00 $4.50 $4.00 $3.50 $3.00 $2.50 2017 2018 2019 2020 2021 2022 2023 2024 TTM 2Q25 DCF(1) per Common Unit Distribution per Common Unit 29 (1) Distributable Cash Flow, as adjusted is a non-GAAP measure. For a definition, please see slide 2
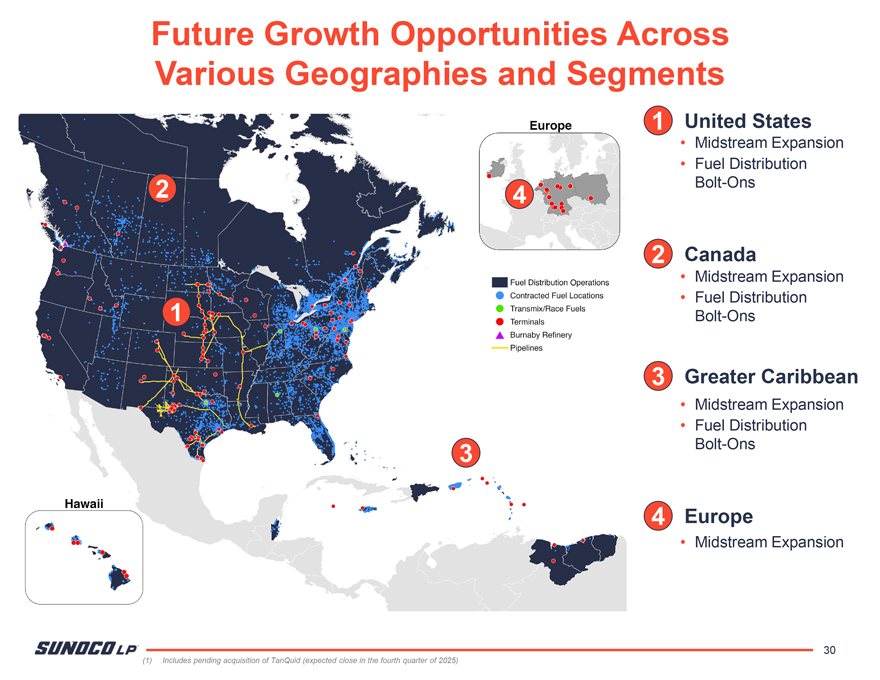
Future Growth Opportunities Across Various Geographies and Segments 1 United States Midstream Expansion Fuel Distribution 2 Bolt-Ons 4 2 Canada Midstream Expansion Fuel Distribution 1 Bolt-Ons 3 Greater Caribbean Midstream Expansion Fuel Distribution 3 Bolt-Ons 4 Europe Midstream Expansion 30 (1) Includes pending acquisition of TanQuid (expected close in the fourth quarter of 2025)
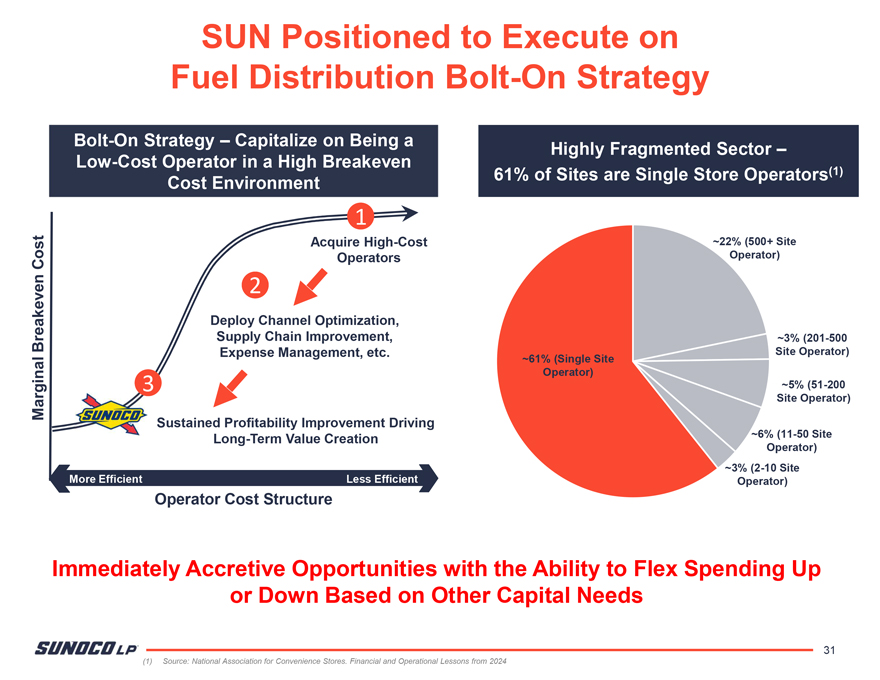
SUN Positioned to Execute on Fuel Distribution Bolt-On Strategy Bolt-On Strategy – Capitalize on Being a Highly Fragmented Sector –Low-Cost Operator in a High Breakeven 61% of Sites are Single Store Operators(1) Cost Environment 1 Acquire High-Cost ~22% (500+ Site Cost Operators Operator) 2 Deploy Channel Optimization, Breakeven Supply Chain Improvement, ~3% (201-500 Expense Management, etc. Site Operator) ~61% (Single Site Operator) 3 ~5% (51-200 Marginal Site Operator) Sustained Profitability Improvement Driving ~6% (11-50 Site Long-Term Value Creation Operator) ~3% (2-10 Site More Efficient Less Efficient Operator) Operator Cost Structure Immediately Accretive Opportunities with the Ability to Flex Spending Up or Down Based on Other Capital Needs 31 (1) Source: National Association for Convenience Stores. Financial and Operational Lessons from 2024
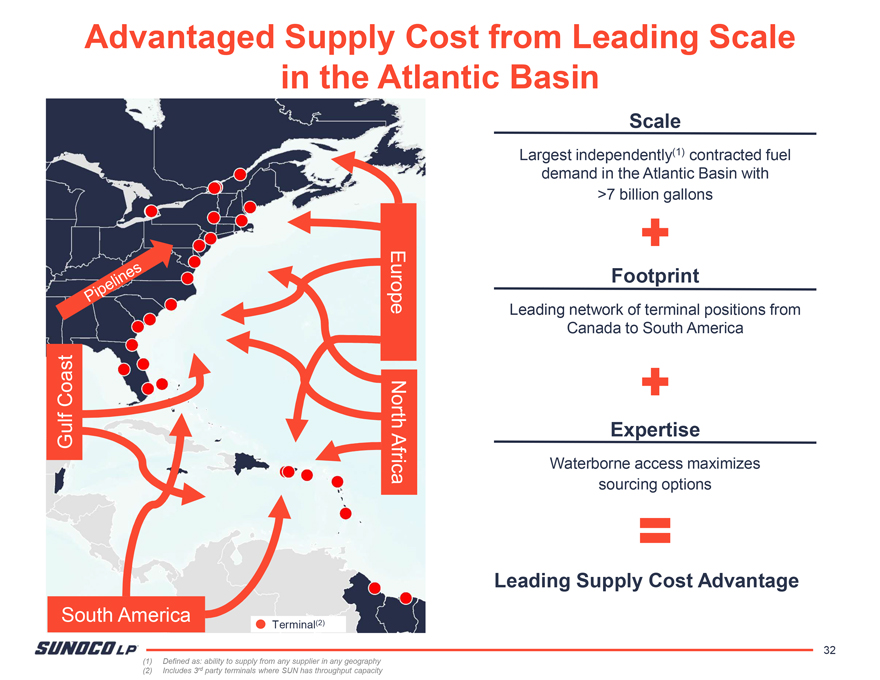
Advantaged Supply Cost from Leading Scale in the Atlantic Basin Scale Largest independently(1) contracted fuel demand in the Atlantic Basin with >7 billion gallons Europe Footprint Leading network of terminal positions from Canada to South America Coast North Gulf Expertise Africa Waterborne access maximizes sourcing options Leading Supply Cost Advantage South America (2) Terminal 32 (1) Defined as: ability to supply from any supplier in any geography (2) Includes 3rd party terminals where SUN has throughput capacity
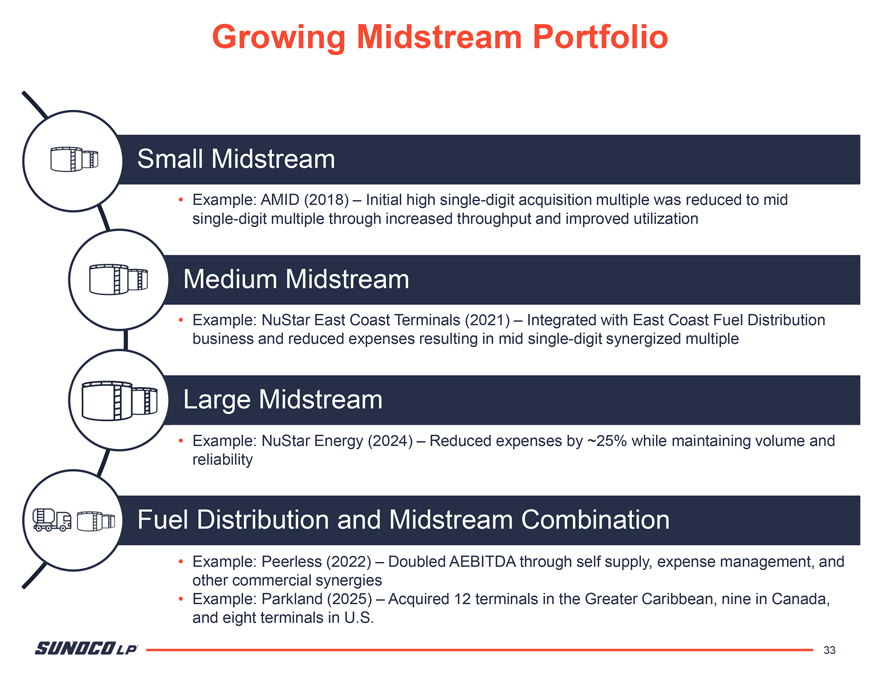
Growing Midstream Portfolio Small Midstream Example: AMID (2018) – Initial high single-digit acquisition multiple was reduced to mid single-digit multiple through increased throughput and improved utilization Medium Midstream Example: NuStar East Coast Terminals (2021) – Integrated with East Coast Fuel Distribution business and reduced expenses resulting in mid single-digit synergized multiple Large Midstream Example: NuStar Energy (2024) – Reduced expenses by ~25% while maintaining volume and reliability Fuel Distribution and Midstream Combination Example: Peerless (2022) – Doubled AEBITDA through self supply, expense management, and other commercial synergies Example: Parkland (2025) – Acquired 12 terminals in the Greater Caribbean, nine in Canada, and eight terminals in U.S. 33

® SUNOCO SUArDCDLP· 34