
.2 3RD QUARTER 2025
2
3
4
5
6
7

8
9

10

11

12
13
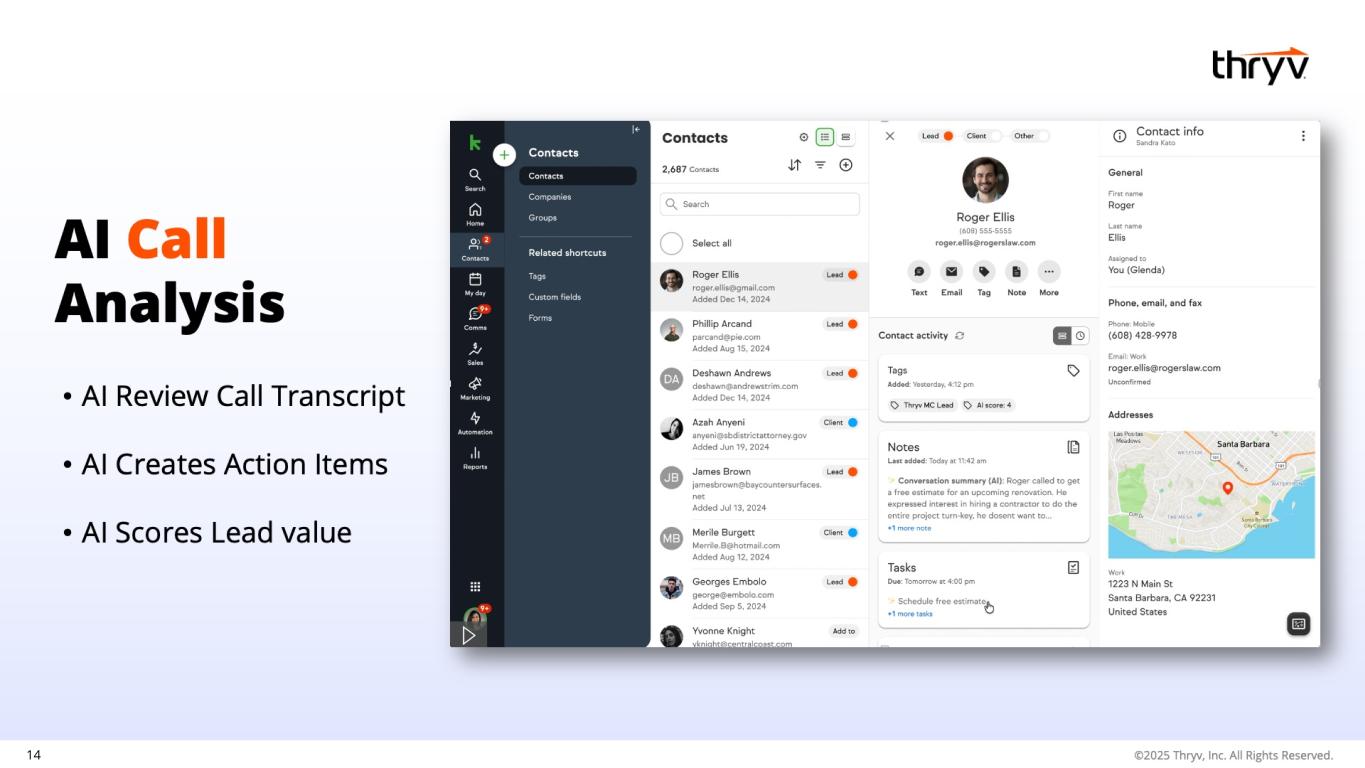
14

15
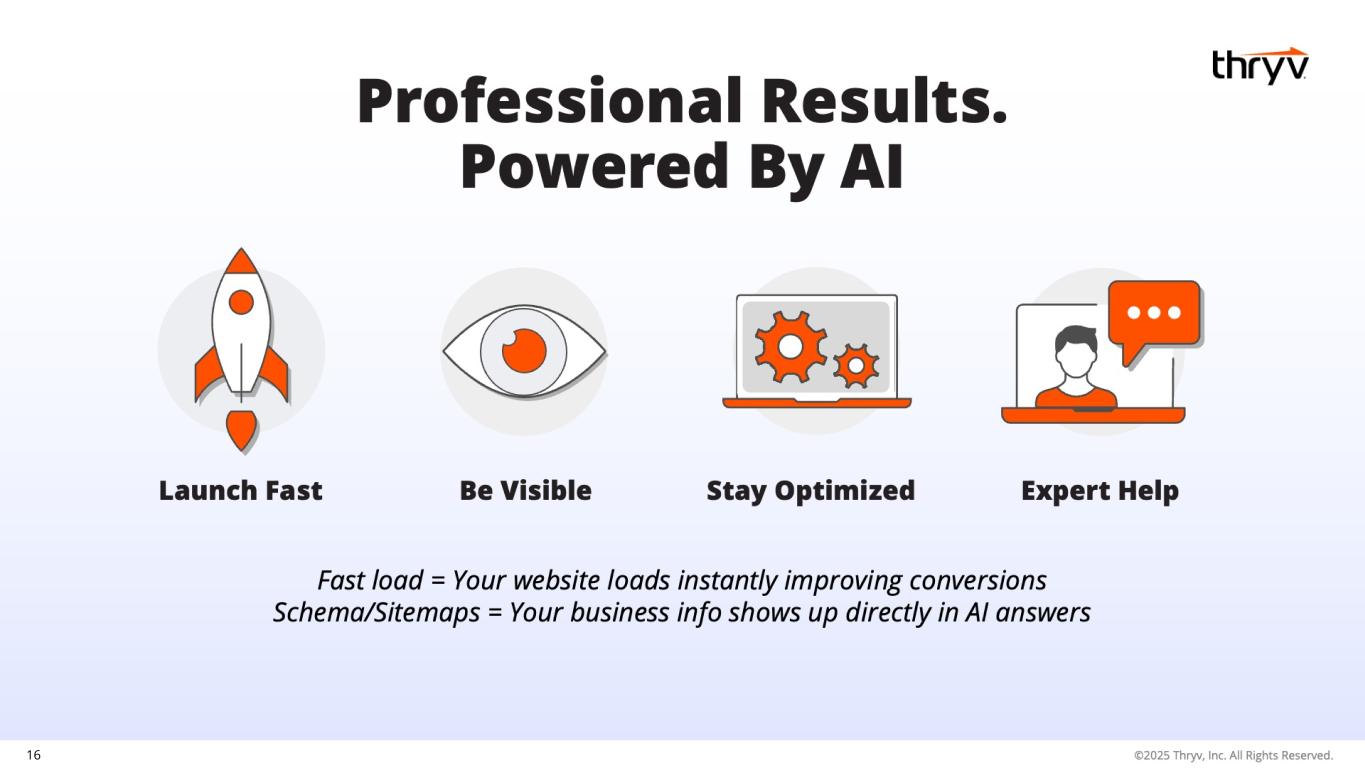
16

17
18 Q3 2025
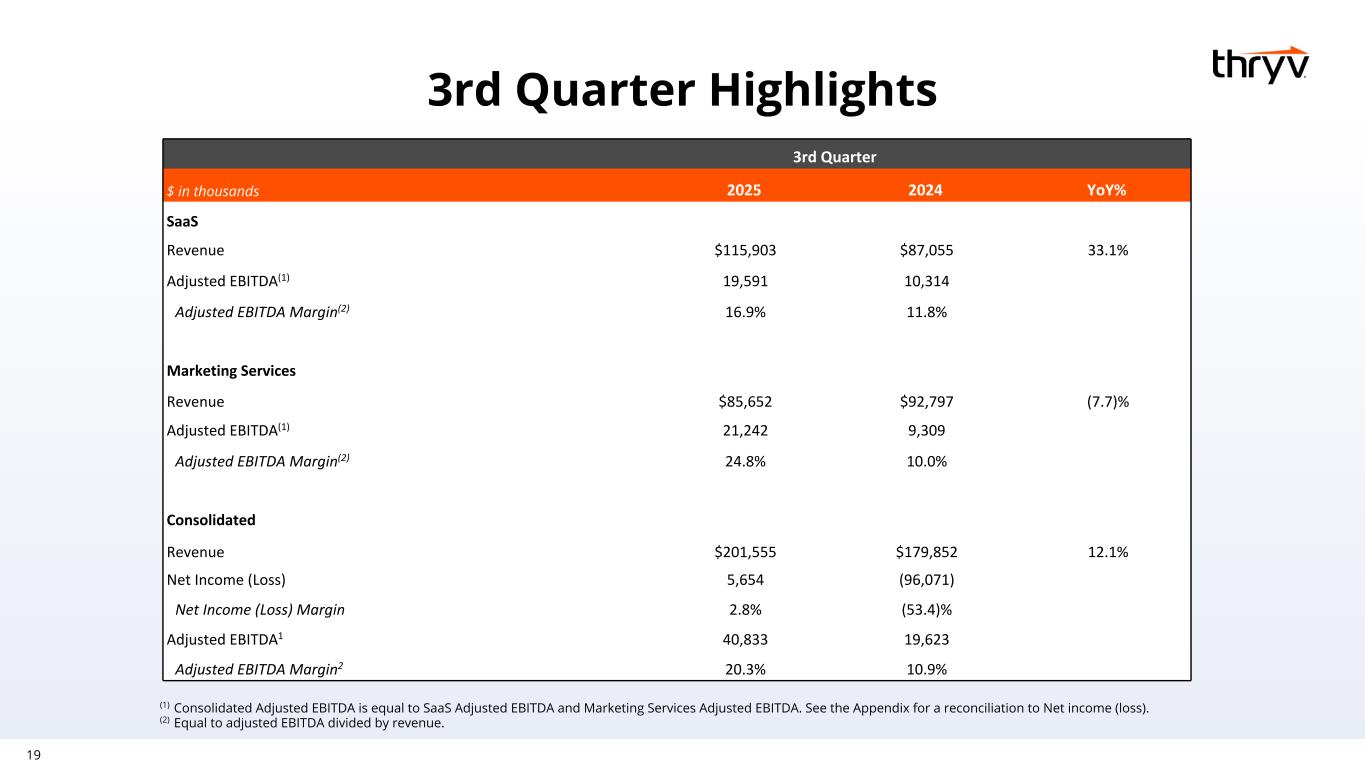
19 3rd Quarter Highlights (1) Consolidated Adjusted EBITDA is equal to SaaS Adjusted EBITDA and Marketing Services Adjusted EBITDA. See the Appendix for a reconciliation to Net income (loss). (2) Equal to adjusted EBITDA divided by revenue. 3rd Quarter $ in thousands 2025 2024 YoY% SaaS Revenue $115,903 $87,055 33.1% Adjusted EBITDA(1) 19,591 10,314 Adjusted EBITDA Margin(2) 16.9% 11.8% Marketing Services Revenue $85,652 $92,797 (7.7)% Adjusted EBITDA(1) 21,242 9,309 Adjusted EBITDA Margin(2) 24.8% 10.0% Consolidated Revenue $201,555 $179,852 12.1% Net Income (Loss) 5,654 (96,071) Net Income (Loss) Margin 2.8% (53.4)% Adjusted EBITDA1 40,833 19,623 Adjusted EBITDA Margin2 20.3% 10.9%
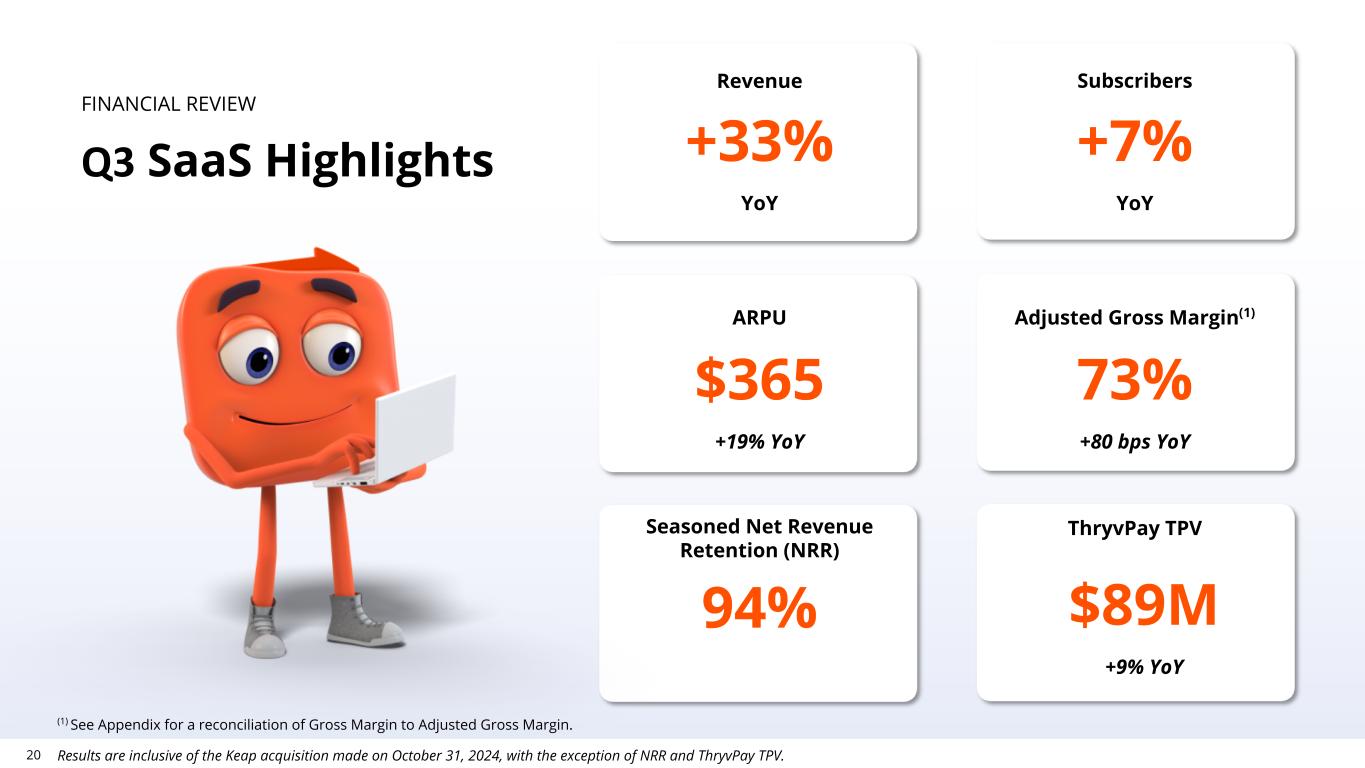
20 FINANCIAL REVIEW Q3 SaaS Highlights +33% YoY +7% YoY $365 +19% YoY $89M +9% YoY Revenue Subscribers ARPU ThryvPay TPVSeasoned Net Revenue Retention (NRR) 73% +80 bps YoY 94% + b YoY Adjusted Gross Margin(1) Results are inclusive of the Keap acquisition made on October 31, 2024, with the exception of NRR and ThryvPay TPV. (1) See Appendix for a reconciliation of Gross Margin to Adjusted Gross Margin.
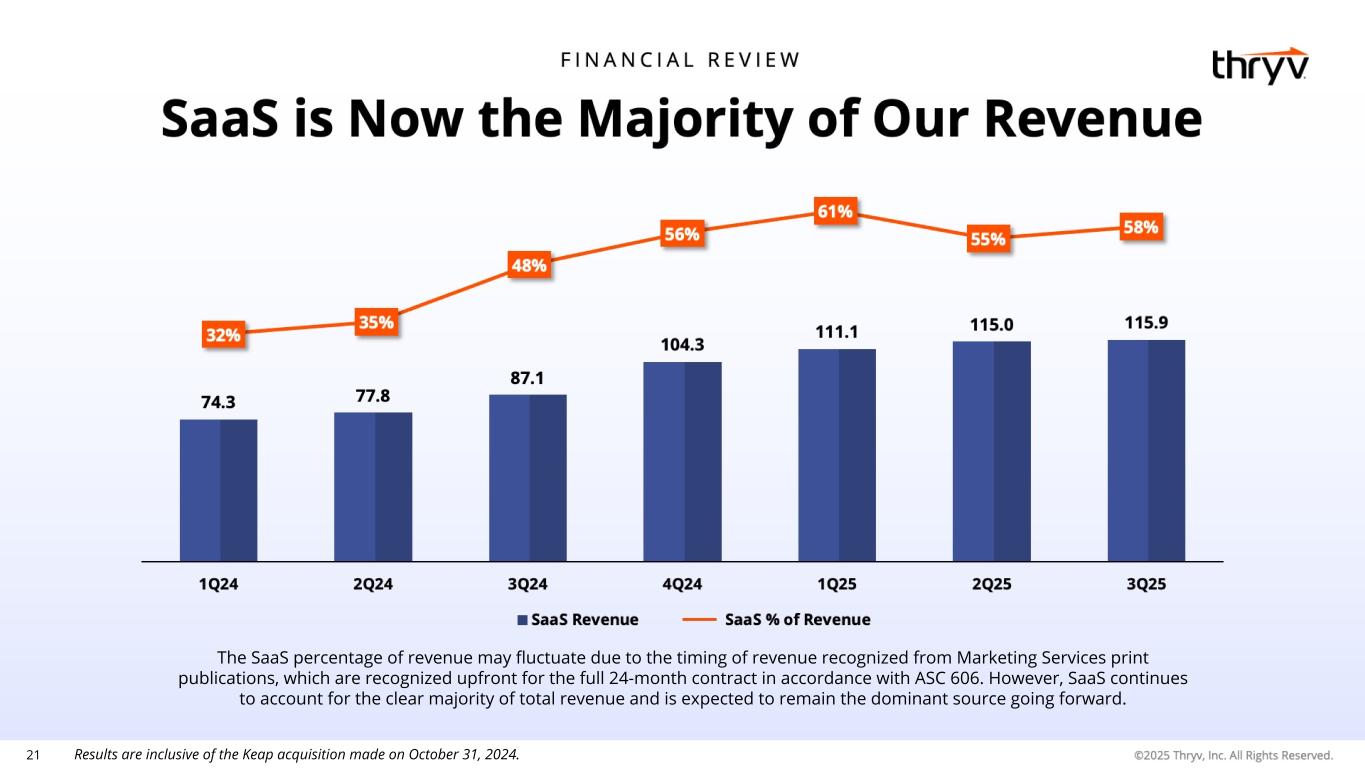
21 Results are inclusive of the Keap acquisition made on October 31, 2024. The SaaS percentage of revenue may fluctuate due to the timing of revenue recognized from Marketing Services print publications, which are recognized upfront for the full 24-month contract in accordance with ASC 606. However, SaaS continues to account for the clear majority of total revenue and is expected to remain the dominant source going forward.
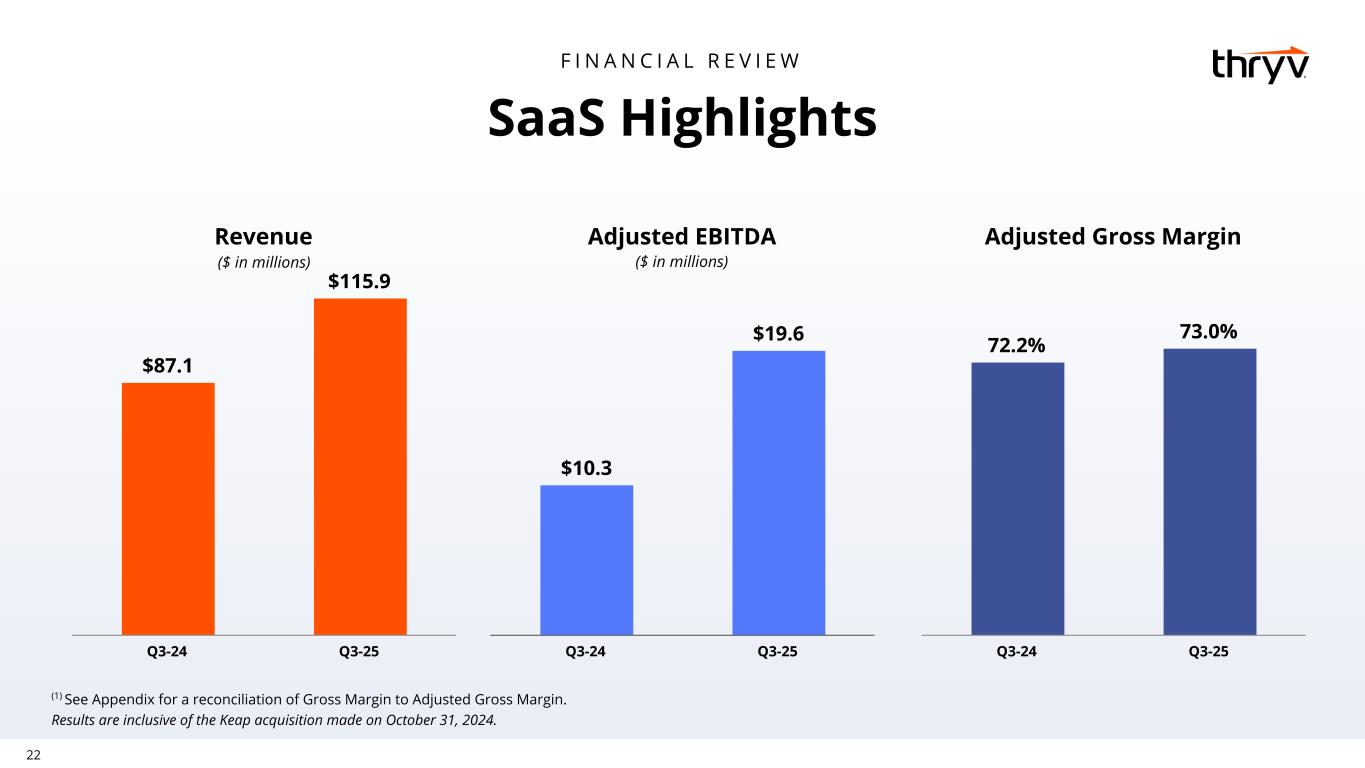
22 SaaS Highlights F I N A N C I A L R E V I E W Revenue $87.1 $115.9 Q3-24 Q3-25 Adjusted EBITDA $10.3 $19.6 Q3-24 Q3-25 Adjusted Gross Margin 72.2% 73.0% Q3-24 Q3-25 ($ in millions) Results are inclusive of the Keap acquisition made on October 31, 2024. (1) See Appendix for a reconciliation of Gross Margin to Adjusted Gross Margin. ($ in millions)
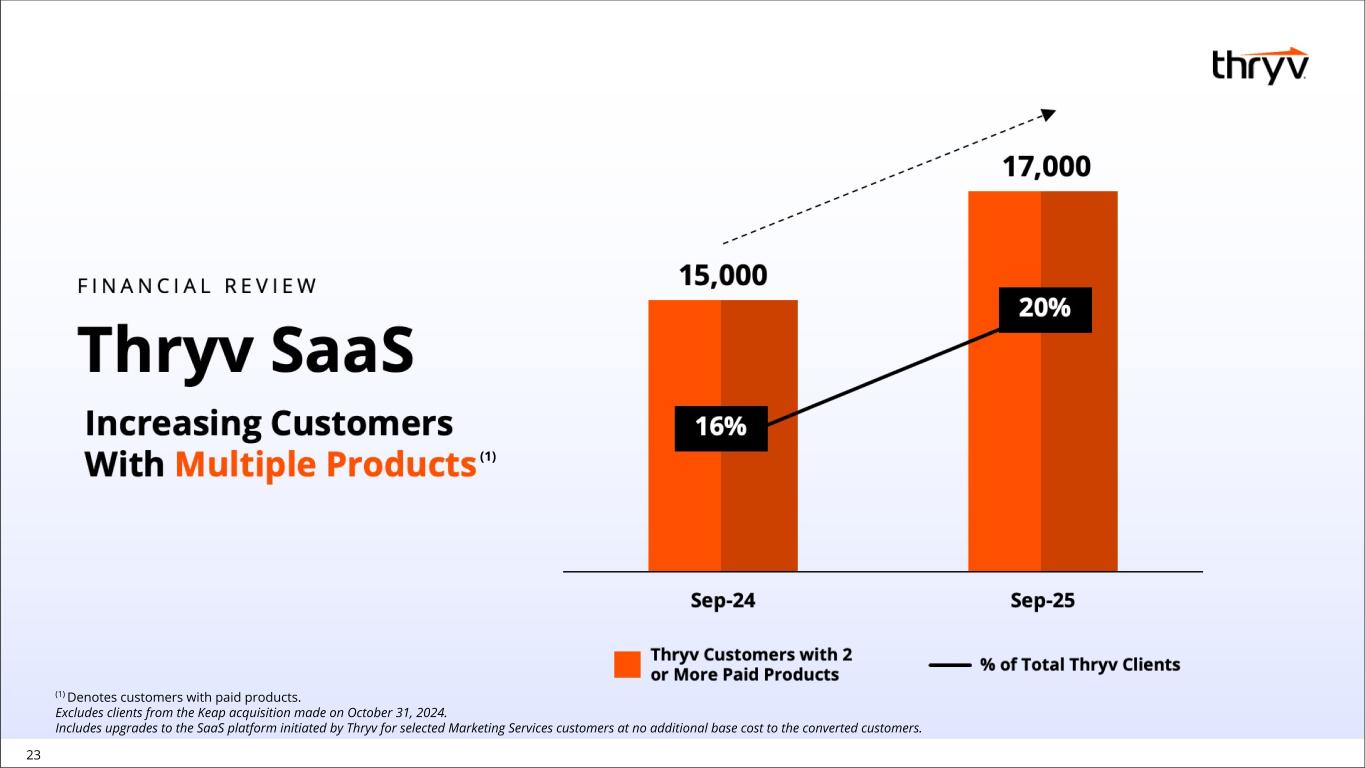
23 (1) (1) Denotes customers with paid products. Excludes clients from the Keap acquisition made on October 31, 2024. Includes upgrades to the SaaS platform initiated by Thryv for selected Marketing Services customers at no additional base cost to the converted customers.
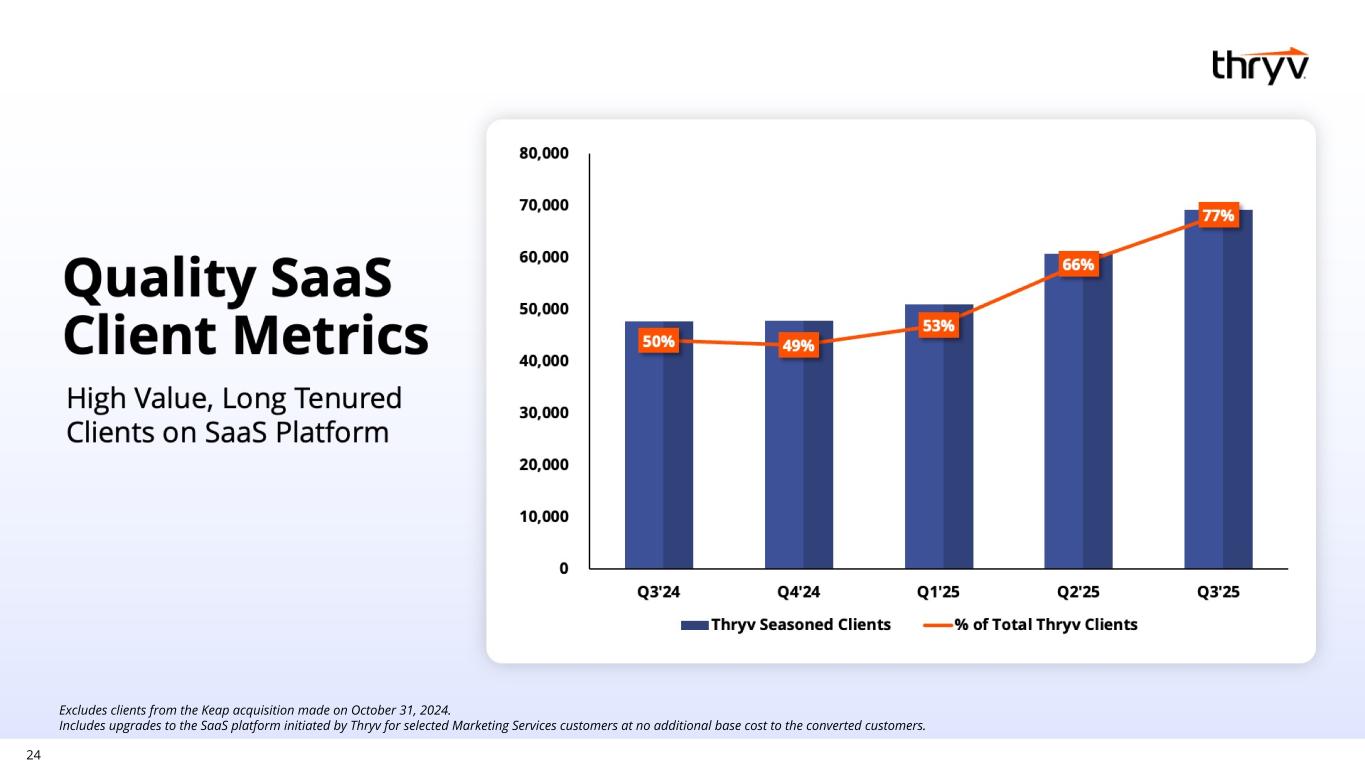
24 Excludes clients from the Keap acquisition made on October 31, 2024. Includes upgrades to the SaaS platform initiated by Thryv for selected Marketing Services customers at no additional base cost to the converted customers.
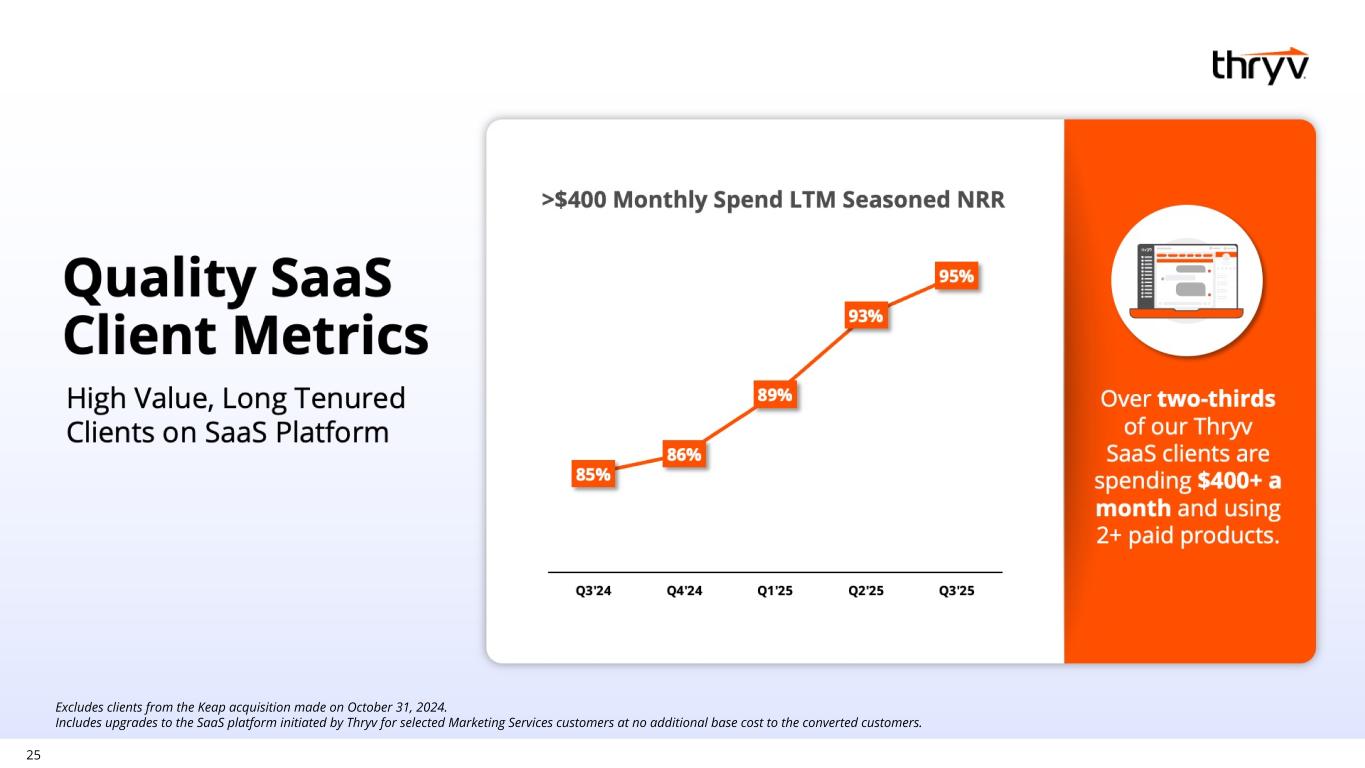
25 Excludes clients from the Keap acquisition made on October 31, 2024. Includes upgrades to the SaaS platform initiated by Thryv for selected Marketing Services customers at no additional base cost to the converted customers.
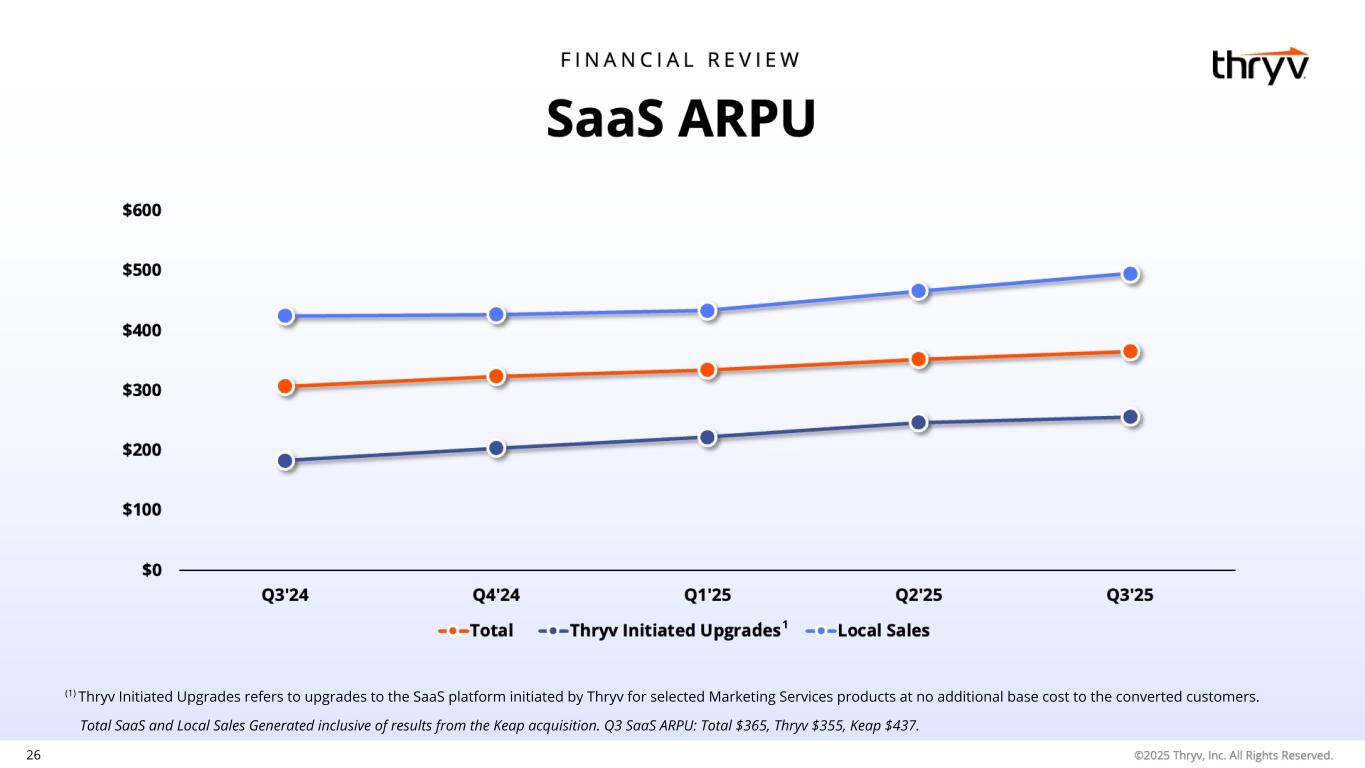
26 Total SaaS and Local Sales Generated inclusive of results from the Keap acquisition. Q3 SaaS ARPU: Total $365, Thryv $355, Keap $437. (1) Thryv Initiated Upgrades refers to upgrades to the SaaS platform initiated by Thryv for selected Marketing Services products at no additional base cost to the converted customers. 1
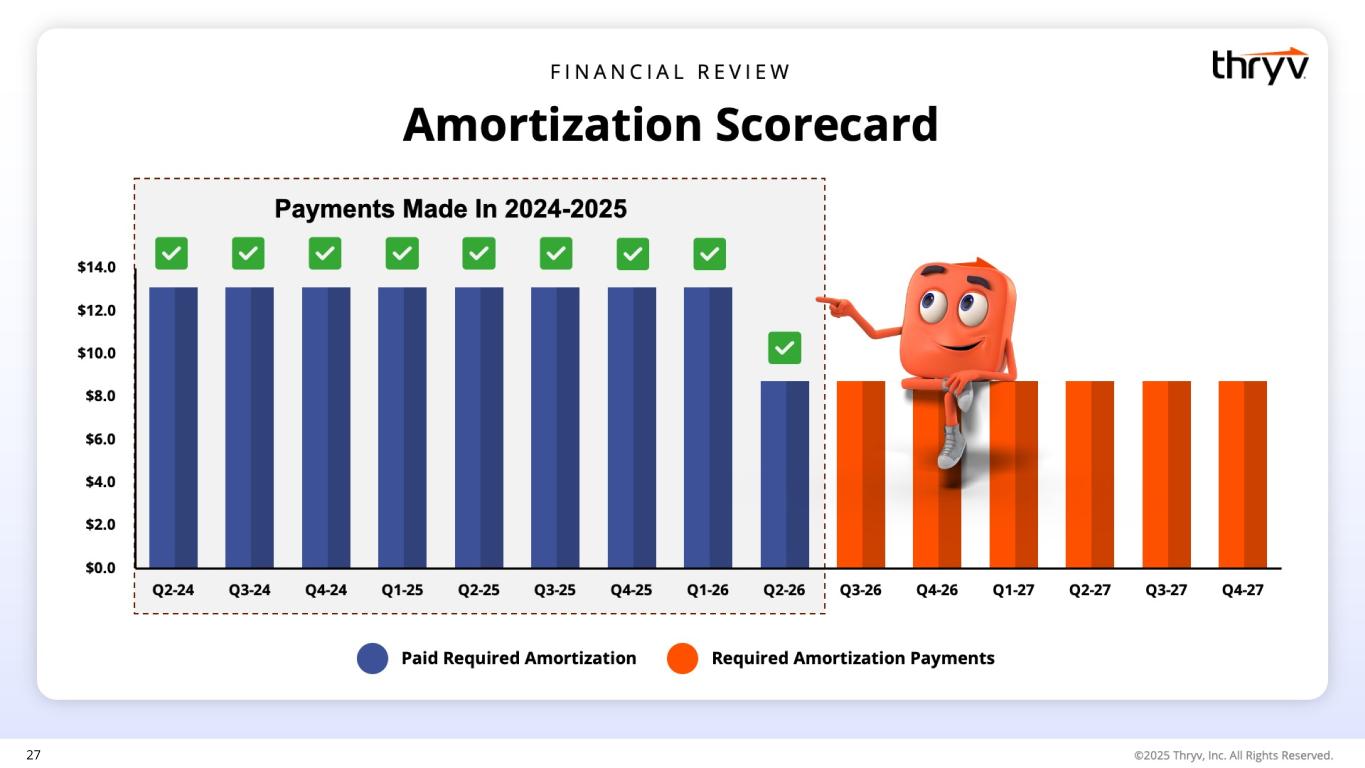
27
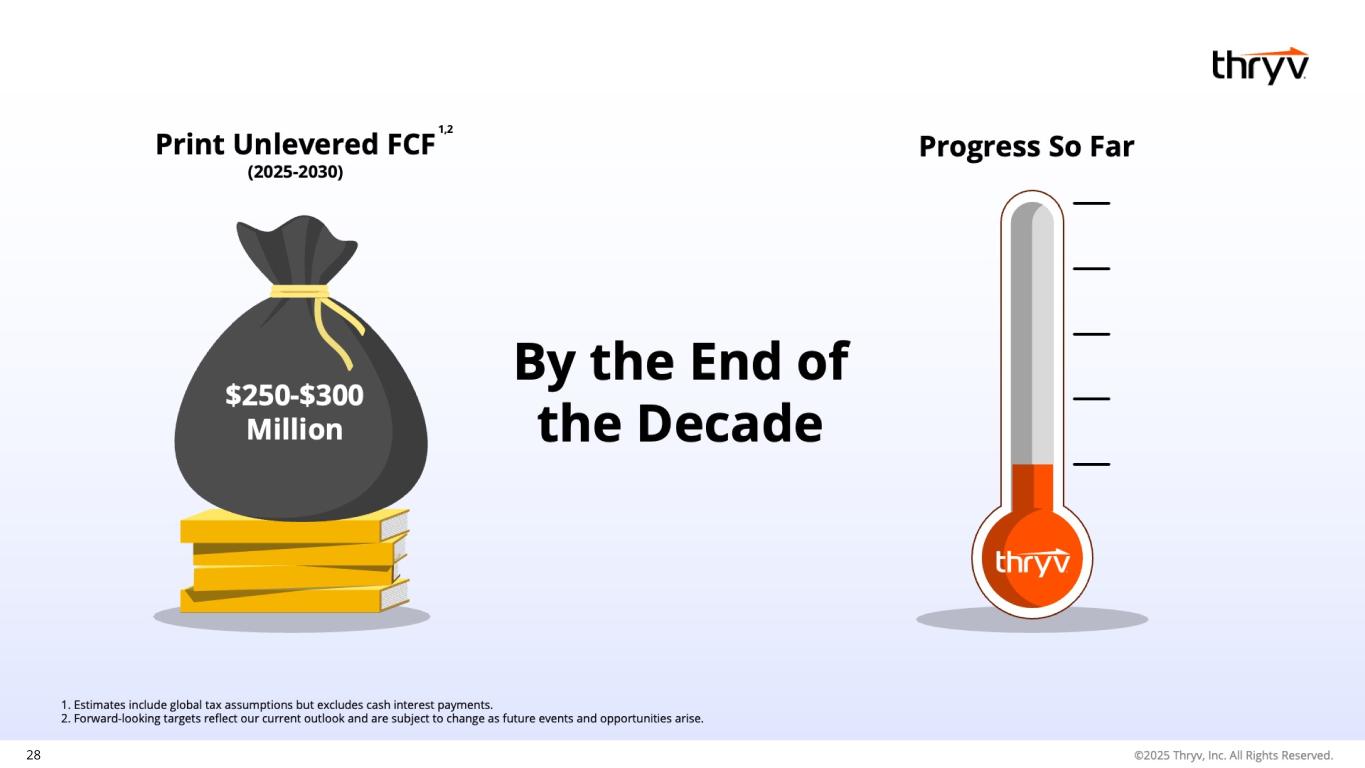
28
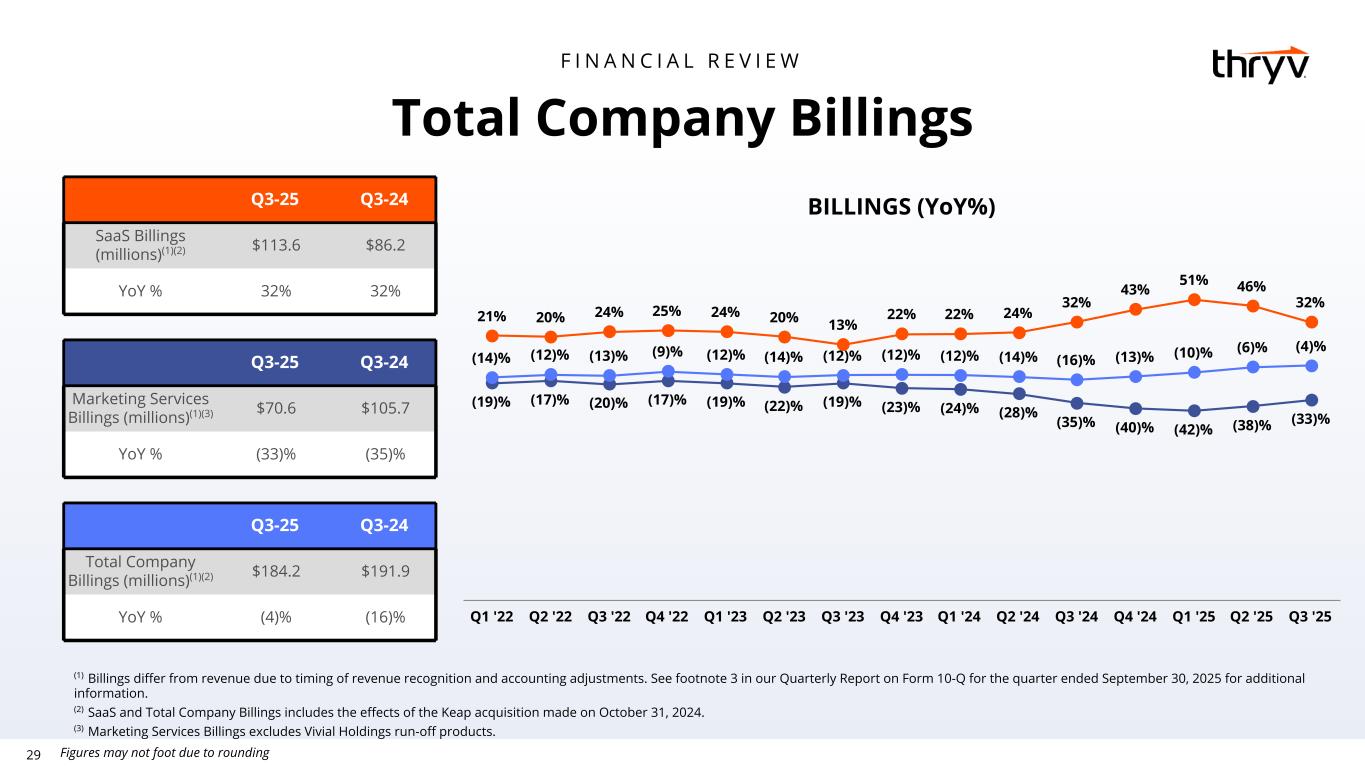
29 Q3-25 Q3-24 Marketing Services Billings (millions)(1)(3) $70.6 $105.7 YoY % (33)% (35)% BILLINGS (YoY%) (19)% (17)% (20)% (17)% (19)% (22)% (19)% (23)% (24)% (28)% (35)% (40)% (42)% (38)% (33)% 21% 20% 24% 25% 24% 20% 13% 22% 22% 24% 32% 43% 51% 46% 32% (14)% (12)% (13)% (9)% (12)% (14)% (12)% (12)% (12)% (14)% (16)% (13)% (10)% (6)% (4)% Q1 '22 Q2 '22 Q3 '22 Q4 '22 Q1 '23 Q2 '23 Q3 '23 Q4 '23 Q1 '24 Q2 '24 Q3 '24 Q4 '24 Q1 '25 Q2 '25 Q3 '25 Total Company Billings F I N A N C I A L R E V I E W Q3-25 Q3-24 SaaS Billings (millions)(1)(2) $113.6 $86.2 YoY % 32% 32% Q3-25 Q3-24 Total Company Billings (millions)(1)(2) $184.2 $191.9 YoY % (4)% (16)% (1) Billings differ from revenue due to timing of revenue recognition and accounting adjustments. See footnote 3 in our Quarterly Report on Form 10-Q for the quarter ended September 30, 2025 for additional information. (2) SaaS and Total Company Billings includes the effects of the Keap acquisition made on October 31, 2024. (3) Marketing Services Billings excludes Vivial Holdings run-off products. Figures may not foot due to rounding
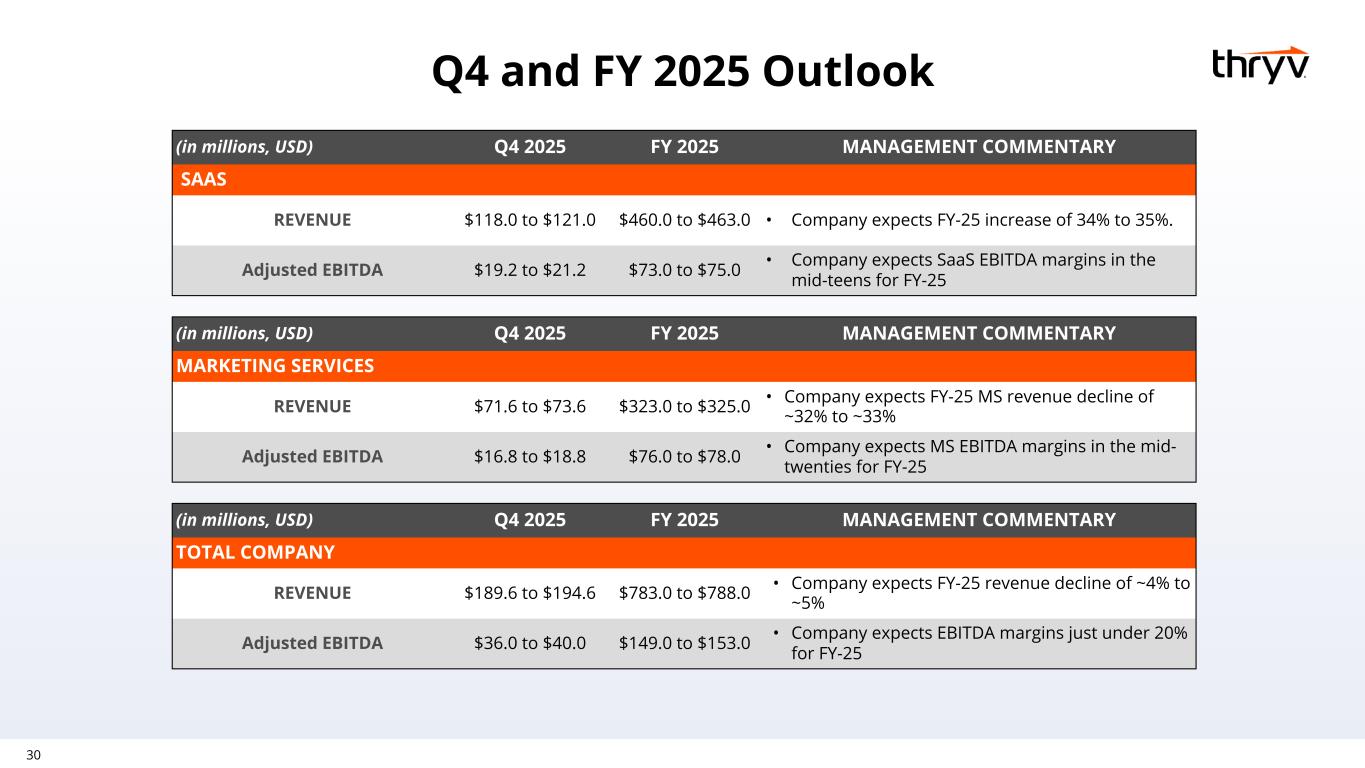
30 Q4 and FY 2025 Outlook (in millions, USD) Q4 2025 FY 2025 MANAGEMENT COMMENTARY MARKETING SERVICES REVENUE $71.6 to $73.6 $323.0 to $325.0 • Company expects FY-25 MS revenue decline of ~32% to ~33% Adjusted EBITDA $16.8 to $18.8 $76.0 to $78.0 • Company expects MS EBITDA margins in the mid- twenties for FY-25 (in millions, USD) Q4 2025 FY 2025 MANAGEMENT COMMENTARY SAAS REVENUE $118.0 to $121.0 $460.0 to $463.0 • Company expects FY-25 increase of 34% to 35%. Adjusted EBITDA $19.2 to $21.2 $73.0 to $75.0 • Company expects SaaS EBITDA margins in the mid-teens for FY-25 (in millions, USD) Q4 2025 FY 2025 MANAGEMENT COMMENTARY TOTAL COMPANY REVENUE $189.6 to $194.6 $783.0 to $788.0 • Company expects FY-25 revenue decline of ~4% to ~5% Adjusted EBITDA $36.0 to $40.0 $149.0 to $153.0 • Company expects EBITDA margins just under 20% for FY-25

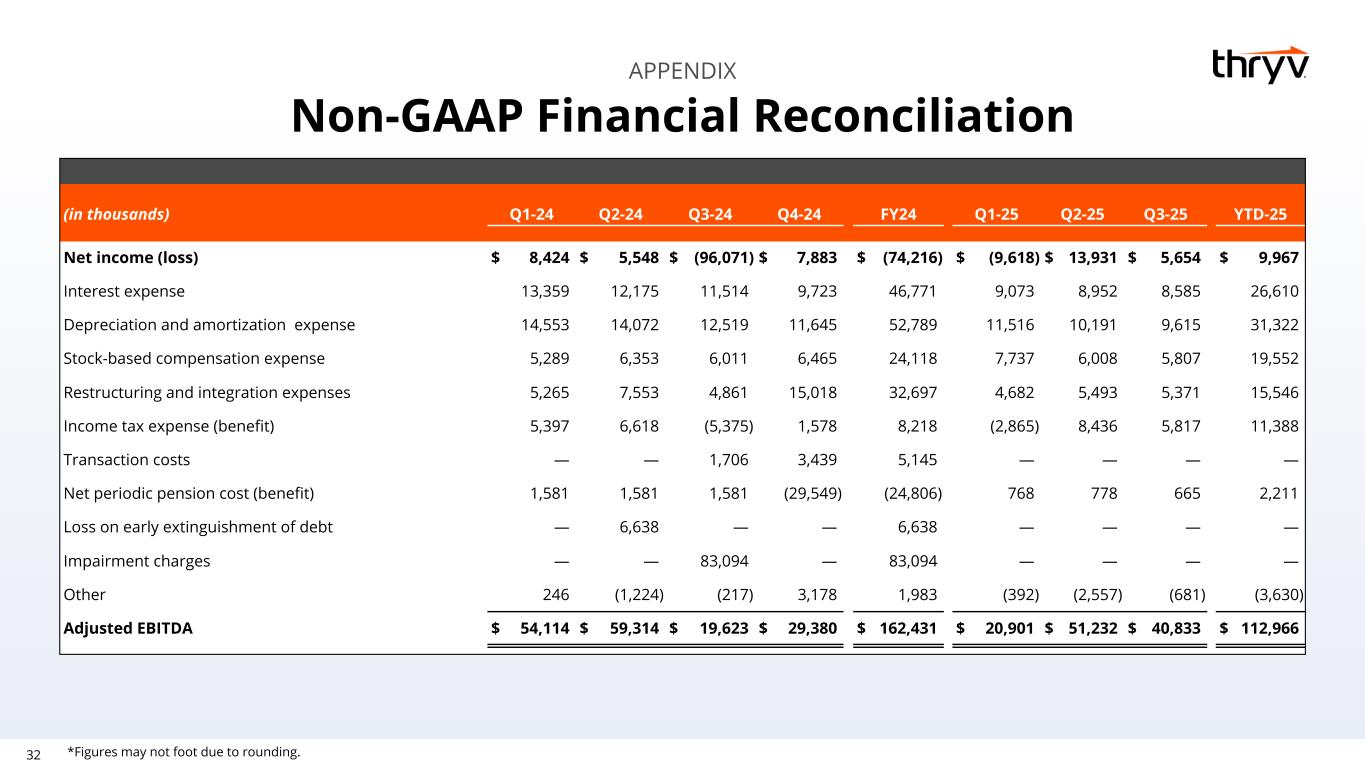
32 APPENDIX Non-GAAP Financial Reconciliation *Figures may not foot due to rounding. (in thousands) Q1-24 Q2-24 Q3-24 Q4-24 FY24 Q1-25 Q2-25 Q3-25 YTD-25 Net income (loss) $ 8,424 $ 5,548 $ (96,071) $ 7,883 $ (74,216) $ (9,618) $ 13,931 $ 5,654 $ 9,967 Interest expense 13,359 12,175 11,514 9,723 46,771 9,073 8,952 8,585 26,610 Depreciation and amortization expense 14,553 14,072 12,519 11,645 52,789 11,516 10,191 9,615 31,322 Stock-based compensation expense 5,289 6,353 6,011 6,465 24,118 7,737 6,008 5,807 19,552 Restructuring and integration expenses 5,265 7,553 4,861 15,018 32,697 4,682 5,493 5,371 15,546 Income tax expense (benefit) 5,397 6,618 (5,375) 1,578 8,218 (2,865) 8,436 5,817 11,388 Transaction costs — — 1,706 3,439 5,145 — — — — Net periodic pension cost (benefit) 1,581 1,581 1,581 (29,549) (24,806) 768 778 665 2,211 Loss on early extinguishment of debt — 6,638 — — 6,638 — — — — Impairment charges — — 83,094 — 83,094 — — — — Other 246 (1,224) (217) 3,178 1,983 (392) (2,557) (681) (3,630) Adjusted EBITDA $ 54,114 $ 59,314 $ 19,623 $ 29,380 $ 162,431 $ 20,901 $ 51,232 $ 40,833 $ 112,966
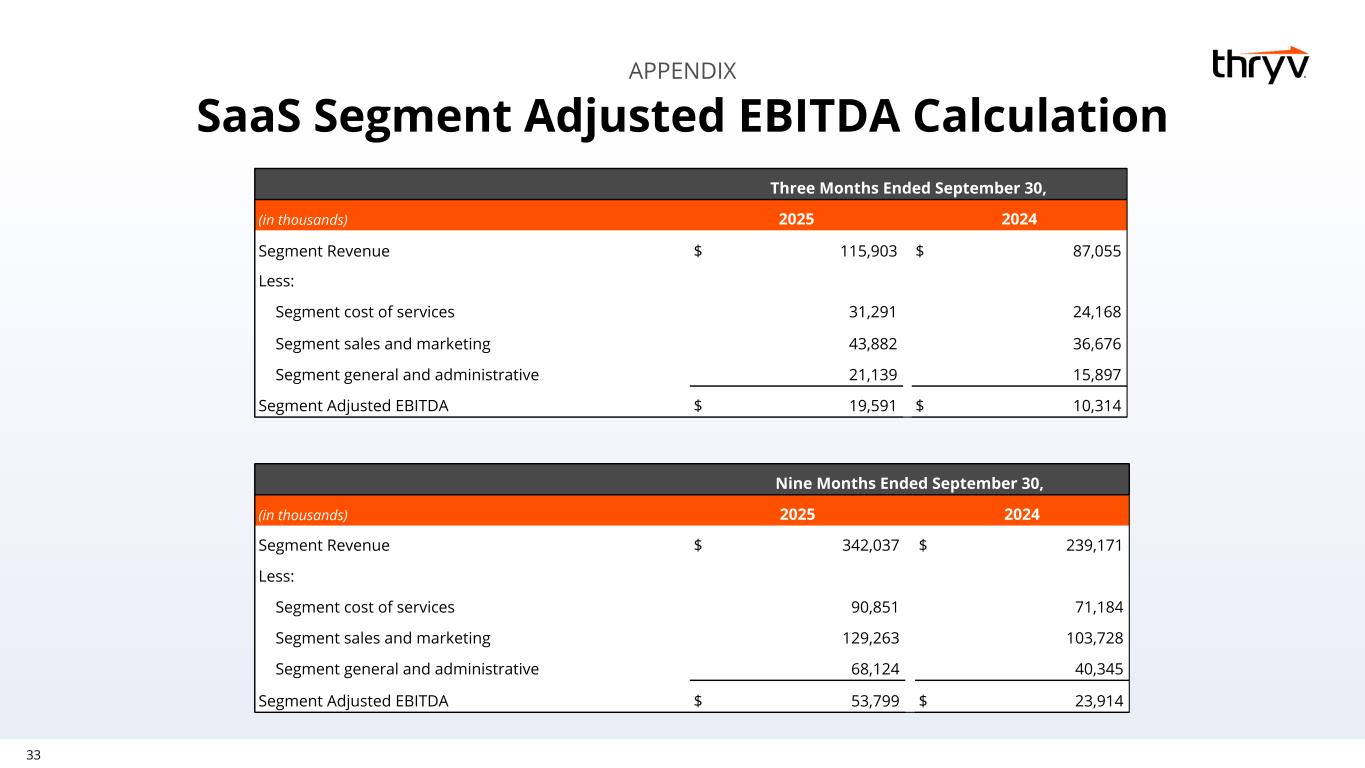
33 APPENDIX Three Months Ended September 30, (in thousands) 2025 2024 Segment Revenue $ 115,903 $ 87,055 Less: Segment cost of services 31,291 24,168 Segment sales and marketing 43,882 36,676 Segment general and administrative 21,139 15,897 Segment Adjusted EBITDA $ 19,591 $ 10,314 SaaS Segment Adjusted EBITDA Calculation Nine Months Ended September 30, (in thousands) 2025 2024 Segment Revenue $ 342,037 $ 239,171 Less: Segment cost of services 90,851 71,184 Segment sales and marketing 129,263 103,728 Segment general and administrative 68,124 40,345 Segment Adjusted EBITDA $ 53,799 $ 23,914
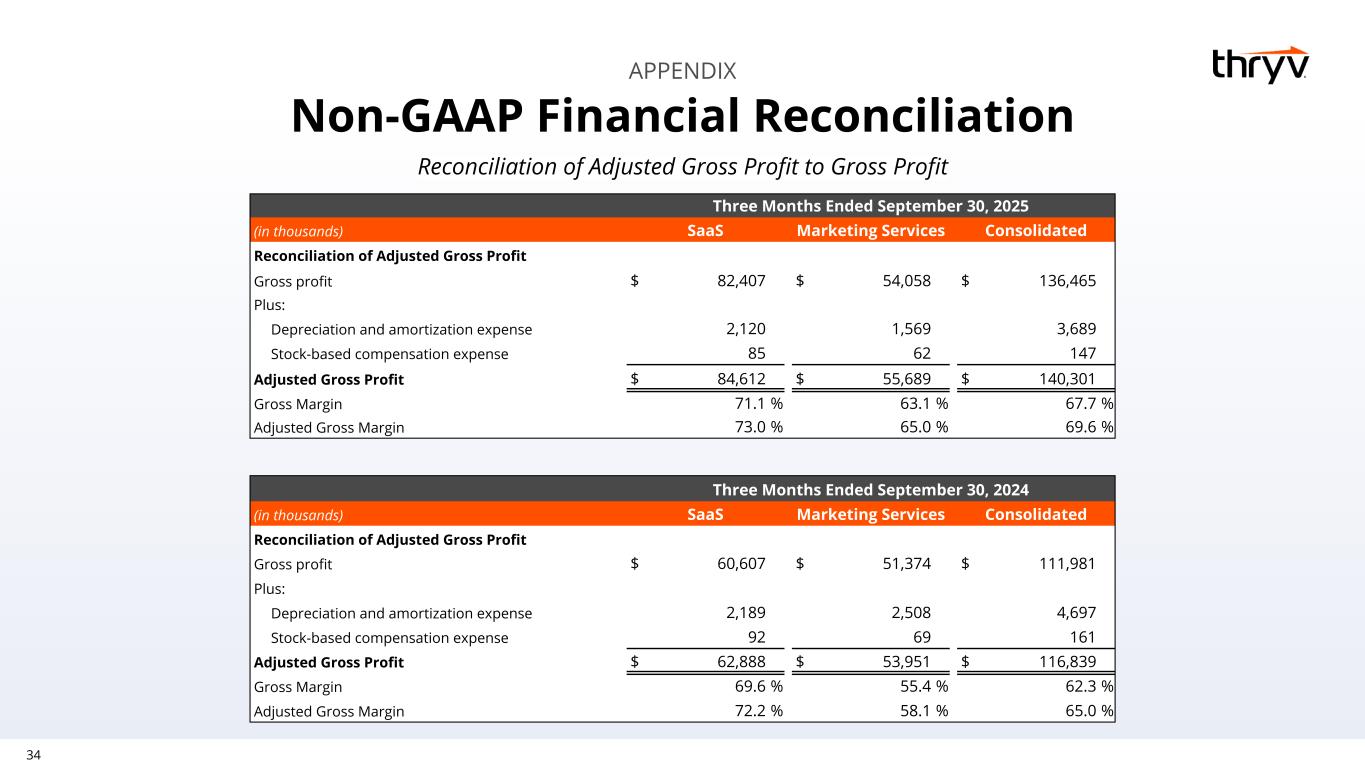
34 Reconciliation of Adjusted Gross Profit to Gross Profit APPENDIX Three Months Ended September 30, 2025 (in thousands) SaaS Marketing Services Consolidated Reconciliation of Adjusted Gross Profit Gross profit $ 82,407 $ 54,058 $ 136,465 Plus: Depreciation and amortization expense 2,120 1,569 3,689 Stock-based compensation expense 85 62 147 Adjusted Gross Profit $ 84,612 $ 55,689 $ 140,301 Gross Margin 71.1 % 63.1 % 67.7 % Adjusted Gross Margin 73.0 % 65.0 % 69.6 % Three Months Ended September 30, 2024 (in thousands) SaaS Marketing Services Consolidated Reconciliation of Adjusted Gross Profit Gross profit $ 60,607 $ 51,374 $ 111,981 Plus: Depreciation and amortization expense 2,189 2,508 4,697 Stock-based compensation expense 92 69 161 Adjusted Gross Profit $ 62,888 $ 53,951 $ 116,839 Gross Margin 69.6 % 55.4 % 62.3 % Adjusted Gross Margin 72.2 % 58.1 % 65.0 % Non-GAAP Financial Reconciliation
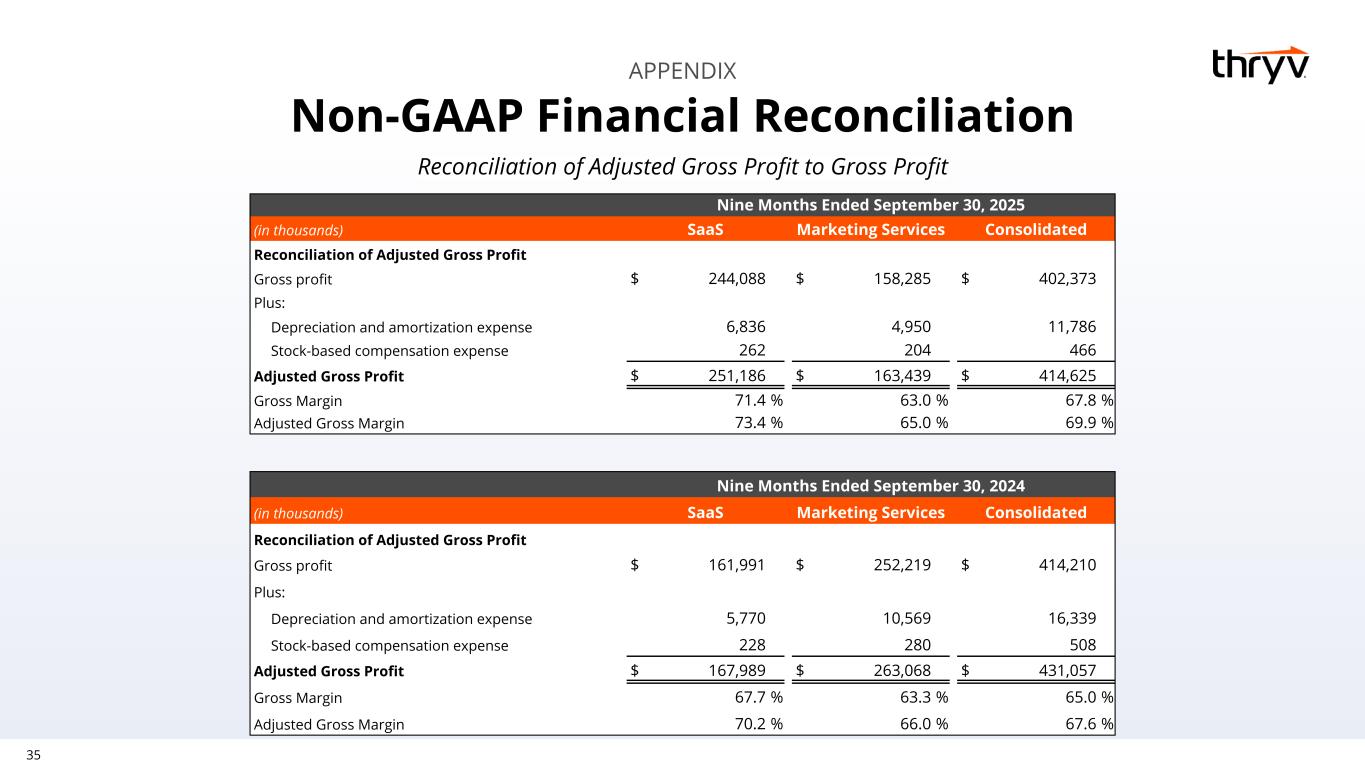
35 Reconciliation of Adjusted Gross Profit to Gross Profit APPENDIX Non-GAAP Financial Reconciliation Nine Months Ended September 30, 2025 (in thousands) SaaS Marketing Services Consolidated Reconciliation of Adjusted Gross Profit Gross profit $ 244,088 $ 158,285 $ 402,373 Plus: Depreciation and amortization expense 6,836 4,950 11,786 Stock-based compensation expense 262 204 466 Adjusted Gross Profit $ 251,186 $ 163,439 $ 414,625 Gross Margin 71.4 % 63.0 % 67.8 % Adjusted Gross Margin 73.4 % 65.0 % 69.9 % Nine Months Ended September 30, 2024 (in thousands) SaaS Marketing Services Consolidated Reconciliation of Adjusted Gross Profit Gross profit $ 161,991 $ 252,219 $ 414,210 Plus: Depreciation and amortization expense 5,770 10,569 16,339 Stock-based compensation expense 228 280 508 Adjusted Gross Profit $ 167,989 $ 263,068 $ 431,057 Gross Margin 67.7 % 63.3 % 65.0 % Adjusted Gross Margin 70.2 % 66.0 % 67.6 %
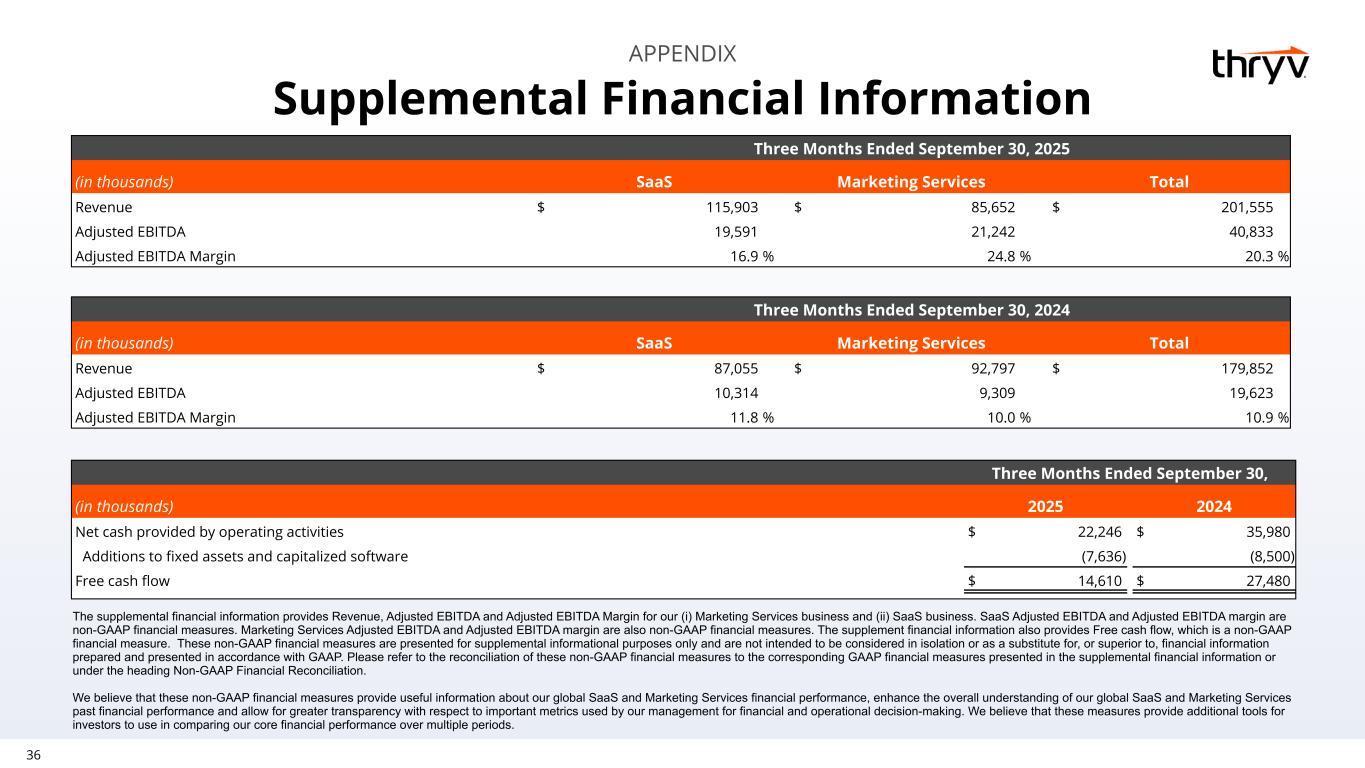
36 APPENDIX Supplemental Financial Information The supplemental financial information provides Revenue, Adjusted EBITDA and Adjusted EBITDA Margin for our (i) Marketing Services business and (ii) SaaS business. SaaS Adjusted EBITDA and Adjusted EBITDA margin are non-GAAP financial measures. Marketing Services Adjusted EBITDA and Adjusted EBITDA margin are also non-GAAP financial measures. The supplement financial information also provides Free cash flow, which is a non-GAAP financial measure. These non-GAAP financial measures are presented for supplemental informational purposes only and are not intended to be considered in isolation or as a substitute for, or superior to, financial information prepared and presented in accordance with GAAP. Please refer to the reconciliation of these non-GAAP financial measures to the corresponding GAAP financial measures presented in the supplemental financial information or under the heading Non-GAAP Financial Reconciliation. We believe that these non-GAAP financial measures provide useful information about our global SaaS and Marketing Services financial performance, enhance the overall understanding of our global SaaS and Marketing Services past financial performance and allow for greater transparency with respect to important metrics used by our management for financial and operational decision-making. We believe that these measures provide additional tools for investors to use in comparing our core financial performance over multiple periods. Three Months Ended September 30, 2025 (in thousands) SaaS Marketing Services Total Revenue $ 115,903 $ 85,652 $ 201,555 Adjusted EBITDA 19,591 21,242 40,833 Adjusted EBITDA Margin 16.9 % 24.8 % 20.3 % Three Months Ended September 30, (in thousands) 2025 2024 Net cash provided by operating activities $ 22,246 $ 35,980 Additions to fixed assets and capitalized software (7,636) (8,500) Free cash flow $ 14,610 $ 27,480 Three Months Ended September 30, 2024 (in thousands) SaaS Marketing Services Total Revenue $ 87,055 $ 92,797 $ 179,852 Adjusted EBITDA 10,314 9,309 19,623 Adjusted EBITDA Margin 11.8 % 10.0 % 10.9 %
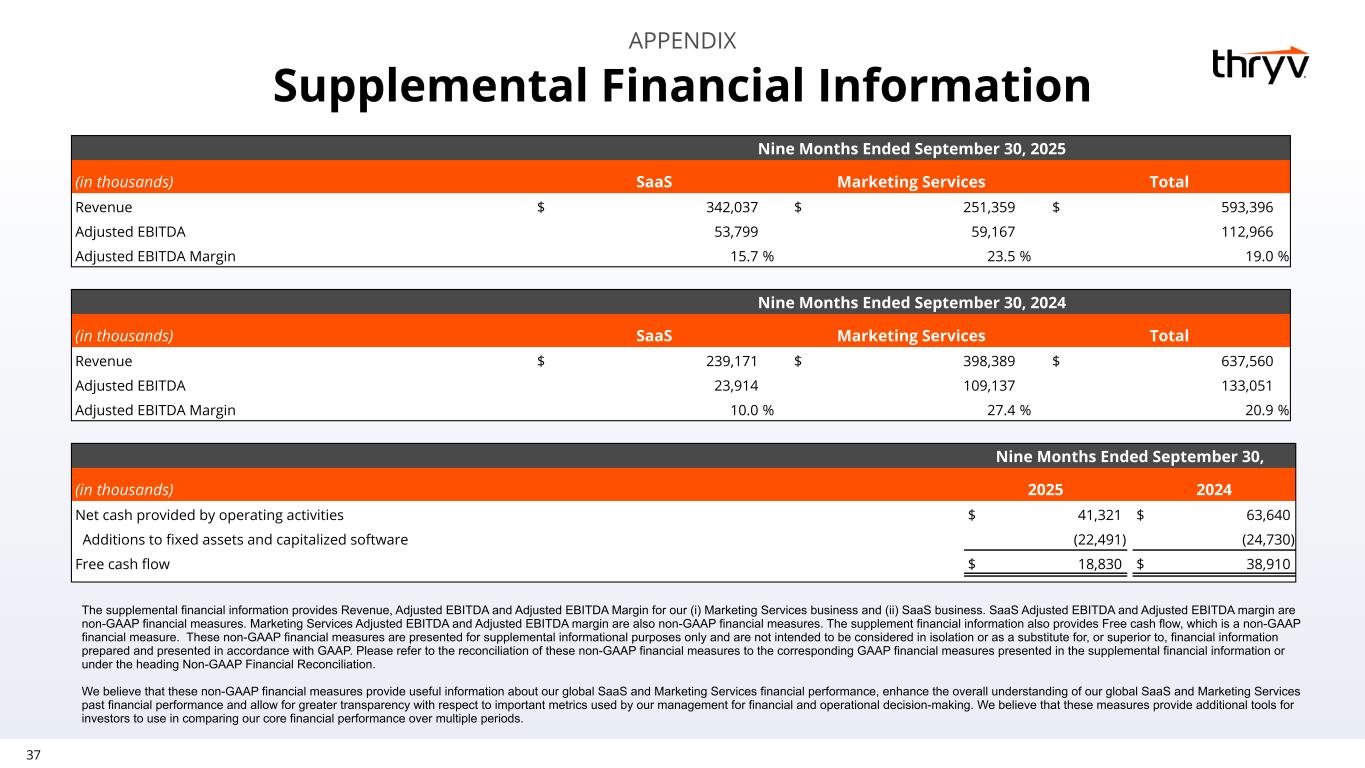
37 APPENDIX Nine Months Ended September 30, (in thousands) 2025 2024 Net cash provided by operating activities $ 41,321 $ 63,640 Additions to fixed assets and capitalized software (22,491) (24,730) Free cash flow $ 18,830 $ 38,910 Supplemental Financial Information Nine Months Ended September 30, 2025 (in thousands) SaaS Marketing Services Total Revenue $ 342,037 $ 251,359 $ 593,396 Adjusted EBITDA 53,799 59,167 112,966 Adjusted EBITDA Margin 15.7 % 23.5 % 19.0 % Nine Months Ended September 30, 2024 (in thousands) SaaS Marketing Services Total Revenue $ 239,171 $ 398,389 $ 637,560 Adjusted EBITDA 23,914 109,137 133,051 Adjusted EBITDA Margin 10.0 % 27.4 % 20.9 % The supplemental financial information provides Revenue, Adjusted EBITDA and Adjusted EBITDA Margin for our (i) Marketing Services business and (ii) SaaS business. SaaS Adjusted EBITDA and Adjusted EBITDA margin are non-GAAP financial measures. Marketing Services Adjusted EBITDA and Adjusted EBITDA margin are also non-GAAP financial measures. The supplement financial information also provides Free cash flow, which is a non-GAAP financial measure. These non-GAAP financial measures are presented for supplemental informational purposes only and are not intended to be considered in isolation or as a substitute for, or superior to, financial information prepared and presented in accordance with GAAP. Please refer to the reconciliation of these non-GAAP financial measures to the corresponding GAAP financial measures presented in the supplemental financial information or under the heading Non-GAAP Financial Reconciliation. We believe that these non-GAAP financial measures provide useful information about our global SaaS and Marketing Services financial performance, enhance the overall understanding of our global SaaS and Marketing Services past financial performance and allow for greater transparency with respect to important metrics used by our management for financial and operational decision-making. We believe that these measures provide additional tools for investors to use in comparing our core financial performance over multiple periods.
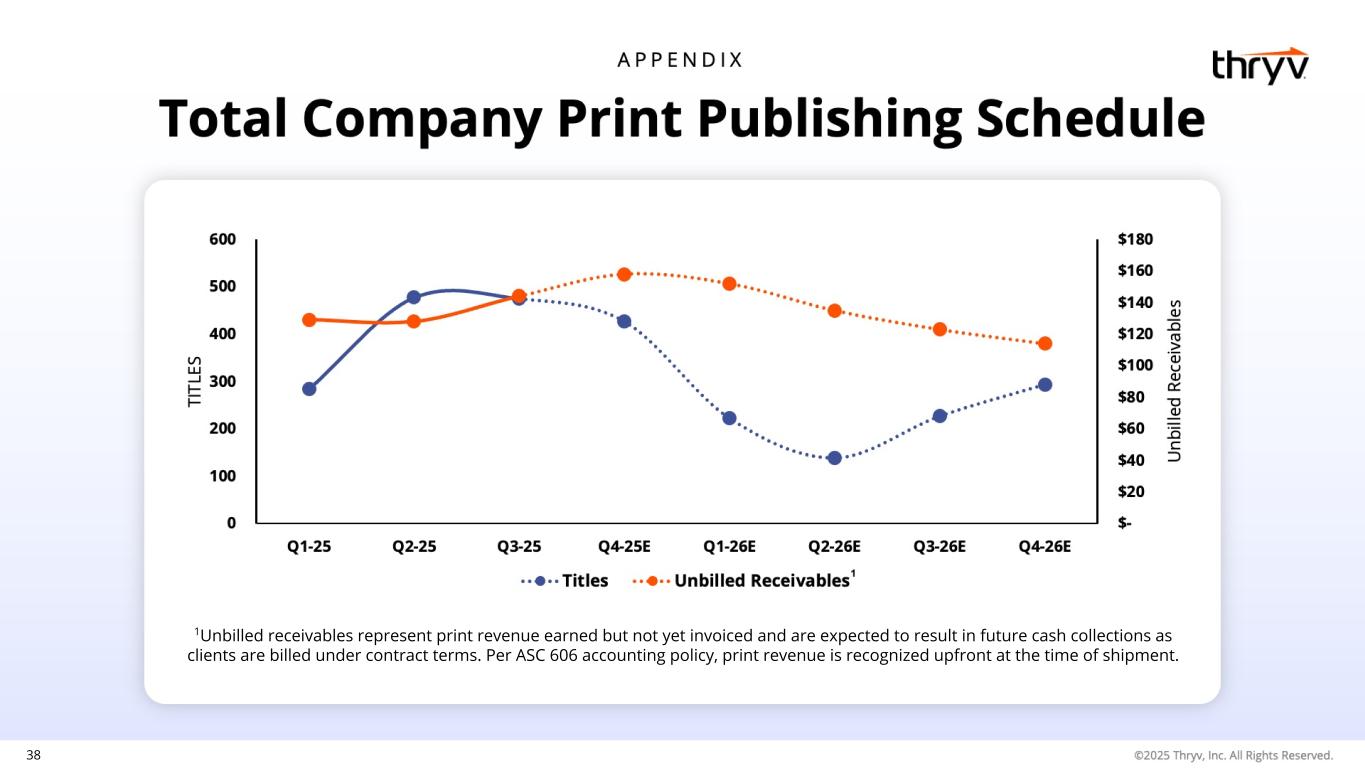
38 1Unbilled receivables represent print revenue earned but not yet invoiced and are expected to result in future cash collections as clients are billed under contract terms. Per ASC 606 accounting policy, print revenue is recognized upfront at the time of shipment.
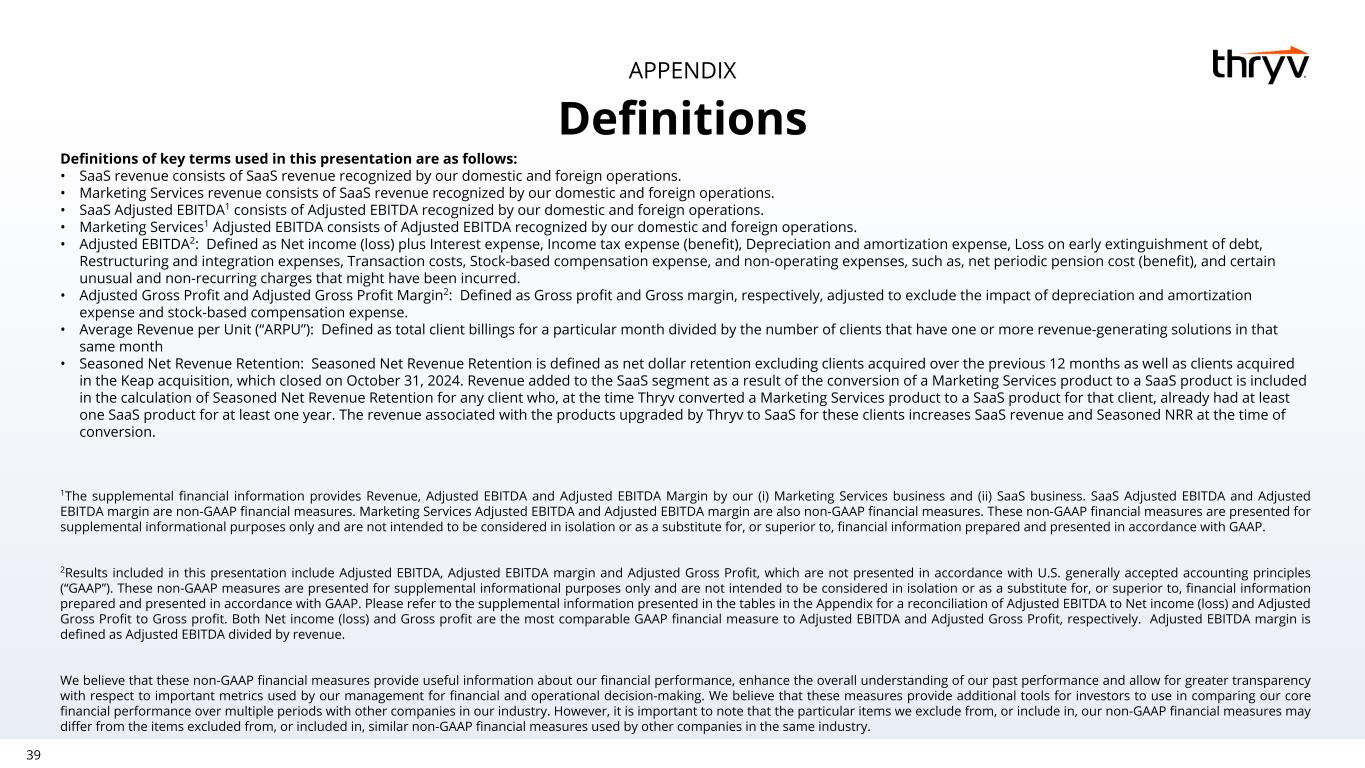
39 APPENDIX Definitions Definitions of key terms used in this presentation are as follows: • SaaS revenue consists of SaaS revenue recognized by our domestic and foreign operations. • Marketing Services revenue consists of SaaS revenue recognized by our domestic and foreign operations. • SaaS Adjusted EBITDA1 consists of Adjusted EBITDA recognized by our domestic and foreign operations. • Marketing Services1 Adjusted EBITDA consists of Adjusted EBITDA recognized by our domestic and foreign operations. • Adjusted EBITDA2: Defined as Net income (loss) plus Interest expense, Income tax expense (benefit), Depreciation and amortization expense, Loss on early extinguishment of debt, Restructuring and integration expenses, Transaction costs, Stock-based compensation expense, and non-operating expenses, such as, net periodic pension cost (benefit), and certain unusual and non-recurring charges that might have been incurred. • Adjusted Gross Profit and Adjusted Gross Profit Margin2: Defined as Gross profit and Gross margin, respectively, adjusted to exclude the impact of depreciation and amortization expense and stock-based compensation expense. • Average Revenue per Unit (“ARPU”): Defined as total client billings for a particular month divided by the number of clients that have one or more revenue-generating solutions in that same month • Seasoned Net Revenue Retention: Seasoned Net Revenue Retention is defined as net dollar retention excluding clients acquired over the previous 12 months as well as clients acquired in the Keap acquisition, which closed on October 31, 2024. Revenue added to the SaaS segment as a result of the conversion of a Marketing Services product to a SaaS product is included in the calculation of Seasoned Net Revenue Retention for any client who, at the time Thryv converted a Marketing Services product to a SaaS product for that client, already had at least one SaaS product for at least one year. The revenue associated with the products upgraded by Thryv to SaaS for these clients increases SaaS revenue and Seasoned NRR at the time of conversion. 1The supplemental financial information provides Revenue, Adjusted EBITDA and Adjusted EBITDA Margin by our (i) Marketing Services business and (ii) SaaS business. SaaS Adjusted EBITDA and Adjusted EBITDA margin are non-GAAP financial measures. Marketing Services Adjusted EBITDA and Adjusted EBITDA margin are also non-GAAP financial measures. These non-GAAP financial measures are presented for supplemental informational purposes only and are not intended to be considered in isolation or as a substitute for, or superior to, financial information prepared and presented in accordance with GAAP. 2Results included in this presentation include Adjusted EBITDA, Adjusted EBITDA margin and Adjusted Gross Profit, which are not presented in accordance with U.S. generally accepted accounting principles (“GAAP”). These non-GAAP measures are presented for supplemental informational purposes only and are not intended to be considered in isolation or as a substitute for, or superior to, financial information prepared and presented in accordance with GAAP. Please refer to the supplemental information presented in the tables in the Appendix for a reconciliation of Adjusted EBITDA to Net income (loss) and Adjusted Gross Profit to Gross profit. Both Net income (loss) and Gross profit are the most comparable GAAP financial measure to Adjusted EBITDA and Adjusted Gross Profit, respectively. Adjusted EBITDA margin is defined as Adjusted EBITDA divided by revenue. We believe that these non-GAAP financial measures provide useful information about our financial performance, enhance the overall understanding of our past performance and allow for greater transparency with respect to important metrics used by our management for financial and operational decision-making. We believe that these measures provide additional tools for investors to use in comparing our core financial performance over multiple periods with other companies in our industry. However, it is important to note that the particular items we exclude from, or include in, our non-GAAP financial measures may differ from the items excluded from, or included in, similar non-GAAP financial measures used by other companies in the same industry.