UNITED STATES
SECURITIES AND EXCHANGE COMMISSION
Washington, D.C. 20549
FORM N-CSR
CERTIFIED SHAREHOLDER REPORT OF REGISTERED
MANAGEMENT INVESTMENT COMPANIES
Investment Company Act File Number 811-22759
The Private Shares Fund
(Exact name of registrant as specified in charter)
88 Pine Street, 31st Floor, Suite 3101
New York, NY 10005
(Address of principal executive offices) (Zip code)
Cogency Global, Inc.
c/o The Private Shares Fund
850 New Burton Rd. Ste. 201
City of Dover, County of Kent, Delaware 19904
(Name and address of agent for service)
Copies to:
Dechert LLP
45 Fremont Street, 26th Floor
San Francisco, CA 94105
Registrant's telephone number, including area code: (646) 839-5548
Date of fiscal year end: December 31
Date of reporting period: December 31, 2024
Item 1. Reports to Stockholders.
(a) The following is a copy of the report transmitted to shareholders pursuant to Rule 30e-1 under the Investment Company Act of 1940, as amended.
|
THE PRIVATE SHARES FUND |
|
|
|
Table of Contents |
||
|
2 |
||
|
4 |
||
|
7 |
||
|
8 |
||
|
10 |
||
|
17 |
||
|
18 |
||
|
19 |
||
|
20 |
||
|
21 |
||
|
24 |
||
|
36 |
||
|
37 |
||
|
39 |
1
PORTFOLIO MANAGER COMMENTARY
The Private Shares Fund (the “Fund” or “PSF”) can report that for the fourth quarter and full year 2024, the Fund generated a total return of 6.91% and 11.66%, respectively, as measured by the Fund’s Institutional Class (PIIVX). It is worth noting that the fourth quarter return of 6.91% represents the third best quarter since PIIVX’s inception.
The Portfolio Managers (“PMs”) continue to believe there is significant upside potential to current NAV across what we view as a best-in-class portfolio of late-stage, growth-oriented private innovation companies. In addition to new rounds of financing at higher valuations including SpaceX, Databricks and xAI, four of the Fund’s holdings have filed to go public. The PMs believe the Fund is well positioned to benefit from the prospect of improving macroeconomic conditions and less stringent regulations, which are likely to drive increased exit (e.g., Mergers & Acquisitions, IPO, etc.) and financing activity in 2025.
As of December 31, 2024, the average and median portfolio company revenue were $805 million and $158 million, respectively, with corresponding average and median revenue growth rates of 41% and 26%. Furthermore, 39% of the underlying portfolio companies were profitable. To be clear, these revenue and profitability metrics represent historic highs for the Fund.
Despite these record high operating metrics, 45% of the Fund’s holdings are priced below their last round using the Investment Adviser’s methodology, which represents approximately 30% of the Fund’s invested Assets Under Management (AUM). Of these investments, the average discount to last round is 36%. In our opinion, this represents significant embedded value.
As previously reported, we have been observing and discussing improving capital deployment and valuation trends for the past several quarters and continue to closely monitor this data across the venture capital and growth ecosystem. However, there continues to be a significant valuation disparity between late-stage private companies and public comparables, with the former trading at substantial relative discounts by most measures. While the Fed’s decision to continue to cut rates in December is a positive development, further rate cuts in the near-term are uncertain. In parallel, many investors remain liquidity constrained due to a lack of distributions, which further extends the already fertile ground for investors with dry powder to negotiate more favorable terms. Although we anticipate and encourage investors to remain highly selective and disciplined, we expect these trends to continue improving over the coming quarters, which should bode well for the Fund as recent headwinds potentially shift into tailwinds.
VC MARKET UPDATE
The National Venture Capital Association (NVCA) reported approximately 2,859 U.S. Venture Capital (VC)-backed deals closed in the fourth quarter of 2024 with an aggregate deal value of $74.6 billion. This pace of deal activity marks the highest levels in 10 quarters and far exceeds all pre-Covid levels. Full year 2024 VC deal activity came in at aggregate deal value of $209 billion, the third highest on record.
Although VC dry powder now sits at roughly $300 billion, there continues to be a significant supply/demand ratio imbalance as investors exhibit greater discipline. As a result, this creates greater negotiating leverage for active investors willing to commit capital in both secondary transactions and new financing rounds. That said, high-performing companies demonstrating strong operating metrics should continue to be rewarded with more attractive valuations.
Late-stage deal activity closed in the fourth quarter hit $33.4 billion, the highest level in 12 quarters. Full year 2024 late-stage deal activity hit $86.7 billion, the third highest on record. While it is believed that many late-stage companies continue sitting on substantial cash balances following the surge in capital raising over the prior couple years while in parallel implementing business efficiency measures, we believe deal activity is likely to pick up as the valuation and exit environment improve.
As previously reported, during the fourth quarter of 2022, the NVCA created a new category called venture-growth stage deals, which they define as any financing that is Series E or later or any VC financing of a company that is at least seven years old and has raised at least six VC rounds. The purpose is to better distinguish the mitigated risk/reward profile of these more mature companies compared to all VC deals. Venture-growth deal activity in the fourth quarter of $25.6 billion represents a new record, while full year 2024 activity of $52.9 billion represents the second highest on record.
Similar to the aforementioned trends, early-stage VC activity for full year 2024 of $54.7 billion is the second highest on record.
2
|
THE PRIVATE SHARES FUND |
|
Shareholder Letter (Continued) |
In terms of liquidity, VC exit activity for the fourth quarter of 2024 was higher in both exit count and deal value. Increases in corporate M&A activity and private equity-led buyouts are likely to continue in 2025 with improving macroeconomic conditions and expectations for a less stringent regulatory environment under the new Presidential administration. In parallel, we are looking at one of the largest and most compelling IPO backlogs in recent history, with many high-performing technology and innovation companies that are generating a healthy balance of strong growth rates and profitability. As recently reported, 18 of PSF’s holdings were cited by CB Insights as being amongst the highest profile IPO candidates for the next exit cycle. Based on our continued conversations with the Fund’s portfolio holdings, investment bankers and public market investors, we expect to see a pickup in public market offerings over the coming quarters.
As always, we are grateful for your continued support and welcome the opportunity to share further insights around our optimism for the Fund heading into 2025.
NEW PORTFOLIO ADDITIONS (2024)
xAi
xAi, founded by Elon Musk, is an artificial intelligence company focused on developing advanced AI systems to accelerate scientific discovery and enhance human understanding.
PORTFOLIO ADD-ONS (2024)
Northgate Growth Fund III
Northgate Growth Fund III is a special-purpose vehicle that holds an underlying private fund investment.
Voyager Technologies
Voyager Technologies is a defense and space company specializing in commercial space station development and national security solutions.
Tradeshift
Tradeshift develops financial platform software designed to drive supply chain innovation in the digital economy.
PORTFOLIO COMPANY LIQUIDITY ACTIVITY (2024)
Rubrik
On April 25, 2024, Rubrik (RBRK) began trading on the New York Stock Exchange at $32 per share, raising approximately $752 million.
Malwarebytes
In October 2024, the fund completed a secondary sale of a portion of its stake in Malwarebytes.
Code42
In July 2024, Mimecast announced that it had acquired Code42.
Udacity
In May 2024, Accenture announced that it had acquired Udacity.
Mynd
In May 2024, Mynd announced its merger with Roofstock to create a comprehensive, end-to-end solution for single-family rental investors.
3
As of December 31, 2024, the Fund’s performance is as follows:
|
Total Return Information (Unaudited) |
||||||
|
The Private Shares Fund – Class A |
Ten |
Five |
Three |
One |
Annualized |
Cumulative |
|
Returns based on Purchase Without |
6.72% |
9.45% |
0.83% |
11.40% |
8.27% |
135.24% |
|
Returns based on Purchase With Maximum Sales Charge of 5.75% (POP) |
6.09% |
8.16% |
-1.14% |
5.00% |
7.67% |
121.72% |
|
Fund Benchmark |
||||||
|
Russell 2000® Index |
7.82% |
7.40% |
1.24% |
11.54% |
7.57% |
119.35% |
|
The Private Shares Fund – Class I |
Ten |
Five |
Three |
One |
Annualized |
Cumulative |
|
Returns based on Purchase Without Any Sales Charge (NAV) |
N/A |
9.71% |
1.08% |
11.66% |
8.73% |
81.51% |
|
Fund Benchmark |
||||||
|
Russell 2000® Index |
N/A |
7.40% |
1.24% |
11.54% |
7.24% |
64.55% |
|
The Private Shares Fund – Class L |
Ten |
Five |
Three |
One |
Annualized |
Cumulative |
|
Returns based on Purchase Without Any Sales Charge (NAV) |
N/A |
9.17% |
0.58% |
11.12% |
7.64% |
63.03% |
|
Returns based on Purchase With Maximum Sales Charge of 4.25% (POP) |
N/A |
8.23% |
-0.86% |
6.39% |
6.94% |
56.10% |
|
Fund Benchmark |
||||||
|
Russell 2000® Index |
N/A |
7.40% |
1.24% |
11.54% |
6.50% |
51.96% |
Performance data quoted represents past performance and is no guarantee of future results. Public offering price (“POP”) performance assumes a maximum sales load of 5.75% (Class A) and 4.25% (Class L) on all sales. Investment return and principal value will fluctuate so that an investor’s shares, when redeemed, may be worth more or less than original cost. Current performance may be lower or higher than the performance data quoted. For performance as of the most recent month-end, please call 1-855-551-5510. Some of the Fund’s fees were waived or expenses reimbursed; otherwise, returns would have been lower. The Fund’s total annual expenses per the currently stated prospectus are 2.54% (Class A), 2.49% (Class I), and 2.78% (Class L). The Fund’s total net expenses are 2.72% (Class A), 2.47% (Class I), and 2.97% (Class L). Liberty Street Advisors, Inc. (the “Investment Adviser”) has contractually agreed to waive fees and/or reimburse (excluding taxes, interest expense, commitment fees, legal fees or other expenses related to any borrowing or leverage incurred by the Fund, brokerage commissions, acquired fund fees and expenses, and extraordinary expenses, such as litigation or reorganization costs, but inclusive of organizational costs and offering costs) expenses such that the total expenses do not exceed 2.65% (Class A), 2.40% (Class I), and 2.90% (Class L) through May 2, 2026. Net expenses are applicable to investors.
4
|
THE PRIVATE SHARES FUND |
|
Fund Performance (Continued) December 31, 2024 (Unaudited) |
DISCLOSURES
Investment in the Fund involves substantial risk. The Fund is not suitable for investors who cannot bear the risk of loss of all or part of their investment. The Fund is appropriate only for investors who can tolerate a high degree of risk and do not require a liquid investment. All investing involves risk including the possible loss of principal. Shares in the Fund are highly illiquid, and can be sold by shareholders only in the quarterly repurchase program of the Fund which allows for up to 5% of the Fund’s outstanding shares to be redeemed each quarter at NAV. Due to transfer restrictions and the illiquid nature of the Fund’s investments, you may not be able to sell your shares when, or in the amount that, you desire. The Fund primarily invests in late-stage operating businesses and does so primarily by directly investing in private, operating growth companies (“Portfolio Companies”). There are significant potential risks relating to investing in Portfolio Companies. Because most of the securities in which the Fund invests are not publicly traded, the Fund’s investments will be valued by Liberty Street Advisors, Inc. (the “Investment Adviser”) as Valuation Designee pursuant to fair valuation procedures and methodologies approved by the Board of Trustees, as set forth in the prospectus. As a consequence, the value of the securities, and therefore the Fund’s Net Asset Value (“NAV”), may vary. There are significant potential risks associated with investing in venture capital and private equity-backed companies with complex capital structures. The Fund focuses its investments in a limited number of securities, which could subject it to greater risk than that of a larger, more varied portfolio. There is a greater focus in technology securities that could adversely affect the Fund’s performance. The Fund’s quarterly repurchase policy may require the Fund to liquidate portfolio holdings earlier than the Investment Adviser would otherwise do so and may also result in an increase in the Fund’s expense ratio. Portfolio holdings of private companies that become publicly traded likely will be subject to more volatile market fluctuations than when private, and the Fund may not be able to sell shares at favorable prices. Such companies frequently impose lock-ups that would prohibit the Fund from selling shares for a period of time after an initial public offering (IPO). Market prices of public securities held by the Fund may decline substantially before the Investment Adviser is able to sell the securities. The Fund may invest in private securities utilizing special purpose vehicles (“SPVs”) and similar investment structures, venture capital funds and other funds that invest in private companies and rely on exclusions from the 1940 Act under section 3(c)(1) or 3(c)(7) (“Private Funds”), private investments in public equity (“PIPE”) transactions where the issuer is a special purpose acquisition company (“SPAC”), and may utilize profit sharing agreements. The Fund will bear its pro rata portion of expenses on investments in SPVs and Private Funds and will have no direct claim against underlying portfolio companies. The Fund’s investments in Private Funds subject it to the risks associated with direct ownership of the securities in which the underlying funds invest, as well as additional risks specific to the Private Funds, including operational risk, legal and indemnification risks, and lock-ups and other restrictions on withdrawal. PIPE transactions involve price risk, market risk, expense risk, and the risk that the Fund may not be able to sell the securities due to lock-ups or restrictions. Profit sharing agreements may expose the Fund to certain risks, including that the agreements could reduce the gain the Fund otherwise would have achieved on its investment, may be difficult to value and may result in contractual disputes. Certain conflicts of interest involving the Fund and its affiliates could impact the Fund’s investment returns and limit the flexibility of its investment policies. This is not a complete enumeration of the Fund’s risks. Please read the Fund prospectus for other risk factors related to the Fund.
The Fund may not be suitable for all investors. We encourage you to consult with appropriate financial professionals before considering an investment in the Fund.
The Russell 2000 is an index measuring the performance of approximately 2,000 smallest-cap American companies in the Russell 3000 Index, which is made up of 3,000 of the largest U.S. stocks. It is a market-cap weighted index. A SPAC is a company that has no commercial operations and is formed strictly to raise capital through an IPO for the purpose of acquiring or merging with an existing company.
The views expressed in this material reflect those of the Investment Adviser as of the date this is written and may not reflect its views on the date this material is first published or anytime thereafter. These views are intended to assist in understanding the Fund’s investment methodology and do not constitute investment advice. This material may contain discussions about investments that may or may not be held by the Fund. All current and future holdings are subject to risk and to change.
The Fund is distributed by Foreside Fund Services, LLC.
5
|
THE PRIVATE SHARES FUND |
|
Fund Performance (Continued) December 31, 2024 (Unaudited) |
IMPORTANT DISCLOSURES
The inclusion of various indices is for comparison purposes only. The performance of an index is not an exact representation of any particular investment, as you cannot invest directly in an index.
Holdings subject to change. Not a recommendation to buy, sell, or hold any specific security.
6
Growth of $10,000 Investment
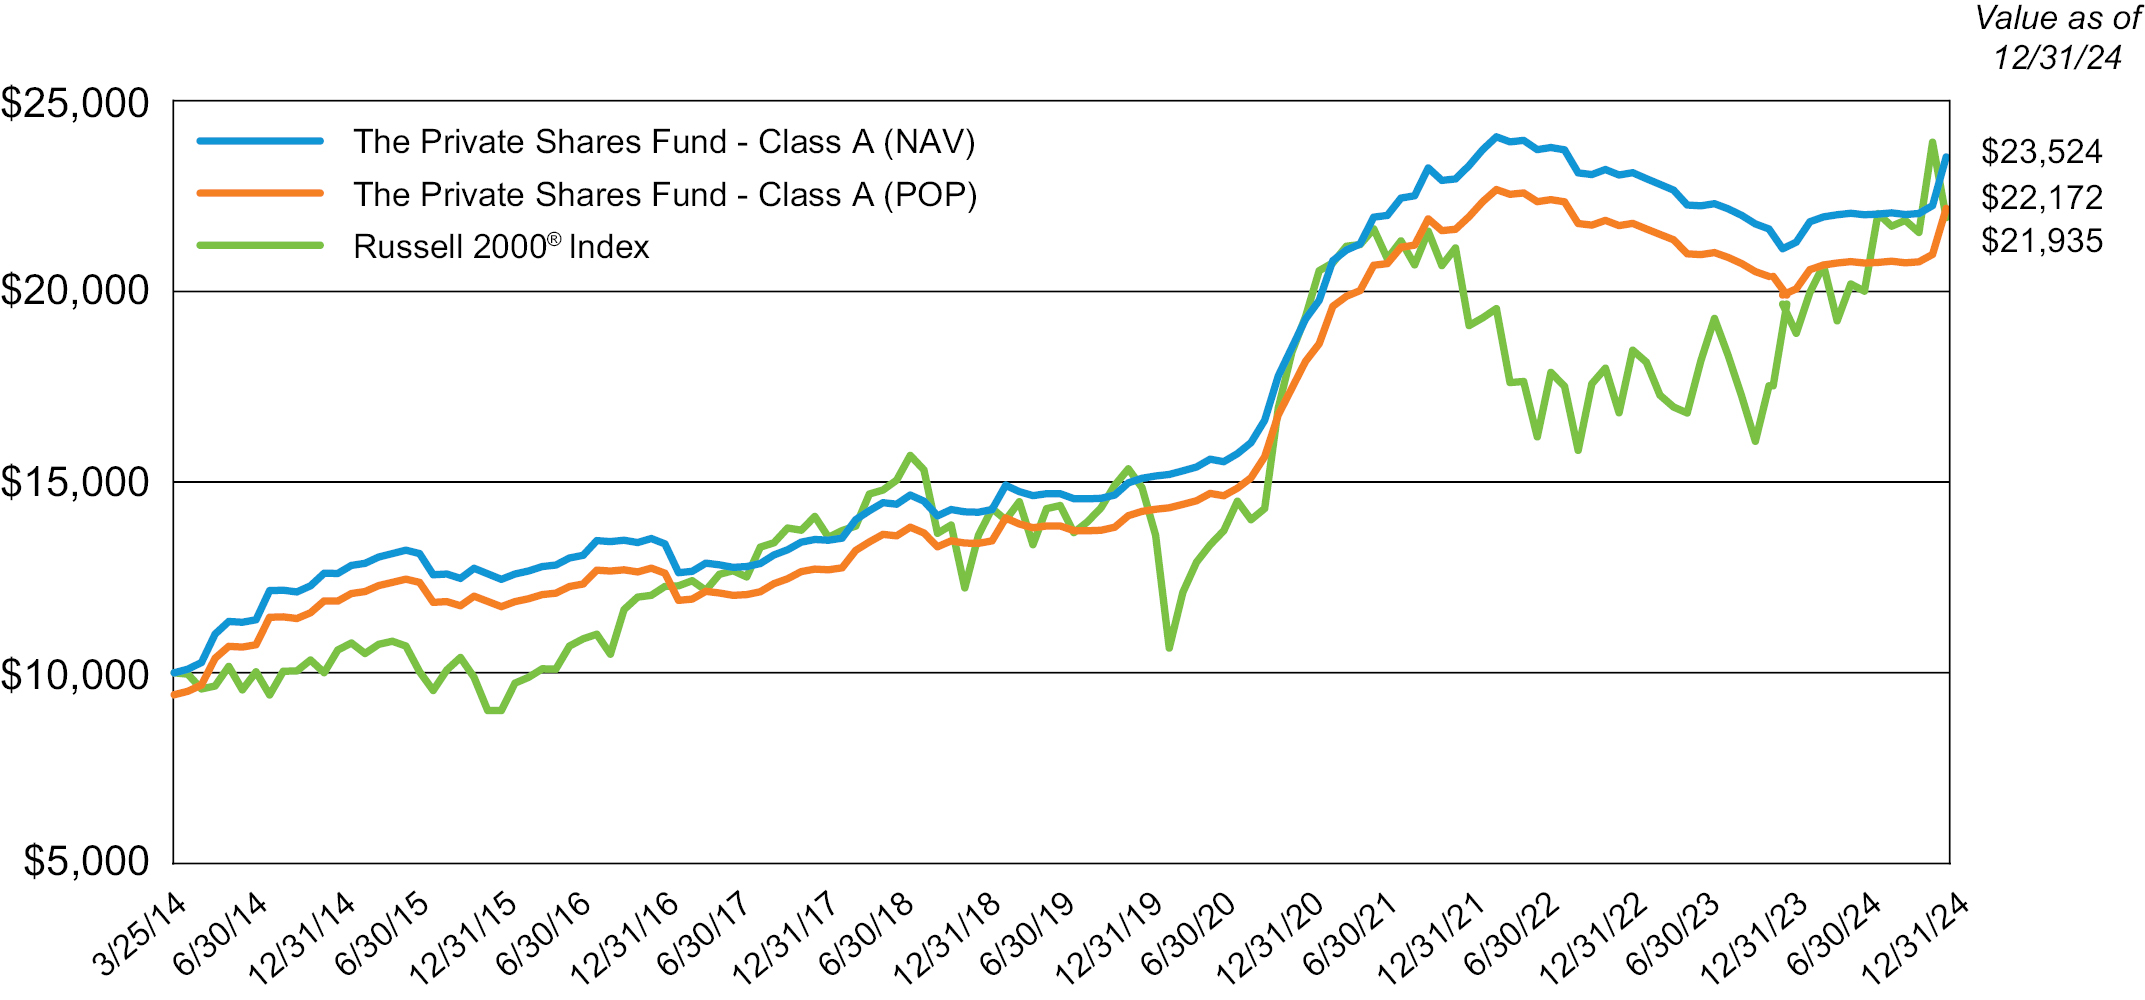
This graph illustrates the hypothetical investment of $10,000 in the Class A from March 25, 2014 (Class inception) to December 31, 2024. The Total Return Information table and Growth of $10,000 Investment graph do not reflect the deduction of taxes that a shareholder would pay on fund distributions or the redemption of fund shares. The Public Offering Price (“POP”) assumes an initial investment of $9,425 ($10,000 less the maximum sales load of 5.75%). The Net Asset Value (“NAV”) assumes no sales load.
Performance data quoted represents past performance and is no guarantee of future results.
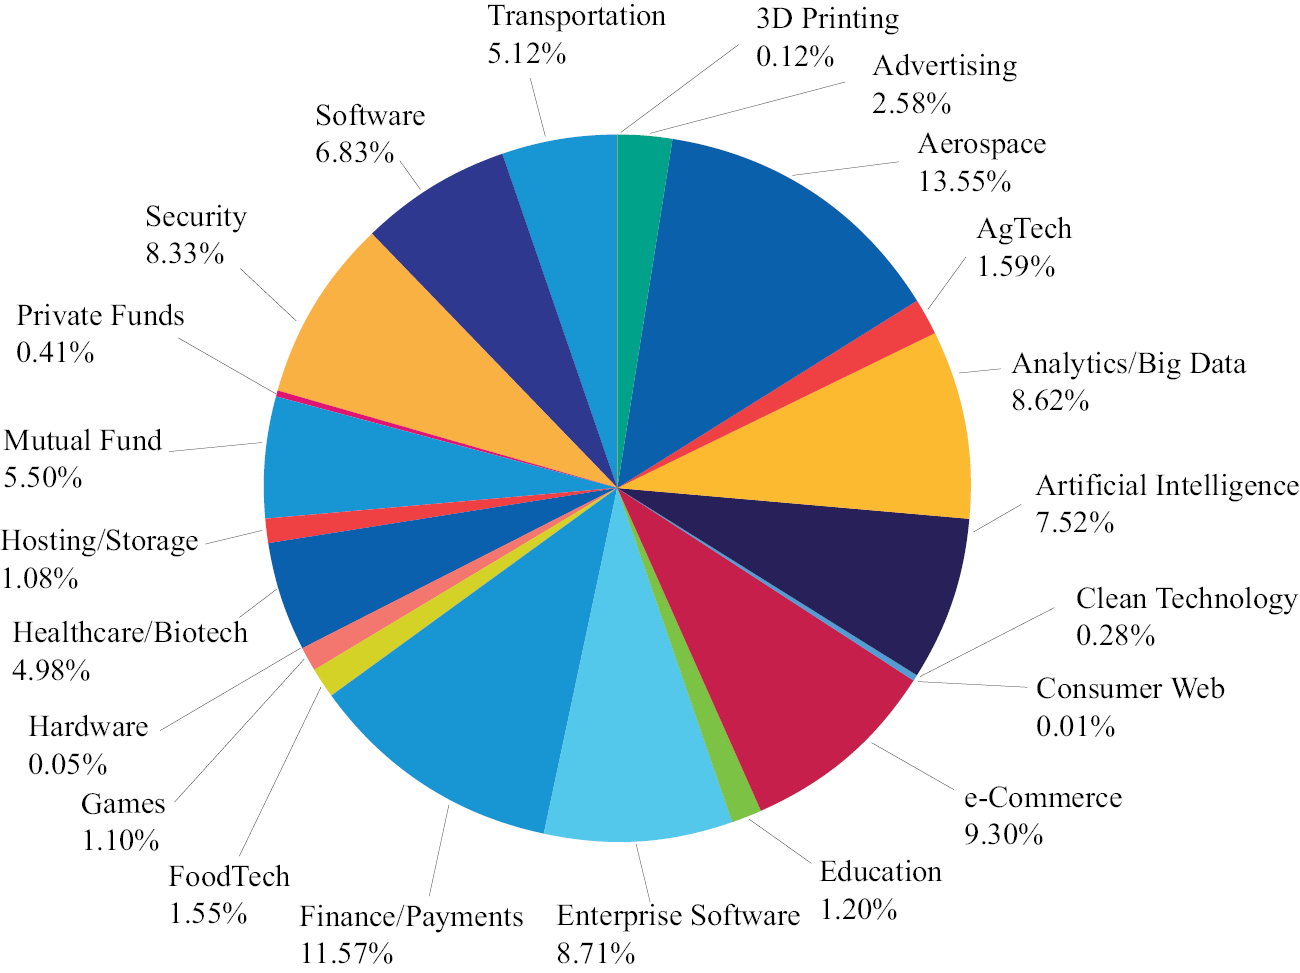
Fund Sector Diversification
The following chart provides a visual breakdown of the Fund, by the industry sectors that the underlying securities represent, as a percentage of the total investments.
7
Fund Holdings
|
|
|
|
|
|
|
|||||
|
|
|
|
|
|
|
|||||
|
|
|
|
|
|
|
|||||
|
|
|
|
|
|
|
|||||
|
|
|
|
|
|
|
|||||
|
|
|
|
|
|
|
|||||
|
|
|
|
|
|
|
|||||
|
|
|
|
|
|
|
8
|
THE PRIVATE SHARES FUND |
|
Portfolio Composition (Continued) December 31, 2024 (Unaudited) |
Fund Holdings (Continued)
|
|
|
|
|
|
|
|||||
|
|
|
|
|
|
|
|||||
|
|
|
|
|
|
|
|||||
|
|
|
|
|
|
|
|||||
|
|
|
|
|
|
|
|||||
|
|
|
|
|
9
|
Acquisition |
Shares |
Cost |
Fair Value |
|||||||
|
|
|
|||||||||
|
Common Stock in Private Companies(a),(b) — 43.2% |
|
|
||||||||
|
3D Printing — 0.1% |
|
|
||||||||
|
Carbon, Inc. |
Jun 2019 |
158,853 |
$ |
2,125,214 |
$ |
1,205,694 |
||||
|
|
|
|||||||||
|
Advertising — 2.6% |
|
|
||||||||
|
GroundTruth, Inc. |
Oct 2016 |
1,659,427 |
|
446,424 |
|
431,451 |
||||
|
NextRoll, Inc. |
Mar 2017 |
2,367,054 |
|
16,079,048 |
|
21,540,191 |
||||
|
OpenX Software, Ltd. |
Jun 2015 |
2,899,297 |
|
2,615,386 |
|
2,928,290 |
||||
|
|
19,140,858 |
|
24,899,932 |
|||||||
|
Aerospace — 8.3% |
|
|
||||||||
|
Axiom Space, Inc. |
Mar 2021 |
29,543 |
|
5,099,983 |
|
3,666,287 |
||||
|
Relativity Space, Inc. |
Oct 2021 |
437,922 |
|
9,999,993 |
|
9,926,378 |
||||
|
Space Exploration Technologies Corp. |
May 2019 |
360,330 |
|
7,386,765 |
|
66,661,050 |
||||
|
|
22,486,741 |
|
80,253,715 |
|||||||
|
AgTech — 0.2% |
|
|
||||||||
|
Farmer’s Business Network, Inc. |
Sep 2021 |
119,676 |
|
5,042,625 |
|
1,695,809 |
||||
|
|
|
|||||||||
|
Analytics/Big Data — 5.9% |
|
|
||||||||
|
Content Square SAS |
Dec 2023 |
544,905 |
|
3,740,557 |
|
6,048,446 |
||||
|
Dataminr, Inc. |
Sep 2015 |
567,043 |
|
6,559,226 |
|
16,863,859 |
||||
|
Domino Data Lab, Inc. |
Apr 2021 |
330,000 |
|
4,118,400 |
|
4,893,900 |
||||
|
Dremio Corp.(c) |
Dec 2021 |
166,664 |
|
1,035,883 |
|
966,651 |
||||
|
INRIX, Inc. |
May 2014 |
133,238 |
|
3,026,250 |
|
6,539,321 |
||||
|
SingleStore, Inc. |
May 2020 |
2,148,366 |
|
10,359,604 |
|
15,017,078 |
||||
|
Tealium, Inc. |
Sep 2020 |
200,000 |
|
1,300,000 |
|
2,896,000 |
||||
|
ThoughtSpot, Inc. |
Oct 2018 |
162,087 |
|
1,745,758 |
|
4,352,036 |
||||
|
|
31,885,678 |
|
57,577,291 |
|||||||
|
Artificial Intelligence — 3.7% |
|
|
||||||||
|
Brain Corp. |
Dec 2020 |
2,375,000 |
|
9,540,000 |
|
12,540,000 |
||||
|
Cerebras Systems, Inc. |
Feb 2022 |
309,813 |
|
6,946,627 |
|
9,015,558 |
||||
|
Nanotronics Imaging, Inc. |
Aug 2022 |
76,504 |
|
7,803,408 |
|
14,238,160 |
||||
|
|
24,290,035 |
|
35,793,718 |
|||||||
|
Clean Technology — 0.0% |
|
|
||||||||
|
WiTricity Holdings, Inc.(c) |
Mar 2021 |
166,667 |
|
1,667 |
|
273,334 |
||||
|
|
|
|||||||||
|
e-Commerce — 1.0% |
|
|
||||||||
|
1661, Inc. (d.b.a. GOAT)(c) |
Sep 2021 |
128,148 |
|
760,724 |
|
419,044 |
||||
|
CaaStle, Inc. |
Mar 2022 |
1,174,400 |
|
3,057,263 |
|
9,207,296 |
||||
|
|
3,817,987 |
|
9,626,340 |
|||||||
|
Education — 1.1% |
|
|
||||||||
|
Eruditus Learning Solutions Pte., Ltd.(c) |
Aug 2021 |
36,264 |
|
5,146,825 |
|
4,010,436 |
||||
|
Learneo, Inc. (f.k.a. Course Hero, Inc.) |
Jun 2020 |
270,000 |
|
3,429,200 |
|
6,787,800 |
||||
|
|
8,576,025 |
|
10,798,236 |
|||||||
See accompanying Notes to the Financial Statements
10
|
THE PRIVATE SHARES FUND |
|
Schedule of Investments (Continued) December 31, 2024 |
|
Acquisition |
Shares |
Cost |
Fair Value |
|||||||
|
|
|
|||||||||
|
Common Stock in Private Companies(a),(b) — 43.2% (Continued) |
|
|
||||||||
|
Enterprise Software — 3.4% |
|
|
||||||||
|
Automation Anywhere, Inc. |
Jul 2021 |
189,449 |
$ |
4,019,940 |
$ |
2,222,237 |
||||
|
Docker, Inc. |
May 2017 |
2,500 |
|
531,250 |
|
22,500 |
||||
|
EquipmentShare.com, Inc. |
Oct 2021 |
694,800 |
|
9,985,874 |
|
18,585,900 |
||||
|
Motive Technologies, Inc. (f.k.a. Keep Truckin, Inc.) |
May 2019 |
788,562 |
|
3,420,734 |
|
8,642,639 |
||||
|
Tebra Technologies, Inc. (f.k.a. Kareo, Inc.) |
Nov 2020 |
190,007 |
|
1,235,126 |
|
1,518,156 |
||||
|
Trax, Ltd. |
Mar 2020 |
149,970 |
|
5,100,000 |
|
2,198,560 |
||||
|
|
24,292,924 |
|
33,189,992 |
|||||||
|
Finance/Payments — 5.1% |
|
|
||||||||
|
Betterment Holdings, Inc. |
Mar 2021 |
1,457,800 |
|
14,999,995 |
|
24,724,288 |
||||
|
Circle Internet Financial, Ltd. |
Apr 2018 |
290,200 |
|
2,604,825 |
|
12,446,678 |
||||
|
ConsenSys Software, Inc. |
May 2022 |
31,010 |
|
3,703,824 |
|
4,343,261 |
||||
|
Payward, Inc. (d.b.a. Kraken) |
Jun 2021 |
105,218 |
|
5,079,228 |
|
5,151,473 |
||||
|
Prosper Marketplace, Inc. |
Jan 2016 |
244,130 |
|
1,307,998 |
|
107,417 |
||||
|
Upgrade, Inc. |
Apr 2022 |
661,053 |
|
2,900,002 |
|
3,027,623 |
||||
|
|
30,595,872 |
|
49,800,740 |
|||||||
|
FoodTech — 0.5% |
|
|
||||||||
|
Impossible Foods, Inc. |
Oct 2022 |
373,248 |
|
3,569,496 |
|
5,318,784 |
||||
|
|
|
|||||||||
|
Games — 1.1% |
|
|
||||||||
|
Epic Games, Inc. |
Nov 2022 |
17,168 |
|
10,826,013 |
|
10,660,813 |
||||
|
|
|
|||||||||
|
Hardware — 0.1% |
|
|
||||||||
|
Hydrow, Inc. |
Feb 2022 |
14,172,560 |
|
4,999,989 |
|
473,364 |
||||
|
|
|
|||||||||
|
Healthcare/Biotech — 2.3% |
|
|
||||||||
|
Click Therapeutics, Inc. |
Nov 2020 |
1,000,000 |
|
3,500,000 |
|
3,850,000 |
||||
|
Color Health, Inc. |
Feb 2022 |
139,486 |
|
10,039,927 |
|
6,095,538 |
||||
|
Devoted Health, Inc. |
Aug 2022 |
177,776 |
|
9,999,953 |
|
11,491,441 |
||||
|
ZocDoc, Inc. |
Feb 2015 |
61,016 |
|
1,321,708 |
|
544,873 |
||||
|
|
24,861,588 |
|
21,981,852 |
|||||||
|
Security — 5.5% |
|
|
||||||||
|
Arctic Wolf Networks, Inc. |
Dec 2021 |
2,072,651 |
|
20,456,420 |
|
24,208,564 |
||||
|
Contrast Security, Inc. |
Sep 2022 |
31,250 |
|
255,000 |
|
342,812 |
||||
|
Lookout, Inc. |
Jul 2022 |
1,869,160 |
|
10,000,006 |
|
18,878,516 |
||||
|
Snyk, Ltd. |
Mar 2023 |
392,707 |
|
2,932,070 |
|
4,948,108 |
||||
|
Tanium, Inc. |
Apr 2019 |
640,000 |
|
4,787,200 |
|
5,356,800 |
||||
|
|
38,430,696 |
|
53,734,800 |
|||||||
|
Software — 1.9% |
|
|
||||||||
|
Discord, Inc.(c) |
Dec 2021 |
45,694 |
|
18,405,998 |
|
17,675,810 |
||||
|
Roofstock, Inc. |
Jun 2024 |
127,231 |
|
6,130,637 |
|
1,160,400 |
||||
|
|
24,536,635 |
|
18,836,210 |
|||||||
See accompanying Notes to the Financial Statements
11
|
THE PRIVATE SHARES FUND |
|
Schedule of Investments (Continued) December 31, 2024 |
|
Acquisition |
Shares |
Cost |
Fair Value |
|||||||
|
|
|
|||||||||
|
Common Stock in Private Companies(a),(b) — 43.2% (Continued) |
|
|
||||||||
|
Transportation — 0.4% |
|
|
||||||||
|
Flexport, Inc. |
Jul 2022 |
538,387 |
$ |
7,256,025 |
$ |
3,547,970 |
||||
|
TOTAL COMMON STOCK IN PRIVATE COMPANIES |
|
286,736,068 |
|
419,668,594 |
||||||
|
|
|
|||||||||
|
Preferred Stock in Private Companies(a),(b) — 46.6% |
|
|
||||||||
|
Advertising — 0.0% |
|
|
||||||||
|
GroundTruth, Inc., Preferred Series B-1 |
Jan 2017 |
600,000 |
|
149,200 |
|
156,000 |
||||
|
|
|
|||||||||
|
Aerospace — 5.3% |
|
|
||||||||
|
Axiom Space, Inc., Preferred Series B |
Dec 2020 |
32,221 |
|
2,019,958 |
|
3,998,626 |
||||
|
Axiom Space, Inc., Preferred Series C-1 |
Aug 2021 |
108,731 |
|
15,612,740 |
|
13,493,518 |
||||
|
Beta Technologies, Inc., Preferred Series A |
Apr 2021 |
40,944 |
|
2,999,967 |
|
4,686,860 |
||||
|
Beta Technologies, Inc., Preferred Series B |
Apr 2022 |
58,156 |
|
5,999,954 |
|
6,657,117 |
||||
|
Radian Aerospace, Inc., Preferred Series Seed 2 |
Sep 2021 |
607,336 |
|
1,999,997 |
|
2,234,997 |
||||
|
Relativity Space, Inc., Preferred Series E |
Jul 2021 |
437,922 |
|
10,299,992 |
|
9,926,378 |
||||
|
Voyager Space Holdings, Inc., Preferred Series B |
Mar 2022 |
192,061 |
|
7,499,982 |
|
8,416,113 |
||||
|
Voyager Space Holdings, Inc., Preferred Series C |
Mar 2024 |
11,410 |
|
499,986 |
|
499,986 |
||||
|
Xplore, Inc., Preferred Series A1 |
Feb 2022 |
237,524 |
|
1,000,000 |
|
1,250,001 |
||||
|
|
47,932,576 |
|
51,163,596 |
|||||||
|
AgTech — 1.4% |
|
|
||||||||
|
CIBO Technologies, Inc., Preferred Series C(c) |
Aug 2021 |
600,000 |
|
3,090,000 |
|
2,946,000 |
||||
|
Farmer’s Business Network, Inc., Preferred Series G |
Sep 2021 |
128,704 |
|
10,199,946 |
|
4,960,252 |
||||
|
Invaio Sciences, Inc., Preferred Series C(c) |
Mar 2021 |
1,061,390 |
|
5,150,000 |
|
5,444,931 |
||||
|
|
18,439,946 |
|
13,351,183 |
|||||||
|
Analytics/Big Data — 2.7% |
|
|
||||||||
|
Content Square SAS, Preferred Series F |
Dec 2023 |
160,410 |
|
1,693,701 |
|
2,394,921 |
||||
|
Databricks, Inc., Preferred Series G(c) |
Jul 2022 |
182,664 |
|
10,807,205 |
|
16,896,420 |
||||
|
Dataminr, Inc., Preferred Series A |
Apr 2019 |
20,000 |
|
198,000 |
|
594,800 |
||||
|
Dataminr, Inc., Preferred Series B |
Apr 2019 |
87,496 |
|
866,211 |
|
2,602,131 |
||||
|
Dremio Corp., Preferred Series E(c) |
Dec 2021 |
469,594 |
|
4,140,000 |
|
3,385,773 |
||||
|
|
17,705,117 |
|
25,874,045 |
|||||||
|
Artificial Intelligence — 3.4% |
|
|
||||||||
|
Nanotronics Imaging, Inc., Preferred Series F-2 |
Apr 2022 |
90,888 |
|
15,300,066 |
|
16,915,166 |
||||
|
VerbIT, Inc., Preferred Series A |
Nov 2021 |
47,640 |
|
693,256 |
|
271,072 |
||||
|
VerbIT, Inc., Preferred Series B |
Nov 2021 |
288,180 |
|
4,194,173 |
|
1,639,744 |
||||
|
VerbIT, Inc., Preferred Series E-1 |
Nov 2021 |
423,720 |
|
6,166,668 |
|
4,393,976 |
||||
|
VerbIT, Inc., Preferred Series Seed 2 |
Nov 2021 |
65,000 |
|
945,904 |
|
369,850 |
||||
|
X.AI, Corp., Preferred Series B(c) |
May 2024 |
417,710 |
|
5,150,000 |
|
9,043,422 |
||||
|
X.AI, Corp., Preferred Series C(c) |
Nov 2024 |
42,794 |
|
1,000,000 |
|
926,490 |
||||
|
|
33,450,067 |
|
33,559,720 |
|||||||
See accompanying Notes to the Financial Statements
12
|
THE PRIVATE SHARES FUND |
|
Schedule of Investments (Continued) December 31, 2024 |
|
Acquisition |
Shares |
Cost |
Fair Value |
|||||||
|
|
|
|||||||||
|
Preferred Stock in Private Companies(a),(b) — 46.6% (Continued) |
|
|
||||||||
|
Clean Technology — 0.2% |
|
|
||||||||
|
WiTricity Holdings, Inc., Preferred Series A |
Oct 2020 |
1,000,000 |
$ |
1,020,000 |
$ |
1,640,000 |
||||
|
WiTricity Holdings, Inc., Preferred Series B |
Jun 2022 |
333,253 |
|
999,999 |
|
793,142 |
||||
|
|
2,019,999 |
|
2,433,142 |
|||||||
|
Consumer Web — 0.0% |
|
|
||||||||
|
Trusper, Inc. (d.b.a. Musely), Preferred Series B |
Oct 2014 |
7,961 |
|
100,012 |
|
106,120 |
||||
|
|
|
|||||||||
|
e-Commerce — 8.3% |
|
|
||||||||
|
1661, Inc. (d.b.a. GOAT), Preferred Series A-1(c) |
Sep 2021 |
112,563 |
|
668,206 |
|
368,081 |
||||
|
1661, Inc. (d.b.a. GOAT), Preferred Series A-5(c) |
Sep 2021 |
2,394 |
|
14,211 |
|
7,828 |
||||
|
1661, Inc. (d.b.a. GOAT), Preferred Series A-7(c) |
Sep 2021 |
146,495 |
|
869,637 |
|
479,039 |
||||
|
1661, Inc. (d.b.a. GOAT), Preferred Series B(c) |
Sep 2021 |
231,687 |
|
1,375,362 |
|
757,616 |
||||
|
1661, Inc. (d.b.a. GOAT), Preferred Series C(c) |
Sep 2021 |
237,913 |
|
1,412,322 |
|
777,976 |
||||
|
CaaStle, Inc., Preferred Series A-12 |
Dec 2021 |
1,801,270 |
|
8,110,608 |
|
14,121,957 |
||||
|
GrubMarket, Inc., Preferred Series D |
Oct 2020 |
440,742 |
|
1,999,999 |
|
10,044,065 |
||||
|
GrubMarket, Inc., Preferred Series E |
Jun 2021 |
1,520,838 |
|
14,999,995 |
|
34,658,362 |
||||
|
GrubMarket, Inc., Preferred Series F |
Feb 2022 |
697,526 |
|
9,999,982 |
|
15,895,913 |
||||
|
Lyst, Ltd., Preferred Series E |
Jul 2021 |
401,929 |
|
5,172,500 |
|
3,476,686 |
||||
|
|
44,622,822 |
|
80,587,523 |
|||||||
|
Education — 0.1% |
|
|
||||||||
|
Yanka Industries, Inc. (d.b.a. MasterClass), Preferred Series Seed 1 |
Jul 2021 |
193,100 |
|
6,146,189 |
|
890,191 |
||||
|
|
|
|||||||||
|
Enterprise Software — 5.3% |
|
|
||||||||
|
Checkr, Inc., Preferred Series A-1 |
Mar 2020 |
150,000 |
|
1,405,000 |
|
2,805,000 |
||||
|
Cohere Technologies, Inc., Preferred Series D-1 |
Feb 2022 |
279,571 |
|
1,999,995 |
|
2,130,331 |
||||
|
Cohere Technologies, Inc., Preferred Series D-2 |
Dec 2020 |
386,038 |
|
2,071,233 |
|
2,941,610 |
||||
|
EquipmentShare.com, Inc., Preferred Series E |
May 2022 |
323,064 |
|
4,999,997 |
|
8,641,962 |
||||
|
Motive Technologies, Inc. (f.k.a. Keep Truckin, Inc.), Preferred Series E |
May 2021 |
638,843 |
|
4,599,996 |
|
7,001,719 |
||||
|
Motive Technologies, Inc. (f.k.a. Keep Truckin, Inc.), Preferred Series F |
Jun 2022 |
1,923,076 |
|
14,999,993 |
|
21,076,913 |
||||
|
Ocrolus, Inc., Preferred Series C(c) |
Aug 2021 |
438,327 |
|
3,114,950 |
|
3,024,456 |
||||
|
Tebra Technologies, Inc. (f.k.a. Kareo, Inc.), Preferred Series Seed 2 |
Nov 2020 |
123,819 |
|
804,870 |
|
989,314 |
||||
|
Trax, Ltd., Pre IPO |
Mar 2021 |
76,722 |
|
3,999,978 |
|
2,724,398 |
||||
|
|
37,996,012 |
|
51,335,703 |
|||||||
|
Finance/Payments — 6.4% |
|
|
||||||||
|
Betterment Holdings, Inc., Preferred Series F |
Sep 2021 |
318,380 |
|
3,999,999 |
|
5,399,725 |
||||
|
ConsenSys Software, Inc., Preferred Series D(c) |
Feb 2022 |
35,699 |
|
5,075,000 |
|
5,000,002 |
||||
|
Fundbox, Ltd., Preferred Series C |
Jun 2019 |
439,552 |
|
4,999,992 |
|
7,041,623 |
||||
|
Fundbox, Ltd., Preferred Series D |
Sep 2021 |
531,914 |
|
7,499,988 |
|
8,521,262 |
||||
|
Payward, Inc. (d.b.a. Kraken), Preferred Series A |
Nov 2021 |
262,210 |
|
13,768,164 |
|
12,837,801 |
||||
|
Payward, Inc. (d.b.a. Kraken), Preferred Series Seed |
Apr 2022 |
67,000 |
|
3,505,340 |
|
3,280,320 |
||||
|
Prosper Marketplace, Inc., Preferred Series A |
Jan 2016 |
55,395 |
|
305,781 |
|
32,129 |
||||
|
Prosper Marketplace, Inc., Preferred Series A-1 |
Jan 2016 |
58,165 |
|
116 |
|
25,593 |
||||
|
Ripple Labs, Inc., Preferred Series A |
Dec 2018 |
42,000 |
|
504,000 |
|
5,250,000 |
||||
|
Upgrade, Inc., Preferred Series C-1 |
Mar 2022 |
3,290,000 |
|
14,159,000 |
|
15,068,200 |
||||
|
|
53,817,380 |
|
62,456,655 |
|||||||
See accompanying Notes to the Financial Statements
13
|
THE PRIVATE SHARES FUND |
|
Schedule of Investments (Continued) December 31, 2024 |
|
Acquisition |
Shares/ |
Cost |
Fair Value |
||||||||
|
|
|
|
|||||||||
|
Preferred Stock in Private Companies(a),(b) — 46.6% (Continued) |
|
|
|
||||||||
|
FoodTech — 1.0% |
|
|
|
||||||||
|
Impossible Foods, Inc., Preferred Series E-1 |
Nov 2022 |
|
400,000 |
$ |
4,080,000 |
$ |
5,700,000 |
||||
|
Impossible Foods, Inc., Preferred Series H-1(c) |
Nov 2021 |
|
153,494 |
|
3,746,778 |
|
2,988,528 |
||||
|
Impossible Foods, Inc., Preferred Series H-2(c) |
Nov 2021 |
|
53,389 |
|
1,303,222 |
|
1,039,484 |
||||
|
|
|
9,130,000 |
|
9,728,012 |
|||||||
|
Healthcare/Biotech — 2.7% |
|
|
|
||||||||
|
Click Therapeutics, Inc., Preferred Series A |
Nov 2020 |
|
60,087 |
|
210,304 |
|
231,335 |
||||
|
Collective Health, Inc., Preferred Series F |
May 2021 |
|
3,989,361 |
|
3,120,000 |
|
2,433,510 |
||||
|
Crossover Health Management Services, Inc., Preferred Series D |
Mar 2021 |
|
291,645 |
|
10,370,696 |
|
16,273,791 |
||||
|
Devoted Health, Inc., Preferred Series E |
Dec 2023 |
|
8,888 |
|
499,953 |
|
574,520 |
||||
|
Omada Health, Inc., Preferred Series E |
Dec 2021 |
|
1,334,400 |
|
7,999,995 |
|
6,538,560 |
||||
|
ZocDoc, Inc., Preferred Series A |
Feb 2015 |
|
35,000 |
|
875,000 |
|
312,550 |
||||
|
|
|
23,075,948 |
|
26,364,266 |
|||||||
|
Security — 2.8% |
|
|
|
||||||||
|
Contrast Security, Inc., Preferred Series A |
Jul 2022 |
|
828,514 |
|
10,300,003 |
|
9,088,799 |
||||
|
Contrast Security, Inc., Preferred Series C |
Nov 2022 |
|
1,164,596 |
|
7,649,998 |
|
12,775,618 |
||||
|
Cybereason, Inc., Preferred Series F |
Jul 2021 |
|
1,510,600 |
|
7,631,457 |
|
2,945,670 |
||||
|
Lookout, Inc., Preferred Series A |
Feb 2015 |
|
204,000 |
|
1,927,800 |
|
2,060,400 |
||||
|
|
|
27,509,258 |
|
26,870,487 |
|||||||
|
Software — 4.5% |
|
|
|
||||||||
|
Roofstock, Inc., Preferred Series E |
Mar 2022 |
|
339,154 |
|
9,999,990 |
|
6,613,503 |
||||
|
Tradeshift Holdings, Inc., Preferred Series 3 |
Jun 2021 |
|
28,797,969 |
|
12,551,436 |
|
36,939,155 |
||||
|
|
|
22,551,426 |
|
43,552,658 |
|||||||
|
Transportation — 2.5% |
|
|
|
||||||||
|
Clearmotion, Inc., Preferred Series A-3 |
Mar 2022 |
|
2,075,885 |
|
341,068 |
|
515,650 |
||||
|
Clearmotion, Inc., Preferred Series A-4 |
Mar 2022 |
|
12,954,589 |
|
908,932 |
|
3,217,920 |
||||
|
Clearmotion, Inc., Preferred Series B |
Mar 2023 |
|
2,484,760 |
|
500,000 |
|
617,214 |
||||
|
Flexport, Inc., Preferred Series A |
Jun 2022 |
|
580,165 |
|
8,489,030 |
|
3,823,287 |
||||
|
Flexport, Inc., Preferred Series B-1 |
Jul 2022 |
|
69,790 |
|
944,665 |
|
459,916 |
||||
|
Flexport, Inc., Preferred Series D-3 |
Jul 2022 |
|
82,613 |
|
1,117,776 |
|
544,420 |
||||
|
Loadsmart, Inc., Preferred Series D |
Jan 2022 |
|
500,000 |
|
10,000,000 |
|
8,170,000 |
||||
|
Neutron Holdings, Inc. (d.b.a. Lime), Preferred Series 1-D |
Mar 2019 |
|
20,618,556 |
|
5,000,000 |
|
1,470,103 |
||||
|
Turo, Inc., Preferred Series D-1 |
Jun 2018 |
|
314,017 |
|
2,932,295 |
|
5,988,304 |
||||
|
|
|
30,233,766 |
|
24,806,814 |
|||||||
|
TOTAL PREFERRED STOCK IN PRIVATE COMPANIES |
|
|
374,879,718 |
|
453,236,115 |
||||||
|
|
|
|
|||||||||
|
Convertible Notes of Private Companies(a),(b) — 3.9% |
|
|
|
||||||||
|
AgTech — 0.0% |
|
|
|
||||||||
|
Farmer’s Business Network, Inc., 15.00% 9/28/2025 |
Sep 2023 |
$ |
350,000 |
|
350,000 |
|
350,000 |
||||
|
|
|
|
|||||||||
|
Artificial Intelligence — 0.3% |
|
|
|
||||||||
|
Nanotronics Imaging, Inc., 5.00% 4/25/2025 |
Apr 2023 |
$ |
3,000,000 |
|
3,000,000 |
|
3,318,614 |
||||
See accompanying Notes to the Financial Statements
14
|
THE PRIVATE SHARES FUND |
|
Schedule of Investments (Continued) December 31, 2024 |
|
Acquisition |
Principal/ |
Cost |
Fair Value |
||||||||
|
|
|
|
|||||||||
|
Convertible Notes of Private Companies(a),(b) — 3.9% (Continued) |
|
|
|||||||||
|
Hosting/Storage — 1.1% |
|
|
|
||||||||
|
TMGcore, Inc., 4.00% 9/30/2028 |
Dec 2021 |
$ |
10,476,362 |
$ |
10,476,362 |
$ |
10,488,991 |
||||
|
|
|
|
|||||||||
|
Software — 0.3% |
|
|
|
||||||||
|
Tradeshift Holdings, Inc., 0.00% 4/3/2025 |
Apr 2023 |
$ |
2,227,053 |
|
2,227,053 |
|
2,227,053 |
||||
|
Tradeshift Holdings, Inc., 0.00% 9/5/2026 |
Sep 2024 |
$ |
500,000 |
|
500,000 |
|
500,000 |
||||
|
|
|
2,727,053 |
|
2,727,053 |
|||||||
|
Transportation — 2.2% |
|
|
|
||||||||
|
Neutron Holdings, Inc. (d.b.a. Lime), 4.00% 6/1/2027 |
Jun 2020 |
$ |
10,418,495 |
|
252,362 |
|
762,795 |
||||
|
Neutron Holdings, Inc. (d.b.a. Lime), 7.50% 10/29/2025(d) |
Oct 2021 |
$ |
17,330,137 |
|
17,330,137 |
|
20,472,597 |
||||
|
|
|
17,582,499 |
|
21,235,392 |
|||||||
|
TOTAL CONVERTIBLE NOTES OF PRIVATE COMPANIES |
|
|
34,135,914 |
|
38,120,050 |
||||||
|
|
|
|
|||||||||
|
UNITS OF PRIVATE COMPANIES(a),(b) — 0.0% |
|
|
|
||||||||
|
Security — 0.0% |
|
|
|
||||||||
|
Excalibur CombineCo, L.P. Class A Units |
Jun 2023 |
|
194 |
|
193,877 |
|
193,857 |
||||
|
TOTAL UNITS OF PRIVATE COMPANIES |
|
|
193,877 |
|
193,857 |
||||||
|
|
|
|
|||||||||
|
Warrants of Private Companies(a),(b) — 0.1% |
|
|
|
||||||||
|
Analytics/Big Data — 0.0% |
|
|
|
||||||||
|
Content Square SAS, Exercise Price $0.0001, Exercise Date 6/11/2025 |
Dec 2023 |
|
14,553 |
|
153,658 |
|
217,275 |
||||
|
|
|
|
|||||||||
|
Software — 0.1% |
|
|
|
||||||||
|
Tradeshift Holdings, Inc., Exercise Price $0.001, Exercise Date 11/21/2031 |
Nov 2021 |
|
213,797 |
|
2,425,355 |
|
274,238 |
||||
|
Tradeshift Holdings, Inc., Exercise Price $0.001, Exercise Date 9/9/2031 |
Dec 2021 |
|
427,594 |
|
4,570,844 |
|
548,475 |
||||
|
Tradeshift Holdings, Inc., Exercise Price $0.001, Exercise Date 3/25/2032 |
Mar 2022 |
|
213,797 |
|
2,538,052 |
|
274,237 |
||||
|
|
|
9,534,251 |
|
1,096,950 |
|||||||
|
Transportation — 0.0% |
|
|
|
||||||||
|
Neutron Holdings, Inc. (d.b.a. Lime), Exercise Price $0.01, Exercise Date 6/2/2027 |
Jun 2020 |
|
1,016,483 |
|
807 |
|
52,145 |
||||
|
TOTAL WARRANTS OF PRIVATE COMPANIES |
|
|
9,688,716 |
|
1,366,370 |
||||||
|
|
|
|
|||||||||
|
Simple Agreement for Future Equity of Private Companies(a),(b) — 0.0% |
|
|
|||||||||
|
Artificial Intelligence — 0.0% |
|
|
|
||||||||
|
Cubefabs, Inc. |
Nov 2023 |
|
250,000 |
|
250,000 |
|
250,000 |
||||
|
TOTAL SIMPLE AGREEMENT FOR FUTURE EQUITY OF PRIVATE COMPANIES |
|
250,000 |
|
250,000 |
|||||||
|
|
|
|
|||||||||
|
Special Purpose Vehicles/PRIVATE FUNDS(a),(b) — 0.4% |
|
|
|
||||||||
|
Private Funds — 0.4% |
|
|
|
||||||||
|
Northgate Growth Fund III |
Dec 2022 |
|
|
3,950,000 |
|
3,958,030 |
|||||
|
TOTAL SPECIAL PURPOSE VEHICLES/PRIVATE FUNDS |
|
|
3,950,000 |
|
3,958,030 |
||||||
See accompanying Notes to the Financial Statements
15
|
THE PRIVATE SHARES FUND |
|
Schedule of Investments (Continued) December 31, 2024 |
|
Cost |
Fair Value |
|||||||||
|
|
|
|||||||||
|
Short-Term Investments — 5.5% |
|
|
||||||||
|
MUTUAL FUNDS — 5.5% |
|
|
||||||||
|
Goldman Sachs Government Fund, 4.31%(e) |
$ |
1,758,237 |
$ |
1,758,237 |
||||||
|
UMB Money Market II Special, 4.19%(e) |
|
51,589,355 |
|
51,589,355 |
||||||
|
|
|
|||||||||
|
TOTAL SHORT-TERM INVESTMENTS |
|
53,347,592 |
|
53,347,592 |
||||||
|
|
|
|||||||||
|
TOTAL INVESTMENTS — 99.7% |
|
763,181,885 |
|
970,140,608 |
||||||
|
Other assets less liabilities — 0.3% |
|
|
2,477,235 |
|||||||
|
|
|
|||||||||
|
NET ASSETS — 100.0% |
|
$ |
972,617,843 |
|||||||
(a) Investments in private companies, and in some cases public companies, may be subject to restrictions on disposition imposed by the issuer. All positions held are non-controlled and non-affiliated investments, as defined by the Investment Company Act of 1940, as amended (“1940 Act”). As of December 31, 2024 restricted securities represented 94.26% of the net assets of the Fund.
(b) Debt positions (convertible notes of private companies) are income producing, all other positions are Equity positions and are non-income producing, except for short-term investments.
(c) These securities have been purchased through Special Purpose Vehicles/Private Funds in which the Fund has a direct investment of ownership units of the Vehicles. The shares, cost basis and fair value stated are disclosed based on the underlying securities purchased by the Vehicle and the Fund’s ownership percentage.
(d) Denotes a variable rate security. The rate shown is the current interest rate as of December 31, 2024.
(e) Represents the 7-day effective yield as of December 31, 2024.
All issuers are based in the United States, except for Lyst, Ltd., OpenX Software, Ltd., and Snyk, Ltd., which are based in the UK, and Trax, Ltd., Eruditus Learning Solutions Pte., Ltd., Fundbox, Ltd., and Content Square SAS, which are based in the Cayman Islands, Singapore, Israel, and France, respectively.
See accompanying Notes to the Financial Statements
16
|
Assets: |
|
||
|
Investments, at fair value (cost $763,181,885) (Note 3) |
$ |
970,140,608 |
|
|
Cash |
|
393,552 |
|
|
Receivable for fund shares sold |
|
1,195,009 |
|
|
Interest receivable |
|
2,954,690 |
|
|
Prepaid expenses and other assets |
|
330,994 |
|
|
Total assets |
|
975,014,853 |
|
|
|
|||
|
Liabilities: |
|
||
|
Advisory fees |
|
1,525,102 |
|
|
Payable for shareholder servicing fees - Class L |
|
869 |
|
|
Payable for shareholder servicing fees - Class A |
|
29,390 |
|
|
Payable for audit and tax fees |
|
168,100 |
|
|
Payable for transfer agent fees |
|
346,890 |
|
|
Payable for 12b-1 fees - Class L |
|
869 |
|
|
Other accrued liabilities |
|
325,790 |
|
|
Total liabilities |
|
2,397,010 |
|
|
Commitments and contingences (Note 9) |
|
||
|
Net assets |
$ |
972,617,843 |
|
|
|
|||
|
Net assets consist of: |
|
||
|
Capital stock (unlimited shares authorized, no par value) |
$ |
784,625,388 |
|
|
Total distributable earnings |
|
187,992,455 |
|
|
Net assets |
$ |
972,617,843 |
|
|
|
|||
|
Net assets: |
|
||
|
Class A |
$ |
136,148,130 |
|
|
Class I |
|
832,134,463 |
|
|
Class L |
|
4,335,250 |
|
|
Total net assets |
$ |
972,617,843 |
|
|
|
|||
|
Shares outstanding: |
|
||
|
Class A |
|
3,224,358 |
|
|
Class I |
|
19,345,945 |
|
|
Class L |
|
104,545 |
|
|
Total shares outstanding |
|
22,674,848 |
|
|
|
|||
|
Net asset value, public offering price, and redemption proceeds per share: |
|
||
|
Class A - Net asset value and redemption proceeds per share |
$ |
42.22 |
|
|
Class I - Net asset value and redemption proceeds per share |
$ |
43.01 |
|
|
Class L - Net asset value and redemption proceeds per share |
$ |
41.47 |
|
|
Class A - Public offering price per share(a) |
$ |
44.80 |
|
|
Class L - Public offering price per share(b) |
$ |
43.31 |
(a) Computation of public offering price per share 100/94.25 of net asset value. (See Note 10).
(b) Computation of public offering price per share 100/95.75 of net asset value. (See Note 10).
See accompanying Notes to the Financial Statements
17
|
Investment Income: |
|
|
||
|
Dividends1 |
$ |
2,660,102 |
|
|
|
Interest2 |
|
6,258,279 |
|
|
|
Total investment income |
|
8,918,381 |
|
|
|
|
|
|||
|
Expenses: |
|
|
||
|
Investment advisory fees (Note 5) |
|
17,858,079 |
|
|
|
Transfer agent fees |
|
1,970,576 |
|
|
|
Audit and tax fees |
|
1,167,800 |
|
|
|
Legal fees |
|
508,098 |
|
|
|
Printing & postage |
|
429,028 |
|
|
|
Fund accounting & administration fees |
|
392,972 |
|
|
|
Trustee fees |
|
331,975 |
|
|
|
Insurance fees |
|
191,139 |
|
|
|
Consulting expense |
|
182,000 |
|
|
|
Miscellaneous expenses3 |
|
163,500 |
|
|
|
Registration fees |
|
92,295 |
|
|
|
Chief compliance officer fees |
|
90,000 |
|
|
|
Shareholder servicing fees - Class A |
|
80,771 |
|
|
|
Custodian fees |
|
42,621 |
|
|
|
Distribution fees - Class L |
|
9,229 |
|
|
|
Shareholder servicing fees - Class L |
|
3,529 |
|
|
|
Total expenses |
|
23,513,612 |
|
|
|
Less: Net contractual waiver of fees and reimbursement of expenses (Note 4) |
|
(572,088 |
) |
|
|
Net expenses |
|
22,941,524 |
|
|
|
Net investment loss |
$ |
(14,023,143 |
) |
|
|
|
|
|||
|
Net realized loss on investments |
|
(3,734,037 |
) |
|
|
Net change in unrealized gain on investments |
|
122,482,195 |
|
|
|
Net realized and change in unrealized gain on investments |
|
118,748,158 |
|
|
|
Net change in net assets from operations |
$ |
104,725,015 |
|
1 Includes paid-in-kind dividends of $791,797.
2 Includes paid-in-kind interest of $759,949.
3 Includes borrowing costs incurred during the fiscal year in the amount of $11,721 were excluded from the contractual waiver of fees.
See accompanying Notes to the Financial Statements
18
|
Year ended |
Year ended |
|||||||
|
|
|
|
|
|||||
|
Operations: |
|
|
|
|
||||
|
Net investment loss |
$ |
(14,023,143 |
) |
$ |
(13,673,227 |
) |
||
|
Net realized loss on investments |
|
(3,734,037 |
) |
|
(7,220,192 |
) |
||
|
Net change in unrealized gain/(loss) on investments |
|
122,482,195 |
|
|
(62,099,665 |
) |
||
|
Net change in net assets resulting from operations |
|
104,725,015 |
|
|
(82,993,084 |
) |
||
|
|
|
|
|
|||||
|
Fund share transactions: |
|
|
|
|
||||
|
Proceeds from shares issued - Class A |
|
14,608,294 |
|
|
17,392,389 |
|
||
|
Proceeds from shares issued - Class I |
|
177,329,680 |
|
|
151,699,613 |
|
||
|
Proceeds from shares issued - Class L |
|
743,511 |
|
|
766,702 |
|
||
|
Cost of shares repurchased - Class A |
|
(36,177,467 |
) |
|
(39,289,111 |
) |
||
|
Cost of shares repurchased - Class I |
|
(164,351,926 |
) |
|
(160,988,941 |
) |
||
|
Cost of shares repurchased - Class L |
|
(322,710 |
) |
|
(403,663 |
) |
||
|
Contribution from Investment Advisor1 |
|
— |
|
|
592,258 |
|
||
|
Net change in net assets from fund share transactions |
|
(8,170,618 |
) |
|
(30,230,753 |
) |
||
|
Net change in net assets |
$ |
96,554,397 |
|
$ |
(113,223,837 |
) |
||
|
|
|
|
|
|||||
|
Net assets: |
|
|
|
|
||||
|
Beginning of year |
$ |
876,063,446 |
|
$ |
989,287,283 |
|
||
|
End of year |
$ |
972,617,843 |
|
$ |
876,063,446 |
|
||
|
|
|
|
|
|||||
|
Transactions in shares: |
|
|
|
|
||||
|
Issuance of shares - Class A |
|
370,379 |
|
|
431,499 |
|
||
|
Issuance of shares - Class I |
|
4,429,079 |
|
|
3,707,863 |
|
||
|
Issuance of shares - Class L |
|
18,802 |
|
|
19,130 |
|
||
|
Repurchase of shares - Class A |
|
(903,982 |
) |
|
(989,755 |
) |
||
|
Repurchase of shares - Class I |
|
(4,035,918 |
) |
|
(4,000,220 |
) |
||
|
Repurchase of shares - Class L |
|
(8,174 |
) |
|
(10,362 |
) |
||
|
Net change in shares |
|
(129,814 |
) |
|
(841,845 |
) |
||
1 See Note 2 in the Notes to the Financial Statements.
See accompanying Notes to the Financial Statements
19
|
Cash flows from operating activities: |
|
|
||
|
Net change in net assets from operations |
$ |
104,725,015 |
|
|
|
Adjustments to reconcile net change in net assets from operations to net cash provided by operating activities: |
|
|
||
|
Purchases of investments |
|
(10,195,808 |
) |
|
|
Net sales of short-term investments |
|
30,500,001 |
|
|
|
Proceeds from sales of investments |
|
7,079,081 |
|
|
|
Net change in unrealized gain on investments |
|
(122,482,195 |
) |
|
|
Net realized loss on investments |
|
3,734,037 |
|
|
|
Paid-in-kind interest and dividends |
|
(1,551,746 |
) |
|
|
Change in operating assets and liabilities: |
|
|
||
|
Increase in interest receivable |
|
(1,744,835 |
) |
|
|
Increase in prepaid expenses and other assets |
|
(88,135 |
) |
|
|
Increase in net payable to Investment Adviser |
|
111,778 |
|
|
|
Decrease in other accrued liabilities |
|
(263,772 |
) |
|
|
Net cash provided by operating activities |
|
9,823,421 |
|
|
|
|
|
|||
|
Cash flows from financing activities: |
|
|
||
|
Proceeds from shares issued, net of change in receivable for fund shares sold |
|
189,084,133 |
|
|
|
Cost of shares redeemed, net of change in payable |
|
(198,514,002 |
) |
|
|
Net cash used in financing activities |
|
(9,429,869 |
) |
|
|
|
|
|||
|
Net change in cash |
|
393,552 |
|
|
|
|
|
|||
|
Cash at beginning of year |
|
— |
|
|
|
Cash at end of year |
$ |
393,552 |
|
|
|
|
|
|||
|
Supplemental disclosure of noncash financing activities |
|
|
||
|
Transfer in and out between share classes |
$ |
2,892,505 |
|
See accompanying Notes to the Financial Statements
20
|
Financial Highlights – Class A For a capital share outstanding throughout each period |
|
Year ended |
Year ended |
Year ended |
Year ended |
Year ended |
||||||||||||||||
|
|
|
|
|
|
|
|
|
|
|
|||||||||||
|
Per share operating performance |
|
|
|
|
|
|
|
|
|
|
||||||||||
|
Net asset value, beginning of year |
$ |
37.91 |
|
$ |
41.37 |
|
$ |
41.77 |
|
$ |
36.33 |
|
$ |
29.96 |
|
|||||
|
|
|
|
|
|
|
|
|
|
|
|||||||||||
|
Change in net assets from operations: |
|
|
|
|
|
|
|
|
|
|
||||||||||
|
Net investment loss |
|
(0.67 |
) |
|
(0.64 |
) |
|
(0.80 |
) |
|
(0.88 |
) |
|
(0.90 |
) |
|||||
|
Net realized and unrealized gain/(loss) on investments |
|
4.98 |
|
|
(2.84 |
) |
|
0.98 |
|
|
9.54 |
|
|
7.98 |
|
|||||
|
Total change in net assets from operations |
|
4.31 |
|
|
(3.48 |
) |
|
0.18 |
|
|
8.66 |
|
|
7.08 |
|
|||||
|
|
|
|
|
|
|
|
|
|
|
|||||||||||
|
Distributions: |
|
|
|
|
|
|
|
|
|
|
||||||||||
|
From net return of capital |
|
— |
|
|
— |
|
|
— |
|
|
— |
|
|
(0.07 |
) |
|||||
|
From net realized gain on investments |
|
— |
|
|
— |
|
|
(0.58 |
) |
|
(3.22 |
) |
|
(0.64 |
) |
|||||
|
Total distributions |
|
— |
|
|
— |
|
|
(0.58 |
) |
|
(3.22 |
) |
|
(0.71 |
) |
|||||
|
|
|
|
|
|
|
|
|
|
|
|||||||||||
|
Impact of NAV Error |
|
— |
|
|
0.02 |
|
|
— |
|
|
— |
|
|
— |
|
|||||
|
Net increase (decrease) in net asset value |
|
4.31 |
|
|
(3.46 |
) |
|
(0.40 |
) |
|
5.44 |
|
|
6.37 |
|
|||||
|
Net asset value, end of year |
$ |
42.22 |
|
$ |
37.91 |
|
$ |
41.37 |
(b) |
$ |
41.77 |
|
$ |
36.33 |
|
|||||
|
|
|
|
|
|
|
|
|
|
|
|||||||||||
|
Total return(c) |
|
11.40 |
% |
|
(8.36 |
)%(d) |
|
0.42 |
% |
|
23.85 |
% |
|
23.69 |
% |
|||||
|
|
|
|
|
|
|
|
|
|
|
|||||||||||
|
Ratios and supplemental data |
|
|
|
|
|
|
|
|
|
|
||||||||||
|
Net assets, end of year (in thousands) |
$ |
136,148 |
|
$ |
142,451 |
|
$ |
178,577 |
|
$ |
158,433 |
|
$ |
103,984 |
|
|||||
|
Ratio of net expenses to average net assets(e) |
|
2.65 |
%(f) |
|
2.60 |
%(g)(h) |
|
2.51 |
%(g) |
|
2.51 |
%(g) |
|
2.50 |
% |
|||||
|
Ratio of gross expenses before reimbursement to average net assets |
|
2.55 |
% |
|
2.48 |
% |
|
2.41 |
% |
|
2.64 |
% |
|
2.97 |
% |
|||||
|
Ratio of net investment loss to average net assets |
|
(1.70 |
)% |
|
(1.60 |
)% |
|
(1.89 |
)% |
|
(2.42 |
)% |
|
(2.48 |
)% |
|||||
|
Portfolio turnover |
|
0.84 |
% |
|
2.23 |
% |
|
3.17 |
% |
|
26.20 |
% |
|
6.97 |
% |
|||||
(a) Per share calculations are based on average shares outstanding throughout the period.
(b) The NAV per share has been adjusted from the published NAV of $41.75 for post-closing adjustments.
(c) The Fund’s total investment returns do not include a sales load.
(d) A revision on the valuation of certain securities resulted in understated NAV. The impact of the NAV error on Total Return at NAV was 0.05%.
(e) The ratio of net expenses includes recoupment of previously waived and/or reimbursed fees of $144,908, $199,187 and $184,461, or 0.10%, 0.12% and 0.10%, for the fiscal year ended December 31, 2024, 2023 and 2022, respectively, and contractual waivers and expense reimbursements of $171,876 and $492,357, or 0.12% and 0.47% for the fiscal years ended December 31, 2021 and 2020, respectively. Please see Note 4 in the Notes to the Financial Statements for additional information.
(f) Effective November 19, 2024 expenses associated with lines of credit are excluded from of the 2.65% expense cap. Borrowing costs incurred by the Fund and allocated to Class A during November 19, 2024 to December 31, 2024 were $1,667 or 0.00%.
(g) During the fiscal years ended December 31, 2023, 2022 and 2021 there were legal expenses incurred by the Fund that were distinguishable in their characterization as being unusual in nature as well as not expected to be recurring in future periods. The exclusion of these extraordinary expenses from the Fund’s expense limitation agreement caused the expense ratio to exceed the contractual expense limit by $943 or 0.00%, $17,472 or 0.01% and $17,854 or 0.01%, respectively.
(h) Effective May 1, 2023, the Investment Adviser contractually agreed to waive management fees and/or reimburse the Fund for expenses the Fund incurs, subject to certain exclusions, to the extent necessary to maintain the Fund’s total annual operating expenses after fee waivers and/or reimbursement to an annual rate of 2.65%, 2.40%, and 2.90% (each, an “Expense Limit”) of the average daily net assets of the Fund attributable to Class A, Class I and Class L Shares, respectively. Prior to May 1, 2023, the Expense Limit for Class A shares was 2.50%.
See accompanying Notes to the Financial Statements
21
|
THE PRIVATE SHARES FUND |
|
Financial Highlights – Class I For a capital share outstanding throughout each period |
|
Year ended |
Year ended |
Year ended |
Year ended |
Year ended |
||||||||||||||||
|
|
|
|
|
|
|
|
|
|
|
|||||||||||
|
Per share operating performance |
|
|
|
|
|
|
|
|
|
|
||||||||||
|
Net asset value, beginning of year |
$ |
38.52 |
|
$ |
41.94 |
|
$ |
42.22 |
|
$ |
36.61 |
|
$ |
30.12 |
|
|||||
|
|
|
|
|
|
|
|
|
|
|
|||||||||||
|
Change in net assets from operations: |
|
|
|
|
|
|
|
|
|
|
||||||||||
|
Net investment loss |
|
(0.58 |
) |
|
(0.55 |
) |
|
(0.65 |
) |
|
(0.62 |
) |
|
(0.47 |
) |
|||||
|
Net realized and unrealized gain/(loss) on investments |
|
5.07 |
|
|
(2.89 |
) |
|
0.95 |
|
|
9.45 |
|
|
7.67 |
|
|||||
|
Total change in net assets from operations |
|
4.49 |
|
|
(3.44 |
) |
|
0.30 |
|
|
8.83 |
|
|
7.20 |
|
|||||
|
|
|
|
|
|
|
|
|
|
|
|||||||||||
|
Distributions: |
|
|
|
|
|
|
|
|
|
|
||||||||||
|
From net return of capital |
|
— |
|
|
— |
|
|
— |
|
|
— |
|
|
(0.07 |
) |
|||||
|
From net realized gain on investments |
|
— |
|
|
— |
|
|
(0.58 |
) |
|
(3.22 |
) |
|
(0.64 |
) |
|||||
|
Total distributions |
|
— |
|
|
— |
|
|
(0.58 |
) |
|
(3.22 |
) |
|
(0.71 |
) |
|||||
|
|
|
|
|
|
|
|
|
|
|
|||||||||||
|
Impact of NAV Error |
|
— |
|
|
0.02 |
|
|
— |
|
|
— |
|
|
— |
|
|||||
|
Net increase (decrease) in net asset value |
|
4.49 |
|
|
(3.42 |
) |
|
(0.28 |
) |
|
5.61 |
|
|
6.49 |
|
|||||
|
Net asset value, end of year |
$ |
43.01 |
|
$ |
38.52 |
|
$ |
41.94 |
(b) |
$ |
42.22 |
|
$ |
36.61 |
|
|||||
|
|
|
|
|
|
|
|
|
|
|
|||||||||||
|
Total return |
|
11.66 |
% |
|
(8.15 |
)%(c) |
|
0.70 |
% |
|
24.13 |
% |
|
23.97 |
% |
|||||
|
|
|
|
|
|
|
|
|
|
|
|||||||||||
|
Ratios and supplemental data |
|
|
|
|
|
|
|
|
|
|
||||||||||
|
Net assets, end of year (in thousands) |
$ |
832,134 |
|
$ |
730,108 |
|
$ |
807,234 |
|
$ |
566,272 |
|
$ |
197,921 |
|
|||||
|
Ratio of net expenses to average net assets(d) |
|
2.40 |
%(e) |
|
2.35 |
%(f)(g) |
|
2.26 |
%(f) |
|
2.26 |
%(f) |
|
2.25 |
% |
|||||
|
Ratio of gross expenses before reimbursement to average net assets |
|
2.49 |
% |
|
2.42 |
% |
|
2.34 |
% |
|
2.50 |
% |
|
2.75 |
% |
|||||
|
Ratio of net investment loss to average net assets |
|
(1.45 |
)% |
|
(1.36 |
)% |
|
(1.62 |
)% |
|
(2.15 |
)% |
|
(2.24 |
)% |
|||||
|
Portfolio turnover |
|
0.84 |
% |
|
2.23 |
% |
|
3.17 |
% |
|
26.20 |
% |
|
6.97 |
% |
|||||
(a) Per share calculations are based on average shares outstanding throughout the period.
(b) The NAV per share has been adjusted from the published NAV of $42.32 for post-closing adjustments.
(c) A revision on the valuation of certain securities resulted in understated NAV. The impact of the NAV error on Total Return at NAV was 0.05%.
(d) The ratio of net expenses includes contractual waivers and expense reimbursements of $719,354, $594,159, $631,951, $899,197, $567,388, and $546,174, or 0.09%, 0.07%, 0.08%, 0.23%, 0.50%, and 0.82%, for the fiscal years ended December 31, 2024, 2023, 2022, 2021, and 2020, respectively. Please see Note 4 in the Notes to the Financial Statements for additional information.
(e) Effective November 19, 2024 expenses associated with lines of credit are excluded from of the 2.40% expense cap. Borrowing costs incurred by the Fund and allocated to Class I during November 19, 2024 to December 31, 2024 were $10,000 or 0.00%.
(f) During the fiscal years ended December 31, 2023, 2022 and 2021 there were legal expenses incurred by the Fund that were distinguishable in their characterization as being unusual in nature as well as not expected to be recurring in future periods. The exclusion of these extraordinary expenses from the Fund’s expense limitation agreement caused the expense ratio to exceed the contractual expense limit by $4,444 or 0.00%, $74,334 or 0.01% and $48,772 or 0.01%, respectively.
(g) Effective May 1, 2023, the Investment Adviser contractually agreed to waive management fees and/or reimburse the Fund for expenses the Fund incurs, subject to certain exclusions, to the extent necessary to maintain the Fund’s total annual operating expenses after fee waivers and/or reimbursement to an annual rate of 2.65%, 2.40%, and 2.90% (each, an “Expense Limit”) of the average daily net assets of the Fund attributable to Class A, Class I and Class L Shares, respectively. Prior to May 1, 2023, the Expense Limit for Class I shares was 2.25%.
See accompanying Notes to the Financial Statements
22
|
THE PRIVATE SHARES FUND |
|
Financial Highlights – Class L For a capital share outstanding throughout each period |
|
Year ended |
Year ended |
Year ended |
Year ended |
Year ended |
||||||||||||||||
|
|
|
|
|
|
|
|
|
|
|
|||||||||||
|
Per share operating performance |
|
|
|
|
|
|
|
|
|
|
||||||||||
|
Net asset value, beginning of year |
$ |
37.32 |
|
$ |
40.82 |
|
$ |
41.33 |
|
$ |
36.07 |
|
$ |
29.83 |
|
|||||
|
|
|
|
|
|
|
|
|
|
|
|||||||||||
|
Change in net assets from operations: |
|
|
|
|
|
|
|
|
|
|
||||||||||
|
Net investment loss |
|
(0.76 |
) |
|
(0.74 |
) |
|
(1.12 |
) |
|
(0.82 |
) |
|
(0.67 |
) |
|||||
|
Net realized and unrealized gain/(loss) on investments |
|
4.91 |
|
|
(2.78 |
) |
|
1.19 |
|
|
9.30 |
|
|
7.62 |
|
|||||
|
Total change in net assets from operations |
|
4.15 |
|
|
(3.52 |
) |
|
0.07 |
|
|
8.48 |
|
|
6.95 |
|
|||||
|
|
|
|
|
|
|
|
|
|
|
|||||||||||
|
Distributions: |
|
|
|
|
|
|
|
|
|
|
||||||||||
|
From net return of capital |
|
— |
|
|
— |
|
|
— |
|
|
— |
|
|
(0.07 |
) |
|||||
|
From net realized gain on investments |
|
— |
|
|
— |
|
|
(0.58 |
) |
|
(3.22 |
) |
|
(0.64 |
) |
|||||
|
Total distributions |
|
— |
|
|
— |
|
|
(0.58 |
) |
|
(3.22 |
) |
|
(0.71 |
) |
|||||
|
|
|
|
|
|
|
|
|
|
|
|||||||||||
|
Impact of NAV Error |
|
— |
|
|
0.02 |
|
|
— |
|
|
— |
|
|
— |
|
|||||
|
Net increase (decrease) in net asset value |
|
4.15 |
|
|
(3.50 |
) |
|
(0.51 |
) |
|
5.26 |
|
|
6.24 |
|
|||||
|
Net asset value, end of year |
$ |
41.47 |
|
$ |
37.32 |
|
$ |
40.82 |
(b) |
$ |
41.33 |
|
$ |
36.07 |
|
|||||
|
|
|
|
|
|
|
|
|
|
|
|||||||||||
|
Total return(c) |
|
11.12 |
% |
|
(8.57 |
)%(d) |
|
0.16 |
% |
|
23.52 |
% |
|
23.36 |
% |
|||||
|
|
|
|
|
|
|
|
|
|
|
|||||||||||
|
Ratios and supplemental data |
|
|
|
|
|
|
|
|
|
|
||||||||||
|
Net assets, end of year (in thousands) |
$ |
4,335 |
|
$ |
3,505 |
|
$ |
3,476 |
|
$ |
3,780 |
|
$ |
1,539 |
|
|||||
|
Ratio of net expenses to average net assets(e) |
|
2.90 |
%(f) |
|
2.85 |
%(g)(h) |
|
2.76 |
%(g) |
|
2.76 |
%(g) |
|
2.75 |
% |
|||||
|
Ratio of gross expenses before reimbursement to average net assets |
|
2.84 |
% |
|
2.73 |
% |
|
2.63 |
% |
|
2.84 |
% |
|
3.18 |
% |
|||||
|
Ratio of net investment loss to average net assets |
|
(1.96 |
)% |
|
(1.86 |
)% |
|
(2.15 |
)% |
|
(2.66 |
)% |
|
(2.74 |
)% |
|||||
|
Portfolio turnover |
|
0.84 |
% |
|
2.23 |
% |
|
3.17 |
% |
|
26.20 |
% |
|
6.97 |
% |
|||||
(a) Per share calculations are based on average shares outstanding throughout the period.
(b) The NAV per share has been adjusted from the published NAV of $41.20 for post-closing adjustments.
(c) The Fund’s total investment returns do not include a sales load.
(d) A revision on the valuation of certain securities resulted in understated NAV. The impact of the NAV error on Total Return at NAV was 0.05%.
(e) The ratio of net expenses includes recoupment of previously waived and/or reimbursed fees of $2,358, $4,383 and $5,663, or 0.06%, 0.12% and 0.13%, for the fiscal years ended December 31, 2024, 2023 and 2022, respectively, and contractual waivers and expense reimbursements of $2,134, and $4,514, or 0.08%, and 0.43%, for the fiscal years ended December 31, 2021 and 2020, respectively. Please see Note 4 in the Notes to the Financial Statements for additional information.
(f) Effective November 19, 2024 expenses associated with lines of credit are excluded from of the 2.90% expense cap. Borrowing costs incurred by the Fund and allocated to Class L during November 19, 2024 to December 31, 2024 were $54 or 0.00%.
(g) During the fiscal years ended December 31, 2023, 2022 and 2021 there were legal expenses incurred by the Fund that were distinguishable in their characterization as being unusual in nature as well as not expected to be recurring in future periods. The exclusion of these extraordinary expenses from the Fund’s expense limitation agreement caused the expense ratio to exceed the contractual expense limit by $20 or 0.00%, $428 or 0.01% and $361 or 0.01%, respectively.
(h) Effective May 1, 2023, the Investment Adviser contractually agreed to waive management fees and/or reimburse the Fund for expenses the Fund incurs, subject to certain exclusions, to the extent necessary to maintain the Fund’s total annual operating expenses after fee waivers and/or reimbursement to an annual rate of 2.65%, 2.40%, and 2.90% (each, an “Expense Limit”) of the average daily net assets of the Fund attributable to Class A, Class I and Class L Shares, respectively. Prior to May 1, 2023, the Expense Limit for Class L shares was 2.75%.
See accompanying Notes to the Financial Statements
23
1. Organization
The Private Shares Fund (the “Fund”) was established as a limited liability company under the laws of the State of Delaware on August 20, 2012 and converted into a Delaware statutory trust on March 22, 2013. The Fund is registered with the Securities and Exchange Commission (the “SEC”) as a diversified, closed-end management investment company that operates as an “interval fund” under the Investment Company Act of 1940, as amended (the “1940 Act”). The shares of beneficial interest of the Fund (the “Shares”) are continuously offered under Rule 415 of the Securities Act of 1933, as amended (the “Securities Act”). As an interval fund, the Fund makes quarterly repurchase offers for 5% of the Fund’s outstanding Shares at net asset value (“NAV”), with no repurchase fee incurred. The Fund’s inception date was March 25, 2014. Prior to March 25, 2014, the Fund had been inactive except for matters relating to the Fund’s establishment, designation and planned registration of the Fund’s Shares under the Securities Act and the sale of 5,000 Shares (“Initial Shares”) for $100,000 to the Fund’s initial shareholder, which occurred on July 30, 2013.
The investment objective of the Fund is to provide investors capital appreciation, which it seeks by primarily investing, under normal market conditions, at least 80% of (i) the value of its net assets, plus (ii) the amount of any borrowings for investment purposes, in the equity securities (e.g., common and/or preferred stock, or equity-linked securities convertible into such equity securities) of private, operating growth companies (each, a “Portfolio Company”). Liberty Street Advisors, Inc.’s (the “Investment Adviser”) primary strategy is to invest in Portfolio Companies and to hold such securities until a liquidity event with respect to such Portfolio Company occurs, such as an initial public offering, or a merger or acquisition transaction. The Fund currently offers three different classes of shares: Class A, Class I, and Class L shares. The separate classes of shares differ principally in the applicable sales charges (if any) and shareholder servicing fees. Generally, shareholders of each class also bear certain expenses that pertain to that particular class. All shareholders bear the common expenses of the Fund and earn income and realized and unrealized gains/losses pro rata based on the daily ending net assets of each class, without discrimination between share classes. Expenses that are specific to a class are charged directly to that class. Dividends are determined separately for each class based on income and expenses allocated to each class. Realized gain distributions are allocated to each class pro rata based on the shares outstanding of each class on the date of distribution. Differences in per share dividend rates generally result from the differences in separate class expenses, including distribution and shareholder servicing fees.
2. Significant accounting policies
The Fund is an investment company and follows the accounting and reporting guidance under Financial Accounting Standards Board (“FASB”) Accounting Standards Codification (“ASC”) Topic 946, Financial Services – Investment Companies. The following is a summary of significant accounting policies consistently followed by the Fund in the preparation of its financial statements.
Investment transactions and income recognition — Investment transactions are accounted for on a trade date basis. Net realized gains and losses on securities are computed on a specific identification basis. Dividend income is recorded on the ex-dividend date or as soon as known if after the ex-dividend date. Non-cash dividends included in dividend income, if any, are recorded at fair value. Interest income and estimated expenses are accrued daily.
Use of estimates — The preparation of the financial statements in accordance with US generally accepted accounting principles (“GAAP”) requires management to make estimates and assumptions that affect the reported amounts of assets and liabilities and disclosure of contingent assets and liabilities at the date of the financial statements, as well as reported amounts of increases and decreases in net assets from operations during the reporting period. Actual results could differ from these estimates.
Investment valuation — The Fund’s NAV is based in large part on the value of its securities which are carried at fair value in accordance with the provisions of FASB ASC Topic 820, Fair Value Measurements and Disclosures. Where reliable market prices are available for those securities, the Investment Adviser will rely on those prices. However, because the securities in which the Fund invests are often illiquid, market prices may not be readily available or, where available, may be unreliable. At any point in time, there may be few recent purchase or sale transactions or offers on which to base the value of a given Portfolio Company’s security. In addition, the prices reflected in recent transactions or offers may be extremely sensitive to changes in supply or demand, including changes fueled by investor perceptions or other conditions.
24
|
THE PRIVATE SHARES FUND |
|
Notes to the Financial Statements (Continued) December 31, 2024 |
|
2. Significant accounting policies — (continued) |
When reliable market values are not available, the Fund’s investments will be valued by the Investment Adviser, as the Valuation Designee designated by the Board of Trustees, pursuant to valuation procedures and methodologies approved by the Board of Trustees. While the Valuation Designee will use good faith efforts to determine the fair value of the Fund’s securities, fair value will be dependent on the judgment of the Valuation Designee. The Valuation Designee may also rely to some extent on information provided by the Portfolio Companies.
From time to time, the Fund may determine that it should modify its estimates or assumptions, as new information becomes available. As a consequence, the value of the securities, and therefore the Fund’s NAV, may vary. This may adversely affect shareholders. Because of the uncertainty and judgment involved in the valuation of the Portfolio Company securities, which do not have a readily available market, the estimated fair value of such securities may be different from values that would have been used had a readily available market existed for such securities. In addition, in the event that the Fund desires to sell Portfolio Company shares, the Fund may also not be able to sell these securities at the prices at which they are carried on the Fund’s books or may have to delay their sale in order to do so. This may adversely affect the Fund’s NAV.
There were no changes to the valuation approaches or techniques applied to the assessment of fair value for the Fund’s common stock in private companies, preferred stock in private companies, warrants of private companies, convertible notes of private companies, simple agreement for future equity of private companies and special purpose vehicles/private funds during the year ended December 31, 2024. The Fund may engage a third-party provider in the valuation of the Portfolio Company securities.
Federal income taxes — The Fund’s policy is to comply with Subchapter M of the Internal Revenue Code of 1986, as amended (the “Code”), and to distribute to shareholders each year substantially all of its net investment income and any net realized capital gain. Therefore, a federal income tax or excise tax provision is not required.
Management has evaluated all tax positions taken or expected to be taken by the Fund to determine whether each tax position is more likely than not (i.e. greater than 50%) to be sustained upon examination by the applicable taxing authority, including resolution of any related appeals or litigation processes, based on the technical merits of the position. Tax positions that do not meet the more likely than not threshold may result in a tax benefit or expense in the current year. If the Fund were to incur an income tax liability in the future, interest on any income tax liability would be reported as interest expense and penalties on any income tax liability would be reported as income taxes. No interest expense or penalties have been recognized as of or for the year ended December 31, 2024. Management of the Fund also is not aware of any tax positions for which it is reasonably possible that the total amounts of recognized tax benefits will significantly change in the next twelve months. Management has determined that the Fund has not taken any tax positions which do not meet the more likely than not threshold and as such, no liabilities related to uncertain tax positions have been reflected in the Fund’s financial statements.
Management analyzed all open tax years, as defined by the applicable statute of limitations for all major jurisdictions in which it files tax returns, which includes federal and certain states. The Fund’s 2020 - 2023 tax years are open to examination as of December 31, 2024.
Distributions to shareholders — The Fund distributes net investment income and net realized gains (net of any capital loss carryovers), if any, annually. The timing and character of income and capital gain distributions are determined in accordance with income tax regulations, which may differ from GAAP. These differences are due in part to differing treatment of net operating loss, wash sales, non-deductible offering costs and capital loss carryforwards. To the extent that differences arise that are permanent in nature, such amounts are reclassified within the capital accounts on the Statement of Assets and Liabilities, based on their federal tax treatment. Temporary differences do not require reclassification.
25
|
THE PRIVATE SHARES FUND |
|
Notes to the Financial Statements (Continued) December 31, 2024 |
|
2. Significant accounting policies — (continued) |
Shareholder service fee plan — Under the terms of the Fund’s Shareholder Services Plan, the Fund compensates financial industry professionals for providing ongoing services with respect to clients to whom they have distributed Class A and Class L Shares of the Fund. Both Class A and Class L may incur shareholder servicing fees on an annual basis up to 0.25% of its daily average NAV. Class I is not subject to a shareholder servicing fee. For the year ended December 31, 2024, Class A and Class L incurred $80,771 and $3,529, respectively, in shareholder servicing fees.
Distribution fee plan — Under the terms of the Fund’s Distribution Plan, the Fund compensates financial industry professionals for providing ongoing services with respect to certain activities relating to the distribution of Class L to investors and maintenance of shareholder accounts, as well as for payments to the Class L platform sponsors. Although the Fund is not an open-end investment company, it has undertaken to comply with the terms of Rule 12b-1 as a condition of an exemptive order under the 1940 Act which permits it to have asset-based distribution fees. Under the Distribution Plan, Class L pays Foreside Fund Services, LLC (“Distributor”) a distribution fee at an annual rate of 0.25% of its average daily NAV. Class A and Class I are not subject to a distribution fee. For the year ended December 31, 2024, Class L incurred $9,229 in distribution fees.
The Investment Adviser’s affiliated broker-dealer, HRC Fund Associates, LLC (“HRC”), Member FINRA/SIPC, markets the Fund shares to financial intermediaries pursuant to a marketing agreement with the Investment Adviser. The marketing agreement between the Investment Adviser and HRC is not part of the Distribution Plan. The Investment Adviser pays HRC out of its own resources and without additional cost to the Fund or its shareholders. In addition, for its wholesaling activities, HRC receives sales charges from the Fund’s Distributor pursuant to a wholesaling agreement with the Fund’s Distributor. For the year ended December 31, 2024, HRC received $13,471 in sales charges from the Fund’s Distributor for the wholesaling services.
Line of credit — The Fund has entered into a one-year credit agreement with UMB Bank, n.a. (the “Bank”), to provide for short-term financing for fund operations including share repurchases and investment opportunities. The credit agreement is divided into two parts: a committed line of credit (the “Committed Facility”) under which the Fund may borrow at its election and an uncommitted line of credit (the “Uncommitted Facility”) made available to the Fund at the Bank’s election. Loans issued under the credit agreement are secured by the assets of the Fund. Borrowings under the credit agreement bear interest at the 1-Month Secured Overnight Financing Rate (“SOFR”) plus 2.50%, annually. The Fund pays interest, origination fees and other fees and expenses in connection with loans under the credit agreement. The Fund pays the Bank an annual commitment fee (the “Commitment Fee”) on the unused portion of the Committed Facility. The credit agreement is subject to renegotiation in subsequent periods. Any interest derived from usage of the line of credit is treated as exclusive of the expense cap.
For the period from January 1, 2024 to December 30, 2024, the Committed Facility and Uncommitted Facility amounts were $48,448,150 and $11,551,850, respectively, and the Commitment Fee charged to the Fund was based on the average daily unused balance of the Committed Facility at the rate of 0.20% per annum. Effective December 31, 2024, the Committed Facility and Uncommitted Facility amounts increased to $150,000,000, of which up to $75,000,000 is part of the Committed Facility and the remaining balance is part of the Uncommitted Facility. Effective December 31, 2024, the Commitment Fee charged to the Fund will be based on the average daily unused balance of the Committed Facility at the rate of 0.50% per annum. The amended agreement will mature on December 31, 2025.
Commitment fees for the year ended December 31, 2024 were $97,087 and are included within Miscellaneous expenses on the Statement of Operations. The Fund did not borrow under the Facility during the year and had no outstanding balance as of December 31, 2024.
Transactions with affiliates — To the extent any affiliate of the Investment Adviser or the Fund (“Affiliated Broker”) receives any fee, payment, commission, or other financial incentive of any type (“Broker Fees”) in connection with the purchase and sale of securities by the Fund, such Broker Fees will be subject to policies and procedures adopted by the Board of Trustees pursuant to Section 17(e) and Rule 17e-1 of the 1940 Act. These policies and procedures include a quarterly review of Broker Fees by the Board of Trustees. Among other things, Section 17(e) and those procedures provide that, when acting as broker for the Fund in connection with the purchase or sale of securities to or by the Fund, an Affiliated Broker may not receive any compensation exceeding
26
|
THE PRIVATE SHARES FUND |
|
Notes to the Financial Statements (Continued) December 31, 2024 |
|
2. Significant accounting policies — (continued) |
the following limits: (1) if the transaction is effected on a securities exchange, the compensation may not exceed the “usual and customary broker’s commission” (as defined in Rule 17e-1 under the 1940 Act); (2) in the case of the purchase of securities by the Fund in connection with a secondary distribution, the compensation cannot exceed 2% of the sale price; and (3) the compensation for transactions otherwise effected cannot exceed 1% of the purchase or sale price. Rule 17e-1 defines a “usual and customary broker’s commission” as one that is fair compared to the commission received by other brokers in connection with comparable transactions involving similar securities being purchased or sold on an exchange during a comparable period of time. Notwithstanding the foregoing, no Affiliated Broker will receive any undisclosed fees from the Fund in connection with any transaction involving the Fund and such Affiliated Broker, and to the extent any transactions involving the Fund are effected by an Affiliated Broker, such Affiliated Broker’s Broker Fees for such transactions shall be limited in accordance with Section 17(e)(2) of the 1940 Act and the Fund’s policies and procedures concerning Affiliated Brokers. The Fund did not conduct any transactions with an Affiliated Broker for the year ended December 31, 2024.
The Fund has implemented certain written policies and procedures to ensure that the Fund does not engage in any transactions with any prohibited affiliates. Under the 1940 Act, the Board of Trustees has a duty to evaluate, and shall oversee the analysis of, all conflicts of interest involving the Fund and its affiliates, and shall do so in accordance with the aforementioned policies and procedures.
Payment from affiliate — For the year ended December 31, 2023, the Fund was reimbursed $572,258 from the Adviser as a result of a NAV error. The error occurred from November 9, 2022 through December 31, 2022 and had an immaterial impact to the NAV and total return of the Fund for 2022. Also, the Fund was reimbursed $20,000 from the Adviser as part of the reinstatement of the Class L’s Rule 12b-1 distribution plan. These are included in the fund share transactions on the Fund’s Statements of Changes in Net Assets.
Investments in special purpose vehicles/private funds — Special purpose vehicles (“SPVs”) consist of an investment by the Fund in an entity that invests directly in the common or preferred stock of a Portfolio Company. Investments in SPVs are generally valued using the same fair value techniques for the securities held by the Fund once the investment has been made by the SPV into the underlying Portfolio Company and are categorized as Level 3 of the fair value hierarchy. The investments in an SPV that have yet to purchase the underlying securities are held at cost and are categorized in Level 3 of the fair value hierarchy. The investments in private funds are measured using net asset value as a practical expedient and are not categorized within the fair value hierarchy.
Segment information — Effective for the year ended December 31, 2024, the Fund has adopted Accounting Standards Update (ASU) 2023-07, “Segment Reporting (Topic 280): Improvements to Reportable Segment Disclosures” (ASU 2023-07), in these financial statements. The adoption of ASU 2023-07 has resulted in additional disclosures, as described below, but did not have a material impact on the amounts recognized in the financial statements.
ASU 2023-07, among other things, (i) requires a single segment public entity to provide all of the disclosures as required by Topic 280, (ii) requires a public entity to disclose the title and position of the Chief Operating Decision Maker (CODM) and an explanation of how the CODM uses the reported measure(s) of segment profit or loss in assessing segment performance and deciding how to allocate resources and (iii) provides the ability for a public entity to elect more than one performance measure.
The Fund operates through a single operating and reporting segment. The Fund’s CODM is its Principal Executive Officer and President, Kevin Moss. Mr. Moss reviews the financial information by way of the Fund’s portfolio composition (Schedule of Investments), total returns, expense ratios and changes in net assets (i.e. changes in net assets resulting from operations, subscriptions and redemptions), which are used by the CODM to assess performance versus the Fund’s comparative benchmarks to make resource allocation decisions for the Fund. The financial information is consistent with that presented within the Fund’s accompanying financial statements.
27
|
THE PRIVATE SHARES FUND |
|
Notes to the Financial Statements (Continued) December 31, 2024 |
3. Fair value measurements
GAAP defines fair value, establishes a three-tier framework for measuring fair value based on a hierarchy of inputs, and expands disclosure about fair value measurements. It also provides guidance on determining when there has been a significant decrease in the volume and level of activity for an asset or liability, when a transaction is not orderly and how that information must be incorporated into a fair value measurement. The hierarchy distinguishes between market data obtained from independent sources (observable inputs) and the Fund’s own market assumptions (unobservable inputs). These inputs are used in determining the fair value of the Fund’s investments. These inputs are summarized in the three broad levels listed below:
• Level 1 — quoted prices for active markets for identical securities. An active market for the security is a market in which transactions occur with sufficient frequency and volume to provide pricing information on an ongoing basis. A quoted price in an active market provides the most reliable evidence of fair value.
• Level 2 — other significant observable inputs (including quoted prices for similar securities, interest rates, prepayment speeds, credit risk, etc. and quoted prices for identical or similar assets in markets that are not active). Inputs that are derived principally from or corroborated by observable market data. An adjustment to any observable input that is significant to the fair value may render the measurement a Level 3 measurement.
• Level 3 — significant unobservable inputs, including the Fund’s own assumptions in determining the fair value of investments.
For the year ended December 31, 2024, there were transfers of $3,401,166 out of Level 3.
The following is a description of the valuation techniques applied to the Fund’s major categories of assets and liabilities measured at fair value on a recurring basis. There were no changes to the valuation approaches or techniques applied to the assessment of fair value for the Fund’s common stock in private companies, preferred stock in private companies, warrants of private companies, convertible notes of private companies, simple agreement for future equity of private companies and special purpose vehicles/private funds during the year ended December 31, 2024. The Fund may engage a third-party provider in the valuation of the Portfolio Company securities.
Securities traded on a national exchange (or reported on the NYSE and NASDAQ national market) are stated at the last reported sales price on the day of valuation. To the extent these securities are actively traded, and valuation adjustments are not applied, they are categorized in Level 1 of the fair value hierarchy. Stocks traded on inactive markets or valued by reference to similar instruments which are marketable and to the extent the inputs are observable and timely, are categorized in Level 2 of the fair value hierarchy.
The Fund’s portfolio holdings are primarily in Level 3 investments. As they are not publicly traded, and many are subject to restrictions on resale, the investments are less liquid than publicly traded securities, resulting in increased liquidity risk to the Fund.
The Fund’s portfolio investments will generally not be in publicly traded securities. Investments for which observable market prices in active markets do not exist are reported at fair value, as determined in good faith by the Investment Adviser under consistently applied policies and procedures approved by the Board of Trustees in accordance with GAAP. The Board has designated the Investment Adviser to be the Valuation Designee to prepare Portfolio Company valuations. The Valuation Designee has adopted appropriate segregation protocols to minimize the Fund portfolio managers’ influence on the Adviser’s Fair Value process.
Investments in private operating companies may consist of common stock, preferred stock, and debt of privately owned portfolio companies. At each measurement date, the Fund reviews the valuation of each investment and records adjustments as necessary to reflect the expected exit value of the investment under current market conditions. Ongoing reviews by the Fund’s management are based on an assessment of the type of investment, the stage in the lifecycle of the portfolio company, and trends in the performance and credit profile of each portfolio company as of the measurement date. The Fund generally values private operating companies using the company’s most recent round of equity financing. As the validity of this value is inevitably eroded over time, the Fund will
28
|
THE PRIVATE SHARES FUND |
|
Notes to the Financial Statements (Continued) December 31, 2024 |
|
3. Fair value measurements — (continued) |
take a market approach to value such portfolio companies. In certain instances, the Fund may use multiple valuation approaches for a particular investment and estimate its fair value based on a weighted average or a selected outcome within a range of multiple valuation results. The decision to use a valuation approach will depend on the investment type and the information available. The market approach includes valuation techniques that use observable market data (e.g., current trading and/or acquisition multiples) of comparable companies and applying the data to key financial metrics of the investment. The comparability (as measured by size, growth profile, and geographic concentration, among other factors) of the identified set of comparable companies to the investment is considered in applying the market approach. The Option Pricing Model treats a portfolio company’s common stock and preferred stock as call options on the enterprise or equity value of the portfolio company, with exercise or strike prices based on the characteristics of each series or class of equity in the portfolio company’s capital structure (e.g., the liquidation preference of a given series of preferred stock). This method is sensitive to certain key assumptions, such as volatility and time to exit, that are not observable. This information may not be available because it is difficult to obtain financial and other information with respect to private companies. In considering the extent and nature of information utilized in the valuation process, management will generally apply a greater weighting to that information which is recent and observable. Because such valuations are inherently uncertain and may be based on estimates, the determinations of fair value may differ materially from the values that would be assessed if a readily available market for these securities existed. Based on these factors, the investments in private companies will generally be presented as a Level 3 investment. Changes in accounting standards, such as the recent change in revenue recognition policies, may not be adopted consistently by issuers or at the same time, and as a result varied implementation may make it more difficult for the Fund to properly evaluate or compare financial information provided by Portfolio Companies of the Fund or to determine the validity of data of publicly traded company comparables for purposes of valuing the Fund’s portfolio holdings.
The inputs or methodology used for valuing securities are not necessarily an indication of the risk associated with investing in those securities. The following is a summary of the inputs used to determine fair value of the Fund’s investments as of December 31, 2024:
|
Investment in Securities |
Level 1 |
Level 2 |
Level 3 |
Investments |
Total |
||||||||||
|
|
|
|
|
|
|||||||||||
|
Security Type* |
|
|
|
|
|
||||||||||
|
Common stock in private companies |
$ |
— |
$ |
— |
$ |
419,668,594 |
$ |
— |
$ |
419,668,594 |
|||||
|
Preferred stock in private companies |
|
— |
|
— |
|
453,236,115 |
|
— |
|
453,236,115 |
|||||
|
Convertible notes of private companies |
|
— |
|
— |
|
38,120,050 |
|
— |
|
38,120,050 |
|||||
|
Units of private companies |
|
— |
|
— |
|
193,857 |
|
— |
|
193,857 |
|||||
|
Warrants of private companies |
|
— |
|
— |
|
1,366,370 |
|
— |
|
1,366,370 |
|||||
|
Simple agreement for future equity of private companies |
|
— |
|
— |
|
250,000 |
|
— |
|
250,000 |
|||||
|
Special purpose vehicles/private funds |
|
— |
|
— |
|
— |
|
3,958,030 |
|
3,958,030 |
|||||
|
Short-term investments |
|
53,347,592 |
|
— |
|
— |
|
— |
|
53,347,592 |
|||||
|
Total |
$ |
53,347,592 |
$ |
— |
$ |
912,834,986 |
$ |
3,958,030 |
$ |
970,140,608 |
|||||
____________
* All sub-categories within the security type represent their respective evaluation status. For a detailed breakout by industry, please refer to the Schedule of Investments.
29
|
THE PRIVATE SHARES FUND |
|
Notes to the Financial Statements (Continued) December 31, 2024 |
|
3. Fair value measurements — (continued) |
The following is a rollforward of the activity in investments in which significant unobservable inputs (Level 3) were used in determining fair value on a recurring basis:
|
Beginning |
Transfers |
Transfers |
Purchases or |
(Sales or |
Net |
Change in net |
Ending |
Change in |
|||||||||||||||||||||||
|
The Private Shares Fund |
|||||||||||||||||||||||||||||||
|
Common stock in private companies |
$ |
360,045,401 |
$ |
— |
$ |
(3,401,166 |
) |
$ |
11,235,884 |
1 |
$ |
(9,909,802 |
)2 |
$ |
(2,066,299 |
) |
$ |
63,764,576 |
$ |
419,668,594 |
$ |
59,846,415 |
|||||||||
|
Preferred stock in private companies |
383,413,414 |
— |
— |
21,028,219 |
3,4,5 |
(12,741,653 |
)1,6 |
— |
61,536,135 |
453,236,115 |
69,660,580 |
||||||||||||||||||||
|
Convertible notes of private companies |
44,528,100 |
— |
— |
1,935,495 |
7 |
(6,305,227 |
)3,8 |
(6,705 |
) |
(2,031,613 |
) |
38,120,050 |
3,696,604 |
||||||||||||||||||
|
Units of private companies |
— |
— |
— |
2,610,856 |
2,6 |
— |
(2,416,978 |
) |
(21 |
) |
193,857 |
(21 |
) |
||||||||||||||||||
|
Warrants of private companies |
2,568,297 |
— |
— |
— |
— |
— |
(1,201,927 |
) |
1,366,370 |
(1,201,927 |
) |
||||||||||||||||||||
|
Simple agreement for future equity of private companies |
|
1,250,000 |
|
— |
|
— |
|
— |
|
(1,000,000 |
)5 |
|
— |
|
— |
|
250,000 |
|
— |
||||||||||||
|
$ |
791,805,212 |
$ |
— |
$ |
(3,401,166 |
) |
$ |
36,810,454 |
$ |
(29,956,682 |
) |
$ |
(4,489,982 |
) |
$ |
122,067,151 |
$ |
912,834,986 |
$ |
132,001,651 |
|||||||||||
____________
1 Amounts include $4,999,989 in common stock in private companies converted from $4,999,989 in preferred stock in private companies.
2 Amounts include $1,396,978 in common stock in private companies converted to $1,396,978 in units of private companies.
3 Amounts include $6,023,650 in preferred stock in private companies converted from $6,023,650 in convertible notes of private companies.
4 Amounts include $6,150,000 in preferred stock in private companies converted from $6,150,000 in special purpose vehicles/private funds.
5 Amounts include $1,000,000 in preferred stock in private companies converted from $1,000,000 in simple agreement for future equity of private companies.
6 Amounts include $1,213,878 in preferred stock in private companies converted to $1,213,878 in units of private companies.
7 Amounts include $953,836 in accrued interest on the convertible notes of private companies.
8 Amounts include $204,326 in accrued interest on the convertible notes of private companies.
30
|
THE PRIVATE SHARES FUND |
|
Notes to the Financial Statements (Continued) December 31, 2024 |
|
3. Fair value measurements — (continued) |
The following is a summary of quantitative information about significant unobservable valuation inputs for Level 3 Fair Value Measurements for investments held as of December 31, 2024:
|
Type of Level 3 |
Fair Value as of |
Valuation |
Unobservable |
Range (Wt. Avg.) |
|||||
|
|
|||||||||
|
Common stock in private companies |
$ |
419,668,594 |
Precedent Transactions |
Precedent Transactions |
N/A |
||||
|
|
Market Comparable Companies |
Enterprise Value/Revenue Multiples |
0.59 - 14.30 (6.38) |
||||||
|
|
Market Movement |
-78.89% - 32.55% (-27.23%) |
|||||||
|
|
Discounts For Lack of Marketability |
18.20% - 21.02% (20.21%) |
|||||||
|
Preferred stock in private companies |
|
453,236,115 |
Precedent Transactions |
Precedent Transactions |
N/A |
||||
|
|
Market Comparable Companies |
Enterprise Value/Revenue Multiples |
0.59 - 17.12 (6.69) |
||||||
|
|
Market Movement |
-78.84% - 32.55% (-18.87%) |
|||||||
|
|
Discounts For Lack of Marketability |
9.87% - 21.02% (11.21%) |
|||||||
|
Convertible notes of private companies |
|
38,120,050 |
Precedent Transactions |
Precedent Transactions |
N/A |
||||
|
|
Option Pricing Model |
Industry Volatility |
70.00% - 75.00% (74.28%) |
||||||
|
|
Estimated Time to Exit |
0.29 - 3.79 (1.67) Years |
|||||||
|
|
Risk-Free Interest Rate |
4.24% - 4.27% (4.27%) |
|||||||
|
Units of private companies |
|
193,857 |
Precedent Transactions |
Precedent Transactions |
N/A |
||||
|
Warrants of private companies |
|
1,366,370 |
Option Pricing Model |
Industry Volatility |
36.56% - 49.51% (39.01%) |
||||
|
|
Estimated Time to Exit |
0.50 - 7.24 (5.70) Years |
|||||||
|
|
Risk-Free Interest Rate |
4.12% - 5.02% (4.28%) |
|||||||
|
Simple agreement for future equity of private companies |
|
250,000 |
Precedent Transactions |
Precedent Transactions |
N/A |
||||
____________
* Market approach
** Changes in the significant unobservable inputs used to determine an investment's value can significantly affect its fair value. Generally, an increase in these inputs will lead to a higher fair value, except for changes in the discount for lack of marketability, which have the opposite effect on fair value.
4. Expense limitation agreement
The Investment Adviser has contractually agreed to waive management fees and/or reimburse the Fund for expenses the Fund incurs, but only to the extent necessary to maintain the Fund’s total annual operating expenses after fee waivers and/or reimbursement (exclusive of any taxes, interest expense, commitment fees, legal fees or other expenses related to any borrowing or leverage incurred by the Fund, brokerage commissions, acquired fund fees and expenses, and extraordinary expenses, such as litigation or reorganization costs, but inclusive of organizational costs and offering costs) to an annual rate of 2.65%, 2.40%, and 2.90% (each, an “Expense Limit”) of the average daily net assets of the Fund (the “Expense Limitation Agreement”) attributable to Class A, Class I and Class L Shares, respectively, until May 2, 2026. Prior to May 1, 2023, the Expense Limit was 2.50%, 2.25% and 2.75% of the average daily net assets of the Fund attributable to Class A, Class I and Class L shares, respectively.
31
|
THE PRIVATE SHARES FUND |
|
Notes to the Financial Statements (Continued) December 31, 2024 |
|
4. Expense limitation agreement — (continued) |
Under the Expense Limitation Agreement, the Investment Adviser is permitted to seek reimbursement for any fees previously waived and/or expenses previously assumed, to the extent that such reimbursement will not cause Class A, Class I or Class L Shares’ annualized expenses to exceed the lesser of the current Expense Limitation or the Expense Limitation in place at the time of the waiver and/or assumption of expenses. The Fund is not obligated to reimburse the Investment Adviser for fees previously waived or expenses previously assumed by the Investment Adviser more than three years after the date of such waiver or expense reimbursement. For the years ended December 31, 2022, December 31, 2023, and December 31, 2024 the Investment Adviser waived investment advisory fees and/or reimbursed expenses in the amount of $441,827, $390,590, and $572,088, respectively. For the year ended December 31, 2022, Class A and Class L had recognized net recoupment of $184,461 and $5,663, respectively, and Class I had recognized a net waiver/reimbursement of $631,951. For the year ended December 31, 2023, Class A and Class L had recognized net recoupment of $199,187 and $4,383, respectively, and Class I had recognized a net waiver/reimbursement of $594,159. For the year ended December 31, 2024, Class A and Class L had recognized net recoupment of $144,908 and $2,358, respectively, and Class I had recognized a net waiver/reimbursement of $719,354. The remaining unrecouped amounts of $441,827, $390,590, and $572,088, are subject to possible recoupment by the Investment Adviser through December 31, 2025, December 31, 2026, and December 31, 2027, respectively.
5. Investment advisory agreement
The Fund has entered into an Investment Advisory Agreement with the Investment Adviser, pursuant to which the Investment Adviser provides general investment advisory services for the Fund. For providing these services, the Investment Adviser receives a fee from the Fund, accrued daily and paid monthly in arrears, at an annual rate equal to 1.90% of the Fund’s average daily net assets. For the year ended December 31, 2024, the Fund incurred $17,858,079 in investment advisory fees, of which $1,525,102 is payable at December 31, 2024.
Certain Officers of the Fund are also employees of the Investment Adviser. None of the Fund Officers who are affiliated with the Investment Adviser receives any compensation from the Fund.
6. Capital share transactions
The Fund is offering an unlimited number of shares on a continuous basis at NAV. The value per share of the relevant class is calculated after receipt of the purchase, in good order, plus any applicable sales load.
As of December 31, 2024, ownership from affiliated parties represents 0.02% of the Fund.
The Fund’s shares are not redeemable each business day, are not listed for trading on an exchange, and no secondary market currently exists for Fund shares. As an interval fund and as described in the Fund’s prospectus, the Fund will make quarterly repurchase offers of 5% of the total number of shares outstanding at its NAV, unless postponed in accordance with regulatory requirements, and each repurchase pricing shall occur no later than the 14th day after the repurchase request deadline, or the next business day if the 14th day is not a business day. Rule 23c-3 of the 1940 Act permits repurchases between 5% and 25% of the Fund’s outstanding shares at NAV.
32
|
THE PRIVATE SHARES FUND |
|
Notes to the Financial Statements (Continued) December 31, 2024 |
|
6. Capital share transactions — (continued) |
In every full quarter since the commencement of operations, the Fund has offered shareholders the opportunity to participate in this program. During the year ended December 31, 2024, the Fund had Repurchase Offers as follows:
|
Repurchase Offer |
Repurchase Request |
Repurchase Pricing |
Repurchase Offer |
% of Shares |
Number of Shares |
|||||
|
February 27, 2024 |
March 22, 2024 |
March 22, 2024 |
5% |
5% |
1,258,013 |
|||||
|
May 28, 2024 |
June 21, 2024 |
June 21, 2024 |
5% |
5% |
1,209,437 |
|||||
|
August 27, 2024 |
September 20,2024 |
September 20,2024 |
5% |
5% |
1,188,959 |
|||||
|
November 26, 2024 |
December 20, 2024 |
December 20, 2024 |
5% |
5% |
1,256,258 |
7. Purchases and sales of securities
Purchases and sales of securities for the year ended December 31, 2024, were $10,923,442 and $7,079,081, respectively.
8. Federal tax information
At December 31, 2024, gross unrealized appreciation and depreciation of investments based on cost for federal income tax purposes were as follows:
|
Cost of investments |
$ |
764,689,372 |
|
|
|
Gross unrealized appreciation |
$ |
300,633,685 |
|
|
|
Gross unrealized depreciation |
|
(95,182,449 |
) |
|
|
Net unrealized appreciation on investments |
$ |
205,451,236 |
|
GAAP requires that certain components of net assets be reclassified between financial and tax reporting. These reclassifications have no effect on net assets or net asset value per share. For the year ended December 31, 2024, permanent differences in book and tax accounting have been reclassified to paid-in capital and total distributable income/(loss) as follows:
|
Increase (Decrease) |
||||||
|
Paid in Capital |
Total Distributable Income/(Loss) |
|||||
|
$(14,276,872) |
$14,276,872 |
|||||
As of December 31, 2024, the components of accumulated earnings on a tax basis were as follows:
|
Undistributed ordinary income |
$ |
— |
|
|
|
Undistributed long-term capital gains |
|
— |
|
|
|
Tax accumulated earnings |
|
— |
|
|
|
Accumulated capital and other losses |
|
(17,414,288 |
) |
|
|
Net unrealized gain |
|
205,451,236 |
|
|
|
Payable for withholding attributed to profit sharing agreement |
|
(44,493 |
) |
|
|
Total accumulated earnings |
$ |
187,992,455 |
|
The tax character of distributions paid during the fiscal years ended, December 31, 2024 and December 31, 2023 were as follows:
|
2024 |
2023 |
|||||
|
|
|
|||||
|
Distributions Paid from: |
|
|
||||
|
Ordinary income |
$ |
— |
$ |
— |
||
|
Net Long Term Capital Gains |
|
— |
|
— |
||
|
Total Taxable Distributions Paid |
$ |
— |
$ |
— |
||
33
|
THE PRIVATE SHARES FUND |
|
Notes to the Financial Statements (Continued) December 31, 2024 |
|
8. Federal tax information — (continued) |
The fund had a net capital loss carryforward of:
|
Short-term Non-Expiring |
$ |
469 |
|
|
Long-term Non-Expiring |
|
17,413,819 |
|
|
$ |
17,414,288 |
To the extent that a fund may realize future net capital gains, those gains will be offset by any of its unused capital loss carryforward. Future capital loss carryover utilization in any given year may be subject to Internal Revenue Code limitations.
9. Commitments and contingencies
In the normal course of business, the Fund will enter into contracts that contain a variety of representations, provide general indemnifications, set forth termination provisions and compel the contracting parties to arbitration in the event of dispute. From time to time, the Fund may be a party to arbitration, or legal proceedings, in the ordinary course of business, including proceedings relating to the enforcement of provisions of such contracts. The Fund’s maximum exposure under these arrangements is unknown, as this would involve future claims that may be made against the Fund that would be subject to arbitration, generally.
In the normal course of business, the Fund may enter into agreements to purchase and sell investments. Such agreements are subject to certain rights of the issuers and ultimately, issuer approval. At December 31, 2024, the Fund had not entered into any agreements to purchase or sell existing equity securities.
At December 31, 2024, the Fund reasonably believes its assets will provide adequate coverage to satisfy all its unfunded commitments. The Fund’s policies and procedures prohibit it from entering into an unfunded commitment unless it has reserved enough cash and/or short-term investments to meet the funding requirements thereof. At December 31, 2024, the Fund had total unfunded capital commitments of $1,050,000 for investments in special purpose vehicles/private funds.
10. Offering price per share
A maximum front-end sales load of 5.75% for Class A shares and 4.25% for Class L is imposed on purchases. Class I shares are not subject to sales charge. For the year ended December 31, 2024, various broker dealers received $155,422 of sales charges from sales of the Fund’s shares.
11. Recent market and economic developments
Social, political, economic and other conditions and events (such as natural disasters, epidemics and pandemics, terrorism, conflicts and social unrest) that occur from time to time will create uncertainty and may have significant impacts on issuers, industries, governments and other systems, including the financial markets, to which the Fund and the issuers in which it invests are exposed. As global systems, economies and financial markets are increasingly interconnected, events that once had only local impact are now more likely to have regional or even global effects. Events that occur in one country, region or financial market will, more frequently, adversely impact issuers in other countries, regions or markets, including in established markets such as the United States. These impacts can be exacerbated by failures of governments and societies to adequately respond to an emerging event or threat.
Recent examples of the above include conflict, loss of life and disaster connected to ongoing armed conflict between Russia and Ukraine in Europe and Hamas and Israel in the Middle East. Russia’s invasion of Ukraine in February 2022, the resulting responses by the United States and other countries, and the potential for wider conflict, have increased and may continue to increase volatility and uncertainty in financial markets worldwide. The United States and other countries have imposed broad-ranging economic sanctions on Russia and Russian entities and individuals, and may impose additional sanctions, including on other countries that provide military or economic support to Russia. These sanctions, among other things, restrict companies from doing business with Russia and Russian issuers, and may adversely affect companies with economic or
34
|
THE PRIVATE SHARES FUND |
|
Notes to the Financial Statements (Continued) December 31, 2024 |
|
11. Recent market and economic developments — (continued) |
financial exposure to Russia and Russian issuers. The extent and duration of Russia’s military actions and the repercussions of such actions are not known. The invasion may widen beyond Ukraine and may escalate, including through retaliatory actions and cyberattacks by Russia and even other countries. Additionally, the ongoing armed conflict between Israel and Hamas and other militant groups in the Middle East and related events may cause significant market disruptions and volatility. These events may adversely affect regional and global economies including those of Europe and the United States. Certain industries and markets, such as those involving oil, natural gas and other commodities, as well as global supply chains, may be particularly adversely affected. Whether or not the Fund invests in securities of issuers located in Russia, Ukraine, Israel and adjacent countries or with significant exposure to issuers in these countries, these events could negatively affect the value and liquidity of the Fund’s investments.
U.S. and global markets recently have experienced increased volatility, including as a result of the recent failures of certain U.S. and non-U.S. banks, which could be harmful to the Fund and companies in which it invests. For example, if a bank in which the Fund or company has an account fails, any cash or other assets in bank accounts may be temporarily inaccessible or permanently lost by the Fund or company. If a bank that provides a subscription line credit facility, asset-based facility, other credit facility and/or other services to a company fails, the company could be unable to draw funds under its credit facilities or obtain replacement credit facilities or other services from other lending institutions with similar terms. Even if banks used by companies in which the Fund invests remain solvent, continued volatility in the banking sector could cause or intensify an economic recession, increase the costs of banking services or result in the companies being unable to obtain or refinance indebtedness at all or on as favorable terms as could otherwise have been obtained. Conditions in the banking sector are evolving, and the scope of any potential impacts to the Fund and companies, both from market conditions and also potential legislative or regulatory responses, are uncertain. Continued market volatility and uncertainty and/or a downturn in market and economic and financial conditions, as a result of developments in the banking industry or otherwise (including as a result of delayed access to cash or credit facilities), could have an adverse impact on the Fund and companies in which it invests.
12. Subsequent events
In preparing these financial statements, management has evaluated subsequent events through the date of issuance of the financial statements included herein and has determined that there are no subsequent events that require disclosure or adjustment to the financial statements.
35

To the Shareholders and Board of Trustees
The Private Shares Fund:
Opinion on the Financial Statements
We have audited the accompanying statement of assets and liabilities of The Private Shares Fund (the Fund), including the schedule of investments, as of December 31, 2024, the related statements of operations and cash flows for the year then ended, the statements of changes in net assets for each of the years in the two-year period then ended, and the related notes (collectively, the financial statements) and the financial highlights for each of the years in the five-year period then ended. In our opinion, the financial statements and financial highlights present fairly, in all material respects, the financial position of the Fund as of December 31, 2024, the results of its operations and its cash flows for the year then ended, the changes in its net assets for each of the years in the two-year period then ended, and the financial highlights for each of the years in the five-year period then ended, in conformity with U.S. generally accepted accounting principles.
Basis for Opinion
These financial statements and financial highlights are the responsibility of the Fund's management. Our responsibility is to express an opinion on these financial statements and financial highlights based on our audits. We are a public accounting firm registered with the Public Company Accounting Oversight Board (United States) (PCAOB) and are required to be independent with respect to the Fund in accordance with the U.S. federal securities laws and the applicable rules and regulations of the Securities and Exchange Commission and the PCAOB.
We conducted our audits in accordance with the standards of the PCAOB. Those standards require that we plan and perform the audit to obtain reasonable assurance about whether the financial statements and financial highlights are free of material misstatement, whether due to error or fraud. Our audits included performing procedures to assess the risks of material misstatement of the financial statements and financial highlights, whether due to error or fraud, and performing procedures that respond to those risks. Such procedures included examining, on a test basis, evidence regarding the amounts and disclosures in the financial statements and financial highlights. Such procedures also included confirmation of securities owned as of December 31, 2024, by correspondence with custodians and issuers of securities; when replies were not received from the issuers, we performed other auditing procedures. Our audits also included evaluating the accounting principles used and significant estimates made by management, as well as evaluating the overall presentation of the financial statements and financial highlights. We believe that our audits provide a reasonable basis for our opinion.

We have served as the Fund’s auditor since 2013.
Chicago, Illinois
February 28, 2025
36
The Board of Trustees of the Fund has overall responsibility for monitoring the Fund’s investment program and its management and operations. The names of the Trustees and Officers of the Fund, their addresses, ages and principal occupations during the past five years are provided in the tables below. Trustees who are deemed “interested persons,” as defined in the 1940 Act, are included in the table titled “Interested Trustee.” Trustees who are not “interested persons” are referred to as “Independent Trustees.” The Fund’s Statement of Additional Information includes additional information about the Fund’s Trustees and is available, without charge and upon request, by calling 1-855-551-5510.
|
Name, Address(1) |
Position(s) |
Term of |
Principal Occupation(s) |
Number of |
Other |
|||||
|
INDEPENDENT TRUSTEES: |
||||||||||
|
Robert Boulware Birth Year: 1956 |
Independent Trustee |
Since |
Professional board director and trustee. Managing Director, Pilgrim Funds, LLC (private equity firm); Mid-Con Energy Partners, LP (oil/natural gas company) (June 2020 – January 2021) |
1 |
Brighthouse Financial |
|||||
|
Mark Radcliffe Birth Year: 1952 |
Independent Trustee |
Since |
CEO, Personal Engines, LLC (business consulting) (September 1, 2023 – present); Partner, DLA Piper (2005 – 2022); Senior Counsel DLA Piper (December 29, 2022 – August 31, 2023) (law firm) |
1 |
None |
|||||
|
Daniel A. Doyle Birth Year: 1958 |
Independent Trustee |
Since |
Senior Vice President & Chief Financial Officer, Puget Sound Energy (public utility) (2011 – 2021); Independent Trustee, Chair of the Audit Committee, MetLife Investor Series Trust (2007 – 2013) (mutual funds) |
1 |
None |
|||||
|
Herb W. Morgan Birth Year: 1966 |
Independent Trustee |
Since |
Founder, Chief Executive and Investment Officer, Efficient Market Advisors/Cantor Managed ETF Portfolios (2004-present) (investment advisor) |
1 |
Broad Street Holdings, Inc. (Holding Company) |
|||||
|
INTERESTED TRUSTEE: |
||||||||||
|
Timothy Reick Birth Year: 1974 |
Interested Trustee |
Since |
CEO, Liberty Street Advisors, Inc., HRC Fund Associates, LLC |
1 |
None |
|||||
|
OFFICERS: |
||||||||||
|
Kevin Moss Birth Year: 1969 |
President |
Since |
Managing Director of Liberty Street Advisors, Inc. since December 2020; Prior thereto, President and Chief Operating Officer of SP Investments Management LLC through December 2020. |
N/A |
None |
|||||
37
|
THE PRIVATE SHARES FUND |
|
Trustees and Officers (Continued) December 31, 2024 (Unaudited) |
|
Name, Address(1) |
Position(s) |
Term of |
Principal Occupation(s) |
Number of |
Other |
|||||
|
Jack Sweeney Birth Year: 1985 |
Treasurer and Chief Financial Officer |
Since |
Vice President of Liberty Street Advisors since December 2020; Chief Financial Officer at SP Investments Management LLC, March 2019 through December 2020; Finance Manager at Venrock, August 2016 to March 2019 and Senior Associate at Ernst &Young LLP, prior thereto. |
N/A |
None |
|||||
|
Peter Guarino Birth Year: 1958 |
Chief Compliance Officer |
Since |
President and Chief Compliance Officer, Compliance4 LLC (independent compliance consultancy) November 2008 to the present. |
N/A |
None |
(1) All addresses c/o The Private Shares Fund, 88 Pine Street, Floor 31, Suite 3101, New York, NY 10005.
(2) Each Trustee will serve for the duration of the Fund, or until death, resignation, termination, removal or retirement.
38
Proxy voting — A description of the policies and procedures that the Fund uses to determine how to vote proxies relating to portfolio securities and information regarding how the Fund voted proxies during the 12-month period ended June 30 are available without charge upon request by (1) calling the Fund at 1-855-551-5510 and (2) from Fund documents filed with the Securities and Exchange Commission (“SEC”) on the SEC’s website at www.sec.gov.
Portfolio holdings — The Fund files its complete schedule of portfolio holdings with the SEC for the first and third quarters of each fiscal year on form N-PORT-P. The Fund’s Form N-PORT-P is available on the SEC’s website at www.sec.gov. You may also obtain copies by calling the Fund at 1-855-551-5510.
Consideration for renewal of the Investment Advisory agreement — At the meeting of the Board of Trustees held on November 19, 2024 (the “Meeting”), the Board of Trustees of the Fund (including the Trustees who are not “interested” within the meaning of Section 2(a)(19) of the Investment Company Act of 1940 (the “Independent Trustees,” voting separately)) renewed the Investment Advisory Agreement (the “Advisory Agreement”) with Liberty Street Advisors, Inc. (the “Adviser”).
In the course of their consideration of the Advisory Agreement, the Independent Trustees had met on November 8, 2024 (the “Pre-Meeting”) with members of the Adviser and then in executive session and were advised throughout the process by their independent counsel. The Independent Trustees evaluated the terms of the Advisory Agreement and reviewed with counsel their duties and responsibilities in evaluating and approving the continuation of the Advisory Agreement. In considering the Advisory Agreement, the Board reviewed the materials provided to it by the Adviser, as supplemented based on requests of the Independent Trustees following the Pre-Meeting and by information provided orally at the Meeting. As part of its evaluation, the Board, including the Independent Trustees, considered, among others, the following factors: (1) the nature, extent, and quality of the services to be provided by the Adviser; (2) the investment performance of the Fund; (3) the costs of the services to be provided and profits to be realized by the Adviser and their affiliates from the relationship with the Fund; (4) the extent to which economies of scale would be realized as the Fund grows; and (5) any other benefits received by the Adviser serving the Fund. The Independent Trustees considered the Adviser’s written response, as supplemented by the Adviser’s additional oral responses at the meeting, and determined that the content of the Adviser’s responses satisfied their requests for information to support their decision to consider and approve the Advisory Agreement.
The Board, including the Independent Trustees, concluded that the Advisory Agreement should enable the Fund to obtain high quality services at a cost that is appropriate, reasonable, and in the interests of investors. They concluded that the prudent exercise of judgment warranted the approval of the continuation of the Advisory Agreement. It also was noted that the Board’s decision to approve the Advisory Agreement was not based on any single factor, but rather was based on a comprehensive consideration of all the information provided to the Board. Upon consideration of these and other factors, the Board, including the Independent Trustees, also determined:
The nature, extent and quality of the advisory services to be provided. The Board considered: the background and experience of key investment personnel and the Adviser’s ability to retain them; overall Adviser personnel; the Adviser’s focus on analysis of a complex asset category; the Adviser’s disciplined investment process; the Adviser’s investment in and commitment to personnel; the Adviser’s internal compliance efforts and the Adviser’s risk and general oversight; and the Adviser’s oversight of and interaction with service providers. The Board concluded that the nature, extent and quality of the management and advisory service to be provided are appropriate and thus support a decision to approve the Advisory Agreement.
The investment performance of the Fund. The Board evaluated the historical performance of the Fund and comparative information provided regarding the Fund’s investment performance and information on the performance of other investment funds and various indices. The Board also considered the various performance reports received throughout the year, as well as a peer report from an independent third party. The Board noted the limitations of comparisons to other registered funds in light of the Fund’s relatively unique portfolio and strategy in the registered fund context and the limitations inherent in peer analysis under such circumstances. The Board noted that the utility of third-party reports may increase in the future, especially as peers develop longer track records. On the basis of the Board’s assessment, the Board concluded that the Adviser was capable of generating a level of long-term investment performance that is consistent with the Fund’s investment objective, policies and strategies.
39
|
THE PRIVATE SHARES FUND |
|
Additional Information (Continued) December 31, 2024 |
The cost of advisory service to be provided and profits to be realized by the Adviser. In analyzing the cost of services and profitability of the Adviser, the Board considered the revenues and expenses of the Adviser and the Fund’s size. The Board took into account the entrepreneurial investment by and continuing cost to the Adviser regarding investment management infrastructure to support the Fund and other support for Fund investors. In addition, the Board recognized the subjective nature of determining profitability and recognized the difficulties in making comparisons, as the profitability of similar advisers generally is not publicly available and the profitability information that is available for certain advisers or management firms may not be representative of the industry and may be affected by, among other considerations, the Adviser’s particular business mix, capital costs, types of funds managed and expense allocations. On the basis of the Board’s review of the fees charged by the Adviser for investment advisory and related services (including to their other clients), the specialized nature of the Fund’s investment program, the Adviser’s financial information, and the costs associated with managing the Fund, the Board concluded that the investment management fee and the Adviser’s profitability are reasonable in light of the services provided and the management fees and overall expense ratios of comparable funds and other clients of the Adviser.
The extent to which economies of scale would be realized as the Fund grows and whether fee levels reflect these economies of scale. The Board noted the expense limitation agreements put in place by the Adviser, under which the Adviser continues to pay a portion of the Fund’s expenses, and concluded that the Fund’s management fee is reasonable and fair under the current circumstances. The Board noted that it will periodically re-examine whether the Fund has achieved economies of scale, as well as the appropriateness of management fees payable to the Adviser.
Benefits to the Adviser from its relationship with the Fund. The Board considered the other benefits derived by the Adviser from its relationship with the Fund, to the extent such benefits are identifiable and/or determinable. The Board reviewed the potential for other “fall-out” benefits to the Adviser, including reputational benefits and the potential for growth of the Adviser’s other business lines through association with the Fund, and concluded that such benefits are reasonable and typical of those potentially received by managers of publicly offered funds. The Board also noted that the Adviser does not receive soft dollars. Thus, the Board concluded that other benefits derived by the Adviser from its relationship with the Fund, to the extent such benefits are identifiable or determinable, are reasonable and fair, result from the provision of appropriate services to the Fund and investors therein and are consistent with industry practice and the best interests of the Fund and its shareholders.
Other considerations. The Board determined that the Adviser has made and continues to make a substantial commitment to managing the Fund’s assets and monitoring compliance and the provision of services. The Board also noted that the Adviser maintains the financial and operational resources reasonably necessary to manage the Fund in a professional manner that is consistent with the best interests of the Fund and its shareholders.
40
![]()
Board of Trustees
Robert Boulware
Mark Radcliffe
Daniel A. Doyle
Herb W. Morgan
Timothy Reick
Investment Adviser
Liberty Street Advisors, Inc.
88 Pine Street, 31st Floor, Suite 3101
New York, NY 10005
Dividend Paying Agent, Transfer Agent
UMB Fund Services
235 West Galena Street
Milwaukee, WI 53212
Custodian
UMB Bank National Association
1010 Grand Boulevard
Kansas City, MO 64106
Distributor
Foreside Fund Services, LLC
Three Canal Plaza, Suite 100
Portland, ME 04101
Independent Auditors
KPMG LLP
550 South Hope Street, Suite 1500
Los Angeles, CA 90071
This report has been prepared for the general information of the shareholders. It is not authorized for distribution to prospective investors unless preceded or accompanied by a current prospectus. The Fund’s prospectus contains more complete information about the objectives, policies, expenses and risks of the Funds. The Fund is not a bank deposit, not FDIC insured and may lose value. Please read the prospectus carefully before investing or sending money.
This report contains certain forward looking statements which are subject to known and unknown risks and uncertainties that could cause actual results to differ materially from those expressed or implied by such statements. Forward looking statements generally include words such as ‘‘believes’’, ‘‘expects’’, ‘‘anticipates’’ and other words of similar import. Such risks and uncertainties include, among other things, the Risk Factors noted in the Fund’s filings with the Securities and Exchange Commission. The Fund undertakes no obligation to update any forward looking statement.
(b) There were no notices transmitted to stockholders in reliance on Rule 30e-3 under the Investment Company Act of 1940, as amended, that contained disclosures specified by paragraph (c)(3) of that rule.
Item 2. Code of Ethics.
The Registrant has a code of ethics (the “Code”) that applies to the Registrant’s principal executive officer and principal financial officer. During the period covered by this report, there were no material amendments to the provisions of the Code, nor were there any implicit or explicit waivers to the provisions of the Code. The Code is filed herewith.
Item 3. Audit Committee Financial Expert.
3(a)(1) The Board of Trustees of the Registrant (the “Board”) has determined that the Registrant has at least one Board member serving on the Audit Committee that possesses the attributes identified in Instruction 2(b) of Item 3 to Form N-CSR to qualify as an “audit committee financial expert.”
3(a)(2) Daniel Doyle is the Registrant’s audit committee financial expert and is “independent” for purposes of Item 3(a)(2) to Form N-CSR.
Item 4. Principal Accountant Fees and Services.
The aggregate fees for professional services by KPMG LLP during the fiscal year 2024 and 2023 were as follows:
(a) Audit Fees.
| Fiscal year ended December 31, 2024: | $ | 1,100,000 | ||
| Fiscal year ended December 31, 2023: | $ | 622,500 |
(b) Audit-Related Fees.
| Fiscal year ended December 31, 2024: | $ | 0.00 | ||
| Fiscal year ended December 31, 2023: | $ | 137,600 |
(c) Tax Fees. These are fees billed for professional services rendered by the Registrant’s independent auditors for tax compliance, tax advice, and tax planning.
| Fiscal year ended December 31, 2024: | $ | 23,900 | ||
| Fiscal year ended December 31, 2023: | $ | 25,800 |
(d) All Other Fees.
| Fiscal year ended December 31, 2024: | $ | 0.00 | ||
| Fiscal year ended December 31, 2023: | $ | 0.00 |
(e) Audit Committee’s pre-approval policies and procedures.
| (1) | The Audit Committee has adopted pre-approval policies and procedures that require the Audit Committee to pre-approve all audit and non-audit services of the Registrant, including services provided to the Registrant’s investment adviser or any entity controlling, controlled by or under common control with the Registrant’s investment adviser that provides ongoing services to the Registrant with respect to any engagement that directly relates to the operations and financial reporting of the Registrant. | |
| (2) | Services approved pursuant to paragraph (c)(7)(i)(C) of Rule 2-01 of Regulation S-X: 100% of these fees were approved by the Audit Committee as required pursuant to paragraph (c)(7)(ii) of Rule 2-01 of Regulation S-X. |
(f) None.
(g) During the last two fiscal years, there were no other non-audit services rendered by the Registrant’s independent auditors to the Registrant, its investment adviser or any entity controlling, controlled by or under the common control with the investment adviser that provides ongoing services to the Registrant.
(h) Not applicable.
(i) Not applicable.
(j) Not applicable.
Item 5. Audit Committee of Listed Registrants.
Not applicable.
Item 6. Schedule of Investments.
(a) Included as part of the report to shareholders filed under Item 1 of this Form N-CSR.
(b) Not applicable
Item 7. Financial Statements and Financial Highlights for Open-End Management Investment Companies.
Not applicable.
Item 8. Changes in and Disagreements with Accountants for Open-End Management Investment Companies.
Not applicable.
Item 9. Proxy Disclosures for Open-End Management Investment Companies.
Not applicable.
Item 10. Remuneration Paid to Directors, Officers, and Others of Open-End Management Investment Companies.
Not applicable.
Item 11. Statement Regarding Basis for Approval of Investment Advisory Contract.
Included as part of the report to shareholders filed under Item 1 of this Form N-CSR.
Item 12. Disclosure of Proxy Voting Policies and Procedures for Closed-End Management Investment Companies.
The Board of Trustees of the Registrant has adopted the Proxy Voting Policy of Liberty Street Advisors, Inc (“Liberty”), the Registrant’s investment adviser, as the Registrant’s Proxy Voting Procedures. Subject to the oversight of the Registrant’s Board of Trustees, the Registrant has delegated responsibility to the Adviser to vote any proxies the Registrant may receive. The Adviser’s general policy is to vote proxy proposals, amendments, consents or resolutions relating to the Registrant in a manner that serves the best interests of the Registrant.
Adviser’s Proxy Voting Policy
Liberty, as a matter of policy and as a fiduciary to its clients that are registered management investment companies (“Clients”), permits Clients to delegate proxy voting authority to Liberty, consistent with the best economic interests of the Clients. All Client proxies are voted in accordance with the Adviser’s Proxy Voting Guidelines, as described below.
As part of its fiduciary duties to the Registrant, Liberty will vote proxies. With respect to each proxy proposal, Liberty will consider the period of time that the particular security is expected to be held for an account, the size of the holding, the costs involved with the proxy proposal, the existing corporate governance structure, and the current management and operations for the particular company. Typically, Liberty will vote proxies in accordance with management’s recommendations. However, in situations where Liberty believes that management is acting on its own behalf or acting in a manner that is adverse to the rights of the company’s shareholders, Liberty will not vote with management.
For each proxy, Liberty also considers whether there are any specific facts and circumstances that may give rise to a material conflict of interest on the part of Liberty in voting the proxy. If it is determined that a material conflict of interest may exist, the proxy will be referred to Liberty’s Investment Committee to decide if Liberty may vote the proxy or if the proxy should be referred to the Registrant to vote. All instances where Liberty determines a material conflict of interest may exist are resolved in the best interests of the Registrant. Liberty retains final authority and fiduciary responsibility for proxy voting.
Item 13. Portfolio Managers of Closed-End Management Investment Companies.
(a)(1) Identification of Portfolio Manager(s) and Description of Role of Portfolio Manager(s).
As of December 31, 2024, the portfolio management team of the Registrant was comprised of Kevin Moss, Christian Munafo and Sven Jonas Grankvist (the “Portfolio Management Team”). The Portfolio Management Team was primarily responsible for the day-to-day portfolio management of the Registrant.
Mr. Moss is a Managing Director of Liberty Street Advisors, Inc. and serves as both a portfolio manager and member of the Liberty Investment Committee. Prior to joining Liberty, he was with SP Investments Management, LLC (“SPIM”), a registered investment adviser and wholly owned subsidiary of SharesPost, Inc. For eight years he served as SPIM’s President and COO overseeing the operations and trading of SPIM. He is also one of the creators of the SharesPost 100 Fund and continues to serve as the President of the Fund and is one of the portfolio managers. Prior to joining SPIM, Kevin was a senior portfolio manager at First New York Securities, where he managed a global macro book. With over 20 years of senior level experience in financial services, Kevin’s specific areas of expertise include the management of client relationships, investment research coverage, block and position trading, and operations management. Kevin began his career as an institutional equity sales trader working for Instinet, and later Commerzbank. His client base included hedge funds, pension funds and proprietary trading desks. Subsequently, Kevin held a series of distinguished posts at leading hedge funds and proprietary trading firms including serving as the head of international trading for Libra Advisors and Opus Trading Funds. Mr. Moss holds a Bachelor of Science from Tulane University and an MBA from Columbia University.
Mr. Munafo is the Chief Investment Officer of Liberty Street Advisors, Inc. and serves as both a portfolio manager and member of the Liberty Investment Committee. Prior to joining Liberty, he was Chief Investment Officer of SP Investments Management, LLC. Mr. Munafo joined SP Investments Management in August 2019, where he also served as one of the portfolio managers and members of the investment committee. Prior to his position with the Investment Adviser, Mr. Munafo was Co-Head of the Global Private Equity Secondary Practice at HQ Capital based in New York, where he was also a member of the senior leadership team. Prior to that, he served as Head of Secondaries at Thomas Weisel Partners. Mr. Munafo has over 25 years of experience in finance, with the last 20 years focused on secondary investments involving venture-backed and growth equity-oriented companies and funds. During this time, he has also served on the boards of many of these companies and funds. In aggregate, Mr. Munafo has helped raise more than $2 billion globally from institutional investors, corporations, pensions, endowments and family offices. In addition, Mr. Munafo has overseen the completion of more than 100 secondary transactions representing over $2 billion in capital commitments, ranging from traditional purchases of limited partnership interests to more complex non-traditional transactions including fund restructurings, recapitalizations, tender programs, preferred equity/loan facilities and purchases of company securities. Mr. Munafo began his career as an investment banker focused on mergers and acquisitions at Banc of America Securities. Mr. Munafo holds a Bachelor of Arts from Rutgers College in Economics and Finance.
Mr. Grankvist is a Managing Director at Liberty Street Advisors, Inc., where he serves as both a portfolio manager and a member of the Liberty Investment Committee. Prior to joining Liberty, he spent eight years at SP Investments Management, LLC, a registered investment adviser. He is a founding member of the SharesPost 100 Fund team and has played a key role in developing and overseeing daily valuation procedures. As a portfolio manager, he has led or co-led hundreds of primary and secondary direct transactions for over 60 leading growth-stage private companies, with responsibilities spanning due diligence, origination, negotiation, and deal execution. With 16 years of experience in financial services and investment management, Jonas has spent the past 12 years specializing in the investment and valuation of venture-backed and growth equity-oriented companies. He began his career as a technology investment banker at Berman Capital. Jonas holds an LL.M. from Uppsala University and an MBA, magna cum laude, from Golden Gate University.
(a)(2) Other Accounts Managed by Portfolio Manager(s) or Management Team Member and Potential Conflicts of Interest.
(i) As of December 31, 2024, Messrs. Moss, Munafo, and Grankvist were the portfolio managers for, and primarily responsible for the day-to-day portfolio management of, the Private Shares Opportunities Fund LLC (“Private Shares Opportunity Fund”) and the GAM LSA Private Shares (Cayman) Master Fund.
(ii) (A) Zero.
(B) Two (1), Private Shares Opportunity Fund. Total assets of Private Shares Opportunity Fund managed by Messrs. Moss, Munafo, and Grankvist as of December 31, 2024 were approximately $66,341,324. (2) GAM LSA Private Shares (Cayman) Master Fund. Total assets of GAM LSA Private Shares (Cayman) Master Fund managed by Messrs. Moss, Munafo, and Grankvist as of December 31, 2024 were approximately $85,499,929.
(C) Zero.
(iii) Two (2) accounts. As of December 31, 2024, $48,092,970 of the assets in the Private Shares Opportunity Fund were subject to performance fee. As of December 31, 2024, $0 of the assets in the GAM LSA Private Shares (Cayman) Master Fund were subject to performance fee.
(iv) A material conflict could arise in respect of the allocation of investment opportunities between the Registrant, the Private Shares Opportunity Fund, and the GAM LSA Private Shares (Cayman) Master Fund as all entities have a substantially similar investment strategy to invest in the equity securities of private companies. However, to address such potential conflict of interest, Liberty has adopted allocation policies and procedures designed to address such conflict. It is Liberty’s practice to allocate investments among the portfolios of clients managed by Liberty, (collectively, “Client accounts”) on a fair and equitable basis in a manner that is consistent with the investment objective(s) of the Client accounts. The policy prohibits any allocation of investments in a manner that Liberty’s proprietary accounts or affiliated accounts (“Affiliate accounts”), or any particular client(s) or group of clients receive more favorable treatment than other Client accounts. Liberty considers an Affiliate account to include accounts and funds in which Liberty, or any partner or officer of Liberty or any portfolio manager of the client funds (“Affiliate personnel”), directly or indirectly has a material ownership interest, or where Liberty Street or Affiliate personnel receive a management fee or participate in a performance fee or allocation as advisor, member, and/or portfolio manager to such account.
In general, the proposed allocation will be pro rata among eligible participating Client accounts that are not Affiliate accounts. Affiliate accounts will be allocated such securities only after all eligible participating Client accounts have received their allocation. Specific to the Registrant, Affiliate accounts, including the Private Shares Opportunity Fund, will be allocated such securities only after the Registrant has received its allocation. However, the proposed allocation will also take into consideration other relevant factors including, but not limited to, the size of each Client and Affiliate account’s proposed allocation, liquidity needs, cash flow, investment or regulatory restrictions and previous allocations. While Liberty will endeavor to allocate pro rata in the first instance based on the relative size of the participating Client account(s), Liberty may use other methods of allocation – provided that such methods are fair and equitable.
(a)(3) Compensation Structure of Portfolio Manager(s).
As of December 31, 2024, compensation for the Registrant’s Portfolio Management Team consists of base salary and bonus, which is in part dependent upon the overall performance of Liberty. The compensation is monitored to ensure competitiveness in the external marketplace.
(a)(4) Disclosure of Securities Ownership.
The following table sets forth the dollar range of equity securities beneficially owned by the Portfolio Management Team in the Registrant as of December 31, 2024:
| Portfolio Manager | Dollar Range of Registrant Shares Beneficially Owned |
| Kevin Moss | $10,000 - $50,000 |
| Christian Munafo | $10,000 - $50,000 |
| Sven Jonas Grankvist | $10,000 - $50,000 |
Item 14. Purchases of Equity Securities by Closed-End Management Investment Company and Affiliated Purchasers.
REGISTRANT PURCHASES OF EQUITY SECURITIES
| Class A | (a) Total Number of Shares (or Units) Purchased | (b) Average Price Paid per Share (of Unit) | (c) Total Number of Shares (or Units) Purchased as Part of Publicly Announced Plans or Programs | (d) Maximum Number (or Approximate Dollar Value) of Shares (or Units) that May Yet Be Purchased Under the Plans or Programs | ||||||||||||
| Period | ||||||||||||||||
| Jan. 1-31, 2024 | 0 | 0 | 0 | 0 | ||||||||||||
| Feb. 1-29, 2024 | 0 | 0 | 0 | 0 | ||||||||||||
| Mar. 1-31, 2024 | 257,389 | $ | 39.43 | 0 | 0 | |||||||||||
| Apr. 1-30, 2024 | 0 | 0 | 0 | 0 | ||||||||||||
| May 1-31, 2024 | 0 | 0 | 0 | 0 | ||||||||||||
| Jun. 1-30, 2024 | 176,875 | $ | 39.33 | 0 | 0 | |||||||||||
| Jul. 1-31, 2024 | 0 | 0 | 0 | 0 | ||||||||||||
| Aug. 1-31, 2024 | 0 | 0 | 0 | 0 | ||||||||||||
| Sep. 1-30, 2024 | 184,985 | $ | 39.51 | 0 | 0 | |||||||||||
| Oct. 1-31, 2024 | 0 | 0 | 0 | 0 | ||||||||||||
| Nov. 1-30, 2024 | 0 | 0 | 0 | 0 | ||||||||||||
| Dec. 1-31, 2024 | 241,514 | $ | 41.77 | 0 | 0 | |||||||||||
| Total | 860,763 | $ | 40.08 | 0 | 0 | |||||||||||
| Class I | (a) Total Number of Shares (or Units) Purchased | (b) Average Price Paid per Share (of Unit) | (c) Total Number of Shares (or Units) Purchased as Part of Publicly Announced Plans or Programs | (d) Maximum Number (or Approximate Dollar Value) of Shares (or Units) that May Yet Be Purchased Under the Plans or Programs | ||||||||||||
| Period | ||||||||||||||||
| Jan. 1-31, 2024 | 0 | 0 | 0 | 0 | ||||||||||||
| Feb. 1-29, 2024 | 0 | 0 | 0 | 0 | ||||||||||||
| Mar. 1-31, 2024 | 998,962 | $ | 40.09 | 0 | 0 | |||||||||||
| Apr. 1-30, 2024 | 0 | 0 | 0 | 0 | ||||||||||||
| May 1-31, 2024 | 0 | 0 | 0 | 0 | ||||||||||||
| Jun. 1-30, 2024 | 1,030,825 | $ | 40.02 | 0 | 0 | |||||||||||
| Jul. 1-31, 2024 | 0 | 0 | 0 | 0 | ||||||||||||
| Aug. 1-31, 2024 | 0 | 0 | 0 | 0 | ||||||||||||
| Sep. 1-30, 2024 | 1,001,678 | $ | 40.22 | 0 | 0 | |||||||||||
| Oct. 1-31, 2024 | 0 | 0 | 0 | 0 | ||||||||||||
| Nov. 1-30, 2024 | 0 | 0 | 0 | 0 | ||||||||||||
| Dec. 1-31, 2024 | 1,012,182 | $ | 42.55 | 0 | 0 | |||||||||||
| Total | 4,043,647 | $ | 40.72 | 0 | 0 | |||||||||||
| Class L | (a) Total Number of Shares (or Units) Purchased | (b) Average Price Paid per Share (of Unit) | (c) Total Number of Shares (or Units) Purchased as Part of Publicly Announced Plans or Programs | (d) Maximum Number (or Approximate Dollar Value) of Shares (or Units) that May Yet Be Purchased Under the Plans or Programs | ||||||||||||
| Period | ||||||||||||||||
| Jan. 1-31, 2024 | 0 | 0 | 0 | 0 | ||||||||||||
| Feb. 1-29, 2024 | 0 | 0 | 0 | 0 | ||||||||||||
| Mar. 1-31, 2024 | 1,662 | $ | 38.80 | 0 | 0 | |||||||||||
| Apr. 1-30, 2024 | 0 | 0 | 0 | 0 | ||||||||||||
| May 1-31, 2024 | 0 | 0 | 0 | 0 | ||||||||||||
| Jun. 1-30, 2024 | 1,737 | $ | 38.68 | 0 | 0 | |||||||||||
| Jul. 1-31, 2024 | 0 | 0 | 0 | 0 | ||||||||||||
| Aug. 1-31, 2024 | 0 | 0 | 0 | 0 | ||||||||||||
| Sep. 1-30, 2024 | 2,296 | $ | 38.83 | 0 | 0 | |||||||||||
| Oct. 1-31, 2024 | 0 | 0 | 0 | 0 | ||||||||||||
| Nov. 1-30, 2024 | 0 | 0 | 0 | 0 | ||||||||||||
| Dec. 1-31, 2024 | 2,562 | $ | 41.03 | 0 | 0 | |||||||||||
| Total | 8,257 | $ | 39.48 | 0 | 0 | |||||||||||
On February 27, 2024, May 28, 2024, August 27, 2024, and November 26, 2024, the Registrant offered to repurchase 1,258,013, 1,209,437, 1,188,959, and 1,256,258 shares, respectively, pursuant to its periodic repurchase plan.
Item 15. Submission of Matters to a Vote of Security Holders.
There have been no material changes to the procedures by which the shareholders may recommend nominees to the registrant’s board of directors, where those changes were implemented after the registrant last provided disclosure in response to the requirements of Item 407(c)(2)(iv) of Regulation S-K (17 CFR 229.407) (as required by Item 22(b)(15) of Schedule 14A (17 CFR 240.14a-101)), or this Item.
Item 16. Controls and Procedures.
| (a) | The Registrant’s Principal Executive Officer and Principal Financial Officer have reviewed the Registrant's disclosure controls and procedures (as defined in Rule 30a-3(c) under the Investment Company Act of 1940, as amended, (the “Act”)) as of a date within 90 days of the filing of this report, as required by Rule 30a-3(b) under the Act. Based on their review, such officers have concluded that the disclosure controls and procedures were effective in ensuring that information required to be disclosed in this report was appropriately recorded, processed, summarized and reported and made known to them by others within the Registrant and by the Registrant’s service providers. |
| (b) | There were no changes in the Registrant’s internal control over financial reporting (as defined in Rule 30a-3(d) under the Act (17 CFR 270.30a-3(d)) that occurred during the period covered by this report that materially affected, or were reasonably likely to materially affect, the Registrant’s internal control over financial reporting. |
Item 17. Disclosure of Securities Lending Activities for Closed-End Management Investment Companies
The Fund did not engage in securities lending activities.
Item 18. Recovery of Erroneously Awarded Compensation.
| (a) | Not applicable |
| (b) | Not applicable |
Item 19. Exhibits.
| (a) (1) | Code of Ethics. Filed herewith. |
| (a) (2) | Any policy required by the listing standards adopted pursuant to Rule 10D-1 under the Securities Exchange Act of 1934 by the registered national securities exchange or registered national securities association upon which the registrant’s securities are listed. Not applicable. |
| (a) (3) | Certifications required pursuant to Rule 30a-2(a) under the 1940 Act and Section 302 of the Sarbanes-Oxley Act of 2002. Filed herewith. |
| (a) (4) | Any written solicitation to purchase securities under Rule 23c-1 under the Act sent or given during the period covered by the report by or on behalf of the registrant to 10 or more persons. Not applicable. |
| (a) (5) | Change in the registrant’s independent public accountant. Not applicable. |
| (b) | Certification pursuant to Rule 30a-2(a) under the 1940 Act and Section 906 of the Sarbanes-Oxley Act of 2002. Filed herewith. |
SIGNATURES
Pursuant to the requirements of the Securities Exchange Act of 1934 and the Investment Company Act of 1940, the Registrant has duly caused this report to be signed on its behalf by the undersigned, thereunto duly authorized.
The Private Shares Fund
| By: | /s/ Kevin Moss | |
| President | ||
| March 7, 2025 |
Pursuant to the requirements of the Securities Exchange Act of 1934 and the Investment Company Act of 1940, this report has been signed below by the following persons on behalf of the Registrant and in the capacities and on the dates indicated.
| By: | /s/ Kevin Moss | |
| President | ||
| March 7, 2025 |
| By: | /s/ Jack Sweeney | |
| Principal Financial Officer | ||
| March 7, 2025 |