UNITED STATES
SECURITIES AND EXCHANGE COMMISSION
Washington, D.C. 20549
FORM N-CSR
CERTIFIED SHAREHOLDER REPORT OF REGISTERED MANAGEMENT INVESTMENT COMPANIES
Investment Company Act File Number 811-22759
The Private Shares Fund
(Exact name of registrant as specified in charter)
88 Pine Street, Suite 3101
New York, NY 10005
(Address of principal executive offices) (Zip code)
Cogency Global, Inc.
c/o The Private Shares Fund
850 New Burton Rd. Ste. 201
City of Dover, County of Kent, Delaware 19904
(Name and address of agent for service)
Copies to:
Dechert LLP
45 Fremont Street, 26th Floor
San Francisco, CA 94105
Registrant's telephone number, including area code: (646) 839-5548
Date of fiscal year end: December 31
Date of reporting period: June 30, 2025
Item 1. Reports to Stockholders.
(a) The following is a copy of the report transmitted to shareholders pursuant to Rule 30e-1 under the Investment Company Act of 1940, as amended.
|
THE PRIVATE SHARES FUND |
|
|
|
Table of Contents |
||
|
2 |
||
|
5 |
||
|
6 |
||
|
8 |
||
|
15 |
||
|
16 |
||
|
17 |
||
|
18 |
||
|
19 |
||
|
22 |
||
|
34 |
1
As of June 30, 2025, the Fund’s performance is as follows:
|
Total Return Information (Unaudited) |
||||||
|
The Private Shares Fund – Class A |
Ten |
Five |
Three |
One |
Annualized |
Cumulative |
|
Returns based on Purchase Without |
6.15% |
8.85% |
0.18% |
8.33% |
8.02% |
138.42% |
|
Returns based on Purchase With Maximum Sales Charge of 5.75% (POP) |
5.52% |
7.57% |
-1.78% |
2.10% |
7.45% |
124.71% |
|
Fund Benchmark |
||||||
|
Russell 2000® Index |
7.12% |
10.04% |
10.00% |
7.68% |
7.05% |
115.43% |
|
The Private Shares Fund – Class I |
Ten |
Five |
Three |
One |
Annualized |
Cumulative |
|
Returns based on Purchase Without Any Sales Charge (NAV) |
N/A |
9.08% |
0.36% |
8.41% |
8.33% |
83.92% |
|
Fund Benchmark |
||||||
|
Russell 2000® Index |
N/A |
10.04% |
10.00% |
7.68% |
6.51% |
61.61% |
|
The Private Shares Fund – Class L |
Ten |
Five |
Three |
One |
Annualized |
Cumulative |
|
Returns based on Purchase Without Any Sales Charge (NAV) |
N/A |
8.59% |
-0.06% |
8.11% |
7.28% |
65.11% |
|
Returns based on Purchase With Maximum Sales Charge of 4.25% (POP) |
N/A |
7.65% |
-1.49% |
3.52% |
6.63% |
58.09% |
|
Fund Benchmark |
||||||
|
Russell 2000® Index |
N/A |
10.04% |
10.00% |
7.68% |
5.77% |
49.25% |
Performance data quoted represents past performance and is no guarantee of future results. Public offering price (“POP”) performance assumes a maximum sales load of 5.75% (Class A) and 4.25% (Class L) on all sales. Investment return and principal value will fluctuate so that an investor’s shares, when redeemed, may be worth more or less than original cost. Current performance may be lower or higher than the performance data quoted. For performance as of the most recent month-end, please call 1-855-551-5510. Some of the Fund’s fees were waived or expenses reimbursed; otherwise, returns would have been lower. The Fund’s total annual expenses per the currently stated prospectus are 2.53% (Class A), 2.48% (Class I), and 2.76% (Class L). The Fund’s total net expenses are 2.72% (Class A), 2.47% (Class I), and 2.97% (Class L). Liberty Street Advisors, Inc. (the “Investment Adviser”) has contractually agreed to waive fees and/or reimburse (excluding taxes, interest expense, commitment fees, legal fees or other expenses related to any borrowing or leverage incurred by the Fund, brokerage commissions, acquired fund fees and expenses, and extraordinary expenses, such as litigation or reorganization costs, but inclusive of organizational costs and offering costs) expenses such that the total expenses do not exceed 2.65% (Class A), 2.40% (Class I), and 2.90% (Class L) through May 2, 2026. Net expenses are applicable to investors.
2
|
THE PRIVATE SHARES FUND |
|
Fund Performance (Continued) June 30, 2025 (Unaudited) |
DISCLOSURES
Investment in the Fund involves substantial risk. The Fund is not suitable for investors who cannot bear the risk of loss of all or part of their investment. The Fund is appropriate only for investors who can tolerate a high degree of risk and do not require a liquid investment. All investing involves risk including the possible loss of principal. Shares in the Fund are highly illiquid, and can be sold by shareholders only in the quarterly repurchase program of the Fund which allows for up to 5% of the Fund’s outstanding shares to be redeemed each quarter at NAV. Due to transfer restrictions and the illiquid nature of the Fund’s investments, you may not be able to sell your shares when, or in the amount that, you desire. The Fund primarily invests in late-stage operating businesses and does so primarily by directly investing in private, operating growth companies (“Portfolio Companies”). There are significant potential risks relating to investing in Portfolio Companies. Because most of the securities in which the Fund invests are not publicly traded, the Fund’s investments will be valued by Liberty Street Advisors, Inc. (the “Investment Adviser”) as Valuation Designee pursuant to fair valuation procedures and methodologies approved by the Board of Trustees, as set forth in the prospectus. As a consequence, the value of the securities, and therefore the Fund’s Net Asset Value (“NAV”), may vary. There are significant potential risks associated with investing in venture capital and private equity-backed companies with complex capital structures. The Fund focuses its investments in a limited number of securities, which could subject it to greater risk than that of a larger, more varied portfolio. There is a greater focus in technology securities that could adversely affect the Fund’s performance. The Fund’s quarterly repurchase policy may require the Fund to liquidate portfolio holdings earlier than the Investment Adviser would otherwise do so and may also result in an increase in the Fund’s expense ratio. Portfolio holdings of private companies that become publicly traded likely will be subject to more volatile market fluctuations than when private, and the Fund may not be able to sell shares at favorable prices. Such companies frequently impose lock-ups that would prohibit the Fund from selling shares for a period of time after an initial public offering (IPO). Market prices of public securities held by the Fund may decline substantially before the Investment Adviser is able to sell the securities. The Fund may invest in private securities utilizing special purpose vehicles (“SPVs”) and similar investment structures, venture capital funds and other funds that invest in private companies and rely on exclusions from the 1940 Act under section 3(c)(1) or 3(c)(7) (“Private Funds”), private investments in public equity (“PIPE”) transactions where the issuer is a special purpose acquisition company (“SPAC”), and may utilize profit sharing agreements. The Fund will bear its pro rata portion of expenses on investments in SPVs and Private Funds and will have no direct claim against underlying portfolio companies. The Fund’s investments in Private Funds subject it to the risks associated with direct ownership of the securities in which the underlying funds invest, as well as additional risks specific to the Private Funds, including operational risk, legal and indemnification risks, and lock-ups and other restrictions on withdrawal. PIPE transactions involve price risk, market risk, expense risk, and the risk that the Fund may not be able to sell the securities due to lock-ups or restrictions. Profit sharing agreements may expose the Fund to certain risks, including that the agreements could reduce the gain the Fund otherwise would have achieved on its investment, may be difficult to value and may result in contractual disputes. Certain conflicts of interest involving the Fund and its affiliates could impact the Fund’s investment returns and limit the flexibility of its investment policies. This is not a complete enumeration of the Fund’s risks. Please read the Fund prospectus for other risk factors related to the Fund.
The Fund may not be suitable for all investors. We encourage you to consult with appropriate financial professionals before considering an investment in the Fund.
The Russell 2000 is an index measuring the performance of approximately 2,000 smallest-cap American companies in the Russell 3000 Index, which is made up of 3,000 of the largest U.S. stocks. It is a market-cap weighted index. A SPAC is a company that has no commercial operations and is formed strictly to raise capital through an IPO for the purpose of acquiring or merging with an existing company.
The views expressed in this material reflect those of the Investment Adviser as of the date this is written and may not reflect its views on the date this material is first published or anytime thereafter. These views are intended to assist in understanding the Fund’s investment methodology and do not constitute investment advice. This material may contain discussions about investments that may or may not be held by the Fund. All current and future holdings are subject to risk and to change.
The Fund is distributed by Foreside Fund Services, LLC.
3
|
THE PRIVATE SHARES FUND |
|
Fund Performance (Continued) June 30, 2025 (Unaudited) |
IMPORTANT DISCLOSURES
The inclusion of various indices is for comparison purposes only. The performance of an index is not an exact representation of any particular investment, as you cannot invest directly in an index.
Holdings subject to change. Not a recommendation to buy, sell, or hold any specific security.
4
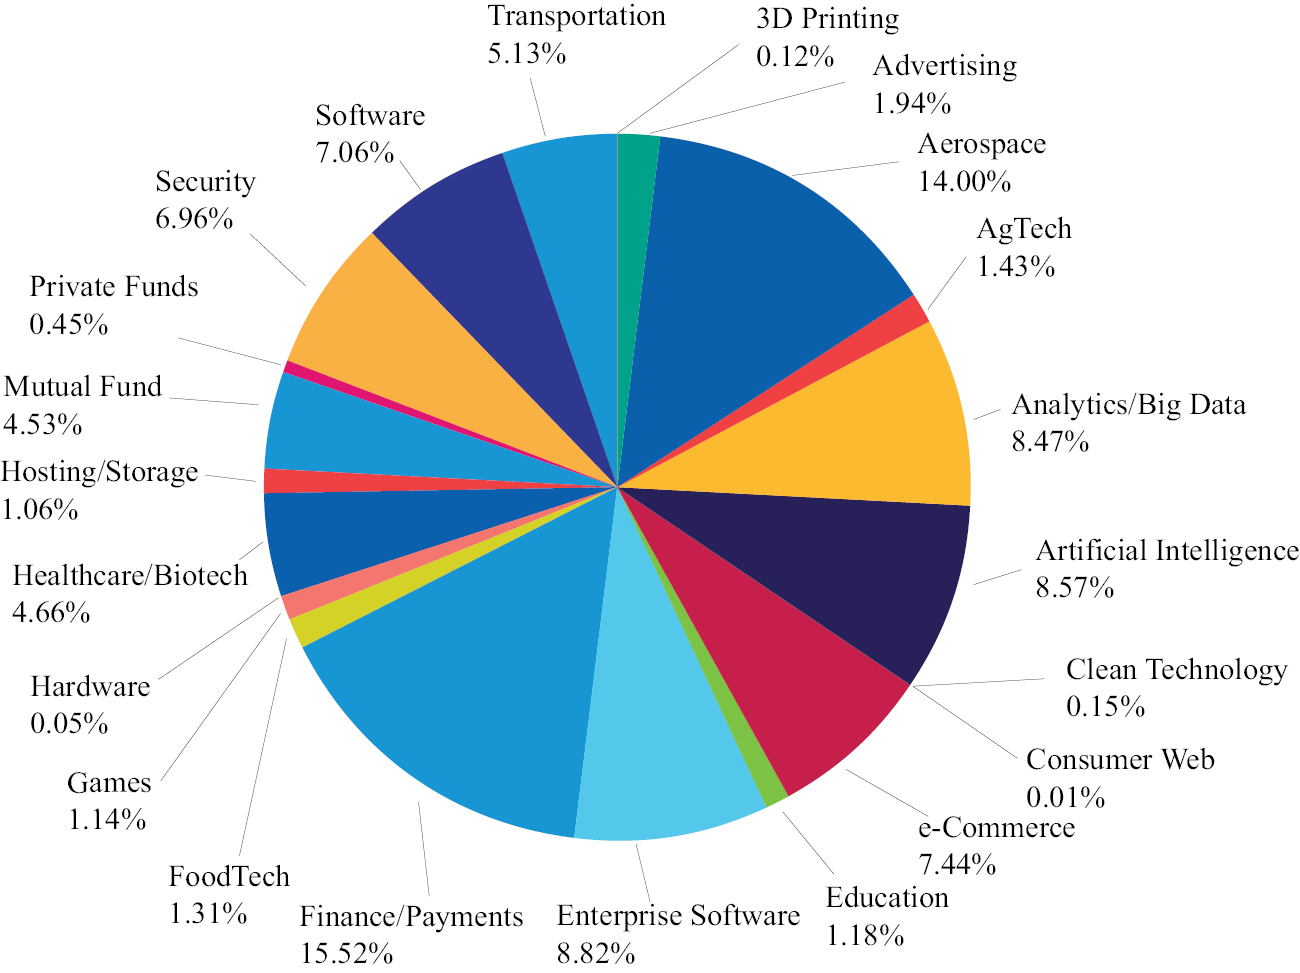
Fund Sector Diversification
The following chart provides a visual breakdown of the Fund, by the industry sectors that the underlying securities represent, as a percentage of the total investments.
5
Fund Holdings
|
|
|
|
|
|
|
|||||
|
|
|
|
|
|
|
|||||
|
|
|
|
|
|
|
|||||
|
|
|
|
|
|
|
|||||
|
|
|
|
|
|
|
|||||
|
|
|
|
|
|
|
|||||
|
|
|
|
|
|
|
|||||
|
|
|
|
|
|
|
6
|
THE PRIVATE SHARES FUND |
|
Portfolio Composition (Continued) June 30, 2025 (Unaudited) |
Fund Holdings (Continued)
|
|
|
|
|
|
|
|||||
|
|
|
|
|
|
|
|||||
|
|
|
|
|
|
|
|||||
|
|
|
|
|
|
|
|||||
|
|
|
|
|
|
|
|||||
|
|
|
7
|
Acquisition |
Shares |
Cost |
Fair Value |
|||||||
|
|
|
|||||||||
|
Common Stock in Public Companies(a),(b) — 8.2% |
|
|
||||||||
|
Aerospace — 2.1% |
|
|
||||||||
|
Voyager Technologies, Inc. |
Mar 2022 |
544,823 |
$ |
14,999,950 |
$ |
21,384,303 |
||||
|
|
|
|||||||||
|
Finance/Payments — 5.3% |
|
|
||||||||
|
Circle Internet Group, Inc. |
Apr 2018 |
290,200 |
|
2,604,826 |
|
52,610,358 |
||||
|
|
|
|||||||||
|
Healthcare/Biotech — 0.8% |
|
|
||||||||
|
Omada Health, Inc. |
Dec 2021 |
444,800 |
|
7,999,995 |
|
8,139,840 |
||||
|
TOTAL COMMON STOCK IN PUBLIC COMPANIES |
|
25,604,771 |
|
82,134,501 |
||||||
|
|
|
|||||||||
|
Common Stock in Private Companies(a),(b) — 37.0% |
|
|
||||||||
|
3D Printing — 0.1% |
|
|
||||||||
|
Carbon, Inc. |
Jun 2019 |
158,853 |
|
2,125,214 |
|
1,172,335 |
||||
|
|
|
|||||||||
|
Advertising — 1.9% |
|
|
||||||||
|
GroundTruth, Inc. |
Oct 2016 |
1,659,427 |
|
446,424 |
|
481,234 |
||||
|
NextRoll, Inc. |
Mar 2017 |
2,367,054 |
|
16,079,048 |
|
16,072,297 |
||||
|
OpenX Software, Ltd. |
Jun 2015 |
2,899,297 |
|
2,615,386 |
|
2,609,367 |
||||
|
|
19,140,858 |
|
19,162,898 |
|||||||
|
Aerospace — 7.1% |
|
|
||||||||
|
Axiom Space, Inc. |
Mar 2021 |
29,543 |
|
5,099,983 |
|
3,666,287 |
||||
|
Relativity Space, Inc. |
Oct 2021 |
12,165 |
|
20,299,986 |
|
51,882 |
||||
|
Space Exploration Technologies Corp. |
May 2019 |
360,330 |
|
7,386,765 |
|
66,661,050 |
||||
|
|
32,786,734 |
|
70,379,219 |
|||||||
|
AgTech — 0.1% |
|
|
||||||||
|
Farmer’s Business Network, Inc. |
Sep 2021 |
119,676 |
|
5,042,625 |
|
935,866 |
||||
|
|
|
|||||||||
|
Analytics/Big Data — 5.7% |
|
|
||||||||
|
Content Square SAS |
Dec 2023 |
544,905 |
|
3,740,557 |
|
6,375,388 |
||||
|
Dataminr, Inc. |
Sep 2015 |
567,043 |
|
6,559,226 |
|
16,756,121 |
||||
|
Domino Data Lab, Inc. |
Apr 2021 |
330,000 |
|
4,118,400 |
|
5,412,000 |
||||
|
INRIX, Inc. |
May 2014 |
133,238 |
|
3,026,250 |
|
6,045,008 |
||||
|
SingleStore, Inc. |
May 2020 |
2,148,366 |
|
10,359,604 |
|
14,866,693 |
||||
|
Tealium, Inc. |
Sep 2020 |
200,000 |
|
1,300,000 |
|
2,990,000 |
||||
|
ThoughtSpot, Inc. |
Oct 2018 |
162,087 |
|
1,745,758 |
|
3,984,098 |
||||
|
|
30,849,795 |
|
56,429,308 |
|||||||
|
Artificial Intelligence — 4.1% |
|
|
||||||||
|
Brain Corp. |
Dec 2020 |
2,375,000 |
|
9,540,000 |
|
12,848,750 |
||||
|
Cerebras Systems, Inc. |
Feb 2022 |
309,813 |
|
6,946,627 |
|
11,351,548 |
||||
|
Nanotronics Imaging, Inc. |
Aug 2022 |
76,504 |
|
7,803,408 |
|
16,138,519 |
||||
|
|
24,290,035 |
|
40,338,817 |
|||||||
|
EDUCATION — 0.7% |
|
|
||||||||
|
Learneo, Inc. (f.k.a. Course Hero, Inc.) |
Jun 2020 |
270,000 |
|
3,429,200 |
|
6,501,600 |
||||
See accompanying Notes to the Financial Statements
8
|
THE PRIVATE SHARES FUND |
|
Schedule of Investments (Continued) June 30, 2025 (Unaudited) |
|
Acquisition |
Shares |
Cost |
Fair Value |
|||||||
|
|
|
|||||||||
|
Common Stock in Private Companies(a),(b) — 37.0% (Continued) |
|
|
||||||||
|
Enterprise Software — 3.6% |
|
|
||||||||
|
Automation Anywhere, Inc. |
Jul 2021 |
189,449 |
$ |
4,019,940 |
$ |
2,144,563 |
||||
|
Docker, Inc. |
May 2017 |
2,500 |
|
531,250 |
|
24,750 |
||||
|
EquipmentShare.com, Inc. |
Oct 2021 |
694,800 |
|
9,985,874 |
|
20,976,012 |
||||
|
Motive Technologies, Inc. (f.k.a. Keep Truckin, Inc.) |
May 2019 |
788,562 |
|
3,420,734 |
|
8,871,322 |
||||
|
Tebra Technologies, Inc. (f.k.a. Kareo, Inc.) |
Nov 2020 |
190,007 |
|
1,235,126 |
|
1,417,452 |
||||
|
Trax, Ltd. |
Mar 2020 |
149,970 |
|
5,100,000 |
|
2,080,084 |
||||
|
|
24,292,924 |
|
35,514,183 |
|||||||
|
Finance/Payments — 3.7% |
|
|
||||||||
|
Betterment Holdings, Inc. |
Mar 2021 |
1,457,800 |
|
14,999,995 |
|
24,388,994 |
||||
|
ConsenSys Software, Inc. |
May 2022 |
31,010 |
|
3,703,824 |
|
3,968,660 |
||||
|
Payward, Inc. (d.b.a. Kraken) |
Jun 2021 |
105,218 |
|
5,079,228 |
|
5,273,526 |
||||
|
Prosper Marketplace, Inc. |
Jan 2016 |
244,130 |
|
1,307,998 |
|
97,652 |
||||
|
Upgrade, Inc. |
Apr 2022 |
661,053 |
|
2,900,002 |
|
3,087,118 |
||||
|
|
27,991,047 |
|
36,815,950 |
|||||||
|
FoodTech — 0.4% |
|
|
||||||||
|
Impossible Foods, Inc. |
Oct 2022 |
373,248 |
|
3,569,496 |
|
4,452,849 |
||||
|
|
|
|||||||||
|
Games — 1.1% |
|
|
||||||||
|
Epic Games, Inc. |
Nov 2022 |
17,168 |
|
10,826,013 |
|
11,375,002 |
||||
|
|
|
|||||||||
|
Hardware — 0.0% |
|
|
||||||||
|
Hydrow, Inc. |
Feb 2022 |
14,172,560 |
|
4,999,989 |
|
473,364 |
||||
|
|
|
|||||||||
|
Healthcare/Biotech — 1.8% |
|
|
||||||||
|
Click Therapeutics, Inc. |
Nov 2020 |
1,000,000 |
|
3,500,000 |
|
4,967,100 |
||||
|
Color Health, Inc. |
Feb 2022 |
139,486 |
|
10,039,927 |
|
1,687,781 |
||||
|
Devoted Health, Inc. |
Aug 2022 |
177,776 |
|
9,999,953 |
|
11,055,889 |
||||
|
ZocDoc, Inc. |
Feb 2015 |
61,016 |
|
1,321,708 |
|
466,772 |
||||
|
|
24,861,588 |
|
18,177,542 |
|||||||
|
Security — 4.9% |
|
|
||||||||
|
Arctic Wolf Networks, Inc. |
Dec 2021 |
2,072,651 |
|
20,456,420 |
|
24,996,171 |
||||
|
Contrast Security, Inc. |
Sep 2022 |
31,250 |
|
255,000 |
|
288,125 |
||||
|
Cybereason, Inc. |
Apr 2025 |
2,115,128 |
|
7,631,457 |
|
1,336,338 |
||||
|
Lookout, Inc. |
Jul 2022 |
1,869,160 |
|
10,000,006 |
|
12,766,363 |
||||
|
Snyk, Ltd. |
Mar 2023 |
392,707 |
|
2,932,070 |
|
4,543,620 |
||||
|
Tanium, Inc. |
Apr 2019 |
640,000 |
|
4,787,200 |
|
5,203,200 |
||||
|
|
46,062,153 |
|
49,133,817 |
|||||||
|
Software — 1.5% |
|
|
||||||||
|
Discord, Inc. |
Dec 2021 |
36,603 |
|
15,833,016 |
|
14,153,648 |
||||
|
Roofstock, Inc. |
Jun 2024 |
127,231 |
|
6,130,637 |
|
1,080,191 |
||||
|
|
21,963,653 |
|
15,233,839 |
|||||||
See accompanying Notes to the Financial Statements
9
|
THE PRIVATE SHARES FUND |
|
Schedule of Investments (Continued) June 30, 2025 (Unaudited) |
|
Acquisition |
Shares |
Cost |
Fair Value |
|||||||
|
|
|
|||||||||
|
Common Stock in Private Companies(a),(b) — 37.0% (Continued) |
|
|
||||||||
|
Transportation — 0.3% |
|
|
||||||||
|
Flexport, Inc. |
Jul 2022 |
538,387 |
$ |
7,256,025 |
$ |
2,858,835 |
||||
|
TOTAL COMMON STOCK IN PRIVATE COMPANIES |
|
289,487,349 |
|
368,955,424 |
||||||
|
|
|
|||||||||
|
Preferred Stock in Private Companies(a),(b) — 38.5% |
|
|
||||||||
|
Advertising — 0.0% |
|
|
||||||||
|
GroundTruth, Inc., Preferred Series B-1 |
Jan 2017 |
600,000 |
|
149,200 |
|
174,000 |
||||
|
|
|
|||||||||
|
Aerospace — 4.8% |
|
|
||||||||
|
Axiom Space, Inc., Preferred Series B |
Dec 2020 |
32,221 |
|
2,019,958 |
|
3,998,627 |
||||
|
Axiom Space, Inc., Preferred Series C-1 |
Aug 2021 |
108,731 |
|
15,612,740 |
|
13,493,518 |
||||
|
Beta Technologies, Inc., Preferred Series A |
Apr 2021 |
40,944 |
|
2,999,967 |
|
4,686,860 |
||||
|
Beta Technologies, Inc., Preferred Series B |
Apr 2022 |
58,156 |
|
5,999,954 |
|
6,657,117 |
||||
|
Radian Aerospace, Inc., Preferred Series Seed 2 |
Sep 2021 |
607,336 |
|
1,999,997 |
|
2,332,170 |
||||
|
Relativity Space, Inc., Preferred Series 1A |
May 2025 |
1,172,360 |
|
4,999,998 |
|
4,999,998 |
||||
|
Relativity Space, Inc., Preferred Series Z |
May 2025 |
9,999 |
|
0 |
|
9,999,000 |
||||
|
Xplore, Inc., Preferred Series A1 |
Feb 2022 |
237,524 |
|
1,000,000 |
|
1,250,001 |
||||
|
|
34,632,614 |
|
47,417,291 |
|||||||
|
AgTech — 0.5% |
|
|
||||||||
|
Farmer’s Business Network, Inc., Preferred Series G |
Sep 2021 |
128,704 |
|
10,199,946 |
|
4,570,279 |
||||
|
|
|
|||||||||
|
Analytics/Big Data — 0.6% |
|
|
||||||||
|
Content Square SAS, Preferred Series F |
Dec 2023 |
160,410 |
|
1,693,701 |
|
2,441,440 |
||||
|
Dataminr, Inc., Preferred Series A |
Apr 2019 |
20,000 |
|
198,000 |
|
591,000 |
||||
|
Dataminr, Inc., Preferred Series B |
Apr 2019 |
87,496 |
|
866,211 |
|
2,585,507 |
||||
|
|
2,757,912 |
|
5,617,947 |
|||||||
|
Artificial Intelligence — 2.4% |
|
|
||||||||
|
Nanotronics Imaging, Inc., Preferred Series F-2 |
Apr 2022 |
90,888 |
|
15,300,066 |
|
19,172,823 |
||||
|
VerbIT, Inc., Preferred Series A |
Nov 2021 |
47,640 |
|
693,256 |
|
151,495 |
||||
|
VerbIT, Inc., Preferred Series B |
Nov 2021 |
288,180 |
|
4,194,173 |
|
916,412 |
||||
|
VerbIT, Inc., Preferred Series E-1 |
Nov 2021 |
423,720 |
|
6,166,668 |
|
3,915,173 |
||||
|
VerbIT, Inc., Preferred Series Seed 2 |
Nov 2021 |
65,000 |
|
945,904 |
|
206,700 |
||||
|
|
27,300,067 |
|
24,362,603 |
|||||||
|
Clean Technology — 0.1% |
|
|
||||||||
|
WiTricity Holdings, Inc., Preferred Series A |
Oct 2020 |
1,000,000 |
|
1,020,000 |
|
820,000 |
||||
|
WiTricity Holdings, Inc., Preferred Series B |
Jun 2022 |
333,253 |
|
999,999 |
|
559,865 |
||||
|
|
2,019,999 |
|
1,379,865 |
|||||||
|
Consumer Web — 0.0% |
|
|
||||||||
|
Trusper, Inc. (d.b.a. Musely), Preferred Series B |
Oct 2014 |
7,961 |
|
100,012 |
|
118,380 |
||||
|
|
|
|||||||||
|
e-Commerce — 7.2% |
|
|
||||||||
|
GrubMarket, Inc., Preferred Series D |
Oct 2020 |
440,742 |
|
1,999,999 |
|
11,865,590 |
||||
|
GrubMarket, Inc., Preferred Series E |
Jun 2021 |
1,520,838 |
|
14,999,995 |
|
40,943,773 |
||||
|
GrubMarket, Inc., Preferred Series F |
Feb 2022 |
697,526 |
|
9,999,982 |
|
18,778,690 |
||||
|
|
26,999,976 |
|
71,588,053 |
|||||||
See accompanying Notes to the Financial Statements
10
|
THE PRIVATE SHARES FUND |
|
Schedule of Investments (Continued) June 30, 2025 (Unaudited) |
|
Acquisition |
Shares |
Cost |
Fair Value |
|||||||
|
|
|
|||||||||
|
Preferred Stock in Private Companies(a),(b) — 38.5% (Continued) |
|
|
||||||||
|
Education — 0.1% |
|
|
||||||||
|
Yanka Industries, Inc. (d.b.a. MasterClass), Preferred Series Seed 1 |
Jul 2021 |
193,100 |
$ |
6,146,189 |
$ |
1,204,944 |
||||
|
|
|
|||||||||
|
Enterprise Software — 5.0% |
|
|
||||||||
|
Checkr, Inc., Preferred Series A-1 |
Mar 2020 |
150,000 |
|
1,405,000 |
|
2,565,000 |
||||
|
Cohere Technologies, Inc., Preferred Series D-1 |
Feb 2022 |
279,571 |
|
1,999,995 |
|
1,973,771 |
||||
|
Cohere Technologies, Inc., Preferred Series D-2 |
Dec 2020 |
386,038 |
|
2,071,233 |
|
2,682,964 |
||||
|
EquipmentShare.com, Inc., Preferred Series E |
May 2022 |
323,064 |
|
4,999,997 |
|
9,753,302 |
||||
|
Motive Technologies, Inc. (f.k.a. Keep Truckin, Inc.), Preferred Series E |
May 2021 |
638,843 |
|
4,599,996 |
|
7,186,984 |
||||
|
Motive Technologies, Inc. (f.k.a. Keep Truckin, Inc.), Preferred Series F |
Jun 2022 |
1,923,076 |
|
14,999,993 |
|
21,634,605 |
||||
|
Tebra Technologies, Inc. (f.k.a. Kareo, Inc.), Preferred Series Seed 2 |
Nov 2020 |
123,819 |
|
804,870 |
|
923,690 |
||||
|
Trax, Ltd., Pre IPO |
Mar 2021 |
76,722 |
|
3,999,978 |
|
2,700,614 |
||||
|
|
34,881,062 |
|
49,420,930 |
|||||||
|
Finance/Payments — 6.0% |
|
|
||||||||
|
Betterment Holdings, Inc., Preferred Series F |
Sep 2021 |
318,380 |
|
3,999,999 |
|
5,326,497 |
||||
|
Fundbox, Ltd., Preferred Series C |
Jun 2019 |
439,552 |
|
4,999,992 |
|
5,551,542 |
||||
|
Fundbox, Ltd., Preferred Series D |
Sep 2021 |
531,914 |
|
7,499,988 |
|
7,127,648 |
||||
|
Payward, Inc. (d.b.a. Kraken), Preferred Series A |
Nov 2021 |
262,210 |
|
13,768,164 |
|
13,141,965 |
||||
|
Payward, Inc. (d.b.a. Kraken), Preferred Series Seed |
Apr 2022 |
67,000 |
|
3,505,340 |
|
3,358,040 |
||||
|
Prosper Marketplace, Inc., Preferred Series A |
Jan 2016 |
55,395 |
|
305,781 |
|
28,805 |
||||
|
Prosper Marketplace, Inc., Preferred Series A-1 |
Jan 2016 |
58,165 |
|
116 |
|
23,266 |
||||
|
Ripple Labs, Inc., Preferred Series A |
Dec 2018 |
40,697 |
|
488,364 |
|
10,174,250 |
||||
|
Upgrade, Inc., Preferred Series C-1 |
Mar 2022 |
3,290,000 |
|
14,159,000 |
|
15,364,300 |
||||
|
|
48,726,744 |
|
60,096,313 |
|||||||
|
FoodTech — 0.5% |
|
|
||||||||
|
Impossible Foods, Inc., Preferred Series E-1 |
Nov 2022 |
400,000 |
|
4,080,000 |
|
4,772,000 |
||||
|
|
|
|||||||||
|
Healthcare/Biotech — 2.0% |
|
|
||||||||
|
Click Therapeutics, Inc., Preferred Series A |
Nov 2020 |
60,087 |
|
210,304 |
|
298,458 |
||||
|
Collective Health, Inc., Preferred Series F |
May 2021 |
3,989,361 |
|
3,120,000 |
|
2,273,936 |
||||
|
Crossover Health Management Services, Inc., Preferred Series D |
Mar 2021 |
303,329 |
|
10,786,170 |
|
16,589,063 |
||||
|
Devoted Health, Inc., Preferred Series E |
Dec 2023 |
8,888 |
|
499,953 |
|
552,745 |
||||
|
ZocDoc, Inc., Preferred Series A |
Feb 2015 |
35,000 |
|
875,000 |
|
267,750 |
||||
|
|
15,491,427 |
|
19,981,952 |
|||||||
|
Security — 2.0% |
|
|
||||||||
|
Contrast Security, Inc., Preferred Series A |
Jul 2022 |
828,514 |
|
10,300,003 |
|
7,638,899 |
||||
|
Contrast Security, Inc., Preferred Series C |
Nov 2022 |
1,164,596 |
|
7,649,998 |
|
10,737,575 |
||||
|
Cybereason, Inc., Preferred Series H |
Apr 2025 |
175,604 |
|
110,947 |
|
110,947 |
||||
|
Lookout, Inc., Preferred Series A |
Feb 2015 |
204,000 |
|
1,927,800 |
|
1,393,320 |
||||
|
|
19,988,748 |
|
19,880,741 |
|||||||
See accompanying Notes to the Financial Statements
11
|
THE PRIVATE SHARES FUND |
|
Schedule of Investments (Continued) June 30, 2025 (Unaudited) |
|
Acquisition |
Shares/ |
Cost |
Fair Value |
||||||||
|
|
|
|
|||||||||
|
Preferred Stock in Private Companies(a),(b) — 38.5% (Continued) |
|
|
|||||||||
|
Software — 4.8% |
|
|
|
||||||||
|
Roofstock, Inc., Preferred Series E |
Mar 2022 |
|
339,154 |
$ |
9,999,990 |
$ |
6,688,117 |
||||
|
Tradeshift Holdings, Inc., Preferred Series 3 |
Jun 2021 |
|
28,797,969 |
|
12,551,436 |
|
41,469,075 |
||||
|
|
|
22,551,426 |
|
48,157,192 |
|||||||
|
Transportation — 2.5% |
|
|
|
||||||||
|
Clearmotion, Inc., Preferred Series A-3 |
Mar 2022 |
|
2,075,885 |
|
341,068 |
|
515,650 |
||||
|
Clearmotion, Inc., Preferred Series A-4 |
Mar 2022 |
|
12,954,589 |
|
908,932 |
|
3,217,920 |
||||
|
Clearmotion, Inc., Preferred Series B |
Mar 2023 |
|
2,484,760 |
|
500,000 |
|
617,214 |
||||
|
Flexport, Inc., Preferred Series A |
Jun 2022 |
|
580,165 |
|
8,489,030 |
|
3,080,676 |
||||
|
Flexport, Inc., Preferred Series B-1 |
Jul 2022 |
|
69,790 |
|
944,665 |
|
370,585 |
||||
|
Flexport, Inc., Preferred Series D-3 |
Jul 2022 |
|
82,613 |
|
1,117,776 |
|
474,199 |
||||
|
Loadsmart, Inc., Preferred Series D |
Jan 2022 |
|
500,000 |
|
10,000,000 |
|
8,280,000 |
||||
|
Neutron Holdings, Inc. (d.b.a. Lime), Preferred Series 1-D |
Mar 2019 |
|
20,618,556 |
|
5,000,000 |
|
1,870,103 |
||||
|
Turo, Inc., Preferred Series D-1 |
Jun 2018 |
|
314,017 |
|
2,932,295 |
|
5,988,304 |
||||
|
|
|
30,233,766 |
|
24,414,651 |
|||||||
|
TOTAL PREFERRED STOCK IN PRIVATE COMPANIES |
|
|
286,259,088 |
|
383,157,141 |
||||||
|
|
|
|
|||||||||
|
Convertible Notes of Private Companies(a),(b) — 4.2% |
|
|
|
||||||||
|
AgTech — 0.0% |
|
|
|
||||||||
|
Farmer’s Business Network, Inc., 15.00% 9/28/2025 |
Sep 2023 |
$ |
350,000 |
|
350,000 |
|
350,000 |
||||
|
|
|
|
|||||||||
|
Analytics/Big Data — 0.1% |
|
|
|
||||||||
|
Dataminr, Inc., 10.00% 2/28/2030 |
Jun 2025 |
$ |
1,000,000 |
|
1,000,000 |
|
1,000,000 |
||||
|
|
|
|
|||||||||
|
Artificial Intelligence — 0.3% |
|
|
|
||||||||
|
Nanotronics Imaging, Inc., 5.00% 4/25/2025 |
Apr 2023 |
$ |
3,000,000 |
|
3,000,000 |
|
3,418,031 |
||||
|
|
|
|
|||||||||
|
Hosting/Storage — 1.1% |
|
|
|
||||||||
|
TMGcore, Inc., 4.00% 9/30/2028 |
Dec 2021 |
$ |
10,476,362 |
|
10,476,362 |
|
10,494,731 |
||||
|
|
|
|
|||||||||
|
Software — 0.3% |
|
|
|
||||||||
|
Tradeshift Holdings, Inc., 0.00% 7/31/2026 |
Apr 2023 |
$ |
2,227,053 |
|
2,227,053 |
|
2,227,053 |
||||
|
Tradeshift Holdings, Inc., 0.00% 9/13/2027 |
Sep 2024 |
$ |
500,000 |
|
500,000 |
|
500,000 |
||||
|
|
|
2,727,053 |
|
2,727,053 |
|||||||
|
Transportation — 2.4% |
|
|
|
||||||||
|
Neutron Holdings, Inc. (d.b.a. Lime), 8.00% 10/29/2026(c) |
Oct 2021 |
$ |
18,054,330 |
|
18,054,330 |
|
22,526,544 |
||||
|
Neutron Holdings, Inc. (d.b.a. Lime), 4.00% 6/1/2027 |
Jun 2020 |
$ |
10,418,495 |
|
252,362 |
|
1,092,339 |
||||
|
|
|
18,306,692 |
|
23,618,883 |
|||||||
|
TOTAL CONVERTIBLE NOTES OF PRIVATE COMPANIES |
|
|
35,860,107 |
|
41,608,698 |
||||||
See accompanying Notes to the Financial Statements
12
|
THE PRIVATE SHARES FUND |
|
Schedule of Investments (Continued) June 30, 2025 (Unaudited) |
|
Acquisition |
Units |
Cost |
Fair Value |
|||||||
|
|
|
|||||||||
|
Units of Private Companies(a),(b) — 0.0% |
|
|
||||||||
|
Security — 0.0% |
|
|
||||||||
|
Excalibur CombineCo, L.P. Class A Units |
Jun 2023 |
194 |
$ |
193,877 |
$ |
193,857 |
||||
|
TOTAL UNITS OF PRIVATE COMPANIES |
|
193,877 |
|
193,857 |
||||||
|
|
|
|||||||||
|
Warrants of Private Companies(a),(b) — 0.1% |
|
|
||||||||
|
Software — 0.1% |
|
|
||||||||
|
Tradeshift Holdings, Inc., Exercise Price $0.001, Exercise Date 11/21/2031 |
Nov 2021 |
213,797 |
|
2,425,355 |
|
136,958 |
||||
|
Tradeshift Holdings, Inc., Exercise Price $0.001, Exercise Date 9/9/2031 |
Dec 2021 |
427,594 |
|
4,570,844 |
|
273,917 |
||||
|
Tradeshift Holdings, Inc., Exercise Price $0.001, Exercise Date 3/25/2032 |
Mar 2022 |
213,797 |
|
2,538,052 |
|
136,958 |
||||
|
|
9,534,251 |
|
547,833 |
|||||||
|
Transportation — 0.0% |
|
|
||||||||
|
Neutron Holdings, Inc. (d.b.a. Lime), Exercise Price $0.01, Exercise Date 6/2/2027 |
Jun 2020 |
1,016,483 |
|
807 |
|
82,742 |
||||
|
TOTAL WARRANTS OF PRIVATE COMPANIES |
|
9,535,058 |
|
630,575 |
||||||
|
|
|
|||||||||
|
SPECIAL PURPOSE VEHICLES(a),(b),(d) — 6.8% |
|
|
||||||||
|
AGTECH — 0.8% |
|
|
||||||||
|
Stage 1 Growth Fund, LLC, Series CiBO (invested in CIBO Technologies, Inc., Preferred Series C1) |
Aug 2021 |
1,298,566 |
|
3,210,057 |
|
3,116,558 |
||||
|
Stage 1 Growth Fund, LLC Series Invaio (invested in Invaio Sciences, Inc., Preferred Series C) |
Mar 2021 |
1,061,390 |
|
5,150,000 |
|
5,222,039 |
||||
|
|
8,360,057 |
|
8,338,597 |
|||||||
|
ANALYTICS/BIG DATA — 2.1% |
|
|
||||||||
|
KVC Select, LLC (invested in Dremio Corp., 26.2% Common Stock and 73.8% Preferred Series E) |
Dec 2021 |
636,258 |
|
5,213,383 |
|
4,270,465 |
||||
|
Tiger Global PIP 12-1, LLC (invested in Databricks, Inc., Preferred Series G) |
Jul 2022 |
182,664 |
|
10,815,024 |
|
16,896,420 |
||||
|
|
16,028,407 |
|
21,166,885 |
|||||||
|
ARTIFICIAL INTELLIGENCE — 1.7% |
|
|
||||||||
|
HOF Capital WH Strategic Opportunities Fund, LP (invested in X.AI, Corp., Preferred Series B) |
May 2024 |
267,335 |
|
3,296,000 |
|
9,773,768 |
||||
|
MVP Opportunity Fund VI LLC, Series 24G (invested in X.AI, Corp., Preferred Series C) |
Nov 2024 |
42,794 |
|
1,000,000 |
|
1,564,549 |
||||
|
SC JAL, LLC (invested in X.AI, Corp., Preferred Series B) |
May 2024 |
150,375 |
|
1,854,000 |
|
5,497,710 |
||||
|
|
6,150,000 |
|
16,836,026 |
|||||||
|
CLEAN TECHNOLOGY — 0.0% |
|
|
|
|
||||||
|
Stage 1 Growth Fund Series WiTricity Holdings (invested in WiTricity Holdings, Inc. Common Stock) |
Mar 2021 |
166,667 |
|
1,667 |
|
65,000 |
||||
|
|
|
|||||||||
|
E-COMMERCE — 0.2% |
|
|
||||||||
|
Irving Investors Privates OSC XXXVIII, LLC (invested in 1661, Inc. (d.b.a GOAT), 14.9% Common Stock, 13.1% Preferred Series A-1, 0.3% Preferred Series A-5, 17.1% Preferred Series A-7, 27.0% Preferred Series B, and 27.7% Preferred Series C) |
Sep 2021 |
859,200 |
|
5,100,463 |
|
2,388,576 |
||||
|
|
5,100,463 |
|
2,388,576 |
|||||||
|
EDUCATION — 0.4% |
|
|
||||||||
|
GSV ERS LP (invested in Eruditus Learning Solutions Pte., Ltd. Common Stock) |
Aug 2021 |
36,264 |
|
5,146,824 |
|
4,010,436 |
||||
See accompanying Notes to the Financial Statements
13
|
THE PRIVATE SHARES FUND |
|
Schedule of Investments (Continued) June 30, 2025 (Unaudited) |
|
Acquisition |
Units/ |
Cost |
Fair Value |
|||||||
|
|
|
|||||||||
|
SPECIAL PURPOSE VEHICLES(a),(b),(d) — 6.8% (Continued) |
|
|
||||||||
|
ENTERPRISE SOFTWARE — 0.3% |
|
|
||||||||
|
KVC Select, LLC (invested in Ocrolus, Inc., Preferred Series C) |
Aug 2021 |
438,327 |
$ |
3,137,450 |
$ |
2,770,227 |
||||
|
|
|
|||||||||
|
FINANCE/PAYMENTS — 0.5% |
|
|
||||||||
|
ParaFi Private Opportunities, LLC - Series J (invested in ConsenSys Software, Inc., Preferred Series D) |
Feb 2022 |
35,699 |
|
5,075,000 |
|
4,791,520 |
||||
|
|
|
|||||||||
|
FOODTECH — 0.4% |
|
|
||||||||
|
Khosla Ventures IFSPV II-B, LLC (invested in Impossible Foods, Inc., 74.2% Preferred Series H-1 and 25.8% Preferred Series H-2) |
Nov 2021 |
206,883 |
|
5,050,000 |
|
3,819,060 |
||||
|
|
|
|||||||||
|
SOFTWARE — 0.4% |
|
|
||||||||
|
Artist Edge Partners IV, LP (invested in Discord, Inc. Common Stock) |
Dec 2021 |
9,091 |
|
2,631,600 |
|
3,515,308 |
||||
|
TOTAL SPECIAL PURPOSE VEHICLES |
|
56,681,468 |
|
67,701,636 |
||||||
|
|
|
|||||||||
|
Simple Agreement for Future Equity of Private Companies(a),(b) — 0.0% |
|
|
||||||||
|
Artificial Intelligence — 0.0% |
|
|
||||||||
|
Cubefabs, Inc. |
Nov 2023 |
250,000 |
|
250,000 |
|
250,000 |
||||
|
TOTAL SIMPLE AGREEMENT FOR FUTURE EQUITY OF PRIVATE COMPANIES |
|
250,000 |
|
250,000 |
||||||
|
|
|
|||||||||
|
PRIVATE FUNDS(a),(b) — 0.5% |
|
|
||||||||
|
Private Funds — 0.5% |
|
|
||||||||
|
Northgate Growth Fund III |
Dec 2022 |
4,450,000 |
|
4,450,000 |
|
4,478,179 |
||||
|
TOTAL PRIVATE FUNDS |
|
4,450,000 |
|
4,478,179 |
||||||
|
|
|
|||||||||
|
Short-Term Investments — 4.6% |
|
|
||||||||
|
MUTuAL FUNDS — 4.6% |
|
|
||||||||
|
UMB Money Market II Special, 4.19%(e) |
|
45,306,372 |
|
45,306,372 |
||||||
|
|
|
|||||||||
|
TOTAL SHORT-TERM INVESTMENTS |
|
45,306,372 |
|
45,306,372 |
||||||
|
|
|
|||||||||
|
TOTAL INVESTMENTS — 99.9% |
|
753,628,090 |
|
994,416,383 |
||||||
|
Other assets less liabilities — 0.1% |
|
|
1,268,245 |
|||||||
|
|
|
|||||||||
|
NET ASSETS — 100.0% |
|
$ |
995,684,628 |
|||||||
(a) Debt positions (convertible notes of private companies) are income producing, all other positions are Equity positions and are non-income producing, except for short-term investments.
(b) Investments in private companies, and in some cases public companies, may be subject to restrictions on disposition imposed by the issuer. All positions held are non-controlled and non-affiliated investments, as defined by the Investment Company Act of 1940, as amended (“1940 Act”). As of June 30, 2025 restricted securities represented 95.32% of the net assets of the Fund.
(c) Denotes a variable rate security. The rate shown is the current interest rate as of June 30, 2025.
(d) The Fund has a direct investment in an SPV which has invested in an underlying portfolio company. If applicable, the number of units presented, are the units in the SPV owned by the Fund, which represents the equivalent number of securities of the underlying portfolio company for which the investment has economic exposure.
(e) Represents the 7-day effective yield as of June 30, 2025.
All issuers are based in the United States, except for OpenX Software, Ltd., and Snyk, Ltd., which are based in the UK, and Trax, Ltd., Eruditus Learning Solutions Pte., Ltd., Fundbox, Ltd., and Content Square SAS, which are based in the Cayman Islands, Singapore, Israel, and France, respectively.
See accompanying Notes to the Financial Statements
14
|
Assets: |
|
||
|
Investments, at fair value (cost $753,628,090) (Note 3) |
$ |
994,416,383 |
|
|
Receivable for fund shares sold |
|
532,732 |
|
|
Interest receivable |
|
3,209,735 |
|
|
Adviser contribution |
|
193,394 |
|
|
Prepaid expenses and other assets |
|
145,617 |
|
|
Prepaid borrowing costs |
|
38,441 |
|
|
Total assets |
|
998,536,302 |
|
|
|
|||
|
Liabilities: |
|
||
|
Advisory fees |
|
1,922,875 |
|
|
Payable for shareholder servicing fees - Class L |
|
1,165 |
|
|
Payable for shareholder servicing fees - Class A |
|
27,075 |
|
|
Payable for audit and tax fees |
|
297,534 |
|
|
Payable for transfer agent fees |
|
332,638 |
|
|
Payable for 12b-1 fees - Class L |
|
1,165 |
|
|
Payable for unused line of credit fees |
|
37,917 |
|
|
Other accrued liabilities |
|
231,305 |
|
|
Total liabilities |
|
2,851,674 |
|
|
Commitments and contingences (Note 9) |
|
||
|
Net assets |
$ |
995,684,628 |
|
|
|
|||
|
Net assets consist of: |
|
||
|
Capital stock (unlimited shares authorized, no par value) |
$ |
792,649,298 |
|
|
Total distributable earnings |
|
203,035,330 |
|
|
Net assets |
$ |
995,684,628 |
|
|
|
|||
|
Net assets: |
|
||
|
Class A |
$ |
127,025,805 |
|
|
Class I |
|
863,000,508 |
|
|
Class L |
|
5,658,315 |
|
|
Total net assets |
$ |
995,684,628 |
|
|
|
|||
|
Shares outstanding: |
|
||
|
Class A |
|
2,968,063 |
|
|
Class I |
|
19,802,383 |
|
|
Class L |
|
134,721 |
|
|
Total shares outstanding |
|
22,905,167 |
|
|
|
|||
|
Net asset value, public offering price, and redemption proceeds per share: |
|
||
|
Class A - Net asset value and redemption proceeds per share |
$ |
42.80 |
|
|
Class I - Net asset value and redemption proceeds per share |
$ |
43.58 |
|
|
Class L - Net asset value and redemption proceeds per share |
$ |
42.00 |
|
|
Class A - Public offering price per share(a) |
$ |
45.41 |
|
|
Class L - Public offering price per share(b) |
$ |
43.86 |
(a) Computation of public offering price per share 100/94.25 of net asset value. (See Note 10).
(b) Computation of public offering price per share 100/95.75 of net asset value. (See Note 10).
See accompanying Notes to the Financial Statements
15
|
Investment Income: |
|
|
||
|
Dividends1 |
$ |
2,019,029 |
|
|
|
Interest2 |
|
2,640,658 |
|
|
|
Total investment income |
|
4,659,687 |
|
|
|
|
|
|||
|
Expenses: |
|
|
||
|
Investment advisory fees (Note 5) |
|
9,324,925 |
|
|
|
Transfer agent fees |
|
965,928 |
|
|
|
Audit and tax fees |
|
432,424 |
|
|
|
Legal fees |
|
236,036 |
|
|
|
Fund accounting & administration fees |
|
203,487 |
|
|
|
Printing & postage |
|
179,121 |
|
|
|
Trustee fees |
|
172,301 |
|
|
|
Consulting expense |
|
123,411 |
|
|
|
Insurance fees |
|
98,003 |
|
|
|
Unused line of credit fees3 |
|
75,417 |
|
|
|
Borrowing fees3 |
|
57,184 |
|
|
|
Registration fees |
|
49,010 |
|
|
|
Chief compliance officer fees |
|
44,510 |
|
|
|
Miscellaneous expenses |
|
35,721 |
|
|
|
Shareholder servicing fees - Class A |
|
30,980 |
|
|
|
Custodian fees |
|
17,420 |
|
|
|
Distribution fees - Class L |
|
6,112 |
|
|
|
Shareholder servicing fees - Class L |
|
662 |
|
|
|
Total expenses |
|
12,052,652 |
|
|
|
Less: Net contractual waiver of fees and reimbursement of expenses (Note 4) |
|
(42,286 |
) |
|
|
Net expenses |
|
12,010,366 |
|
|
|
Net investment loss |
$ |
(7,350,679 |
) |
|
|
|
|
|||
|
Net realized loss on investments |
|
(11,458,305 |
) |
|
|
Net change in unrealized gain on investments |
|
33,851,859 |
|
|
|
Net realized and change in unrealized gain on investments |
|
22,393,554 |
|
|
|
Net change in net assets from operations |
$ |
15,042,875 |
|
1 Includes paid-in-kind dividends of $415,474.
2 Includes paid-in-kind interest of $724,193.
3 Line of credit borrowing costs incurred during the fiscal year that were excluded from the contractual waiver of fees.
See accompanying Notes to the Financial Statements
16
|
Six months ended |
Year ended |
|||||||
|
|
|
|
|
|||||
|
Operations: |
|
|
|
|
||||
|
Net investment loss |
$ |
(7,350,679 |
) |
$ |
(14,023,143 |
) |
||
|
Net realized loss on investments |
|
(11,458,305 |
) |
|
(3,734,037 |
) |
||
|
Net change in unrealized gain on investments |
|
33,851,859 |
|
|
122,482,195 |
|
||
|
Net change in net assets resulting from operations |
|
15,042,875 |
|
|
104,725,015 |
|
||
|
|
|
|
|
|||||
|
Fund share transactions: |
|
|
|
|
||||
|
Proceeds from shares issued - Class A |
|
8,877,781 |
|
|
14,608,294 |
|
||
|
Proceeds from shares issued - Class I |
|
104,902,684 |
|
|
177,329,680 |
|
||
|
Proceeds from shares issued - Class L |
|
1,414,137 |
|
|
743,511 |
|
||
|
Cost of shares repurchased - Class A |
|
(19,795,638 |
) |
|
(36,177,467 |
) |
||
|
Cost of shares repurchased - Class I |
|
(87,315,223 |
) |
|
(164,351,926 |
) |
||
|
Cost of shares repurchased - Class L |
|
(199,258 |
) |
|
(322,710 |
) |
||
|
Contribution from Investment Adviser |
|
139,427 |
|
|
— |
|
||
|
Net change in net assets from fund share transactions |
|
8,023,910 |
|
|
(8,170,618 |
) |
||
|
Net change in net assets |
$ |
23,066,785 |
|
$ |
96,554,397 |
|
||
|
|
|
|
|
|||||
|
Net assets: |
|
|
|
|
||||
|
Beginning of period |
$ |
972,617,843 |
|
$ |
876,063,446 |
|
||
|
End of period |
$ |
995,684,628 |
|
$ |
972,617,843 |
|
||
|
|
|
|
|
|||||
|
Transactions in shares: |
|
|
|
|
||||
|
Issuance of shares - Class A |
|
213,425 |
|
|
370,379 |
|
||
|
Issuance of shares - Class I |
|
2,468,493 |
|
|
4,429,079 |
|
||
|
Issuance of shares - Class L |
|
34,869 |
|
|
18,802 |
|
||
|
Repurchase of shares - Class A |
|
(469,720 |
) |
|
(903,982 |
) |
||
|
Repurchase of shares - Class I |
|
(2,012,055 |
) |
|
(4,035,918 |
) |
||
|
Repurchase of shares - Class L |
|
(4,693 |
) |
|
(8,174 |
) |
||
|
Net change in shares |
|
230,319 |
|
|
(129,814 |
) |
||
See accompanying Notes to the Financial Statements
17
|
Cash flows from operating activities: |
|
|
||
|
Net change in net assets from operations |
$ |
15,042,875 |
|
|
|
Adjustments to reconcile net change in net assets from operations to net cash used in operating activities: |
|
|
||
|
Purchases of investments |
|
(13,835,132 |
) |
|
|
Net sales of short-term investments |
|
8,041,220 |
|
|
|
Proceeds from sales of investments |
|
5,051,360 |
|
|
|
Net change in unrealized gain on investments |
|
(33,851,859 |
) |
|
|
Net realized loss on investments |
|
11,458,305 |
|
|
|
Paid-in-kind interest and dividends |
|
(1,139,667 |
) |
|
|
Change in operating assets and liabilities: |
|
|
||
|
Increase in interest receivable |
|
(255,045 |
) |
|
|
Decrease in prepaid expenses and other assets |
|
146,936 |
|
|
|
Increase in net payable to Investment Adviser |
|
204,379 |
|
|
|
Increase in other accrued liabilities |
|
56,891 |
|
|
|
Net cash used in operating activities |
|
(9,079,737 |
) |
|
|
|
|
|||
|
Cash flows from financing activities: |
|
|
||
|
Proceeds from shares issued, net of change in receivable for fund shares sold |
|
112,656,446 |
|
|
|
Cost of shares redeemed |
|
(104,109,688 |
) |
|
|
Contribution from Investment Adviser |
|
139,427 |
|
|
|
Net cash provided by financing activities |
|
8,686,185 |
|
|
|
|
|
|||
|
Net change in cash |
|
(393,552 |
) |
|
|
|
|
|||
|
Cash at beginning of period |
|
393,552 |
|
|
|
Cash at end of period |
$ |
— |
|
See accompanying Notes to the Financial Statements
18
|
Financial Highlights – Class A For a capital share outstanding throughout each period |
|
Six months |
|
|
|
|
|
|||||||||||||||||||
|
|
|
|
|
|
|
|
|
|
|
|
|
|||||||||||||
|
Per share operating performance |
|
|
|
|
|
|
|
|
|
|
|
|
||||||||||||
|
Net asset value, beginning of period |
$ |
42.22 |
|
$ |
37.91 |
|
$ |
41.37 |
|
$ |
41.77 |
|
$ |
36.33 |
|
$ |
29.96 |
|
||||||
|
|
|
|
|
|
|
|
|
|
|
|
|
|||||||||||||
|
Change in net assets from operations: |
|
|
|
|
|
|
|
|
|
|
|
|
||||||||||||
|
Net investment loss |
|
(0.33 |
) |
|
(0.67 |
) |
|
(0.64 |
) |
|
(0.80 |
) |
|
(0.88 |
) |
|
(0.90 |
) |
||||||
|
Net realized and unrealized gain/(loss) on investments |
|
0.87 |
|
|
4.98 |
|
|
(2.84 |
) |
|
0.98 |
|
|
9.54 |
|
|
7.98 |
|
||||||
|
Total change in net assets from operations |
|
0.54 |
|
|
4.31 |
|
|
(3.48 |
) |
|
0.18 |
|
|
8.66 |
|
|
7.08 |
|
||||||
|
|
|
|
|
|
|
|
|
|
|
|
|
|||||||||||||
|
Distributions: |
|
|
|
|
|
|
|
|
|
|
|
|
||||||||||||
|
From net return of capital |
|
— |
|
|
— |
|
|
— |
|
|
— |
|
|
— |
|
|
(0.07 |
) |
||||||
|
From net realized gain on investments |
|
— |
|
|
— |
|
|
— |
|
|
(0.58 |
) |
|
(3.22 |
) |
|
(0.64 |
) |
||||||
|
Total distributions |
|
— |
|
|
— |
|
|
— |
|
|
(0.58 |
) |
|
(3.22 |
) |
|
(0.71 |
) |
||||||
|
|
|
|
|
|
|
|
|
|
|
|
|
|||||||||||||
|
Impact of NAV Error |
|
0.04 |
|
|
— |
|
|
0.02 |
|
|
— |
|
|
— |
|
|
— |
|
||||||
|
Net increase (decrease) in net asset value |
|
0.58 |
|
|
4.31 |
|
|
(3.46 |
) |
|
(0.40 |
) |
|
5.44 |
|
|
6.37 |
|
||||||
|
Net asset value, end of period |
$ |
42.80 |
(b) |
$ |
42.22 |
|
$ |
37.91 |
|
$ |
41.37 |
(c) |
$ |
41.77 |
|
$ |
36.33 |
|
||||||
|
|
|
|
|
|
|
|
|
|
|
|
|
|||||||||||||
|
Total return(d) |
|
1.35 |
%(e)(f) |
|
11.40 |
% |
|
(8.36 |
)%(g) |
|
0.42 |
% |
|
23.85 |
% |
|
23.69 |
% |
||||||
|
|
|
|
|
|
|
|
|
|
|
|
|
|||||||||||||
|
Ratios and supplemental data |
|
|
|
|
|
|
|
|
|
|
|
|
||||||||||||
|
Net assets, end of period (in thousands) |
$ |
127,026 |
|
$ |
136,148 |
|
$ |
142,451 |
|
$ |
178,577 |
|
$ |
158,433 |
|
$ |
103,984 |
|
||||||
|
Ratio of net expenses to average net assets |
|
2.57 |
%(i)(j) |
|
2.65 |
%(h)(i) |
|
2.60 |
%(h)(k)(l) |
|
2.51 |
%(h)(k) |
|
2.51 |
%(h)(k) |
|
2.50 |
%(h) |
||||||
|
Ratio of gross expenses before reimbursement to average net assets |
|
2.57 |
%(j) |
|
2.55 |
% |
|
2.48 |
% |
|
2.41 |
% |
|
2.64 |
% |
|
2.97 |
% |
||||||
|
Ratio of net investment loss to average net assets |
|
(1.62 |
)%(j) |
|
(1.70 |
)% |
|
(1.60 |
)% |
|
(1.89 |
)% |
|
(2.42 |
)% |
|
(2.48 |
)% |
||||||
|
Portfolio turnover |
|
0.55 |
%(e) |
|
0.84 |
% |
|
2.23 |
% |
|
3.17 |
% |
|
26.20 |
% |
|
6.97 |
% |
||||||
(a) Per share calculations are based on average shares outstanding throughout the period.
(b) The NAV per share has been adjusted from the published NAV of $42.73 for post-closing adjustments.
(c) The NAV per share has been adjusted from the published NAV of $41.75 for post-closing adjustments.
(d) The Fund’s total investment returns do not include a sales load.
(e) Not annualized for periods less than one year.
(f) The impact of the NAV error on Total Return at NAV was 0.17%.
(g) A revision on the valuation of certain securities resulted in understated NAV. The impact of the NAV error on Total Return at NAV was 0.05%.
(h) The ratio of net expenses includes recoupment of previously waived and/or reimbursed fees of $144,908, $199,187 and $184,461, or 0.10%, 0.12% and 0.10%, for the fiscal years ended December 31, 2024, December 31, 2023 and December 31, 2022, respectively, and contractual waivers and expense reimbursements of $171,876 and $492,357, or 0.12% and 0.47% for the fiscal years ended December 31, 2021 and 2020, respectively. Please see Note 4 in the Notes to the Financial Statements for additional information.
(i) Effective November 19, 2024 expenses associated with lines of credit are excluded from of the 2.65% expense cap. Borrowing costs incurred by the Fund and allocated to Class A during the six month period ended June 30, 2025 and November 19, 2024 to December 31, 2024 were $17,667 and $1,667 or 0.03% and 0.00%, respectively.
(j) Annualized for period less than one year.
(k) During the fiscal years ended December 31, 2023, 2022 and 2021 there were legal expenses incurred by the Fund that were distinguishable in their characterization as being unusual in nature as well as not expected to be recurring in future periods. The exclusion of these extraordinary expenses from the Fund’s expense limitation agreement caused the expense ratio to exceed the contractual expense limit by $943 or 0.00%, $17,472 or 0.01% and $17,854 or 0.01%, respectively.
(l) Effective May 1, 2023, the Investment Adviser contractually agreed to waive management fees and/or reimburse the Fund for expenses the Fund incurs, subject to certain exclusions, to the extent necessary to maintain the Fund’s total annual operating expenses after fee waivers and/or reimbursement to an annual rate of 2.65%, 2.40%, and 2.90% (each, an “Expense Limit”) of the average daily net assets of the Fund attributable to Class A, Class I and Class L Shares, respectively. Prior to May 1, 2023, the Expense Limit for Class A shares was 2.50%.
See accompanying Notes to the Financial Statements
19
|
THE PRIVATE SHARES FUND |
|
Financial Highlights – Class I For a capital share outstanding throughout each period |
|
Six months |
|
|
|
|
|
|||||||||||||||||||
|
|
|
|
|
|
|
|
|
|
|
|
|
|||||||||||||
|
Per share operating performance |
|
|
|
|
|
|
|
|
|
|
|
|
||||||||||||
|
Net asset value, beginning of period |
$ |
43.01 |
|
$ |
38.52 |
|
$ |
41.94 |
|
$ |
42.22 |
|
$ |
36.61 |
|
$ |
30.12 |
|
||||||
|
|
|
|
|
|
|
|
|
|
|
|
|
|||||||||||||
|
Change in net assets from operations: |
|
|
|
|
|
|
|
|
|
|
|
|
||||||||||||
|
Net investment loss |
|
(0.31 |
) |
|
(0.58 |
) |
|
(0.55 |
) |
|
(0.65 |
) |
|
(0.62 |
) |
|
(0.47 |
) |
||||||
|
Net realized and unrealized gain/(loss) on investments |
|
0.88 |
|
|
5.07 |
|
|
(2.89 |
) |
|
0.95 |
|
|
9.45 |
|
|
7.67 |
|
||||||
|
Total change in net assets from operations |
|
0.57 |
|
|
4.49 |
|
|
(3.44 |
) |
|
0.30 |
|
|
8.83 |
|
|
7.20 |
|
||||||
|
|
|
|
|
|
|
|
|
|
|
|
|
|||||||||||||
|
Distributions: |
|
|
|
|
|
|
|
|
|
|
|
|
||||||||||||
|
From net return of capital |
|
— |
|
|
— |
|
|
— |
|
|
— |
|
|
— |
|
|
(0.07 |
) |
||||||
|
From net realized gain on investments |
|
— |
|
|
— |
|
|
— |
|
|
(0.58 |
) |
|
(3.22 |
) |
|
(0.64 |
) |
||||||
|
Total distributions |
|
— |
|
|
— |
|
|
— |
|
|
(0.58 |
) |
|
(3.22 |
) |
|
(0.71 |
) |
||||||
|
|
|
|
|
|
|
|
|
|
|
|
|
|||||||||||||
|
Impact of NAV Error |
|
— |
|
|
— |
|
|
0.02 |
|
|
— |
|
|
— |
|
|
— |
|
||||||
|
Net increase (decrease) in net asset value |
|
0.57 |
|
|
4.49 |
|
|
(3.42 |
) |
|
(0.28 |
) |
|
5.61 |
|
|
6.49 |
|
||||||
|
Net asset value, end of period |
$ |
43.58 |
|
$ |
43.01 |
|
$ |
38.52 |
|
$ |
41.94 |
(b) |
$ |
42.22 |
|
$ |
36.61 |
|
||||||
|
|
|
|
|
|
|
|
|
|
|
|
|
|||||||||||||
|
Total return |
|
1.33 |
%(c) |
|
11.66 |
% |
|
(8.15 |
)%(d) |
|
0.70 |
% |
|
24.13 |
% |
|
23.97 |
% |
||||||
|
|
|
|
|
|
|
|
|
|
|
|
|
|||||||||||||
|
Ratios and supplemental data |
|
|
|
|
|
|
|
|
|
|
|
|
||||||||||||
|
Net assets, end of period (in thousands) |
$ |
863,001 |
|
$ |
832,134 |
|
$ |
730,108 |
|
$ |
807,234 |
|
$ |
566,272 |
|
$ |
197,921 |
|
||||||
|
Ratio of net expenses to average net assets(e) |
|
2.43 |
%(f)(g) |
|
2.40 |
%(f) |
|
2.35 |
%(h)(i) |
|
2.26 |
%(h) |
|
2.26 |
%(h) |
|
2.25 |
% |
||||||
|
Ratio of gross expenses before reimbursement to average net assets |
|
2.44 |
%(g) |
|
2.49 |
% |
|
2.42 |
% |
|
2.34 |
% |
|
2.50 |
% |
|
2.75 |
% |
||||||
|
Ratio of net investment loss to average net assets |
|
(1.48 |
)%(g) |
|
(1.45 |
)% |
|
(1.36 |
)% |
|
(1.62 |
)% |
|
(2.15 |
)% |
|
(2.24 |
)% |
||||||
|
Portfolio turnover |
|
0.55 |
%(c) |
|
0.84 |
% |
|
2.23 |
% |
|
3.17 |
% |
|
26.20 |
% |
|
6.97 |
% |
||||||
(a) Per share calculations are based on average shares outstanding throughout the period.
(b) The NAV per share has been adjusted from the published NAV of $42.32 for post-closing adjustments.
(c) Not annualized for periods less than one year.
(d) A revision on the valuation of certain securities resulted in understated NAV. The impact of the NAV error on Total Return at NAV was 0.05%.
(e) The ratio of net expenses includes contractual waivers and expense reimbursements of $42,286, $719,354, $594,159, $631,951, $899,197, $567,388, and $546,174, or 0.01%, 0.09%, 0.07%, 0.08%, 0.23%, 0.50%, and 0.82%, for the six month period ended June 30, 2025 and the fiscal years ended December 31, 2024 December 31, 2023, 2022, 2021, and 2020, respectively. Please see Note 4 in the Notes to the Financial Statements for additional information.
(f) Effective November 19, 2024 expenses associated with lines of credit are excluded from of the 2.40% expense cap. Borrowing costs incurred by the Fund and allocated to Class I during the six month period ended June 30, 2025 and November 19, 2024 to December 31, 2024 were $114,273 and $10,000 or 0.03% and 0.00%, respectively.
(g) Annualized for period less than one year.
(h) During the fiscal years ended December 31, 2023, 2022 and 2021 there were legal expenses incurred by the Fund that were distinguishable in their characterization as being unusual in nature as well as not expected to be recurring in future periods. The exclusion of these extraordinary expenses from the Fund’s expense limitation agreement caused the expense ratio to exceed the contractual expense limit by $4,444 or 0.00%, $74,334 or 0.01% and $48,772 or 0.01%, respectively.
(i) Effective May 1, 2023, the Investment Adviser contractually agreed to waive management fees and/or reimburse the Fund for expenses the Fund incurs, subject to certain exclusions, to the extent necessary to maintain the Fund’s total annual operating expenses after fee waivers and/or reimbursement to an annual rate of 2.65%, 2.40%, and 2.90% (each, an “Expense Limit”) of the average daily net assets of the Fund attributable to Class A, Class I and Class L Shares, respectively. Prior to May 1, 2023, the Expense Limit for Class I shares was 2.25%.
See accompanying Notes to the Financial Statements
20
|
THE PRIVATE SHARES FUND |
|
Financial Highlights – Class L For a capital share outstanding throughout each period |
|
Six months |
|
|
|
|
|
|||||||||||||||||||
|
|
|
|
|
|
|
|
|
|
|
|
|
|||||||||||||
|
Per share operating performance |
|
|
|
|
|
|
|
|
|
|
|
|
||||||||||||
|
Net asset value, beginning of period |
$ |
41.47 |
|
$ |
37.32 |
|
$ |
40.82 |
|
$ |
41.33 |
|
$ |
36.07 |
|
$ |
29.83 |
|
||||||
|
|
|
|
|
|
|
|
|
|
|
|
|
|||||||||||||
|
Change in net assets from operations: |
|
|
|
|
|
|
|
|
|
|
|
|
||||||||||||
|
Net investment loss |
|
(0.36 |
) |
|
(0.76 |
) |
|
(0.74 |
) |
|
(1.12 |
) |
|
(0.82 |
) |
|
(0.67 |
) |
||||||
|
Net realized and unrealized gain/(loss) on investments |
|
0.85 |
|
|
4.91 |
|
|
(2.78 |
) |
|
1.19 |
|
|
9.30 |
|
|
7.62 |
|
||||||
|
Total change in net assets from operations |
|
0.49 |
|
|
4.15 |
|
|
(3.52 |
) |
|
0.07 |
|
|
8.48 |
|
|
6.95 |
|
||||||
|
|
|
|
|
|
|
|
|
|
|
|
|
|||||||||||||
|
Distributions: |
|
|
|
|
|
|
|
|
|
|
|
|
||||||||||||
|
From net return of capital |
|
— |
|
|
— |
|
|
— |
|
|
— |
|
|
— |
|
|
(0.07 |
) |
||||||
|
From net realized gain on investments |
|
— |
|
|
— |
|
|
— |
|
|
(0.58 |
) |
|
(3.22 |
) |
|
(0.64 |
) |
||||||
|
Total distributions |
|
— |
|
|
— |
|
|
— |
|
|
(0.58 |
) |
|
(3.22 |
) |
|
(0.71 |
) |
||||||
|
|
|
|
|
|
|
|
|
|
|
|
|
|||||||||||||
|
Impact of NAV Error |
|
0.04 |
|
|
— |
|
|
0.02 |
|
|
— |
|
|
— |
|
|
— |
|
||||||
|
Net increase (decrease) in net asset value |
|
0.53 |
|
|
4.15 |
|
|
(3.50 |
) |
|
(0.51 |
) |
|
5.26 |
|
|
6.24 |
|
||||||
|
Net asset value, end of period |
$ |
42.00 |
(b) |
$ |
41.47 |
|
$ |
37.32 |
|
$ |
40.82 |
(c) |
$ |
41.33 |
|
$ |
36.07 |
|
||||||
|
|
|
|
|
|
|
|
|
|
|
|
|
|||||||||||||
|
Total return(d) |
|
1.28 |
%(e)(f) |
|
11.12 |
% |
|
(8.57 |
)%(g) |
|
0.16 |
% |
|
23.52 |
% |
|
23.36 |
% |
||||||
|
|
|
|
|
|
|
|
|
|
|
|
|
|||||||||||||
|
Ratios and supplemental data |
|
|
|
|
|
|
|
|
|
|
|
|
||||||||||||
|
Net assets, end of period (in thousands) |
$ |
5,658 |
|
$ |
4,335 |
|
$ |
3,505 |
|
$ |
3,476 |
|
$ |
3,780 |
|
$ |
1,539 |
|
||||||
|
Ratio of net expenses to average net assets |
|
2.75 |
%(i)(j) |
|
2.90 |
%(h)(i) |
|
2.85 |
%(h)(k)(l) |
|
2.76 |
%(h)(k) |
|
2.76 |
%(h)(k) |
|
2.75 |
%(h) |
||||||
|
Ratio of gross expenses before reimbursement to average net assets |
|
2.75 |
%(j) |
|
2.84 |
% |
|
2.73 |
% |
|
2.63 |
% |
|
2.84 |
% |
|
3.18 |
% |
||||||
|
Ratio of net investment loss to average net assets |
|
(1.80 |
)%(j) |
|
(1.96 |
)% |
|
(1.86 |
)% |
|
(2.15 |
)% |
|
(2.66 |
)% |
|
(2.74 |
)% |
||||||
|
Portfolio turnover |
|
0.55 |
%(e) |
|
0.84 |
% |
|
2.23 |
% |
|
3.17 |
% |
|
26.20 |
% |
|
6.97 |
% |
||||||
(a) Per share calculations are based on average shares outstanding throughout the period.
(b) The NAV per share has been adjusted from the published NAV of $41.91 for post-closing adjustments.
(c) The NAV per share has been adjusted from the published NAV of $41.20 for post-closing adjustments.
(d) The Fund’s total investment returns do not include a sales load.
(e) Not annualized for periods less than one year.
(f) The impact of the NAV error on Total Return at NAV was 0.22%.
(g) A revision on the valuation of certain securities resulted in understated NAV. The impact of the NAV error on Total Return at NAV was 0.05%.
(h) The ratio of net expenses includes recoupment of previously waived and/or reimbursed fees of $2,358, $4,383 and $5,663, or 0.06%, 0.12% and 0.13%, for the fiscal years ended December 31, 2024, December 31, 2023 and December 31, 2022, respectively, and contractual waivers and expense reimbursements of $2,134, and $4,514, or 0.08%, and 0.43%, for the fiscal years ended December 31, 2021, and 2020, respectively. Please see Note 4 in the Notes to the Financial Statements for additional information.
(i) Effective November 19, 2024 expenses associated with lines of credit are excluded from of the 2.90% expense cap. Borrowing costs incurred by the Fund and allocated to Class L during the six month period ended June 30, 2025 and November 19, 2024 to December 31, 2024 were $661 and $54 or 0.03% and 0.00%, respectively.
(j) Annualized for period less than one year.
(k) During the fiscal years ended December 31, 2023, 2022 and 2021 there were legal expenses incurred by the Fund that were distinguishable in their characterization as being unusual in nature as well as not expected to be recurring in future periods. The exclusion of these extraordinary expenses from the Fund’s expense limitation agreement caused the expense ratio to exceed the contractual expense limit by $20 or 0.00%, $428 or 0.01% and $361 or 0.01%, respectively.
(l) Effective May 1, 2023, the Investment Adviser contractually agreed to waive management fees and/or reimburse the Fund for expenses the Fund incurs, subject to certain exclusions, to the extent necessary to maintain the Fund’s total annual operating expenses after fee waivers and/or reimbursement to an annual rate of 2.65%, 2.40%, and 2.90% (each, an “Expense Limit”) of the average daily net assets of the Fund attributable to Class A, Class I and Class L Shares, respectively. Prior to May 1, 2023, the Expense Limit for Class L shares was 2.75%.
See accompanying Notes to the Financial Statements
21
1. Organization
The Private Shares Fund (the “Fund”) was established as a limited liability company under the laws of the State of Delaware on August 20, 2012 and converted into a Delaware statutory trust on March 22, 2013. The Fund is registered with the Securities and Exchange Commission (the “SEC”) as a diversified, closed-end management investment company that operates as an “interval fund” under the Investment Company Act of 1940, as amended (the “1940 Act”). The shares of beneficial interest of the Fund (the “Shares”) are continuously offered under Rule 415 of the Securities Act of 1933, as amended (the “Securities Act”). As an interval fund, the Fund makes quarterly repurchase offers for 5% of the Fund’s outstanding Shares at net asset value (“NAV”), with no repurchase fee incurred. The Fund’s inception date was March 25, 2014. Prior to March 25, 2014, the Fund had been inactive except for matters relating to the Fund’s establishment, designation and planned registration of the Fund’s Shares under the Securities Act and the sale of 5,000 Shares (“Initial Shares”) for $100,000 to the Fund’s initial shareholder, which occurred on July 30, 2013.
The investment objective of the Fund is to provide investors capital appreciation, which it seeks by primarily investing, under normal market conditions, at least 80% of (i) the value of its net assets, plus (ii) the amount of any borrowings for investment purposes, in the equity securities (e.g., common and/or preferred stock, or equity-linked securities convertible into such equity securities) of private, operating growth companies (each, a “Portfolio Company”). Liberty Street Advisors, Inc.’s (the “Investment Adviser”) primary strategy is to invest in Portfolio Companies and to hold such securities until a liquidity event with respect to such Portfolio Company occurs, such as an initial public offering, or a merger or acquisition transaction. The Fund currently offers three different classes of shares: Class A, Class I, and Class L shares. The separate classes of shares differ principally in the applicable sales charges (if any), distribution fees, and shareholder servicing fees. Generally, shareholders of each class also bear certain expenses that pertain to that particular class. All shareholders bear the common expenses of the Fund and earn income and realized and unrealized gains/losses pro rata based on the daily ending net assets of each class, without discrimination between share classes. Expenses that are specific to a class are charged directly to that class. Dividends are determined separately for each class based on income and expenses allocated to each class. Realized gain distributions are allocated to each class pro rata based on the shares outstanding of each class on the date of distribution. Differences in per share dividend rates generally result from the differences in separate class expenses, including distribution and shareholder servicing fees.
2. Significant accounting policies
The Fund is an investment company and follows the accounting and reporting guidance under Financial Accounting Standards Board (“FASB”) Accounting Standards Codification (“ASC”) Topic 946, Financial Services – Investment Companies. The following is a summary of significant accounting policies consistently followed by the Fund in the preparation of its financial statements.
Investment transactions and income recognition — Investment transactions are accounted for on a trade date basis. Net realized gains and losses on securities are computed on a specific identification basis. Dividend income is recorded on the ex-dividend date or as soon as known if after the ex-dividend date. Non-cash dividends included in dividend income, if any, are recorded at fair value. Interest income and estimated expenses are accrued daily.
Use of estimates — The preparation of the financial statements in accordance with US generally accepted accounting principles (“GAAP”) requires management to make estimates and assumptions that affect the reported amounts of assets and liabilities and disclosure of contingent assets and liabilities at the date of the financial statements, as well as reported amounts of increases and decreases in net assets from operations during the reporting period. Actual results could differ from these estimates.
Investment valuation — The Fund’s NAV is based in large part on the value of its securities which are carried at fair value in accordance with the provisions of FASB ASC Topic 820, Fair Value Measurements and Disclosures. Where reliable market prices are available for those securities, the Investment Adviser will rely on those prices. However, because the securities in which the Fund invests are often illiquid, market prices may not be readily available or, where available, may be unreliable. At any point in time, there may be few recent purchase or sale transactions or offers on which to base the value of a given Portfolio Company’s security. In addition, the prices reflected in recent transactions or offers may be extremely sensitive to changes in supply or demand, including changes fueled by investor perceptions or other conditions.
22
|
THE PRIVATE SHARES FUND |
|
Notes to the Financial Statements (Continued) June 30, 2025 (Unaudited) |
|
2. Significant accounting policies — (continued) |
When reliable market values are not available, the Fund’s investments will be valued by the Investment Adviser, as the Valuation Designee designated by the Board of Trustees, pursuant to valuation procedures and methodologies approved by the Board of Trustees. While the Valuation Designee will use good faith efforts to determine the fair value of the Fund’s securities, fair value will be dependent on the judgment of the Valuation Designee. The Valuation Designee may also rely to some extent on information provided by the Portfolio Companies.
From time to time, the Fund may determine that it should modify its estimates or assumptions, as new information becomes available. As a consequence, the value of the securities, and therefore the Fund’s NAV, may vary. This may adversely affect shareholders. Because of the uncertainty and judgment involved in the valuation of the Portfolio Company securities, which do not have a readily available market, the estimated fair value of such securities may be different from values that would have been used had a readily available market existed for such securities. In addition, in the event that the Fund desires to sell Portfolio Company shares, the Fund may also not be able to sell these securities at the prices at which they are carried on the Fund’s books or may have to delay their sale in order to do so. This may adversely affect the Fund’s NAV.
There were no changes to the valuation approaches or techniques applied to the assessment of fair value for the Fund’s common stock in private companies, preferred stock in private companies, warrants of private companies, convertible notes of private companies, simple agreement for future equity of private companies and special purpose vehicles/private funds during the six months ended June 30, 2025. The Fund may engage a third-party provider in the valuation of the Portfolio Company securities.
Federal income taxes — The Fund’s policy is to comply with Subchapter M of the Internal Revenue Code of 1986, as amended (the “Code”), and to distribute to shareholders each year substantially all of its net investment income and any net realized capital gain. Therefore, a federal income tax or excise tax provision is not required.
Management has evaluated all tax positions taken or expected to be taken by the Fund to determine whether each tax position is more likely than not (i.e. greater than 50%) to be sustained upon examination by the applicable taxing authority, including resolution of any related appeals or litigation processes, based on the technical merits of the position. Tax positions that do not meet the more likely than not threshold may result in a tax benefit or expense in the current year. If the Fund were to incur an income tax liability in the future, interest on any income tax liability would be reported as interest expense and penalties on any income tax liability would be reported as income taxes. No interest expense or penalties have been recognized as of or for the six months ended June 30, 2025. Management of the Fund also is not aware of any tax positions for which it is reasonably possible that the total amounts of recognized tax benefits will significantly change in the next twelve months. Management has determined that the Fund has not taken any tax positions which do not meet the more likely than not threshold and as such, no liabilities related to uncertain tax positions have been reflected in the Fund’s financial statements.
Management analyzed all open tax years, as defined by the applicable statute of limitations for all major jurisdictions in which it files tax returns, which includes federal and certain states. The Fund’s 2021-2024 tax years are open to examination as of June 30, 2025.
Distributions to shareholders — The Fund distributes net investment income and net realized gains (net of any capital loss carryovers), if any, annually. The timing and character of income and capital gain distributions are determined in accordance with income tax regulations, which may differ from GAAP. These differences are due in part to differing treatment of net operating loss, wash sales, non-deductible offering costs and capital loss carryforwards. To the extent that differences arise that are permanent in nature, such amounts are reclassified within the capital accounts on the Statement of Assets and Liabilities, based on their federal tax treatment. Temporary differences do not require reclassification.
23
|
THE PRIVATE SHARES FUND |
|
Notes to the Financial Statements (Continued) June 30, 2025 (Unaudited) |
|
2. Significant accounting policies — (continued) |
Shareholder service fee plan — Under the terms of the Fund’s Shareholder Services Plan, the Fund compensates financial industry professionals for providing ongoing services with respect to clients to whom they have distributed Class A and Class L Shares of the Fund. Both Class A and Class L may incur shareholder servicing fees on an annual basis up to 0.25% of its daily average NAV. Class I is not subject to a shareholder servicing fee. For the six months ended June 30, 2025, Class A and Class L incurred $30,980 and $662, respectively, in shareholder servicing fees.
Distribution fee plan — Under the terms of the Fund’s Distribution Plan, the Fund compensates financial industry professionals for providing ongoing services with respect to certain activities relating to the distribution of Class L to investors and maintenance of shareholder accounts, as well as for payments to the Class L platform sponsors. Although the Fund is not an open-end investment company, it has undertaken to comply with the terms of Rule 12b-1 as a condition of an exemptive order under the 1940 Act which permits it to have asset-based distribution fees. Under the Distribution Plan, Class L pays Foreside Fund Services, LLC (“Distributor”) a distribution fee at an annual rate of 0.25% of its average daily NAV. Class A and Class I are not subject to a distribution fee. For the six months ended June 30, 2025, Class L incurred $6,112 in distribution fees.
The Investment Adviser’s affiliated broker-dealer, HRC Fund Associates, LLC (“HRC”), Member FINRA/SIPC, markets the Fund shares to financial intermediaries pursuant to a marketing agreement with the Investment Adviser. The marketing agreement between the Investment Adviser and HRC is not part of the Distribution Plan. The Investment Adviser pays HRC out of its own resources and without additional cost to the Fund or its shareholders. In addition, for its wholesaling activities, HRC receives sales charges from the Fund’s Distributor pursuant to a wholesaling agreement with the Fund’s Distributor. For the six months ended June 30, 2025, HRC received $42,168 in sales charges from the Fund’s Distributor for the wholesaling services.
Line of credit — The Fund has entered into a one-year credit agreement with UMB Bank, n.a. (the “Bank”), to provide for short-term financing for fund operations including share repurchases and investment opportunities. The credit agreement is divided into two parts: a committed line of credit (the “Committed Facility”) under which the Fund may borrow at its election and an uncommitted line of credit (the “Uncommitted Facility”) made available to the Fund at the Bank’s election. Loans issued under the credit agreement are secured by the assets of the Fund. Borrowings under the credit agreement bear interest at the 1-Month Secured Overnight Financing Rate (“SOFR”) plus 2.50%, annually. The Fund pays interest, origination fees and other fees and expenses in connection with loans under the credit agreement. The Fund pays the Bank an annual commitment fee (the “Commitment Fee”) on the unused portion of the Committed Facility. The credit agreement is subject to renegotiation in subsequent periods. Any interest derived from usage of the line of credit is treated as exclusive of the expense cap.
Effective December 31, 2024, the Fund's facility is a total of $150,000,000. This includes a Committed Facility of up to $75,000,000 and an Uncommitted Facility for the remaining balance. A commitment fee of 0.20% per annum will be charged on the average daily unused balance of the Committed Facility. The agreement matures on December 31, 2025.
Commitment fees for the six months ended June 30, 2025 were $75,417. The Fund did not borrow under the Facility during the year and had no outstanding balance as of June 30, 2025.
Transactions with affiliates — To the extent any affiliate of the Investment Adviser or the Fund (“Affiliated Broker”) receives any fee, payment, commission, or other financial incentive of any type (“Broker Fees”) in connection with the purchase and sale of securities by the Fund, such Broker Fees will be subject to policies and procedures adopted by the Board of Trustees pursuant to Section 17(e) and Rule 17e-1 of the 1940 Act. These policies and procedures include a quarterly review of Broker Fees by the Board of Trustees. Among other things, Section 17(e) and those procedures provide that, when acting as broker for the Fund in connection with the purchase or sale of securities to or by the Fund, an Affiliated Broker may not receive any compensation exceeding the following limits: (1) if the transaction is effected on a securities exchange, the compensation may not exceed the “usual and customary broker’s commission” (as defined in Rule 17e-1 under the 1940 Act); (2) in the case of the purchase of securities by the Fund in connection with a secondary distribution, the compensation cannot exceed 2% of the sale price; and (3) the compensation for
24
|
THE PRIVATE SHARES FUND |
|
Notes to the Financial Statements (Continued) June 30, 2025 (Unaudited) |
|
2. Significant accounting policies — (continued) |
transactions otherwise effected cannot exceed 1% of the purchase or sale price. Rule 17e-1 defines a “usual and customary broker’s commission” as one that is fair compared to the commission received by other brokers in connection with comparable transactions involving similar securities being purchased or sold on an exchange during a comparable period of time. Notwithstanding the foregoing, no Affiliated Broker will receive any undisclosed fees from the Fund in connection with any transaction involving the Fund and such Affiliated Broker, and to the extent any transactions involving the Fund are effected by an Affiliated Broker, such Affiliated Broker’s Broker Fees for such transactions shall be limited in accordance with Section 17(e)(2) of the 1940 Act and the Fund’s policies and procedures concerning Affiliated Brokers. The Fund did not conduct any transactions with an Affiliated Broker for the six months ended June 30, 2025.
The Fund has implemented certain written policies and procedures to ensure that the Fund does not engage in any transactions with any prohibited affiliates. Under the 1940 Act, the Board of Trustees has a duty to evaluate, and shall oversee the analysis of, all conflicts of interest involving the Fund and its affiliates, and shall do so in accordance with the aforementioned policies and procedures.
Investments in special purpose vehicles/private funds — Special purpose vehicles (“SPVs”) consist of an investment by the Fund in an entity that invests directly in the common or preferred stock of a Portfolio Company. Investments in SPVs are generally valued using the same fair value techniques for the securities held by the Fund once the investment has been made by the SPV into the underlying Portfolio Company and are categorized as Level 3 of the fair value hierarchy. The investments in an SPV that have yet to purchase the underlying securities are held at cost and are categorized in Level 3 of the fair value hierarchy. The investments in private funds are measured using net asset value as a practical expedient and are not categorized within the fair value hierarchy.
Segment information — Effective for the period ended June 30, 2025, the Fund has adopted Accounting Standards Update (ASU) 2023-07, “Segment Reporting (Topic 280): Improvements to Reportable Segment Disclosures” (ASU 2023-07), in these financial statements. The adoption of ASU 2023-07 has resulted in additional disclosures, as described below, but did not have a material impact on the amounts recognized in the financial statements.
ASU 2023-07, among other things, (i) requires a single segment public entity to provide all of the disclosures as required by Topic 280, (ii) requires a public entity to disclose the title and position of the Chief Operating Decision Maker (CODM) and an explanation of how the CODM uses the reported measure(s) of segment profit or loss in assessing segment performance and deciding how to allocate resources and (iii) provides the ability for a public entity to elect more than one performance measure.
The Fund operates through a single operating and reporting segment. The Fund’s CODM is its Principal Executive Officer and President, Kevin Moss. Mr. Moss reviews the financial information by way of the Fund’s portfolio composition (Schedule of Investments), total returns, expense ratios and changes in net assets (i.e. changes in net assets resulting from operations, subscriptions and redemptions), which are used by the CODM to assess performance versus the Fund’s comparative benchmarks to make resource allocation decisions for the Fund. The financial information is consistent with that presented within the Fund’s accompanying financial statements.
25
|
THE PRIVATE SHARES FUND |
|
Notes to the Financial Statements (Continued) June 30, 2025 (Unaudited) |
|
3. Fair value measurements |
GAAP defines fair value, establishes a three-tier framework for measuring fair value based on a hierarchy of inputs, and expands disclosure about fair value measurements. It also provides guidance on determining when there has been a significant decrease in the volume and level of activity for an asset or liability, when a transaction is not orderly and how that information must be incorporated into a fair value measurement. The hierarchy distinguishes between market data obtained from independent sources (observable inputs) and the Fund’s own market assumptions (unobservable inputs). These inputs are used in determining the fair value of the Fund’s investments. These inputs are summarized in the three broad levels listed below:
• Level 1 — quoted prices for active markets for identical securities. An active market for the security is a market in which transactions occur with sufficient frequency and volume to provide pricing information on an ongoing basis. A quoted price in an active market provides the most reliable evidence of fair value.
• Level 2 — other significant observable inputs (including quoted prices for similar securities, interest rates, prepayment speeds, credit risk, etc. and quoted prices for identical or similar assets in markets that are not active). Inputs that are derived principally from or corroborated by observable market data. An adjustment to any observable input that is significant to the fair value may render the measurement a Level 3 measurement.
• Level 3 — significant unobservable inputs, including the Fund’s own assumptions in determining the fair value of investments.
For the six months ended June 30, 2025, there were transfers of $25,604,770 (cost basis) out of Level 3 investments.
The following is a description of the valuation techniques applied to the Fund’s major categories of assets and liabilities measured at fair value on a recurring basis. There were no changes to the valuation approaches or techniques applied to the assessment of fair value for the Fund’s common stock in private companies, preferred stock in private companies, warrants of private companies, convertible notes of private companies, simple agreement for future equity of private companies and special purpose vehicles/private funds during the six months ended June 30, 2025. The Fund may engage a third-party provider in the valuation of the Portfolio Company securities.
Securities traded on a national exchange (or reported on the NYSE and NASDAQ national market) are stated at the last reported sales price on the day of valuation. To the extent these securities are actively traded, and valuation adjustments are not applied, they are categorized in Level 1 of the fair value hierarchy. Stocks traded on inactive markets or valued by reference to similar instruments which are marketable and to the extent the inputs are observable and timely, are categorized in Level 2 of the fair value hierarchy.
The Fund’s portfolio holdings are primarily in Level 3 investments. As they are not publicly traded, and many are subject to restrictions on resale, the investments are less liquid than publicly traded securities, resulting in increased liquidity risk to the Fund.
The Fund’s portfolio investments will generally not be in publicly traded securities. Investments for which observable market prices in active markets do not exist are reported at fair value, as determined in good faith by the Investment Adviser under consistently applied policies and procedures approved by the Board of Trustees in accordance with GAAP. The Board has designated the Investment Adviser to be the Valuation Designee to prepare Portfolio Company valuations. The Valuation Designee has adopted appropriate segregation protocols to minimize the Fund portfolio managers’ influence on the Adviser’s Fair Value process.
Investments in private operating companies may consist of common stock, preferred stock, and debt of privately owned portfolio companies. At each measurement date, the Fund reviews the valuation of each investment and records adjustments as necessary to reflect the expected exit value of the investment under current market conditions. Ongoing reviews by the Fund’s management are based on an assessment of the type of investment, the stage in the lifecycle of the portfolio company, and trends in the performance and credit profile of each portfolio company as of the measurement date. The Fund generally values private operating companies using the company’s most recent round of equity financing. As the validity of this value is inevitably eroded over time, the Fund will
26
|
THE PRIVATE SHARES FUND |
|
Notes to the Financial Statements (Continued) June 30, 2025 (Unaudited) |
|
3. Fair value measurements — (continued) |
take a market approach to value such portfolio companies. In certain instances, the Fund may use multiple valuation approaches for a particular investment and estimate its fair value based on a weighted average or a selected outcome within a range of multiple valuation results. The decision to use a valuation approach will depend on the investment type and the information available. The market approach includes valuation techniques that use observable market data (e.g., current trading and/or acquisition multiples) of comparable companies and applying the data to key financial metrics of the investment. The comparability (as measured by size, growth profile, and geographic concentration, among other factors) of the identified set of comparable companies to the investment is considered in applying the market approach. The Option Pricing Model treats a portfolio company’s common stock and preferred stock as call options on the enterprise or equity value of the portfolio company, with exercise or strike prices based on the characteristics of each series or class of equity in the portfolio company’s capital structure (e.g., the liquidation preference of a given series of preferred stock). This method is sensitive to certain key assumptions, such as volatility and time to exit, that are not observable. This information may not be available because it is difficult to obtain financial and other information with respect to private companies. In considering the extent and nature of information utilized in the valuation process, management will generally apply a greater weighting to that information which is recent and observable. Because such valuations are inherently uncertain and may be based on estimates, the determinations of fair value may differ materially from the values that would be assessed if a readily available market for these securities existed. Based on these factors, the investments in private companies will generally be presented as a Level 3 investment. Changes in accounting standards, such as the recent change in revenue recognition policies, may not be adopted consistently by issuers or at the same time, and as a result varied implementation may make it more difficult for the Fund to properly evaluate or compare financial information provided by Portfolio Companies of the Fund or to determine the validity of data of publicly traded company comparables for purposes of valuing the Fund’s portfolio holdings.
The inputs or methodology used for valuing securities are not necessarily an indication of the risk associated with investing in those securities. The following is a summary of the inputs used to determine fair value of the Fund’s investments as of June 30, 2025:
|
Investment in Securities |
Level 1 |
Level 2 |
Level 3 |
Investments |
Total |
||||||||||
|
|
|
|
|
|
|||||||||||
|
Security Type* |
|
|
|
|
|
||||||||||
|
Common stock in public companies |
$ |
— |
$ |
82,134,501 |
$ |
— |
$ |
— |
$ |
82,134,501 |
|||||
|
Common stock in private companies |
|
— |
|
— |
|
368,955,424 |
|
— |
|
368,955,424 |
|||||
|
Preferred stock in private companies |
|
— |
|
— |
|
383,157,141 |
|
— |
|
383,157,141 |
|||||
|
Convertible notes of private companies |
|
— |
|
— |
|
41,608,698 |
|
— |
|
41,608,698 |
|||||
|
Units of private companies |
|
— |
|
— |
|
193,857 |
|
— |
|
193,857 |
|||||
|
Warrants of private companies |
|
— |
|
— |
|
630,575 |
|
— |
|
630,575 |
|||||
|
Special purpose vehicles |
|
— |
|
— |
|
67,701,636 |
|
— |
|
67,701,636 |
|||||
|
Simple agreement for future equity of private companies |
|
— |
|
— |
|
250,000 |
|
— |
|
250,000 |
|||||
|
Private funds |
|
— |
|
— |
|
— |
|
4,478,179 |
|
4,478,179 |
|||||
|
Short-term investments |
|
45,306,372 |
|
— |
|
— |
|
— |
|
45,306,372 |
|||||
|
Total |
$ |
45,306,372 |
$ |
82,134,501 |
$ |
862,497,331 |
$ |
4,478,179 |
$ |
994,416,383 |
|||||
____________
* All sub-categories within the security type represent their respective evaluation status. For a detailed breakout by industry, please refer to the Schedule of Investments.
27
|
THE PRIVATE SHARES FUND |
|
Notes to the Financial Statements (Continued) June 30, 2025 (Unaudited) |
|
3. Fair value measurements — (continued) |
The following is a rollforward of the activity in investments in which significant unobservable inputs (Level 3) were used in determining fair value on a recurring basis:
|
Beginning |
Transfers |
Transfers |
Purchases or |
(Sales or |
Net |
Change in net |
Ending |
Change in |
||||||||||||||||||||||||
|
The Private Shares Fund |
||||||||||||||||||||||||||||||||
|
Common stock in private companies |
$ |
410,482,457 |
$ |
— |
$ |
(2,604,825 |
) |
$ |
17,990,068 |
1 |
$ |
— |
$ |
(3,057,263 |
) |
$ |
(53,855,013 |
) |
$ |
368,955,424 |
$ |
(53,855,013 |
) |
|||||||||
|
Preferred stock in private companies |
400,150,070 |
— |
(22,999,945 |
) |
12,526,401 |
2 |
(22,982,809 |
)1,2 |
(8,247,384 |
) |
24,710,808 |
383,157,141 |
24,854,809 |
|||||||||||||||||||
|
Convertible notes of private companies |
38,120,050 |
— |
— |
1,724,193 |
3 |
— |
— |
1,764,455 |
41,608,698 |
1,764,455 |
||||||||||||||||||||||
|
Units of private companies |
193,857 |
— |
— |
— |
— |
— |
— |
193,857 |
— |
|||||||||||||||||||||||
|
Warrants of private companies |
1,366,370 |
— |
— |
— |
— |
(153,658 |
) |
(582,137 |
) |
630,575 |
(582,137 |
) |
||||||||||||||||||||
|
Special purpose vehicles |
62,272,182 |
— |
— |
187,877 |
— |
— |
5,241,577 |
67,701,636 |
(5,241,578 |
) |
||||||||||||||||||||||
|
Simple agreement for future equity of private companies |
250,000 |
— |
— |
|
— |
— |
— |
250,000 |
— |
|||||||||||||||||||||||
|
$ |
912,834,986 |
$ |
— |
$ |
(25,604,770 |
) |
$ |
32,428,539 |
$ |
(22,982,809 |
) |
$ |
(11,458,305 |
) |
$ |
(22,720,310 |
) |
$ |
862,497,331 |
$ |
(33,059,465 |
) |
||||||||||
____________
1 Amounts include a cost basis of $17,931,449 in common stock in private companies converted from a cost basis of $17,931,449 in preferred stock in private companies.
2 Amounts include a cost basis of $3,090,000 in preferred stock in private companies converted from a cost basis of $3,090,000 in preferred stock in private companies.
3 Amounts include $724,193 in accrued interest on the convertible notes of private companies.
28
|
THE PRIVATE SHARES FUND |
|
Notes to the Financial Statements (Continued) June 30, 2025 (Unaudited) |
|
3. Fair value measurements — (continued) |
The following is a summary of quantitative information about significant unobservable valuation inputs for Level 3 Fair Value Measurements for investments held as of June 30, 2025:
|
Type of Level 3 Investment |
Fair Value as of |
Valuation |
Unobservable |
Range (Wt. Avg.) |
|||||
|
|
|||||||||
|
Common stock in private companies |
$ |
368,955,424 |
Precedent Transactions |
Precedent Transactions |
N/A |
||||
|
|
Market Comparable Companies |
Enterprise Value/Revenue Multiples |
0.75 - 23.41 (7.22) |
||||||
|
|
Market Movement |
-87.21% - 53.08% (-17.98%) |
|||||||
|
|
Discounts For Lack of Marketability |
15.06% - 22.63% (20.16%) |
|||||||
|
Preferred stock in private companies |
|
383,157,141 |
Precedent Transactions |
Precedent Transactions |
N/A |
||||
|
|
Market Comparable Companies |
Enterprise Value/Revenue Multiples |
0.75 - 23.41 (6.04) |
||||||
|
|
Market Movement |
-87.21% - 68.05% (-10.81%) |
|||||||
|
|
Discounts For Lack of Marketability |
7.95% - 21.32% (9.37%) |
|||||||
|
Convertible notes of private companies |
|
41,608,698 |
Precedent Transactions |
Precedent Transactions |
N/A |
||||
|
|
Option Pricing Model |
Industry Volatility |
60.00% - 65.00% (60.68%) |
||||||
|
|
Estimated Time to Exit |
0.29 - 3.30 (1.17) Years |
|||||||
|
|
Risk-Free Interest Rate |
3.86% - 4.33% (4.26%) |
|||||||
|
Units of private companies |
|
193,857 |
Precedent Transactions |
Precedent Transactions |
N/A |
||||
|
Warrants of private companies |
|
630,575 |
Option Pricing Model |
Industry Volatility |
42.84% - 47.06% (43.39%) |
||||
|
|
Estimated Time to Exit |
1.97 - 6.79 (5.85) Years |
|||||||
|
|
Risk-Free Interest Rate |
3.90% - 4.19% (4.12%) |
|||||||
|
Special purpose vehicles |
|
67,701,636 |
Precedent Transactions |
Precedent Transactions |
N/A |
||||
|
|
Market Comparable Companies |
Enterprise Value/Revenue Multiples |
0.55 - 10.01 (5.65) |
||||||
|
|
Market Movement |
-37.38% - 9.81% (-23.93%) |
|||||||
|
Simple agreement for future equity of private companies |
|
250,000 |
Precedent Transactions |
Precedent Transactions |
N/A |
||||
____________
* Market approach
** Changes in the significant unobservable inputs used to determine an investment’s value can significantly affect its fair value. Generally, an increase in these inputs will lead to a higher fair value, except for changes in the discount for lack of marketability, which have the opposite effect on fair value.
4. Expense limitation agreement
The Investment Adviser has contractually agreed to waive management fees and/or reimburse the Fund for expenses the Fund incurs, but only to the extent necessary to maintain the Fund’s total annual operating expenses after fee waivers and/or reimbursement (exclusive of any taxes, interest expense, commitment fees, legal fees or other expenses related to any borrowing or leverage incurred by the Fund, brokerage commissions, acquired fund fees and expenses, and extraordinary expenses, such as litigation or
29
|
THE PRIVATE SHARES FUND |
|
Notes to the Financial Statements (Continued) June 30, 2025 (Unaudited) |
|
4. Expense limitation agreement — (continued) |
reorganization costs, but inclusive of organizational costs and offering costs) to an annual rate of 2.65%, 2.40%, and 2.90% (each, an “Expense Limit”) of the average daily net assets of the Fund (the “Expense Limitation Agreement”) attributable to Class A, Class I and Class L Shares, respectively, until May 2, 2026. Prior to May 1, 2023, the Expense Limit was 2.50%, 2.25% and 2.75% of the average daily net assets of the Fund attributable to Class A, Class I and Class L shares, respectively.
Under the Expense Limitation Agreement, the Investment Adviser is permitted to seek reimbursement for any fees previously waived and/or expenses previously assumed, to the extent that such reimbursement will not cause Class A, Class I or Class L Shares’ annualized expenses to exceed the lesser of the current Expense Limitation or the Expense Limitation in place at the time of the waiver and/or assumption of expenses. The Fund is not obligated to reimburse the Investment Adviser for fees previously waived or expenses previously assumed by the Investment Adviser more than three years after the date of such waiver or expense reimbursement. The Advisor may only recoup fees previously waived prior to May 1, 2023 so long as the resulting expense ratio does not exceed the expense limitation annual rates in place during the same time that the waivers were incurred. For the years ended December 31, 2022, December 31, 2023, and December 31, 2024 the Investment Adviser waived investment advisory fees and/or reimbursed expenses in the amount of $441,827, $390,590, and $572,088, respectively, in the aggregate across all share classes. For the year ended December 31, 2022, Class A and Class L had recognized net recoupment of $184,461 and $5,663, respectively, and Class I had recognized a net waiver/reimbursement of $631,951. For the year ended December 31, 2023, Class A and Class L had recognized net recoupment of $199,187 and $4,383, respectively, and Class I had recognized a net waiver/reimbursement of $594,159. For the year ended December 31, 2024, Class A and Class L had recognized net recoupment of $144,908 and $2,358, respectively, and Class I had recognized a net waiver/reimbursement of $719,354. The remaining unrecouped amounts of $474,978, $430,367, and $595,765, relating to Class I specifically, are subject to possible recoupment by the Investment Adviser through December 31, 2025, December 31, 2026, and December 31, 2027, respectively.
5. Investment advisory agreement
The Fund has entered into an Investment Advisory Agreement with the Investment Adviser, pursuant to which the Investment Adviser provides general investment advisory services for the Fund. For providing these services, the Investment Adviser receives a fee from the Fund, accrued daily and paid monthly in arrears, at an annual rate equal to 1.90% of the Fund’s average daily net assets. For the six months ended June 30, 2025, the Fund incurred $9,324,925 in investment advisory fees, of which $1,922,875 is payable at June 30, 2025.
Certain Officers of the Fund are also employees of the Investment Adviser. None of the Fund Officers who are affiliated with the Investment Adviser receives any compensation from the Fund.
6. Capital share transactions
The Fund is offering an unlimited number of shares on a continuous basis at NAV. The value per share of the relevant class is calculated after receipt of the purchase, in good order, plus any applicable sales load.
As of June 30, 2025, ownership from affiliated parties represents 0.02% of the Fund.
The Fund’s shares are not redeemable each business day, are not listed for trading on an exchange, and no secondary market currently exists for Fund shares. As an interval fund and as described in the Fund’s prospectus, the Fund will make quarterly repurchase offers of 5% of the total number of shares outstanding at its NAV, unless postponed in accordance with regulatory requirements, and each repurchase pricing shall occur no later than the 14th day after the repurchase request deadline, or the next business day if the 14th day is not a business day. Rule 23c-3 of the 1940 Act permits repurchases between 5% and 25% of the Fund’s outstanding shares at NAV.
30
|
THE PRIVATE SHARES FUND |
|
Notes to the Financial Statements (Continued) June 30, 2025 (Unaudited) |
|
6. Capital share transactions — (continued) |
In every full quarter since the commencement of operations, the Fund has offered shareholders the opportunity to participate in this program. During the six months ended June 30, 2025, the Fund had Repurchase Offers as follows:
|
Repurchase Offer |
Repurchase Request |
Repurchase Pricing |
Repurchase Offer |
% of Shares |
Number of Shares |
|||||
|
February 25, 2025 |
March 21, 2025 |
March 21, 2025 |
5% |
5% |
1,209,914 |
|||||
|
May 27, 2025 |
June 20, 2025 |
June 20, 2025 |
5% |
5% |
1,197,892 |
7. Purchases and sales of securities
Purchases and sales of securities for the six months ended June 30, 2025, were $14,146,458 and $5,051,360, respectively.
8. Federal tax information
At June 30, 2025, gross unrealized appreciation and depreciation of investments based on cost for federal income tax purposes were as follows:
|
Cost of investments |
$ |
752,439,467 |
|
|
|
Gross unrealized appreciation |
$ |
365,983,145 |
|
|
|
Gross unrealized depreciation |
|
(124,006,229 |
) |
|
|
Net unrealized appreciation on investments |
$ |
241,976,916 |
|
As of December 31, 2024, the components of accumulated earnings on a tax basis were as follows:
|
Undistributed ordinary income |
$ |
— |
|
|
|
Undistributed long-term capital gains |
|
— |
|
|
|
Tax accumulated earnings |
|
— |
|
|
|
Accumulated capital and other losses |
|
(17,414,288 |
) |
|
|
Net unrealized gain |
|
205,451,236 |
|
|
|
Payable for withholding attributed to profit sharing agreement |
|
(44,493 |
) |
|
|
Total accumulated earnings |
$ |
187,992,455 |
|
9. Commitments and contingencies
In the normal course of business, the Fund will enter into contracts that contain a variety of representations, provide general indemnifications, set forth termination provisions and compel the contracting parties to arbitration in the event of dispute. From time to time, the Fund may be a party to arbitration, or legal proceedings, in the ordinary course of business, including proceedings relating to the enforcement of provisions of such contracts. The Fund’s maximum exposure under these arrangements is unknown, as this would involve future claims that may be made against the Fund that would be subject to arbitration, generally.
In the normal course of business, the Fund may enter into agreements to purchase and sell investments. Such agreements are subject to certain rights of the issuers and ultimately, issuer approval. At June 30, 2025, the Fund had entered into agreements to purchase equity securities totaling $5,000,002 and no agreements had been entered into to sell existing securities.
At June 30, 2025, the Fund reasonably believes its assets will provide adequate coverage to satisfy all its unfunded commitments. The Fund’s policies and procedures prohibit it from entering into an unfunded commitment unless it has reserved enough cash and/or short-term investments to meet the funding requirements thereof. At June 30, 2025, the Fund had total unfunded capital commitments of $550,000 for investments in special purpose vehicles/private funds.
10. Offering price per share
A maximum front-end sales load of 5.75% for Class A shares and 4.25% for Class L is imposed on purchases. Class I shares are not subject to sales charge. For the six months ended June 30, 2025, various broker dealers received $211,394 of sales charges from sales of the Fund’s shares.
31
|
THE PRIVATE SHARES FUND |
|
Notes to the Financial Statements (Continued) June 30, 2025 (Unaudited) |
11. Investment risks
Investments in Portfolio Companies — Investment in Portfolio Companies involves a number of significant risks, including: Portfolio Companies may have limited financial resources and may be unable to meet their obligations with their existing working capital, which may lead to equity financings, possibly at discounted valuations, in which our holdings could be substantially diluted if we do not or cannot participate, bankruptcy or liquidation and the reduction or loss of our investment; Portfolio Companies typically have limited operating histories, less established and comprehensive product lines and smaller market shares than larger businesses, which tend to render them more vulnerable to competitors’ actions, market conditions and consumer sentiment in respect of their products or services, as well as general economic downturns; Because Portfolio Companies are privately owned, there is usually little publicly available information about these businesses; therefore, although the Investment Adviser and its agents perform due diligence on these Portfolio Companies, their operations and their prospects, including review of independent research reports and market valuations of securities of such companies on alternative trading systems and other private secondary markets, the Investment Adviser may not be able to obtain all of the material information that would be generally available for public company investments, including financial or other information regarding the Portfolio Companies in which we invest. Furthermore, there can be no assurance that the information that we do obtain with respect to any investment is reliable. The Fund will invest in Portfolio Companies for which current, up-to-date financial information is not available if the Investment Adviser determines, based on the results of its due diligence review, that such investment is in the best interests of the Fund and its Shareholders.; Portfolio Companies are more likely to depend on the management talents and efforts of a small group of persons; therefore, the death, disability, resignation or termination of one or more of these persons could have a material adverse impact on a Portfolio Company and, in turn, on us; and Portfolio Companies generally have less predictable operating results, may from time to time be parties to litigation, may be engaged in rapidly changing businesses with products subject to a substantial risk of obsolescence, and may require substantial additional capital to support their operations, finance expansion or maintain their competitive position.
Valuation — The Fund’s NAV is based on the value of its securities. Where reliable public market prices are available for those securities, the Investment Adviser will rely on those prices. However, in light of its investment strategy to invest in private, operating, late-stage, growth companies, the Fund expects that in most cases (other than subsequent to an IPO transaction involving a Portfolio Company) public market prices will not be available for the Fund’s portfolio securities, and where private market prices are available, such prices may be unreliable. At any point in time, there may be limited or no recent purchase or sale transactions or offers on private markets on which to base the value of a given private share. In addition, the prices reflected in recent private transactions or offers may be extremely sensitive to changes in supply or demand, including changes fueled by investor perceptions or other conditions.
In these cases, which the Fund expects will be in most circumstances, the Fund’s investments will be valued by the Investment Adviser, under the supervision of the Board of Trustees, pursuant to fair valuation procedures and methodologies approved by the Board of Trustees. While the Fund and the Investment Adviser use good faith efforts to determine the fair value of the Fund’s securities, value will be dependent on the judgment of the Investment Adviser. The Investment Adviser may also rely to some extent on information provided by the Portfolio Companies, which may not be timely or comprehensive. In addition, such information may not be available because it is difficult to obtain financial and other information with respect to private companies, and even where the Fund is able to obtain such information, there can be no assurance that it is complete or accurate. The Investment Adviser may also take into consideration valuations of similar classes of private company securities as publicly reported by other funds. From time to time, the Fund may determine that it should modify its assumptions as new information becomes available. As a consequence, the value of the securities, and therefore the Fund’s NAV, may vary. This may adversely affect Shareholders. The Fund may also not be able to sell these securities at the prices at which they are carried on the Fund’s books, or may have to delay their sale in order to do so. This may in turn adversely affect the Fund’s NAV.
Market Risk — The value of, and the income generated by, the securities in which the Fund invests may decline, sometimes rapidly or unpredictably, due to factors affecting certain issuers, particular industries or sectors or the overall markets, such as inflation (or expectations for inflation), deflation (or expectations for deflation), interest rates, global demand for particular products or resources, market instability, debt crises and downgrades, embargoes, tariffs, sanctions and other trade barriers, regulatory events, other governmental trade or market control programs and related geopolitical events. In addition, the value of the Fund’s investments may be negatively affected by the occurrence of global events such as war, terrorism, environmental disasters, natural disasters or events, exchange trading suspensions and closures, and infectious disease outbreaks or pandemics.
32
|
THE PRIVATE SHARES FUND |
|
Notes to the Financial Statements (Continued) June 30, 2025 (Unaudited) |
|
11. Investment risks — (continued) |
Availability of Investment Opportunities — The business of identifying and structuring investments of the types contemplated by the Fund is competitive and involves a high degree of uncertainty. The availability of investment opportunities generally is subject to market conditions as well as, in some cases, the prevailing regulatory or political climate. No assurance can be given that the Fund will be able to identify and complete attractive investments in the future or that it will be able to fully invest its assets. Similarly, identification of attractive investment opportunities by the Investment Adviser is difficult and involves a high degree of uncertainty. Even if an attractive investment opportunity is identified by an Investment Adviser, it may not be permitted to take advantage of the opportunity to the fullest extent desired.
12. Recent market and economic developments
Social, political, economic and other conditions and events (such as natural disasters, epidemics and pandemics, terrorism, conflicts and social unrest) that occur from time to time will create uncertainty and may have significant impacts on issuers, industries, governments and other systems, including the financial markets, to which the Fund and the issuers in which it invests are exposed. As global systems, economies and financial markets are increasingly interconnected, events that once had only local impact are now more likely to have regional or even global effects. Events that occur in one country, region or financial market will, more frequently, adversely impact issuers in other countries, regions or markets, including in established markets such as the United States. These impacts can be exacerbated by failures of governments and societies to adequately respond to an emerging event or threat.
Recent examples of the above include conflict between Russia and Ukraine in Europe and Hamas and Israel in the Middle East and the Houthi movement’s attacks on ships in the Red Sea and retaliatory actions by the United States and other countries. Such conflicts may destabilize parts of Europe and the Middle East for prolonged periods of time and could escalate and draw in additional countries. Conflicts and related actions taken by governments or other organizations have the potential to adversely affect regional and global economies including those that the Fund invests in. These conflicts and other conflicts that could occur in the future could negatively affect the value and liquidity of the Fund’s investments.
13. Subsequent events
In preparing these financial statements, management has evaluated subsequent events through the date of issuance of the financial statements included herein and has determined that there are no subsequent events that require disclosure or adjustment to the financial statements.
33
Proxy voting — A description of the policies and procedures that the Fund uses to determine how to vote proxies relating to portfolio securities and information regarding how the Fund voted proxies during the 12-month period ended June 30 are available without charge upon request by (1) calling the Fund at 1-855-551-5510; (2) on the Fund’s website (www.privatesharesfund.com); (3) by emailing theprivatesharesfund@umb.com; and (4) from Fund documents filed with the Securities and Exchange Commission (“SEC”) on the SEC’s website at www.sec.gov.
Portfolio holdings — The Fund files its complete schedule of portfolio holdings with the SEC for the first and third quarters of each fiscal year on form N-PORT-P. The Fund’s Form N-PORT-P is available on the SEC’s website at http://sec.gov. You may also obtain copies by calling the Fund at 1-855-551-5510.
Change in the independent registered public accounting firm —
(a) Previous independent registered public accounting firm: On May 28, 2025, the Fund, on the recommendation of the Audit Committee and by action of the Board, dismissed KPMG LLP (“KPMG”) as the independent registered public accounting firm to the Fund. KPMG ceased to provide audit services to the Fund on May 28, 2025.
The audit reports of KPMG on the financial statements of the Fund as of and for the years ended December 31, 2024 and 2023 did not contain any adverse opinion or disclaimer of opinion, nor were they qualified or modified as to uncertainty, audit scope, or accounting principles.
During the two fiscal years ended December 31, 2024 and 2023 and the subsequent interim period through May 28, 2025, there were no: (i) disagreements with KPMG on any matter of accounting principles or practices, financial statement disclosure, or auditing scope or procedures, which disagreements if not resolved to the satisfaction of KPMG would have caused them to make reference in connection with their opinion to the subject matter of the disagreement, or (ii) “reportable events” as that term is described in Item 304(a)(1)(v) of Regulation S-K, except that management of the Fund and KPMG identified a material weakness specific to the Fund’s design and operation of controls relating to the valuation of a private equity investment in accordance with U.S. GAAP. Specifically, for one of the portfolio investments, Management ascribed a higher weighting to unobservable inputs than to available observable inputs in determining fair value for the financial statements for the year ended December 31, 2022.
The Fund provided KPMG with a copy of the foregoing disclosures and requested that KPMG furnish the Fund with a letter addressed to the U.S. Securities and Exchange Commission stating whether KPMG agrees with the above statements.
(b) New independent registered public accounting firm: On May 20, 2025, the Fund, on the recommendation of the Audit Committee and by action of the Board, approved Grant Thornton LLP (“GT”) to serve as the independent registered public accounting firm to audit the financial statements of the Fund for the fiscal year ending December 31, 2025. During the fiscal years ended December 31, 2024 and December 31, 2023 and the subsequent interim period through May 20, 2025, neither the Fund nor anyone on behalf of the Fund consulted GT on items that concerned (a) the application of accounting principles to a specified transaction, either completed or proposed, or the type of audit opinion that might be rendered on the Fund’s financial statements, or (b) the subject of a disagreement (as defined in paragraph (a)(1)(iv) of Item 304 of Regulation S-K and related instructions) or reportable events (as described in paragraph (a)(1)(v) of Item 304 of Regulation S-K).
34
![]()
Board of Trustees
Robert Boulware
Mark Radcliffe
Daniel A. Doyle
Herb W. Morgan
Timothy Reick
Investment Adviser
Liberty Street Advisors, Inc.
88 Pine Street, 31st Floor, Suite 3101
New York, NY 10005
Dividend Paying Agent, Transfer Agent
UMB Fund Services
235 West Galena Street
Milwaukee, WI 53212
Custodian
UMB Bank National Association
1010 Grand Boulevard
Kansas City, MO 64106
Distributor
Foreside Fund Services, LLC
Three Canal Plaza, Suite 100
Portland, ME 04101
Independent Auditors
Grant Thornton LLP
171 N Clark Street, Suite 200
Chicago, IL 60601
This report has been prepared for the general information of the shareholders. It is not authorized for distribution to prospective investors unless preceded or accompanied by a current prospectus. The Fund’s prospectus contains more complete information about the objectives, policies, expenses and risks of the Funds. The Fund is not a bank deposit, not FDIC insured and may lose value. Please read the prospectus carefully before investing or sending money.
This report contains certain forward looking statements which are subject to known and unknown risks and uncertainties that could cause actual results to differ materially from those expressed or implied by such statements. Forward looking statements generally include words such as ‘‘believes’’, ‘‘expects’’, ‘‘anticipates’’ and other words of similar import. Such risks and uncertainties include, among other things, the Risk Factors noted in the Fund’s filings with the Securities and Exchange Commission. The Fund undertakes no obligation to update any forward looking statement.
(b) There were no notices transmitted to stockholders in reliance on Rule 30e-3 under the Investment Company Act of 1940, as amended, that contained disclosures specified by paragraph (c)(3) of that rule.
Item 2. Code of Ethics.
Not applicable to semi-annual reports.
Item 3. Audit Committee Financial Expert.
Not applicable to semi-annual reports.
Item 4. Principal Accountant Fees and Services.
Not applicable to semi-annual reports.
Item 5. Audit Committee of Listed Registrants.
Not applicable.
Item 6. Schedule of Investments.
(a) Included as part of the report to shareholders filed under Item 1(a) of this Form N-CSR.
(b) Not applicable
Item 7. Financial Statements and Financial Highlights for Open-End Management Investment Companies.
Not applicable.
Item 8. Changes in and Disagreements with Accountants for Open-End Management Investment Companies.
Not applicable.
Item 9. Proxy Disclosures for Open-End Management Investment Companies.
Not applicable.
Item 10. Remuneration Paid to Directors, Officers, and Others of Open-End Management Investment Companies.
Not applicable.
Item 11. Statement Regarding Basis for Approval of Investment Advisory Contract.
Not applicable.
Item 12. Disclosure of Proxy Voting Policies and Procedures for Closed-End Management Investment Companies.
Not applicable to semi-annual reports.
Item 13. Portfolio Managers of Closed-End Management Investment Companies.
(a) Not applicable to semi-annual reports.
(b) There has been no change, as of the date of this filing, in any of the portfolio managers identified in response to paragraph (a)(1) of this Item in the registrant’s most recently filed annual report on Form N-CSR.
Item 14. Purchases of Equity Securities by Closed-End Management Investment Company and Affiliated Purchasers.
REGISTRANT PURCHASES OF EQUITY SECURITIES
Class A: Period | (a) Total Number of Shares (or Units) Purchased | (b) Average Price Paid per Share (or Unit) | (c) Total Number of Shares (or Units) Purchased as Part of Publicly Announced Plans or Programs | (d) Maximum Number (or Approximate Dollar Value) of Shares (or Units) that May Yet Be Purchased Under the Plans or Programs | ||||||||||||
| Jan. 1-31, 2025 | 0 | 0 | 0 | 0 | ||||||||||||
| Feb. 1-28, 2025 | 0 | 0 | 0 | 0 | ||||||||||||
| Mar. 1-31, 2025 | 213,722 | $ | 41.57 | 0 | 0 | |||||||||||
| Apr. 1-30, 2025 | 0 | 0 | 0 | 0 | ||||||||||||
| May. 1-31, 2025 | 0 | 0 | 0 | 0 | ||||||||||||
| Jun. 1-30, 2025 | 176,786 | $ | 43.53 | 0 | 0 | |||||||||||
| Jul. 1-31, 2025 | 0 | 0 | 0 | 0 | ||||||||||||
| Aug. 1-31, 2025 | 0 | 0 | 0 | 0 | ||||||||||||
| Sep. 1-30, 2025 | 0 | 0 | 0 | 0 | ||||||||||||
| Oct. 1-31, 2025 | 0 | 0 | 0 | 0 | ||||||||||||
| Nov. 1-30, 2025 | 0 | 0 | 0 | 0 | ||||||||||||
| Dec. 1-31, 2025 | 0 | 0 | 0 | 0 | ||||||||||||
| Total | 390,508 | $ | 42.46 | 0 | 0 | |||||||||||
Class I: Period | (a) Total Number of Shares (or Units) Purchased | (b) Average Price Paid per Share (or Unit) | (c) Total Number of Shares (or Units) Purchased as Part of Publicly Announced Plans or Programs | (d) Maximum Number (or Approximate Dollar Value) of Shares (or Units) that May Yet Be Purchased Under the Plans or Programs | ||||||||||||
| Jan. 1-31, 2025 | 0 | 0 | 0 | 0 | ||||||||||||
| Feb. 1-28, 2025 | 0 | 0 | 0 | 0 | ||||||||||||
| Mar. 1-31, 2025 | 995,595 | $ | 42.37 | 0 | 0 | |||||||||||
| Apr. 1-30, 2025 | 0 | 0 | 0 | 0 | ||||||||||||
| May. 1-31, 2025 | 0 | 0 | 0 | 0 | ||||||||||||
| Jun. 1-30, 2025 | 1,017,010 | $ | 44.40 | 0 | 0 | |||||||||||
| Jul. 1-31, 2025 | 0 | 0 | 0 | 0 | ||||||||||||
| Aug. 1-31, 2025 | 0 | 0 | 0 | 0 | ||||||||||||
| Sep. 1-30, 2025 | 0 | 0 | 0 | 0 | ||||||||||||
| Oct. 1-31, 2025 | 0 | 0 | 0 | 0 | ||||||||||||
| Nov. 1-30, 2025 | 0 | 0 | 0 | 0 | ||||||||||||
| Dec. 1-31, 2025 | 0 | 0 | 0 | 0 | ||||||||||||
| Total | 2,012,605 | $ | 43.40 | 0 | 0 | |||||||||||
Class L: Period | (a) Total Number of Shares (or Units) Purchased | (b) Average Price Paid per Share (or Unit) | (c) Total Number of Shares (or Units) Purchased as Part of Publicly Announced Plans or Programs | (d) Maximum Number (or Approximate Dollar Value) of Shares (or Units) that May Yet Be Purchased Under the Plans or Programs | ||||||||||||
| Jan. 1-31, 2025 | 0 | 0 | 0 | 0 | ||||||||||||
| Feb. 1-28, 2025 | 0 | 0 | 0 | 0 | ||||||||||||
| Mar. 1-31, 2025 | 597 | $ | 40.80 | 0 | 0 | |||||||||||
| Apr. 1-30, 2025 | 0 | 0 | 0 | 0 | ||||||||||||
| May. 1-31, 2025 | 0 | 0 | 0 | 0 | ||||||||||||
| Jun. 1-30, 2025 | 4,096 | $ | 42.70 | 0 | 0 | |||||||||||
| Jul. 1-31, 2025 | 0 | 0 | 0 | 0 | ||||||||||||
| Aug. 1-31, 2025 | 0 | 0 | 0 | 0 | ||||||||||||
| Sep. 1-30, 2025 | 0 | 0 | 0 | 0 | ||||||||||||
| Oct. 1-31, 2025 | 0 | 0 | 0 | 0 | ||||||||||||
| Nov. 1-30, 2025 | 0 | 0 | 0 | 0 | ||||||||||||
| Dec. 1-31, 2025 | 0 | 0 | 0 | 0 | ||||||||||||
| Total | 4,693 | $ | 42.46 | 0 | 0 | |||||||||||
On February 25, 2025 and May 27, 2025, the Registrant offered to repurchase 1,209,914 and 1,197,892 shares, respectively, pursuant to its periodic repurchase plan.
Item 15. Submission of Matters to a Vote of Security Holders.
There have been no material changes to the procedures by which the shareholders may recommend nominees to the registrant’s board of directors, where those changes were implemented after the registrant last provided disclosure in response to the requirements of Item 407(c)(2)(iv) of Regulation S-K (17 CFR 229.407) (as required by Item 22(b)(15) of Schedule 14A (17 CFR 240.14a-101)), or this Item.
Item 16. Controls and Procedures.
| (a) | The Registrant’s Principal Executive Officer and Principal Financial Officer have reviewed the Registrant's disclosure controls and procedures (as defined in Rule 30a-3(c) under the Investment Company Act of 1940, as amended, (the “Act”)) as of a date within 90 days of the filing of this report, as required by Rule 30a-3(b) under the Act. Based on their review, such officers have concluded that the disclosure controls and procedures were effective in ensuring that information required to be disclosed in this report was appropriately recorded, processed, summarized and reported and made known to them by others within the Registrant and by the Registrant’s service providers. |
| (b) | There were no changes in the Registrant’s internal control over financial reporting (as defined in Rule 30a-3(d) under the Act (17 CFR 270.30a-3(d)) that occurred during the period covered by this report that materially affected, or were reasonably likely to materially affect, the Registrant’s internal control over financial reporting. |
Item 17. Disclosure of Securities Lending Activities for Closed-End Management Investment Companies.
The Fund has not engaged in Security Lending Activities.
Item 18. Recovery of Erroneously Awarded Compensation.
(a) Not applicable
(b) Not applicable
Item 19. Exhibits.
| (a) (1) | Code of ethics. Not applicable to semi-annual reports. |
| (a) (2) | Any policy required by the listing standards adopted pursuant to Rule 10D-1 under the Securities Exchange Act of 1934 by the registered national securities exchange or registered national securities association upon which the registrant’s securities are listed. Not applicable. |
| (a) (3) | Certifications required pursuant to Rule 30a-2(a) under the 1940 Act and Section 302 of the Sarbanes-Oxley Act of 2002. Filed herewith. |
| (a) (4) | Any written solicitation to purchase securities under Rule 23c-1 under the Act sent or given during the period covered by the report by or on behalf of the registrant to 10 or more persons. Not applicable. |
| (a) (5) | Change in the registrant’s independent public accountant is attached hereto. |
| (b) | Certification pursuant to Rule 30a-2(a) under the 1940 Act and Section 906 of the Sarbanes-Oxley Act of 2002. Filed herewith. |
SIGNATURES
Pursuant to the requirements of the Securities Exchange Act of 1934 and the Investment Company Act of 1940, the Registrant has duly caused this report to be signed on its behalf by the undersigned, thereunto duly authorized.
The Private Shares Fund
| By: | /s/ Kevin Moss | |
| Kevin Moss | ||
| President | ||
| September 8, 2025 |
Pursuant to the requirements of the Securities Exchange Act of 1934 and the Investment Company Act of 1940, this report has been signed below by the following persons on behalf of the Registrant and in the capacities and on the dates indicated.
| By: | /s/ Kevin Moss | |
| By: Kevin Moss | ||
| President | ||
| (Principal Executive Officer) | ||
| September 8, 2025 |
| By: | /s/ Jack Sweeney | |
| Jack Sweeney | ||
| Principal Financial Officer | ||
| September 8, 2025 |