
RESOURCE REIT, INC.
TABLE OF CONTENTS
| Company Information | 3 | |||||||
| Forward-Looking Statements | 4 | |||||||
| Presentation of Operating Data and Financial Information | 4 | |||||||
| Third Quarter 2021 Financial Results | 6 | |||||||
| Consolidated Balance Sheets – As reported on Form 10-Q (filed November 12, 2021) | 11 | |||||||
| Consolidated Statements of Operations – As reported on Form 10-Q (filed November 12, 2021) | 12 | |||||||
| Supplemental and Combined Consolidated Statements of Operations | 13 | |||||||
| Supplemental and Combined Financial & Operating Highlights | 14 | |||||||
| Supplemental and Combined FFO & Core FFO Reconciliation | 15 | |||||||
| Supplemental and Combined Adjusted EBITDA Reconciliation and Interest Coverage Ratio | 16 | |||||||
| Supplemental and Combined Same Store Portfolio Net Operating Income Reconciliation | 17 | |||||||
| Supplemental and Combined Same Store Portfolio Net Operating Income by State |
18 | |||||||
| Supplemental and Combined Same Store Portfolio Net Operating Income by State |
19 | |||||||
| Supplemental Portfolio Information | 20 | |||||||
| Supplemental Mortgage Notes Payable Summary Information | 21 | |||||||
| Supplemental Debt Summary | 22 | |||||||
| Supplemental Debt Covenants and Encumbered Asset Information | 23 | |||||||
| Supplemental and Combined Capital Analysis | 24 | |||||||
| Supplemental and Combined Capital Expenditures | 25 | |||||||
| Non-GAAP Financial Measures and Other Definitions | 26 | |||||||
2
RESOURCE REIT, INC.
Resource REIT, Inc.
September 30, 2021
Company Information:
Resource REIT, Inc. (“RRE” or the “Company”) is a real estate investment trust that owns and operates multifamily apartment properties across the United States. RRE’s targeted portfolio consists primarily of suburban “Class B” multifamily assets in highly desirable submarkets of growth-oriented MSAs. After the acquisition of a new multifamily apartment property, the Company often seeks to invest additional capital in the property to enhance its marketability and value (properties receiving additional capital are referred to herein as “value add properties”). In addition, the Company may invest in other real estate assets or debt secured by real estate assets. The Company continually monitors the composition and performance of its portfolio of optimized, renovated properties and pursues sales opportunities that will maximize returns for stockholders. More information may be found on the Company’s website at www.resourcereit.com, under the “Investor Relations” tab.
Corporate Headquarters
1845 Walnut Street, 17th Floor
Philadelphia, PA 19103
212 546-5005
3
RESOURCE REIT, INC.
Forward-Looking Statements
This supplement contains certain forward-looking statements within the meaning of Section 27A of the Securities Act of 1933, as amended, and Section 21E of the Securities Exchange Act of 1934, as amended. The Company intends such forward-looking statements to be covered by the safe harbor provisions for forward-looking statements contained in the Private Securities Litigation Reform Act of 1995 and includes this statement for purposes of complying with these safe harbor provisions. Forward-looking statements relate to expectations, beliefs, projections, future plans and strategies, anticipated events or trends and similar expressions concerning matters that are not historical facts. In some cases, you can identify forward-looking statements by terms such as “anticipate,” “believe,” “could,” “estimate,” “expects,” “intend,” “may,” “plan,” “potential,” “project,” “should,” “will” and “would” or the negative of these terms or other comparable terminology. You should not rely on forward-looking statements since they involve known and unknown risks, uncertainties and other factors which are, in some cases, beyond the Company’s control and which could materially affect its results of operations, financial condition, cash flows, performance or future achievements or events. Factors that could cause actual results to differ materially from these expectations include, but are not limited to, the risks discussed in the Company’s Annual Report on Form 10-K for the year ended December 31, 2020, as updated by the Company’s subsequent reports filed with the Securities and Exchange Commission, including the continuing adverse effect of the current pandemic of the novel coronavirus (“COVID-19”) on the financial condition, results of operations, cash flows and performance of the Company, its tenants and the real estate market, global economy and financial markets generally. See “COVID-19 Pandemic” below. Actual results may differ materially from those contemplated by such forward-looking statements. Readers are cautioned not to place undue reliance on these forward-looking statements, which speak only as of the date hereof. The Company undertakes no obligation to publicly revise or update these forward-looking statements to reflect events or circumstances after the date of this supplement, except as may be required under applicable law.
Presentation of Operating Data and Financial Information
On January 28, 2021, Resource Real Estate Opportunity REIT, Inc. (“REIT I”), Resource Real Estate Opportunity REIT II, Inc. (“REIT II”) and Resource Apartment REIT III, Inc. (“REIT III”) completed the mergers described in Note 1 of the Company’s Quarterly Report on Form 10-Q for the quarter ended September 30, 2021 (collectively, the “Merger”). In the Merger, the Company (f/k/a REIT II) was the legal acquirer and REIT I was the accounting acquirer for financial reporting purposes.
Historical Financial Results
The Company’s historical unaudited Consolidated Balance Sheets as of September 30, 2021 and December 31, 2020 and Consolidated Statements of Operations for the three and nine months ended September 30, 2021 and 2020 (all as reported in the Company’s Quarterly Report on Form 10-Q for the quarter ended September 30, 2021) included herein present the actual financial condition and results of operations for REIT I prior to the Merger closing on January 28, 2021 and the combined entity for periods after the Merger closing. For this reason, the historical period to period comparisons may not be meaningful as the Merger represents a significant business combination for the Company.
Supplemental and Combined Financial Results
The Company’s “supplemental” unaudited financial information included herein presents: (i) the Company’s actual financial condition as of March 31, 2021, June 30, 2021 and September 30, 2021 and (ii) supplemental results of operations for the Company for the three months ended March 31, 2021 and June 30, 2021 and the three and nine months ended September 30, 2021, as if the Merger occurred on January 1, 2021. The Company’s “combined” unaudited financial information included herein presents the combined financial condition and results of operations for REIT I, REIT II and REIT III as of and for the three and nine months ended September 30, 2020 (as aggregated from the information reported in their respective Quarterly Reports on Form 10-Q for the quarter ended September 30, 2020). The information in this supplement has been prepared to give effect to the Merger as if it occurred on January 1, 2021, such that for the period from January 1, 2021 through January 28, 2021, the actual results of operations for REIT II and REIT III have been combined with the actual results of operations for REIT I during the period immediately prior to the Merger, depreciation and amortization and amortization of fair value adjustments related to assumed debt at the Merger have been adjusted to
4
RESOURCE REIT, INC.
reflect the Merger as of January 1, 2021, and the information for the period after January 28, 2021 reflects the actual results of the combined company. The information in this supplement does not reflect pro forma financial statements as prepared in compliance with Article 11 of Regulation S-X as it does not reflect the Merger as of the earliest date reported (January 1, 2020). The combined information for periods during 2020 is presented on a combined basis whereby the combined financial condition and results of operations for REIT I, REIT II and REIT III have been aggregated based upon the financial information reported by each respective company in its Quarterly Report on Form 10-Q for those periods, adjusted for the removal of related party revenue and expense between the parties which eliminates upon consolidation. Management believes the supplemental and combined period to period comparisons may be more meaningful to investors as it presents financial information for all three companies which merged into the Company.
5
RESOURCE REIT, INC.
Resource REIT, Inc.
Third Quarter 2021 Financial Results
Operating Data and Financial Results
Third Quarter Highlights
| · | Net loss attributable to common stockholders of ($6.1) million, or ($0.04) per common share-diluted, for the three months ended September 30, 2021, as compared to a net loss attributable to common stockholders of ($7.7) million, or ($0.09) per common share-diluted, for the three months ended September 30, 2020. |
| · | Total rental income increased 89% to $63.0 million for the three months ended September 30, 2021, as compared to $33.3 million for the three months ended September 30, 2020. |
| · | Redeemed $67.5 million of 7% participating Preferred OP Units on September 14, 2021. |
| · | Quarterly dividend of $0.07 per share of common stock paid on September 30, 2021. |
Key Financial Measures
| · | The table below sets forth the Company’s net loss attributable to common stockholders, FFO and Core FFO, each on a per share basis, for the three and nine months ended September 30, 2021 and 2020: |
| Three Months Ended | Nine Months Ended | |||||||||||||||
|
|
|
|
|
|||||||||||||
| Per Share | September 30, 2021 | September 30, 2020 | September 30, 2021 | September 30, 2020 | ||||||||||||
|
|
|
|
|
|||||||||||||
| Net loss - diluted |
$ | (0.04) | $ | (0.09) | $ | (0.11) | $ | (0.27) | ||||||||
| FFO - diluted |
$ | 0.10 | $ | 0.06 | $ | 0.20 | $ | 0.18 | ||||||||
| Core FFO - diluted |
$ | 0.12 | $ | 0.08 | $ | 0.32 | $ | 0.22 | ||||||||
Please see the section entitled “Non-GAAP Financial Measures and Other Definitions” in this supplement for definitions of capitalized terms. Definitions of non-GAAP financial measures, including FFO and Core FFO, are included together with reconciliations of such measures to the Consolidated Statements of Operations.
Supplemental and Combined Operating Data and Financial Results
Results below are presented on a supplemental basis for the three months ended March 31, 2021 and June 30, 2021 and the three and nine months ended September 30, 2021, as if the Merger occurred on January 1, 2021, and a combined basis for the three and nine months ended September 30, 2020:
Financial Results
| · | Supplemental net loss attributable to common stockholders of ($5.3) million, or ($0.03) per common share-diluted, for the three months ended September 30, 2021, as compared to a combined net loss attributable to common stockholders of ($19.8) million, or ($0.13) per common share-diluted, for the three months ended September 30, 2020. |
| · | Supplemental FFO increased 242% to $16.9 million, or $0.11 per common share-diluted, for the three months ended September 30, 2021, as compared to combined FFO of $5.0 million, or $0.03 per common share-diluted, for the three months ended September 30, 2020. |
| · | Supplemental Core FFO increased 73% to $18.6 million, or $0.12 per common share-diluted, for the three months ended September 30, 2021, as compared to combined Core FFO of $10.7 million, or $0.07 per common share-diluted, for the three months ended September 30, 2020. |
6
RESOURCE REIT, INC.
| · | Supplemental Adjusted EBITDA increased 36% to $29.9 million for the three months ended September 30, 2021, as compared to a combined Adjusted EBITDA of $21.9 million for the three months ended September 30, 2020. |
Portfolio Performance
| · | Supplemental Rental income grew 5.0% to $63.0 million for the three months ended September 30, 2021, as compared to combined rental income of $59.9 million for the three months ended September 30, 2020. |
| · | Supplemental Same Store NOI before property management fees increased 18.2% to $37.3 million for the three months ended September 30, 2021, as compared to combined Same Store NOI before property management fees of $31.6 million for the three months ended September 30, 2020. |
| · | Supplemental Same Store property operating margin before property management fees improved 560 basis points to 59.2% for the three months ended September 30, 2021, as compared to a combined Same Store property operating margin before property management fees of 53.6% for the three months ended September 30, 2020. |
| · | Supplemental Portfolio occupancy increased 170 basis points to 95.1% and supplemental portfolio average rent increased 6.5% to $1,369 for the three months ended September 30, 2021, as compared to combined results of 93.4% portfolio occupancy and portfolio average rent of $1,286, respectively, for the three months ended September 30, 2020. |
Please see the section entitled “Non-GAAP Financial Measures and Other Definitions” in this supplement for definitions of capitalized terms. Definitions of non-GAAP financial measures, including FFO and Core FFO, are included together with reconciliations of such measures to the Consolidated Statements of Operations.
7
RESOURCE REIT, INC.
Same Store Property Operating Results
The table below reflects supplemental Same Store property results for the three months ended June 30, 2021 and the three and nine months ended September 30, 2021 and combined Same Store property results for the three and nine months ended September 30, 2020:
| (Dollars in thousands, except rent per unit) | Three Months Ended | Nine Months Ended | Three Months Ended | |||||||||||||||||||||||||
| Sept 30, 2021 |
Sept 30, 2020 |
Variance | Sept 30, 2021 |
Sept 30, 2020 |
Variance | June 30, 2021 |
||||||||||||||||||||||
|
|
|
|||||||||||||||||||||||||||
| Operating Results: |
||||||||||||||||||||||||||||
| Rental income (1) |
$ | 62,934 | $ | 58,833 | 7.0% | $ | 183,879 | $ | 175,965 | 4.5% | $ | 61,002 | ||||||||||||||||
| Property operating expenses (1) |
25,649 | 27,279 | -6.0% | 77,343 | 76,915 | 0.6% | 25,782 | |||||||||||||||||||||
|
|
|
|
|
|
|
|
|
|
|
|||||||||||||||||||
| Net operating income (“NOI”) before property management fees (2) |
37,285 | 31,554 | 18.2% | 106,536 | 99,050 | 7.6% | 35,220 | |||||||||||||||||||||
| Property management fees |
1,696 | 2,369 | -28.4% | 4,958 | 7,564 | -34.5% | 1,650 | |||||||||||||||||||||
|
|
|
|
|
|
|
|
|
|
|
|||||||||||||||||||
| Net operating income after property management fees (2) |
35,589 | 29,185 | 21.9% | 101,578 | 91,486 | 11.0% | 33,570 | |||||||||||||||||||||
| Average Occupancy |
95.1% | 93.4% | 1.7% | 95.0% | 92.9% | 2.1% | 95.2% | |||||||||||||||||||||
| Net effective rent per occupied unit |
$ | 1,369 | $ | 1,293 | 5.9% | $ | 1,339 | $ | 1,301 | 3.0% | $ | 1,334 | ||||||||||||||||
| NOI Margin before property management fees (%) |
59.2% | 53.6% | 5.6% | 57.9% | 56.3% | 1.6% | 57.7% | |||||||||||||||||||||
| NOI Margin after property management fees (%) |
56.5% | 49.6% | 6.9% | 55.2% | 52.0% | 3.2% | 55.0% | |||||||||||||||||||||
(1) Excludes activity for Non-Same Store properties.
(2) Same Store portfolio consists of 49 properties, which represent 14,643 units, for the three months ended June 30, 2021 and three and nine months ended September 30, 2021 and 2020, respectively.
Please see the section entitled “Non-GAAP Financial Measures and Other Definitions” in this supplement for definitions of non-GAAP financial measures, including NOI.
COVID-19 Pandemic
One of the most significant risks and uncertainties facing the Company and the real estate industry generally continues to be the effect of the ongoing public health crisis of the novel coronavirus disease (“COVID-19”) pandemic. The Company continues to closely monitor the impact of the COVID-19 pandemic on all aspects of its business, including how the pandemic is impacting its tenants. The Company did not incur significant disruptions from the COVID-19 pandemic during the three and nine months ended September 30, 2021; however, a small percentage of its tenants requested a rent deferral as a result of the pandemic. The Company evaluates each tenant rent deferral request on an individual basis, considering a number of factors. Not all tenant requests have or will ultimately result in modified agreements, nor is the Company forgoing its contractual rights under its lease agreements. There are no executed short-term rent deferral plans outstanding at September 30, 2021.
The extent to which the COVID-19 pandemic impacts the Company’s operations and those of its tenants depends on future developments, which cannot be predicted with confidence, including the scope, severity and duration of the pandemic, the actions taken to contain the pandemic or mitigate its impact, and the direct and indirect economic effects of the pandemic and containment measures. The Company is unable to predict the ultimate impact that the pandemic will have on its financial condition, results of operations and cash flows due to numerous uncertainties.
8
RESOURCE REIT, INC.
During the three months ended September 30, 2021, the Company’s net bad debt was $522,000. The table below presents additional details on the supplemental components of bad debt for the three months ended June 30, 2021 and September 30, 2021 and combined components of bad debt for the three months ended September 30, 2020:
| Components of Bad Debt (1) | Q3 2021 | Q3 2020 | Q2 2021 | |||||||||||||||||||||
| (Dollars in thousands) | Amount | Percentage | Amount | Percentage | Amount | Percentage | ||||||||||||||||||
|
|
||||||||||||||||||||||||
| Operating Results: |
||||||||||||||||||||||||
| Charge-offs |
$ | 773 | 1.2% | $ | 445 | 0.7% | $ | 557 | 0.9% | |||||||||||||||
| Bad Debt Recoveries |
(200) | -0.3% | (170) | -0.3% | (233) | -0.4% | ||||||||||||||||||
| Provision for bad debt |
(51) | -0.1% | 725 | 1.2% | 584 | 0.9% | ||||||||||||||||||
|
|
|
|
|
|
|
|
|
|
|
|
|
|||||||||||||
| Net bad debt |
522 | 0.8% | 1,000 | 1.6% | 908 | 1.4% | ||||||||||||||||||
(1) Percentages are a percentage of total rental income. Bad Debt is recorded as a reduction to rental income in our consolidated statements of operations.
Portfolio Operating Statistics
The table below reflects the supplemental Portfolio Operating Statistics for the three months ended June 30, 2021 and September 30, 2021 and combined Portfolio Operating Statistics for the three months ended September 30, 2020:
| (Dollars in thousands, except rent per unit) | Q3 2021 |
Q3 2020 |
Q2 2021 |
|||||||||
|
|
||||||||||||
| Rental income |
$ | 62,961 | $ | 59,947 | $ | 62,105 | ||||||
| Property operating expenses |
25,640 | 27,782 | 26,345 | |||||||||
|
|
|
|
|
|
|
|||||||
| Net operating income before property management fees |
37,321 | 32,165 | 35,760 | |||||||||
| Property management fees |
1,696 | 2,415 | 1,679 | |||||||||
|
|
|
|
|
|
|
|||||||
| Net operating income after property management fees |
35,625 | 29,750 | 34,081 | |||||||||
| NOI Margin before property management fees (%) |
59.3% | 53.7% | 57.6% | |||||||||
| NOI Margin after property management fees (%) |
56.6% | 49.6% | 54.9% | |||||||||
| Collections - 30 day |
95.3% | 98.6% | 95.6% | |||||||||
| Total rent collected, as a percentage of rent billed (1) |
96.6% | N/A | 98.1% | |||||||||
| Average occupancy |
95.1% | 93.5% | 95.2% | |||||||||
| Net effective rent per occupied unit |
$ | 1,369 | $ | 1,286 | $ | 1,325 | ||||||
| Resident retention rate |
57.6% | 54.4% | 51.7% | |||||||||
(1) Includes rents collected for all periods presented through September 30, 2021.
Please see the section entitled “Non-GAAP Financial Measures and Other Definitions” in this supplement for definitions of non-GAAP financial measures, including NOI.
Disposition Activity
During the three months ended September 30, 2021, the Company entered into agreements to sell four properties, The Retreat at Rocky Ridge, Tech Center Square, The Brookwood and Pines of York. The Company completed the sale of each of these properties in October / November 2021 and received gross sale proceeds totaling $152.4 million. These rental properties represented 936 units with locations in Birmingham, Alabama, Newport News, VA, Homewood, AL and Yorktown, VA. The Company expects to recognize a gain on sale from these transactions during the quarter ended December 31, 2021.
In October 2021, the Company entered into agreements to sell Maxwell Townhomes, located in San Antonio, Texas and The Bryant at Yorba Linda, located in Yorba Linda, California. The Company expects both transactions to close in the first quarter of 2022 and to recognize a gain on sale.
9
RESOURCE REIT, INC.
Financial Liquidity
As of September 30, 2021, the Company had a total liquidity position of approximately $188.1 million, which includes $107.2 million of unrestricted cash and $80.9 million of additional capacity under the Company’s secured revolving credit facility.
Capital Expenditures – Supplemental (Same Store)
For the three months ended September 30, 2021, recurring capital expenditures were $2.4 million, or $162 per unit, non-recurring capital expenditures were $890,000, or $61 per unit, and value-add capital expenditures were $1.2 million, or $80 per unit. For the nine months ended September 30, 2021, recurring capital expenditures were $4.4 million, or $301 per unit, non-recurring capital expenditures were $4.5 million, or $305 per unit, and value-add capital expenditures were $2.3 million, or $159 per unit.
Distributions
On September 23, 2021, the Company’s Board of Directors declared a cash distribution of $0.07 per share for the third quarter of 2021, which was paid on September 30, 2021 to stockholders of record at the close of business on September 29, 2021.
Selected Financial Information
See the tables on the following pages for selected financial information for Resource REIT, Inc.
10
RESOURCE REIT, INC.
The following tables present the historical financial statements reported in the Company’s Quarterly Report on Form 10-Q for the quarter ended September 30, 2021 (filed November 12, 2021):
Resource REIT, Inc.
Consolidated Balance Sheets
(in thousands, except share data)
| September 30, 2021 | December 31, 2020 | |||||||||||
| (unaudited) | ||||||||||||
| ASSETS |
||||||||||||
| Investments: |
||||||||||||
| Rental properties, net |
$ | 2,039,963 | $ | 897,975 | ||||||||
| Identified intangible assets, net |
— | 5 | ||||||||||
| Assets held for sale - rental properties |
75,215 | — | ||||||||||
| Total investments |
2,115,178 | 897,980 | ||||||||||
| Cash |
107,224 | 70,015 | ||||||||||
| Restricted cash |
19,976 | 14,769 | ||||||||||
| Subtotal- cash and restricted cash |
127,200 | 84,784 | ||||||||||
| Due from related parties |
— | 2,763 | ||||||||||
| Tenant receivables, net of allowance of $2,259 and $774, respectively |
974 | 516 | ||||||||||
| Prepaid expenses and other assets |
10,192 | 6,000 | ||||||||||
| Goodwill |
154,667 | 154,935 | ||||||||||
| Operating lease right-of-use assets |
2,726 | 3,180 | ||||||||||
| Total assets |
$ | 2,410,937 | $ | 1,150,158 | ||||||||
| LIABILITIES AND EQUITY |
||||||||||||
| Liabilities: |
||||||||||||
| Mortgage notes payable, net |
$ | 1,550,464 | $ | 825,986 | ||||||||
| Accounts payable and accrued expenses |
21,078 | 12,677 | ||||||||||
| Accrued real estate taxes |
20,759 | 7,370 | ||||||||||
| Due to related parties |
— | 20,245 | ||||||||||
| Tenant prepayments |
2,227 | 1,210 | ||||||||||
| Security deposits |
5,201 | 2,860 | ||||||||||
| Operating lease liabilities |
2,761 | 3,190 | ||||||||||
| Total liabilities |
$ | 1,602,490 | $ | 873,538 | ||||||||
| Equity: |
||||||||||||
| Preferred stock, par value $.01; 10,000,000 shares authorized, none issued |
— | — | ||||||||||
| Common stock, par value $.01; 1,000,000,000 shares authorized; 165,636,606 and 86,075,442 shares issued and outstanding (including 1,055,589 and 790,272 of unvested restricted shares, respectively)
|
|
1,656
|
|
|
861
|
| ||||||
| Convertible stock; par value $.01; 50,000 shares authorized; 50,000 and 49,935 shares issued and outstanding, respectively |
1 | 1 | ||||||||||
| Additional paid-in capital |
1,326,572 | 618,074 | ||||||||||
| Accumulated other comprehensive income (loss) |
(111 | ) | (391 | ) | ||||||||
| Accumulated deficit |
(519,671 | ) | (469,736 | ) | ||||||||
| Total stockholders’ equity |
808,447 | 148,809 | ||||||||||
| Noncontrolling interest |
— | 127,811 | ||||||||||
| Total equity |
808,447 | 276,620 | ||||||||||
| Total liabilities and equity |
$ | 2,410,937 | $ | 1,150,158 | ||||||||
11
RESOURCE REIT, INC.
Resource REIT, INC.
Consolidated Statements of Operations
(in thousands, except per share data)
(unaudited)
| Three Months Ended | Nine Months Ended | |||||||||||||||||||||
| September 30, | September 30, | |||||||||||||||||||||
|
|
|
|
|
|
| |||||||||||||||||
| 2021 | 2020 | 2021 | 2020 | |||||||||||||||||||
| Revenues: |
||||||||||||||||||||||
| Rental income |
$ | 62,961 | $ | 33,258 | $ | 178,466 | $ | 99,625 | ||||||||||||||
| Property management fee income - related parties |
— | 289 | 342 | 289 | ||||||||||||||||||
| Asset management fee income - related parties |
— | 702 | 833 | 702 | ||||||||||||||||||
| Other revenue |
— | — | 37 | — | ||||||||||||||||||
| Total revenues |
62,961 | 34,249 | 179,678 | 100,616 | ||||||||||||||||||
| Expenses: |
||||||||||||||||||||||
| Property operating expenses |
17,013 | 10,652 | 48,824 | 28,911 | ||||||||||||||||||
| Real estate taxes |
7,292 | 4,033 | 22,477 | 12,864 | ||||||||||||||||||
| Acquisition costs |
— | — | — | 113 | ||||||||||||||||||
| Property management fees - third party |
1,696 | 392 | 5,017 | 392 | ||||||||||||||||||
| Property management fees- related party |
— | 1,124 | — | 4,071 | ||||||||||||||||||
| Asset Management fees - related party |
— | 2,335 | — | 8,518 | ||||||||||||||||||
| Transaction costs |
— | 1,849 | — | 1,849 | ||||||||||||||||||
| Casualty loss |
454 | 18 | 1,372 | 221 | ||||||||||||||||||
| General and administrative- Property related |
1,335 | 954 | 3,982 | 2,640 | ||||||||||||||||||
| General and administrative- Corporate |
5,207 | 1,972 | 18,454 | 5,332 | ||||||||||||||||||
| Loss on disposal of assets |
188 | 142 | 606 | 363 | ||||||||||||||||||
| Depreciation and amortization expense |
24,128 | 12,760 | 75,178 | 38,927 | ||||||||||||||||||
| Total expenses |
57,313 | 36,231 | 175,910 | 104,201 | ||||||||||||||||||
| Income (loss) before other income (expense) |
5,648 | (1,982 | ) | 3,768 | (3,585 | ) | ||||||||||||||||
| Other income (expense): |
||||||||||||||||||||||
| Interest expense |
(10,774 | ) | (5,632 | ) | (36,204 | ) | (19,772 | ) | ||||||||||||||
| Interest income |
— | 42 | 21 | 141 | ||||||||||||||||||
| Gain on sale of rental property |
— | — | 18,734 | — | ||||||||||||||||||
| Gain on sale of land easement |
— | 20 | — | 310 | ||||||||||||||||||
| Insurance proceeds in excess of cost basis |
80 | 3 | 241 | 39 | ||||||||||||||||||
| Total other income (expense) |
(10,694 | ) | (5,567 | ) | (17,208 | ) | (19,282 | ) | ||||||||||||||
| Loss before income taxes |
(5,046 | ) | (7,549 | ) | (13,440 | ) | (22,867 | ) | ||||||||||||||
| Provision for income taxes |
— | — | (206 | ) | — | |||||||||||||||||
| Net loss |
$ | (5,046 | ) | $ | (7,549 | ) | $ | (13,646 | ) | $ | (22,867 | ) | ||||||||||
| Redemption of preferred OP units |
(342 | ) | — | (342 | ) | — | ||||||||||||||||
| Preferred return to preferred OP unit holders |
(921 | ) | (286 | ) | (3,161 | ) | (286 | ) | ||||||||||||||
| Net loss after preferred return |
(6,309 | ) | (7,835 | ) | (17,149 | ) | (23,153 | ) | ||||||||||||||
| Less: Allocation of income to preferred unit holders attributable to noncontrolling interest |
47 | 6 | 158 | 6 | ||||||||||||||||||
| Less: Net loss attributable to noncontrolling interest |
188 | 171 | 696 | 171 | ||||||||||||||||||
| Net loss attributable to common stockholders |
$ | (6,074 | ) | $ | (7,658 | ) | $ | (16,295 | ) | $ | (22,976 | ) | ||||||||||
| Weighted average common shares outstanding- basic |
158,320 | 85,598 | 150,202 | 85,533 | ||||||||||||||||||
| Weighted average common shares outstanding- diluted
|
|
158,320
|
|
|
85,598
|
|
|
150,202
|
|
|
85,533
|
| ||||||||||
| Net loss per common share- BASIC |
$ | (0.04 | ) | $ | (0.09 | ) | $ | (0.11 | ) | $ | (0.27 | ) | ||||||||||
| Net loss per common share- DILUTED |
$ | (0.04 | ) | $ | (0.09 | ) | $ | (0.11 | ) | $ | (0.27 | ) | ||||||||||
12
RESOURCE REIT, INC.
The following tables present supplemental results for the three months ended June 30, 2021 and the three and nine months ended September 30, 2021 (as if the Merger occurred on January 1, 2021) and combined results for the three and nine months ended September 30, 2020 (combined results of REIT I, REIT II and REIT III as reported in their respective Quarterly Reports on Form 10-Q for the quarter ended September 30, 2020, adjusted for the removal of related party revenue and expense between the parties which eliminates upon consolidation):
Resource REIT, INC.
Supplemental and Combined Consolidated Statements of Operations
(in thousands, except per share data)
(unaudited)
| Three Months Ended September 30, |
Nine Months Ended September 30, |
|
Three Months Ended June 30, |
|||||||||||||||||||||||||||||||
| 2021 (1) | 2020 (2) | 2021 (1) | 2020 (2) | 2021 (1) | ||||||||||||||||||||||||||||||
| Revenues: |
||||||||||||||||||||||||||||||||||
| Rental income |
$ | 62,961 | $ | 59,947 | $ | 186,136 | $ | 179,294 | $ | 62,105 | ||||||||||||||||||||||||
| Other revenue |
- | - | 37 | - | - | |||||||||||||||||||||||||||||
| Total revenues |
62,961 | 59,947 | 186,173 | 179,294 | 62,105 | |||||||||||||||||||||||||||||
| Expenses: |
||||||||||||||||||||||||||||||||||
| Property operating expenses |
17,013 | 18,502 | 50,677 | 50,078 | 16,923 | |||||||||||||||||||||||||||||
| Real estate taxes |
7,292 | 7,582 | 23,567 | 23,698 | 7,960 | |||||||||||||||||||||||||||||
| General and administrative - Property related |
1,335 | 1,698 | 4,137 | 4,449 | 1,462 | |||||||||||||||||||||||||||||
| Property operating expenses before property management fees |
25,640 | 27,782 | 78,381 | 78,225 | 26,345 | |||||||||||||||||||||||||||||
| Property management fees - third party |
1,696 | 392 | 5,017 | 392 | 1,679 | |||||||||||||||||||||||||||||
| Property management fees - related party |
- | 2,023 | - | 7,317 | - | |||||||||||||||||||||||||||||
| Property operating expenses including property management fees |
27,336 | 30,197 | 83,398 | 85,934 | 28,024 | |||||||||||||||||||||||||||||
| Acquisition costs |
- | - | - | 113 | - | |||||||||||||||||||||||||||||
| Management fees - related party |
- | 4,504 | - | 16,282 | - | |||||||||||||||||||||||||||||
| Transaction costs |
- | 5,573 | 7,822 | 5,573 | - | |||||||||||||||||||||||||||||
| Casualty Loss |
454 | (412 | ) | 1,378 | 690 | 618 | ||||||||||||||||||||||||||||
| General and administrative - Corporate |
5,207 | 3,625 | 18,974 | 10,657 | 5,413 | |||||||||||||||||||||||||||||
| Loss on disposal of assets |
188 | 218 | 614 | 732 | 308 | |||||||||||||||||||||||||||||
| Depreciation and amortization expense |
23,298 | 25,030 | 79,103 | 75,903 | 27,302 | |||||||||||||||||||||||||||||
| Total expenses |
56,483 | 68,735 | 191,289 | 195,884 | 61,665 | |||||||||||||||||||||||||||||
| Income (loss) before other income (expense) |
6,478 | (8,788 | ) | (5,116 | ) | (16,590 | ) | 440 | ||||||||||||||||||||||||||
| Other income (expense): |
||||||||||||||||||||||||||||||||||
| Interest expense |
(10,774 | ) | (10,965 | ) | (37,624 | ) | (37,879 | ) | (10,898 | ) | ||||||||||||||||||||||||
| Interest income |
- | 55 | 22 | 203 | 6 | |||||||||||||||||||||||||||||
| Gain on sale of rental property |
- | - | 18,734 | 530 | 18,734 | |||||||||||||||||||||||||||||
| Gain on sale of land easement |
- | 20 | - | 310 | - | |||||||||||||||||||||||||||||
| Insurance proceeds in excess of cost basis |
80 | 4 | 241 | 40 | 143 | |||||||||||||||||||||||||||||
| Total other income (expense) |
(10,694 | ) | (10,886 | ) | (18,627 | ) | (36,796 | ) | 7,985 | |||||||||||||||||||||||||
| Net (loss) income |
(4,216 | ) | (19,674 | ) | (23,743 | ) | (53,386 | ) | 8,425 | |||||||||||||||||||||||||
| Redemption of preferred OP units |
(342 | ) | - | (342 | ) | - | - | |||||||||||||||||||||||||||
| Preferred return to preferred OP unit holders |
(921 | ) | (286 | ) | (3,161 | ) | (286 | ) | (1,120 | ) | ||||||||||||||||||||||||
| Net (loss) income after preferred return |
(5,479 | ) | (19,960 | ) | (27,246 | ) | (53,672 | ) | 7,305 | |||||||||||||||||||||||||
| Less: Allocation of income to preferred unit holders attributable to noncontrolling interest |
47 | 6 | 150 | 6 | 52 | |||||||||||||||||||||||||||||
| Less: Net loss (income) attributable to noncontrolling interest |
157 | 171 | 1,054 | 171 | (387 | ) | ||||||||||||||||||||||||||||
| Net (loss) income attributable to common stockholders |
$ | (5,275 | ) | $ | (19,783 | ) | $ | (26,042 | ) | $ | (53,495 | ) | $ | 6,970 | ||||||||||||||||||||
| Weighted average common shares outstanding - basic (3) |
158,320 | 157,053 | 157,263 | 157,011 | 156,780 | |||||||||||||||||||||||||||||
| Weighted average common shares outstanding - diluted (3) |
158,320 | 157,053 | 157,263 | 157,011 | 156,822 | |||||||||||||||||||||||||||||
| Net (loss) income per common share - BASIC |
$ | (0.03 | ) | $ | (0.13 | ) | $ | (0.17 | ) | $ | (0.34 | ) | $ | 0.04 | ||||||||||||||||||||
| Net (loss) income per common share - DILUTED |
$ | (0.03 | ) | $ | (0.13 | ) | $ | (0.17 | ) | $ | (0.34 | ) | $ | 0.04 | ||||||||||||||||||||
(1) Assumes merger occurred on January 1, 2021.
(2) Reflects combined results of REIT I, REIT II and REIT III.
(3) Shares have been adjusted for the 2020 periods shown by the same exchange ratio used for the merger of REIT I, REIT II and REIT III.
13
RESOURCE REIT, INC.
Supplemental and Combined Financial & Operating Highlights
| (Dollars in thousands, except per share and rent per unit data) | Three Months Ended | |||||||||||||||||||||
|
September 30, 2021 |
September 30, 2020 |
June 30, 2021 |
March, 31 2021 |
|||||||||||||||||||
| Selected Financial Information |
||||||||||||||||||||||
| Operating Statistics: |
||||||||||||||||||||||
| Net income (loss) attributable to common stockholders |
$ | (5,275) | $ | (19,783) | $ | 6,970 | $ | (27,737) | ||||||||||||||
| Net income (loss) per common share - diluted |
$ | (0.03) | $ | (0.13) | $ | 0.04 | $ | (0.18) | ||||||||||||||
| Rental income |
$ | 62,961 | $ | 59,947 | $ | 62,105 | $ | 61,070 | ||||||||||||||
| Property operating expenses |
$ | 27,336 | $ | 30,197 | $ | 28,024 | $ | 28,038 | ||||||||||||||
| Net Operating Income |
$ | 35,625 | $ | 29,750 | $ | 34,081 | $ | 33,032 | ||||||||||||||
| Net Operating Income Margin (%) |
56.6% | 49.6% | 54.9% | 54.1% | ||||||||||||||||||
| Adjusted EBITDA |
$ | 29,856 | $ | 21,894 | $ | 27,891 | $ | 24,325 | ||||||||||||||
| Funds From Operations |
$ | 16,946 | $ | 4,956 | $ | 11,578 | $ | (4,766) | ||||||||||||||
| FFO per diluted share |
$ | 0.11 | $ | 0.03 | $ | 0.07 | $ | (0.03) | ||||||||||||||
| Core Funds From Operations |
$ | 18,555 | $ | 10,696 | $ | 16,206 | $ | 15,328 | ||||||||||||||
| Core FFO per share |
$ | 0.12 | $ | 0.07 | $ | 0.10 | $ | 0.10 | ||||||||||||||
| Core FFO payout ratio (%) |
62.4% | 0.0% | 68.1% | 72.0% | ||||||||||||||||||
| Dividends to common shareholders |
$ | 11,572 | $ | - | $ | 11,039 | $ | 11,029 | ||||||||||||||
| Dividends to preferred unitholders |
$ | 921 | $ | 286 | $ | 1,120 | $ | 1,120 | ||||||||||||||
| Dividends per share, per quarter (common) |
$ | 0.07 | $ | - | $ | 0.07 | $ | 0.07 | ||||||||||||||
| Dividends per share, annualized (common) |
$ | 0.28 | $ | - | $ | 0.28 | $ | 0.28 | ||||||||||||||
| Dividend yield on NAV (%) (common) |
3.1% | 0.0% | 3.1% | 3.1% | ||||||||||||||||||
| DRIP (%) |
23.4% | 0.0% | 24.2% | 22.6% | ||||||||||||||||||
| DRIP shares (1) |
314 | - | 311 | 289 | ||||||||||||||||||
| Shares redeemed (1) |
241 | - | 149 | 306 | ||||||||||||||||||
| Shares redeemed, price |
$ | 9.06 | $ | - | $ | 9.06 | $ | 9.08 | ||||||||||||||
| NAV (1), (2) |
$ | 1,497,159 | $ | 1,425,588 | $ | 1,497,159 | $ | 1,497,159 | ||||||||||||||
| NAV, per share (1), (2) |
$ | 9.06 | $ | 9.12 | $ | 9.06 | $ | 9.06 | ||||||||||||||
| Portfolio Data: |
||||||||||||||||||||||
| Total gross assets |
$ | 2,772,916 | $ | 2,599,089 | $ | 2,833,511 | $ | 2,848,794 | ||||||||||||||
| Mortgages payable, net |
$ | 1,550,464 | $ | 1,488,331 | $ | 1,554,165 | $ | 1,582,382 | ||||||||||||||
| Cash balance |
$ | 107,224 | $ | 103,846 | $ | 174,604 | $ | 147,078 | ||||||||||||||
| Total number of properties |
49 | 50 | 49 | 50 | ||||||||||||||||||
| Total units |
14,643 | 14,995 | 14,643 | 14,995 | ||||||||||||||||||
| Collections - 30 day |
95.3% | 98.6% | 95.6% | 95.2% | ||||||||||||||||||
| Total rent collected, as a percentage of rent billed (3) |
96.6% | N/A | 98.1% | 98.2% | ||||||||||||||||||
| Average occupancy |
95.1% | 93.5% | 95.2% | 94.8% | ||||||||||||||||||
| Net effective rent per occupied unit |
$ | 1,369 | $ | 1,286 | $ | 1,325 | $ | 1,307 | ||||||||||||||
| Resident retention rate |
57.6% | 54.4% | 51.7% | 53.3% | ||||||||||||||||||
| Liquidity: |
||||||||||||||||||||||
| Unrestricted cash |
$ | 107,224 | $ | 103,846 | $ | 174,604 | $ | 147,078 | ||||||||||||||
| Secured line of credit - availability |
$ | 80,884 | $ | - | $ | 76,507 | $ | - | ||||||||||||||
| Total Liquidity |
$ | 188,108 | $ | 103,846 | $ | 251,111 | $ | 147,078 | ||||||||||||||
(1) As reported, DRIP shares, shares redeemed and NAV for the three REITs combined, adjusted for the merger exchange ratio.
(2) For September 30 and June 30, 2021 above, NAV information is as of January 28, 2021.
(3) Includes rents collected for all periods presented through September 30, 2021.
14
RESOURCE REIT, INC.
Supplemental and Combined FFO & Core FFO Reconciliation
| (Dollars in thousands, except per share data) | Three Months Ended
September 30, |
Nine Months Ended
September 30, |
|
Three Months Ended
June 30, |
||||||||||||||||||||||||
| 2021 | 2020 | 2021 | 2020 | 2021 | ||||||||||||||||||||||||
| Funds From Operations (FFO): |
||||||||||||||||||||||||||||
| Net loss attributable to common stockholders |
$ | (5,275 | ) | $ | (19,783 | ) | $ | (26,042 | ) | $ | (53,495 | ) | $ | 6,970 | ||||||||||||||
| Less: Gain on sale of rental property (1) |
- | - | (17,874 | ) | (530 | ) | (17,874 | ) | ||||||||||||||||||||
| Plus: Depreciation expense (1) |
22,221 | 24,739 | 67,674 | 75,433 | 22,482 | |||||||||||||||||||||||
| FFO attributable to common stockholders |
16,946 | 4,956 | 23,758 | 21,408 | 11,578 | |||||||||||||||||||||||
| Stock compensation expense (1) |
385 | 2 | 3,630 | 2 | 362 | |||||||||||||||||||||||
| Redemption of preferred units |
329 | - | 329 | - | - | |||||||||||||||||||||||
| Debt prepayment costs (1) |
- | - | 2,324 | - | - | |||||||||||||||||||||||
| Acquisition fees |
- | - | - | 113 | - | |||||||||||||||||||||||
| Transaction costs (1) |
- | 5,531 | 7,463 | 5,531 | - | |||||||||||||||||||||||
| Amortization of Intangible Lease Assets (1) |
205 | 2 | 7,996 | 181 | 3,567 | |||||||||||||||||||||||
| Realized loss on change in fair value of interest rate caps (1) |
59 | 35 | 122 | 94 | 13 | |||||||||||||||||||||||
| Debt premium (discount) amortization (1) |
(142 | ) | (108 | ) | 182 | (328 | ) | (151 | ) | |||||||||||||||||||
| Deferring financing costs amortization (1) |
413 | 694 | 3,198 | 2,121 | 385 | |||||||||||||||||||||||
| Casualty losses, net of casualty gains (1) |
360 | (416 | ) | 1,087 | 650 | 452 | ||||||||||||||||||||||
| Core FFO attributable to common stockholders |
$ | 18,555 | $ | 10,696 | $ | 50,089 | $ | 29,772 | $ | 16,206 | ||||||||||||||||||
| Basic net loss per common share |
$ | (0.03 | ) | $ | (0.13 | ) | $ | (0.17 | ) | $ | (0.34 | ) | $ | 0.04 | ||||||||||||||
| Diluted net loss per common share |
$ | (0.03 | ) | $ | (0.13 | ) | $ | (0.17 | ) | $ | (0.34 | ) | $ | 0.04 | ||||||||||||||
| FFO, per diluted share (2) |
$ | 0.11 | $ | 0.03 | $ | 0.15 | $ | 0.14 | $ | 0.07 | ||||||||||||||||||
| Core FFO per diluted share (2)
|
$ | 0.12 | $ | 0.07 | $ | 0.32 | $ | 0.19 | $ | 0.10 | ||||||||||||||||||
| Weighted average shares outstanding - basic |
158,320 | 157,053 | 157,263 | 157,011 | 156,780 | |||||||||||||||||||||||
| Weighted average shares outstanding - diluted (3) |
158,404 | 157,053 | 157,306 | 157,011 | 156,822 | |||||||||||||||||||||||
(1) Each line item is adjusted to reflect the allocation to the noncontrolling interests for the three and nine months ended September 30, 2021 as follows (in thousands): gain on sale of rental property $0 and $860, depreciation expense of $863 and $3.1 million, stock compensation expense of $15 and $171, redemption of preferred OP units $13 and $13, debt prepayment costs of $0 and $112, transaction costs of $0 and $359, amortization of intangible lease assets of $8 and $383, realized loss on change in fair value of interest rate caps related to extinguishments of $2 and $5, debt premium (discount) amortization of $6 and $10, deferred financing costs amortization of $16 and $150 and casualty losses, net of casualty gains, of $14 and $49.
(2) Calculated using weighted average shares outstanding – diluted.
(3) None of the shares of convertible stock and 602,506 unvested performance based restricted stock awards are included in the diluted earnings per share calculations because the necessary conditions for conversion have not been satisfied as of either September 30, 2021 or 2020. Weighted average shares outstanding – diluted in this table, which was used to calculate FFO per share and Core FFO per share, includes 84,290 and 43,492 weighted average unvested restricted shares outstanding for the three and nine months ended September 30, 2021, however, these restricted shares were excluded from the calculation of diluted net loss per common share – GAAP because their effect would be antidilutive for the three and nine months ended September 30, 2021. Income (loss) attributable to outstanding OP Common and Preferred units issued in the Self-Management Transaction prior to their redemption and or conversion were included in net (income) loss attributable to noncontrolling interest, and therefore, excluded from the calculation of earnings (loss) per common share, basic and diluted, for all periods presented.
15
RESOURCE REIT, INC.
Supplemental and Combined Adjusted EBITDA Reconciliation and Interest Coverage Ratio
| (Dollars in thousands) | Three Months Ended September 30, |
Nine Months Ended September 30, |
|
Three Months Ended June 30, |
||||||||||||||||||||||||
| 2021 | 2020 | 2021 | 2020 | 2021 | ||||||||||||||||||||||||
| Adjusted EBITDA: |
||||||||||||||||||||||||||||
| Net income (loss) attributable to common stockholders |
$ | (5,275 | ) | $ | (19,783 | ) | $ | (26,042 | ) | $ | (53,495 | ) | $ | 6,970 | ||||||||||||||
| Plus: Allocation of income (loss) to noncontrolling interests |
(204 | ) | (177 | ) | (1,204 | ) | (177 | ) | 335 | |||||||||||||||||||
| Less: Gain on sale of rental property |
- | - | (18,734 | ) | (530 | ) | (18,734 | ) | ||||||||||||||||||||
| Less; Debt premium (discount) amortization |
(148 | ) | (110 | ) | 192 | (330 | ) | (158 | ) | |||||||||||||||||||
| Plus: Depreciation and amortization expense |
23,298 | 25,030 | 79,103 | 75,903 | 27,302 | |||||||||||||||||||||||
| Plus: Interest expense |
10,432 | 10,337 | 31,521 | 35,985 | 10,638 | |||||||||||||||||||||||
| Plus: Interest expense - preferred unit holders (1) |
921 | 286 | 3,161 | 286 | 1,120 | |||||||||||||||||||||||
| Plus: Deferring financing costs amortization |
429 | 702 | 3,348 | 2,129 | 404 | |||||||||||||||||||||||
| Plus: Realized loss on change in fair value of interest rate caps |
61 | 36 | 127 | 95 | 14 | |||||||||||||||||||||||
| Plus: Debt prepayment costs |
- | - | 2,436 | - | - | |||||||||||||||||||||||
| Plus: Transaction Costs |
- | 5,573 | 7,822 | 5,573 | - | |||||||||||||||||||||||
| Plus: Redemption of preferred OP units |
342 | - | 342 | - | - | |||||||||||||||||||||||
| Adjusted EBITDA |
$ | 29,856 | $ | 21,894 | $ | 82,072 | $ | 65,439 | $ | 27,891 | ||||||||||||||||||
| Interest Cost: |
||||||||||||||||||||||||||||
| Interest expense (2) |
$ | 11,695 | $ | 11,251 | $ | 40,785 | $ | 38,165 | $ | 12,018 | ||||||||||||||||||
| INTEREST COVERAGE |
2.6 | x | 1.9 | x | 2.0 | x | 1.7 | x | 2.3 | x | ||||||||||||||||||
(1) Reported as allocation of income to preferred unit holders to noncontrolling interest on Consolidated Statements of Operations.
(2) Includes interest expense paid to Preferred OP Unitholders.
16
RESOURCE REIT, INC.
Supplemental and Combined Same Store Portfolio Net Operating Income Reconciliation
| (Dollars in thousands, except rent per unit) | Three Months Ended September 30, |
Nine Months Ended September 30, |
Three Months Ended June 30, |
|||||||||||||||||||||||||||||||||||||||
| 2021 | 2020 | % change | 2021 | 2020 | % change | 2021 | ||||||||||||||||||||||||||||||||||||
| Revenues: |
||||||||||||||||||||||||||||||||||||||||||
| Rental and other property revenue |
$ | 62,934 | $ | 58,833 | 7.0% | $ | 183,879 | $ | 175,965 | 4.5% | $ | 61,002 | ||||||||||||||||||||||||||||||
| Property Operating Expenses: |
||||||||||||||||||||||||||||||||||||||||||
| Real estate taxes |
7,292 | 7,495 | -2.7% | 23,409 | 23,433 | -0.1% | 7,888 | |||||||||||||||||||||||||||||||||||
| Property insurance |
1,263 | 1,551 | -18.6% | 4,210 | 4,492 | -6.3% | 1,495 | |||||||||||||||||||||||||||||||||||
| Payroll |
5,693 | 5,637 | 1.0% | 16,442 | 15,874 | 3.6% | 5,409 | |||||||||||||||||||||||||||||||||||
| Utilities |
3,735 | 3,693 | 1.1% | 10,917 | 10,431 | 4.7% | 3,480 | |||||||||||||||||||||||||||||||||||
| Landscaping |
663 | 676 | -1.9% | 1,875 | 1,890 | -0.8% | 715 | |||||||||||||||||||||||||||||||||||
| Repairs and maintenance |
2,740 | 2,550 | 7.5% | 8,091 | 7,138 | 13.4% | 2,623 | |||||||||||||||||||||||||||||||||||
| Turnover |
1,580 | 1,699 | -7.0% | 3,624 | 3,675 | -1.4% | 1,127 | |||||||||||||||||||||||||||||||||||
| General and administrative |
1,335 | 1,676 | -20.3% | 4,084 | 4,377 | -6.7% | 1,436 | |||||||||||||||||||||||||||||||||||
| Marketing |
631 | 706 | -10.6% | 1,858 | 1,853 | 0.3% | 611 | |||||||||||||||||||||||||||||||||||
| Other expenses |
717 | 1,596 | -55.1% | 2,833 | 3,752 | -24.5% | 998 | |||||||||||||||||||||||||||||||||||
| Total property operating expenses |
25,649 | 27,279 | -6.0% | 77,343 | 76,915 | 0.6% | 25,782 | |||||||||||||||||||||||||||||||||||
| Property management fees |
1,696 | 2,369 | -28.4% | 4,958 | 7,564 | -34.5% | 1,650 | |||||||||||||||||||||||||||||||||||
| Same Store net operating income (1) |
$ | 35,589 | $ | 29,185 | 21.9% | $ | 101,578 | $ | 91,486 | 11.0% | $ | 33,570 | ||||||||||||||||||||||||||||||
| Same Store NOI margin |
56.5% | 49.6% | 6.9% | 55.2% | 52.0% | 3.2% | 55.0% | |||||||||||||||||||||||||||||||||||
| Average occupancy |
95.1% | 93.4% | 1.7% | 95.0% | 92.9% | 2.1% | 95.2% | |||||||||||||||||||||||||||||||||||
| Net effective rent per occupied unit |
$ | 1,369 | $ | 1,293 | 5.9% | $ | 1,339 | $ | 1,301 | 3.0% | $ | 1,334 | ||||||||||||||||||||||||||||||
| Reconciliation of Same Store net operating income to net income (loss) attributable to common stockholders |
||||||||||||||||||||||||||||||||||||||||||
| Same Store net operating income |
35,589 | 29,185 | 101,578 | 91,486 | 33,570 | |||||||||||||||||||||||||||||||||||||
| Non-Same Store net operating income |
36 | 565 | 1,160 | 1,874 | 511 | |||||||||||||||||||||||||||||||||||||
| Total NOI |
$ | 35,625 | $ | 29,750 | $ | 102,738 | $ | 93,360 | $ | 34,081 | ||||||||||||||||||||||||||||||||
| Other (expense) income: |
||||||||||||||||||||||||||||||||||||||||||
| Casualty loss |
(454 | ) | 412 | (1,378 | ) | (690 | ) | (618 | ) | |||||||||||||||||||||||||||||||||
| Acquisition costs |
- | - | - | (113 | ) | - | ||||||||||||||||||||||||||||||||||||
| Transaction costs |
- | (5,573 | ) | (7,822 | ) | (5,573 | ) | - | ||||||||||||||||||||||||||||||||||
| Management fees - related party |
- | (4,504 | ) | - | (16,282 | ) | - | |||||||||||||||||||||||||||||||||||
| General and administrative - Corporate |
(5,207 | ) | (3,625 | ) | (18,974 | ) | (10,657 | ) | (5,413 | ) | ||||||||||||||||||||||||||||||||
| Loss on disposal of assets |
(188 | ) | (218 | ) | (614 | ) | (732 | ) | (308 | ) | ||||||||||||||||||||||||||||||||
| Depreciation and amortization expense |
(23,298 | ) | (25,030 | ) | (79,103 | ) | (75,903 | ) | (27,302 | ) | ||||||||||||||||||||||||||||||||
| Interest expense |
(10,774 | ) | (10,965 | ) | (37,624 | ) | (37,879 | ) | (10,898 | ) | ||||||||||||||||||||||||||||||||
| Interest income |
- | 55 | 22 | 203 | 6 | |||||||||||||||||||||||||||||||||||||
| Gain on sale of rental property |
- | - | 18,734 | 530 | 18,734 | |||||||||||||||||||||||||||||||||||||
| Gain on sale of land easement |
- | 20 | - | 310 | - | |||||||||||||||||||||||||||||||||||||
| Management fee and other income |
- | - | 37 | - | - | |||||||||||||||||||||||||||||||||||||
| Insurance proceeds in excess of cost basis |
80 | 4 | 241 | 40 | 143 | |||||||||||||||||||||||||||||||||||||
| Total other expense (income) |
(39,841 | ) | (49,424 | ) | (126,481 | ) | (146,746 | ) | (25,656 | ) | ||||||||||||||||||||||||||||||||
| Net (loss) income |
$ | (4,216 | ) | $ | (19,674 | ) | $ | (23,743 | ) | $ | (53,386 | ) | $ | 8,425 | ||||||||||||||||||||||||||||
| Redemption of preferred OP units |
(342 | ) | - | (342 | ) | - | - | |||||||||||||||||||||||||||||||||||
| Preferred return to preferred unit holders |
(921 | ) | (286 | ) | (3,161 | ) | (286 | ) | (1,120 | ) | ||||||||||||||||||||||||||||||||
| Net (loss) income after preferred return |
(5,479 | ) | (19,960 | ) | (27,246 | ) | (53,672 | ) | 7,305 | |||||||||||||||||||||||||||||||||
| Less: Allocation of income to preferred unit holders attributable to noncontrolling interest |
47 | 6 | 150 | 6 | 52 | |||||||||||||||||||||||||||||||||||||
| Less: Net loss (income) attributable to noncontrolling interest |
157 | 171 | 1,054 | 171 | (387 | ) | ||||||||||||||||||||||||||||||||||||
| Net (loss) income attributable to common stockholders |
$ | (5,275 | ) | $ | (19,783 | ) | $ | (26,042 | ) | $ | (53,495 | ) | $ | 6,970 | ||||||||||||||||||||||||||||
(1) Same Store portfolio consists of 49 properties, which represent 14,643 units.
17
RESOURCE REIT, INC.
Supplemental and Combined Same Store Portfolio Net Operating Income by State
THREE MONTHS ENDED SEPTEMBER 30, 2021 AND 2020
| (Dollars in thousands, except rent per unit) | Rental Income | Property Operating Expenses (1) |
Net Operating Income | Average Occupancy | Net Effective Rent Per Occupied Unit |
|||||||||||||||||||||||||||||||||||||||||||||||||||||||||||||
| State | Number of Properties |
Units | 2021 | 2020 | % Change |
2021 | 2020 | % Change |
2021 | 2020 | % Change |
2021 | 2020 | % Change |
2021 | 2020 | % Change | |||||||||||||||||||||||||||||||||||||||||||||||||
| Alabama |
2 | 480 | $ | 1,662 | $ | 1,547 | 7.4 | % | $ | 891 | $ | 959 | -7.1 | % | $ | 771 | $ | 588 | 31.1 | % | 96.6 | % | 94.0 | % | 2.6 | % | $ | 1,023 | $ | 988 | 3.6 | % | ||||||||||||||||||||||||||||||||||
| Arizona |
2 | 866 | 3,536 | 3,081 | 14.8 | % | 1,246 | 1,202 | 3.7 | % | 2,290 | 1,879 | 21.9 | % | 96.8 | % | 94.9 | % | 1.9 | % | 1,268 | 1,151 | 10.2 | % | ||||||||||||||||||||||||||||||||||||||||||
| California |
2 | 694 | 4,227 | 3,897 | 8.5 | % | 1,546 | 1,669 | -7.4 | % | 2,681 | 2,228 | 20.3 | % | 94.4 | % | 93.5 | % | 0.9 | % | 2,046 | 1,933 | 5.9 | % | ||||||||||||||||||||||||||||||||||||||||||
| Colorado |
4 | 1,016 | 4,741 | 4,591 | 3.3 | % | 1,584 | 1,895 | -16.4 | % | 3,157 | 2,696 | 17.1 | % | 92.5 | % | 92.8 | % | -0.3 | % | 1,542 | 1,452 | 6.2 | % | ||||||||||||||||||||||||||||||||||||||||||
| Florida |
4 | 984 | 4,196 | 3,791 | 10.7 | % | 1,860 | 1,897 | -2.0 | % | 2,336 | 1,894 | 23.3 | % | 96.9 | % | 94.5 | % | 2.4 | % | 1,310 | 1,237 | 5.9 | % | ||||||||||||||||||||||||||||||||||||||||||
| Georgia |
7 | 1,790 | 7,985 | 7,537 | 5.9 | % | 3,399 | 3,692 | -7.9 | % | 4,586 | 3,845 | 19.3 | % | 95.1 | % | 94.0 | % | 1.1 | % | 1,406 | 1,333 | 5.4 | % | ||||||||||||||||||||||||||||||||||||||||||
| Illinois |
4 | 1,251 | 6,221 | 5,772 | 7.8 | % | 2,631 | 2,766 | -4.9 | % | 3,590 | 3,006 | 19.4 | % | 96.7 | % | 92.3 | % | 4.4 | % | 1,599 | 1,535 | 4.2 | % | ||||||||||||||||||||||||||||||||||||||||||
| Minnesota |
2 | 739 | 3,198 | 2,941 | 8.7 | % | 1,407 | 1,540 | -8.6 | % | 1,791 | 1,401 | 27.8 | % | 95.9 | % | 94.6 | % | 1.3 | % | 1,347 | 1,288 | 4.6 | % | ||||||||||||||||||||||||||||||||||||||||||
| North Carolina |
2 | 623 | 2,410 | 2,279 | 5.7 | % | 989 | 1,059 | -6.6 | % | 1,421 | 1,220 | 16.5 | % | 95.6 | % | 95.6 | % | 0.0 | % | 1,245 | 1,183 | 5.2 | % | ||||||||||||||||||||||||||||||||||||||||||
| Ohio |
1 | 156 | 765 | 654 | 17.0 | % | 299 | 274 | 9.1 | % | 466 | 380 | 22.6 | % | 96.9 | % | 89.3 | % | 7.6 | % | 1,290 | 1,274 | 1.3 | % | ||||||||||||||||||||||||||||||||||||||||||
| Oregon |
2 | 545 | 2,480 | 2,306 | 7.5 | % | 1,017 | 1,099 | -7.5 | % | 1,463 | 1,207 | 21.2 | % | 95.9 | % | 91.7 | % | 4.2 | % | 1,453 | 1,364 | 6.6 | % | ||||||||||||||||||||||||||||||||||||||||||
| Pennsylvania |
1 | 133 | 645 | 608 | 6.1 | % | 239 | 434 | -44.9 | % | 406 | 174 | 133.3 | % | 96.7 | % | 90.6 | % | 6.1 | % | 1,473 | 1,389 | 6.0 | % | ||||||||||||||||||||||||||||||||||||||||||
| Texas |
13 | 4,769 | 18,345 | 17,478 | 5.0 | % | 9,055 | 9,953 | -9.0 | % | 9,290 | 7,525 | 23.5 | % | 93.7 | % | 92.8 | % | 0.9 | % | 1,244 | 1,166 | 6.6 | % | ||||||||||||||||||||||||||||||||||||||||||
| Virginia |
3 | 597 | 2,523 | 2,351 | 7.3 | % | 1,182 | 1,209 | -2.2 | % | 1,341 | 1,142 | 17.4 | % | 97.3 | % | 95.3 | % | 2.0 | % | 1,288 | 1,249 | 3.1 | % | ||||||||||||||||||||||||||||||||||||||||||
|
|
|
|
|
|
|
|
|
|
|
|
|
|
|
|
|
|
|
|
|
|
|
|
|
|
|
|
|
|
|
|
|
|
|
|
|
|
|
|
|
|
|
|
|
|
| |||||||||||||||||||||
| Total / Weighted Average |
49 | 14,643 | $ | 62,934 | $ | 58,833 | 7.0 | % | $ | 27,345 | $ | 29,648 | -7.8 | % | $ | 35,589 | $ | 29,185 | 21.9 | % | 95.1 | % | 93.4 | % | 1.7 | % | $ | 1,369 | $ | 1,293 | 5.9 | % | ||||||||||||||||||||||||||||||||||
(1) Includes property operating expenses, real estate taxes and property management fees but excludes Non-Same Store expenses.
18
RESOURCE REIT, INC.
Supplemental and Combined Same Store Portfolio Net Operating Income by State
NINE MONTHS ENDED SEPTEMBER 30, 2021 AND 2020
| (Dollars in thousands, except rent per unit) | Rental Income | Property Operating Expenses (1) |
Net Operating Income | Average Occupancy | Net Effective Rent Per Occupied Unit |
|||||||||||||||||||||||||||||||||||||||||||||||||||||||||||||
| State | Number of Properties |
Units | 2021 | 2020 | % Change |
2021 | 2020 | % Change |
2021 | 2020 | % Change |
2021 | 2020 | % Change |
2021 | 2020 | % Change |
|||||||||||||||||||||||||||||||||||||||||||||||||
| Alabama |
2 | 480 | $ | 4,920 | $ | 4,585 | 7.3 | % | $ | 2,546 | $ | 2,467 | 3.2 | % | $ | 2,374 | $ | 2,118 | 12.1 | % | 96.3 | % | 93.0 | % | 3.3 | % | $ | 1,012 | $ | 993 | 1.9% | |||||||||||||||||||||||||||||||||||
| Arizona |
2 | 866 | 10,059 | 8,884 | 13.2 | % | 3,516 | 3,422 | 2.7 | % | 6,543 | 5,462 | 19.8 | % | 96.8 | % | 93.8 | % | 3.0 | % | 1,211 | 1,112 | 8.9% | |||||||||||||||||||||||||||||||||||||||||||
| California |
2 | 694 | 12,180 | 11,821 | 3.0 | % | 4,867 | 4,966 | -2.0 | % | 7,313 | 6,855 | 6.7 | % | 94.9 | % | 92.8 | % | 2.1 | % | 2,001 | 1,915 | 4.5% | |||||||||||||||||||||||||||||||||||||||||||
| Colorado |
4 | 1,016 | 13,898 | 13,759 | 1.0 | % | 4,779 | 5,085 | -6.0 | % | 9,119 | 8,674 | 5.1 | % | 92.5 | % | 91.6 | % | 0.9 | % | 1,517 | 1,488 | 1.9% | |||||||||||||||||||||||||||||||||||||||||||
| Florida |
4 | 984 | 12,279 | 11,288 | 8.8 | % | 5,626 | 5,591 | 0.6 | % | 6,653 | 5,697 | 16.8 | % | 96.8 | % | 93.0 | % | 3.8 | % | 1,277 | 1,234 | 3.4% | |||||||||||||||||||||||||||||||||||||||||||
| Georgia |
7 | 1,790 | 23,431 | 22,528 | 4.0 | % | 10,329 | 10,699 | -3.5 | % | 13,102 | 11,829 | 10.8 | % | 95.4 | % | 93.0 | % | 2.4 | % | 1,379 | 1,351 | 2.1% | |||||||||||||||||||||||||||||||||||||||||||
| Illinois |
4 | 1,251 | 18,134 | 17,256 | 5.1 | % | 7,584 | 7,979 | -5.0 | % | 10,550 | 9,277 | 13.7 | % | 96.1 | % | 92.4 | % | 3.7 | % | 1,564 | 1,540 | 1.5% | |||||||||||||||||||||||||||||||||||||||||||
| Minnesota |
2 | 739 | 9,217 | 8,995 | 2.5 | % | 4,199 | 4,342 | -3.3 | % | 5,018 | 4,653 | 7.8 | % | 95.7 | % | 94.7 | % | 1.0 | % | 1,332 | 1,280 | 4.0% | |||||||||||||||||||||||||||||||||||||||||||
| North Carolina |
2 | 623 | 6,974 | 6,703 | 4.0 | % | 2,808 | 2,923 | -3.9 | % | 4,166 | 3,780 | 10.2 | % | 94.0 | % | 94.0 | % | 0.0 | % | 1,215 | 1,175 | 3.4% | |||||||||||||||||||||||||||||||||||||||||||
| Ohio |
1 | 156 | 2,184 | 2,143 | 1.9 | % | 889 | 866 | 2.7 | % | 1,295 | 1,277 | 1.4 | % | 93.4 | % | 93.9 | % | -0.5 | % | 1,269 | 1,267 | 0.1% | |||||||||||||||||||||||||||||||||||||||||||
| Oregon |
2 | 545 | 7,227 | 7,000 | 3.2 | % | 3,007 | 2,969 | 1.3 | % | 4,220 | 4,031 | 4.7 | % | 95.5 | % | 92.5 | % | 3.0 | % | 1,417 | 1,399 | 1.2% | |||||||||||||||||||||||||||||||||||||||||||
| Pennsylvania |
1 | 133 | 1,987 | 1,855 | 7.1 | % | 1,019 | 1,077 | -5.4 | % | 968 | 778 | 24.4 | % | 96.9 | % | 91.3 | % | 5.6 | % | 1,458 | 1,405 | 3.7% | |||||||||||||||||||||||||||||||||||||||||||
| Texas |
13 | 4,769 | 53,936 | 52,202 | 3.3 | % | 27,617 | 28,581 | -3.4 | % | 26,319 | 23,621 | 11.4 | % | 94.0 | % | 92.6 | % | 1.4 | % | 1,217 | 1,185 | 2.6% | |||||||||||||||||||||||||||||||||||||||||||
| Virginia |
3 | 597 | 7,453 | 6,946 | 7.3 | % | 3,515 | 3,512 | 0.1 | % | 3,938 | 3,434 | 14.7 | % | 97.1 | % | 95.1 | % | 2.0 | % | 1,269 | 1,231 | 3.1% | |||||||||||||||||||||||||||||||||||||||||||
|
|
|
|
|
|
|
|
|
|
|
|
|
|
|
|
|
|
|
|
|
|
|
|
|
|
|
|
|
|
|
|
|
|
|
|
|
|
|
|||||||||||||||||||||||||||||
| Total / Weighted Average |
49 | 14,643 | $ | 183,879 | $ | 175,965 | 4.5 | % | $ | 82,301 | $ | 84,479 | -2.6 | % | $ | 101,578 | $ | 91,486 | 11.0 | % | 95.0 | % | 92.9 | % | 2.1 | % | $ | 1,339 | $ | 1,301 | 3.0% | |||||||||||||||||||||||||||||||||||
(1) Includes property operating expenses, real estate taxes and property management fees but excludes Non-Same Store expenses.
19
RESOURCE REIT, INC.
Supplemental Portfolio Information
THREE MONTHS ENDED SEPTEMBER 30, 2021
| (Dollars in thousands, except rent per unit) | Net Effective | |||||||||||||||||||||
| Property | Market | Number of Units |
Year Built | Rent
per Occupied Unit (1) |
Revenue per Occupied Unit (2) |
Average Occupancy |
||||||||||||||||
| 1000 Spalding |
Atlanta, GA | 252 | 1995 | $ | 1,408 | $ | 1,490 | 96.1% | ||||||||||||||
| 81 Fifty at West Hills |
Portland, OR | 357 | 1985 | 1,435 | 1,594 | 96.9% | ||||||||||||||||
| Adair off Addison |
Dallas, TX | 352 | 1980 | 1,228 | 1,355 | 95.8% | ||||||||||||||||
| Addison at Sandy Springs |
Sandy Springs, GA | 236 | 1987 | 1,255 | 1,373 | 92.2% | ||||||||||||||||
| Arcadia |
Centennial , CO | 300 | 1984 | 1,611 | 1,708 | 94.2% | ||||||||||||||||
| Aston at Cinco Ranch |
Katy, TX | 228 | 2000 | 1,375 | 1,462 | 97.5% | ||||||||||||||||
| Bay Club |
Jacksonville, FL | 220 | 1990 | 1,303 | 1,416 | 96.4% | ||||||||||||||||
| Bristol Grapevine |
Grapevine, TX | 376 | 1978 - 1981 | 1,084 | 1,182 | 95.1% | ||||||||||||||||
| Bryant at Yorba Linda |
Yorba Linda, CA | 400 | 1986 | 2,209 | 2,280 | 94.6% | ||||||||||||||||
| Calloway at Las Colinas |
Irving, TX | 536 | 1984 | 1,145 | 1,281 | 91.5% | ||||||||||||||||
| Courtney Meadows |
Jacksonville, FL | 276 | 2001 | 1,297 | 1,442 | 98.2% | ||||||||||||||||
| Crosstown at Chapel Hill |
Chapel Hill, NC | 411 | 1990 | 1,230 | 1,327 | 96.0% | ||||||||||||||||
| Estates at Johns Creek |
John’s Creek , GA | 403 | 1999 | 1,708 | 2,018 | 95.9% | ||||||||||||||||
| Grand Reserve |
Naperville, IL | 319 | 1997 | 1,794 | 1,924 | 97.4% | ||||||||||||||||
| Green Trails |
Lisle, IL | 440 | 1988 | 1,482 | 1,595 | 97.0% | ||||||||||||||||
| Heritage Pointe |
Gilbert, AZ | 458 | 1989 | 1,244 | 1,371 | 96.7% | ||||||||||||||||
| Indigo Creek |
Glendale, AZ | 408 | 1998 | 1,294 | 1,439 | 97.1% | ||||||||||||||||
| Martin’s Point |
Lombard, IL | 256 | 1989 | 1,543 | 1,619 | 95.8% | ||||||||||||||||
| Matthew’s Reserve |
Matthews, NC | 212 | 1998 | 1,276 | 1,382 | 95.0% | ||||||||||||||||
| Maxwell Townhomes |
San Antonio, TX | 316 | 1983 | 1,108 | 1,239 | 87.8% | ||||||||||||||||
| Meridian Pointe |
Burnsville, MN | 339 | 1989 | 1,399 | 1,500 | 94.9% | ||||||||||||||||
| Montclair Terrace |
Portland, OR | 188 | 1968 - 2006 | 1,490 | 1,556 | 94.2% | ||||||||||||||||
| Perimeter 5550 |
Atlanta, GA | 165 | 1994 | 1,309 | 1,411 | 96.0% | ||||||||||||||||
| Perimeter Circle |
Atlanta, GA | 194 | 1995 | 1,404 | 1,497 | 96.9% | ||||||||||||||||
| Pines of York |
Yorktown, VA | 248 | 1976 | 1,079 | 1,182 | 98.0% | ||||||||||||||||
| Point Bonita |
Chula Vista, CA | 294 | 1970 - 1988 | 1,823 | 1,988 | 94.2% | ||||||||||||||||
| Providence in the Park |
Arlington , TX | 524 | 1997 | 1,330 | 1,440 | 89.5% | ||||||||||||||||
| Ravina |
Austin, TX | 498 | 2001 | 1,320 | 1,484 | 97.6% | ||||||||||||||||
| Retreat at Rocky Ridge |
Birmingham, AL | 206 | 1986 | 879 | 1,054 | 97.5% | ||||||||||||||||
| Skyview |
Westminster, CO | 224 | 1985 | 1,314 | 1,463 | 84.0% | ||||||||||||||||
| South Lamar Village |
Austin, TX | 208 | 1981 | 1,372 | 1,488 | 96.5% | ||||||||||||||||
| Sunset Ridge |
San Antonio, TX | 324 | 1949 | 1,176 | 1,319 | 95.2% | ||||||||||||||||
| Tech Center Square |
Newport News, VA | 208 | 1985 | 1,101 | 1,239 | 97.1% | ||||||||||||||||
| Terraces at Lake Mary |
Lake Mary, FL | 284 | 1998 | 1,337 | 1,539 | 96.8% | ||||||||||||||||
| The Brookwood Apartment Homes |
Homewood, AL | 274 | 1968 | 1,134 | 1,302 | 96.0% | ||||||||||||||||
| The Cannery |
Dayton, OH | 156 | 1800s / 2011 | 1,290 | 1,687 | 96.9% | ||||||||||||||||
| The Palmer at Las Colinas |
Dallas, TX | 476 | 1991 | 1,487 | 1,640 | 93.1% | ||||||||||||||||
| The Summit |
Alexandria, VA | 141 | 1976 | 1,937 | 2,233 | 96.5% | ||||||||||||||||
| The Westside Apartment Homes |
Plano, TX | 412 | 1984 | 1,193 | 1,317 | 93.6% | ||||||||||||||||
| TrailPoint |
The Woodlands, TX | 271 | 1981 | 1,122 | 1,216 | 96.1% | ||||||||||||||||
| Tramore Village |
Austell, GA | 324 | 1999 | 1,261 | 1,386 | 94.0% | ||||||||||||||||
| Uptown Buckhead |
Atlanta, GA | 216 | 1989 | 1,287 | 1,417 | 95.7% | ||||||||||||||||
| Verdant |
Boulder , CO | 216 | 1991 | 1,919 | 2,153 | 94.5% | ||||||||||||||||
| Verona |
Littleton, CO | 276 | 1985 | 1,341 | 1,464 | 96.2% | ||||||||||||||||
| Vista |
Philadelphia , PA | 133 | 1964 | 1,473 | 1,670 | 96.8% | ||||||||||||||||
| Wimbledon Oaks |
Arlington, TX | 248 | 1986 | 1,163 | 1,244 | 94.4% | ||||||||||||||||
| Windbrooke Crossing |
Buffalo Grove, IL | 236 | 1986 | 1,612 | 1,773 | 96.3% | ||||||||||||||||
| Winthrop West |
Riverview, FL | 204 | 1990 | 1,299 | 1,455 | 96.3% | ||||||||||||||||
| Woods at Burnsville |
Burnsville, MN | 400 | 1984 | 1,305 | 1,510 | 96.9% | ||||||||||||||||
|
|
|
|
|
|
|
|
|
|
|
|
||||||||||||
| Total / Weighted Average |
14,643 | $ | 1,369 | $ | 1,508 | 95.1% | ||||||||||||||||
(1) Represents the average net effective rent per occupied unit.
(2) Represents total revenue per occupied unit.
20
RESOURCE REIT, INC.
Supplemental Mortgage Notes Payable Summary Information
AS OF SEPTEMBER 30, 2021
(Dollars in thousands)
| Property | Type | Term | Outstanding | Interest | Maturity | |||||||||||
|
(months) |
Principal (1) | Rate (2) | Date | |||||||||||||
| 1000 Spalding |
Fixed | 84 | $ | 35,035 | 2.51% | 12/1/2027 | ||||||||||
| Addison at Sandy Springs |
Floating | 84 | 22,000 | 1.84% | 5/1/2025 | |||||||||||
| Arcadia |
Fixed | 84 | 56,810 | 2.57% | 12/1/2027 | |||||||||||
| Bay Club |
Floating | 84 | 20,469 | 1.95% | 8/1/2024 | |||||||||||
| Bristol Grapevine |
Floating | 84 | 32,650 | 1.79% | 5/1/2025 | |||||||||||
| Bryant at Yorba Linda |
Floating | 84 | 74,637 | 2.33% | 4/15/2027 | |||||||||||
| Calloway at Las Colinas |
Fixed | 84 | 51,935 | 2.57% | 12/1/2027 | |||||||||||
| Courtney Meadows |
Floating | 84 | 26,037 | 1.92% | 1/1/2025 | |||||||||||
| Crosstown at Chapel Hill |
Floating | 84 | 42,477 | 1.85% | 7/1/2025 | |||||||||||
| Grand Reserve |
Floating | 120 | 47,845 | 1.80% | 5/1/2028 | |||||||||||
| Green Trails |
Floating | 84 | 58,512 | 2.07% | 6/1/2024 | |||||||||||
| Indigo Creek |
Floating | 84 | 38,732 | 2.01% | 5/1/2024 | |||||||||||
| Martin’s Point |
Floating | 84 | 28,721 | 1.94% | 11/1/2024 | |||||||||||
| Matthew’s Reserve |
Fixed | 84 | 23,850 | 4.47% | 9/1/2025 | |||||||||||
| Maxwell Townhomes |
Fixed | 120 | 12,258 | 4.32% | 1/1/2022 | |||||||||||
| Meridian Pointe |
Floating | 84 | 37,665 | 1.98% | 8/1/2024 | |||||||||||
| Perimeter 5550 |
Floating | 84 | 20,630 | 1.58% | 1/1/2026 | |||||||||||
| Perimeter Circle |
Floating | 84 | 26,115 | 1.58% | 1/1/2026 | |||||||||||
| Pines of York |
Fixed | 120 | 13,541 | 4.46% | 12/1/2021 | |||||||||||
| Point Bonita |
Fixed | 120 | 24,898 | 5.33% | 10/1/2023 | |||||||||||
| Ravina |
Fixed | 120 | 24,935 | 3.76% | 5/1/2022 | |||||||||||
| Skyview |
Floating | 120 | 27,890 | 2.44% | 10/1/2026 | |||||||||||
| Sunset Ridge |
Floating | 84 | 28,600 | 2.42% | 11/1/2027 | |||||||||||
| Terraces at Lake Mary |
Floating | 84 | 30,800 | 1.99% | 9/1/2024 | |||||||||||
| The Brookwood Apartment Homes |
Fixed | 120 | 18,772 | 4.82% | 11/1/2021 | |||||||||||
| The Summit |
Fixed | 84 | 27,580 | 3.84% | 7/1/2026 | |||||||||||
| TrailPoint |
Floating | 120 | 17,159 | 2.49% | 11/1/2023 | |||||||||||
| Tramore Village |
Floating | 84 | 32,293 | 1.88% | 4/1/2025 | |||||||||||
| Verdant |
Fixed | 84 | 47,146 | 2.57% | 12/1/2027 | |||||||||||
| Wimbledon Oaks |
Fixed | 84 | 18,410 | 4.33% | 3/1/2026 | |||||||||||
| Windbrooke Crossing |
Floating | 84 | 35,767 | 2.77% | 1/1/2024 | |||||||||||
| Winthrop West |
Fixed | 84 | 21,760 | 4.36% | 10/1/2025 | |||||||||||
| Woods at Burnsville |
Floating | 84 | 36,216 | 2.21% | 2/1/2024 | |||||||||||
| Structured Credit Facility - Advance 1 |
Fixed | 120 | 235,205 | 2.79% | 2/1/2031 | |||||||||||
| Structured Credit Facility - Advance 2 |
Fixed | 84 | 235,205 | 2.62% | 2/1/2028 | |||||||||||
| Structured Credit Facility - Floating (3) |
Floating | 120 | 24,760 | 2.11% | 2/1/2031 | |||||||||||
|
|
|
|
||||||||||||||
| Total / Weighted Average |
$ | 1,557,315 | 2.60% | |||||||||||||
(1) Mortgage debt is non-recourse to the Company and encumbers the multifamily properties.
(2) At September 30, 2021, one-month LIBOR in effect was 0.08%.
(3) At September 30, 2021, one-month SOFR in effect was 0.05%.
21
RESOURCE REIT, INC.
Supplemental Debt Summary
| AS OF SEPTEMBER 30, 2021
(Dollars in thousands) |
Amount | Weighted Avg Rate |
Type | Weighted Average Maturity |
||||||||||||
|
|
|
|||||||||||||||
| Debt: |
||||||||||||||||
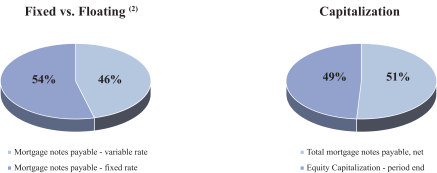
| Mortgage notes payable - variable rate |
709,975 | 2.06% | Floating | 3.93 | ||||||||||||
| Mortgage notes payable - fixed rate |
847,340 | 3.04% | Fixed | 6.20 | ||||||||||||
|
|
|
|
|
|
|
|||||||||||
| Total Mortgage notes payable |
1,557,315 | 2.60% | 5.16 | |||||||||||||
|
|
|
|
|
|||||||||||||
| Unamortized premium / deferred financing costs |
(6,851) | |||||||||||||||
|
|
|
|||||||||||||||
| Total mortgage notes payable, net |
1,550,464 | |||||||||||||||
| Secured revolving credit facility (1) |
- | |||||||||||||||
| Equity Capitalization - period end |
1,500,671 | |||||||||||||||
|
|
|
|||||||||||||||
| Total Capitalization |
$ | 3,051,135 | ||||||||||||||
|
|
|
|||||||||||||||
(1) Secured revolving credit facility has a total capacity of $100.0 million, including $15.0 million available in letters of credit, of which none was drawn as of September 30, 2021. Borrowings under the facility mature on May 20, 2024.
(2) As of September 30, 2021, the Company maintains 21 interest rate caps with a combined notional value of $724.9 million with strike prices ranging from 1.45% to 5.84% and maturity dates ranging from November 2021 to February 2026.
| Secured Fixed Debt |
Secured Variable Debt |
Total Debt |
% of Total Debt |
Weighted Average Interest rate |
||||||||||||||||
|
|
|
|||||||||||||||||||
| Debt Maturity Schedule: |
||||||||||||||||||||
| 2021 |
$ | 32,313 | $ | - | $ | 32,313 | 2.1% | 4.7% | ||||||||||||
| 2022 |
37,193 | - | 37,193 | 2.4% | 3.9% | |||||||||||||||
| 2023 |
24,898 | 17,159 | 42,057 | 2.7% | 4.2% | |||||||||||||||
| 2024 |
- | 286,882 | 286,882 | 18.4% | 2.1% | |||||||||||||||
| 2025 |
45,610 | 155,457 | 201,067 | 12.9% | 2.4% | |||||||||||||||
| 2026 |
45,990 | 74,635 | 120,625 | 7.7% | 2.7% | |||||||||||||||
| 2027 + |
661,336 | 175,842 | 837,178 | 53.8% | 2.6% | |||||||||||||||
|
|
|
|
|
|
|
|
|
|
|
|||||||||||
| Total |
$ | 847,340 | $ | 709,975 | $ | 1,557,315 | 100.0% | 2.6% | ||||||||||||
|
|
|
|
|
|
|
|
|
|
|
|||||||||||
22
RESOURCE REIT, INC.
Supplemental Debt Covenants and Encumbered Asset Information
AS OF SEPTEMBER 30, 2021
(Dollars in thousands)
| Secured Revolving Credit Facility | Requirement | Actual | Compliance | |||||
| Debt Covenant Summary: |
||||||||
| Maximum total leverage ratio (1) |
£ 65% | 53.5% | Yes | |||||
| Minimum fixed charge coverage ratio (2) |
³ 1.35x | 1.84x | Yes | |||||
| Maximum secured recourse debt |
£ 5% | 0.0% | Yes | |||||
| Minimum tangible net worth |
³$678,834 | $ | 981,203 | Yes | ||||
(1) Steps down to 60% after 18 months (beginning the third quarter of 2022).
(2) Steps up to 1.50x after 12 months (beginning the first quarter of 2022).
AS OF SEPTEMBER 30, 2021
(Dollars in thousands)
| Encumbered Asset Information | Total Properties |
Total Units |
% of Total | Gross Assets (5) | Debt | LTV | Q3 2021 NOI |
% of Total | ||||||||||||||||||||||||
| Encumbered assets - Corporate Level Facility (3) |
5 | 931 | 6.4% | $ | 103,580 | $ | - | 0.0% | $ | 2,064 | 5.8% | |||||||||||||||||||||
| Encumbered assets - Property Level (4) |
33 | 9,842 | 67.2% | 1,816,893 | 1,062,145 | 58.5% | 24,046 | 67.6% | ||||||||||||||||||||||||
| Encumbered assets - Structured Credit Level Facility (4) |
11 | 3,870 | 26.4% | 656,263 | 495,170 | 75.5% | 9,478 | 26.6% | ||||||||||||||||||||||||
|
|
|
|
|
|
|
|
|
|
|
|
|
|
|
|||||||||||||||||||
| 49 | 14,643 | 100.0% | $ | 2,576,736 | $ | 1,557,315 | 60.4% | $ | 35,589 | 100.0% | ||||||||||||||||||||||
(3) Secured revolving credit facility is secured by a pledge of the equity interests of certain of the Company’s subsidiaries.
(4) Secured by mortgages.
(5) Gross asset calculation excludes goodwill, cash, prepaids and other assets recorded at our corporate level.
23
RESOURCE REIT, INC.
Supplemental and Combined Capital Analysis
| (Dollars in thousands) | As of | |||||||||||
|
|
|
| ||||||||||
| September 30, 2021 |
September 30, 2020 |
June 30, 2021 | ||||||||||
|
|
|
| ||||||||||
| Capitalization: |
||||||||||||
| NAV, per share |
$ | 9.06 | $ | 9.12 | $ | 9.06 | ||||||
| Common shares & OP units outstanding |
165,637 | 165,775 | 165,941 | |||||||||
|
|
|
|
|
|
|
|
|
| ||||
| Market value of common equity |
1,500,671 | 1,511,868 | 1,503,425 | |||||||||
| Preferred Operating Partnership Unit Liquidation Value |
- | 63,993 | 63,993 | |||||||||
|
|
|
|
|
|
|
|
|
| ||||
| Equity capitalization |
1,500,671 | 1,575,861 | 1,567,418 | |||||||||
| Total mortgage debt (1) |
1,557,315 | 1,497,797 | 1,561,202 | |||||||||
| Secured revolving credit facility |
- | - | - | |||||||||
|
|
|
|
|
|
|
|
|
| ||||
| Total debt outstanding |
1,557,315 | 1,497,797 | 1,561,202 | |||||||||
| Less: Cash and cash equivalents |
(107,224 | ) | (103,846 | ) | (174,604 | ) | ||||||
|
|
|
|
|
|
|
|
|
| ||||
| Total net debt |
1,450,091 | 1,393,951 | 1,386,598 | |||||||||
|
|
|
|
|
|
|
|
|
| ||||
| Total Enterprise Value |
$ | 2,950,762 | $ | 2,969,812 | $ | 2,954,016 | ||||||
|
|
|
|
|
|
|
|
|
| ||||
| Adjusted EBITDA (2) |
$ | 29,856 | $ | 21,894 | $ | 27,891 | ||||||
| Total Net Debt / Adjusted EBITDA (3) |
12.1 | x | 15.9 | x | 12.4 | x | ||||||
| Total Net Debt / Enterprise Value |
49.1 | % | 46.9 | % | 46.9 | % | ||||||
(1) Total mortgage debt breakdown presented on pg. 21 for September 30, 2021.
(2) Adjusted EBITDA reconcilation presented on pg. 16.
(3) Adjusted EBITDA is shown on an annualized basis for periods shorter than one year.
24
RESOURCE REIT, INC.
Supplemental and Combined Capital Expenditures (1)
| (Dollars in thousands, except per unit) | Three Months Ended September 30, |
Nine Months Ended September 30, | ||||||||||||||
|
|
|
|
|
|
| |||||||||||
| 2021 | 2020 | 2021 (2) | 2020 | |||||||||||||
|
|
|
| ||||||||||||||
| Total Same-Store properties / units |
14,643 | 14,643 | 14,643 | 14,643 | ||||||||||||
| Recurring |
$ | 2,369 | $ | 1,301 | $ | 4,397 | $ | 3,543 | ||||||||
| Non-Recurring |
890 | 1,521 | 4,469 | 3,263 | ||||||||||||
|
|
|
|
|
|
|
|
|
|
|
|
| |||||
| Capital Expenditures - Same Store |
$ | 3,259 | $ | 2,822 | $ | 8,866 | $ | 6,806 | ||||||||
| Capital Expenditures, per unit - Same Store |
$ | 223 | $ | 193 | $ | 605 | $ | 465 | ||||||||
| Value Add |
1,174 | 425 | 2,331 | 9,288 | ||||||||||||
|
|
|
|
|
|
|
|
|
|
|
|
| |||||
| Total Capital Spend - Same Store |
$ | 4,433 | $ | 3,247 | $ | 11,197 | $ | 16,094 | ||||||||
| Total Capital Spend, per unit - Same Store |
$ | 303 | $ | 222 | $ | 765 | $ | 1,099 | ||||||||
| All properties / units |
14,643 | 14,995 | 14,995 | 14,995 | ||||||||||||
| Recurring |
$ | 2,369 | $ | 1,338 | $ | 4,447 | $ | 3,642 | ||||||||
| Non-Recurring |
890 | 1,521 | 4,481 | 3,271 | ||||||||||||
|
|
|
|
|
|
|
|
|
|
|
|
| |||||
| Capital Expenditures - All |
$ | 3,259 | $ | 2,859 | $ | 8,928 | $ | 6,913 | ||||||||
| Capital Expenditures, per unit - All |
$ | 223 | $ | 191 | $ | 595 | $ | 461 | ||||||||
| Value Add |
1,174 | 456 | 2,331 | 9,319 | ||||||||||||
|
|
|
|
|
|
|
|
|
|
|
|
| |||||
| Total Capital Spend - All |
$ | 4,433 | $ | 3,315 | $ | 11,259 | $ | 16,232 | ||||||||
| Total Capital Spend, per unit - All |
$ | 303 | $ | 221 | $ | 751 | $ | 1,082 | ||||||||
(1) The above table reflects total capital spent on fixed assets placed in service for the periods presented.
(2) Column includes total capital spent on fixed assets for Evergreen @ Coursey Place until its sale on 6/29/2021.
25
RESOURCE REIT, INC.
Non-GAAP Financial Measures and Other Definitions
Average Occupancy
Average occupancy represents the daily average occupied units for the reporting period divided by the total number of units, expressed as a percentage.
Earnings Before Interest, Taxes, Depreciation and Amortization (“EBITDA”) and Adjusted EBITDA
EBITDA and Adjusted EBITDA are non-GAAP financial measures. EBITDA represents net income (loss) (computed in accordance with GAAP) before interest expense, including amortization of deferred financing costs, income tax expense and depreciation and amortization expenses.
Adjusted EBITDA further excludes certain other non-cash or non-operating gains or losses related to items such as asset sales, debt extinguishments and acquisition related debt extinguishment expenses, casualty losses, transaction and related Merger costs and abandoned deal costs. The Company considers both EBITDA and Adjusted EBITDA to be appropriate supplemental measures of performance because they eliminate interest, income taxes, depreciation and amortization, other non-cash or non-operating gains and losses and one-time items which permit investors to view income from operations without these non-cash or non-operating items.
Funds From Operations (“FFO”) and Core FFO
FFO and Core FFO are non-GAAP financial performance measures. FFO is widely recognized as a measure of operating performance for a REIT. The Company uses FFO as defined by Nareit to be net income or loss, computed in accordance with GAAP, excluding depreciation and amortization related to real estate, gains and losses from the sale of certain real estate assets, impairment write-downs of certain real estate assets and investments in entities when the impairment is directly attributable to decreases in the value of depreciable real estate held by the entity and after related adjustments for noncontrolling interests. The Company believes that FFO is helpful to investors and management as a measure of operating performance.
Core FFO includes certain adjustments to FFO for non-routine items or items not considered core to business operations. Core FFO adjusts FFO to exclude equity compensation expense, losses on extinguishment of debt and modification costs, transaction (including Self-Management) costs, amortization of deferred financing costs, amortization of intangible lease assets, debt premium or discount amortization, realized losses on fair value adjustments related to interest rate caps, and casualty gains and losses. The Company believes that Core FFO is helpful to investors and management as a measure of operating performance.
Generally Accepted Accounting Principles (“GAAP”)
The Company defines GAAP as generally accepted accounting principles in the United States.
Interest Coverage
Interest coverage is a ratio computed by dividing Adjusted EBITDA by interest expense.
26
RESOURCE REIT, INC.
Net Debt
Net debt is calculated as total debt less cash and cash equivalents. The Company believes that Net Debt is a helpful measure of its credit position and progress towards reducing overall leverage.
Supplemental and Combined Reconciliation of Debt to Net Debt
| (Dollars in thousands) | As of | |||||||||||||||||||
| September 30, 2021 |
September 30, 2020 |
June 30, 2021 |
||||||||||||||||||
| Total mortgage debt |
$ | 1,557,315 | $ | 1,497,797 | $ | 1,561,202 | ||||||||||||||
| Secured revolving credit facility |
- | - | - | |||||||||||||||||
| Total debt outstanding |
1,557,315 | 1,497,797 | 1,561,202 | |||||||||||||||||
| Less: Cash and cash equivalents |
(107,224 | ) | (103,846) | (174,604) | ||||||||||||||||
| Total net debt |
$ | 1,450,091 | $ | 1,393,951 | $ | 1,386,598 | ||||||||||||||
| Adjusted EBITDA |
$ | 29,856 | $ | 21,894 | $ | 27,891 | ||||||||||||||
| Total Net Debt / Adjusted EBITDA |
12.1 | x | 15.9x | 12.4x | ||||||||||||||||
| Enterprise Value |
$ | 2,950,762 | $ | 2,969,812 | $ | 2,954,016 | ||||||||||||||
| Total Net Debt / Enterprise Value |
49.1% | 46.9% | 46.9% | |||||||||||||||||
Net Effective Rent Per Occupied Unit
Net effective rent per occupied unit represents the average of gross potential rent net of gain/loss to lease, less vacancy, non-revenue units and concessions, divided by the average occupancy (in units) for the period presented.
Net Operating Income (“NOI”)
NOI is a non-GAAP financial performance measure. The Company defines NOI as total property revenue less total property expenses, excluding interest expense, depreciation and amortization and non-recurring and recurring expenses that are not reflective of the continuing operations of the properties. The Company uses NOI to evaluate the performance of the portfolio on a Same Store and Non-Same Store basis because it reflects the core operations of property performance without the other corporate level and non-recurring items not related to the Company’s properties and their continuing operations. NOI should only be used as an alternative measure of performance.
Preferred OP Units
Preferred OP Units are the Series A Cumulative Participating Redeemable Preferred Units in RRE Opportunity II, LP, the Company’s operating partnership.
Same Store Properties and Same Store Portfolio
The Company defines Same Store properties as properties that were in the Company’s portfolio for the entirety of the comparative periods presented. The Company reviews the Same Store portfolio at the beginning of each calendar year and adds properties that were owned at the beginning of the previous year. Properties that have been sold are excluded from the Same Store portfolio. The Company believes this is helpful when comparing to prior period results.
27
RESOURCE REIT, INC.
Total Gross Assets
Total Gross Assets equals total assets plus accumulated depreciation and amortization, including fully depreciated real estate assets that are still in service. The following table provides a reconciliation of total assets to total gross assets.
| (Dollars in thousands) | As of | |||||||||||||||||||
| September 30, 2021 |
September 30, 2020 |
June 30, 2021 |
||||||||||||||||||
| Total assets |
$ | 2,410,937 | $ | 2,107,133 | $ | 2,495,580 | ||||||||||||||
| Plus: accumulated depreciation |
327,426 | 442,984 | 304,558 | |||||||||||||||||
| Plus: accumulated amortization |
34,553 | 48,972 | 33,373 | |||||||||||||||||
| Total gross assets |
$ | 2,772,916 | $ | 2,599,089 | $ | 2,833,511 | ||||||||||||||
28