
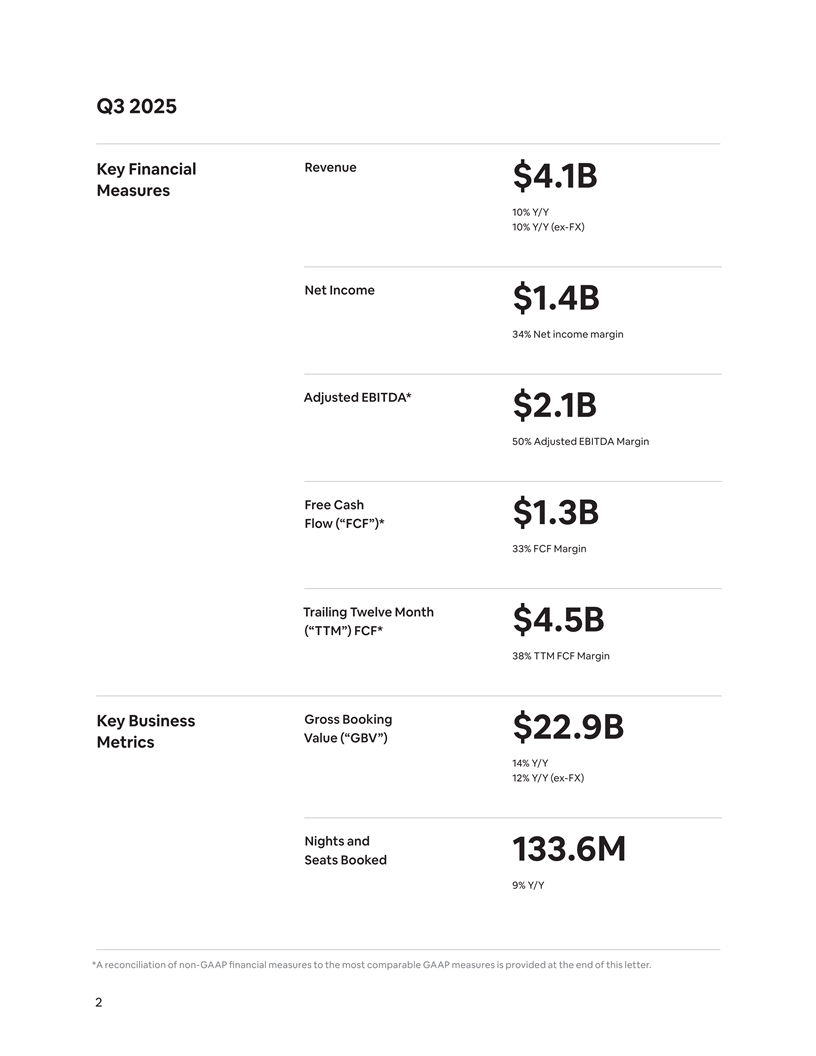
Q3 2025 Revenue Key Financial $4.1B Measures 10% Y/Y 10% Y/Y (ex-FX) Net Income $1.4B 34% Net income margin Adjusted EBITDA* $2.1B 50% Adjusted EBITDA Margin Free Cash $1.3B Flow (“FCF”)* 33% FCF Margin Trailing Twelve Month $4.5B (“TTM”) FCF* 38% TTM FCF Margin Gross Booking Key Business $22.9B Value (“GBV”) Metrics 14% Y/Y 12% Y/Y (ex-FX) Nights and 133.6M Seats Booked 9% Y/Y *A reconciliation of non-GAAP financial measures to the most comparable GAAP measures is provided at the end of this letter. 2
Q3 2025 Shareholder Letter Q3 2025 was another strong quarter for Airbnb. Revenue increased 10% year-over-year, landing at the high end of our guidance range. Adjusted EBITDA was over $2.0 billion, our highest in any quarter. Gross Booking Value increased 14% year-over-year, while Nights and Seats Booked rose by 9%. Both metrics accelerated from Q2 and exceeded our expectations, driven by the strength in the U.S. market and ADR. We’re driving continued growth by focusing on four key areas: making our service better, bringing Airbnb to more parts of the world, expanding what we offer, and integrating AI into our app. Here are some of the highlights: We’re making Airbnb better for hosts and guests: This quarter, we announced dozens of new features that make it easier to book the perfect stay, manage your reservation, and discover more options in great locations. Here are a few of them: ¦ Reserve Now, Pay Later—We know guests want more flexible ways to pay, so we recently introduced a feature in the U.S. that gives guests the option to reserve an eligible stay and pay $0 upfront. This helped drive the acceleration of Nights and Seats Booked in Q3, and we’ll continue rolling it out more broadly in the coming months. ¦ Updated cancellation policies—We’re helping hosts earn more and guests make changes more easily by updating our cancellation policies. Hosts can now choose a new policy that allows guests to cancel for free up to 14 days before check-in. And for all stays under 28 nights, guests can cancel for a full refund up to 24 hours after their reservation is confirmed, if they book more than 7 days before check-in. Initial tests show that these changes are reducing customer service cases and increasing annualized bookings. ¦ Improved maps—When guests are looking at a potential Airbnb, they’ll see nearby landmarks, public transit, restaurants and more. Later this year, guests will also be able to see different map views, including satellite, street, and transit. ¦ Flexible carousels—When guests search for a place to stay, they’ll see homes just outside their search criteria—like places with similar prices, different amenities, or stays in nearby 1 towns for less. The goal is to drive bookings by making it easier for guests to find amazing stays they might have otherwise missed. We’re bringing Airbnb to more parts of the world: International expansion continues to be a significant growth opportunity for us, and the team is executing against a multi-year strategy that’s already off to a strong start. The average growth rate of nights booked on an origin basis in our expansion markets continues to be twice that of our core markets over the last 12 months. Our strategy includes attracting new users to the platform, and we’re seeing big wins in some of our key markets. First-time bookers increased over 20% in Japan and nearly 50% in India on a year-over-year basis. 1 Flexible location carousels are currently available to a limited number of guests, with broader availability anticipated in early 2026. 3
We’re expanding what we oe ff r: In May, we took the first step in expanding Airbnb beyond stays with the launch of Airbnb Services and reimagined Airbnb Experiences. Since launch, feedback from guests has been overwhelmingly positive— with services and experiences receiving an average rating of 4.93 out of 5 stars. These new offerings are also bringing new people to the platform. In Q3 2025, almost half of experiences bookings were not attached to an Airbnb accommodations booking. While scaling high-quality supply will take time, we’ve received over 110,000 applications from potential services and experiences hosts. At the same time, we’re continuing to roll out new features that make these offerings even better, starting with social features aimed at bringing people together in the real world: ¦ Who’s going—Before guests book an Airbnb Experience, we’ll show them who else is going, and where they’re from. ¦ Direct messaging—Guests can now request to directly message other guests they met during an experience to keep in touch or plan their next experience, right in the app. ¦ Connections in profile— In the Connections section of the Airbnb Profile tab, guests can see the people they’ve met on experiences so it’s easy to reconnect. Finally, we’re integrating AI into our app: Over the past year, we’ve been laying the foundation for a more intelligent, more personalized Airbnb— from rebuilding our tech stack to launching a series of new AI features. A few highlights include: ¦ Smarter AI customer support—Our AI assistant is getting even better with smarter responses, including answers tailored to your reservation or listing. It also lets you take common actions—like canceling or changing reservation dates—directly from the chat. ¦ AI customer support in more places—We initially launched in the U.S., where our AI assistant has already reduced people’s need to contact a human agent by around 15%. It’s also helped some people get significantly faster help, cutting the typical resolution time from hours to seconds. We’re now expanding it, starting with Spanish in Mexico, with more countries and languages to come. ¦ AI-powered search—We’re currently building out AI-powered search that will let people have a conversation with the app about what they’re looking for so we can help them design the perfect trip. These eo ff rts mark the beginning of a major transformation to make Airbnb a more complete, AI-powered platform for connecting people in the real world. At a time when most companies are trying to keep you glued to a device, we remain focused on bringing people together. That’s a long-term vision, but we’re already building toward it. 4
Outlook Our Q3 2025 results demonstrate our continued focus on driving faster growth, as year-over-year growth of nights booked accelerated relative to Q2 2025. In October, we continued to see strong demand despite more difficult year-over-year comparisons. Specifically, we are seeing strength in longer lead time bookings, in part driven by our Reserve Now, Pay Later offering in the U.S., supporting our positive outlook for the rest of the year. ¦ Q4 Revenue. In Q4 2025, we expect to generate revenue of $2.66 billion to $2.72 billion, representing year-over-year growth of 7% to 10%, inclusive of a small foreign exchange tailwind after factoring in our hedging program. We anticipate our implied take rate in Q4 2025 to be relatively flat year-over year. ¦ Q4 GBV and Nights and Seats Booked. In Q4 2025, we expect our GBV to grow low-double- digits year-over-year. We anticipate our GBV to benefit from a modest increase in ADR, primarily due to price appreciation and FX, as well as continued growth in Nights and Seats Booked. In Q4 2025, we expect year-over-year growth of Nights and Seats Booked in the mid-single-digit range due to the challenging Q4 2024 comparison. ¦ Full-Year Adjusted EBITDA. For the full-year 2025, we now expect to deliver an Adjusted EBITDA Margin of approximately 35%. We expect Adjusted EBITDA in Q4 2025 to be flat- to-down slightly on a year-over-year basis and for Adjusted EBITDA Margin to decline over the same time period, primarily driven by investments in new growth and policy initiatives. Consistent with our prior update, this includes investing approximately $200 million towards services and experiences in 2025. As we look forward to 2026, we are focused on maintaining strong margins while continuing to invest in growth initiatives. 5

A CLOSER LOOK Local investment, global returns Airbnb is synonymous with authentic travel. But as an American company, showing up authentically in markets around the world depends on our ability to connect at the local level. So we’re investing in and empowering local teams to create campaigns that reflect the language, culture, and behaviors of their communities—helping us become a brand that truly belongs anywhere. Adding flexible payments in Brazil Tapping into local preferences and behaviors, we introduced fee- free installments up to 6 months. Giving guests in Brazil this option has already accounted for nearly 50% of total bookings value in Q3. Tapping cultural insights in Korea Leveraging social partnerships in Japan Often called “Korean Thanksgiving,” Chuseok is becoming a big This year, a major event in the Kansai region was set to draw moment for overseas travel. So we spotlighted trip-planners to crowds to Osaka and its hotels. So we tapped local influencers share their Airbnb stays abroad. Compared to last year’s holiday, to show off flexible, group-friendly alternatives on Airbnb. nights booked increased 67%.1 Compared to last year, nights booked increased more than 30%.2 1 Chuseok’s dates change every year. Our internal nights booked data on an origin basis compares Oct 3-12, 2025 to Sept 13-22, 2024, and may reflect other factors. 6 2 Our internal nights booked data compares Apr-Sept, 2025 to Apr-Sept, 2024, and may reflect other factors.
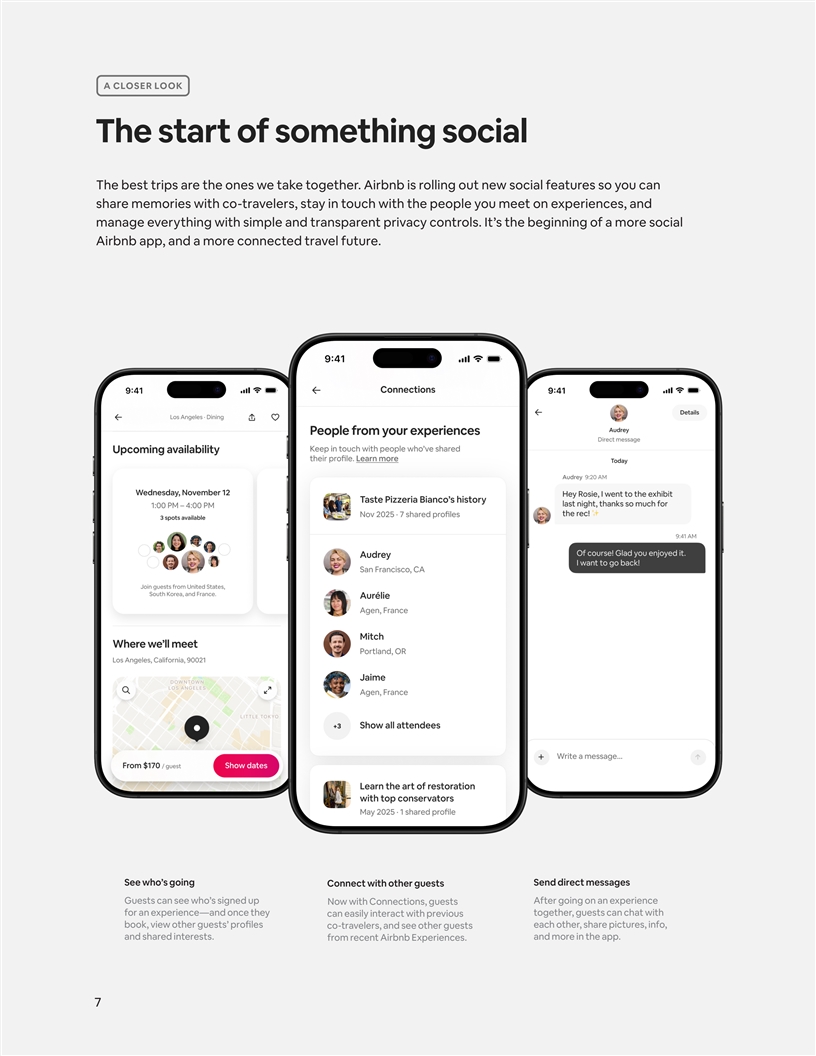
A CLOSER LOOK The start of something social The best trips are the ones we take together. Airbnb is rolling out new social features so you can share memories with co-travelers, stay in touch with the people you meet on experiences, and manage everything with simple and transparent privacy controls. It’s the beginning of a more social Airbnb app, and a more connected travel future. See who’s going Send direct messages Connect with other guests Guests can see who’s signed up After going on an experience Now with Connections, guests for an experience—and once they together, guests can chat with can easily interact with previous book, view other guests’ profiles each other, share pictures, info, co-travelers, and see other guests and shared interests. and more in the app. from recent Airbnb Experiences. 7
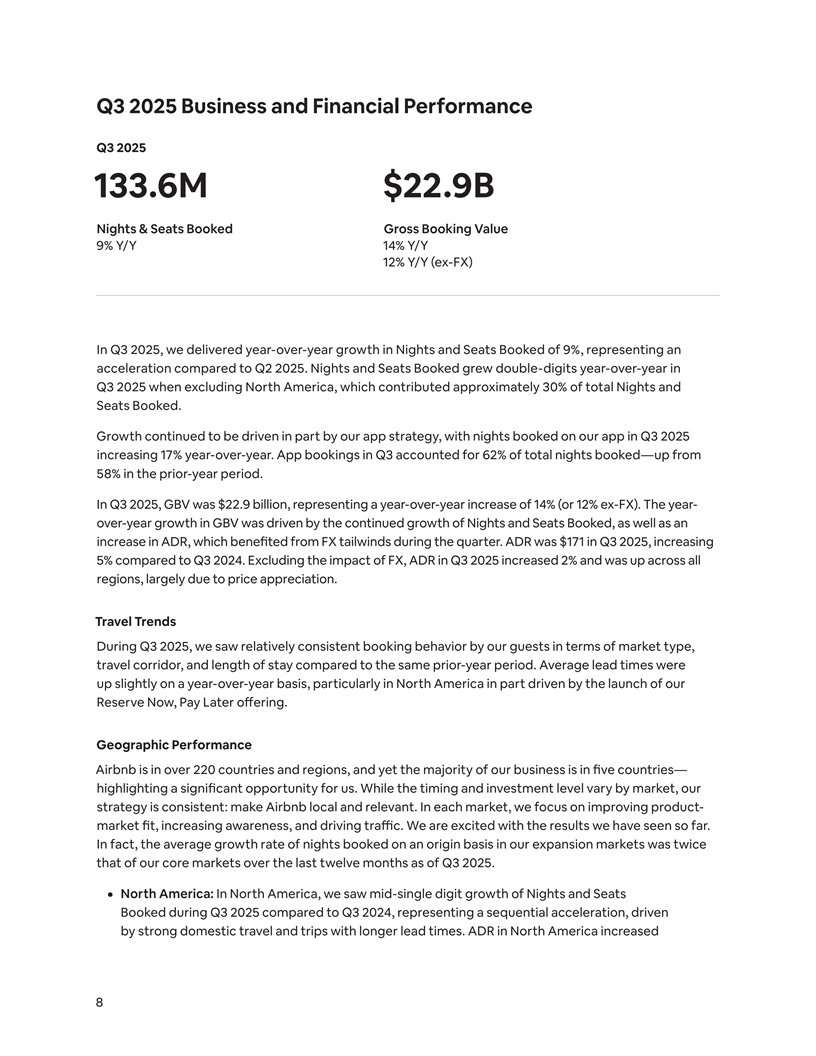
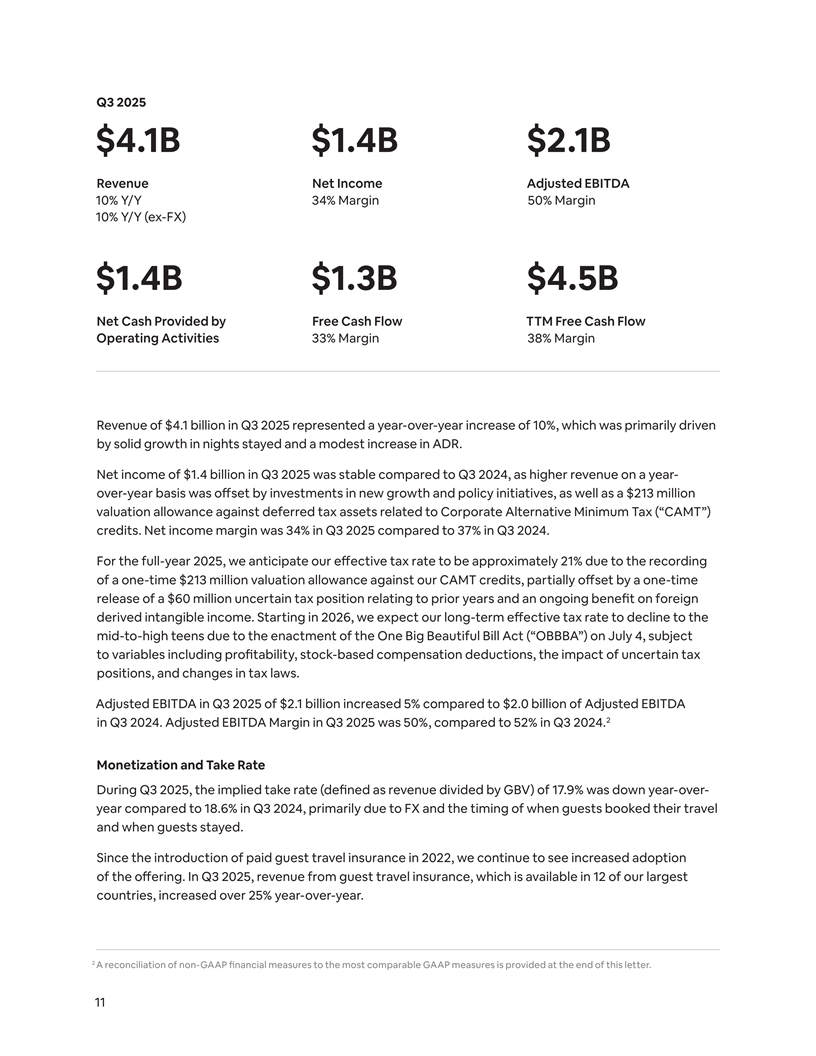
Q3 2025 Business and Financial Performance Q3 2025 133.6M $22.9B Nights & Seats Booked Gross Booking Value 9% Y/Y 14% Y/Y 12% Y/Y (ex-FX) In Q3 2025, we delivered year-over-year growth in Nights and Seats Booked of 9%, representing an acceleration compared to Q2 2025. Nights and Seats Booked grew double-digits year-over-year in Q3 2025 when excluding North America, which contributed approximately 30% of total Nights and Seats Booked. Growth continued to be driven in part by our app strategy, with nights booked on our app in Q3 2025 increasing 17% year-over-year. App bookings in Q3 accounted for 62% of total nights booked—up from 58% in the prior-year period. In Q3 2025, GBV was $22.9 billion, representing a year-over-year increase of 14% (or 12% ex-FX). The year- over-year growth in GBV was driven by the continued growth of Nights and Seats Booked, as well as an increase in ADR, which benefited from FX tailwinds during the quarter. ADR was $171 in Q3 2025, increasing 5% compared to Q3 2024. Excluding the impact of FX, ADR in Q3 2025 increased 2% and was up across all regions, largely due to price appreciation. Travel Trends During Q3 2025, we saw relatively consistent booking behavior by our guests in terms of market type, travel corridor, and length of stay compared to the same prior-year period. Average lead times were up slightly on a year-over-year basis, particularly in North America in part driven by the launch of our Reserve Now, Pay Later offering. Geographic Performance Airbnb is in over 220 countries and regions, and yet the majority of our business is in five countries— highlighting a significant opportunity for us. While the timing and investment level vary by market, our strategy is consistent: make Airbnb local and relevant. In each market, we focus on improving product- market fit, increasing awareness, and driving traffic. We are excited with the results we have seen so far. In fact, the average growth rate of nights booked on an origin basis in our expansion markets was twice that of our core markets over the last twelve months as of Q3 2025. ¦ North America: In North America, we saw mid-single digit growth of Nights and Seats Booked during Q3 2025 compared to Q3 2024, representing a sequential acceleration, driven by strong domestic travel and trips with longer lead times. ADR in North America increased 8
5% in Q3 2025 compared to Q3 2024, primarily driven by mix shift. Growth in short-term stays and entire homes continued to outpace long-term stays (trips of 28 days or more) and private rooms, respectively, helping to drive the mix shift. In August, we launched our Reserve Now, Pay Later payment option within the U.S., which allows guests to pay $0 upfront when they book eligible domestic stays. We are encouraged by the early results. The introduction of Reserve Now, Pay Later helped drive the acceleration of Nights and Seats Booked in North America during Q3 2025. While we expect some cancellations closer to the date of stay, which may or may not occur in the same booking quarter, we expect a net benefit to overall bookings based on prior testing. ¦ EMEA: In EMEA, we saw mid-single digit growth in Nights and Seats Booked during Q3 2025 compared to Q3 2024. During Q3 2025, we faced a slightly unfavorable year-over-year comparison within the region due to the Paris Summer Olympic and Paralympic Games in 2024. ADR in EMEA increased 10% in Q3 2025 compared to Q3 2024 primarily driven by FX. On an ex-FX basis, ADR increased 4% compared to Q3 2024, primarily due to price appreciation. ¦ Latin America: In Latin America, we saw low-20s growth in Nights and Seats Booked during Q3 2025 compared to Q3 2024. ADR in Latin America increased 4% in Q3 2025 compared to Q3 2024, primarily driven by price appreciation and FX. On an ex-FX basis, ADR increased 3% compared to Q3 2024. Brazil continued to drive meaningful growth across the region, with origin nights booked increasing over 20% and the number of first-time bookers increasing 17% in Q3 2025 compared to Q3 2024. As part of our eo ff rts around localization, in July, we expanded our payment options in the country by introducing interest-free installment plans for up to six months. As a result, we saw the share of bookers in Brazil choosing an installment payment option more than double, helping to drive higher bookings during Q3 2025. ¦ Asia Pacific: In Asia Pacific, we saw mid-teens growth in Nights and Seats Booked during Q3 2025 compared to Q3 2024. ADR in Asia Pacific increased 2% in Q3 2025 compared to Q3 2024, primarily driven by price appreciation. On an ex-FX basis, ADR increased 3% compared to Q3 2024. Our expansion playbook in Asia Pacific continues to yield positive results. In Japan, nights booked for domestic travel in Q3 2025 increased 27% year-over-year, representing the third consecutive quarter of acceleration. Our strategy is also attracting new users to the platform more broadly across Asia Pacific, with first-time bookers increasing over 20% in Japan and nearly 50% in India on a year-over-year basis. Supply Our supply continued to grow at a healthy pace in Q3 2025, with active listings growing approximately in-line with Nights and Seats Booked. We continued to see growth in both high-density urban and non-urban destinations, with the most growth in those regions with the highest demand—Latin America and Asia Pacific. We remain focused on improving the quality of supply on our platform to help our guests find the best places to stay. Since launching our updated hosting quality system in 2023, we’ve removed over 9

550,000 listings, and we saw a year-over-year reduction in customer service issue rates and credit card chargeback rates during Q3 2025. We also made it easier for guests to find the best places to stay with Guest Favorites. Since launch, we have seen nearly 500 million nights booked at Guest Favorite listings. 10
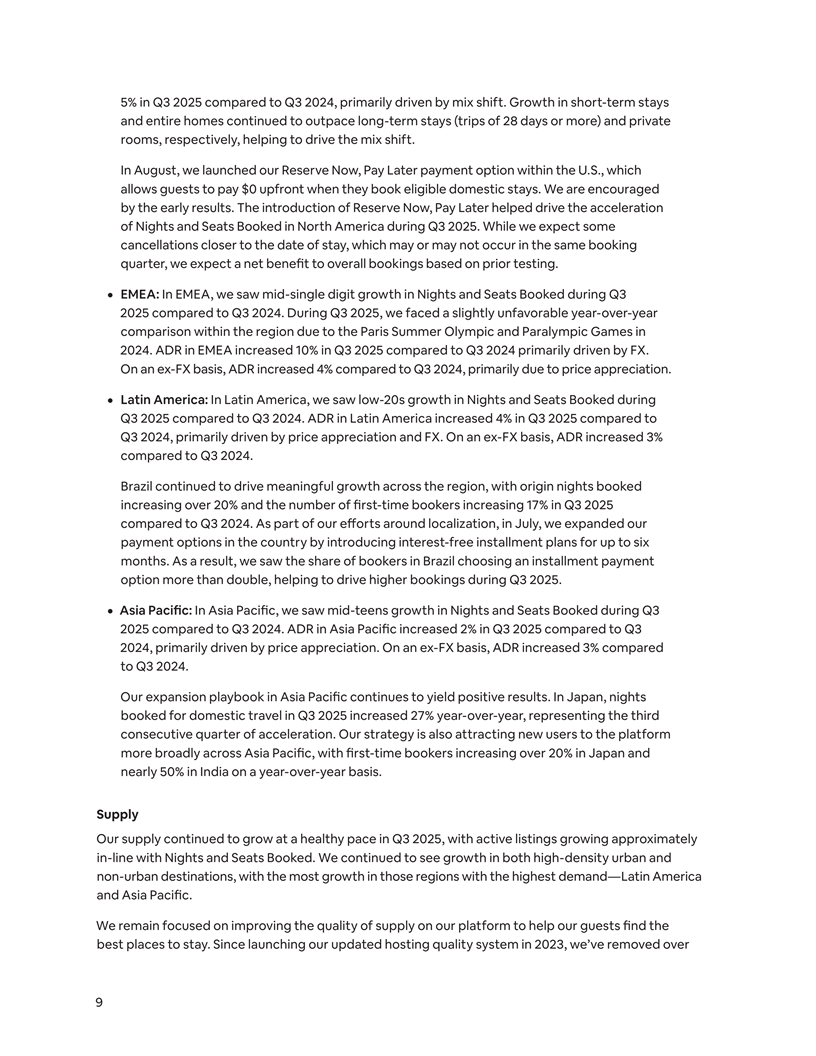
Q3 2025 $4.1B $1.4B $2.1B Revenue Net Income Adjusted EBITDA 10% Y/Y 34% Margin 50% Margin 10% Y/Y (ex-FX) $1.4B $1.3B $4.5B Net Cash Provided by Free Cash Flow TTM Free Cash Flow Operating Activities 33% Margin 38% Margin Revenue of $4.1 billion in Q3 2025 represented a year-over-year increase of 10%, which was primarily driven by solid growth in nights stayed and a modest increase in ADR. Net income of $1.4 billion in Q3 2025 was stable compared to Q3 2024, as higher revenue on a year- over-year basis was offset by investments in new growth and policy initiatives, as well as a $213 million valuation allowance against deferred tax assets related to Corporate Alternative Minimum Tax (“CAMT”) credits. Net income margin was 34% in Q3 2025 compared to 37% in Q3 2024. For the full-year 2025, we anticipate our effective tax rate to be approximately 21% due to the recording of a one-time $213 million valuation allowance against our CAMT credits, partially offset by a one-time release of a $60 million uncertain tax position relating to prior years and an ongoing benefit on foreign derived intangible income. Starting in 2026, we expect our long-term effective tax rate to decline to the mid-to-high teens due to the enactment of the One Big Beautiful Bill Act (“OBBBA”) on July 4, subject to variables including profitability, stock-based compensation deductions, the impact of uncertain tax positions, and changes in tax laws. Adjusted EBITDA in Q3 2025 of $2.1 billion increased 5% compared to $2.0 billion of Adjusted EBITDA 2 in Q3 2024. Adjusted EBITDA Margin in Q3 2025 was 50%, compared to 52% in Q3 2024. Monetization and Take Rate During Q3 2025, the implied take rate (defined as revenue divided by GBV) of 17.9% was down year-over- year compared to 18.6% in Q3 2024, primarily due to FX and the timing of when guests booked their travel and when guests stayed. Since the introduction of paid guest travel insurance in 2022, we continue to see increased adoption of the offering. In Q3 2025, revenue from guest travel insurance, which is available in 12 of our largest countries, increased over 25% year-over-year. 2 A reconciliation of non-GAAP financial measures to the most comparable GAAP measures is provided at the end of this letter. 11

In October, we took steps to simplify our fee structure, which we believe will help our hosts price more competitively. We migrated property management software (“PMS”) hosts on our split fee structure (where hosts paid a 3% fee and guests paid a separate service fee) to a single 15.5% single service fee. Non-PMS hosts currently on our single service fee structure will also see the 15.5% fee applied to their listings. These hosts are able to adjust their prices to maintain the same net earnings and guests will continue to see the full price upfront. 12
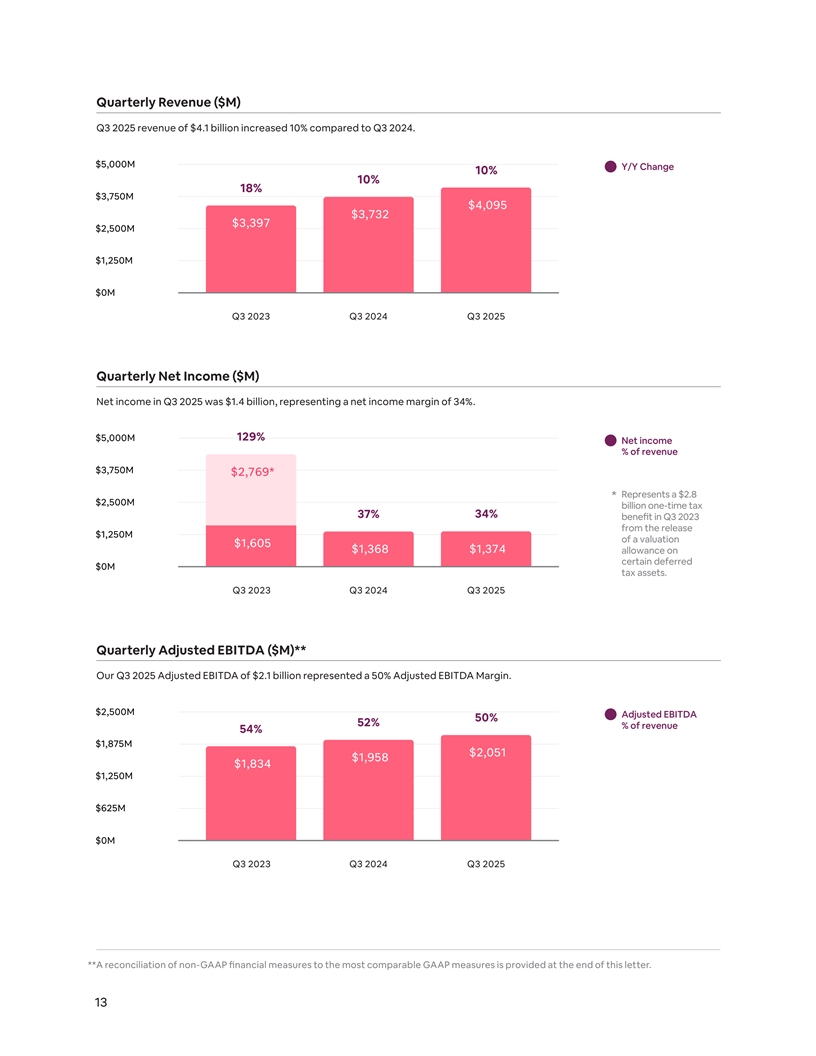
Quarterly Revenue ($M) Q3 2025 revenue of $4.1 billion increased 10% compared to Q3 2024. $5,000M Y/Y Change 10% 10% 18% $3,750M $4,095 $3,732 $3,397 $2,500M $1,250M $0M Q3 2023 Q3 2024 Q3 2025 Quarterly Net Income ($M) Net income in Q3 2025 was $1.4 billion, representing a net income margin of 34%. $5,000M 129% Net income % of revenue $3,750M $2,769* Represents a $2.8 * $2,500M billion one-time tax 37% 34% benefit in Q3 2023 from the release $1,250M of a valuation $1,605 $1,368 $1,374 allowance on certain deferred $0M tax assets. Q3 2023 Q3 2024 Q3 2025 Quarterly Adjusted EBITDA ($M)** Our Q3 2025 Adjusted EBITDA of $2.1 billion represented a 50% Adjusted EBITDA Margin. $2,500M Adjusted EBITDA 50% 52% % of revenue 54% $1,875M $2,051 $1,958 $1,834 $1,250M $625M $0M Q3 2023 Q3 2024 Q3 2025 **A reconciliation of non-GAAP financial measures to the most comparable GAAP measures is provided at the end of this letter. 13
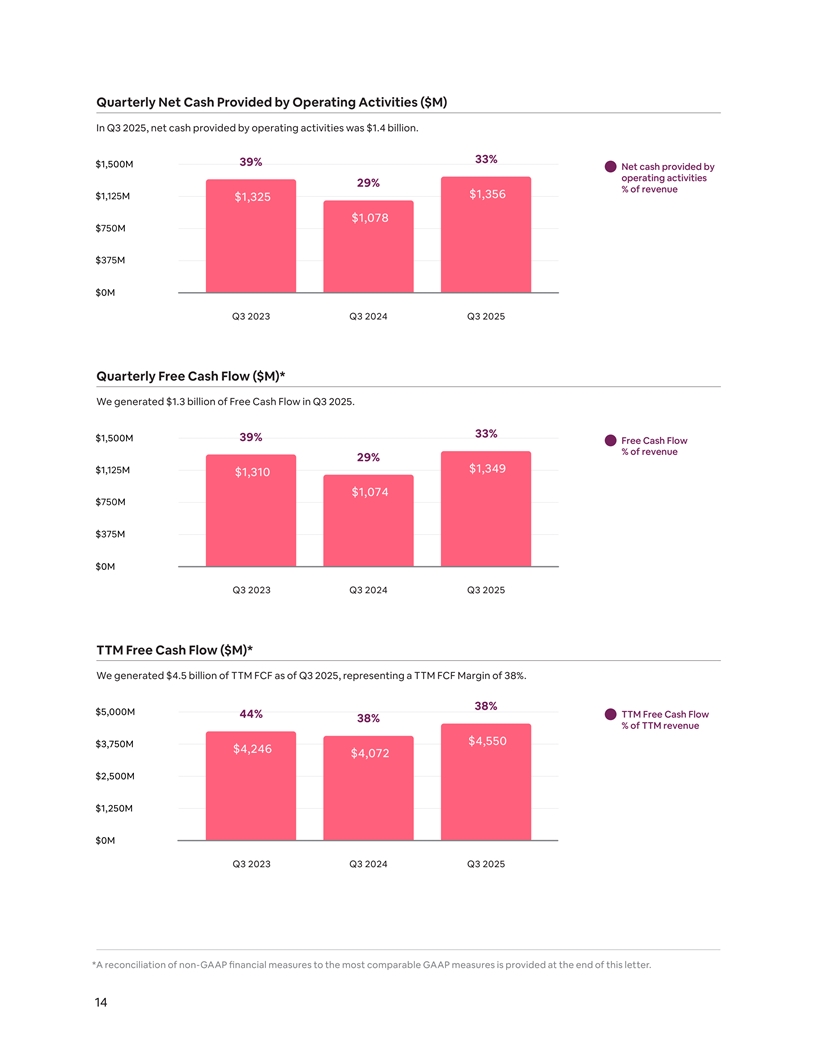
Quarterly Net Cash Provided by Operating Activities ($M) In Q3 2025, net cash provided by operating activities was $1.4 billion. 33% 39% $1,500M Net cash provided by operating activities 29% % of revenue $1,356 $1,125M $1,325 $1,078 $750M $375M $0M Q3 2023 Q3 2024 Q3 2025 Quarterly Free Cash Flow ($M)* We generated $1.3 billion of Free Cash Flow in Q3 2025. 33% $1,500M 39% Free Cash Flow % of revenue 29% $1,125M $1,349 $1,310 $1,074 $750M $375M $0M Q3 2023 Q3 2024 Q3 2025 TTM Free Cash Flow ($M)* We generated $4.5 billion of TTM FCF as of Q3 2025, representing a TTM FCF Margin of 38%. 38% $5,000M TTM Free Cash Flow 44% 38% % of TTM revenue $4,550 $3,750M $4,246 $4,072 $2,500M $1,250M $0M Q3 2023 Q3 2024 Q3 2025 *A reconciliation of non-GAAP financial measures to the most comparable GAAP measures is provided at the end of this letter. 14
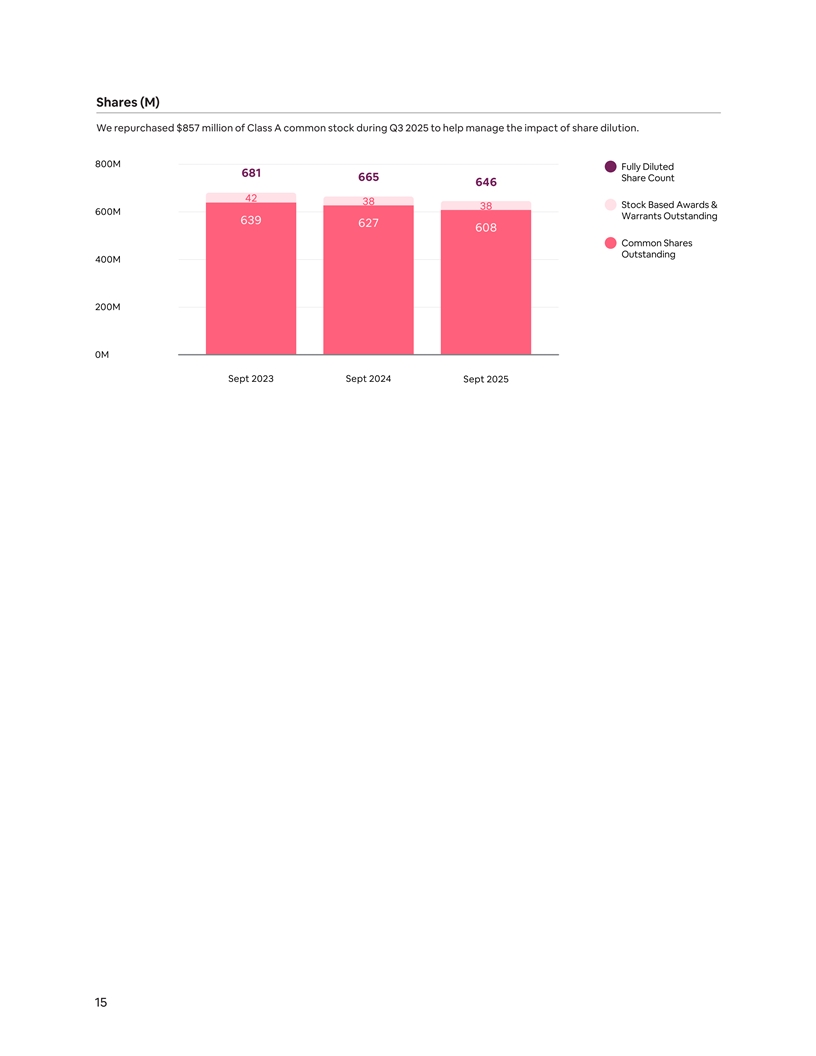
Shares (M) We repurchased $857 million of Class A common stock during Q3 2025 to help manage the impact of share dilution. 800M Fully Diluted 681 665 Share Count 646 42 38 Stock Based Awards & 38 600M Warrants Outstanding 639 627 608 Common Shares Outstanding 400M 200M 0M Sept 2023 Sept 2024 Sept 2025 15
Balance Sheet and Cash Flows For the three months ended September 30, 2025, we reported $1.4 billion of net cash provided by operating activities and $1.3 billion of FCF, highlighting the strength of our cash-generating 3 business model. As of September 30, 2025, we had $11.7 billion of cash and cash equivalents, short-term investments, and restricted cash, as well as $7.2 billion of funds held on behalf of guests. Capital Allocation During Q3 2025, we repurchased $857 million of our Class A common stock. As of September 30, 2025, we had the authorization to purchase up to $6.6 billion of our Class A common stock under our share repurchase programs, including the $6 billion share repurchase authorization announced last quarter. The repurchase program continues to be executed as part of our broader capital allocation strategy which prioritizes investments in organic growth, strategic acquisitions or partnerships, and return of capital to shareholders, in that order. Our strong balance sheet and significant cash flow generation provides us the opportunity to pursue all three capital allocation priorities. In addition to our share repurchase program, we use corporate cash to make required tax payments associated with the vesting of employee RSUs, and withhold a corresponding number of shares from employees. Since the inception of our share repurchases in Q3 2022, our fully diluted share count has decreased approximately 8%, driven in part by our share repurchases and cash used for employee tax obligations totaling $12.4 billion. Earnings Webcast Airbnb will host an audio webcast to discuss its third quarter results at 2:00 p.m. PT / 5:00 p.m. ET on November 6, 2025. The link to the webcast will be made available on the Investor Relations website at https://investors.airbnb.com. Interested parties can register for the call in advance by visiting https://registrations.events/direct/ Q4I6636564. After registering, instructions will be shared on how to join the call. Investor Relations Contact: ir@airbnb.com Press Contact: contact.press@airbnb.com 3 A reconciliation of non-GAAP financial measures to the most comparable GAAP measures is provided at the end of this letter. 16

About Airbnb Airbnb was born in 2007 when two hosts welcomed three guests to their San Francisco home, and has since grown to over 5 million hosts who have welcomed over 2 billion guest arrivals in almost every country across the globe. Every day, hosts offer unique stays, experiences, and services that make it possible for guests to connect with communities in a more authentic way. Forward-Looking Statements This letter contains forward-looking statements within the meaning of the Private Securities Litigation Reform Act of 1995. All statements other than statements of historical fact could be deemed forward- looking, including, but not limited to, statements regarding the future performance of Airbnb, Inc. and its consolidated subsidiaries (the “Company”), including its financial outlook for the fourth quarter of 2025 and the fiscal year 2025; the other expectations described under “Outlook” above; the Company’s expectations regarding travel trends and the travel industry generally; the Company’s strategic priorities and investments, including those in certain markets and those related to Airbnb Experiences and Airbnb Services; the Company’s expectations with respect to the demand for bookings, and expectations with respect to increases in and the quality of active listings; the Company’s expectations regarding cross- border travel; the Company’s expectation of attracting and retaining more hosts, including in expansion markets; the growth of active listings, including in expansion markets; the Company’s expectations regarding international expansion; the Company’s expectations regarding its investments in sales and marketing; the Company’s expectations regarding bookings around major holidays or events; the Company’s plans regarding guest service fees and cross-currency bookings and the impact on take rate; the Company’s expectations regarding its financial performance, including its revenue, implied take rate, Adjusted EBITDA, and Adjusted EBITDA Margin; the Company’s expectations regarding future operating performance, including Nights and Seats Booked and GBV; the Company’s expectations regarding ADR; the Company’s expectation regarding the effect of recent tax legislation; the Company’s expectations with respect to stock-based compensation expense; the Company’s share repurchase program; the Company’s expectations for product and services growth and enhancements, including the ongoing impact and results from platform enhancements or new features and the Company’s expectations regarding the success of its offerings beyond accommodations; the Company’s expectations regarding its investments in AI; and the Company’s business strategy, plans, and objectives for future operations. In some cases, forward-looking statements can be identified by terms such as “may,” “will,” “appears,” “should,” “expects,” “plans,” “anticipates,” “could,” “outlook,” “intends,” “target,” “projects,” “contemplates,” “believes,” “estimates,” “predicts,” “potential,” or “continue,” or the negative of these words or other similar terms or expressions that concern our expectations, strategy, plans, or intentions. Such statements are subject to a number of known and unknown risks, uncertainties, assumptions, and other factors that may cause the Company’s actual results, performance, or achievements to differ materially from results expressed or implied in this letter. Investors are cautioned not to place undue reliance on these statements, and reported results should not be considered as an indication of future performance. Risks that contribute to the uncertain nature of the forward-looking statements include, among others, the travel industry, travel trends, and the global economy generally; the Company’s ability to retain existing hosts and guests and add new hosts and guests; any decline or disruption in the travel and hospitality industries or economic downturn; the Company’s ability to compete successfully; changes to the laws and regulations that may limit the Company’s hosts’ ability and willingness to 17
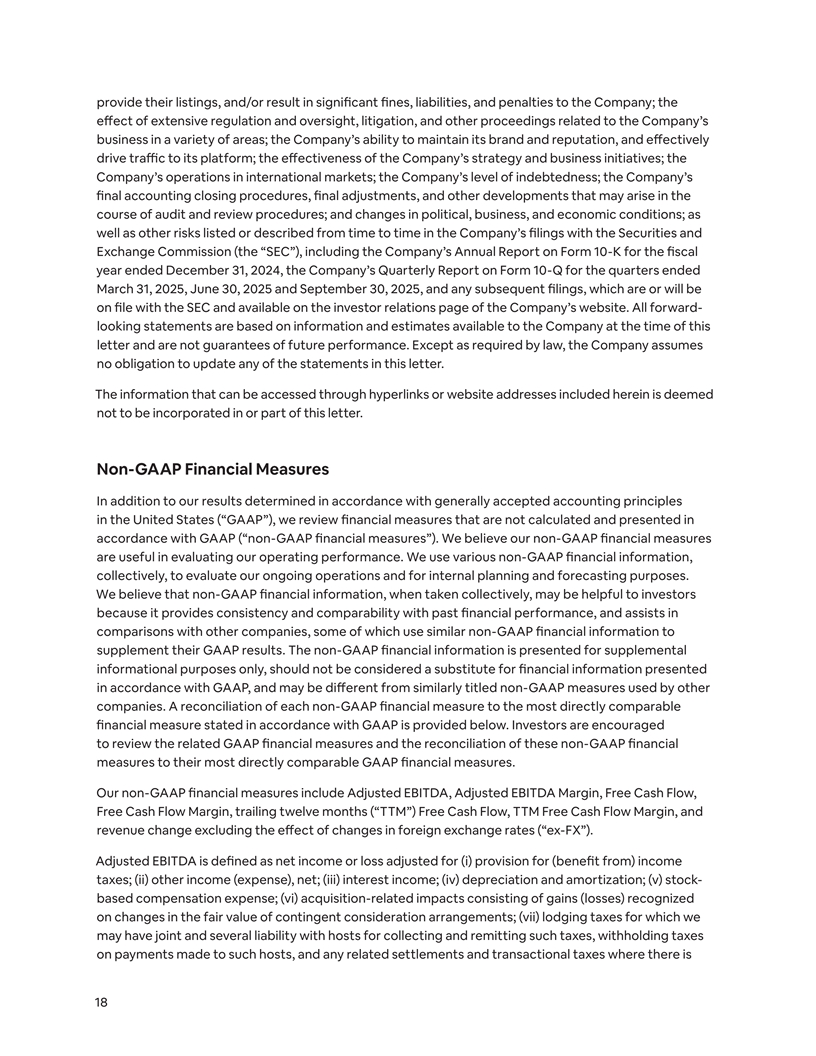
provide their listings, and/or result in significant fines, liabilities, and penalties to the Company; the effect of extensive regulation and oversight, litigation, and other proceedings related to the Company’s business in a variety of areas; the Company’s ability to maintain its brand and reputation, and effectively drive traffic to its platform; the effectiveness of the Company’s strategy and business initiatives; the Company’s operations in international markets; the Company’s level of indebtedness; the Company’s final accounting closing procedures, final adjustments, and other developments that may arise in the course of audit and review procedures; and changes in political, business, and economic conditions; as well as other risks listed or described from time to time in the Company’s filings with the Securities and Exchange Commission (the “SEC”), including the Company’s Annual Report on Form 10-K for the fiscal year ended December 31, 2024, the Company’s Quarterly Report on Form 10-Q for the quarters ended March 31, 2025, June 30, 2025 and September 30, 2025, and any subsequent filings, which are or will be on file with the SEC and available on the investor relations page of the Company’s website. All forward- looking statements are based on information and estimates available to the Company at the time of this letter and are not guarantees of future performance. Except as required by law, the Company assumes no obligation to update any of the statements in this letter. The information that can be accessed through hyperlinks or website addresses included herein is deemed not to be incorporated in or part of this letter. Non-GAAP Financial Measures In addition to our results determined in accordance with generally accepted accounting principles in the United States (“GAAP”), we review financial measures that are not calculated and presented in accordance with GAAP (“non-GAAP financial measures”). We believe our non-GAAP financial measures are useful in evaluating our operating performance. We use various non-GAAP financial information, collectively, to evaluate our ongoing operations and for internal planning and forecasting purposes. We believe that non-GAAP financial information, when taken collectively, may be helpful to investors because it provides consistency and comparability with past financial performance, and assists in comparisons with other companies, some of which use similar non-GAAP financial information to supplement their GAAP results. The non-GAAP financial information is presented for supplemental informational purposes only, should not be considered a substitute for financial information presented in accordance with GAAP, and may be different from similarly titled non-GAAP measures used by other companies. A reconciliation of each non-GAAP financial measure to the most directly comparable financial measure stated in accordance with GAAP is provided below. Investors are encouraged to review the related GAAP financial measures and the reconciliation of these non-GAAP financial measures to their most directly comparable GAAP financial measures. Our non-GAAP financial measures include Adjusted EBITDA, Adjusted EBITDA Margin, Free Cash Flow, Free Cash Flow Margin, trailing twelve months (“TTM”) Free Cash Flow, TTM Free Cash Flow Margin, and revenue change excluding the effect of changes in foreign exchange rates (“ex-FX”). Adjusted EBITDA is defined as net income or loss adjusted for (i) provision for (benefit from) income taxes; (ii) other income (expense), net; (iii) interest income; (iv) depreciation and amortization; (v) stock- based compensation expense; (vi) acquisition-related impacts consisting of gains (losses) recognized on changes in the fair value of contingent consideration arrangements; (vii) lodging taxes for which we may have joint and several liability with hosts for collecting and remitting such taxes, withholding taxes on payments made to such hosts, and any related settlements and transactional taxes where there is 18
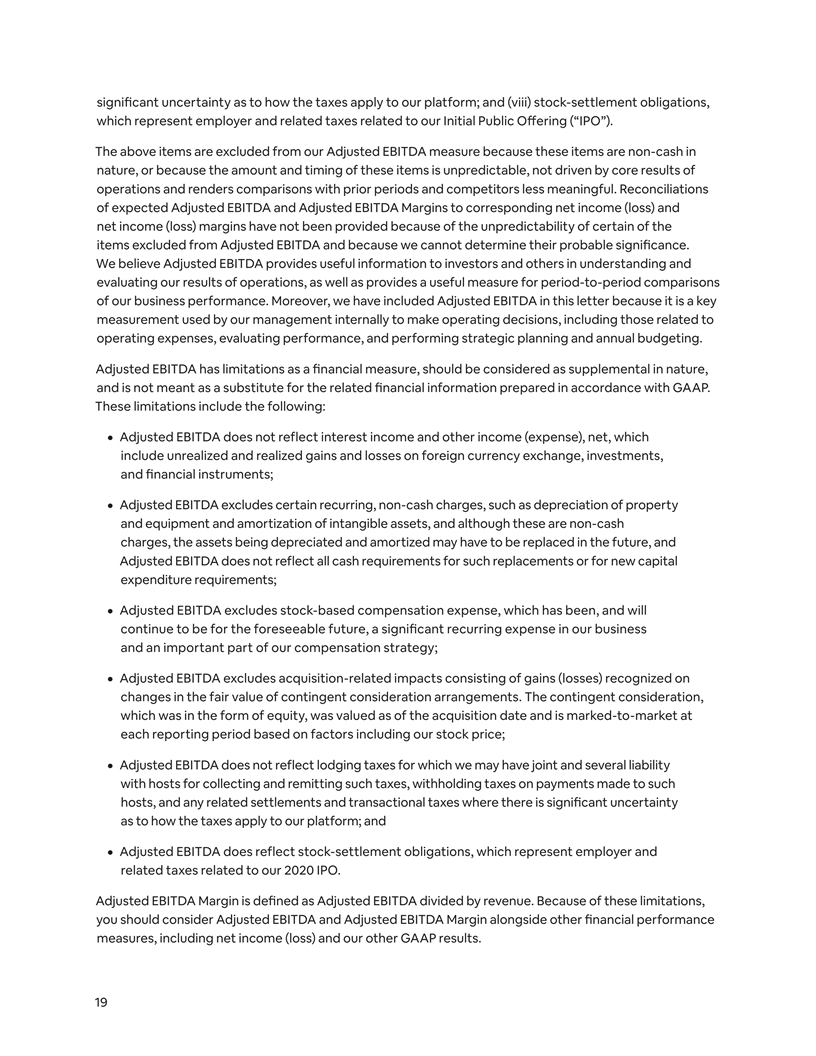
significant uncertainty as to how the taxes apply to our platform; and (viii) stock-settlement obligations, which represent employer and related taxes related to our Initial Public Offering (“IPO”). The above items are excluded from our Adjusted EBITDA measure because these items are non-cash in nature, or because the amount and timing of these items is unpredictable, not driven by core results of operations and renders comparisons with prior periods and competitors less meaningful. Reconciliations of expected Adjusted EBITDA and Adjusted EBITDA Margins to corresponding net income (loss) and net income (loss) margins have not been provided because of the unpredictability of certain of the items excluded from Adjusted EBITDA and because we cannot determine their probable significance. We believe Adjusted EBITDA provides useful information to investors and others in understanding and evaluating our results of operations, as well as provides a useful measure for period-to-period comparisons of our business performance. Moreover, we have included Adjusted EBITDA in this letter because it is a key measurement used by our management internally to make operating decisions, including those related to operating expenses, evaluating performance, and performing strategic planning and annual budgeting. Adjusted EBITDA has limitations as a financial measure, should be considered as supplemental in nature, and is not meant as a substitute for the related financial information prepared in accordance with GAAP. These limitations include the following: ¦ Adjusted EBITDA does not reflect interest income and other income (expense), net, which include unrealized and realized gains and losses on foreign currency exchange, investments, and financial instruments; ¦ Adjusted EBITDA excludes certain recurring, non-cash charges, such as depreciation of property and equipment and amortization of intangible assets, and although these are non-cash charges, the assets being depreciated and amortized may have to be replaced in the future, and Adjusted EBITDA does not reflect all cash requirements for such replacements or for new capital expenditure requirements; ¦ Adjusted EBITDA excludes stock-based compensation expense, which has been, and will continue to be for the foreseeable future, a significant recurring expense in our business and an important part of our compensation strategy; ¦ Adjusted EBITDA excludes acquisition-related impacts consisting of gains (losses) recognized on changes in the fair value of contingent consideration arrangements. The contingent consideration, which was in the form of equity, was valued as of the acquisition date and is marked-to-market at each reporting period based on factors including our stock price; ¦ Adjusted EBITDA does not reflect lodging taxes for which we may have joint and several liability with hosts for collecting and remitting such taxes, withholding taxes on payments made to such hosts, and any related settlements and transactional taxes where there is significant uncertainty as to how the taxes apply to our platform; and ¦ Adjusted EBITDA does reflect stock-settlement obligations, which represent employer and related taxes related to our 2020 IPO. Adjusted EBITDA Margin is defined as Adjusted EBITDA divided by revenue. Because of these limitations, you should consider Adjusted EBITDA and Adjusted EBITDA Margin alongside other financial performance measures, including net income (loss) and our other GAAP results. 19
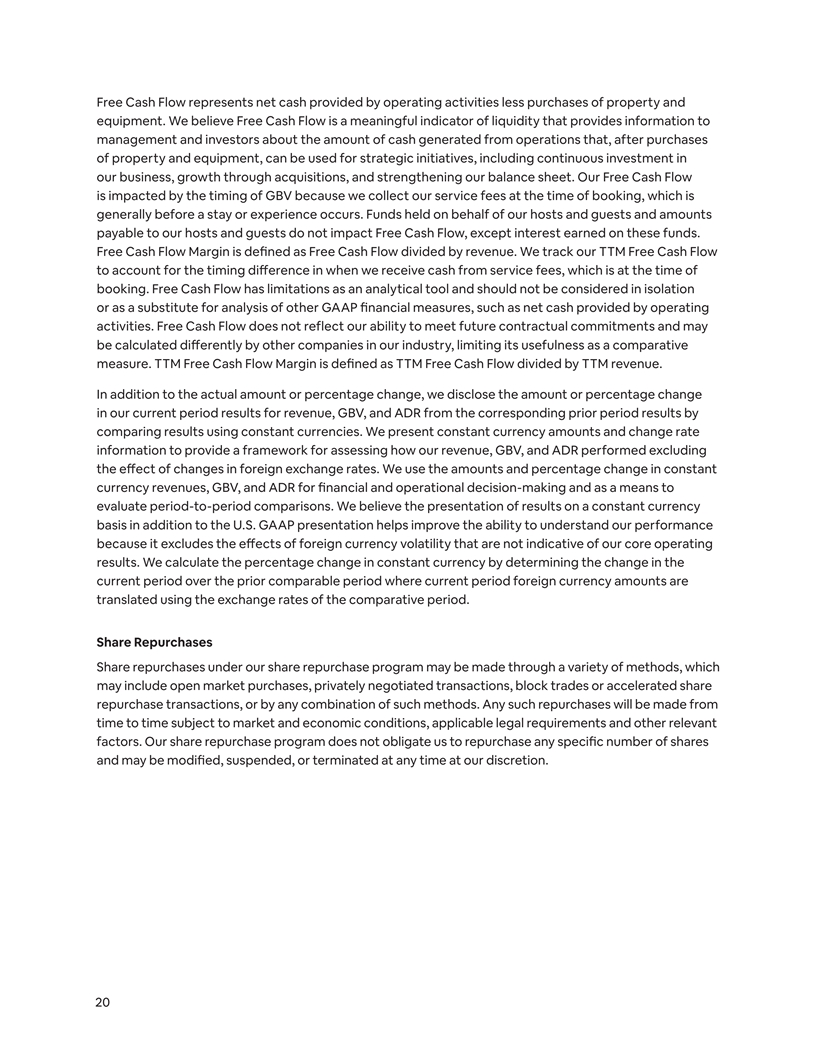
Free Cash Flow represents net cash provided by operating activities less purchases of property and equipment. We believe Free Cash Flow is a meaningful indicator of liquidity that provides information to management and investors about the amount of cash generated from operations that, after purchases of property and equipment, can be used for strategic initiatives, including continuous investment in our business, growth through acquisitions, and strengthening our balance sheet. Our Free Cash Flow is impacted by the timing of GBV because we collect our service fees at the time of booking, which is generally before a stay or experience occurs. Funds held on behalf of our hosts and guests and amounts payable to our hosts and guests do not impact Free Cash Flow, except interest earned on these funds. Free Cash Flow Margin is defined as Free Cash Flow divided by revenue. We track our TTM Free Cash Flow to account for the timing difference in when we receive cash from service fees, which is at the time of booking. Free Cash Flow has limitations as an analytical tool and should not be considered in isolation or as a substitute for analysis of other GAAP financial measures, such as net cash provided by operating activities. Free Cash Flow does not reflect our ability to meet future contractual commitments and may be calculated differently by other companies in our industry, limiting its usefulness as a comparative measure. TTM Free Cash Flow Margin is defined as TTM Free Cash Flow divided by TTM revenue. In addition to the actual amount or percentage change, we disclose the amount or percentage change in our current period results for revenue, GBV, and ADR from the corresponding prior period results by comparing results using constant currencies. We present constant currency amounts and change rate information to provide a framework for assessing how our revenue, GBV, and ADR performed excluding the ee ff ct of changes in foreign exchange rates. We use the amounts and percentage change in constant currency revenues, GBV, and ADR for financial and operational decision-making and as a means to evaluate period-to-period comparisons. We believe the presentation of results on a constant currency basis in addition to the U.S. GAAP presentation helps improve the ability to understand our performance because it excludes the effects of foreign currency volatility that are not indicative of our core operating results. We calculate the percentage change in constant currency by determining the change in the current period over the prior comparable period where current period foreign currency amounts are translated using the exchange rates of the comparative period. Share Repurchases Share repurchases under our share repurchase program may be made through a variety of methods, which may include open market purchases, privately negotiated transactions, block trades or accelerated share repurchase transactions, or by any combination of such methods. Any such repurchases will be made from time to time subject to market and economic conditions, applicable legal requirements and other relevant factors. Our share repurchase program does not obligate us to repurchase any specific number of shares and may be modified, suspended, or terminated at any time at our discretion. 20
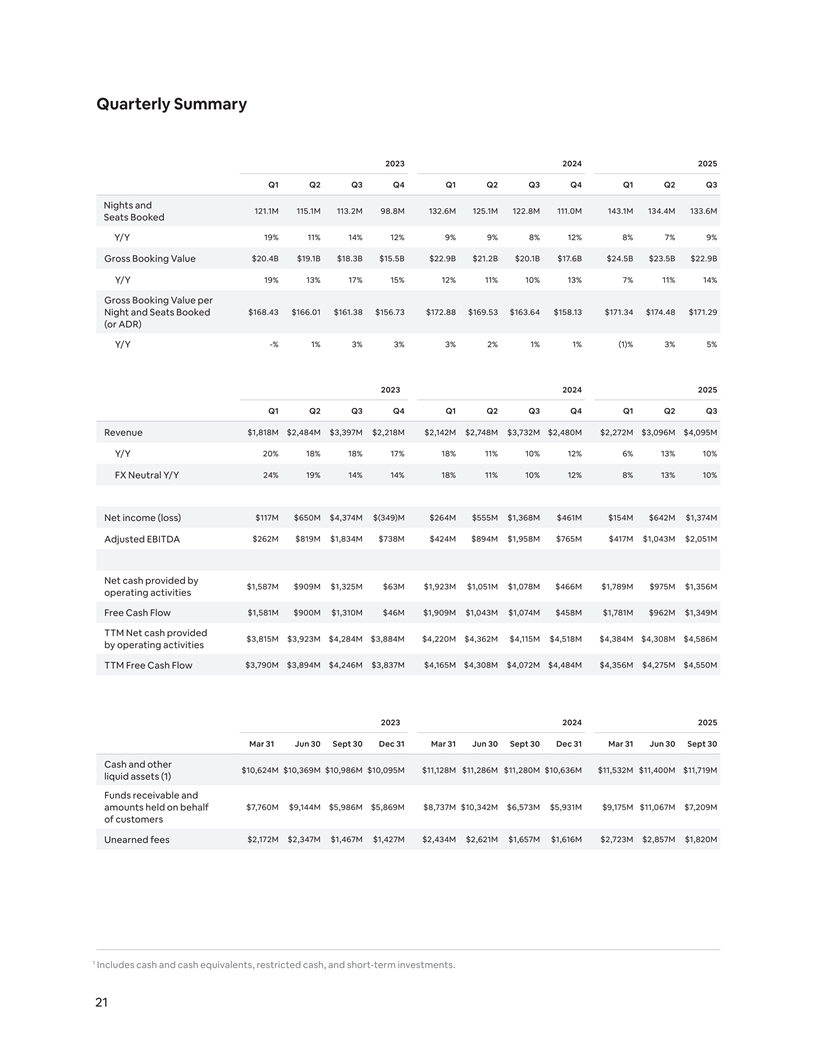
Quarterly Summary 2023 2024 2025 Q1 Q2 Q3 Q4 Q1 Q2 Q3 Q4 Q1 Q2 Q3 Nights and 121.1M 115.1M 113.2M 98.8M 132.6M 125.1M 122.8M 111.0M 143.1M 134.4M 133.6M Seats Booked 19% 11% 14% 12% 9% 9% 8% 12% 8% 7% 9% Y/Y $20.4B $19.1B $18.3B $15.5B $22.9B $21.2B $20.1B $17.6B $24.5B $23.5B $22.9B Gross Booking Value 19% 13% 17% 15% 12% 11% 10% 13% 7% 11% 14% Y/Y Gross Booking Value per $168.43 $166.01 $161.38 $156.73 $172.88 $169.53 $163.64 $158.13 $171.34 $174.48 $171.29 Night and Seats Booked (or ADR) Y/Y -% 1% 3% 3% 3% 2% 1% 1% (1)% 3% 5% 2023 2024 2025 Q1 Q2 Q3 Q4 Q1 Q2 Q3 Q4 Q1 Q2 Q3 Revenue $1,818M $2,484M $3,397M $2,218M $2,142M $2,748M $3,732M $2,480M $2,272M $3,096M $4,095M Y/Y 20% 18% 18% 17% 18% 11% 10% 12% 6% 13% 10% FX Neutral Y/Y 24% 19% 14% 14% 18% 11% 10% 12% 8% 13% 10% Net income (loss) $117M $650M $4,374M $(349)M $264M $555M $1,368M $461M $154M $642M $1,374M Adjusted EBITDA $262M $819M $1,834M $738M $424M $894M $1,958M $765M $417M $1,043M $2,051M Net cash provided by $1,587M $909M $1,325M $63M $1,923M $1,051M $1,078M $466M $1,789M $975M $1,356M operating activities Free Cash Flow $1,581M $900M $1,310M $46M $1,909M $1,043M $1,074M $458M $1,781M $962M $1,349M TTM Net cash provided $3,815M $3,923M $4,284M $3,884M $4,220M $4,362M $4,115M $4,518M $4,384M $4,308M $4,586M by operating activities $3,790M $3,894M $4,246M $3,837M $4,165M $4,308M $4,072M $4,484M $4,356M $4,275M $4,550M TTM Free Cash Flow 2023 2024 2025 Mar 31 Jun 30 Sept 30 Dec 31 Mar 31 Jun 30 Sept 30 Dec 31 Mar 31 Jun 30 Sept 30 Cash and other $10,624M $10,369M $10,986M $10,095M $11,128M $11,286M $11,280M $10,636M $11,532M $11,400M $11,719M liquid assets (1) Funds receivable and amounts held on behalf $7,760M $9,144M $5,986M $5,869M $8,737M $10,342M $6,573M $5,931M $9,175M $11,067M $7,209M of customers Unearned fees $2,172M $2,347M $1,467M $1,427M $2,434M $2,621M $1,657M $1,616M $2,723M $2,857M $1,820M 1 Includes cash and cash equivalents, restricted cash, and short-term investments. 21
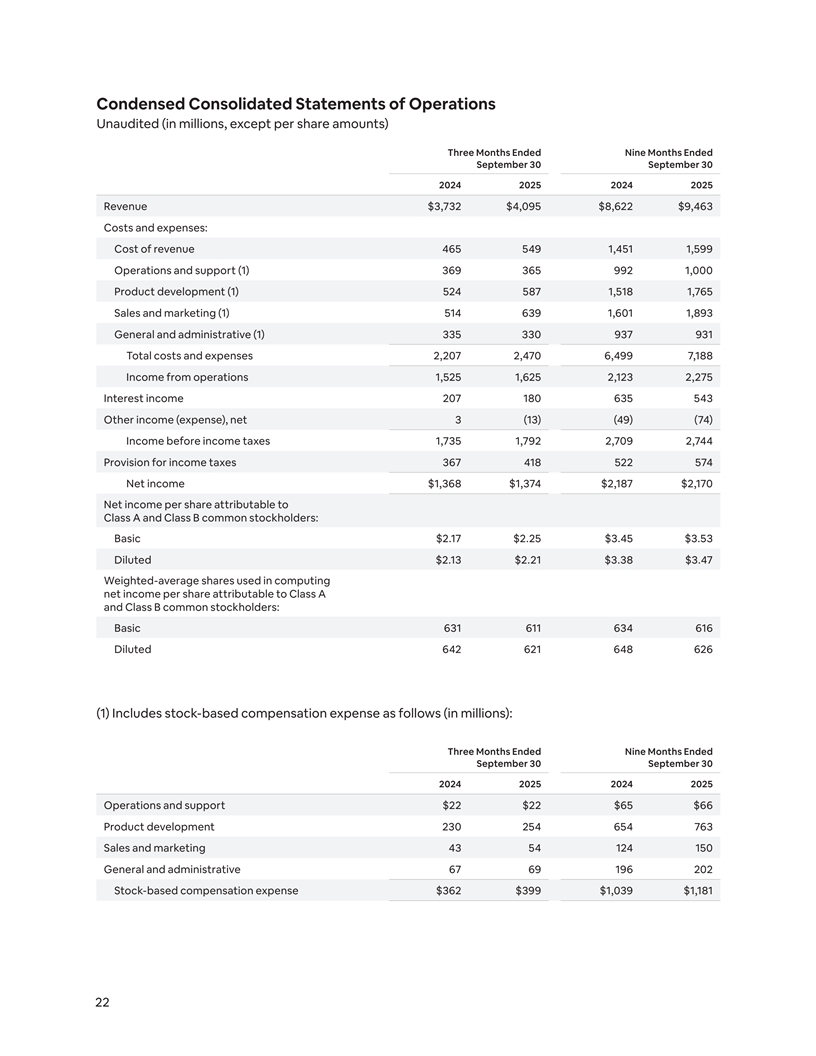
Condensed Consolidated Statements of Operations Unaudited (in millions, except per share amounts) Three Months Ended Nine Months Ended September 30 September 30 2024 2025 2024 2025 Revenue $3,732 $4,095 $8,622 $9,463 Costs and expenses: Cost of revenue 465 549 1,451 1,599 Operations and support (1) 369 365 992 1,000 Product development (1) 524 587 1,518 1,765 Sales and marketing (1) 514 639 1,601 1,893 General and administrative (1) 335 330 937 931 Total costs and expenses 2,207 2,470 6,499 7,188 Income from operations 1,525 1,625 2,123 2,275 Interest income 207 180 635 543 Other income (expense), net 3 (13) (49) (74) Income before income taxes 1,735 1,792 2,709 2,744 Provision for income taxes 367 418 522 574 Net income $1,368 $1,374 $2,187 $2,170 Net income per share attributable to Class A and Class B common stockholders: Basic $2.17 $2.25 $3.45 $3.53 Diluted $2.13 $2.21 $3.38 $3.47 Weighted-average shares used in computing net income per share attributable to Class A and Class B common stockholders: Basic 631 611 634 616 Diluted 642 621 648 626 (1) Includes stock-based compensation expense as follows (in millions): Three Months Ended Nine Months Ended September 30 September 30 2024 2025 2024 2025 Operations and support $22 $22 $65 $66 Product development 230 254 654 763 Sales and marketing 43 54 124 150 General and administrative 67 69 196 202 Stock-based compensation expense $362 $399 $1,039 $1,181 22
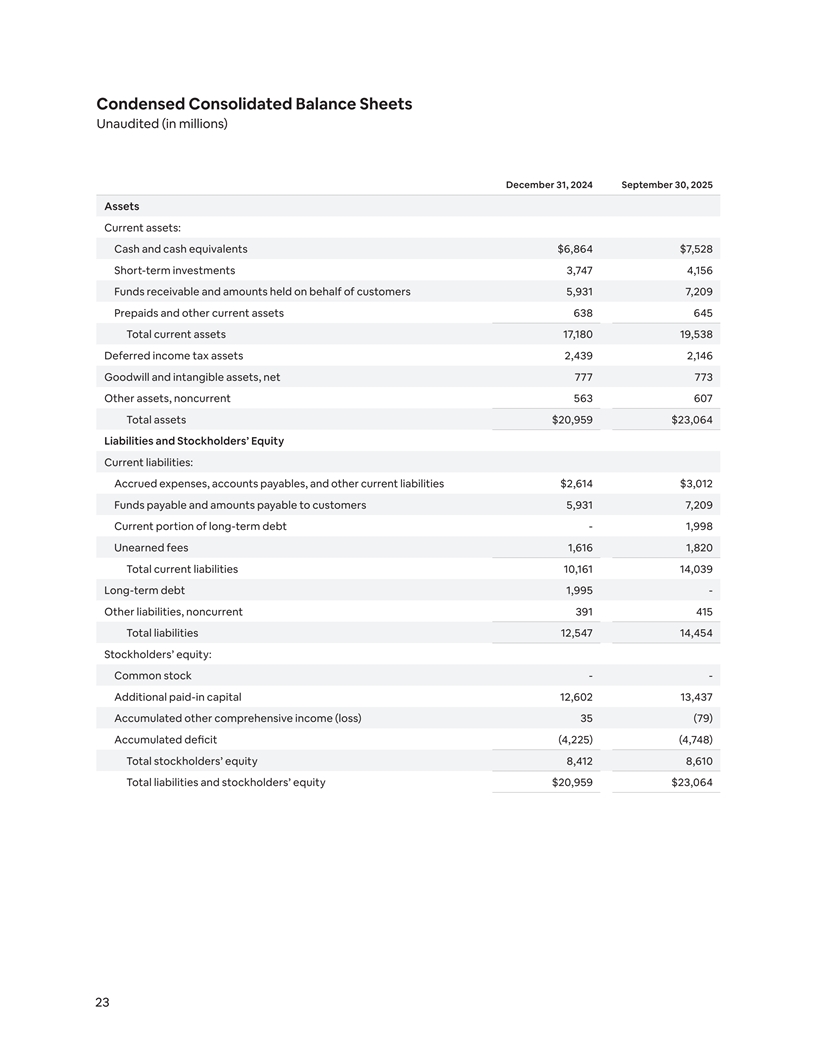
Condensed Consolidated Balance Sheets Unaudited (in millions) December 31, 2024 September 30, 2025 Assets Current assets: Cash and cash equivalents $6,864 $7,528 Short-term investments 3,747 4,156 Funds receivable and amounts held on behalf of customers 5,931 7,209 Prepaids and other current assets 638 645 Total current assets 17,180 19,538 Deferred income tax assets 2,439 2,146 Goodwill and intangible assets, net 777 773 Other assets, noncurrent 563 607 Total assets $20,959 $23,064 Liabilities and Stockholders’ Equity Current liabilities: Accrued expenses, accounts payables, and other current liabilities $2,614 $3,012 Funds payable and amounts payable to customers 5,931 7,209 Current portion of long-term debt - 1,998 Unearned fees 1,616 1,820 Total current liabilities 10,161 14,039 Long-term debt 1,995 - Other liabilities, noncurrent 391 415 Total liabilities 12,547 14,454 Stockholders’ equity: Common stock - - Additional paid-in capital 12,602 13,437 Accumulated other comprehensive income (loss) 35 (79) Accumulated deficit (4,225) (4,748) Total stockholders’ equity 8,412 8,610 Total liabilities and stockholders’ equity $20,959 $23,064 23
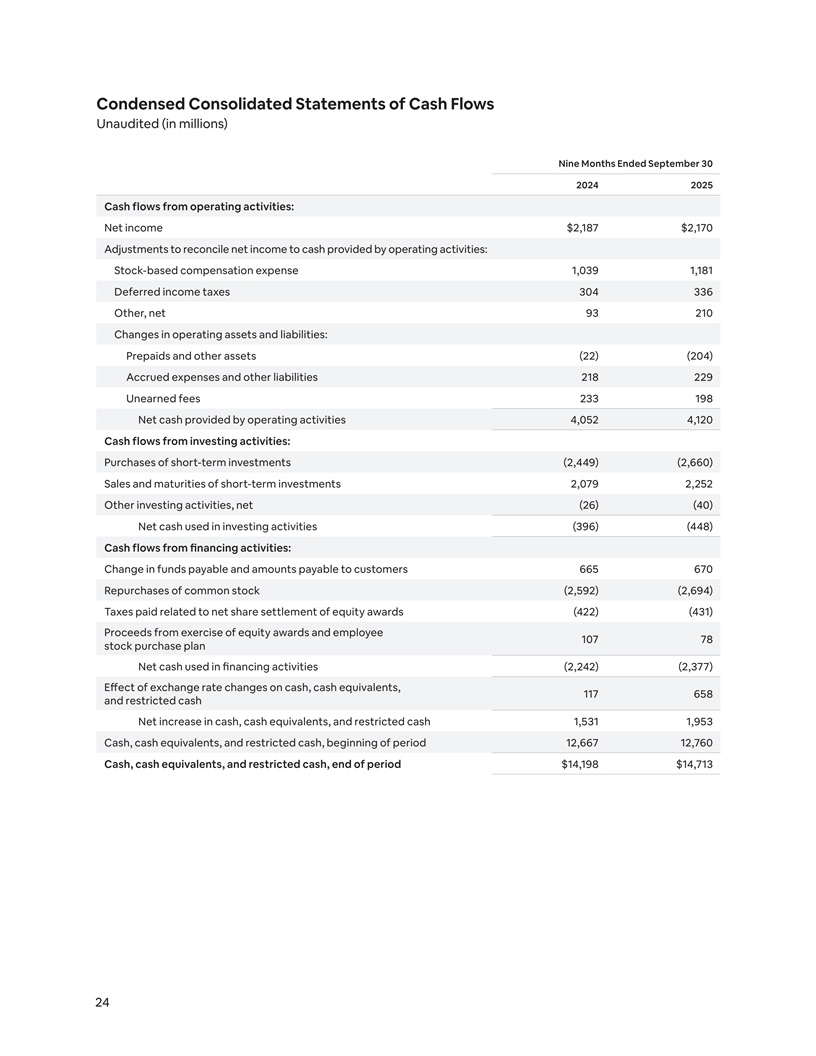
Condensed Consolidated Statements of Cash Flows Unaudited (in millions) Nine Months Ended September 30 2024 2025 Cash flows from operating activities: Net income $2,187 $2,170 Adjustments to reconcile net income to cash provided by operating activities: Stock-based compensation expense 1,039 1,181 Deferred income taxes 304 336 Other, net 93 210 Changes in operating assets and liabilities: Prepaids and other assets (22) (204) Accrued expenses and other liabilities 218 229 Unearned fees 233 198 Net cash provided by operating activities 4,052 4,120 Cash flows from investing activities: Purchases of short-term investments (2,449) (2,660) Sales and maturities of short-term investments 2,079 2,252 Other investing activities, net (26) (40) Net cash used in investing activities (396) (448) Cash flows from financing activities: Change in funds payable and amounts payable to customers 665 670 Repurchases of common stock (2,592) (2,694) Taxes paid related to net share settlement of equity awards (422) (431) Proceeds from exercise of equity awards and employee 107 78 stock purchase plan Net cash used in financing activities (2,242) (2,377) Effect of exchange rate changes on cash, cash equivalents, 117 658 and restricted cash Net increase in cash, cash equivalents, and restricted cash 1,531 1,953 Cash, cash equivalents, and restricted cash, beginning of period 12,667 12,760 Cash, cash equivalents, and restricted cash, end of period $14,198 $14,713 24
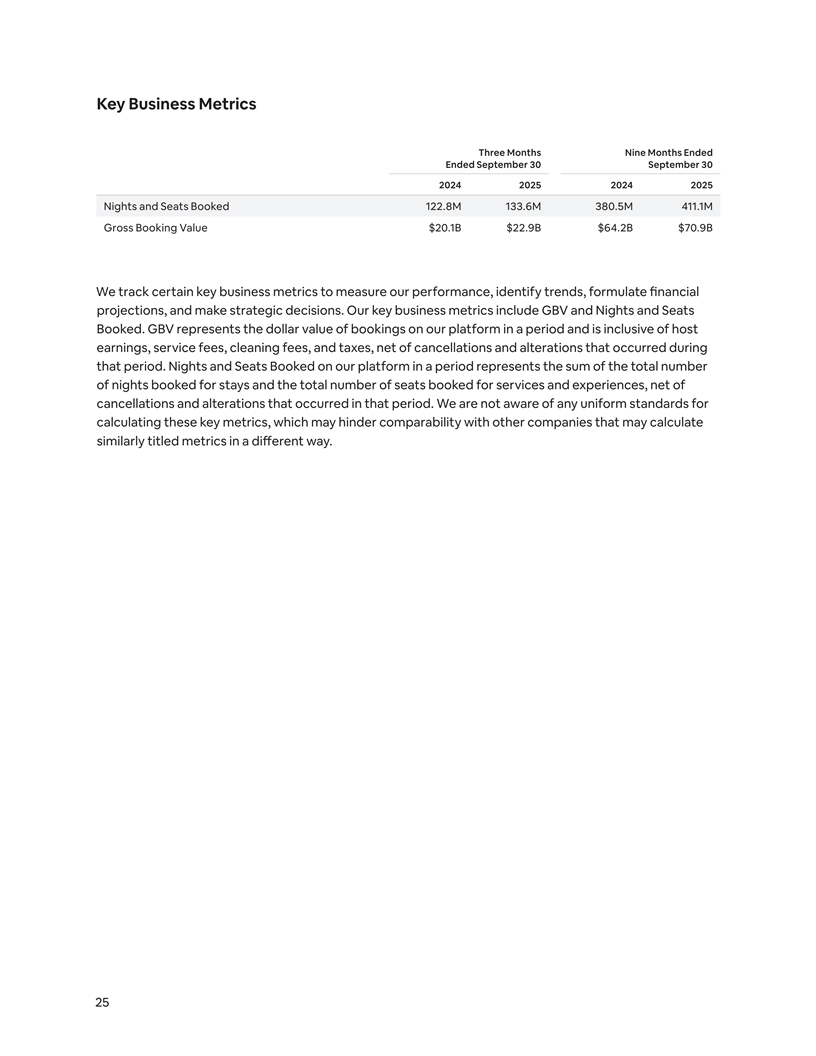
Key Business Metrics Three Months Nine Months Ended Ended September 30 September 30 2024 2025 2024 2025 Nights and Seats Booked 122.8M 133.6M 380.5M 411.1M Gross Booking Value $20.1B $22.9B $64.2B $70.9B We track certain key business metrics to measure our performance, identify trends, formulate financial projections, and make strategic decisions. Our key business metrics include GBV and Nights and Seats Booked. GBV represents the dollar value of bookings on our platform in a period and is inclusive of host earnings, service fees, cleaning fees, and taxes, net of cancellations and alterations that occurred during that period. Nights and Seats Booked on our platform in a period represents the sum of the total number of nights booked for stays and the total number of seats booked for services and experiences, net of cancellations and alterations that occurred in that period. We are not aware of any uniform standards for calculating these key metrics, which may hinder comparability with other companies that may calculate similarly titled metrics in a different way. 25
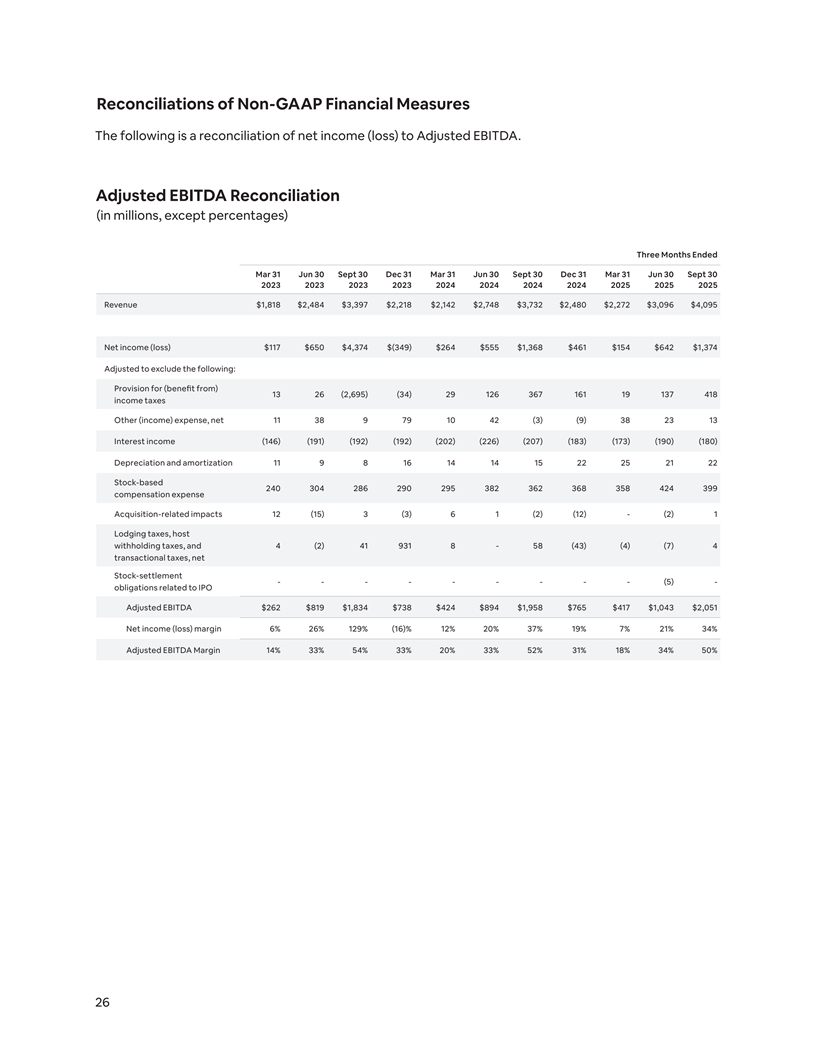
Reconciliations of Non-GAAP Financial Measures The following is a reconciliation of net income (loss) to Adjusted EBITDA. Adjusted EBITDA Reconciliation (in millions, except percentages) Three Months Ended Mar 31 Jun 30 Sept 30 Dec 31 Mar 31 Jun 30 Sept 30 Dec 31 Mar 31 Jun 30 Sept 30 2023 2023 2023 2023 2024 2024 2024 2024 2025 2025 2025 Revenue $1,818 $2,484 $3,397 $2,218 $2,142 $2,748 $3,732 $2,480 $2,272 $3,096 $4,095 Net income (loss) $117 $650 $4,374 $(349) $264 $555 $1,368 $461 $154 $642 $1,374 Adjusted to exclude the following: Provision for (benefit from) 13 26 (2,695) (34) 29 126 367 161 19 137 418 income taxes Other (income) expense, net 11 38 9 79 10 42 (3) (9) 38 23 13 Interest income (146) (191) (192) (192) (202) (226) (207) (183) (173) (190) (180) Depreciation and amortization 11 9 8 16 14 14 15 22 25 21 22 Stock-based 240 304 286 290 295 382 362 368 358 424 399 compensation expense Acquisition-related impacts 12 (15) 3 (3) 6 1 (2) (12) - (2) 1 Lodging taxes, host withholding taxes, and 4 (2) 41 931 8 - 58 (43) (4) (7) 4 transactional taxes, net Stock-settlement - - - - - - - - - (5) - obligations related to IPO Adjusted EBITDA $262 $819 $1,834 $738 $424 $894 $1,958 $765 $417 $1,043 $2,051 Net income (loss) margin 6% 26% 129% (16)% 12% 20% 37% 19% 7% 21% 34% Adjusted EBITDA Margin 14% 33% 54% 33% 20% 33% 52% 31% 18% 34% 50% 26
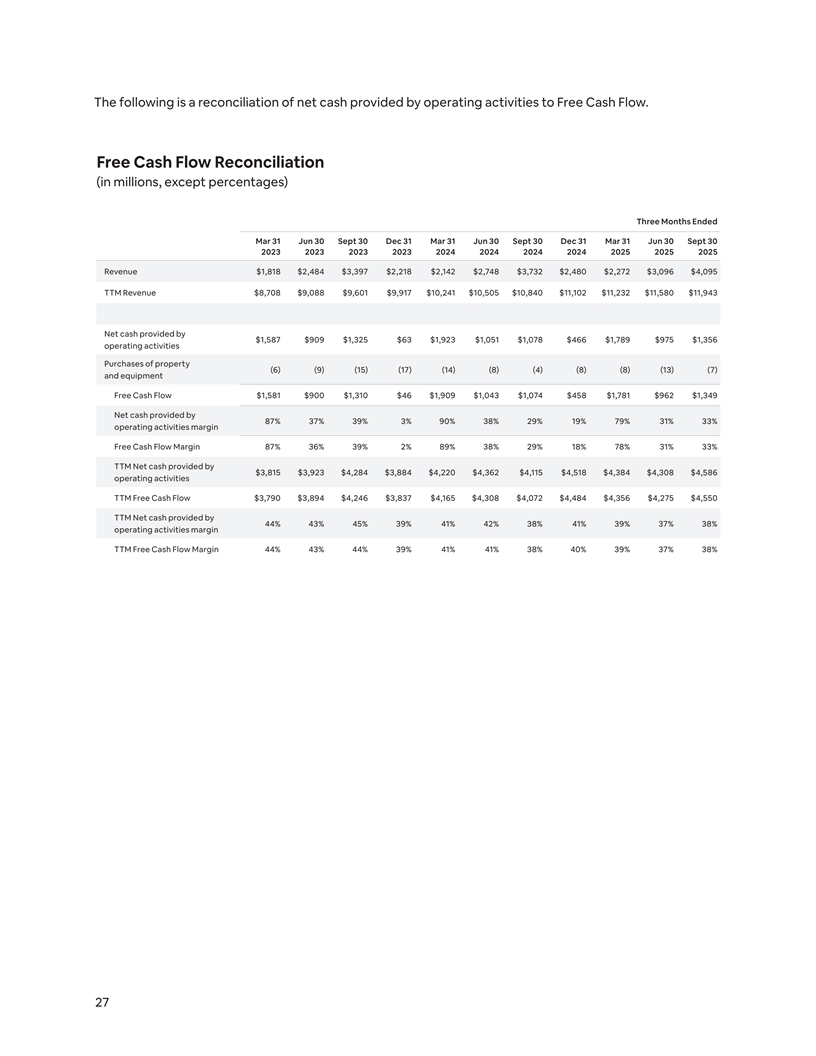
The following is a reconciliation of net cash provided by operating activities to Free Cash Flow. Free Cash Flow Reconciliation (in millions, except percentages) Three Months Ended Mar 31 Jun 30 Sept 30 Dec 31 Mar 31 Jun 30 Sept 30 Dec 31 Mar 31 Jun 30 Sept 30 2023 2023 2023 2023 2024 2024 2024 2024 2025 2025 2025 Revenue $1,818 $2,484 $3,397 $2,218 $2,142 $2,748 $3,732 $2,480 $2,272 $3,096 $4,095 TTM Revenue $8,708 $9,088 $9,601 $9,917 $10,241 $10,505 $10,840 $11,102 $11,232 $11,580 $11,943 Net cash provided by $1,587 $909 $1,325 $63 $1,923 $1,051 $1,078 $466 $1,789 $975 $1,356 operating activities Purchases of property (6) (9) (15) (17) (14) (8) (4) (8) (8) (13) (7) and equipment Free Cash Flow $1,581 $900 $1,310 $46 $1,909 $1,043 $1,074 $458 $1,781 $962 $1,349 Net cash provided by 87% 37% 39% 3% 90% 38% 29% 19% 79% 31% 33% operating activities margin Free Cash Flow Margin 87% 36% 39% 2% 89% 38% 29% 18% 78% 31% 33% TTM Net cash provided by $3,815 $3,923 $4,284 $3,884 $4,220 $4,362 $4,115 $4,518 $4,384 $4,308 $4,586 operating activities TTM Free Cash Flow $3,790 $3,894 $4,246 $3,837 $4,165 $4,308 $4,072 $4,484 $4,356 $4,275 $4,550 TTM Net cash provided by 44% 43% 45% 39% 41% 42% 38% 41% 39% 37% 38% operating activities margin TTM Free Cash Flow Margin 44% 43% 44% 39% 41% 41% 38% 40% 39% 37% 38% 27
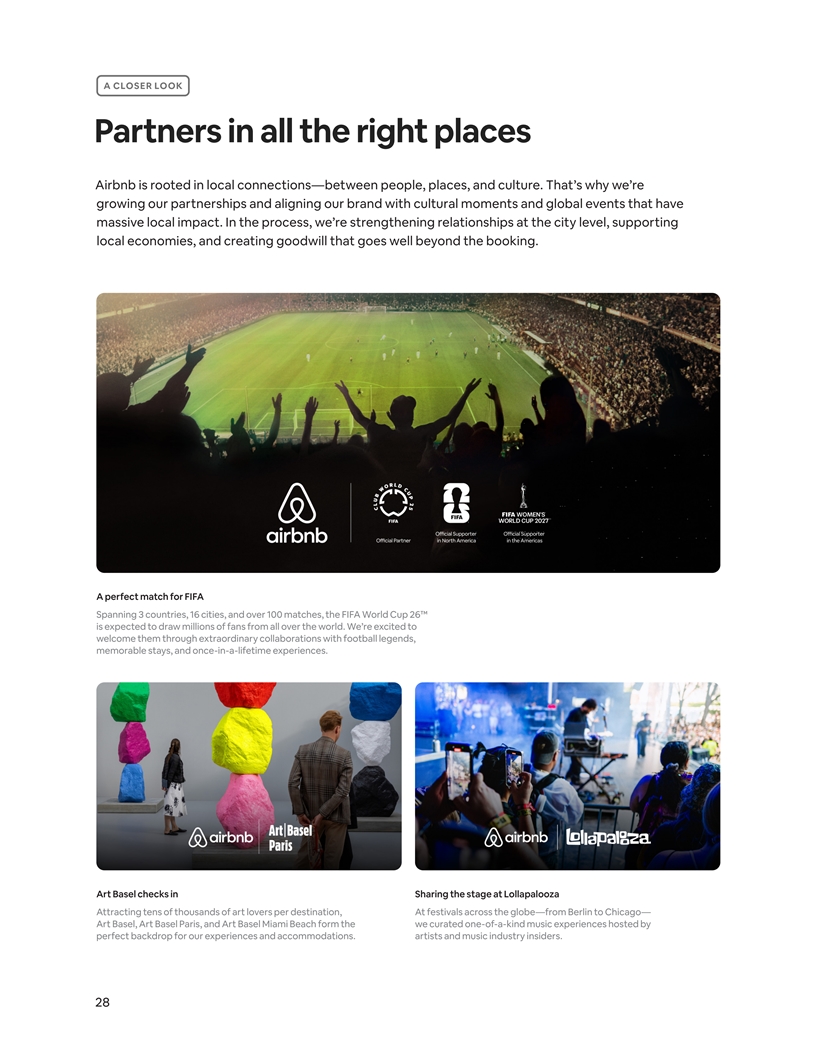
A CLOSER LOOK Partners in all the right places Airbnb is rooted in local connections—between people, places, and culture. That’s why we’re growing our partnerships and aligning our brand with cultural moments and global events that have massive local impact. In the process, we’re strengthening relationships at the city level, supporting local economies, and creating goodwill that goes well beyond the booking. A perfect match for FIFA Spanning 3 countries, 16 cities, and over 100 matches, the FIFA World Cup 26™ is expected to draw millions of fans from all over the world. We’re excited to welcome them through extraordinary collaborations with football legends, memorable stays, and once-in-a-lifetime experiences. Art Basel checks in Sharing the stage at Lollapalooza Attracting tens of thousands of art lovers per destination, At festivals across the globe—from Berlin to Chicago— Art Basel, Art Basel Paris, and Art Basel Miami Beach form the we curated one-of-a-kind music experiences hosted by perfect backdrop for our experiences and accommodations. artists and music industry insiders. 28