AMH Reports Second Quarter 2025 Financial and Operating Results
Raises Full Year 2025 Guidance
LAS VEGAS, July 31, 2025—AMH (NYSE: AMH) (the “Company”), a leading large-scale integrated owner, operator and developer of single-family rental homes, today announced its financial and operating results for the quarter ended June 30, 2025.
Highlights
•Rents and other single-family property revenues increased 8.0% year-over-year to $457.5 million for the second quarter of 2025.
•Net income attributable to common shareholders totaled $105.6 million, or $0.28 per diluted share, for the second quarter of 2025, compared to $92.1 million, or $0.25 per diluted share, for the second quarter of 2024.
•Core Funds from Operations (“Core FFO”) attributable to common share and unit holders increased 4.9% year-over-year to $0.47 per FFO share and unit for the second quarter of 2025 and Adjusted Funds from Operations (“Adjusted FFO”) attributable to common share and unit holders increased 6.3% year-over-year to $0.42 per FFO share and unit for the second quarter of 2025.
•Core Net Operating Income (“Core NOI”) from Same-Home properties increased by 4.1% year-over-year for the second quarter of 2025.
•Achieved Same-Home Average Occupied Days Percentage of 96.3% in the second quarter of 2025, while generating 4.1% rate growth on new leases and 4.4% rate growth on renewals, resulting in 4.3% blended rate growth.
•Delivered a total of 636 high-quality and energy-efficient newly constructed homes from our AMH Development Program to our wholly-owned portfolio and unconsolidated joint ventures in the second quarter of 2025.
•Issued $650.0 million of 4.95% unsecured senior notes due 2030 during the second quarter of 2025, raising net proceeds of $642.5 million.
•Raised Full Year 2025 Core FFO attributable to common share and unit holders guidance midpoint by $0.03 per share and unit to $1.86, representing anticipated full year growth of 5.1% over prior year.
“Our strong second quarter results reflect another successful spring leasing season. Superior performance across all areas of the AMH platform drove a three cent increase to our full year Core FFO per share guidance to $1.86 at the midpoint, representing 5.1% growth over the prior year,” stated Bryan Smith, AMH’s Chief Executive Officer. “Our industry-leading team has done an outstanding job of executing the AMH strategy. With our focus on operational excellence, portfolio optimization and disciplined balance sheet management, we will continue to differentiate ourselves and deliver long-term shareholder value.”
Second Quarter 2025 Financial Results
Net income attributable to common shareholders totaled $105.6 million, or $0.28 per diluted share, for the second quarter of 2025, compared to $92.1 million, or $0.25 per diluted share, for the second quarter of 2024. The increase was primarily due to increases in rents and other single-family property revenues exceeding increases in total expenses and higher net gains on property sales.
Rents and other single-family property revenues increased 8.0% to $457.5 million for the second quarter of 2025, compared to $423.5 million for the second quarter of 2024. Revenue growth was driven by an increase in our average occupied portfolio which grew to 58,282 homes for the second quarter of 2025, compared to 56,516 homes for the second quarter of 2024, as well as higher rental rates.
Refer to “Defined Terms and Non-GAAP Reconciliations” for definitions of metrics and reconciliations to GAAP.
3
AMH
Earnings Press Release (continued)
Core NOI from our total portfolio increased 8.7% to $264.1 million for the second quarter of 2025, compared to $243.0 million for the second quarter of 2024. This growth was driven by a 7.7% increase in core revenues resulting from a larger number of occupied properties and higher rental rates, partially offset by a 5.8% increase in core property operating expenses.
For the Company’s Same-Home portfolio, core revenues increased 3.9% to $361.3 million for the second quarter of 2025, compared to $347.6 million for the second quarter of 2024, which was driven by a 4.0% increase in Average Monthly Realized Rent per property as well as higher fees and lower uncollectible rents, partially offset by a 40 basis point decrease in Average Occupied Days Percentage. Core property operating expenses from Same-Home properties increased 3.6% to $124.5 million for the second quarter of 2025, compared to $120.1 million for the second quarter of 2024, primarily driven by higher repairs and maintenance (“R&M”) and turnover costs, net. The increase was partially due to timing associated with incremental turnover costs related to the Company’s lease expiration management initiative, which is designed to shift lease expiration volume to the first half of the year to better align with the peak leasing season. As a result, Core NOI from Same-Home properties increased 4.1% to $236.8 million for the second quarter of 2025, compared to $227.5 million for the second quarter of 2024.
Core FFO attributable to common share and unit holders was $198.0 million, or $0.47 per FFO share and unit, for the second quarter of 2025, compared to $187.1 million, or $0.45 per FFO share and unit, for the second quarter of 2024. Adjusted FFO attributable to common share and unit holders was $176.4 million, or $0.42 per FFO share and unit, for the second quarter of 2025, compared to $164.6 million, or $0.39 per FFO share and unit, for the second quarter of 2024. These improvements were primarily attributable to growth in Core NOI from our total portfolio.
Year-to-Date 2025 Financial Results
Net income attributable to common shareholders totaled $215.5 million, or $0.58 per diluted share, for the six-month period ended June 30, 2025, compared to $201.4 million, or $0.55 per diluted share, for the six-month period ended June 30, 2024. The increase was primarily due to increases in rents and other single-family property revenues exceeding increases in total expenses.
Rents and other single-family property revenues increased 8.2% to $916.8 million for the six-month period ended June 30, 2025, compared to $847.0 million for the six-month period ended June 30, 2024. Revenue growth was driven by an increase in our average occupied portfolio which grew to 58,016 homes for the six-month period ended June 30, 2025, compared to 56,266 homes for the six-month period ended June 30, 2024, as well as higher rental rates.
Core NOI from our total portfolio increased 8.8% to $523.0 million for the six-month period ended June 30, 2025, compared to $480.7 million for the six-month period ended June 30, 2024. This growth was driven by a 7.8% increase in core revenues resulting from a larger number of occupied properties and higher rental rates, partially offset by a 6.0% increase in core property operating expenses.
For the Company’s Same-Home portfolio, core revenues increased 4.2% to $716.9 million for the six-month period ended June 30, 2025, compared to $687.9 million for the six-month period ended June 30, 2024, which was driven by a 4.2% increase in Average Monthly Realized Rent per property as well as higher fees, partially offset by a 20 basis point decrease in Average Occupied Days Percentage. Core property operating expenses from Same-Home properties increased 3.8% to $244.9 million for the six-month period ended June 30, 2025, compared to $235.9 million for the six-month period ended June 30, 2024, primarily driven by higher R&M and turnover costs, net and property management expenses, net. The increase in R&M and turnover costs, net was partially due to timing associated with incremental turnover costs related to the Company’s lease expiration management initiative, which is designed to shift lease expiration volume to the first half of the year to better align with the peak leasing season. As a result, Core NOI from Same-Home properties increased 4.4% to
Refer to “Defined Terms and Non-GAAP Reconciliations” for definitions of metrics and reconciliations to GAAP.
4
AMH
Earnings Press Release (continued)
$472.0 million for the six-month period ended June 30, 2025, compared to $452.0 million for the six-month period ended June 30, 2024.
Core FFO attributable to common share and unit holders was $392.7 million, or $0.93 per FFO share and unit, for the six-month period ended June 30, 2025, compared to $368.0 million, or $0.88 per FFO share and unit, for the six-month period ended June 30, 2024. Adjusted FFO attributable to common share and unit holders was $353.0 million, or $0.84 per FFO share and unit, for the six-month period ended June 30, 2025, compared to $330.7 million, or $0.79 per FFO share and unit, for the six-month period ended June 30, 2024. These improvements were primarily attributable to growth in Core NOI from our total portfolio.
Investments
Average Occupied Days Percentage was 95.7% for the second quarter of 2025, compared to 94.8% for the first quarter of 2025.
As of June 30, 2025, the Company’s total single-family properties, excluding properties held for sale, consisted of 60,596 homes, compared to 60,700 homes as of March 31, 2025, a decrease of 104 homes during the second quarter of 2025, which included 501 newly constructed homes delivered to our operating portfolio through our AMH Development Program and 5 homes acquired through our traditional acquisition channel, partially offset by 610 homes identified for sale. During the second quarter of 2025, we also developed an additional 135 newly constructed homes which were delivered to our unconsolidated joint ventures, aggregating to 636 total home deliveries through our AMH Development Program. As of June 30, 2025, the Company had 904 properties held for sale and 3,616 properties held in unconsolidated joint ventures.
Capital Activities, Balance Sheet and Liquidity
During the second quarter of 2025, American Homes 4 Rent, L.P. (the “Operating Partnership”), the entity through which the Company conducts substantially all of its business and owns, directly or through subsidiaries, substantially all of its assets, issued $650.0 million of 4.950% unsecured senior notes with a maturity date of June 15, 2030 (the “2030 Notes”). Interest on the 2030 Notes is payable semi-annually in arrears on June 15 and December 15 of each year, commencing on December 15, 2025. The Operating Partnership received aggregate net proceeds of $642.5 million from this offering, after underwriting fees of $3.9 million and a $3.6 million discount, and before offering costs of $1.3 million.
As of June 30, 2025, the Company had cash and cash equivalents of $323.3 million and total outstanding debt of $5.2 billion, excluding unamortized discounts and unamortized deferred financing costs, with a weighted-average interest rate of 4.5% and a weighted-average term to maturity of 9.9 years. The Company had no outstanding borrowings on its $1.25 billion revolving credit facility. During the second quarter of 2025, the Company generated $49.3 million of Retained Cash Flow and sold 370 properties, generating $120.6 million of net proceeds. In July 2025, the Company provided notice of its intent to pay off the AMH 2015-SFR2 securitization during the third quarter of 2025, which had a balance of $427.5 million as of June 30, 2025.
Refer to “Defined Terms and Non-GAAP Reconciliations” for definitions of metrics and reconciliations to GAAP.
5
AMH
Earnings Press Release (continued)
2025 Guidance
Set forth below are the Company’s current expectations with respect to full year 2025 Core FFO attributable to common share and unit holders and our underlying assumptions. In reliance on the exception provided by applicable SEC rules, the Company does not provide guidance for GAAP net income, the most comparable GAAP financial measure, or a reconciliation of 2025 Core FFO guidance to GAAP net income because we are unable to reasonably predict the following items which are included in GAAP net income: (i) gain on sale and impairment of single-family properties and other, net for consolidated properties and unconsolidated real estate joint ventures, (ii) acquisition and other transaction costs and (iii) hurricane-related charges, net. The actual amounts for any and all of these items could significantly impact our 2025 GAAP net income and, as disclosed in our historical financial results, have significantly impacted GAAP net income in prior periods.
Guidance Summary
Full Year 2025
Previous Guidance
Current Guidance
Core FFO attributable to common share and unit holders
$1.80 - $1.86
$1.84 - $1.88
Core FFO attributable to common share and unit holders growth
1.7% - 5.1%
4.0% - 6.2%
Same-Home
Core revenues growth
2.50% - 4.50%
3.00% - 4.50%
Core property operating expenses growth
3.00% - 5.00%
3.00% - 4.50%
Core NOI growth
2.25% - 4.25%
2.75% - 4.75%
Full Year 2025 (Unchanged)
Investment Program
Properties
Investment
Wholly owned acquisitions
—
—
Wholly owned development deliveries
1,800 - 2,000
$700 - $800 million
Development pipeline, pro rata share of JV and Property Enhancing Capex
—
$100 - $200 million
Total capital investment (wholly owned and pro rata JV)
1,800 - 2,000
$0.8 - $1.0 billion
Total gross capital investment (JVs at 100%)
2,200 - 2,400
$1.0 - $1.2 billion
Changes to Full Year 2025 Guidance
•$0.03 incremental Core FFO per share:
◦Primarily driven by increased Core NOI growth from both the Same-Home and Non-Same-Home portfolios from:
▪Better core revenues growth driven by strong year-to-date leasing performance and lower bad debt expense outlook.
◦As well as modestly improved full year financing cost outlook driven by beneficial refinancing execution.
Additional Information
A copy of the Company’s Second Quarter 2025 Earnings Release and Supplemental Information Package and this press release are available on our website at www.amh.com, under “Investor relations.” This information has also been furnished to the SEC in a current report on Form 8-K.
Refer to “Defined Terms and Non-GAAP Reconciliations” for definitions of metrics and reconciliations to GAAP.
6
AMH
Earnings Press Release (continued)
Conference Call
A conference call is scheduled on Friday, August 1, 2025 at 12:00 p.m. Eastern Time to discuss the Company’s financial results for the quarter ended June 30, 2025 and to provide an update on its business. The domestic dial-in number is (877) 451-6152 (U.S. and Canada) and the international dial-in number is (201) 389-0879 (passcode not required). A simultaneous audio webcast may be accessed by using the link at www.amh.com, under “Investor relations.” A replay of the conference call may be accessed through Friday, August 15, 2025 by calling (844) 512-2921 (U.S. and Canada) or (412) 317-6671 (international), replay passcode number 13753995#, or by using the link at www.amh.com, under “Investor relations.”
About AMH
AMH (NYSE: AMH) is a leading large-scale integrated owner, operator and developer of single-family rental homes. We’re an internally managed Maryland real estate investment trust (REIT) focused on acquiring, developing, renovating, leasing and managing homes as rental properties.
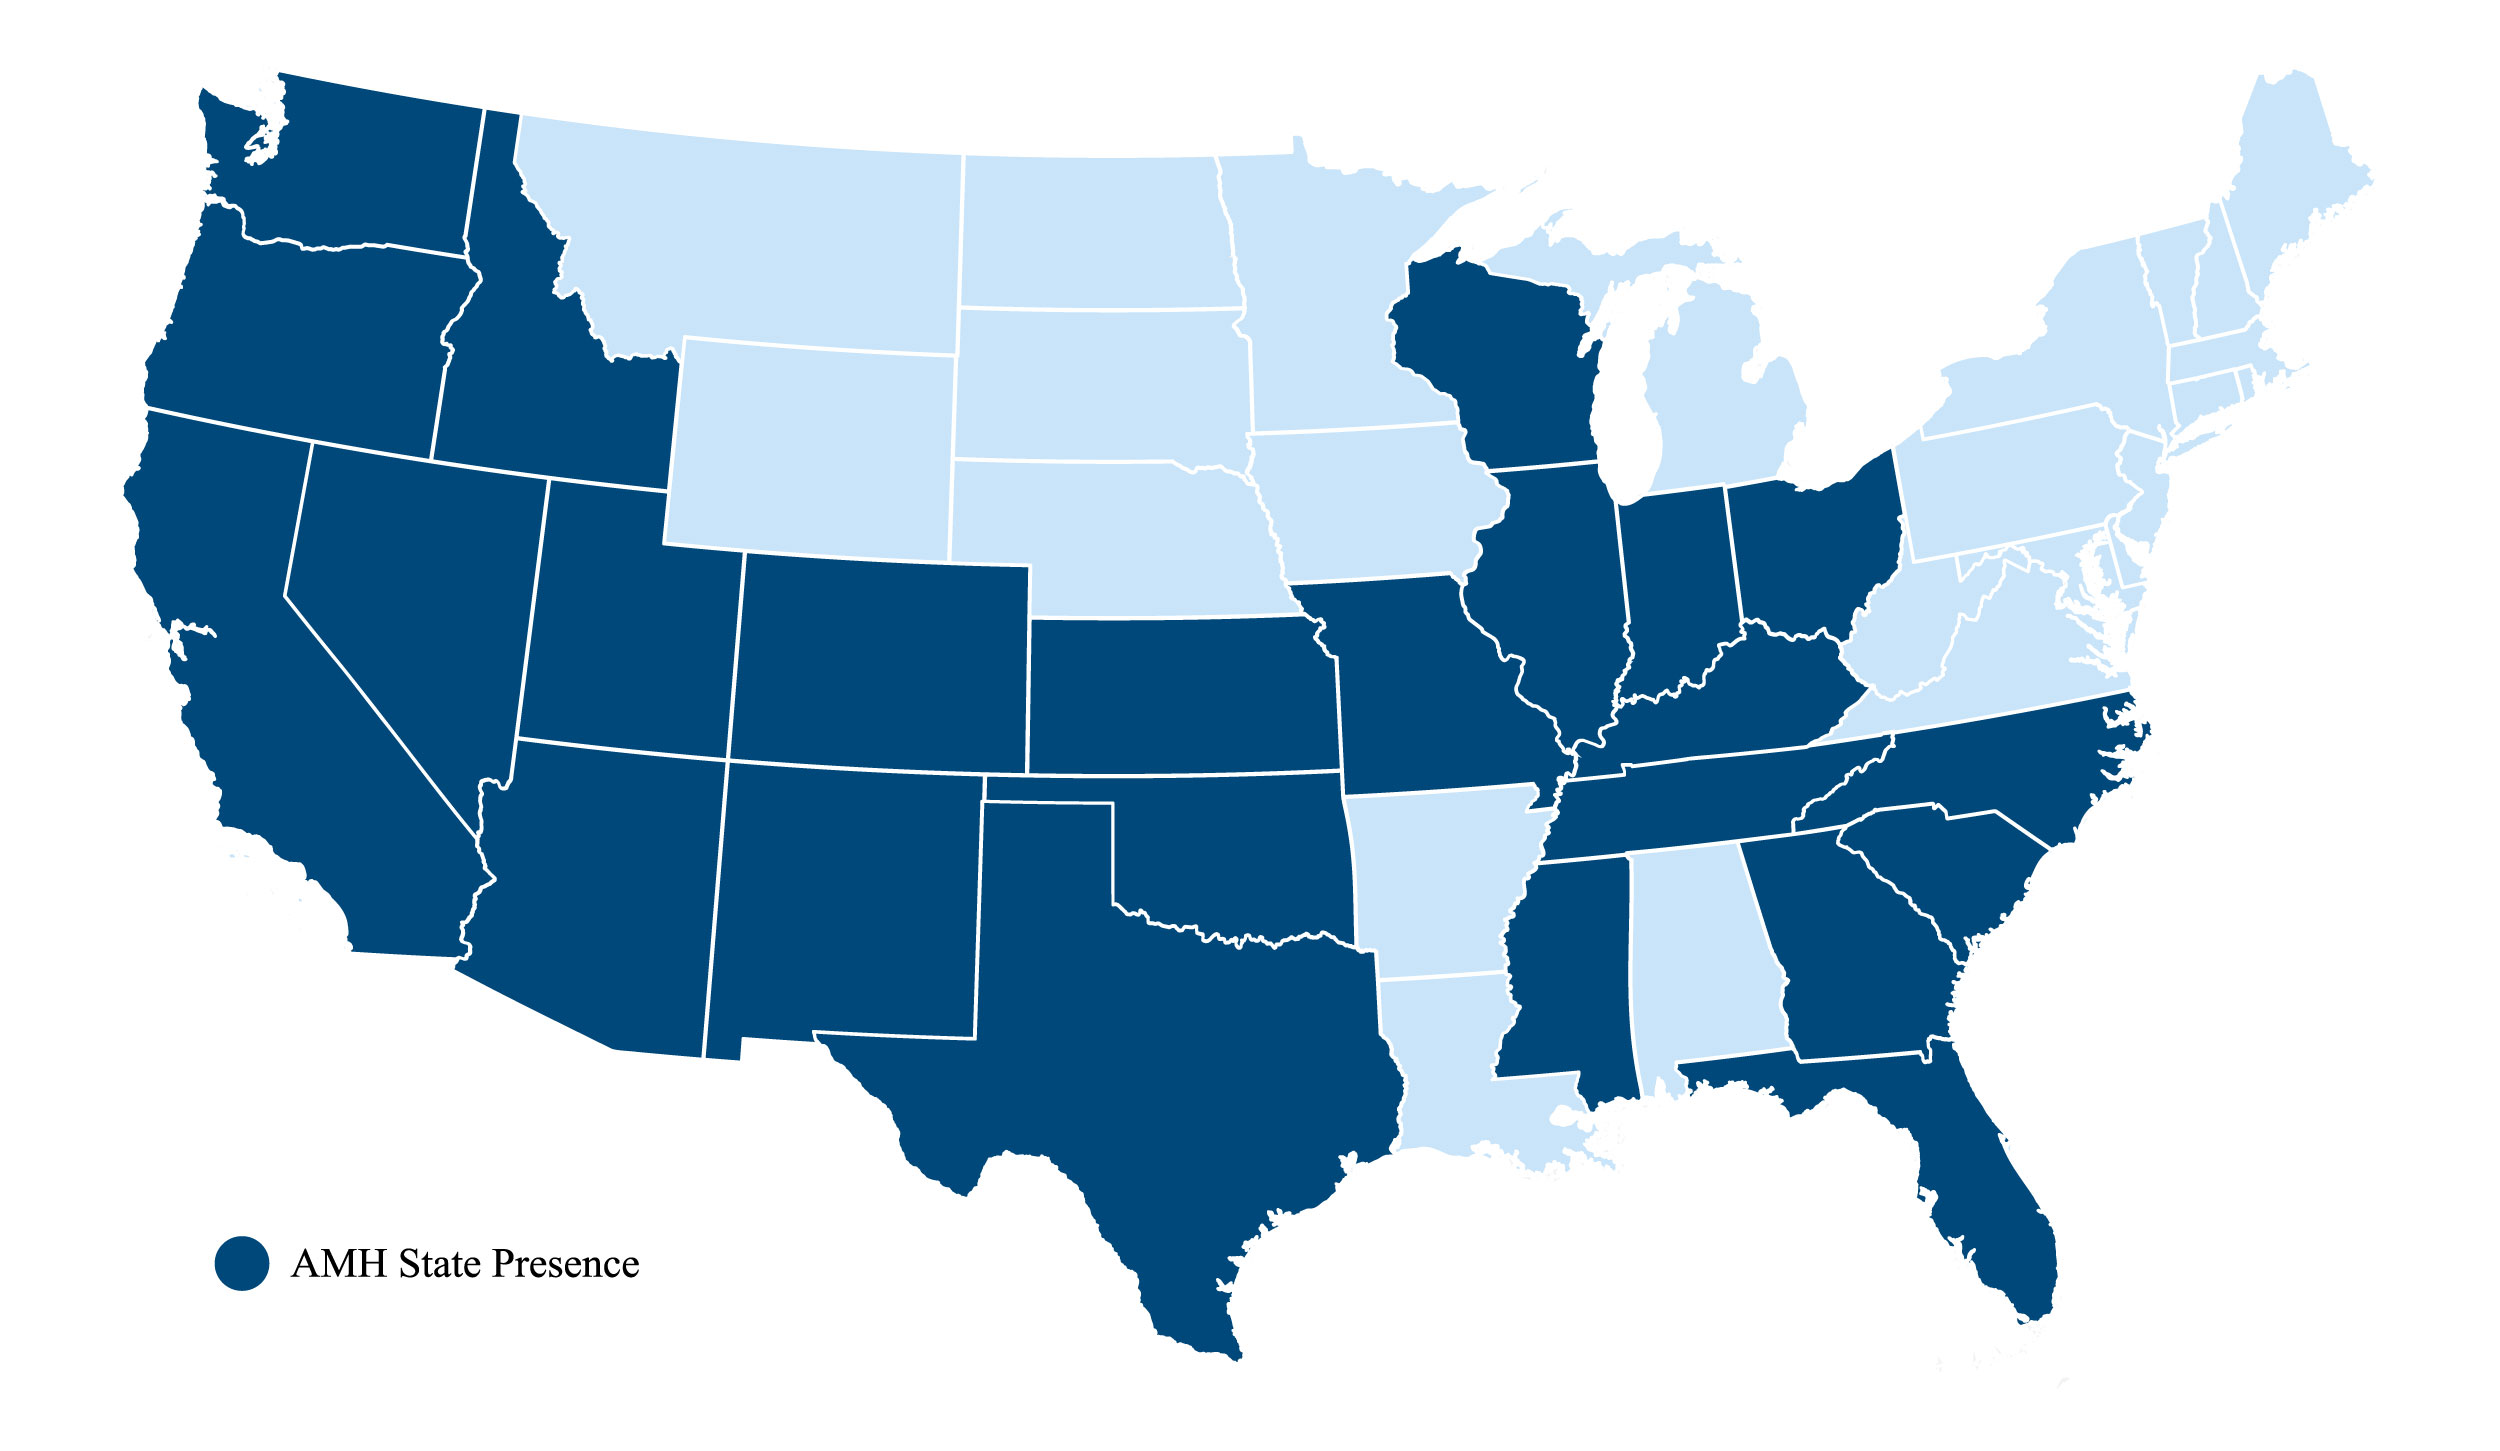
In recent years, we’ve been named a 2025 Great Place to Work®, a 2025 Top U.S. Homebuilder by Builder100, and one of the 2025 Most Trustworthy Companies in America by Newsweek and Statista Inc. As of June 30, 2025, we owned over 61,000 single-family properties in the Southeast, Midwest, Southwest and Mountain West regions of the United States. Additional information about AMH is available on our website at www.amh.com.
AMH refers to one or more of American Homes 4 Rent, American Homes 4 Rent, L.P. and their subsidiaries and joint ventures. In certain states, we operate under AMH Living or American Homes 4 Rent. Please see www.amh.com/dba to learn more.
This press release and the accompanying Supplemental Information Package contain “forward-looking statements.” These forward-looking statements relate to beliefs, expectations or intentions and similar statements concerning matters that are not of historical fact and are generally accompanied by words such as “estimate,” “project,” “predict,” “believe,” “expect,” “anticipate,” “intend,” “potential,” “plan,” “goal,” “outlook,” “guidance” or other words that convey the uncertainty of future events or outcomes. Examples of forward-looking statements contained in this press release and the Supplemental Information Package include, among others, our 2025 Guidance, our belief that our acquisition and homebuilding programs will result in continued growth and the estimated timing of our development deliveries set forth in the Supplemental Information Package. The Company has based these forward-looking statements on its current expectations and assumptions about future events. While the Company’s management considers these expectations and assumptions to be reasonable, they are inherently subject to significant business, economic, competitive, regulatory and other risks, contingencies and uncertainties, most of which are difficult to predict and many of which are beyond the Company’s control and could cause actual results to differ materially from any future results, performance or achievements expressed or implied by these forward-looking statements. Investors should not place undue reliance on these forward-looking statements, which speak only as of the date of this press release. The Company undertakes no obligation to update any forward-looking statements to conform to actual results or changes in its expectations, unless required by applicable law. For a further description of the risks and uncertainties that could cause actual results to differ from those expressed in these forward-looking statements, as well as risks relating to the business of the Company in general, see the “Risk Factors” disclosed in the Company’s Annual Report on Form 10-K for the year ended December 31, 2024 and in the Company’s subsequent filings with the SEC.
Refer to “Defined Terms and Non-GAAP Reconciliations” for definitions of metrics and reconciliations to GAAP.
7
AMH
Select Non-GAAP Reconciliations – Core Net Operating Income
(Amounts in thousands)
(Unaudited)
The following are reconciliations of core revenues, Same-Home core revenues, core property operating expenses, Same-Home core property operating expenses, Core NOI and Same-Home Core NOI to their respective GAAP metrics for the three and six months ended June 30, 2025 and 2024:
For the Three Months Ended Jun 30,
For the Six Months Ended Jun 30,
2025
2024
2025
2024
Core revenues and Same-Home core revenues
Rents and other single-family property revenues
$
457,503
$
423,494
$
916,779
$
847,049
Tenant charge-backs
(52,457)
(47,371)
(116,318)
(104,708)
Core revenues
405,046
376,123
800,461
742,341
Less: Non-Same-Home core revenues
(43,721)
(28,494)
(83,549)
(54,486)
Same-Home core revenues
$
361,325
$
347,629
$
716,912
$
687,855
Core property operating expenses and Same-Home core property operating expenses
Refer to “Defined Terms and Non-GAAP Reconciliations” for definitions of metrics and reconciliations to GAAP.
8
AMH
Select Non-GAAP Reconciliations – Core Net Operating Income (continued)
(Amounts in thousands)
(Unaudited)
The following are reconciliations of core revenues, Same-Home core revenues, core property operating expenses, Same-Home core property operating expenses, Core NOI, Same-Home Core NOI, Unencumbered Core NOI and Encumbered Core NOI to their respective GAAP metrics for the trailing five quarters:
For the Three Months Ended
Jun 30, 2025
Mar 31, 2025
Dec 31, 2024
Sep 30, 2024
Jun 30, 2024
Core revenues and Same-Home core revenues
Rents and other single-family property revenues
$
457,503
$
459,276
$
436,593
$
445,055
$
423,494
Tenant charge-backs
(52,457)
(63,861)
(49,108)
(67,615)
(47,371)
Core revenues
405,046
395,415
387,485
377,440
376,123
Less: Non-Same-Home core revenues
(43,721)
(39,828)
(37,663)
(28,655)
(28,494)
Same-Home core revenues
$
361,325
$
355,587
$
349,822
$
348,785
$
347,629
Core property operating expenses and Same-Home core property operating expenses
(1)Encumbered Core NOI and Unencumbered Core NOI are recast for prior periods to reflect the encumbered and unencumbered portfolios as of the end of the quarter subsequent to securitization payoffs.
Refer to “Defined Terms and Non-GAAP Reconciliations” for definitions of metrics and reconciliations to GAAP.
9
AMH
Fact Sheet
(Amounts in thousands, except per share and property data)
(Unaudited)
For the Three Months Ended Jun 30,
For the Six Months Ended Jun 30,
2025
2024
2025
2024
Operating Data
Net income attributable to common shareholders
$
105,553
$
92,142
$
215,525
$
201,431
Core revenues
$
405,046
$
376,123
$
800,461
$
742,341
Core NOI
$
264,139
$
242,982
$
522,950
$
480,652
Core NOI margin
65.2
%
64.6
%
65.3
%
64.7
%
Fully Adjusted EBITDAre
$
231,735
$
211,573
$
462,621
$
424,309
Fully Adjusted EBITDAre Margin
56.7
%
55.7
%
57.3
%
56.7
%
Per FFO share and unit:
FFO attributable to common share and unit holders
$
0.45
$
0.42
$
0.89
$
0.82
Core FFO attributable to common share and unit holders
$
0.47
$
0.45
$
0.93
$
0.88
Adjusted FFO attributable to common share and unit holders
$
0.42
$
0.39
$
0.84
$
0.79
Jun 30, 2025
Mar 31, 2025
Dec 31, 2024
Sep 30, 2024
Jun 30, 2024
Selected Balance Sheet Information - end of period
Single-family properties in operation, net
$
10,947,696
$
10,932,960
$
10,880,599
$
10,398,690
$
10,295,131
Total assets
$
13,592,318
$
13,289,223
$
13,381,151
$
12,844,285
$
13,303,940
Outstanding borrowings under revolving credit facility
$
—
$
410,000
$
—
$
—
$
—
Total Debt
$
5,227,529
$
4,989,015
$
5,075,391
$
4,578,772
$
5,055,355
Total Capitalization
$
20,669,137
$
21,157,336
$
21,059,213
$
20,851,847
$
20,813,612
Total Debt to Total Capitalization
25.3
%
23.6
%
24.1
%
22.0
%
24.3
%
Net Debt and Preferred Shares to Adjusted EBITDAre
5.2 x
5.3 x
5.4 x
5.0 x
5.1 x
NYSE AMH Class A common share closing price
$
36.07
$
37.81
$
37.42
$
38.39
$
37.16
Portfolio Data - end of period
Occupied single-family properties
58,317
58,246
57,486
55,726
56,669
Single-family properties leased, not yet occupied
406
567
378
347
407
Single-family properties in turnover process
1,753
1,619
2,098
2,271
1,543
Single-family properties recently renovated or developed
118
257
565
544
240
Single-family properties newly acquired and under renovation
2
11
4
11
1
Total single-family properties, excluding properties held for sale
60,596
60,700
60,531
58,899
58,860
Single-family properties held for sale
904
661
805
1,003
633
Total single-family properties wholly owned
61,500
61,361
61,336
59,902
59,493
Single-family properties managed under joint ventures
3,616
3,487
3,376
3,271
3,167
Total single-family properties wholly owned and managed
65,116
64,848
64,712
63,173
62,660
Total Average Occupied Days Percentage (1)
95.7
%
94.8
%
94.2
%
95.1
%
95.8
%
Same-Home Average Occupied Days Percentage (54,029 properties)
96.3
%
96.1
%
95.4
%
96.1
%
96.7
%
Other Data
Distributions declared per common share
$
0.30
$
0.30
$
0.26
$
0.26
$
0.26
Distributions declared per Series G perpetual preferred share
$
0.37
$
0.37
$
0.37
$
0.37
$
0.37
Distributions declared per Series H perpetual preferred share
$
0.39
$
0.39
$
0.39
$
0.39
$
0.39
(1)Calculated based on total single-family properties wholly owned, excluding properties held for sale.
Refer to “Defined Terms and Non-GAAP Reconciliations” for definitions of metrics and reconciliations to GAAP.
10
AMH
Condensed Consolidated Statements of Operations
(Amounts in thousands, except share and per share data)
(Unaudited)
For the Three Months Ended Jun 30,
For the Six Months Ended Jun 30,
2025
2024
2025
2024
Rents and other single-family property revenues
$
457,503
$
423,494
$
916,779
$
847,049
Expenses:
Property operating expenses
160,089
149,470
327,619
305,397
Property management expenses
34,412
32,382
68,593
63,784
General and administrative expense
20,008
21,693
39,679
43,578
Interest expense
46,303
38,678
91,729
77,255
Acquisition and other transaction costs
2,655
2,937
5,716
6,261
Depreciation and amortization
126,939
117,603
251,867
233,329
Total expenses
390,406
362,763
785,203
729,604
Gain on sale and impairment of single-family properties and other, net
51,908
43,892
113,924
112,793
Loss on early extinguishment of debt
—
(63)
(216)
(1,017)
Other income and expense, net
4,619
3,974
7,053
7,408
Net income
123,624
108,534
252,337
236,629
Noncontrolling interest
14,585
12,906
29,840
28,226
Dividends on preferred shares
3,486
3,486
6,972
6,972
Net income attributable to common shareholders
$
105,553
$
92,142
$
215,525
$
201,431
Weighted-average common shares outstanding:
Basic
370,692,250
366,778,333
370,538,451
366,645,796
Diluted
371,059,970
367,312,955
370,916,988
367,142,626
Net income attributable to common shareholders per share:
Basic
$
0.28
$
0.25
$
0.58
$
0.55
Diluted
$
0.28
$
0.25
$
0.58
$
0.55
Refer to “Defined Terms and Non-GAAP Reconciliations” for definitions of metrics and reconciliations to GAAP.
11
AMH
Funds from Operations
(Amounts in thousands, except share and per share data)
(Unaudited)
For the Three Months Ended Jun 30,
For the Six Months Ended Jun 30,
2025
2024
2025
2024
Net income attributable to common shareholders
$
105,553
$
92,142
$
215,525
$
201,431
Adjustments:
Noncontrolling interests in the Operating Partnership
14,585
12,906
29,840
28,226
Gain on sale and impairment of single-family properties and other, net
(51,908)
(43,892)
(113,924)
(112,793)
Adjustments for unconsolidated real estate joint ventures
1,821
1,196
3,305
2,793
Depreciation and amortization
126,939
117,603
251,867
233,329
Less: depreciation and amortization of non-real estate assets
(5,511)
(4,769)
(10,876)
(9,424)
FFO attributable to common share and unit holders
$
191,479
$
175,186
$
375,737
$
343,562
Adjustments:
Acquisition, other transaction costs and other
1,445
2,937
5,535
6,261
Noncash share-based compensation - general and administrative
Core FFO attributable to common share and unit holders
$
198,048
$
187,085
$
392,725
$
368,022
Recurring Capital Expenditures
(20,515)
(21,403)
(37,344)
(35,527)
Leasing costs
(1,098)
(1,042)
(2,337)
(1,837)
Adjusted FFO attributable to common share and unit holders
$
176,435
$
164,640
$
353,044
$
330,658
Per FFO share and unit:
FFO attributable to common share and unit holders
$
0.45
$
0.42
$
0.89
$
0.82
Core FFO attributable to common share and unit holders
$
0.47
$
0.45
$
0.93
$
0.88
Adjusted FFO attributable to common share and unit holders
$
0.42
$
0.39
$
0.84
$
0.79
Weighted-average FFO shares and units:
Common shares outstanding
370,692,250
366,778,333
370,538,451
366,645,796
Share-based compensation plan and forward sale equity contracts (1)
692,590
888,460
726,881
883,662
Operating partnership units
51,228,628
51,376,980
51,302,394
51,376,980
Total weighted-average FFO shares and units
422,613,468
419,043,773
422,567,726
418,906,438
(1)Reflects the effect of potentially dilutive securities issuable upon the assumed vesting/exercise of restricted stock units and stock options and the dilutive effect of forward sale equity contracts under the treasury stock method.
Refer to “Defined Terms and Non-GAAP Reconciliations” for definitions of metrics and reconciliations to GAAP.
12
AMH
Core Net Operating Income – Total Portfolio
(Amounts in thousands)
(Unaudited)
For the Three Months Ended Jun 30,
For the Six Months Ended Jun 30,
2025
2024
2025
2024
Rents from single-family properties
$
398,538
$
371,414
$
788,869
$
733,463
Fees from single-family properties
9,553
8,144
18,932
16,145
Bad debt
(3,045)
(3,435)
(7,340)
(7,267)
Core revenues
405,046
376,123
800,461
742,341
Property tax expense
66,119
64,026
133,059
128,614
HOA fees, net (1)
7,349
6,738
14,163
13,052
R&M and turnover costs, net (1)
31,808
28,263
59,089
53,109
Insurance
4,614
4,948
9,545
9,725
Property management expenses, net (2)
31,017
29,166
61,655
57,189
Core property operating expenses
140,907
133,141
277,511
261,689
Core NOI
$
264,139
$
242,982
$
522,950
$
480,652
Core NOI margin
65.2
%
64.6
%
65.3
%
64.7
%
For the Three Months Ended Jun 30, 2025
Same-Home Properties
Stabilized Properties
Non-Stabilized Properties (3)
Held for Sale and Other Properties (4)
Total Single-Family Properties Wholly Owned
Property count
54,029
3,182
3,383
906
61,500
Average Occupied Days Percentage
96.3
%
95.1
%
85.2
%
55.0
%
95.1
%
Rents from single-family properties
$
355,364
$
22,710
$
17,238
$
3,226
$
398,538
Fees from single-family properties
8,320
609
500
124
9,553
Bad debt
(2,359)
(144)
(217)
(325)
(3,045)
Core revenues
361,325
23,175
17,521
3,025
405,046
Property tax expense
59,005
3,426
2,927
761
66,119
HOA fees, net (1)
6,575
371
314
89
7,349
R&M and turnover costs, net (1)
28,279
899
2,047
583
31,808
Insurance
4,165
315
80
54
4,614
Property management expenses, net (2)
26,503
1,691
2,440
383
31,017
Core property operating expenses
124,527
6,702
7,808
1,870
140,907
Core NOI
$
236,798
$
16,473
$
9,713
$
1,155
$
264,139
Core NOI margin
65.5
%
71.1
%
55.4
%
38.2
%
65.2
%
(1)Presented net of tenant charge-backs.
(2)Presented net of tenant charge-backs and excludes noncash share-based compensation expense related to centralized and field property management employees.
(3)Includes 1,303 recently renovated or developed properties that do not meet the definition of Stabilized Property at the start of the quarter and 2,080 legacy-tenant properties which have not experienced tenant turnover under our ownership (the majority of which were acquired through bulk acquisitions) or properties currently out of service due to a casualty loss.
(4)Includes 904 properties held for sale and 2 properties newly acquired and under renovation that are not yet placed into service. Average Occupied Days Percentage is calculated based only on properties held for sale.
Refer to “Defined Terms and Non-GAAP Reconciliations” for definitions of metrics and reconciliations to GAAP.
13
AMH
Same-Home Results – Quarterly and Year-to-Date Comparisons
(Amounts in thousands, except property and per property data)
(Unaudited)
For the Three Months Ended Jun 30,
For the Six Months Ended Jun 30,
2025
2024
Change
2025
2024
Change
Number of Same-Home properties
54,029
54,029
54,029
54,029
Average Occupied Days Percentage
96.3
%
96.7
%
(0.4)
%
96.2
%
96.4
%
(0.2)
%
Average Monthly Realized Rent per Property
$
2,276
$
2,188
4.0
%
$
2,264
$
2,172
4.2
%
Turnover Rate
7.9
%
7.5
%
0.4
%
14.6
%
13.8
%
0.8
%
Turnover Rate - TTM
28.4
%
N/A
28.4
%
N/A
Core NOI:
Rents from single-family properties
$
355,364
$
342,982
3.6
%
$
705,967
$
678,864
4.0
%
Fees from single-family properties
8,320
7,311
13.8
%
16,601
14,587
13.8
%
Bad debt
(2,359)
(2,664)
(11.4)
%
(5,656)
(5,596)
1.1
%
Core revenues
361,325
347,629
3.9
%
716,912
687,855
4.2
%
Property tax expense
59,005
58,712
0.5
%
118,811
117,645
1.0
%
HOA fees, net (1)
6,575
6,248
5.2
%
12,749
12,077
5.6
%
R&M and turnover costs, net (1)
28,279
25,092
12.7
%
52,038
46,984
10.8
%
Insurance
4,165
4,414
(5.6)
%
8,444
8,742
(3.4)
%
Property management expenses, net (2)
26,503
25,676
3.2
%
52,907
50,431
4.9
%
Core property operating expenses
124,527
120,142
3.6
%
244,949
235,879
3.8
%
Core NOI
$
236,798
$
227,487
4.1
%
$
471,963
$
451,976
4.4
%
Core NOI margin
65.5
%
65.4
%
65.8
%
65.7
%
Selected Property Expenditure Details:
Recurring Capital Expenditures
$
18,685
$
18,862
(0.9)
%
$
33,719
$
31,584
6.8
%
Per property:
Average Recurring Capital Expenditures
$
346
$
349
(0.9)
%
$
624
$
585
6.8
%
Average R&M and turnover costs, net, plus Recurring Capital Expenditures
$
869
$
814
6.8
%
$
1,587
$
1,454
9.1
%
Property Enhancing Capex
$
8,496
$
8,268
$
17,242
$
16,340
(1)Presented net of tenant charge-backs.
(2)Presented net of tenant charge-backs and excludes noncash share-based compensation expense related to centralized and field property management employees.
Refer to “Defined Terms and Non-GAAP Reconciliations” for definitions of metrics and reconciliations to GAAP.
14
AMH
Same-Home Results – Sequential Quarterly Results
(Amounts in thousands, except per property data)
(Unaudited)
For the Three Months Ended
Jun 30, 2025
Mar 31, 2025
Dec 31, 2024
Sep 30, 2024
Jun 30, 2024
Average Occupied Days Percentage
96.3
%
96.1
%
95.4
%
96.1
%
96.7
%
Average Monthly Realized Rent per Property
$
2,276
$
2,252
$
2,238
$
2,219
$
2,188
Average Change in Rent for Renewals
4.4
%
4.5
%
5.0
%
5.2
%
5.2
%
Average Change in Rent for Re-Leases
4.1
%
1.4
%
0.3
%
5.3
%
5.7
%
Average Blended Change in Rent
4.3
%
3.6
%
3.4
%
5.2
%
5.3
%
Core NOI:
Rents from single-family properties
$
355,364
$
350,603
$
345,967
$
345,549
$
342,982
Fees from single-family properties
8,320
8,281
8,007
7,351
7,311
Bad debt
(2,359)
(3,297)
(4,152)
(4,115)
(2,664)
Core revenues
361,325
355,587
349,822
348,785
347,629
Property tax expense
59,005
59,806
55,302
58,078
58,712
HOA fees, net (1)
6,575
6,174
6,350
6,336
6,248
R&M and turnover costs, net (1)
28,279
23,759
24,697
27,652
25,092
Insurance
4,165
4,279
4,466
4,461
4,414
Property management expenses, net (2)
26,503
26,404
26,240
25,128
25,676
Core property operating expenses
124,527
120,422
117,055
121,655
120,142
Core NOI
$
236,798
$
235,165
$
232,767
$
227,130
$
227,487
Core NOI margin
65.5
%
66.1
%
66.5
%
65.1
%
65.4
%
Selected Property Expenditure Details:
Recurring Capital Expenditures
$
18,685
$
15,034
$
15,286
$
20,503
$
18,862
Per property:
Average Recurring Capital Expenditures
$
346
$
278
$
283
$
379
$
349
Average R&M and turnover costs, net, plus Recurring Capital Expenditures
$
869
$
718
$
740
$
891
$
814
Property Enhancing Capex
$
8,496
$
8,746
$
7,128
$
9,403
$
8,268
(1)Presented net of tenant charge-backs.
(2)Presented net of tenant charge-backs and excludes noncash share-based compensation expense related to centralized and field property management employees.
Refer to “Defined Terms and Non-GAAP Reconciliations” for definitions of metrics and reconciliations to GAAP.
15
AMH
Same-Home Results – Operating Metrics by Market
Market
Number of Properties
Gross Book Value per Property
% of 2Q25 NOI
Avg. Change in Rent for Renewals (1)
Avg. Change in Rent for Re-Leases (1)
Avg. Blended Change in
Rent (1)
Atlanta, GA
5,319
$
227,550
9.7
%
3.7
%
3.1
%
3.5
%
Charlotte, NC
3,879
222,618
7.5
%
4.1
%
5.5
%
4.5
%
Dallas-Fort Worth, TX
3,591
176,328
5.7
%
3.8
%
1.9
%
3.3
%
Nashville, TN
3,105
251,188
7.0
%
3.8
%
2.5
%
3.4
%
Jacksonville, FL
2,963
217,815
4.8
%
3.4
%
1.3
%
2.8
%
Phoenix, AZ
2,939
219,637
5.9
%
4.9
%
1.1
%
3.8
%
Indianapolis, IN
2,765
176,304
3.7
%
5.3
%
9.2
%
6.3
%
Tampa, FL
2,651
232,833
4.7
%
3.9
%
2.3
%
3.5
%
Houston, TX
2,155
180,404
3.0
%
4.2
%
2.4
%
3.8
%
Columbus, OH
2,088
198,293
3.9
%
5.6
%
7.7
%
6.0
%
Raleigh, NC
2,059
202,495
3.6
%
4.1
%
3.8
%
4.0
%
Cincinnati, OH
2,066
199,359
3.8
%
5.3
%
9.5
%
6.5
%
Las Vegas, NV
1,996
285,123
4.1
%
3.9
%
1.8
%
3.4
%
Salt Lake City, UT
1,864
304,659
4.6
%
4.7
%
6.9
%
5.3
%
Orlando, FL
1,770
222,186
3.2
%
3.6
%
2.5
%
3.3
%
Greater Chicago area, IL and IN
1,483
194,577
2.7
%
6.8
%
12.9
%
7.9
%
Charleston, SC
1,401
231,350
2.7
%
4.0
%
4.0
%
4.0
%
San Antonio, TX
1,097
200,578
1.5
%
3.4
%
(3.8)
%
1.8
%
Savannah/Hilton Head, SC
990
210,719
2.0
%
5.0
%
5.0
%
5.0
%
Seattle, WA
935
330,437
2.4
%
8.3
%
7.4
%
8.0
%
All Other (2)
6,913
233,447
13.5
%
4.1
%
4.5
%
4.2
%
Total/Average
54,029
$
222,262
100.0
%
4.4
%
4.1
%
4.3
%
Average Occupied Days Percentage
Average Monthly Realized Rent per Property
Market
2Q25 QTD
2Q24 QTD
Change
2Q25 QTD
2Q24 QTD
Change
Atlanta, GA
95.8
%
96.4
%
(0.6)
%
$
2,306
$
2,220
3.9
%
Charlotte, NC
96.9
%
97.6
%
(0.7)
%
2,231
2,124
5.0
%
Dallas-Fort Worth, TX
95.7
%
96.0
%
(0.3)
%
2,330
2,252
3.5
%
Nashville, TN
96.4
%
96.5
%
(0.1)
%
2,395
2,312
3.6
%
Jacksonville, FL
96.3
%
96.6
%
(0.3)
%
2,194
2,141
2.5
%
Phoenix, AZ
95.1
%
95.8
%
(0.7)
%
2,174
2,119
2.6
%
Indianapolis, IN
96.6
%
98.0
%
(1.4)
%
1,940
1,837
5.6
%
Tampa, FL
95.8
%
96.4
%
(0.6)
%
2,446
2,371
3.2
%
Houston, TX
96.4
%
96.4
%
—
%
2,111
2,034
3.8
%
Columbus, OH
97.5
%
97.4
%
0.1
%
2,261
2,142
5.6
%
Raleigh, NC
97.0
%
96.8
%
0.2
%
2,082
2,011
3.5
%
Cincinnati, OH
97.7
%
97.8
%
(0.1)
%
2,218
2,092
6.0
%
Las Vegas, NV
95.3
%
96.1
%
(0.8)
%
2,323
2,255
3.0
%
Salt Lake City, UT
97.1
%
97.4
%
(0.3)
%
2,515
2,404
4.6
%
Orlando, FL
96.3
%
95.8
%
0.5
%
2,405
2,333
3.1
%
Greater Chicago area, IL and IN
97.9
%
98.4
%
(0.5)
%
2,560
2,387
7.2
%
Charleston, SC
95.5
%
96.7
%
(1.2)
%
2,348
2,251
4.3
%
San Antonio, TX
95.1
%
95.5
%
(0.4)
%
1,953
1,930
1.2
%
Savannah/Hilton Head, SC
96.5
%
97.5
%
(1.0)
%
2,311
2,184
5.8
%
Seattle, WA
97.0
%
96.0
%
1.0
%
2,865
2,729
5.0
%
All Other (2)
96.4
%
96.7
%
(0.3)
%
2,254
2,169
3.9
%
Total/Average
96.3
%
96.7
%
(0.4)
%
$
2,276
$
2,188
4.0
%
(1)Reflected for the three months ended June 30, 2025.
(2)Represents 14 markets in 12 states.
Refer to “Defined Terms and Non-GAAP Reconciliations” for definitions of metrics and reconciliations to GAAP.
16
AMH
Condensed Consolidated Balance Sheets
(Amounts in thousands)
Jun 30, 2025
Dec 31, 2024
(Unaudited)
Assets
Single-family properties:
Land
$
2,387,155
$
2,370,006
Buildings and improvements
11,778,460
11,559,461
Single-family properties in operation
14,165,615
13,929,467
Less: accumulated depreciation
(3,217,919)
(3,048,868)
Single-family properties in operation, net
10,947,696
10,880,599
Single-family properties under development and development land
1,309,824
1,272,284
Single-family properties and land held for sale, net
242,402
212,808
Total real estate assets, net
12,499,922
12,365,691
Cash and cash equivalents
323,258
199,413
Restricted cash
143,342
150,803
Rent and other receivables
50,444
48,452
Escrow deposits, prepaid expenses and other assets
307,238
337,379
Investments in unconsolidated joint ventures
147,835
159,134
Goodwill
120,279
120,279
Total assets
$
13,592,318
$
13,381,151
Liabilities
Revolving credit facility
$
—
$
—
Asset-backed securitizations, net
427,275
924,344
Unsecured senior notes, net
4,731,334
4,086,418
Accounts payable and accrued expenses
588,166
521,759
Total liabilities
5,746,775
5,532,521
Commitments and contingencies
Equity
Shareholders’ equity:
Class A common shares
3,702
3,690
Class B common shares
6
6
Preferred shares
92
92
Additional paid-in capital
7,542,892
7,529,008
Accumulated deficit
(388,735)
(380,632)
Accumulated other comprehensive income
7,249
7,852
Total shareholders’ equity
7,165,206
7,160,016
Noncontrolling interest
680,337
688,614
Total equity
7,845,543
7,848,630
Total liabilities and equity
$
13,592,318
$
13,381,151
Refer to “Defined Terms and Non-GAAP Reconciliations” for definitions of metrics and reconciliations to GAAP.
17
AMH
Debt Summary as of June 30, 2025
(Amounts in thousands)
(Unaudited)
Secured
Unsecured
Total Balance
% of Total
Interest Rate (1)
Years to Maturity (2)
Floating rate debt:
Revolving credit facility (3)
$
—
$
—
$
—
—
%
5.40
%
4.0
Total floating rate debt
—
—
—
—
%
5.40
%
4.0
Fixed rate debt:
AMH 2015-SFR2 securitization (4)
427,529
—
427,529
8.2
%
4.36
%
20.3
2028 unsecured senior notes
—
500,000
500,000
9.6
%
4.08
%
2.6
2029 unsecured senior notes
—
400,000
400,000
7.7
%
4.90
%
3.6
2030 unsecured senior notes
—
650,000
650,000
12.3
%
4.95
%
5.0
2031 unsecured senior notes
—
450,000
450,000
8.6
%
2.46
%
6.0
2032 unsecured senior notes
—
600,000
600,000
11.5
%
3.63
%
6.8
2034 unsecured senior notes I
—
600,000
600,000
11.5
%
5.50
%
8.6
2034 unsecured senior notes II
—
500,000
500,000
9.6
%
5.50
%
9.0
2035 unsecured senior notes
—
500,000
500,000
9.6
%
5.08
%
9.7
2051 unsecured senior notes
—
300,000
300,000
5.7
%
3.38
%
26.1
2052 unsecured senior notes
—
300,000
300,000
5.7
%
4.30
%
26.8
Total fixed rate debt
427,529
4,800,000
5,227,529
100.0
%
4.45
%
9.9
Total Debt
$
427,529
$
4,800,000
5,227,529
100.0
%
4.45
%
9.9
Unamortized discounts and loan costs
(68,920)
Total debt per balance sheet
$
5,158,609
Maturity Schedule by Year (2)
Total Debt
% of Total
Remaining 2025
$
2,388
—
%
2026
4,776
0.1
%
2027
4,776
0.1
%
2028
504,776
9.7
%
2029
404,776
7.7
%
Thereafter
4,306,037
82.4
%
Total
$
5,227,529
100.0
%
(1)Interest rates are as of June 30, 2025 and reflect the effect of any hedging instruments, as applicable.
(2)Years to maturity and maturity schedule reflect all debt on a fully extended basis. The AMH 2015-SFR2 securitization has an anticipated repayment date of October 9, 2025. If the securitization is not repaid by this date, the duration-adjusted weighted-average interest rate will increase by a minimum of 3.00%.
(3)The revolving credit facility bears interest at the Secured Overnight Financing Rate plus a 0.10% spread adjustment and a margin of 0.85% as of period end.
(4)The Company has provided notice to the lender of its intent to pay off the AMH 2015-SFR2 securitization during the third quarter of 2025.
Interest Expense Reconciliation
For the Three Months Ended Jun 30,
For the Six Months Ended Jun 30,
(Amounts in thousands)
2025
2024
2025
2024
Interest expense per income statement and included in Core FFO attributable to common share and unit holders
$
46,303
$
38,678
$
91,729
$
77,255
Less: amortization of discounts, loan costs and cash flow hedges
(2,463)
(2,904)
(4,948)
(5,960)
Add: capitalized interest
14,219
13,131
28,073
27,353
Cash interest
$
58,059
$
48,905
$
114,854
$
98,648
Refer to “Defined Terms and Non-GAAP Reconciliations” for definitions of metrics and reconciliations to GAAP.
18
AMH
Capital Structure and Credit Metrics as of June 30, 2025
(Amounts in thousands, except share and per share data)
(Unaudited)
Total Capitalization
Total Debt
$
5,227,529
25.3
%
Total preferred shares
230,000
1.1
%
Common equity at market value:
Common shares outstanding
370,897,655
Operating partnership units
50,826,980
Total shares and units
421,724,635
NYSE AMH Class A common share closing price at June 30, 2025
$
36.07
Market value of common shares and operating partnership units
15,211,608
73.6
%
Total Capitalization
$
20,669,137
100.0
%
Preferred Shares
Earliest Redemption Date
Outstanding Shares
Annual Dividend Per Share
Annual Dividend Amount
Series
Per Share
Total
5.875% Series G Perpetual Preferred Shares
7/17/2022
4,600,000
$
25.00
$
115,000
$
1.469
$
6,756
6.250% Series H Perpetual Preferred Shares
9/19/2023
4,600,000
$
25.00
115,000
$
1.563
7,188
Total preferred shares
9,200,000
$
230,000
$
13,944
Credit Ratios
Credit Ratings
Net Debt and Preferred Shares to Adjusted EBITDAre
5.2 x
Rating Agency
Rating
Outlook
Fixed Charge Coverage
4.1 x
Moody's Investor Service
Baa2
Stable
Unencumbered Core NOI percentage
93.6
%
S&P Global Ratings
BBB
Positive
Unsecured Senior Notes Covenant Ratios
Requirement
Actual
Ratio of Indebtedness to Total Assets
<
60.0
%
31.5
%
Ratio of Secured Debt to Total Assets
<
40.0
%
2.6
%
Ratio of Unencumbered Assets to Unsecured Debt
>
150.0
%
329.6
%
Ratio of Consolidated Income Available for Debt Service to Interest Expense
>
1.50 x
4.35 x
Unsecured Credit Facility Covenant Ratios
Requirement
Actual
Ratio of Total Indebtedness to Total Asset Value
<
60.0
%
28.4
%
Ratio of Secured Indebtedness to Total Asset Value
<
40.0
%
2.8
%
Ratio of Unsecured Indebtedness to Unencumbered Asset Value
<
60.0
%
29.5
%
Ratio of EBITDA to Fixed Charges
>
1.50 x
3.83 x
Ratio of Unencumbered NOI to Unsecured Interest Expense
>
1.75 x
5.27 x
Refer to “Defined Terms and Non-GAAP Reconciliations” for definitions of metrics and reconciliations to GAAP.
19
AMH
Top 20 Markets Summary as of June 30, 2025
Property Information (1)
Market
Number of Properties
Percentage of Total Properties
Gross Book Value per Property
Avg. Sq. Ft.
Avg. Age (years)
Atlanta, GA
6,028
9.9
%
$
238,325
2,196
17.4
Charlotte, NC
4,244
7.0
%
231,632
2,119
18.7
Dallas-Fort Worth, TX
3,787
6.2
%
178,940
2,084
20.9
Nashville, TN
3,383
5.6
%
262,866
2,122
16.7
Jacksonville, FL
3,365
5.6
%
233,417
1,926
14.4
Phoenix, AZ
3,300
5.4
%
224,957
1,854
19.8
Indianapolis, IN
3,030
5.0
%
182,341
1,934
22.2
Tampa, FL
3,052
5.0
%
249,730
1,956
14.8
Las Vegas, NV
2,660
4.4
%
315,290
1,965
10.7
Houston, TX
2,335
3.9
%
182,305
2,066
19.5
Raleigh, NC
2,167
3.6
%
205,329
1,899
18.7
Columbus, OH
2,201
3.6
%
209,502
1,895
21.6
Orlando, FL
2,180
3.6
%
246,105
1,938
16.6
Cincinnati, OH
2,103
3.5
%
200,947
1,843
22.4
Salt Lake City, UT
1,937
3.2
%
309,157
2,243
18.2
Charleston, SC
1,644
2.7
%
244,368
1,962
13.3
Greater Chicago area, IL and IN
1,512
2.5
%
194,807
1,869
23.8
San Antonio, TX
1,190
2.0
%
204,149
1,911
16.1
Boise, ID
1,086
1.8
%
318,390
1,880
10.8
Savannah/Hilton Head, SC
1,056
1.7
%
218,812
1,884
16.4
All Other (3)
8,336
13.8
%
251,032
1,942
18.2
Total/Average
60,596
100.0
%
$
233,771
1,998
17.9
Leasing Information (1)
Market
Avg. Occupied Days
Percentage (2)
Avg. Monthly Realized Rent
per Property (2)
Avg. Change in Rent for
Renewals (2)
Avg. Change in Rent for
Re-Leases (2)
Avg. Blended Change
in Rent (2)
Atlanta, GA
95.1
%
$
2,317
4.1
%
3.5
%
3.9
%
Charlotte, NC
96.5
%
2,245
4.3
%
5.7
%
4.7
%
Dallas-Fort Worth, TX
95.4
%
2,328
3.9
%
1.8
%
3.3
%
Nashville, TN
96.2
%
2,407
3.8
%
2.5
%
3.4
%
Jacksonville, FL
95.6
%
2,207
3.3
%
1.5
%
2.8
%
Phoenix, AZ
94.9
%
2,169
5.1
%
1.3
%
4.1
%
Indianapolis, IN
96.2
%
1,942
5.3
%
9.2
%
6.3
%
Tampa, FL
94.9
%
2,475
4.1
%
2.4
%
3.7
%
Las Vegas, NV
94.0
%
2,358
4.0
%
1.8
%
3.5
%
Houston, TX
96.0
%
2,099
4.1
%
2.2
%
3.7
%
Raleigh, NC
96.9
%
2,087
3.9
%
3.8
%
3.9
%
Columbus, OH
97.1
%
2,272
5.6
%
7.9
%
6.1
%
Orlando, FL
95.4
%
2,416
3.4
%
2.0
%
3.0
%
Cincinnati, OH
97.7
%
2,217
5.3
%
9.6
%
6.5
%
Salt Lake City, UT
96.4
%
2,510
4.7
%
6.9
%
5.3
%
Charleston, SC
94.0
%
2,359
4.0
%
3.8
%
3.9
%
Greater Chicago area, IL and IN
97.8
%
2,560
6.8
%
13.3
%
7.9
%
San Antonio, TX
94.3
%
1,951
2.6
%
(3.5)
%
1.3
%
Boise, ID
94.9
%
2,294
3.6
%
3.3
%
3.5
%
Savannah/Hilton Head, SC
96.1
%
2,316
5.0
%
4.9
%
5.0
%
All Other (3)
95.4
%
2,318
4.2
%
5.2
%
4.4
%
Total/Average
95.7
%
$
2,282
4.3
%
4.1
%
4.2
%
(1)Property and leasing information based on total single-family properties wholly owned, excluding properties held for sale.
(2)Reflected for the three months ended June 30, 2025.
(3)Represents 16 markets in 15 states.
Refer to “Defined Terms and Non-GAAP Reconciliations” for definitions of metrics and reconciliations to GAAP.
20
AMH
Property Additions
2Q25 Additions
YTD 2Q25 Additions
Market
Number of Properties
Average Total Investment Cost
Number of Properties
Average Total Investment Cost
Tampa, FL
69
$
385,437
124
$
385,632
Atlanta, GA
57
361,446
104
363,143
Las Vegas, NV
56
425,612
133
423,474
Jacksonville, FL
51
378,788
98
373,888
Tucson, AZ
48
378,182
96
375,625
Orlando, FL
47
425,875
89
412,547
Columbus, OH
33
379,166
34
378,314
Phoenix, AZ
30
387,727
48
395,244
Nashville, TN
29
449,303
45
457,484
Charlotte, NC
20
372,442
28
371,791
Charleston, SC
18
377,788
40
388,935
Boise, ID
15
412,999
31
442,216
Seattle, WA
14
562,109
27
556,819
Denver, CO
14
483,716
29
477,382
Savannah/Hilton Head, SC
4
345,835
15
343,837
Cincinnati, OH
1
339,370
2
339,069
Total/Average
506
$
400,200
943
$
400,993
Property Dispositions
Jun 30, 2025 Single-Family Properties Held for Sale
2Q25 Dispositions
YTD 2Q25 Dispositions
Market
Number of Properties
Average Net Proceeds per Property
Number of Properties
Average Net Proceeds per Property
Houston, TX
93
28
$
261,927
55
$
253,510
Atlanta, GA
91
32
299,880
78
308,533
Dallas-Fort Worth, TX
74
35
302,546
90
301,282
Greater Chicago area, IL and IN
72
5
306,518
9
280,453
Raleigh, NC
54
8
338,752
17
339,364
Charlotte, NC
51
13
351,417
28
376,221
Phoenix, AZ
45
29
353,342
63
363,881
Tampa, FL
34
17
341,020
52
340,205
Austin, TX
32
17
265,391
43
271,321
Inland Empire, CA
30
37
443,040
41
438,921
Indianapolis, IN
29
6
307,422
17
273,840
San Antonio, TX
28
17
199,330
30
212,295
Orlando, FL
25
20
333,000
50
325,243
Memphis, TN
25
6
235,723
12
249,980
Tucson, AZ
24
6
269,045
10
267,948
Nashville, TN
24
15
358,119
34
348,151
Jacksonville, FL
20
11
258,996
22
294,477
Las Vegas, NV
18
5
359,743
18
410,326
Oklahoma City, OK
15
6
225,775
6
225,775
Denver, CO
14
6
426,179
11
444,134
All Other (1)
106
51
362,389
100
359,712
Total/Average
904
370
$
325,982
786
$
324,564
(1)Represents 19 markets in 14 states.
Refer to “Defined Terms and Non-GAAP Reconciliations” for definitions of metrics and reconciliations to GAAP.
21
AMH
AMH Development Pipeline Summary as of June 30, 2025 (1)
YTD 2Q25 Deliveries
Jun 30, 2025 Lots for Future Delivery
Market
Number of Properties
Average Total Investment Cost
Average Monthly Rent
Las Vegas, NV
199
$
404,000
$
2,450
680
Phoenix, AZ
177
363,000
2,180
1,446
Tampa, FL
124
386,000
2,710
427
Atlanta, GA
121
370,000
2,490
947
Jacksonville, FL
98
374,000
2,350
356
Orlando, FL
89
413,000
2,610
568
Nashville, TN
88
468,000
2,780
147
Denver, CO
57
520,000
3,210
492
Seattle, WA
57
470,000
3,180
608
Charleston, SC
40
389,000
2,520
851
Charlotte, NC
36
358,000
2,470
327
Columbus, OH
33
379,000
2,670
642
Boise, ID
31
442,000
2,450
245
Salt Lake City, UT
31
473,000
2,940
276
Raleigh, NC
—
—
—
66
Total/Average
1,181
$
404,000
$
2,560
8,078
Lots optioned
887
Total lots owned and optioned
8,965
Estimated Delivery Timing
Dec 31, 2024 Lots for Future Delivery
YTD 2Q25
Net Additions/(Reductions) (3)
YTD 2Q25 Deliveries
Full Year Estimated 2025 Deliveries (1)
Deliveries Thereafter (1)
Wholly-owned development pipeline (2)
9,458
(218)
925
1,800 - 2,000
7,340
Joint venture development pipeline (2)(4)
765
141
256
~400
506
Total development pipeline
10,223
(77)
1,181
2,200 - 2,400
7,846
(1)Reflects the Company’s latest development program results and estimates as of July 31, 2025.
(2)Reflects land pipeline and delivery timeline for projects that are intended either for the Company’s wholly-owned or joint venture portfolios.
(3)Represents the net of lots acquired and optioned and lots transferred to held for sale or disposed during the period.
(4)Represents two unconsolidated joint ventures for each of which the Company holds a 20% interest.
Refer to “Defined Terms and Non-GAAP Reconciliations” for definitions of metrics and reconciliations to GAAP.
22
AMH
Lease Expirations
MTM
3Q25
4Q25
1Q26
2Q26
Thereafter
Lease expirations
2,320
11,957
6,997
17,314
16,396
3,739
Share Repurchase History
(Amounts in thousands, except share and per share data)
Share Repurchases
Period
Common Shares Repurchased
Purchase Price
Avg. Price Paid Per Share
2023
—
$
—
$
—
2024
—
—
—
1Q25
—
—
—
2Q25
—
—
—
Total
—
—
$
—
Remaining authorization:
$
265,067
ATM Share History
(Amounts in thousands, except share and per share data)
ATM Shares Sold Directly
ATM Shares Sold Forward
Period
Common Shares Sold Directly
Gross Proceeds
Avg. Issuance Price Per Share
Common Shares Sold Forward
Future Gross Proceeds
Avg. Price Per Share
Period Settled
Total ATM Gross Proceeds
2023
2,799,683
$
101,958
$
36.42
—
$
—
$
—
$
101,958
2024
932,746
33,756
36.19
2,987,024
110,616
37.03
4Q24
144,372
1Q25
—
—
—
—
—
—
—
2Q25
—
—
—
—
—
—
—
246,330
Remaining authorization:
$
753,670
Refer to “Defined Terms and Non-GAAP Reconciliations” for definitions of metrics and reconciliations to GAAP.
23
AMH
2025 Guidance
Set forth below are the Company’s current expectations with respect to full year 2025 Core FFO attributable to common share and unit holders and our underlying assumptions. In reliance on the exception provided by applicable SEC rules, the Company does not provide guidance for GAAP net income, the most comparable GAAP financial measure, or a reconciliation of 2025 Core FFO guidance to GAAP net income because we are unable to reasonably predict the following items which are included in GAAP net income: (i) gain on sale and impairment of single-family properties and other, net for consolidated properties and unconsolidated real estate joint ventures, (ii) acquisition and other transaction costs and (iii) hurricane-related charges, net. The actual amounts for any and all of these items could significantly impact our 2025 GAAP net income and, as disclosed in our historical financial results, have significantly impacted GAAP net income in prior periods.
Guidance Summary
Full Year 2025
Previous Guidance
Current Guidance
Core FFO attributable to common share and unit holders
$1.80 - $1.86
$1.84 - $1.88
Core FFO attributable to common share and unit holders growth
1.7% - 5.1%
4.0% - 6.2%
Same-Home
Core revenues growth
2.50% - 4.50%
3.00% - 4.50%
Core property operating expenses growth
3.00% - 5.00%
3.00% - 4.50%
Core NOI growth
2.25% - 4.25%
2.75% - 4.75%
Full Year 2025 (Unchanged)
Investment Program
Properties
Investment
Wholly owned acquisitions
—
—
Wholly owned development deliveries
1,800 - 2,000
$700 - $800 million
Development pipeline, pro rata share of JV and Property Enhancing Capex
—
$100 - $200 million
Total capital investment (wholly owned and pro rata JV)
1,800 - 2,000
$0.8 - $1.0 billion
Total gross capital investment (JVs at 100%)
2,200 - 2,400
$1.0 - $1.2 billion
Changes to Full Year 2025 Guidance
•$0.03 incremental Core FFO per share:
◦Primarily driven by increased Core NOI growth from both the Same-Home and Non-Same-Home portfolios from:
▪Better core revenues growth driven by strong year-to-date leasing performance and lower bad debt expense outlook.
◦As well as modestly improved full year financing cost outlook driven by beneficial refinancing execution.
Refer to “Defined Terms and Non-GAAP Reconciliations” for definitions of metrics and reconciliations to GAAP.
24
AMH
Defined Terms and Non-GAAP Reconciliations
(Unaudited)
Average Blended Change in Rent
The percentage change in rent on all non-month-to-month lease renewals and re-leases during the period, compared to the annual rent of the previous expired non-month-to-month comparable long-term lease for each individual property.
Average Change in Rent for Re-Leases
The percentage change in annual rent on properties re-leased during the period, compared to the annual rent of the comparable long-term previous expired lease for each individual property.
Average Change in Rent for Renewals
The percentage change in rent on non-month-to-month comparable long-term lease renewals during the period.
Average Monthly Realized Rent
For the related period, Average Monthly Realized Rent is calculated as the lease component of rents and other single-family property revenues (i.e., rents from single-family properties) divided by the product of (a) number of properties and (b) Average Occupied Days Percentage, divided by the number of months. For properties partially owned during the period, this calculation is adjusted to reflect the number of days of ownership.
Average Occupied Days Percentage
The number of days a property is occupied in the period divided by the total number of days the property is owned during the same period after initially being placed in-service. This calculation excludes properties classified as held for sale except where presented for Total Single-Family Properties Wholly Owned in Core Net Operating Income – Total Portfolio.
Average Total Investment Cost
Reflects on a per property basis, depending on the property addition channel, (i) Estimated Total Investment Cost of traditional channel acquisitions, (ii) purchase price, including closing costs, or total internal development costs of newly constructed homes, or (iii) total purchase price, including historic pro rata investment cost of properties acquired through bulk or joint venture portfolio acquisitions.
Core Net Operating Income (“Core NOI”) and Same-Home Core NOI
Core NOI, which we also present separately for our Same-Home, unencumbered and encumbered portfolios, is a supplemental non-GAAP financial measure that we define as core revenues, which is calculated as rents and other single-family property revenues, excluding expenses reimbursed by tenant charge-backs, less core property operating expenses, which is calculated as property operating and property management expenses, excluding noncash share-based compensation expense and expenses reimbursed by tenant charge-backs.
Core NOI also excludes (1) hurricane-related charges, net, which result in material charges to our single-family property portfolio, (2) gain or loss on early extinguishment of debt, (3) gains and losses from sales or impairments of single-family properties and other, (4) depreciation and amortization, (5) acquisition and other transaction costs incurred with business combinations and the acquisition or disposition of properties as well as nonrecurring items unrelated to ongoing operations, (6) noncash share-based compensation expense, (7) interest expense, (8) general and administrative expense, and (9) other income and expense, net. We believe Core NOI provides useful information to investors about the operating performance of our single-family properties without the impact of certain operating expenses that are reimbursed through tenant charge-backs.
25
AMH
Defined Terms and Non-GAAP Reconciliations (continued)
(Unaudited)
Core NOI and Same-Home Core NOI should be considered only as supplements to net income or loss as a measure of our performance and should not be used as measures of our liquidity, nor are they indicative of funds available to fund our cash needs, including our ability to pay dividends or make distributions. Additionally, these metrics should not be used as substitutes for net income or loss or net cash flows from operating activities (as computed in accordance with GAAP).
Refer to Select Non-GAAP Reconciliations – Core Net Operating Income for reconciliations of core revenues, Same-Home core revenues, core property operating expenses, Same-Home core property operating expenses, Core NOI, Same-Home Core NOI, Unencumbered Core NOI and Encumbered Core NOI to their respective GAAP metrics.
Credit Ratios
We present the following selected metrics because we believe they are helpful as supplemental measures in assessing the Company’s ability to service its financing obligations and in evaluating balance sheet leverage against that of other real estate companies. The tables below reconcile these metrics, which are calculated in part based on several non-GAAP financial measures.
Net Debt and Preferred Shares to Adjusted EBITDAre
(Amounts in thousands)
Jun 30, 2025
Mar 31, 2025
Dec 31, 2024
Sep 30, 2024
Jun 30, 2024
Total Debt
$
5,227,529
$
4,989,015
$
5,075,391
$
4,578,772
$
5,055,355
Less: cash and cash equivalents
(323,258)
(69,698)
(199,413)
(162,477)
(718,380)
Less: restricted cash related to securitizations
(13,188)
(19,122)
(26,588)
(26,273)
(37,112)
Net debt
$
4,891,083
$
4,900,195
$
4,849,390
$
4,390,022
$
4,299,863
Preferred shares at liquidation value
230,000
230,000
230,000
230,000
230,000
Net debt and preferred shares
$
5,121,083
$
5,130,195
$
5,079,390
$
4,620,022
$
4,529,863
Adjusted EBITDAre - TTM
$
982,928
$
963,598
$
942,299
$
919,174
$
896,679
Net Debt and Preferred Shares to Adjusted EBITDAre
5.2 x
5.3 x
5.4 x
5.0 x
5.1 x
Fixed Charge Coverage
(Amounts in thousands)
For the Trailing Twelve Months Ended Jun 30, 2025
Interest expense per income statement
$
179,825
Less: amortization of discounts, loan costs and cash flow hedges
(10,477)
Add: capitalized interest
53,863
Cash interest
223,211
Dividends on preferred shares
13,944
Fixed charges
$
237,155
Adjusted EBITDAre - TTM
$
982,928
Fixed Charge Coverage
4.1 x
Unencumbered Core NOI Percentage
For the Three Months Ended
For the Trailing Twelve Months Ended Jun 30, 2025
(Amounts in thousands)
Sep 30, 2024
Dec 31, 2024
Mar 31, 2025
Jun 30, 2025
Unencumbered Core NOI (1)
$
226,329
$
239,471
$
242,258
$
247,499
$
955,557
Core NOI
242,094
255,561
258,811
264,139
1,020,605
Unencumbered Core NOI Percentage
93.6
%
(1)Unencumbered Core NOI is recast for prior periods to reflect the unencumbered portfolio as of the end of the quarter subsequent to securitization payoffs.
26
AMH
Defined Terms and Non-GAAP Reconciliations (continued)
EBITDA is defined as earnings before interest, taxes, depreciation and amortization. EBITDA is a non-GAAP financial measure and is used by us and others as a supplemental measure of performance. EBITDAre is a supplemental non-GAAP financial measure, which we calculate in accordance with the definition approved by the National Association of Real Estate Investment Trusts (“NAREIT”) by adjusting EBITDA for gains and losses from sales or impairments of single-family properties and adjusting for unconsolidated real estate joint ventures on the same basis. Adjusted EBITDAre is a supplemental non-GAAP financial measure calculated by adjusting EBITDAre for (1) acquisition and other transaction costs incurred with business combinations and the acquisition or disposition of properties as well as nonrecurring items unrelated to ongoing operations and adjustments for investments in proptech venture capital funds related to the pro rata equity pickup of realized and unrealized gains and losses from their portfolio investments, (2) noncash share-based compensation expense, (3) hurricane-related charges, net, which result in material charges to our single-family property portfolio and (4) gain or loss on early extinguishment of debt. Fully Adjusted EBITDAre is a supplemental non-GAAP financial measure calculated by adjusting Adjusted EBITDAre for (1) Recurring Capital Expenditures and (2) leasing costs. Adjusted EBITDAre Margin is a supplemental non-GAAP financial measure calculated as Adjusted EBITDAre divided by rents and other single-family property revenues, net of tenant charge-backs and adjusted for income from unconsolidated joint ventures. Fully Adjusted EBITDAre Margin is a supplemental non-GAAP financial measure calculated as Fully Adjusted EBITDAre divided by rents and other single-family property revenues, net of tenant charge-backs and adjusted for income from unconsolidated joint ventures. We believe these metrics provide useful information to investors because they exclude the impact of various income and expense items that are not indicative of operating performance.
27
AMH
Defined Terms and Non-GAAP Reconciliations (continued)
(Unaudited)
The following is a reconciliation of net income, as determined in accordance with GAAP, to EBITDA, EBITDAre, Adjusted EBITDAre, Fully Adjusted EBITDAre, Adjusted EBITDAre Margin and Fully Adjusted EBITDAre Margin for the three and six months ended June 30, 2025 and 2024 (amounts in thousands):
For the Three Months Ended Jun 30,
For the Six Months Ended Jun 30,
2025
2024
2025
2024
Net income
$
123,624
$
108,534
$
252,337
$
236,629
Interest expense
46,303
38,678
91,729
77,255
Depreciation and amortization
126,939
117,603
251,867
233,329
EBITDA
$
296,866
$
264,815
$
595,933
$
547,213
Gain on sale and impairment of single-family properties and other, net
(51,908)
(43,892)
(113,924)
(112,793)
Adjustments for unconsolidated real estate joint ventures
1,821
1,196
3,305
2,793
EBITDAre
$
246,779
$
222,119
$
485,314
$
437,213
Noncash share-based compensation - general and administrative
Adjustments for unconsolidated joint ventures - income
3,576
3,642
7,164
6,640
Rents and other single-family property revenues, net of tenant charge-backs and adjustments for unconsolidated joint ventures
$
408,622
$
379,765
$
807,625
$
748,981
Adjusted EBITDAre Margin
62.0
%
61.6
%
62.2
%
61.6
%
Fully Adjusted EBITDAre Margin
56.7
%
55.7
%
57.3
%
56.7
%
28
AMH
Defined Terms and Non-GAAP Reconciliations (continued)
(Unaudited)
The following is a reconciliation of net income, as determined in accordance with GAAP, to EBITDA, EBITDAre and Adjusted EBITDAre for the following trailing twelve month periods (amounts in thousands):
For the Trailing Twelve Months Ended
Jun 30, 2025
Mar 31, 2025
Dec 31, 2024
Sep 30, 2024
Jun 30, 2024
Net income
$
483,850
$
468,760
$
468,142
$
415,206
$
415,658
Interest expense
179,825
172,200
165,351
155,957
146,727
Depreciation and amortization
495,548
486,212
477,010
468,791
463,963
EBITDA
$
1,159,223
$
1,127,172
$
1,110,503
$
1,039,954
$
1,026,348
Gain on sale and impairment of single-family properties and other, net
(226,887)
(218,871)
(225,756)
(174,572)
(175,210)
Adjustments for unconsolidated real estate joint ventures
5,234
4,609
4,722
5,240
4,936
EBITDAre
$
937,570
$
912,910
$
889,469
$
870,622
$
856,074
Noncash share-based compensation - general and administrative
Represents the sum of purchase price, closing costs and if applicable, estimated initial renovation costs for homes purchased through traditional broker and trustee channels.
FFO / Core FFO / Adjusted FFO attributable to common share and unit holders
FFO attributable to common share and unit holders is a non-GAAP financial measure that we calculate in accordance with the definition approved by NAREIT, which defines FFO as net income or loss calculated in accordance with GAAP, excluding gains and losses from sales or impairment of real estate, plus real estate-related depreciation and amortization (excluding amortization of deferred financing costs and depreciation of non-real estate assets), and after adjustments for unconsolidated real estate joint ventures to reflect FFO on the same basis.
Core FFO attributable to common share and unit holders is a non-GAAP financial measure that we use as a supplemental measure of our performance. We compute this metric by adjusting FFO attributable to common share and unit holders for (1) acquisition and other transaction costs incurred with business combinations and the acquisition or disposition of properties as well as nonrecurring items unrelated to ongoing operations and adjustments for investments in proptech venture capital funds related to the pro rata equity pickup of realized and unrealized gains and losses from their portfolio investments, (2) noncash share-based compensation expense, (3) hurricane-related charges, net, which result in material charges to our single-family property portfolio, (4) gain or loss on early extinguishment of debt and (5) the allocation of income to our perpetual preferred shares in connection with their redemption.
29
AMH
Defined Terms and Non-GAAP Reconciliations (continued)
(Unaudited)
Adjusted FFO attributable to common share and unit holders is a non-GAAP financial measure that we use as a supplemental measure of our performance. We compute this metric by adjusting Core FFO attributable to common share and unit holders for (1) Recurring Capital Expenditures that are necessary to help preserve the value and maintain functionality of our properties and (2) capitalized leasing costs incurred during the period. As a portion of our homes are recently developed, acquired and/or renovated, we estimate Recurring Capital Expenditures for our entire portfolio by multiplying (a) current period actual Recurring Capital Expenditures per Same-Home Property by (b) our total number of properties, excluding newly acquired non-stabilized properties and properties classified as held for sale.
We present FFO attributable to common share and unit holders, as well as on a per FFO share and unit basis, because we consider this metric to be an important measure of the performance of real estate companies, as do many investors and analysts in evaluating the Company. We believe that FFO attributable to common share and unit holders provides useful information to investors because this metric excludes depreciation, which is included in computing net income and assumes the value of real estate diminishes predictably over time. We believe that real estate values fluctuate due to market conditions and in response to inflation. We also believe that Core FFO and Adjusted FFO attributable to common share and unit holders, as well as on a per FFO share and unit basis, provide useful information to investors because they allow investors to compare our operating performance to prior reporting periods without the effect of certain items that, by nature, are not comparable from period to period.
FFO, Core FFO and Adjusted FFO attributable to common share and unit holders are not a substitute for net income or net cash provided by operating activities, each as determined in accordance with GAAP, as a measure of our operating performance, liquidity or ability to pay dividends. These metrics also are not necessarily indicative of cash available to fund future cash needs. Because other REITs may not compute these measures in the same manner, they may not be comparable among REITs.
Refer to Funds from Operations for a reconciliation of these metrics to net income attributable to common shareholders, determined in accordance with GAAP.
The following are reconciliations of property management expenses and general administrative expense, as determined in accordance with GAAP, to property management expenses, net of tenant charge-backs and excluding noncash share-based compensation expense, and general and administrative expense, excluding noncash share-based compensation expense, as included in Core FFO attributable to common share and unit holders (amounts in thousands):
Less: noncash share-based compensation - general and administrative
(3,987)
(7,559)
(8,854)
(14,398)
General and administrative expense, net
$
16,021
$
14,134
$
30,825
$
29,180
30
AMH
Defined Terms and Non-GAAP Reconciliations (continued)
(Unaudited)
The following is a reconciliation of net income per common share–diluted to FFO attributable to common share and unit holders, Core FFO attributable to common share and unit holders and Adjusted FFO attributable to common share and unit holders on a per share and unit basis for the three and six months ended June 30, 2025 and 2024:
For the Three Months Ended Jun 30,
For the Six Months Ended Jun 30,
2025
2024
2025
2024
Net income per common share–diluted
$
0.28
$
0.25
$
0.58
$
0.55
Adjustments:
Conversion from GAAP share count
(0.03)
(0.03)
(0.07)
(0.07)
Noncontrolling interests in the Operating Partnership
0.03
0.03
0.07
0.07
Gain on sale and impairment of single-family properties and other, net
(0.12)
(0.10)
(0.27)
(0.27)
Adjustments for unconsolidated real estate joint ventures
—
—
0.01
0.01
Depreciation and amortization
0.30
0.28
0.60
0.55
Less: depreciation and amortization of non-real estate assets
(0.01)
(0.01)
(0.03)
(0.02)
FFO attributable to common share and unit holders
$
0.45
$
0.42
$
0.89
$
0.82
Adjustments:
Acquisition, other transaction costs and other
—
0.01
0.01
0.01
Noncash share-based compensation - general and administrative
Core FFO attributable to common share and unit holders
$
0.47
$
0.45
$
0.93
$
0.88
Recurring Capital Expenditures
(0.04)
(0.06)
(0.08)
(0.09)
Leasing costs
(0.01)
—
(0.01)
—
Adjusted FFO attributable to common share and unit holders
$
0.42
$
0.39
$
0.84
$
0.79
FFO Shares and Units
Includes weighted-average common shares and operating partnership units outstanding, as well as potentially dilutive securities.
Occupied Property
A property is classified as occupied upon commencement (i.e., start date) of a lease agreement, which can occur contemporaneously with or subsequent to execution (i.e., signature).
Property Enhancing Capex
Includes elective capital expenditures to enhance the operating profile of a property, such as investments to increase future revenues or reduce maintenance expenditures.
Recurring Capital Expenditures
For our Same-Home portfolio, Recurring Capital Expenditures includes replacement costs and other capital expenditures recorded during the period that are necessary to help preserve the value and maintain functionality of our properties. For our total portfolio, we calculate Recurring Capital Expenditures by multiplying (a) current period actual Recurring Capital Expenditures per Same-Home property by (b) our total number of properties, excluding newly acquired non-stabilized properties and properties classified as held for sale.
31
AMH
Defined Terms and Non-GAAP Reconciliations (continued)
(Unaudited)
Retained Cash Flow
Retained Cash Flow is a non-GAAP financial measure that we believe is helpful as a supplemental measure in assessing the Company’s liquidity. This metric is computed by reducing Adjusted FFO attributable to common share and unit holders by common distributions.
Refer to Funds from Operations for a reconciliation of Adjusted FFO attributable to common share and unit holders to net income attributable to common shareholders, determined in accordance with GAAP. The following is a reconciliation of Adjusted FFO attributable to common share and unit holders to Retained Cash Flow (amounts in thousands):
For the Three Months Ended Jun 30, 2025
Adjusted FFO attributable to common share and unit holders
$
176,435
Common distributions
(127,152)
Retained Cash Flow
$
49,283
Same-Home Property
A property is classified as Same-Home if it has been stabilized longer than 90 days prior to the beginning of the earliest period presented under comparison. A property is removed from Same-Home if it has been classified as held for sale or has experienced a casualty loss.
Stabilized Property
A property acquired individually (i.e., not through a bulk purchase) is classified as stabilized once it has been renovated by the Company or newly constructed and then initially leased or available for rent for a period greater than 90 days. Properties acquired through a bulk purchase are first considered non-stabilized, as an entire group, until (1) we have owned them for an adequate period of time to allow for complete on-boarding to our operating platform, and (2) a substantial portion of the properties have experienced tenant turnover at least once under our ownership, providing the opportunity for renovations and improvements to meet our property standards. After such time has passed, properties acquired through a bulk purchase are then evaluated on an individual property basis under our standard stabilization criteria.
Total Capitalization
Includes the market value of all outstanding common shares and operating partnership units (based on the NYSE AMH Class A common share closing price as of period end), the current liquidation value of preferred shares as of period end and Total Debt.
Total Debt
Includes principal balances on asset-backed securitizations, unsecured senior notes and borrowings outstanding under our revolving credit facility as of period end, and excludes unamortized discounts and unamortized deferred financing costs.
Turnover Rate
The number of tenant move-outs during the period divided by the total number of properties.
32
AMH
Defined Terms and Non-GAAP Reconciliations (continued)
Debt covenant compliance ratios for the unsecured senior notes show the Company’s compliance with selected covenants provided in the Indenture dated as of February 7, 2018, as supplemented by the First Supplemental Indenture dated as of February 7, 2018 for the 2028 Unsecured Senior Notes, the Second Supplemental Indenture dated as of January 23, 2019 for the 2029 Unsecured Senior Notes, the Third Supplemental Indenture dated as of July 8, 2021 for the 2031 Unsecured Senior Notes, the Fourth Supplemental Indenture dated as of July 8, 2021 for the 2051 Unsecured Senior Notes, the Fifth Supplemental Indenture dated as of April 7, 2022 for the 2032 Unsecured Senior Notes, the Sixth Supplemental Indenture dated as of April 7, 2022 for the 2052 Unsecured Senior Notes, the Seventh Supplemental Indenture dated as of January 30, 2024 for the 2034 Unsecured Senior Notes I, the Eighth Supplemental Indenture dated as of June 26, 2024 for the 2034 Unsecured Senior Notes II, the Ninth Supplemental Indenture dated as of December 9, 2024 for the 2035 Unsecured Senior Notes, and the Tenth Supplemental Indenture dated as of May 13, 2025 for the 2030 Unsecured Senior Notes, which have been filed as exhibits to the Company’s SEC reports. The ratios for the Unsecured Credit Facility covenants show the Company’s compliance with selected covenants provided in the Credit Agreement dated as of July 16, 2024, as amended by Amendment No. 1 to Credit Agreement dated as of May 6, 2025, which have been filed as exhibits to the Company’s SEC reports.
The debt covenant compliance ratios are provided only to show the Company’s compliance with certain covenants contained in the Indenture governing its unsecured debt securities and in the Credit Agreement, as of the date reported. These ratios should not be used for any other purpose, including without limitation to evaluate the Company’s financial condition or results of operations, nor do they indicate the Company’s covenant compliance as of any other date or for any other period. The capitalized terms in the disclosure are defined in the Indenture or the Credit Agreement, and may differ materially from similar terms used elsewhere in this document and used by other companies that present information about their covenant compliance. For risks related to failure to comply with these covenants, see “Risk Factors – Risks Related to Our Business” and other risks discussed in the Company’s Annual Report on Form 10-K for the year ended December 31, 2024, and in the Company’s subsequent filings with the SEC.
33
Executive Management
Bryan Smith
Sara Vogt-Lowell
Chief Executive Officer
Chief Administrative Officer, Chief Legal Officer and Secretary
Chris Lau
Chief Financial Officer and Senior Executive Vice President