Page | 1 |  |
SECURITIES AND EXCHANGE COMMISSION
Washington, D.C. 20549
FORM 6-K
Report of Foreign Private Issuer
Pursuant to Rule 13a-16 or 15d-16 of the
Securities Exchange Act of 1934
For the month of October, 2026
Commission File Number 1565025
AMBEV S.A.
(Exact name of registrant as specified in its charter)
AMBEV S.A.
(Translation of Registrant's name into English)
Rua Dr. Renato Paes de Barros, 1017 - 3rd
Floor
04530-000 São Paulo, SP
Federative Republic of Brazil
(Address of principal executive office)
Indicate by check mark whether the registrant files or will file annual reports under cover Form 20-F or Form 40-F.
Form 20-F ___X___ Form 40-F _______
Indicate by check mark whether the registrant by furnishing the information contained in this Form is also thereby furnishing the information to the Commission pursuant to Rule 12g3-2(b) under the Securities Exchange Act of 1934.
Yes _______ No ___X____
Page | 1 | |
|
AMBEV REPORTS 2026 THIRD QUARTER RESULTS[1]
“The third quarter built on the progress we achieved in the first half of the year, with the consistent execution of our strategy delivering growth in volumes, net revenue and Normalized EBITDA, alongside margin expansion” – Carlos Lisboa, CEO
| |
| Total Volume (organic) | Net Revenue (organic) |
+0.8% vs LY |
+7.6% vs LY |
| Consolidated volumes increased 0.8% in 3Q26. Volume performance was driven by growth in Brazil NAB (+3.6%), Central America and the Caribbean (“CAC”) (+2.3%) and Brazil Beer (+0.5%), more than offsetting declines in Canada (-1.0%) and Latin America South (“LAS”) (-1.4%). | Top line increased by 7.6%, driven by net revenue per hectoliter (“NR/hl”) growth of 6.8% and our volume performance. Net revenue grew in all our business units: LAS[2] (+21.4%), CAC (+8.1%), Brazil NAB (+6.3%), Brazil Beer (+4.8%) and Canada (+1.2%). |
| Normalized EBITDA (organic) | Normalized Net Profit |
| +8.9% vs LY | R$ 4,393.6 million |
| Normalized EBITDA grew by 8.9%, with all our business units delivering Normalized EBITDA growth. Normalized EBITDA margin increased by 40 bps, to 33.7%, supported by disciplined resource allocation. | Normalized Profit increased by 14.3% compared to R$ 3,843.1 million in 3Q25, mainly driven by EBITDA growth and lower net financial expenses, partially offset by higher income tax expenses. Normalized earnings per share (“EPS”) was R$ 0.28, increasing by 15.4%. |
| Cash flow from operating activities | Capital Allocation |
| R$ 7,677.9 million | 190 million shares buyback program |
| Cash flow from operating activities increased 11.0% compared to R$ 6,919.0 million in 3Q25, mainly driven by Normalized EBITDA growth and improved working capital dynamics. | Our Board of Directors has approved a share buyback program for the repurchase of up to 190,000,000 shares (which correspond to R$ 2.9 billion, based on the closing share price of October 28th, 2026) to be executed within the next 18 months. For further details please see the Share Buyback Program section on page 18. |
[1] The following operating and financial information, unless otherwise indicated, is presented in nominal Brazilian Reais and prepared according to the International Financial Reporting Standards (“IFRS”) issued by the International Accounting Standards Board (“IASB”) and to the accounting practices issued by the Brazilian Accounting Standards Committee ("CPC”) and approved by the Brazilian Securities and Exchange Commission (“CVM”). The information herein should be read together with our financial information for the nine-month period ended September 30, 2026, filed with the CVM and submitted to the U.S. Securities and Exchange Commission (“SEC”).
[2] The impacts resulting from applying Hyperinflation Accounting for our Argentinean subsidiaries, in accordance with IAS 29, are detailed in the section Financial Reporting in Hyperinflationary Economies - Argentina. For FY26, the definition of organic revenue growth has been amended to cap the price growth in Argentina to a maximum of 2% per month (26.8% year-over-year). Corresponding adjustments are made to all income statement related items in the organic growth calculations through scope changes when the cap is triggered. Further details on the cap methodology are available on page 15.
ambev.com.br | Press Release – October 29, 2026 |
Page | 2 | |
MANAGEMENT COMMENTS
The first nine months of 2026 reflect the continued strengthening of our business. Total volumes grew 0.7%, with beer volumes growing at more than twice that pace, while net revenue increased 7.3% and Normalized EBITDA grew 9.3%, with 60 bps of margin expansion.
In the third quarter, our consolidated volumes grew 0.8%, with both beer and soft drinks delivering positive volume performance. Disciplined revenue management and efficient resource allocation supported net revenue growth of 7.6%, Normalized EBITDA growth of 8.9% and Normalized EBITDA margin expansion of 40 bps, even as we stepped up investments behind both our brands and commercial priorities.
This quarter further demonstrates how our portfolio, our digital ecosystem and our operating capabilities are reinforcing one another to support sustainable profitable growth over time.
| · | Lead and grow the category |
Our broad and complementary portfolio is a key driver of our performance. In the quarter, premium brands delivered mid-teens volume growth, Balanced Choices grew by low nineties and no-alcohol beer by low thirties, while mainstream[3] volumes declined by a low-single digit. We estimate to have gained market share in several of our markets.
Michelob Ultra and Stella Pure Gold are good examples of how we are scaling, across our footprint, relevant propositions that connect with consumers seeking a more balanced lifestyle. In the quarter, combined volumes for these two brands grew triple digits, and we have also expanded Stella Artois Pure Gold, a product developed in Brazil, into additional markets in LAS, further demonstrating our ability to launch successful innovations across our footprint.
We remain focused on broadening the relevance of beer by serving a wider range of occasions and consumers. The expansion of premium, Balanced Choices, no-alcohol and beyond beer reinforces our confidence in the long-term opportunity to grow the category through innovation and consumer-led portfolio development.
In the quarter, consolidated NR/hl excluding marketplace grew by 7.2%, with our revenue management initiatives and mix placing NR/hl ahead of estimated consolidated inflation (CPI - Consumer Price Index).
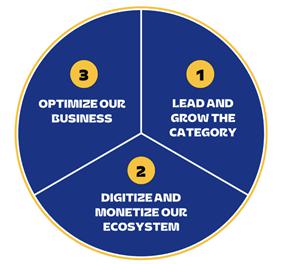 |
· Digitize and monetize our ecosystem BEES and Zé Delivery are at the center of our digital ecosystem, deepening our connection with customers and consumers, while creating new opportunities for growth and value creation across our footprint. BEES has become the backbone of our commercial capabilities, helping make our core business stronger. Through data-driven insights, the platform helps us improve commercial execution, strengthen sell-out activation, sharpen portfolio recommendations and increase the availability of the adequate brands and SKUs across our customer base. |
At the same time, BEES unlocks new growth opportunities. By expanding access to a broader assortment of products and services through BEES Marketplace, we increase the value proposition for customers, while expanding our total addressable market. BEES Marketplace Gross Merchandise Value (GMV) grew approximately 57% in the quarter, supported mainly by the continued expansion of third-party partnerships (“3P”).
[3] Mainstream segment comprises core plus, core and value segments.
ambev.com.br | Press Release – October 29, 2026 |
Page | 3 | |
On the Direct-to-Consumer (“DTC”) side, Zé Delivery further strengthens our direct connection with consumers, providing valuable insights into evolving consumer preferences, consumption behaviors and occasions. By maintaining a direct relationship with a large base of young adult consumers, the platform gives us a unique window into how demand is evolving, helping us identify trends, test new propositions and accelerate learning across our business, while increasing the relevance of our brands and portfolio.
In 3Q26, premium brands represented approximately mid-thirties as a percentage of total beer volumes on the platform, while Balanced Choices reached high-single digit, remaining well ahead of their respective share in our overall beer portfolio.
At the same time, Zé Delivery unlocks growth opportunities beyond our core beer business. By expanding the product assortment available through the platform, we are increasing the categories and occasions we can serve consumers, while enhancing the value proposition for them. Zé GMV grew approximately 16% in the quarter, supported by a 12% increase in monthly buyers, while Zé Marketplace GMV already represents nearly 20% of the total platform GMV.
| · | Optimize our business |
Through disciplined revenue management, productivity initiatives and efficient resource allocation, we enhance our business while creating the flexibility to invest behind our strategic priorities.
Cash COGS/hl excluding marketplace increased by 6.5% in the quarter, while gross margin expanded 60 bps, reflecting productivity and operational efficiency initiatives that helped mitigate cost pressures across several of our markets. As it relates to our FY26 guidance for Brazil Beer Cash COGS/hl, excluding the sale of non-Ambev products on the marketplace, it remains unchanged, expected to increase between 4.5% and 7.5%.
Cash SG&A increased by 7.6%, impacted mainly by incremental sales and marketing investments and higher distribution expenses.
Normalized EBITDA increased by 8.9% and Normalized EBITDA margin reached 33.7%, supported by Normalized EBITDA growth across all business units. Normalized EPS increased by 15.4% in the quarter, to R$ 0.28, mainly driven by Normalized EBITDA growth and improved net financial expenses, which together more than offset higher income tax expenses in the period.
Cash flow from operating activities was a highlight in the quarter and totaled approximately R$ 7.7 billion, increasing by around R$759 million year-on-year, mainly due to Normalized EBITDA growth and improved working capital dynamics.
Our solid cash flow generation and disciplined capital allocation continue to support our shareholder return agenda. On October 28th, 2026, our Board of Directors approved a new Share Buyback Program for the repurchase of up to 190,000,000 common shares issued by the Company (for further details, refer to section Share Buyback Program on page 18).
Our progress during the quarter also extended to sustainability. Ambev was upgraded from AA to AAA by MSCI ESG Ratings, a recognition of advancements in sustainability practices across our businesses.
Despite the dynamic environment, our focus remains on the factors within our control, supported by consistent execution and disciplined resource allocation. Consistent with our risk management policy, we have already hedged our BRL/USD exposure for the full year of 2027.
ambev.com.br | Press Release – October 29, 2026 |
Page | 4 | |
| Financial highlights - Ambev consolidated | ||||||||||||||
| R$ million | 3Q25 | 3Q26 | % As Reported |
% Organic |
YTD25 | YTD26 | % As Reported |
% Organic | ||||||
| Volume ('000 hl) | 42,419.2 | 42,385.0 | -0.1% | 0.8% | 127,306.2 | 127,080.9 | -0.2% | 0.7% | ||||||
| Net revenue | 20,847.3 | 21,594.6 | 3.6% | 7.6% | 63,434.8 | 64,208.0 | 1.2% | 7.3% | ||||||
| Gross profit | 10,727.3 | 11,006.3 | 2.6% | 8.9% | 32,323.0 | 33,037.6 | 2.2% | 9.2% | ||||||
| % Gross margin | 51.5% | 51.0% | -50 bps | 60 bps | 51.0% | 51.5% | 50 bps | 90 bps | ||||||
| Normalized EBITDA | 7,059.1 | 7,270.9 | 3.0% | 8.9% | 20,656.5 | 21,202.5 | 2.6% | 9.3% | ||||||
| % Normalized EBITDA margin | 33.9% | 33.7% | -20 bps | 40 bps | 32.6% | 33.0% | 40 bps | 60 bps | ||||||
| Profit | 4,863.7 | 4,366.3 | -10.2% | 11,458.9 | 11,726.6 | 2.3% | ||||||||
| Normalized profit | 3,843.1 | 4,393.6 | 14.3% | 10,496.0 | 11,718.7 | 11.6% | ||||||||
| EPS (R$/shares) | 0.30 | 0.28 | -9.5% | 0.71 | 0.73 | 2.9% | ||||||||
| Normalized EPS (R$/shares) | 0.24 | 0.28 | 15.4% | 0.65 | 0.73 | 12.3% | ||||||||
ambev.com.br | Press Release – October 29, 2026 |
Page | 5 | |
KEY MARKETS PERFORMANCES
Brazil Beer: Commercial momentum, in an improved industry, drove top- and bottom-line growth
| · | Operating performance[4]: |
| o | 3Q26: Our volumes grew 0.5% in 3Q26. The beer industry continued its sequential recovery and grew approximately 4% in the period, according to Nielsen, supported by the FIFA World Cup, despite persistent pressures on disposable income and mixed weather. Taking into consideration the timing and the impact of the FIFA World Cup, and combining both 2Q26 and 3Q26 data, the industry grew 1.3%, with our volumes outperforming (+2.7%), mainly reflecting sequential market share gains, according to Nielsen. NR/hl excluding marketplace increased by 4.8% in the quarter, mainly driven by revenue management and portfolio mix. Cash COGS/hl excluding marketplace rose 5.4%, primarily driven by commodities headwinds and portfolio mix. Cash SG&A grew by 9.2%, mainly reflecting incremental Sales & Marketing investments and distribution expenses. Normalized EBITDA increased by 1.0%, with gross and Normalized EBITDA margins contracting 10 bps and 130 bps, respectively. |
| o | YTD26: Our volumes grew 2.1%, outperforming a still slightly negative industry, mainly due to low-single digit market share gains, according to Nielsen. Net revenue grew 7.8% (volumes +2.1% and NR/hl +5.5%). Normalized EBITDA grew by 6.9%, with gross and Normalized EBITDA margins both contracting by 30 bps. |
| · | Commercial highlights: Incremental investments behind our brands, innovation and mega platforms have strengthened our portfolio brand equity and drove market share gains in the quarter, both sequentially and versus last year, according to Nielsen. Our premium portfolio delivered high-teens volume growth, while Balanced Choices more than doubled volumes in the period, with Stella Pure Gold nearly tripling volumes, Michelob Ultra growing more than five-fold, and no-alcohol beer growing in the forties. Mainstream volumes declined by mid-single digit. Our Beyond Beer portfolio grew by mid-twenties, with growth in portfolio brand equity in the period driving market share gains, according to Nielsen. As for our digital initiatives, BEES Marketplace GMV grew 83% in the quarter, driven by the continued 3P expansion. |
| Brazil Beer | |||||||
| R$ million | 3Q25 | Scope | Currency Translation | Organic Growth | 3Q26 | % As Reported | % Organic |
| Volume ('000 hl) | 21,556.8 | - | 116.6 | 21,673.4 | 0.5% | 0.5% | |
| Net revenue | 9,677.2 | - | - | 461.7 | 10,138.9 | 4.8% | 4.8% |
| Net revenue/hl (R$) | 448.9 | - | - | 18.9 | 467.8 | 4.2% | 4.2% |
| COGS | (4,749.7) | - | - | (242.1) | (4,991.8) | 5.1% | 5.1% |
| COGS/hl (R$) | (220.3) | - | - | (10.0) | (230.3) | 4.5% | 4.5% |
| COGS excl. deprec. & amort. | (4,293.9) | - | - | (176.7) | (4,470.6) | 4.1% | 4.1% |
| COGS/hl excl. deprec. & amort. (R$) | (199.2) | - | - | (7.1) | (206.3) | 3.6% | 3.6% |
| Gross profit | 4,927.5 | - | - | 219.6 | 5,147.2 | 4.5% | 4.5% |
| % Gross margin | 50.9% | 50.8% | -10 bps | -10 bps | |||
| SG&A excl. deprec. & amort. | (2,456.2) | - | - | (226.1) | (2,682.3) | 9.2% | 9.2% |
| SG&A deprec. & amort. | (455.8) | - | - | 1.8 | (454.1) | -0.4% | -0.4% |
| SG&A total | (2,912.0) | - | - | (224.3) | (3,136.4) | 7.7% | 7.7% |
| Other operating income/(expenses) | 467.1 | 113.7 | - | (24.2) | 556.5 | 19.1% | -5.2% |
| Normalized Operating Profit | 2,482.6 | 113.7 | - | (29.0) | 2,567.3 | 3.4% | -1.2% |
| % Normalized Operating margin | 25.7% | 25.3% | -40 bps | -150 bps | |||
| Normalized EBITDA | 3,394.3 | 113.7 | - | 34.6 | 3,542.6 | 4.4% | 1.0% |
| % Normalized EBITDA margin | 35.1% | 34.9% | -20 bps | -130 bps |
[4] In 3Q26, net revenue per hectoliter and Cash COGS per hectoliter, excluding the sale of non-Ambev marketplace products, were R$ 454.7 (4.8% organic growth) and R$ (196.8) (5.4% organic growth), respectively. In YTD26, net revenue per hectoliter and Cash COGS per hectoliter, excluding the sale of non-Ambev marketplace products, were R$ 453.5 (5.8% organic growth) and R$ (196.2) (8.3% organic growth), respectively. The scope change in Brazil Beer refers to tax credits and related effects.
ambev.com.br | Press Release – October 29, 2026 |
Page | 6 | |
| Brazil Beer | |||||||
| R$ million | YTD25 | Scope | Currency Translation | Organic Growth | YTD26 | % As Reported | % Organic |
| Volume ('000 hl) | 64,757.8 | - | 1,380.3 | 66,138.1 | 2.1% | 2.1% | |
| Net revenue | 28,667.6 | - | - | 2,222.4 | 30,890.0 | 7.8% | 7.8% |
| Net revenue/hl (R$) | 442.7 | - | - | 24.4 | 467.1 | 5.5% | 5.5% |
| COGS | (13,870.5) | - | - | (1,168.2) | (15,038.7) | 8.4% | 8.4% |
| COGS/hl (R$) | (214.2) | - | - | (13.2) | (227.4) | 6.2% | 6.2% |
| COGS excl. deprec. & amort. | (12,489.7) | - | - | (1,145.9) | (13,635.6) | 9.2% | 9.2% |
| COGS/hl excl. deprec. & amort. (R$) | (192.9) | - | - | (13.3) | (206.2) | 6.9% | 6.9% |
| Gross profit | 14,797.1 | - | - | 1,054.2 | 15,851.3 | 7.1% | 7.1% |
| % Gross margin | 51.6% | 51.3% | -30 bps | -30 bps | |||
| SG&A excl. deprec. & amort. | (7,670.7) | - | - | (598.0) | (8,268.7) | 7.8% | 7.8% |
| SG&A deprec. & amort. | (1,384.7) | - | - | (31.3) | (1,416.0) | 2.3% | 2.3% |
| SG&A total | (9,055.3) | - | - | (629.3) | (9,684.7) | 6.9% | 6.9% |
| Other operating income/(expenses) | 1,387.7 | 102.2 | - | 195.5 | 1,685.4 | 21.5% | 14.8% |
| Normalized Operating Profit | 7,129.5 | 102.2 | - | 620.4 | 7,852.1 | 10.1% | 8.8% |
| % Normalized Operating margin | 24.9% | 25.4% | 50 bps | 30 bps | |||
| Normalized EBITDA | 9,894.9 | 102.2 | - | 674.0 | 10,671.1 | 7.8% | 6.9% |
| % Normalized EBITDA margin | 34.5% | 34.5% | 0 bps | -30 bps |
ambev.com.br | Press Release – October 29, 2026 |
Page | 7 | |
Brazil NAB: Volumes back to growth, estimated to be in line with industry performance, driving top- and bottom-line increase
| · | Operating performance[5]: |
| o | 3Q26: Volumes increased by 3.6%, with sequential market share recovery, in a growing industry, despite the exit from a lower return channel since 2Q26. Net revenue grew by 6.3%, with NR/hl up 2.6%, primarily reflecting our revenue management strategy for the year and favorable brand mix. Cash COGS/hl increased by 3.4%, below inflation, mainly supported by more positive dynamics in sugar and PET. Cash SG&A increased by 5.4%, mainly driven by increased distribution expenses. Normalized EBITDA increased by 2.6%, with gross margin and Normalized EBITDA margin contracting by 40 bps and 100 bps, respectively. |
| o | YTD26: Net revenue grew by 3.1% (volumes -1.7% and NR/hl +4.9%), and Normalized EBITDA was up 11.0%, with gross margin and Normalized EBITDA margin expanding 310 bps and 200 bps, respectively. |
| · | Commercial highlights: Our commercial foundations continued to sequentially improve, with market share reaching same level as last year, according to our estimates, as price relativity remained at historical levels. Our main brands continued to operate with brand equity ahead of market share, while our non-sugar portfolio grew double digit, supported by Guaraná and the PepsiCo family. |
| Brazil NAB | |||||||
| R$ million | 3Q25 | Scope | Currency Translation | Organic Growth | 3Q26 | % As Reported | % Organic |
| Volume ('000 hl) | 7,760.2 | - | 280.4 | 8,040.6 | 3.6% | 3.6% | |
| Net revenue | 2,083.1 | - | - | 130.7 | 2,213.8 | 6.3% | 6.3% |
| Net revenue/hl (R$) | 268.4 | - | - | 6.9 | 275.3 | 2.6% | 2.6% |
| COGS | (1,151.1) | - | - | (81.4) | (1,232.5) | 7.1% | 7.1% |
| COGS/hl (R$) | (148.3) | - | - | (5.0) | (153.3) | 3.3% | 3.3% |
| COGS excl. deprec. & amort. | (1,113.9) | - | - | (79.3) | (1,193.2) | 7.1% | 7.1% |
| COGS/hl excl. deprec. & amort. (R$) | (143.5) | - | - | (4.9) | (148.4) | 3.4% | 3.4% |
| Gross profit | 932.0 | - | - | 49.3 | 981.3 | 5.3% | 5.3% |
| % Gross margin | 44.7% | 44.3% | -40 bps | -40 bps | |||
| SG&A excl. deprec. & amort. | (480.6) | - | - | (25.8) | (506.4) | 5.4% | 5.4% |
| SG&A deprec. & amort. | (63.2) | - | - | 25.3 | (37.9) | -40.0% | -40.0% |
| SG&A total | (543.8) | - | - | (0.5) | (544.3) | 0.1% | 0.1% |
| Other operating income/(expenses) | 98.8 | 20.6 | - | (10.7) | 108.7 | 10.1% | -10.8% |
| Normalized Operating Profit | 487.0 | 20.6 | - | 38.2 | 545.7 | 12.1% | 7.8% |
| % Normalized Operating margin | 23.4% | 24.7% | 130 bps | 30 bps | |||
| Normalized EBITDA | 587.4 | 20.6 | - | 15.0 | 623.0 | 6.1% | 2.6% |
| % Normalized EBITDA margin | 28.2% | 28.1% | -10 bps | -100 bps |
| Brazil NAB | |||||||
| R$ million | YTD25 | Scope | Currency Translation | Organic Growth | YTD26 | % As Reported | % Organic |
| Volume ('000 hl) | 24,657.1 | - | (417.6) | 24,239.5 | -1.7% | -1.7% | |
| Net revenue | 6,368.9 | - | - | 200.1 | 6,568.9 | 3.1% | 3.1% |
| Net revenue/hl (R$) | 258.3 | - | - | 12.7 | 271.0 | 4.9% | 4.9% |
| COGS | (3,618.3) | - | - | 91.7 | (3,526.7) | -2.5% | -2.5% |
| COGS/hl (R$) | (146.7) | - | - | 1.3 | (145.5) | -0.9% | -0.9% |
| COGS excl. deprec. & amort. | (3,518.9) | - | - | 82.9 | (3,436.0) | -2.4% | -2.4% |
| COGS/hl excl. deprec. & amort. (R$) | (142.7) | - | - | 1.0 | (141.8) | -0.7% | -0.7% |
| Gross profit | 2,750.6 | - | - | 291.7 | 3,042.3 | 10.6% | 10.6% |
| % Gross margin | 43.2% | 46.3% | 310 bps | 310 bps | |||
| SG&A excl. deprec. & amort. | (1,450.1) | - | - | (49.6) | (1,499.7) | 3.4% | 3.4% |
| SG&A deprec. & amort. | (206.6) | - | - | 42.0 | (164.6) | -20.3% | -20.3% |
| SG&A total | (1,656.7) | - | - | (7.6) | (1,664.3) | 0.5% | 0.5% |
| Other operating income/(expenses) | 353.7 | 14.1 | - | (42.4) | 325.4 | -8.0% | -12.4% |
| Normalized Operating Profit | 1,447.6 | 14.1 | - | 241.7 | 1,703.4 | 17.7% | 16.8% |
| % Normalized Operating margin | 22.7% | 25.9% | 320 bps | 300 bps | |||
| Normalized EBITDA | 1,753.6 | 14.1 | - | 191.0 | 1,958.7 | 11.7% | 11.0% |
| % Normalized EBITDA margin | 27.5% | 29.8% | 230 bps | 200 bps |
[5] The scope change in Brazil NAB refers to tax credits and related effects.
ambev.com.br | Press Release – October 29, 2026 |
Page | 8 | |
BRAZIL[6]
| Brazil | |||||||
| R$ million | 3Q25 | Scope | Currency Translation | Organic Growth | 3Q26 | % As Reported | % Organic |
| Volume ('000 hl) | 29,316.9 | - | 397.0 | 29,713.9 | 1.4% | 1.4% | |
| Net revenue | 11,760.3 | - | - | 592.4 | 12,352.7 | 5.0% | 5.0% |
| Net revenue/hl (R$) | 401.1 | - | - | 14.6 | 415.7 | 3.6% | 3.6% |
| COGS | (5,900.8) | - | - | (323.5) | (6,224.2) | 5.5% | 5.5% |
| COGS/hl (R$) | (201.3) | - | - | (8.2) | (209.5) | 4.1% | 4.1% |
| COGS excl. deprec. & amort. | (5,407.8) | - | - | (256.0) | (5,663.8) | 4.7% | 4.7% |
| COGS/hl excl. deprec. & amort. (R$) | (184.5) | - | - | (6.1) | (190.6) | 3.3% | 3.3% |
| Gross profit | 5,859.6 | - | - | 268.9 | 6,128.5 | 4.6% | 4.6% |
| % Gross margin | 49.8% | 49.6% | -20 bps | -20 bps | |||
| SG&A excl. deprec. & amort. | (2,936.8) | - | - | (251.9) | (3,188.7) | 8.6% | 8.6% |
| SG&A deprec. & amort. | (519.1) | - | - | 27.1 | (492.0) | -5.2% | -5.2% |
| SG&A total | (3,455.8) | - | - | (224.8) | (3,680.7) | 6.5% | 6.5% |
| Other operating income/(expenses) | 565.9 | 134.3 | - | (34.9) | 665.2 | 17.6% | -6.2% |
| Normalized Operating Profit | 2,969.6 | 134.3 | - | 9.2 | 3,113.1 | 4.8% | 0.3% |
| % Normalized Operating margin | 25.3% | 25.2% | -10 bps | -120 bps | |||
| Normalized EBITDA | 3,981.6 | 134.3 | - | 49.6 | 4,165.5 | 4.6% | 1.2% |
| % Normalized EBITDA margin | 33.9% | 33.7% | -20 bps | -130 bps |
| Brazil | |||||||
| R$ million | YTD25 | Scope | Currency Translation | Organic Growth | YTD26 | % As Reported | % Organic |
| Volume ('000 hl) | 89,414.9 | - | 962.7 | 90,377.6 | 1.1% | 1.1% | |
| Net revenue | 35,036.5 | - | - | 2,422.5 | 37,458.9 | 6.9% | 6.9% |
| Net revenue/hl (R$) | 391.8 | - | - | 22.6 | 414.5 | 5.8% | 5.8% |
| COGS | (17,488.8) | - | - | (1,076.6) | (18,565.4) | 6.2% | 6.2% |
| COGS/hl (R$) | (195.6) | - | - | (9.8) | (205.4) | 5.0% | 5.0% |
| COGS excl. deprec. & amort. | (16,008.7) | - | - | (1,063.0) | (17,071.6) | 6.6% | 6.6% |
| COGS/hl excl. deprec. & amort. (R$) | (179.0) | - | - | (9.9) | (188.9) | 5.5% | 5.5% |
| Gross profit | 17,547.7 | - | - | 1,345.9 | 18,893.6 | 7.7% | 7.7% |
| % Gross margin | 50.1% | 50.4% | 30 bps | 30 bps | |||
| SG&A excl. deprec. & amort. | (9,120.7) | - | - | (647.6) | (9,768.4) | 7.1% | 7.1% |
| SG&A deprec. & amort. | (1,591.3) | - | - | 10.7 | (1,580.6) | -0.7% | -0.7% |
| SG&A total | (10,712.0) | - | - | (636.9) | (11,349.0) | 5.9% | 5.9% |
| Other operating income/(expenses) | 1,741.4 | 116.3 | - | 153.1 | 2,010.8 | 15.5% | 9.2% |
| Normalized Operating Profit | 8,577.1 | 116.3 | - | 862.1 | 9,555.4 | 11.4% | 10.1% |
| % Normalized Operating margin | 24.5% | 25.5% | 100 bps | 70 bps | |||
| Normalized EBITDA | 11,648.5 | 116.3 | - | 865.0 | 12,629.8 | 8.4% | 7.5% |
| % Normalized EBITDA margin | 33.2% | 33.7% | 50 bps | 20 bps |
[6] In 3Q26, net revenue per hectoliter and Cash COGS per hectoliter, excluding the sale of non-Ambev marketplace products, were R$ 406.2(4.1% organic growth) and R$ (183.7) (4.8% organic growth), respectively. In YTD26, net revenue per hectoliter and Cash COGS per hectoliter, excluding the sale of non-Ambev marketplace products, were R$ 404.5 (6.0% organic growth) and R$ (181.6) (6.4% organic growth), respectively. The scope change in Brazil refers to tax credits and related effects.
ambev.com.br | Press Release – October 29, 2026 |
Page | 9 | |
Central America and the Caribbean (CAC): Beer-led volume growth drove high-single digit top-line and double digit bottom-line increase, with margins expansion
| · | Operating performance[7]: |
| o | 3Q26: Total volumes increased by 2.3%, with beer volumes outperforming that growth. Top-line increased by 8.1%, with NR/hl excluding marketplace increasing 6.1%, mostly reflecting our revenue management strategy. Cash COGS/hl excluding marketplace increased by 5.5% and Cash SG&A increased by 3.3%, mainly reflecting increased administrative expenses. Normalized EBITDA increased by 11.4%, with gross and Normalized EBITDA margins expanding 160 bps and 140 bps, respectively. |
| o | YTD26: Net revenue increased by 8.3% (volumes +5.0% and NR/hl +3.2%), and Normalized EBITDA grew by 9.8%, with gross and Normalized EBITDA margins expansion of 230 bps and 70 bps, respectively. |
| · | Commercial highlights: In the Dominican Republic the consumer environment continues to be supportive, given the more favorable macro backdrop. Our portfolio continued to gain brand equity, both sequentially and year-on-year, supported by consistent Sales & Marketing investments, mainly driven by Presidente and The One. In Panama, a more supportive consumer backdrop, coupled with our portfolio strategy, drove low-teens beer volumes growth. Our beer portfolio has strengthened brand equity in the period once again, mainly driven by the Balboa family. |
| CAC | |||||||
| R$ million | 3Q25 | Scope | Currency Translation | Organic Growth | 3Q26 | % As Reported | % Organic |
| Volume ('000 hl) | 3,097.6 | (363.4) | 62.2 | 2,796.3 | -9.7% | 2.3% | |
| Net revenue | 2,738.9 | (295.8) | (74.5) | 197.1 | 2,565.7 | -6.3% | 8.1% |
| Net revenue/hl (R$) | 884.2 | 9.3 | (26.6) | 50.6 | 917.5 | 3.8% | 5.7% |
| COGS | (1,208.9) | 148.6 | 31.0 | (43.1) | (1,072.3) | -11.3% | 4.1% |
| COGS/hl (R$) | (390.3) | 2.5 | 11.1 | (6.8) | (383.5) | -1.7% | 1.8% |
| COGS excl. deprec. & amort. | (1,081.8) | 143.4 | 27.7 | (51.2) | (961.8) | -11.1% | 5.5% |
| COGS/hl excl. deprec. & amort. (R$) | (349.2) | 6.0 | 9.9 | (10.7) | (344.0) | -1.5% | 3.1% |
| Gross profit | 1,530.0 | (147.2) | (43.4) | 154.0 | 1,493.3 | -2.4% | 11.1% |
| % Gross margin | 55.9% | 58.2% | 230 bps | 160 bps | |||
| SG&A excl. deprec. & amort. | (436.1) | 46.5 | 11.3 | (12.7) | (391.1) | -10.3% | 3.3% |
| SG&A deprec. & amort. | (54.2) | 4.7 | 2.1 | (7.6) | (55.0) | 1.4% | 15.4% |
| SG&A total | (490.3) | 51.2 | 13.4 | (20.3) | (446.0) | -9.0% | 4.6% |
| Other operating income/(expenses) | 5.8 | 1.1 | (0.2) | (5.2) | 1.4 | -74.9% | -75.3% |
| Normalized Operating Profit | 1,045.5 | (94.9) | (30.3) | 128.5 | 1,048.7 | 0.3% | 13.5% |
| % Normalized Operating margin | 38.2% | 40.9% | 270 bps | 200 bps | |||
| Normalized EBITDA | 1,226.8 | (104.9) | (35.7) | 128.0 | 1,214.2 | -1.0% | 11.4% |
| % Normalized EBITDA margin | 44.8% | 47.3% | 250 bps | 140 bps |
[7] In 3Q26, net revenue per hectoliter and Cash COGS per hectoliter, excluding the sale of non-Ambev marketplace products, were R$884.5 (6.1% organic growth) and R$ (314.8) (5.5% organic growth), respectively. In YTD26, net revenue per hectoliter and Cash COGS per hectoliter, excluding the sale of non-Ambev marketplace products, were R$ 853.4 (4.1% organic growth) and R$ (307.1) (2.4% organic growth), respectively. The scope change in CAC refers to the deconsolidation of subsidiaries.
ambev.com.br | Press Release – October 29, 2026 |
Page | 10 | |
| CAC | YTD25 | Scope | Currency Translation | Organic Growth | YTD26 | % As Reported | % Organic |
| R$ million | |||||||
| Volume ('000 hl) | 8,772.7 | (1,139.8) | 382.8 | 8,015.7 | -8.6% | 5.0% | |
| Net revenue | 8,180.4 | (1,061.7) | (584.2) | 593.9 | 7,128.4 | -12.9% | 8.3% |
| Net revenue/hl (R$) | 932.5 | 0.2 | (72.9) | 29.5 | 889.3 | -4.6% | 3.2% |
| COGS | (3,711.1) | 549.0 | 230.8 | (86.1) | (3,017.4) | -18.7% | 2.7% |
| COGS/hl (R$) | (423.0) | 8.8 | 28.8 | 9.1 | (376.4) | -11.0% | -2.2% |
| COGS excl. deprec. & amort. | (3,297.9) | 521.7 | 204.0 | (139.2) | (2,711.4) | -17.8% | 5.0% |
| COGS/hl excl. deprec. & amort. (R$) | (375.9) | 12.2 | 25.4 | 0.0 | (338.3) | -10.0% | 0.0% |
| Gross profit | 4,469.3 | (512.7) | (353.4) | 507.8 | 4,111.0 | -8.0% | 12.8% |
| % Gross margin | 54.6% | 57.7% | 310 bps | 230 bps | |||
| SG&A excl. deprec. & amort. | (1,366.6) | 173.1 | 107.3 | (124.0) | (1,210.2) | -11.4% | 10.4% |
| SG&A deprec. & amort. | (188.9) | 26.7 | 13.7 | (3.2) | (151.7) | -19.7% | 2.0% |
| SG&A total | (1,555.5) | 199.9 | 121.0 | (127.2) | (1,361.9) | -12.5% | 9.4% |
| Other operating income/(expenses) | 2.9 | 4.4 | 1.4 | (20.0) | (11.4) | nm | nm |
| Normalized Operating Profit | 2,916.6 | (308.4) | (231.1) | 360.6 | 2,737.7 | -6.1% | 13.8% |
| % Normalized Operating margin | 35.7% | 38.4% | 270 bps | 190 bps | |||
| Normalized EBITDA | 3,518.7 | (362.4) | (271.6) | 310.7 | 3,195.4 | -9.2% | 9.8% |
| % Normalized EBITDA margin | 43.0% | 44.8% | 180 bps | 70 bps |
ambev.com.br | Press Release – October 29, 2026 |
Page | 11 | |
Latin America South (LAS): Sequential improvement in beer volumes drove real growth in both top- and bottom-line, alongside margins expansion
| · | Operating performance[8]: |
| o | 3Q26: Volumes were down 1.4%. Top-line increased by 21.4%, with NR/hl excluding marketplace growing 23.6%, led by our consistent revenue management strategy. Cash COGS/hl and Cash SG&A increased below inflation, reflecting our disciplined approach towards cost and expenses management, even as we stepped up Sales & Marketing investments in the period. Normalized EBITDA increased by 41.5%, with gross and Normalized EBITDA margin expanding by 310 bps and 480 bps, respectively. Our performance in the quarter reflected our continued effort to optimize our operations, enabling us to deliver real growth, ahead of inflation, even amid a challenging consumer environment in Argentina, our main market in the region. |
| o | YTD26: Net revenue was up 11.8% (volumes -1.5% and NR/hl +13.5%), and Normalized EBITDA rose by 19.4%, with gross and Normalized EBITDA margin expansion of 210 bps and 180 bps, respectively. |
| · | Commercial highlights: In Argentina, total volumes declined by mid-single digit, mostly impacted by adverse weather and a soft consumer environment. Our beer portfolio brand equity has strengthened once again, reflecting our continued brand-building efforts, as we remain committed to the category development in the country, positioning our portfolio for future opportunities. In Bolivia, total volumes increased by high-single digit, driven by a recovered commercial momentum, following the temporary social unrest that disrupted mobility and logistics during 2Q26. Our beer portfolio gained brand equity once again, while we also estimate to have gained beer market share in the period, sustained by our consistent commercial execution. |
| LAS | IAS 29 6M Impact |
|||||||
| R$ million | 3Q25 | Scope | Currency Translation | Organic Growth | 3Q26 | % As Reported | % Organic | |
| Volume ('000 hl) | 7,605.1 | - | - | (106.2) | 7,498.9 | -1.4% | -1.4% | |
| Net revenue | 3,491.9 | 96.6 | (202.3) | (94.3) | 745.6 | 4,037.5 | 15.6% | 21.4% |
| Net revenue/hl (R$) | 459.2 | 12.9 | (27.0) | (12.6) | 105.9 | 538.4 | 17.3% | 23.1% |
| COGS | (1,808.6) | (138.6) | (72.4) | 86.2 | (253.9) | (2,187.4) | 20.9% | 14.0% |
| COGS/hl (R$) | (237.8) | (18.5) | (9.6) | 11.5 | (37.2) | (291.7) | 22.7% | 15.7% |
| COGS excl. deprec. & amort. | (1,644.5) | (110.3) | (65.2) | 80.8 | (242.4) | (1,981.6) | 20.5% | 14.7% |
| COGS/hl excl. deprec. & amort. (R$) | (216.2) | (14.7) | (8.7) | 10.8 | (35.4) | (264.3) | 22.2% | 16.4% |
| Gross profit | 1,683.3 | (42.0) | (274.7) | (8.1) | 491.7 | 1,850.2 | 9.9% | 29.2% |
| % Gross margin | 48.2% | 45.8% | -240 bps | 310 bps | ||||
| SG&A excl. deprec. & amort. | (870.0) | (49.9) | (22.2) | 44.5 | (89.0) | (986.5) | 13.4% | 10.2% |
| SG&A deprec. & amort. | (91.9) | (0.8) | (5.9) | 0.6 | (7.9) | (106.0) | 15.3% | 8.6% |
| SG&A total | (961.9) | (50.7) | (28.1) | 45.1 | (96.9) | (1,092.5) | 13.6% | 10.1% |
| Other operating income/(expenses) | 15.8 | 1.9 | (1.7) | (0.3) | (1.9) | 13.8 | -13.0% | -12.1% |
| Normalized Operating Profit | 737.2 | (90.9) | (304.5) | 36.7 | 392.8 | 771.4 | 4.6% | 53.3% |
| % Normalized Operating margin | 21.1% | 19.1% | -200 bps | 560 bps | ||||
| Normalized EBITDA | 993.3 | (61.8) | (291.5) | 30.8 | 412.3 | 1,083.2 | 9.0% | 41.5% |
| % Normalized EBITDA margin | 28.4% | 26.8% | -160 bps | 480 bps |
[8] In 3Q26, net revenue per hectoliter and Cash COGS per hectoliter, excluding the sale of non-Ambev marketplace products, were R$ 531.7 (23.6%organic growth) and R$(259.1) (17.2% organic growth), respectively. In YTD26, net revenue per hectoliter and Cash COGS per hectoliter, excluding the sale of non-Ambev marketplace products, were R$ 546.6 (14.1% organic growth) and R$ (262.5) (10.0% organic growth), respectively. The scope change in LAS refers to the organic growth cap methodology in Argentina results, when triggered, and the effects of applying the Hyperinflation Accounting within the quarter. Reported numbers are presented applying Hyperinflation Accounting for our Argentinean operations, as detailed on page 15.
ambev.com.br | Press Release – October 29, 2026 |
Page | 12 | |
| LAS | YTD25 | Scope | Currency Translation | Organic Growth | YTD26 | % As Reported | % Organic | |
| R$ million | IAS 29 6M Impact | |||||||
| Volume ('000 hl) | 22,596.5 | - | - | (331.1) | 22,265.4 | -1.5% | -1.5% | |
| Net revenue | 12,323.2 | 218.7 | (1,542.8) | (155.9) | 1,456.6 | 12,299.8 | -0.2% | 11.8% |
| Net revenue/hl (R$) | 545.4 | 9.7 | (69.3) | (6.9) | 73.5 | 552.4 | 1.3% | 13.5% |
| COGS | (6,586.3) | (300.2) | 689.0 | 128.0 | (476.8) | (6,546.3) | -0.6% | 7.2% |
| COGS/hl (R$) | (291.5) | (13.3) | 30.9 | 5.5 | (25.7) | (294.0) | 0.9% | 8.8% |
| COGS excl. deprec. & amort. | (5,999.9) | (256.3) | 626.8 | 120.0 | (445.2) | (5,954.7) | -0.8% | 7.4% |
| COGS/hl excl. deprec. & amort. (R$) | (265.5) | (11.3) | 28.2 | 5.2 | (23.9) | (267.4) | 0.7% | 9.0% |
| Gross profit | 5,736.9 | (81.5) | (853.8) | (28.0) | 979.8 | 5,753.4 | 0.3% | 17.1% |
| % Gross margin | 46.6% | 46.8% | 20 bps | 210 bps | ||||
| SG&A excl. deprec. & amort. | (3,138.8) | (97.9) | 397.6 | 66.2 | (391.1) | (3,163.9) | 0.8% | 12.5% |
| SG&A deprec. & amort. | (310.2) | 21.8 | 24.9 | 1.7 | (24.5) | (286.3) | -7.7% | 7.9% |
| SG&A total | (3,448.9) | (76.1) | 422.5 | 67.9 | (415.6) | (3,450.3) | 0.0% | 12.0% |
| Other operating income/(expenses) | 32.2 | 2.9 | (4.2) | (0.8) | 4.7 | 34.8 | 8.0% | 14.6% |
| Normalized Operating Profit | 2,320.2 | (154.7) | (435.6) | 39.2 | 568.8 | 2,338.0 | 0.8% | 24.5% |
| % Normalized Operating margin | 18.8% | 19.0% | 20 bps | 220 bps | ||||
| Normalized EBITDA | 3,216.7 | (132.6) | (522.6) | 29.5 | 624.9 | 3,216.0 | 0.0% | 19.4% |
| % Normalized EBITDA margin | 26.1% | 26.1% | 0 bps | 180 bps |
ambev.com.br | Press Release – October 29, 2026 |
Page | 13 | |
Canada: Top- and bottom-line growth, with margins expansion, outperforming both beer and beyond beer industries
| · | Operating performance[9]: |
| o | 3Q26: Volumes decreased by 1.0%, outperforming a soft industry, which continued to be impacted by softer consumer demand. Top-line increased by 1.2%, with NR/hl excluding marketplace growing by 2.2%, reflecting our revenue management initiatives and premiumization. Cash COGS/hl excluding marketplace increased by 0.8% and Cash SG&A increased by 3.8%, primarily reflecting increased sales and marketing investments behind the FIFA World Cup in the quarter. Normalized EBITDA increased by 3.2%, with both gross and Normalized EBITDA margin expanding 20 bps and 60 bps, respectively. |
| o | YTD26: Net revenue was up 1.2% (volumes -1.5% and NR/hl +2.8%), and Normalized EBITDA increased by 3.8%, with both gross and Normalized EBITDA margin expanding 60 bps and 70 bps, respectively. |
| · | Commercial highlights: We gained both beer and beyond beer market share in the quarter, also remaining as the #1 share gainer in both categories year-to-date, according to our estimates. In Beer, both Above Core and Value segments grew in the period, with performance being led by Busch, Michelob Ultra and Corona, which were ranked as the top three fastest-growing beer brand families in the country. Beyond Beer growth was led by Cutwater, Mike’s and NUTRL. |
| Canada | |||||||
| R$ million | 3Q25 | Scope | Currency Translation | Organic Growth | 3Q26 | % As Reported | % Organic |
| Volume ('000 hl) | 2,399.6 | - | (23.7) | 2,376.0 | -1.0% | -1.0% | |
| Net revenue | 2,856.1 | - | (252.4) | 34.9 | 2,638.6 | -7.6% | 1.2% |
| Net revenue/hl (R$) | 1,190.2 | - | (106.2) | 26.5 | 1,110.6 | -6.7% | 2.2% |
| COGS | (1,201.7) | - | 105.6 | (8.2) | (1,104.4) | -8.1% | 0.7% |
| COGS/hl (R$) | (500.8) | - | 44.4 | (8.5) | (464.8) | -7.2% | 1.7% |
| COGS excl. deprec. & amort. | (1,123.0) | - | 97.9 | 1.6 | (1,023.5) | -8.9% | -0.1% |
| COGS/hl excl. deprec. & amort. (R$) | (468.0) | - | 41.2 | (4.0) | (430.8) | -8.0% | 0.9% |
| Gross profit | 1,654.4 | - | (146.8) | 26.7 | 1,534.3 | -7.3% | 1.6% |
| % Gross margin | 57.9% | 58.1% | 20 bps | 20 bps | |||
| SG&A excl. deprec. & amort. | (855.3) | - | 77.7 | (32.2) | (809.9) | -5.3% | 3.8% |
| SG&A deprec. & amort. | (71.3) | - | 7.5 | (15.6) | (79.3) | 11.3% | 21.9% |
| SG&A total | (926.6) | - | 85.2 | (47.8) | (889.2) | -4.0% | 5.2% |
| Other operating income/(expenses) | (20.3) | - | (0.3) | 23.4 | 2.8 | nm | nm |
| Normalized Operating Profit | 707.5 | - | (61.8) | 2.2 | 647.8 | -8.4% | 0.3% |
| % Normalized Operating margin | 24.8% | 24.6% | -20 bps | -30 bps | |||
| Normalized EBITDA | 857.4 | - | (77.1) | 27.6 | 808.0 | -5.8% | 3.2% |
| % Normalized EBITDA margin | 30.0% | 30.6% | 60 bps | 60 bps |
[9] In 3Q26, net revenue per hectoliter and Cash COGS per hectoliter, excluding the sale of non-Ambev marketplace products, were R$ 1,108.4 (2.2% organic growth) and R$(429.3) (0.8% organic growth), respectively. In YTD26, net revenue per hectoliter and Cash COGS per hectoliter, excluding the sale of non-Ambev marketplace products, were R$ 1,137.8 (2.8% organic growth) and R$ (439.1) (0.7% organic growth), respectively.
ambev.com.br | Press Release – October 29, 2026 |
Page | 14 | |
| Canada | |||||||
| R$ million | YTD25 | Scope | Currency Translation | Organic Growth | YTD26 | % As Reported | % Organic |
| Volume ('000 hl) | 6,522.2 | - | (99.9) | 6,422.3 | -1.5% | -1.5% | |
| Net revenue | 7,894.7 | - | (669.9) | 96.0 | 7,320.9 | -7.3% | 1.2% |
| Net revenue/hl (R$) | 1,210.4 | - | (104.3) | 33.8 | 1,139.9 | -5.8% | 2.8% |
| COGS | (3,325.7) | - | 278.3 | 6.1 | (3,041.2) | -8.6% | -0.2% |
| COGS/hl (R$) | (509.9) | - | 43.3 | (7.0) | (473.5) | -7.1% | 1.4% |
| COGS excl. deprec. & amort. | (3,114.9) | - | 258.8 | 27.4 | (2,828.6) | -9.2% | -0.9% |
| COGS/hl excl. deprec. & amort. (R$) | (477.6) | - | 40.3 | (3.2) | (440.4) | -7.8% | 0.7% |
| Gross profit | 4,569.1 | - | (391.6) | 102.1 | 4,279.6 | -6.3% | 2.2% |
| % Gross margin | 57.9% | 58.5% | 60 bps | 60 bps | |||
| SG&A excl. deprec. & amort. | (2,499.0) | - | 214.6 | (60.6) | (2,345.1) | -6.2% | 2.4% |
| SG&A deprec. & amort. | (234.1) | - | 18.5 | 13.9 | (201.8) | -13.8% | -5.9% |
| SG&A total | (2,733.1) | - | 233.1 | (46.8) | (2,546.8) | -6.8% | 1.7% |
| Other operating income/(expenses) | (8.3) | - | (1.3) | 23.8 | 14.2 | nm | nm |
| Normalized Operating Profit | 1,827.6 | - | (159.9) | 79.2 | 1,746.9 | -4.4% | 4.3% |
| % Normalized Operating margin | 23.1% | 23.9% | 80 bps | 80 bps | |||
| Normalized EBITDA | 2,272.5 | - | (197.8) | 86.6 | 2,161.4 | -4.9% | 3.8% |
| % Normalized EBITDA margin | 28.8% | 29.5% | 70 bps | 70 bps |
ambev.com.br | Press Release – October 29, 2026 |
Page | 15 | |
AMBEV CONSOLIDATED[10]
| Ambev | ||||||||
| R$ million | 3Q25 | Scope | Currency Translation | IAS 29 6M Impact |
Organic Growth | 3Q26 | % As Reported | % Organic |
| Volume ('000 hl) | 42,419.2 | (363.4) | 329.3 | 42,385.0 | -0.1% | 0.8% | ||
| Net revenue | 20,847.3 | (199.3) | (529.2) | (94.3) | 1,570.0 | 21,594.6 | 3.6% | 7.6% |
| Net revenue/hl (R$) | 491.5 | (0.5) | (12.5) | (2.4) | 33.4 | 509.5 | 3.7% | 6.8% |
| COGS | (10,120.0) | 10.0 | 64.2 | 86.2 | (628.8) | (10,588.3) | 4.6% | 6.3% |
| COGS/hl (R$) | (238.6) | (1.8) | 1.5 | 2.2 | (13.2) | (249.8) | 4.7% | 5.5% |
| COGS excl. deprec. & amort. | (9,257.1) | 33.1 | 60.4 | 80.8 | (547.9) | (9,630.7) | 4.0% | 6.0% |
| COGS/hl excl. deprec. & amort. (R$) | (218.2) | (1.1) | 1.4 | 2.1 | (11.4) | (227.2) | 4.1% | 5.2% |
| Gross profit | 10,727.3 | (189.2) | (464.9) | (8.1) | 941.3 | 11,006.3 | 2.6% | 8.9% |
| % Gross margin | 51.5% | 51.0% | -50 bps | 60 bps | ||||
| SG&A excl. deprec. & amort. | (5,098.1) | (3.4) | 66.8 | 44.5 | (385.9) | (5,376.2) | 5.5% | 7.6% |
| SG&A deprec. & amort. | (736.4) | 3.9 | 3.8 | 0.6 | (4.1) | (732.2) | -0.6% | 0.6% |
| SG&A total | (5,834.6) | 0.5 | 70.5 | 45.1 | (390.0) | (6,108.4) | 4.7% | 6.7% |
| Other operating income/(expenses) | 567.1 | 137.2 | (2.3) | (0.3) | (18.6) | 683.2 | 20.5% | -3.3% |
| Normalized Operating Profit | 5,459.8 | (51.5) | (396.7) | 36.7 | 532.7 | 5,581.0 | 2.2% | 9.9% |
| % Normalized Operating margin | 26.2% | 25.8% | -40 bps | 60 bps | ||||
| Exceptional items above EBITDA | 845.5 | (9.0) | (5.1) | 6.6 | (881.0) | (43.0) | nm | nm |
| Net finance results | (1,086.0) | (312.4) | -71.2% | |||||
| Share of results of joint ventures | (5.4) | 22.8 | nm | |||||
| Income tax expense | (350.2) | (882.1) | 151.9% | |||||
| Profit | 4,863.7 | 4,366.3 | -10.2% | |||||
| Attributable to Ambev holders | 4,745.1 | 4,245.4 | -10.5% | |||||
| Attributable to non-controlling interests | 118.6 | 120.9 | 2.0% | |||||
| Normalized profit | 3,843.1 | 4,393.6 | 14.3% | |||||
| Attributable to Ambev holders | 3,743.0 | 4,272.4 | 14.1% | |||||
| Normalized EBITDA | 7,059.1 | (32.4) | (404.2) | 30.8 | 617.6 | 7,270.9 | 3.0% | 8.9% |
| % Normalized EBITDA margin | 33.9% | 33.7% | -20 bps | 40 bps |
| Ambev | ||||||||
| R$ million | YTD25 | Scope | Currency Translation | IAS 29 6M Impact |
Organic Growth | YTD26 | % As Reported | % Organic |
| Volume ('000 hl) | 127,306.2 | (1,139.8) | 914.5 | 127,080.9 | -0.2% | 0.7% | ||
| Net revenue | 63,434.8 | (843.0) | (2,796.8) | (155.9) | 4,568.9 | 64,208.0 | 1.2% | 7.3% |
| Net revenue/hl (R$) | 498.3 | (2.2) | (22.0) | (1.4) | 32.5 | 505.3 | 1.4% | 6.6% |
| COGS | (31,111.9) | 248.8 | 1,198.0 | 128.0 | (1,633.3) | (31,170.3) | 0.2% | 5.3% |
| COGS/hl (R$) | (244.4) | (0.2) | 9.4 | 1.0 | (11.1) | (245.3) | 0.4% | 4.6% |
| COGS excl. deprec. & amort. | (28,421.4) | 265.4 | 1,089.6 | 120.0 | (1,620.0) | (28,566.3) | 0.5% | 5.8% |
| COGS/hl excl. deprec. & amort. (R$) | (223.3) | 0.1 | 8.6 | 1.1 | (11.3) | (224.8) | 0.7% | 5.0% |
| Gross profit | 32,323.0 | (594.2) | (1,598.8) | (28.0) | 2,935.6 | 33,037.6 | 2.2% | 9.2% |
| % Gross margin | 51.0% | 51.5% | 50 bps | 90 bps | ||||
| SG&A excl. deprec. & amort. | (16,125.1) | 75.3 | 719.5 | 66.2 | (1,223.4) | (16,487.5) | 2.2% | 7.7% |
| SG&A deprec. & amort. | (2,324.5) | 48.5 | 57.0 | 1.7 | (3.1) | (2,220.4) | -4.5% | 0.1% |
| SG&A total | (18,449.7) | 123.8 | 776.5 | 67.9 | (1,226.4) | (18,708.0) | 1.4% | 6.7% |
| Other operating income/(expenses) | 1,768.2 | 123.6 | (4.2) | (0.8) | 161.6 | 2,048.4 | 15.8% | 9.5% |
| Normalized Operating Profit | 15,641.5 | (346.8) | (826.5) | 39.2 | 1,870.7 | 16,378.1 | 4.7% | 12.3% |
| % Normalized Operating margin | 24.7% | 25.5% | 80 bps | 110 bps | ||||
| Exceptional items above EBITDA | 772.9 | (16.6) | 4.7 | 11.5 | (809.8) | (37.3) | nm | nm |
| Net finance results | (2,916.4) | (1,855.0) | -36.4% | |||||
| Share of results of joint ventures | (8.1) | 33.4 | nm | |||||
| Income tax expense | (2,031.0) | (2,792.5) | 37.5% | |||||
| Profit | 11,458.9 | 11,726.6 | 2.3% | |||||
| Attributable to Ambev holders | 11,156.8 | 11,400.6 | 2.2% | |||||
| Attributable to non-controlling interests | 302.1 | 326.0 | 7.9% | |||||
| Normalized profit | 10,496.0 | 11,718.7 | 11.6% | |||||
| Attributable to Ambev holders | 10,212.1 | 11,392.1 | 11.6% | |||||
| Normalized EBITDA | 20,656.5 | (378.7) | (992.0) | 29.5 | 1,887.1 | 21,202.5 | 2.6% | 9.3% |
| % Normalized EBITDA margin | 32.6% | 33.0% | 40 bps | 60 bps |
[10] In 3Q26, net revenue per hectoliter and Cash COGS per hectoliter, excluding the sale of non-Ambev marketplace products, were R$ 499.3 (7.2% organic growth) and R$ (219.5) (6.5% organic growth), respectively. In YTD26, net revenue per hectoliter and Cash COGS per hectoliter, excluding the sale of non-Ambev marketplace products, were R$ 494.8 (6.9% organic growth) and R$ (216.7) (6.0% organic growth), respectively. The scope changes refer to (i) tax credits and related effects in Brazil; (ii) deconsolidation of subsidiaries in CAC; and (iii) the organic growth cap methodology in Argentina results, when triggered, and the effects of applying the Hyperinflation Accounting within the quarter in LAS.
ambev.com.br | Press Release – October 29, 2026 |
Page | 16 | |
OTHER OPERATING INCOME/EXPENSES
| Other operating income/(expenses) | 3Q25 | 3Q26 | YTD25 | YTD26 |
| R$ million | ||||
| Government grants and subsidized loan gains | 484.7 | 460.8 | 1,357.9 | 1,432.8 |
| (Additions to)/reversals of provisions | (9.2) | (6.9) | (84.0) | (1.9) |
| Gains/(losses) on disposals of property, plant and equipment, intangible assets and investments in associates | 9.9 | 33.6 | 71.9 | 96.1 |
| Other operating income/(expenses), net | 81.7 | 195.7 | 422.3 | 521.4 |
| Total | 567.1 | 683.2 | 1,768.2 | 2,048.4 |
EXCEPTIONAL ITEMS
Exceptional items above EBITDA correspond to restructuring expenses primarily related to organizational realignments resulting from the Group’s operational improvements, resizing initiatives and digitalization efforts, as well as to the effect related to the deconsolidation of balance sheet amounts, including the sale of a subsidiary, as described in Note 1 - General Information, item 1.3.4 - Completion of the third tranche – Sale of subsidiary to our financial statements.
| Exceptional Items | 3Q25 | 3Q26 | YTD25 | YTD26 |
| R$ million | ||||
| Restructuring | (39.0) | (34.1) | (111.6) | (114.7) |
| Subsidiary restructuring | 884.5 | (8.9) | 884.5 | 77.4 |
| Total | 845.5 | (43.0) | 772.9 | (37.3) |
ambev.com.br | Press Release – October 29, 2026 |
Page | 17 | |
NET FINANCE RESULTS
Net finance results in 3Q26 totaled R$ (312.4) million, an improvement of R$ 773.6 million compared to 3Q25, broken down as follows:
| · | Interest income totaled R$ 627.0 million, mainly explained by: (i) interest income of R$ 325.3 million from cash balance investments in Brazil and Argentina, and (ii) interest rate on Brazilian tax credits of R$ 238.5 million. |
| · | Interest expense totaled R$ (560.3) million, mainly impacted by: (i) fair value adjustments of payables pursuant to IFRS 13 (CPC 46) of R$ (343.0) million, (ii) lease liabilities interest accruals of R$ (63.9) million in accordance with IFRS 16 (CPC 06 R2), (iii) interest on tax incentives of R$ (42.4) million, and (iv) CND put option interest accruals of R$ (37.6) million. |
| · | Losses on derivative instruments of R$ (207.9) million, mainly explained by (i) hedging carry costs related to our FX exposure of US$ 1.9 billion in Brazil, with approximately 9.3% carry cost, and (ii) hedging carry costs related to commodities. We did not incur hedging costs related to FX exposure in Argentina this quarter; however, we still maintain an FX exposure of US$ 264.8 million in the country. |
| · | Gains on non-derivative instruments of R$ 151.7 million, mainly driven by non-cash foreign exchange gains on hard-currency balances held by the Company. |
| · | Taxes on financial transactions of R$ (46.1) million. |
| · | Other financial expenses of R$ (252.6) million, mainly explained by accruals on legal contingencies, letter of credit expenses, pension plan expenses and bank fees. |
| · | Non-cash financial expense of R$ (24.1) million resulting from the adoption of hyperinflation accounting in Argentina. |
| Net finance results[11] | 3Q25 | 3Q26 | YTD25 | YTD26 |
| R$ million | ||||
| Interest income | 389.7 | 627.0 | 1,451.4 | 1,822.9 |
| Interest expenses | (488.0) | (560.3) | (1,499.1) | (1,634.6) |
| Gains/(losses) on derivative instruments | (283.1) | (207.9) | (837.8) | (912.7) |
| Gains/(losses) on non-derivative instruments | (524.1) | 151.7 | (1,539.4) | (295.6) |
| Taxes on financial transactions | (97.5) | (46.1) | (217.3) | (152.0) |
| Other net financial income/(expenses) | (64.0) | (252.6) | (228.9) | (687.3) |
| Hyperinflation Argentina | (19.0) | (24.1) | (45.2) | 4.2 |
| - | - | |||
| Net finance results | (1,086.0) | (312.4) | (2,916.4) | (1,855.0) |
[11] Other net financial income/(expenses) line is impacted by the effect of exceptional items below EBITDA.
ambev.com.br | Press Release – October 29, 2026 |
Page | 18 | |
DEBT BREAKDOWN
| Debt breakdown | December 31, 2025 | September 30, 2026 | ||||
| R$ million | Current | Non-current | Total | Current | Non-current | Total |
| Local currency | 885.5 | 1,548.3 | 2,433.9 | 768.1 | 1,157.6 | 1,925.7 |
| Foreign currency | 281.8 | 671.3 | 953.0 | 229.0 | 560.1 | 789.1 |
| Consolidated Debt | 1,167.3 | 2,219.6 | 3,386.9 | 997.1 | 1,717.7 | 2,714.8 |
| Cash and cash equivalents less bank overdrafts | 18,638.2 | 19,188.2 | ||||
| Current investment securities | 1,681.7 | 2,725.9 | ||||
| Net debt/(cash) | (16,933.0) | (19,199.4) | ||||
PROVISION FOR INCOME TAX & SOCIAL CONTRIBUTION
The table below demonstrates the income tax and social contribution provision.
| Income tax and social contribution[12] | 3Q25 | 3Q26 | YTD25 | YTD26 |
| R$ million | ||||
| Profit before income tax | 5,213.9 | 5,248.4 | 13,489.9 | 14,519.1 |
| Adjustment to the taxable basis | ||||
| Other non-taxable income | (530.0) | (166.7) | (860.3) | (493.2) |
| Government grants related to taxes on sales | (97.5) | (100.9) | (291.4) | (312.6) |
| Share of results of associates and joint ventures | 5.4 | (22.8) | 8.1 | (33.4) |
| Non-deductible expenses | 0.1 | 97.8 | 305.3 | 405.4 |
| Taxation on a universal basis and other adjustments related to foreign subsidiaries | 183.7 | 107.6 | 188.7 | 495.6 |
| Total | 4,775.6 | 5,163.4 | 12,840.4 | 14,580.9 |
| Aggregated weighted nominal tax rate | 27.7% | 29.2% | 27.6% | 29.6% |
| Taxes payable – nominal rate | (1,322.3) | (1,507.8) | (3,546.4) | (4,321.3) |
| Adjustment to tax expenses | ||||
| Income tax incentives | 210.4 | 115.2 | 318.6 | 316.0 |
| Deductible interest on capital | 472.2 | 496.0 | 1,066.9 | 1,262.5 |
| Tax savings arising from the amortization of goodwill | 0.9 | 0.9 | 2.7 | 2.7 |
| Withholding income tax | (76.9) | (84.2) | (180.4) | (215.2) |
| Argentina's hyperinflation effect | 13.8 | 3.9 | (14.2) | 48.6 |
| Recognition/(write-off) of deferred charges on tax losses | (13.5) | (14.7) | (59.0) | (49.7) |
| Other tax adjustments | 365.3 | 108.6 | 380.9 | 163.8 |
| Income tax and social contribution expense | (350.2) | (882.1) | (2,031.0) | (2,792.5) |
| Effective tax rate | 6.7% | 16.8% | 15.1% | 19.2% |
SHAREHOLDING STRUCTURE
The table below summarizes Ambev S.A.’s shareholding structure as of September 30, 2026.
| Ambev S.A.'s shareholding structure[13] | ||
| ON ('000 shares) | % Outs | |
| Interbrew International GmbH | 8,441,666 | 54.53% |
| Ambrew S.A.R.L. | 1,287,686 | 8.32% |
| Fundação Zerrenner | 1,609,987 | 10.40% |
| Market (free float) | 4,077,148 | 26.32% |
| Treasury shares | 68,178 | 0.44% |
| 15,484,665 | 100.00% | |
[12] Other non-taxable income and Other tax adjustments lines are impacted by the effect of exceptional items below EBITDA.
[13] In August 2026, the Board of Directors approved the cancellation of 279 million treasury shares, without reducing the share capital.
ambev.com.br | Press Release – October 29, 2026 |
Page | 19 | |
FINANCIAL REPORTING IN HYPERINFLATIONARY ECONOMIES - ARGENTINA
Following the categorization of Argentina as a country with a three-year cumulative inflation rate greater than 100%, the country is considered highly inflationary in accordance with IFRS.
Consequently, starting from 3Q18, we have been reporting the operations of our Argentinean affiliates applying hyperinflation accounting. The IFRS and CPC standards (IAS 29/CPC 42) require the results of our operations in hyperinflationary economies to be reported restating the year-to-date results adjusting for the change in the general purchasing power of the local currency, using official indices, before converting the local amounts at the closing rate of the period (i.e., September 30, 2026 closing rate for 3Q26 and YTD26 results).
The YTD26 hyperinflation accounting adjustment results from the combined effect of (i) the indexation to reflect changes in purchasing power on the YTD26 results against a dedicated line in the finance results; and (ii) the difference between the translation of the YTD26 results at the closing exchange rate of September 30, 2026, and the translation using the average year to date rate on the reported period, as applicable to non-inflationary economies.
The impacts in 3Q25, YTD25, 3Q26 and YTD26 on Net Revenue and Normalized EBITDA were as follows:
| Impact of Hyperinflation Accounting (IAS 29/CPC42) | ||||
| Revenue | ||||
| R$ million | 3Q25 | 3Q26 | YTD25 | YTD26 |
| Indexation(1) | 197.8 | 212.2 | 454.1 | 454.1 |
| Currency(2) | (600.1) | (69.6) | (1,208.6) | (244.4) |
| Total Impact | (402.3) | 142.6 | (754.5) | 209.7 |
| Normalized EBITDA | ||||
| R$ million | 3Q25 | 3Q26 | YTD25 | YTD26 |
| Indexation(1) | 0.7 | (35.1) | (1.3) | (91.7) |
| Currency(2) | 40.0 | (1.9) | 18.6 | (6.3) |
| Total Impact | 40.7 | (37.0) | 17.3 | (98.0) |
| ARS/BRL average rate | 206.6491 | 279.5909 | ||
| ARS/BRL closing rate | 257.0449 | 292.5714 | 257.0449 | 292.5714 |
| (1) | Indexation calculated at each period’s closing exchange rate. |
| (2) | Currency impact calculated as the difference between converting the Argentinean Peso (ARS) reported amounts at the closing exchange rate compared to the average exchange rate of each period. |
Furthermore, IAS 29 requires adjusting non-monetary assets and liabilities on the balance sheet of our operations in hyperinflationary economies for cumulative inflation. The resulting effect from the adjustment until December 31, 2017 was reported in Equity and, the effect from the adjustment from this date on, in a dedicated account in the finance results, reporting deferred taxes on such adjustments, when applicable.
In 3Q26, the transition to hyperinflation accounting in accordance with the IFRS rules resulted in (i) a negative adjustment of R$24.1 million reported in the finance results, (ii) a negative impact on the Profit of R$ 192.2 million, (iii) a negative impact on the Normalized Profit of R$ 190.7 million, and (iv) a negative impact of R$ 0.01 on EPS, as well as on Normalized EPS.
In YTD26, the consequences of the transition were (i) a positive adjustment of R$4.2 million reported in the finance results, (ii) a negative impact on the Profit of R$ 495.1 million, (iii) a negative impact on the Normalized Profit of R$ 493.8 million, and (iv) a negative impact of R$ 0.03 on EPS, as well as on Normalized EPS.
The Q3 results are calculated by deducting from the YTD results the HY results as published. Consequently, LAS and consolidated 3Q26, 3Q25, YTD26 and YTD25 results are impacted by the adjustment of HY results for the cumulative inflation between reporting periods, as well as by the translation of HY results at the YTD closing exchange rate, of September 30 as follows:
ambev.com.br | Press Release – October 29, 2026 |
Page | 20 | |
| LAS - 6M As Reported | YTD25 | Scope | Currency Translation | Organic Growth | YTD26 | % Organic |
| Net revenue | 12,323.2 | 218.7 | (1,542.8) | 1,456.6 | 12,299.8 | 11.8% |
| COGS | (6,586.3) | (300.2) | 689.0 | (476.8) | (6,546.3) | 7.2% |
| COGS excl. deprec. & amort. | (5,999.9) | (256.3) | 626.8 | (445.2) | (5,954.7) | 7.4% |
| Gross profit | 5,736.9 | (81.5) | (853.8) | 979.8 | 5,753.4 | 17.1% |
| SG&A excl. deprec. & amort. | (3,138.8) | (97.9) | 397.6 | (391.1) | (3,163.9) | 12.5% |
| SG&A deprec. & amort. | (310.2) | 21.8 | 24.9 | (24.5) | (286.3) | 7.9% |
| SG&A total | (3,448.9) | (76.1) | 422.5 | (415.6) | (3,450.3) | 12.0% |
| Other operating income/(expenses) | 32.2 | 2.9 | (4.2) | 4.7 | 34.8 | 14.6% |
| Normalized Operating Profit | 2,320.2 | (154.7) | (435.6) | 568.8 | 2,338.0 | 24.5% |
| Normalized EBITDA | 3,216.7 | (132.6) | (522.6) | 624.9 | 3,216.0 | 19.4% |
| LAS - 6M Recalculated at YTD Exchange Rates | YTD25 | Scope | Currency Translation | Organic Growth | YTD26 | % Organic |
| Net revenue | 11,896.8 | 124.4 | (928.9) | 1,456.6 | 12,392.9 | 0.0% |
| COGS | (6,361.7) | (214.0) | 322.7 | (476.8) | (6,601.9) | 0.0% |
| COGS excl. deprec. & amort. | (5,800.2) | (175.5) | 296.1 | (445.2) | (6,004.8) | 0.0% |
| Gross profit | 5,535.0 | (89.6) | (606.2) | 979.8 | 5,791.0 | 0.0% |
| SG&A excl. deprec. & amort. | (3,011.9) | (53.3) | 195.5 | (391.1) | (3,194.6) | 0.0% |
| SG&A deprec. & amort. | (296.7) | 22.3 | 8.4 | (24.5) | (288.8) | 0.0% |
| SG&A total | (3,308.6) | (31.0) | 203.9 | (415.6) | (3,483.4) | 0.0% |
| Other operating income/(expenses) | 31.4 | 2.6 | (2.9) | 4.7 | 35.0 | 0.0% |
| Normalized Operating Profit | 2,257.8 | (118.0) | (405.3) | 568.8 | 2,342.6 | 0.0% |
| Normalized EBITDA | 3,116.0 | (101.8) | (440.2) | 624.9 | 3,228.5 | 0.0% |
| LAS - 6M Recalculation Impact in 3Q | YTD25 | Scope | Currency Translation | Organic Growth | YTD26 | % Organic |
| Net revenue | (426.5) | (94.3) | 613.8 | - | 93.1 | 0.0% |
| COGS | 224.5 | 86.2 | (366.3) | - | (55.6) | 0.0% |
| COGS excl. deprec. & amort. | 199.7 | 80.8 | (330.7) | - | (50.2) | 0.0% |
| Gross profit | (201.9) | (8.1) | 247.5 | - | 37.5 | 0.0% |
| SG&A excl. deprec. & amort. | 126.9 | 44.5 | (202.1) | - | (30.6) | 0.0% |
| SG&A deprec. & amort. | 13.4 | 0.6 | (16.5) | - | (2.5) | 0.0% |
| SG&A total | 140.3 | 45.1 | (218.6) | - | (33.1) | 0.0% |
| Other operating income/(expenses) | (0.8) | (0.3) | 1.3 | - | 0.2 | 0.0% |
| Normalized Operating Profit | (62.4) | 36.7 | 30.3 | - | 4.6 | 0.0% |
| Normalized EBITDA | (100.7) | 30.8 | 82.4 | - | 12.5 | 0.0% |
| LAS 3M, 6M Recalculation Impact in YTD | YTD25 | Scope | Currency Translation | Organic Growth | YTD26 | % Organic |
| Net revenue | (711.2) | (155.9) | 888.0 | - | 20.9 | |
| COGS | 373.6 | 128.0 | (517.3) | - | (15.8) | |
| COGS excl. deprec. & amort. | 335.4 | 120.0 | (469.1) | - | (13.7) | |
| Gross profit | (337.6) | (28.0) | 370.7 | - | 5.1 | |
| SG&A excl. deprec. & amort. | 203.4 | 66.2 | (279.8) | - | (10.2) | |
| SG&A deprec. & amort. | 19.6 | 1.7 | (22.3) | - | (1.0) | |
| SG&A total | 223.0 | 67.9 | (302.1) | - | (11.1) | |
| Other operating income/(expenses) | (1.6) | (0.8) | 2.4 | - | (0.1) | |
| Normalized Operating Profit | (116.2) | 39.2 | 70.9 | - | (6.1) | |
| Normalized EBITDA | (174.1) | 29.5 | 141.5 | - | (3.1) |
For FY26, the definition of organic revenue growth has been amended to cap the price growth in Argentina to a maximum of 2% per month (26.8% year-over-year, and three-year cumulative of 100%). For COGS and distribution expenses, the same price rate cap applies, calculated on a “per hectoliter” basis when applicable. For other income statement lines disclosed, organic growth is calculated pro rata to the capped net revenue growth. Such calculation method applies to amounts in local currency that are then converted from ARS (capped) to BRL using the applicable closing rate, and corresponding adjustments are made through scope changes when triggered.
ambev.com.br | Press Release – October 29, 2026 |
Page | 21 | |
RECONCILIATION BETWEEN NORMALIZED EBITDA & PROFIT
Normalized EBITDA, Normalized Operating Profit and Normalized Profit are measures used by Ambev’s management to measure the Company’s performance.
Normalized EBITDA is calculated excluding from Profit the following effects: (i) Non-controlling interest; (ii) Income Tax expense; (iii) Share of results of associates; (iv) Net finance results; (v) Exceptional items; and (vi) Depreciation & Amortization.
EBITDA is calculated excluding from Normalized EBITDA the following effects: (i) Exceptional items and (ii) Share of results of associates.
EBITDA, Normalized Operating Profit and Normalized Profit are not accounting measures under accounting practices in Brazil, IFRS or the United States of America (US GAAP) and should not be considered as an alternative to Profit as a measure of operational performance or an alternative to Cash Flow as a measure of liquidity. Normalized EBITDA, Normalized Operating Profit and Normalized Profit do not have a standard calculation method and Ambev’s definition of Normalized EBITDA, Normalized Operating Profit and Normalized Profit may not be comparable to that of other companies.
| Reconciliation - Profit to EBITDA[14] | 3Q25 | 3Q26 | YTD25 | YTD26 |
| R$ million | ||||
| Attributable to equity holders of Ambev | 4,745.1 | 4,245.4 | 11,156.8 | 11,400.6 |
| Attributable to Non-controlling interest | 118.6 | 120.9 | 302.1 | 326.0 |
| Profit | 4,863.7 | 4,366.3 | 11,458.9 | 11,726.6 |
| Exceptional items above EBITDA | (845.5) | 43.0 | (772.9) | 37.3 |
| Exceptional items below EBITDA | (175.1) | (15.7) | (190.0) | (45.2) |
| Normalized Profit | 3,843.1 | 4,393.6 | 10,496.0 | 11,718.7 |
| Exceptional items above EBITDA | 845.5 | (43.0) | 772.9 | (37.3) |
| Exceptional items below EBITDA | 175.1 | 15.7 | 190.0 | 45.2 |
| Income tax expense | 350.2 | 882.1 | 2,031.0 | 2,792.5 |
| Profit before taxes | 5,213.9 | 5,248.4 | 13,489.9 | 14,519.1 |
| Share of results of associates and joint ventures | 5.4 | (22.8) | 8.1 | (33.4) |
| Net finance results | 1,086.0 | 312.4 | 2,916.4 | 1,855.0 |
| Exceptional items above EBITDA | (845.5) | 43.0 | (772.9) | 37.3 |
| Normalized Operating Profit | 5,459.8 | 5,581.0 | 15,641.5 | 16,378.1 |
| Depreciation & amortization - total | 1,599.3 | 1,689.8 | 5,015.0 | 4,824.5 |
| Normalized EBITDA | 7,059.1 | 7,270.9 | 20,656.5 | 21,202.5 |
| Exceptional items above EBITDA | 845.5 | (43.0) | 772.9 | (37.3) |
| Share of results of joint ventures | (5.4) | 22.8 | (8.1) | 33.4 |
| EBITDA | 7,899.2 | 7,250.7 | 21,421.3 | 21,198.6 |
ambev.com.br | Press Release – October 29, 2026 |
Page | 22 | |
RECONCILIATION OF NET FINANCE RESULTS BETWEEN INTERIM CONSOLIDATED FINANCIAL STATEMENTS AND PRESS RELEASE
Net finance results presented on page 12 are a summarized view used by Ambev’s management to measure and analyze the Company’s financial performance. The reconciliation between such summarized view and Interim Consolidated Financial Statements is presented below:
| Reconciliation - Net finance results | 3Q25 | 3Q26 | YTD25 | YTD26 |
| R$ million | ||||
| Income from cash and cash equivalents | 271.7 | 299.3 | 863.3 | 997.5 |
| Income from debt securities | 45.5 | 80.3 | 126.0 | 212.9 |
| Income from other receivables | 72.5 | 247.3 | 462.0 | 612.5 |
| Interest income | 389.7 | 627.0 | 1,451.4 | 1,822.9 |
| Interest on accounts payable present value adjustment | (271.9) | (343.0) | (817.4) | (990.4) |
| Interest on bank debts and tax incentives | (42.3) | (38.1) | (129.9) | (125.2) |
| Interest on leases | (67.0) | (63.9) | (188.6) | (204.8) |
| Other interest expenses | (106.8) | (115.4) | (363.3) | (314.2) |
| Interest expenses | (488.0) | (560.3) | (1,499.1) | (1,634.6) |
| Losses on hedging instruments | (283.1) | (207.9) | (837.8) | (912.7) |
| Gains/(losses) on derivative instruments | (283.1) | (207.9) | (837.8) | (912.7) |
| Exchange differences, net | (524.1) | 151.7 | (1,539.4) | (295.6) |
| Gains/(losses) on non-derivative instruments | (524.1) | 151.7 | (1,539.4) | (295.6) |
| Taxes on financial transactions | (97.5) | (46.1) | (217.3) | (152.0) |
| Taxes on financial transactions | (97.5) | (46.1) | (217.3) | (152.0) |
| Interest on provisions for disputes and litigation | (204.7) | (71.9) | (292.6) | (134.7) |
| Interest on pension plans | (27.0) | (28.4) | (82.3) | (86.6) |
| Bank guarantee expenses and surety bond premiums | (42.8) | (78.1) | (213.2) | (264.0) |
| Other net financial income/(expenses) | 210.4 | (74.3) | 359.1 | (202.0) |
| Other net financial income/(expenses) | (64.0) | (252.6) | (228.9) | (687.3) |
| Effects of the application of IAS 29 (hyperinflation) | (19.0) | (24.1) | (45.2) | 4.2 |
| Hyperinflation Argentina | (19.0) | (24.1) | (45.2) | 4.2 |
| Net finance results | (1,086.0) | (312.4) | (2,916.4) | (1,855.0) |
[14] Exceptional items below EBITDA correspond to the exceptional items that impacted net financing costs and income tax expenses.
ambev.com.br | Press Release – October 29, 2026 |
Page | 23 | |
SHARE BUYBACK PROGRAM
On October 28th, 2026, our Board of Directors approved a Share Buyback Program for the repurchase of shares issued by the Company up to the limit of 190,000,000 common shares (“Program”), with the primary purpose of cancellation of such shares. Any remaining shares may be held in treasury, transferred and/or delivered under the Company's share-based payment plans. The Program will remain in effect until April 28, 2028.
Additional information about the Program is available to shareholders on the websites of the Brazilian Securities and Exchange Commission (https://www.gov.br/cvm/en?set_language=en), B3 S.A. - Brasil, Bolsa, Balcão (https://www.b3.com.br/en_us/) and the Company (https://ri.ambev.com.br/en/).
ambev.com.br | Press Release – October 29, 2026 |
Page | 24 | |
3Q 2026 EARNINGS CONFERENCE CALL
| Speakers: | Carlos Lisboa |
| Chief Executive Officer | |
| Guilherme Fleury | |
| Chief Financial and Investor Relations Officer | |
| Language: | English and Portuguese (simultaneous translation) |
| Date: | October 29th, 2026 (Thursday) |
| Time: | 12:30 (Brasília) |
| 11:30 (New York) |
The conference call will be transmitted live via webcast available at:
English: Webcast - English
Portuguese: Webcast - Portuguese
Sell side analysts covering the company as indicated in our website can participate and apply for Q&A by clicking here.
For additional information, please contact the Investor Relations team:
| Patrick Conrad | Elisa Moukarzel Sbardelini | Leandro Ferreira De Souza |
| patrick.conrad@ambev.com.br | elisa.sbardelini@ambev.com.br | leandro.ferreira.souza@ambev.com.br |
ri.ambev.com.br
ambev.com.br | Press Release – October 29, 2026 |
Page | 25 | |
NOTES
This press release segregates the impact of organic changes from those arising from changes in scope or currency translation. Scope changes represent the impact of acquisitions and divestitures, the start-up or termination of activities or the transfer of activities between segments, curtailment gains and losses and year-over-year changes in accounting estimates and other assumptions that management does not consider as part of the underlying performance of the business. Organic growth and normalized numbers are presented applying constant year-over-year exchange rates to exclude the impact of the movement of foreign exchange rates.
Whenever used in this document, terms referring to percentage changes are intended to simplify the reader’s understanding and correspond to the following ranges, regardless of whether the variance is positive or negative: flat (0.0 - 0.1%); low-single digit (LSD: 0.2 - 3.3%); mid-single digit (MSD: 3.4 - 6.6%); high-single digit (HSD: 6.7 - 9.9%); double-digit (10.0 - 19.9%); low-teens (10.1 - 13.3%); mid-teens (13.4 - 16.6%); high-teens (16.7 - 19.9%); twenties (20.0 - 29.9%); low-twenties (20.1 – 23.3%); mid-twenties (23.4 – 26.6%); high-twenties (26.7 – 29.9%). For higher percentages that exceed the prior defined ranges, the same classification logic shall be applied accordingly.
Whenever used in this document, the term "nm" refers to "not meaningful" and is intended to facilitate readability. It is used when the percentage variation exceeds 200% or is below -200%, or when the values compared have opposite signs between periods.
Unless stated, percentage changes in this press release are both organic and normalized in nature. Whenever used in this document, the term “normalized” refers to performance measures EBITDA and Operating Profit before exceptional items and share of results of joint ventures and to performance measures Profit and EPS before exceptional items adjustments. Exceptional items are either income or expenses which do not occur regularly as part of the normal activities of the Company. They are presented separately because they are important for the understanding of the underlying sustainable performance of the Company due to their size or nature. Normalized measures are additional measures used by management and should not replace the measures determined in accordance with IFRS as indicators of the Company’s performance. Comparisons, unless otherwise stated, refer to the third quarter of 2025 (3Q25). Values in this release may not add up due to rounding.
Statements contained in this press release may contain information that is forward-looking and reflects management’s current view and estimates of future economic circumstances, industry conditions, Company performance, and finance results. Any statements, expectations, capabilities, plans and assumptions contained in this press release that do not describe historical facts, such as statements regarding the declaration or payment of dividends, the direction of future operations, the implementation of principal operating and financing strategies and capital expenditure plans, the factors or trends affecting financial condition, liquidity or results of operations, are forward-looking statements within the meaning of the U.S. Private Securities Litigation Reform Act of 1995 and involve a number of risks and uncertainties. There is no guarantee that these results will occur. The statements are based on many assumptions and factors, including general economic and market conditions, industry conditions, and operating factors. Any changes in such assumptions or factors could cause actual results to differ materially from current expectations.
ambev.com.br | Press Release – October 29, 2026 |
Page | 26 | |
| Ambev - EBITDA to Normalized EBITDA Reconciliation by Segment | Brazil | CAC | LAS | Canada | Ambev | ||||||||||||||||
| Organic results | Beer | NAB | Total | Consolidated | |||||||||||||||||
| 3Q25 | 3Q26 | % | 3Q25 | 3Q26 | % | 3Q25 | 3Q26 | % | 3Q25 | 3Q26 | % | 3Q25 | 3Q26 | % | 3Q25 | 3Q26 | % | 3Q25 | 3Q26 | % | |
| EBITDA | 3,385.2 | 3,536.8 | 1.1% | 587.4 | 623.0 | 2.6% | 3,972.5 | 4,159.8 | 1.1% | 2,109.8 | 1,221.8 | -37.2% | 959.4 | 1,061.6 | 45.1% | 857.5 | 807.5 | 3.1% | 7,899.2 | 7,250.7 | -3.0% |
| % of total | 42.9% | 48.8% | 7.4% | 8.6% | 50.3% | 57.4% | 26.7% | 16.9% | 12.1% | 14.6% | 10.9% | 11.1% | 100.0% | 100.0% | |||||||
| Exceptional items | -3.8 | -8.0 | 109.4% | - | - | 0.0% | -3.8 | -8.0 | 109.4% | 883.0 | -13.0 | nm | -33.9 | -21.5 | -60.9% | 0.2 | -0.5 | nm | 845.5 | -43.0 | nm |
| % of total | -0.4% | 18.5% | 0.0% | 0.0% | -0.4% | 18.5% | 104.4% | 30.3% | -4.0% | 50.1% | 0.0% | 1.1% | 100.0% | 100.0% | |||||||
| Share of results of joint ventures | -5.3 | 2.2 | nm | - | - | 0.0% | -5.3 | 2.2 | nm | - | 20.5 | 0.0% | - | - | 0.0% | -0.1 | - | -100.0% | -5.4 | 22.8 | nm |
| % of total | 98.0% | 9.8% | 0.0% | 0.0% | 98.0% | 9.8% | 0.0% | 90.2% | 0.0% | 0.0% | 2.0% | 0.0% | 100.0% | 100.0% | |||||||
| Normalized EBITDA | 3,394.3 | 3,542.6 | 1.0% | 587.4 | 623.0 | 2.6% | 3,981.6 | 4,165.5 | 1.2% | 1,226.8 | 1,214.2 | 11.4% | 993.3 | 1,083.2 | 41.5% | 857.4 | 808.0 | 3.2% | 7,059.1 | 7,270.9 | 8.9% |
| % of total | 48.1% | 48.7% | 8.3% | 8.6% | 56.4% | 57.3% | 17.4% | 16.7% | 14.1% | 14.9% | 12.1% | 11.1% | 100.0% | 100.0% | |||||||
| Ambev - EBITDA to Normalized EBITDA Reconciliation by Segment | Brazil | CAC | LAS | Canada | Ambev | ||||||||||||||||
| Organic results | Beer | NAB | Total | Consolidated | |||||||||||||||||
| YTD25 | YTD26 | % | YTD25 | YTD26 | % | YTD25 | YTD26 | % | YTD25 | YTD26 | % | YTD25 | YTD26 | % | YTD25 | YTD26 | % | YTD25 | YTD26 | % | |
| EBITDA | 9,865.8 | 10,651.4 | 7.0% | 1,753.6 | 1,958.7 | 11.0% | 11,619.4 | 12,610.1 | 7.6% | 4,396.9 | 3,296.4 | -11.3% | 3,148.4 | 3,133.3 | 19.2% | 2,256.6 | 2,158.8 | 4.4% | 21,421.3 | 21,198.6 | 5.3% |
| % of total | 46.1% | 50.2% | 8.2% | 9.2% | 54.2% | 59.5% | 20.5% | 15.5% | 14.7% | 14.8% | 10.5% | 10.2% | 100.0% | 100.0% | |||||||
| Exceptional items | -21.1 | -18.9 | 6.9% | - | - | 0.0% | -21.1 | -18.9 | -10.2% | 878.2 | 66.8 | -91.7% | -68.3 | -82.7 | 29.1% | -15.9 | -2.6 | -82.3% | 772.9 | -37.3 | nm |
| % of total | -2.7% | 50.7% | 0.0% | 0.0% | -2.7% | 50.7% | 113.6% | -179.0% | -8.8% | 221.3% | -2.1% | 6.9% | 100.0% | 100.0% | |||||||
| Share of results of joint ventures | -8.1 | -0.7 | -91.1% | - | - | 0.0% | -8.1 | -0.7 | -91.1% | - | 34.2 | 0.0% | - | - | 0.0% | -0.1 | - | -100.0% | -8.1 | 33.4 | nm |
| % of total | 99.1% | -2.2% | 0.0% | 0.0% | 99.1% | -2.2% | 0.0% | 102.2% | 0.0% | 0.0% | 0.9% | 0.0% | 100.0% | 100.0% | |||||||
| Normalized EBITDA | 9,894.9 | 10,671.1 | 6.9% | 1,753.6 | 1,958.7 | 11.0% | 11,648.5 | 12,629.8 | 7.5% | 3,518.7 | 3,195.4 | 9.8% | 3,216.7 | 3,216.0 | 19.4% | 2,272.5 | 2,161.4 | 3.8% | 20,656.5 | 21,202.5 | 9.3% |
| % of total | 47.9% | 50.3% | 8.5% | 9.2% | 56.4% | 59.6% | 17.0% | 15.1% | 15.6% | 15.2% | 11.0% | 10.2% | 100.0% | 100.0% | |||||||
ambev.com.br | Press Release – October 29, 2026 |
Page | 27 | |
| Ambev - Segment financial information | Brazil | CAC | LAS | Canada | Ambev | ||||||||||||||||
| Organic results | Beer | NAB | Total | Consolidated | |||||||||||||||||
| 3Q25 | 3Q26 | % | 3Q25 | 3Q26 | % | 3Q25 | 3Q26 | % | 3Q25 | 3Q26 | % | 3Q25 | 3Q26 | % | 3Q25 | 3Q26 | % | 3Q25 | 3Q26 | % | |
| Volume ('000 hl) | 21,556.8 | 21,673.4 | 0.5% | 7,760.2 | 8,040.6 | 3.6% | 29,316.9 | 29,713.9 | 1.4% | 3,097.6 | 2,796.3 | 2.3% | 7,605.1 | 7,498.9 | -1.4% | 2,399.6 | 2,376.0 | -1.0% | 42,419.2 | 42,385.0 | 0.8% |
| R$ million | |||||||||||||||||||||
| Net revenue | 9,677.2 | 10,138.9 | 4.8% | 2,083.1 | 2,213.8 | 6.3% | 11,760.3 | 12,352.7 | 5.0% | 2,738.9 | 2,565.7 | 8.1% | 3,491.9 | 4,037.5 | 21.4% | 2,856.1 | 2,638.6 | 1.2% | 20,847.3 | 21,594.6 | 7.6% |
| % of total | 46.4% | 47.0% | 10.0% | 10.3% | 56.4% | 57.2% | 13.1% | 11.9% | 16.8% | 18.7% | 13.7% | 12.2% | 100.0% | 100.0% | |||||||
| COGS | (4,749.7) | (4,991.8) | 5.1% | (1,151.1) | (1,232.5) | 7.1% | (5,900.8) | (6,224.2) | 5.5% | (1,208.9) | (1,072.3) | 4.1% | (1,808.6) | (2,187.4) | 14.0% | (1,201.7) | (1,104.4) | 0.7% | (10,120.0) | (10,588.3) | 6.3% |
| % of total | 46.9% | 47.1% | 11.4% | 11.6% | 58.3% | 58.8% | 11.9% | 10.1% | 17.9% | 20.7% | 11.9% | 10.4% | 100.0% | 100.0% | |||||||
| Gross profit | 4,927.5 | 5,147.2 | 4.5% | 932.0 | 981.3 | 5.3% | 5,859.6 | 6,128.5 | 4.6% | 1,530.0 | 1,493.3 | 11.1% | 1,683.3 | 1,850.2 | 29.2% | 1,654.4 | 1,534.3 | 1.6% | 10,727.3 | 11,006.3 | 8.9% |
| % of total | 45.9% | 46.8% | 8.7% | 8.9% | 54.6% | 55.7% | 14.3% | 13.6% | 15.7% | 16.8% | 15.4% | 13.9% | 100.0% | 100.0% | |||||||
| SG&A | (2,912.0) | (3,136.4) | 7.7% | (543.8) | (544.3) | 0.1% | (3,455.8) | (3,680.7) | 6.5% | (490.3) | (446.0) | 4.6% | (961.9) | (1,092.5) | 10.1% | (926.6) | (889.2) | 5.2% | (5,834.6) | (6,108.4) | 6.7% |
| % of total | 49.9% | 51.3% | 9.3% | 8.9% | 59.2% | 60.3% | 8.4% | 7.3% | 16.5% | 17.9% | 15.9% | 14.6% | 100.0% | 100.0% | |||||||
| Other operating income/(expenses) | 467.1 | 556.5 | -5.2% | 98.8 | 108.7 | -10.8% | 565.9 | 665.2 | -6.2% | 5.8 | 1.4 | -75.3% | 15.8 | 13.8 | -12.1% | (20.3) | 2.8 | nm | 567.1 | 683.2 | -3.3% |
| % of total | 82.4% | 81.5% | 17.4% | 15.9% | 99.8% | 97.4% | 1.0% | 0.2% | 2.8% | 2.0% | -3.6% | 0.4% | 100.0% | 100.0% | |||||||
| Normalized Operating Profit | 2,482.6 | 2,567.3 | -1.2% | 487.0 | 545.7 | 7.8% | 2,969.6 | 3,113.1 | 0.3% | 1,045.5 | 1,048.7 | 13.5% | 737.2 | 771.4 | 53.3% | 707.5 | 647.8 | 0.3% | 5,459.8 | 5,581.0 | 9.9% |
| % of total | 45.5% | 46.0% | 8.9% | 9.8% | 54.4% | 55.8% | 19.1% | 18.8% | 13.5% | 13.8% | 13.0% | 11.6% | 100.0% | 100.0% | |||||||
| Normalized EBITDA | 3,394.3 | 3,542.6 | 1.0% | 587.4 | 623.0 | 2.6% | 3,981.6 | 4,165.5 | 1.2% | 1,226.8 | 1,214.2 | 11.4% | 993.3 | 1,083.2 | 41.5% | 857.4 | 808.0 | 3.2% | 7,059.1 | 7,270.9 | 8.9% |
| % of total | 48.1% | 48.7% | 8.3% | 8.6% | 56.4% | 57.3% | 17.4% | 16.7% | 14.1% | 14.9% | 12.1% | 11.1% | 100.0% | 100.0% | |||||||
| % of net revenue | |||||||||||||||||||||
| Net revenue | 100.0% | 100.0% | 100.0% | 100.0% | 100.0% | 100.0% | 100.0% | 100.0% | 100.0% | 100.0% | 100.0% | 100.0% | 100.0% | 100.0% | |||||||
| COGS | -49.1% | -49.2% | -55.3% | -55.7% | -50.2% | -50.4% | -44.1% | -41.8% | -51.8% | -54.2% | -42.1% | -41.9% | -48.5% | -49.0% | |||||||
| Gross profit | 50.9% | 50.8% | 44.7% | 44.3% | 49.8% | 49.6% | 55.9% | 58.2% | 48.2% | 45.8% | 57.9% | 58.1% | 51.5% | 51.0% | |||||||
| SG&A | -30.1% | -30.9% | -26.1% | -24.6% | -29.4% | -29.8% | -17.9% | -17.4% | -27.5% | -27.1% | -32.4% | -33.7% | -28.0% | -28.3% | |||||||
| Other operating income/(expenses) | 4.8% | 5.5% | 4.7% | 4.9% | 4.8% | 5.4% | 0.2% | 0.1% | 0.5% | 0.3% | -0.7% | 0.1% | 2.7% | 3.2% | |||||||
| Normalized Operating Profit | 25.7% | 25.3% | 23.4% | 24.7% | 25.3% | 25.2% | 38.2% | 40.9% | 21.1% | 19.1% | 24.8% | 24.6% | 26.2% | 25.8% | |||||||
| Normalized EBITDA | 35.1% | 34.9% | 28.2% | 28.1% | 33.9% | 33.7% | 44.8% | 47.3% | 28.4% | 26.8% | 30.0% | 30.6% | 33.9% | 33.7% | |||||||
| Per hectoliter - (R$/hl) | |||||||||||||||||||||
| Net revenue | 448.9 | 467.8 | 4.2% | 268.4 | 275.3 | 2.6% | 401.1 | 415.7 | 3.6% | 884.2 | 917.5 | 5.7% | 459.2 | 538.4 | 23.1% | 1,190.2 | 1,110.6 | 2.2% | 491.5 | 509.5 | 6.8% |
| COGS | (220.3) | (230.3) | 4.5% | (148.3) | (153.3) | 3.3% | (201.3) | (209.5) | 4.1% | (390.3) | (383.5) | 1.8% | (237.8) | (291.7) | 15.7% | (500.8) | (464.8) | 1.7% | (238.6) | (249.8) | 5.5% |
| Gross profit | 228.6 | 237.5 | 3.9% | 120.1 | 122.0 | 1.6% | 199.9 | 206.2 | 3.2% | 493.9 | 534.0 | 8.7% | 221.3 | 246.7 | 31.0% | 689.4 | 645.7 | 2.6% | 252.9 | 259.7 | 8.1% |
| SG&A | (135.1) | (144.7) | 7.1% | (70.1) | (67.7) | -3.4% | (117.9) | (123.9) | 5.1% | (158.3) | (159.5) | 2.3% | (126.5) | (145.7) | 11.6% | (386.1) | (374.2) | 6.2% | (137.5) | (144.1) | 5.9% |
| Other operating income/(expenses) | 21.7 | 25.7 | -5.7% | 12.7 | 13.5 | -13.9% | 19.3 | 22.4 | -7.4% | 1.9 | 0.5 | -75.9% | 2.1 | 1.8 | -10.9% | (8.5) | 1.2 | nm | 13.4 | 16.1 | -4.0% |
| Normalized Operating Profit | 115.2 | 118.5 | -1.7% | 62.8 | 67.9 | 4.1% | 101.3 | 104.8 | -1.0% | 337.5 | 375.0 | 11.0% | 96.9 | 102.9 | 55.5% | 294.8 | 272.7 | 1.3% | 128.7 | 131.7 | 9.1% |
| Normalized EBITDA | 157.5 | 163.5 | 0.5% | 75.7 | 77.5 | -1.0% | 135.8 | 140.2 | -0.1% | 396.0 | 434.2 | 8.9% | 130.6 | 144.4 | 43.5% | 357.3 | 340.1 | 4.3% | 166.4 | 171.5 | 8.0% |
ambev.com.br | Press Release – October 29, 2026 |
Page | 28 | |
| Ambev - Segment financial information | Brazil | CAC | LAS | Canada | Ambev | ||||||||||||||||
| Organic results | Beer | NAB | Total | Consolidated | |||||||||||||||||
| YTD25 | YTD26 | % | YTD25 | YTD26 | % | YTD25 | YTD26 | % | YTD25 | YTD26 | % | YTD25 | YTD26 | % | YTD25 | YTD26 | % | YTD25 | YTD26 | % | |
| Volume ('000 hl) | 64,757.8 | 66,138.1 | 2.1% | 24,657.1 | 24,239.5 | -1.7% | 89,414.9 | 90,377.6 | 1.1% | 8,772.7 | 8,015.7 | 5.0% | 22,596.5 | 22,265.4 | -1.5% | 6,522.2 | 6,422.3 | -1.5% | 127,306.2 | 127,080.9 | 0.7% |
| R$ million | |||||||||||||||||||||
| Net revenue | 28,667.6 | 30,890.0 | 7.8% | 6,368.9 | 6,568.9 | 3.1% | 35,036.5 | 37,458.9 | 6.9% | 8,180.4 | 7,128.4 | 8.3% | 12,323.2 | 12,299.8 | 11.8% | 7,894.7 | 7,320.9 | 1.2% | 63,434.8 | 64,208.0 | 7.3% |
| % of total | 45.2% | 48.1% | 10.0% | 10.2% | 55.2% | 58.3% | 12.9% | 11.1% | 19.4% | 19.2% | 12.4% | 11.4% | 100.0% | 100.0% | |||||||
| COGS | (13,870.5) | (15,038.7) | 8.4% | (3,618.3) | (3,526.7) | -2.5% | (17,488.8) | (18,565.4) | 6.2% | (3,711.1) | (3,017.4) | 2.7% | (6,586.3) | (6,546.3) | 7.2% | (3,325.7) | (3,041.2) | -0.2% | (31,111.9) | (31,170.3) | 5.3% |
| % of total | 44.6% | 48.2% | 11.6% | 11.3% | 56.2% | 59.6% | 11.9% | 9.7% | 21.2% | 21.0% | 10.7% | 9.8% | 100.0% | 100.0% | |||||||
| Gross profit | 14,797.1 | 15,851.3 | 7.1% | 2,750.6 | 3,042.3 | 10.6% | 17,547.7 | 18,893.6 | 7.7% | 4,469.3 | 4,111.0 | 12.8% | 5,736.9 | 5,753.4 | 17.1% | 4,569.1 | 4,279.6 | 2.2% | 32,323.0 | 33,037.6 | 9.2% |
| % of total | 45.8% | 48.0% | 8.5% | 9.2% | 54.3% | 57.2% | 13.8% | 12.4% | 17.7% | 17.4% | 14.1% | 13.0% | 100.0% | 100.0% | |||||||
| SG&A | (9,055.3) | (9,684.7) | 6.9% | (1,656.7) | (1,664.3) | 0.5% | (10,712.0) | (11,349.0) | 5.9% | (1,555.5) | (1,361.9) | 9.4% | (3,448.9) | (3,450.3) | 12.0% | (2,733.1) | (2,546.8) | 1.7% | (18,449.7) | (18,708.0) | 6.7% |
| % of total | 49.1% | 51.8% | 9.0% | 8.9% | 58.1% | 60.7% | 8.4% | 7.3% | 18.7% | 18.4% | 14.8% | 13.6% | 100.0% | 100.0% | |||||||
| Other operating income/(expenses) | 1,387.7 | 1,685.4 | 14.8% | 353.7 | 325.4 | -12.4% | 1,741.4 | 2,010.8 | 9.2% | 2.9 | (11.4) | nm | 32.2 | 34.8 | 14.6% | (8.3) | 14.2 | nm | 1,768.2 | 2,048.4 | 9.5% |
| % of total | 78.5% | 82.3% | 20.0% | 15.9% | 98.5% | 98.2% | 0.2% | -0.6% | 1.8% | 1.7% | -0.5% | 0.7% | 100.0% | 100.0% | |||||||
| Normalized Operating Profit | 7,129.5 | 7,852.1 | 8.8% | 1,447.6 | 1,703.4 | 16.8% | 8,577.1 | 9,555.4 | 10.1% | 2,916.6 | 2,737.7 | 13.8% | 2,320.2 | 2,338.0 | 24.5% | 1,827.6 | 1,746.9 | 4.3% | 15,641.5 | 16,378.1 | 12.3% |
| % of total | 45.6% | 47.9% | 9.3% | 10.4% | 54.8% | 58.3% | 18.6% | 16.7% | 14.8% | 14.3% | 11.7% | 10.7% | 100.0% | 100.0% | |||||||
| Normalized EBITDA | 9,894.9 | 10,671.1 | 6.9% | 1,753.6 | 1,958.7 | 11.0% | 11,648.5 | 12,629.8 | 7.5% | 3,518.7 | 3,195.4 | 9.8% | 3,216.7 | 3,216.0 | 19.4% | 2,272.5 | 2,161.4 | 3.8% | 20,656.5 | 21,202.5 | 9.3% |
| % of total | 47.9% | 50.3% | 8.5% | 9.2% | 56.4% | 59.6% | 17.0% | 15.1% | 15.6% | 15.2% | 11.0% | 10.2% | 100.0% | 100.0% | |||||||
| % of net revenue | |||||||||||||||||||||
| Net revenue | 100.0% | 100.0% | 100.0% | 100.0% | 100.0% | 100.0% | 100.0% | 100.0% | 100.0% | 100.0% | 100.0% | 100.0% | 100.0% | 100.0% | |||||||
| COGS | -48.4% | -48.7% | -56.8% | -53.7% | -49.9% | -49.6% | -45.4% | -42.3% | -53.4% | -53.2% | -42.1% | -41.5% | -49.0% | -48.5% | |||||||
| Gross profit | 51.6% | 51.3% | 43.2% | 46.3% | 50.1% | 50.4% | 54.6% | 57.7% | 46.6% | 46.8% | 57.9% | 58.5% | 51.0% | 51.5% | |||||||
| SG&A | -31.6% | -31.4% | -26.0% | -25.3% | -30.6% | -30.3% | -19.0% | -19.1% | -28.0% | -28.1% | -34.6% | -34.8% | -29.1% | -29.1% | |||||||
| Other operating income/(expenses) | 4.8% | 5.5% | 5.6% | 5.0% | 5.0% | 5.4% | 0.0% | -0.2% | 0.3% | 0.3% | -0.1% | 0.2% | 2.8% | 3.2% | |||||||
| Normalized Operating Profit | 24.9% | 25.4% | 22.7% | 25.9% | 24.5% | 25.5% | 35.7% | 38.4% | 18.8% | 19.0% | 23.1% | 23.9% | 24.7% | 25.5% | |||||||
| Normalized EBITDA | 34.5% | 34.5% | 27.5% | 29.8% | 33.2% | 33.7% | 43.0% | 44.8% | 26.1% | 26.1% | 28.8% | 29.5% | 32.6% | 33.0% | |||||||
| Per hectoliter - (R$/hl) | |||||||||||||||||||||
| Net revenue | 442.7 | 467.1 | 5.5% | 258.3 | 271.0 | 4.9% | 391.8 | 414.5 | 5.8% | 932.5 | 889.3 | 3.2% | 545.4 | 552.4 | 13.5% | 1,210.4 | 1,139.9 | 2.8% | 498.3 | 505.3 | 6.6% |
| COGS | (214.2) | (227.4) | 6.2% | (146.7) | (145.5) | -0.9% | (195.6) | (205.4) | 5.0% | (423.0) | (376.4) | -2.2% | (291.5) | (294.0) | 8.8% | (509.9) | (473.5) | 1.4% | (244.4) | (245.3) | 4.6% |
| Gross profit | 228.5 | 239.7 | 4.9% | 111.6 | 125.5 | 12.5% | 196.3 | 209.1 | 6.5% | 509.5 | 512.9 | 7.4% | 253.9 | 258.4 | 18.8% | 700.5 | 666.4 | 3.8% | 253.9 | 260.0 | 8.4% |
| SG&A | (139.8) | (146.4) | 4.7% | (67.2) | (68.7) | 2.2% | (119.8) | (125.6) | 4.8% | (177.3) | (169.9) | 4.2% | (152.6) | (155.0) | 13.7% | (419.1) | (396.6) | 3.3% | (144.9) | (147.2) | 6.0% |
| Other operating income/(expenses) | 21.4 | 25.5 | 12.4% | 14.3 | 13.4 | -10.9% | 19.5 | 22.2 | 8.0% | 0.3 | (1.4) | nm | 1.4 | 1.6 | 16.3% | (1.3) | 2.2 | nm | 13.9 | 16.1 | 8.7% |
| Normalized Operating Profit | 110.1 | 118.7 | 6.5% | 58.7 | 70.3 | 18.8% | 95.9 | 105.7 | 9.0% | 332.5 | 341.5 | 8.4% | 102.7 | 105.0 | 26.4% | 280.2 | 272.0 | 6.0% | 122.9 | 128.9 | 11.5% |
| Normalized EBITDA | 152.8 | 161.3 | 4.6% | 71.1 | 80.8 | 12.9% | 130.3 | 139.7 | 6.3% | 401.1 | 398.6 | 4.6% | 142.4 | 144.4 | 21.2% | 348.4 | 336.5 | 5.4% | 162.3 | 166.8 | 8.5% |
ambev.com.br | Press Release – October 29, 2026 |
Page | 29 | |
| CONSOLIDATED BALANCE SHEET | ||
| R$ million | December 31, 2025 | September 30, 2026 |
| Assets | ||
| Current assets | ||
| Cash and cash equivalents | 18,638.2 | 19,188.2 |
| Investment securities | 1,681.7 | 2,725.9 |
| Trade receivables | 6,351.6 | 6,254.0 |
| Derivative financial instruments | 769.2 | 689.6 |
| Inventories | 10,520.1 | 9,982.8 |
| Recoverable taxes | 3,623.4 | 1,680.7 |
| Other assets | 1,911.9 | 2,384.2 |
| Assets held for sale | 379.4 | 247.7 |
| 43,875.6 | 43,153.0 | |
| Non-current assets | ||
| Investment securities | 123.3 | 90.9 |
| Derivative financial instruments | 8.9 | 1.9 |
| Recoverable taxes | 10,149.1 | 10,987.4 |
| Deferred tax assets | 8,404.4 | 8,542.2 |
| Other assets | 1,784.7 | 1,811.6 |
| Employee benefits | 29.9 | 23.9 |
| Long term assets | 20,500.4 | 21,457.9 |
| Investments in associates and joint ventures | 485.8 | 1,166.9 |
| Property, plant and equipment | 27,644.3 | 25,299.8 |
| Intangible assets | 11,042.7 | 10,426.6 |
| Goodwill | 41,538.4 | 40,070.5 |
| 101,211.6 | 98,421.7 | |
| Total assets | 145,087.2 | 141,574.7 |
| Equity and liabilities | ||
| Current liabilities | ||
| Trade payables | 23,742.8 | 21,176.1 |
| Derivative financial instruments | 925.1 | 894.3 |
| Interest-bearing loans and borrowing | 1,167.3 | 997.1 |
| Payroll and social security payables | 2,200.7 | 2,505.0 |
| Dividends and interest on capital payables | 4,927.8 | 4,119.7 |
| Income tax and social contribution payable | 1,437.3 | 1,076.2 |
| Taxes and contributions payable | 6,003.1 | 4,457.4 |
| Other liabilities, including obligations related to the acquisition of non-controlling interest | 4,623.7 | 4,836.6 |
| Provisions | 571.4 | 662.4 |
| 45,599.3 | 40,724.7 | |
| Non-current liabilities | ||
| Trade payables | 313.0 | 230.0 |
| Derivative financial instruments | 0.3 | 1.1 |
| Interest-bearing loans and borrowing | 2,219.6 | 1,717.7 |
| Deferred tax liabilities | 3,912.3 | 3,793.4 |
| Income tax and social contribution payable | 713.6 | 498.5 |
| Taxes and contributions payable | 659.7 | 695.3 |
| Other liabilities | 4.3 | 3.7 |
| Provisions | 877.7 | 723.0 |
| Employee benefits | 2,012.7 | 1,745.4 |
| 10,713.1 | 9,408.1 | |
| Total liabilities | 56,312.4 | 50,132.8 |
| Equity | ||
| Issued capital | 58,275.1 | 58,308.1 |
| Reserves | 108,003.5 | 104,939.2 |
| Carrying value adjustments | (78,364.5) | (83,543.9) |
| Retained earnings/(losses) | - | 11,192.3 |
| Equity attributable to Ambev’s shareholders | 87,914.0 | 90,895.7 |
| Non-controlling interest | 860.7 | 546.2 |
| Total Equity | 88,774.8 | 91,441.9 |
| Total equity and liabilities | 145,087.2 | 141,574.7 |
ambev.com.br | Press Release – October 29, 2026 |
Page | 30 | |
| CONSOLIDATED INCOME STATEMENT | 3Q25 | 3Q26 | YTD25 | YTD26 |
| R$ million | ||||
| Net revenue | 20,847.3 | 21,594.6 | 63,434.8 | 64,208.0 |
| Cost of goods sold | (10,120.0) | (10,588.3) | (31,111.9) | (31,170.3) |
| Gross profit | 10,727.3 | 11,006.3 | 32,323.0 | 33,037.6 |
| Distribution expenses | (2,559.7) | (2,594.4) | (8,016.7) | (8,064.3) |
| Sales and marketing expenses | (1,919.9) | (2,067.6) | (6,162.7) | (6,405.2) |
| Administrative expenses | (1,355.0) | (1,446.4) | (4,270.2) | (4,238.5) |
| Other operating income/(expenses) | 567.1 | 683.2 | 1,768.2 | 2,048.4 |
| Normalized Operating Profit | 5,459.8 | 5,581.0 | 15,641.5 | 16,378.1 |
| Exceptional items | 845.5 | (43.0) | 772.9 | (37.3) |
| Income from operations | 6,305.3 | 5,538.1 | 16,414.4 | 16,340.7 |
| Net finance results | (1,086.0) | (312.4) | (2,916.4) | (1,855.0) |
| Share of results of joint ventures | (5.4) | 22.8 | (8.1) | 33.4 |
| Profit before income tax | 5,213.9 | 5,248.4 | 13,489.9 | 14,519.1 |
| Income tax expense | (350.2) | (882.1) | (2,031.0) | (2,792.5) |
| Profit | 4,863.7 | 4,366.3 | 11,458.9 | 11,726.6 |
| Equity holders of Ambev | 4,745.1 | 4,245.4 | 11,156.8 | 11,400.6 |
| Non-controlling interest | 118.6 | 120.9 | 302.1 | 326.0 |
| Basic earnings per share (R$) | 0.30 | 0.28 | 0.71 | 0.73 |
| Diluted earnings per share (R$) | 0.30 | 0.27 | 0.71 | 0.73 |
| Normalized Profit | 3,843.1 | 4,393.6 | 10,496.0 | 11,718.7 |
| Normalized basic earnings per share (R$) | 0.24 | 0.28 | 0.65 | 0.73 |
| Normalized diluted earnings per share (R$) | 0.24 | 0.28 | 0.65 | 0.73 |
| Nº of basic shares outstanding (million of shares) | 15,592.3 | 15,417.7 | 15,623.2 | 15,513.8 |
| Nº of diluted shares outstanding (million of shares) | 15,663.9 | 15,476.3 | 15,694.8 | 15,572.4 |
ambev.com.br | Press Release – October 29, 2026 |
Page | 31 | |
| CONSOLIDATED STATEMENT OF CASH FLOWS | 3Q25 | 3Q26 | YTD25 | YTD26 |
| R$ million | ||||
| Net income | 4,863.7 | 4,366.3 | 11,458.9 | 11,726.6 |
| Depreciation, amortization and impairment | 1,599.3 | 1,689.8 | 5,015.0 | 4,824.5 |
| Impairment losses on receivables and inventory | 61.6 | 63.5 | 200.7 | 165.1 |
| Additions to/(reversals of) provisions and employee benefits | 75.2 | 61.1 | 274.8 | 116.7 |
| Net financial results | 1,086.0 | 312.4 | 2,916.4 | 1,855.0 |
| Losses/(gains) on sales of property, plant and equipment and intangible assets | (9.9) | (33.6) | (71.9) | (96.1) |
| Losses/(gains) on sales of operations in subsidiaries and associates | (884.5) | 5.0 | (884.5) | (81.4) |
| Share-based payment expenses | 100.0 | 114.2 | 306.1 | 304.8 |
| Income tax expenses | 350.2 | 882.1 | 2,031.0 | 2,792.5 |
| Share of results of associates and joint ventures | 5.4 | (22.8) | 8.1 | (33.4) |
| Hedge operations | (97.4) | (130.2) | (794.8) | (247.1) |
| Cash flow from operating activities before changes in working capital | 7,149.7 | 7,307.9 | 20,459.7 | 21,327.1 |
| (Increase)/decrease in trade and other receivables | (137.0) | (250.5) | 784.4 | 411.6 |
| (Increase)/decrease in inventories | 519.3 | 262.2 | (35.9) | (200.9) |
| Increase/(decrease) in trade and other payables | 311.3 | 1,051.9 | (6,665.0) | (3,679.7) |
| Cash generated from operations | 7,843.3 | 8,371.5 | 14,543.2 | 17,858.1 |
| Interest paid | (227.9) | (97.2) | (607.2) | (453.1) |
| Interest received | 336.7 | 455.7 | 986.2 | 1,248.3 |
| Dividends received | 15.0 | 27.1 | 22.0 | 139.3 |
| Income tax paid | (1,048.2) | (1,079.3) | (3,745.9) | (3,242.3) |
| Cash flow from operating activities | 6,919.0 | 7,677.9 | 11,198.4 | 15,550.3 |
| Proceeds from sales of property, plant and equipment and intangible assets | 38.4 | 38.6 | 105.1 | 116.7 |
| Acquisitions of property, plant and equipment and intangible assets | (1,043.9) | (1,133.0) | (2,960.3) | (2,479.8) |
| Sale/(acquisition) and others related to subsidiaries and associates, net of cash | 241.8 | 57.3 | 201.6 | (1,894.9) |
| Investments in short-term debt securities and net proceeds/(acquisitions) of debt securities | (411.3) | (1,045.8) | (268.9) | (1,093.0) |
| Net proceeds/(acquisitions) of other assets | 5.0 | (0.7) | 6.7 | (1.1) |
| Cash flow from/(used in) investing activities | (1,170.0) | (2,083.7) | (2,915.7) | (5,352.0) |
| Capital increases(reduction)/ in associates and subsidiaries | 0.0 | 64.4 | (3.7) | 35.6 |
| Proceeds from/(buybacks of) treasury shares | - | (680.4) | (1,831.1) | (3,333.0) |
| Acquisitions of non-controlling interest | - | - | (0.0) | - |
| Proceeds from borrowing | (41.2) | 14.9 | 9.5 | 40.6 |
| Repayments of borrowing | (39.8) | (30.3) | (131.2) | (133.6) |
| Cash net of finance costs other than interest | (807.5) | (735.8) | (2,457.6) | (1,910.2) |
| Payments of lease liabilities | (253.0) | (272.3) | (847.2) | (827.8) |
| Dividends and interest on capital paid | (2,081.7) | (1,377.2) | (10,773.7) | (2,561.7) |
| Cash flow from/(used in) financing activities | (3,223.2) | (3,016.7) | (16,035.2) | (8,690.2) |
| Net increase/(decrease) in cash and cash equivalents | 2,525.8 | 2,577.5 | (7,752.5) | 1,508.1 |
| Cash and cash equivalents at the beginning of the period | 16,404.0 | 16,610.8 | 28,595.7 | 18,638.2 |
| Effects of exchange rate fluctuations on cash and cash equivalents | (622.1) | (0.0) | (2,535.4) | (958.1) |
| Cash and cash equivalents at the end of the period | 18,307.7 | 19,188.2 | 18,307.7 | 19,188.2 |
ambev.com.br | Press Release – October 29, 2026 |
SIGNATURE
Pursuant to the requirements of the Securities Exchange Act of 1934, the registrant has duly caused this report to be signed on its behalf by the undersigned, thereunto duly authorized.
Date: October 29, 2026
| AMBEV S.A. | ||
| By: | /s/ Guilherme Fleury de Figueiredo Ferraz Parolari | |
|
Guilherme Fleury de Figueiredo Ferraz Parolari Chief Financial and Investor Relations Officer | ||