Q2 2026 FINANCIAL RESULTS August 3, 2026

Q2 2026 results | August 3, 20262 SAFE HARBOR STATEMENT AND DISCLOSURES All statements other than statements of historical fact contained in this presentation, including competitive strengths, business strategy, future financial position or operating results, budgets, projections with respect to revenue, income, earnings (or loss) per share, capital expenditures, dividends, liquidity, capital structure or other financial items, costs, and plans and objectives of management regarding operations and products, are “forward-looking statements” within the meaning of the Private Securities Litigation Reform Act of 1995, Section 27A of the Securities Act, and Section 21E of the Exchange Act. Forward-looking statements also include, but are not limited to, statements regarding the plans, objectives, strategies, financial performance and outlook, trends, and future performance of CNH and its subsidiaries on a standalone basis. These statements may include terminology such as “may”, “will”, “expect”, “could”, “should”, “intend”, “estimate”, “anticipate”, “believe”, “outlook”, “continue”, “remain”, “on track”, “design”, “target”, “objective”, “goal”, “forecast”, “projection”, “prospects”, “plan”, or similar terminology. Forward-looking statements are not guarantees of future performance. Rather, they are based on current views, expectations, estimates, and assumptions, including, in some cases, estimates and data received from third parties, and involve known and unknown risks, uncertainties, and other factors, many of which are outside our control and are difficult to predict. If any of these risks and uncertainties materialize (or they occur with a degree of severity that the Company is unable to predict) or if any other assumptions underlying any of the forward-looking statements prove to be incorrect, actual results or developments may differ materially from any future results or developments expressed or implied by the forward-looking statements. Factors, risks and uncertainties that could cause actual results to differ materially from those contemplated by the forward-looking statements include, among others: economic conditions in each of our markets, including the significant uncertainty caused by geopolitical events; production and supply chain disruptions, including industry capacity constraints, material availability, and global logistics delays and constraints; the many interrelated factors that affect consumer confidence and worldwide demand for capital goods and capital goods-related products; changes in government policies regarding banking, monetary and fiscal policy; legislation, particularly pertaining to capital goods-related issues such as agriculture, the environment, debt relief and subsidy program policies, trade and commerce and infrastructure development; government policies on international trade and investment, including sanctions, import quotas, capital controls and tariffs; volatility in international trade caused by the imposition of tariffs, sanctions, embargoes, and trade wars; actions of competitors in the various industries in which we compete; development and use of new technologies and technological difficulties; the interpretation of, or adoption of new, compliance requirements with respect to engine emissions, safety or other aspects of our products; labor relations; interest rates and currency exchange rates; inflation and deflation; energy prices; prices for agricultural commodities and material price increases; housing starts and other construction activity; weather conditions, particularly to the extent it impacts the agricultural industry; our ability to obtain financing or to refinance existing debt; price pressure on new and used equipment; the resolution of pending litigation and investigations on a wide range of topics, including dealer and supplier litigation, intellectual property rights disputes, product warranty and defective product claims, and emissions and/or fuel economy regulatory and contractual issues; security breaches, cybersecurity attacks, technology failures, and other disruptions to the information technology infrastructure of CNH and its suppliers and dealers; security breaches with respect to our products; our pension plans and other post-employment obligations; political and civil unrest; volatility and deterioration of capital and financial markets, including pandemics (such as the COVID-19 pandemic), terrorist attacks in Europe and elsewhere; the remediation of a material weakness; our ability to realize the anticipated benefits from our business initiatives as part of our strategic plan, including targeted restructuring actions to optimize our cost structure and improve the efficiency of our operations; our failure to realize, or a delay in realizing, all of the anticipated benefits of our acquisitions, joint ventures, strategic alliances or divestitures and other similar risks and uncertainties, and our success in managing the risks involved in the foregoing. The foregoing list of factors is not exhaustive. CNH expressly disclaims any intention or obligation to provide, update or revise any forward-looking statements in this presentation to reflect any change in expectations or any change in events, conditions or circumstances on which these forward-looking statements are based. Further information concerning CNH, including factors that potentially could materially affect CNH’s financial results, is included in CNH’s reports and filings with the U.S. Securities and Exchange Commission (“SEC”). All future written and oral forward-looking statements by CNH or persons acting on the behalf of CNH are expressly qualified in their entirety by the cautionary statements contained herein or referred to above. Reconciliations of non-GAAP measures to the most directly comparable GAAP measure are included in this presentation, which is available on our website at investors.cnh.com.
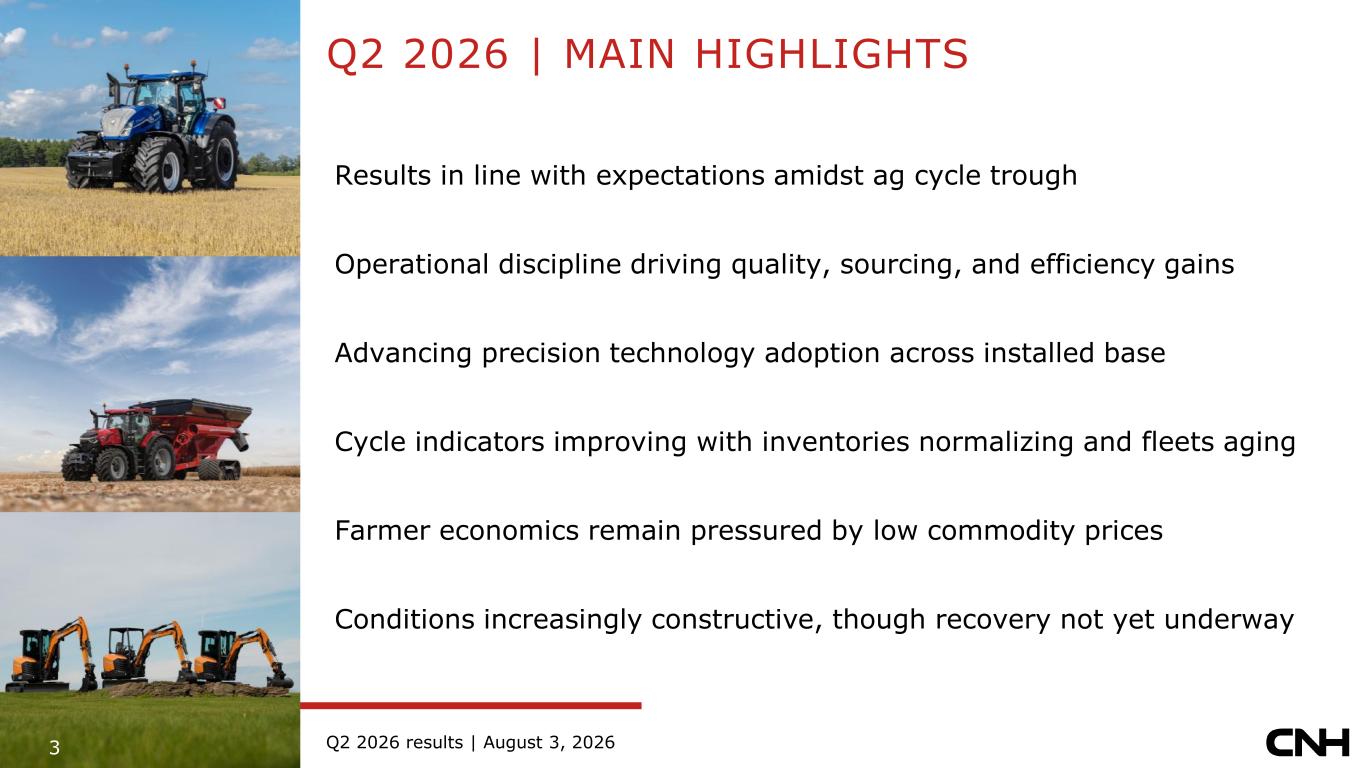
3 Q2 2026 results | August 3, 2026 Q2 2026 | MAIN HIGHLIGHTS Results in line with expectations amidst ag cycle trough Operational discipline driving quality, sourcing, and efficiency gains Advancing precision technology adoption across installed base Cycle indicators improving with inventories normalizing and fleets aging Farmer economics remain pressured by low commodity prices Conditions increasingly constructive, though recovery not yet underway 3
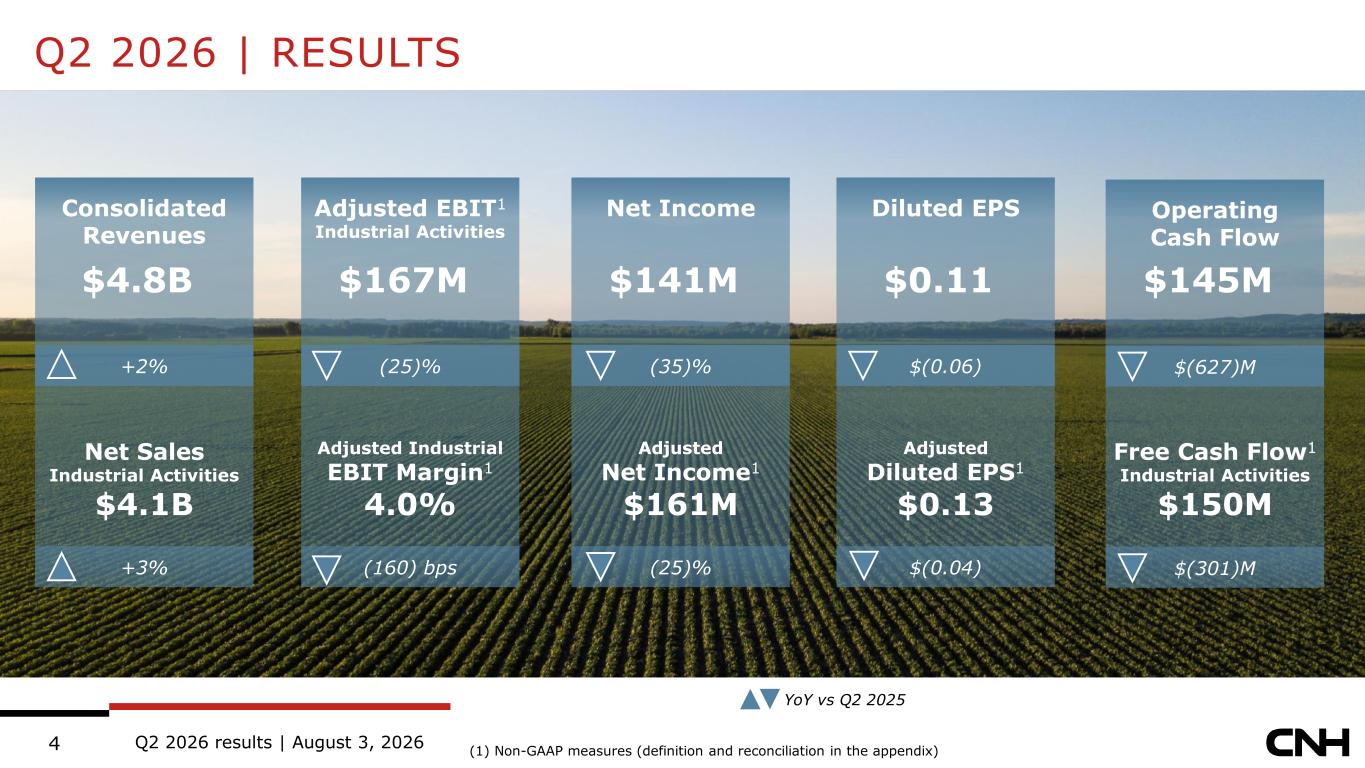
Q2 2026 results | August 3, 20264 Q2 2026 | RESULTS (1) Non-GAAP measures (definition and reconciliation in the appendix) YoY vs Q2 2025 Consolidated Revenues $4.8B +2% Net Sales Industrial Activities $4.1B +3% Adjusted EBIT1 Industrial Activities $167M (25)% (160) bps Adjusted Industrial EBIT Margin1 4.0% Net Income $141M (35)% (25)% Adjusted Net Income1 $161M Diluted EPS $0.11 $(0.06) $(0.04) Adjusted Diluted EPS1 $0.13 Operating Cash Flow $145M $(627)M $(301)M Free Cash Flow1 Industrial Activities $150M
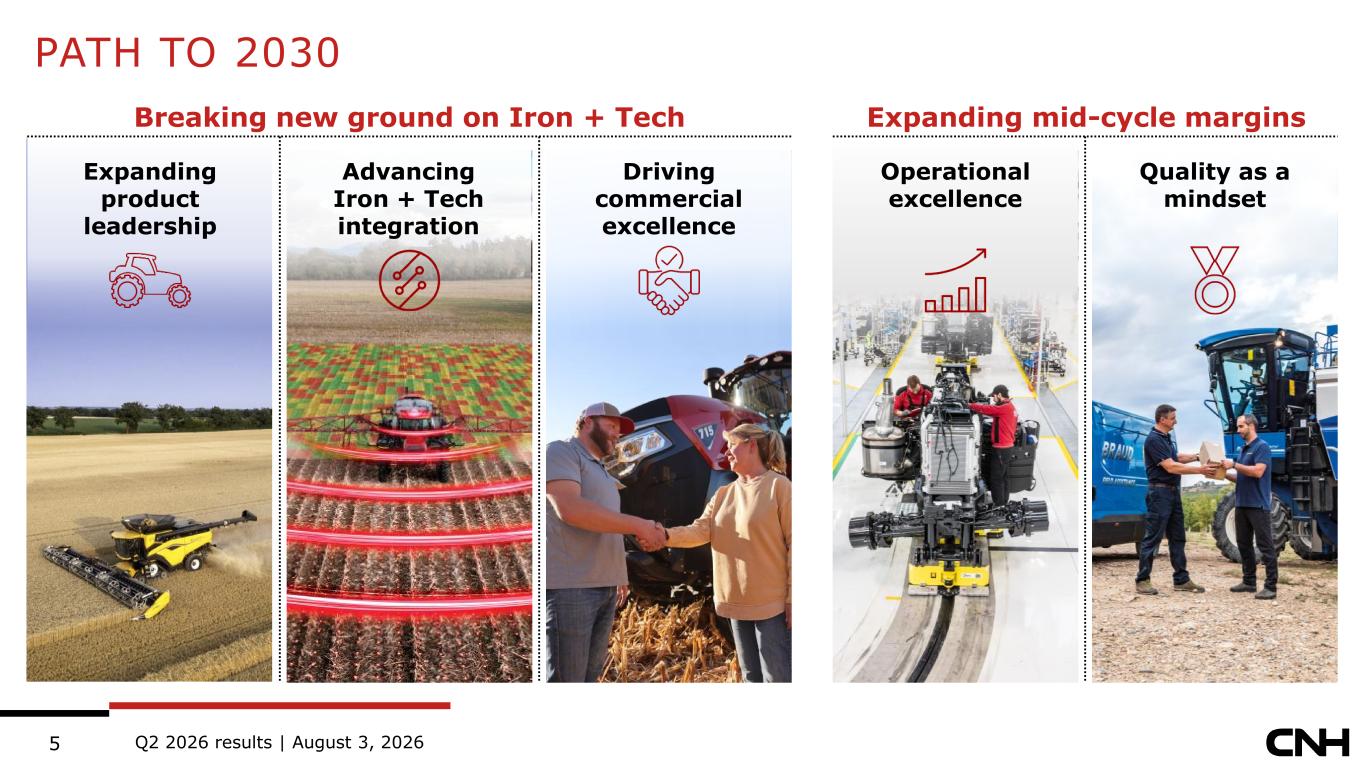
Q2 2026 results | August 3, 20265 Breaking new ground on Iron + Tech Expanding mid-cycle margins PATH TO 2030 Quality as a mindset Driving commercial excellence Operational excellence Expanding product leadership Advancing Iron + Tech integration
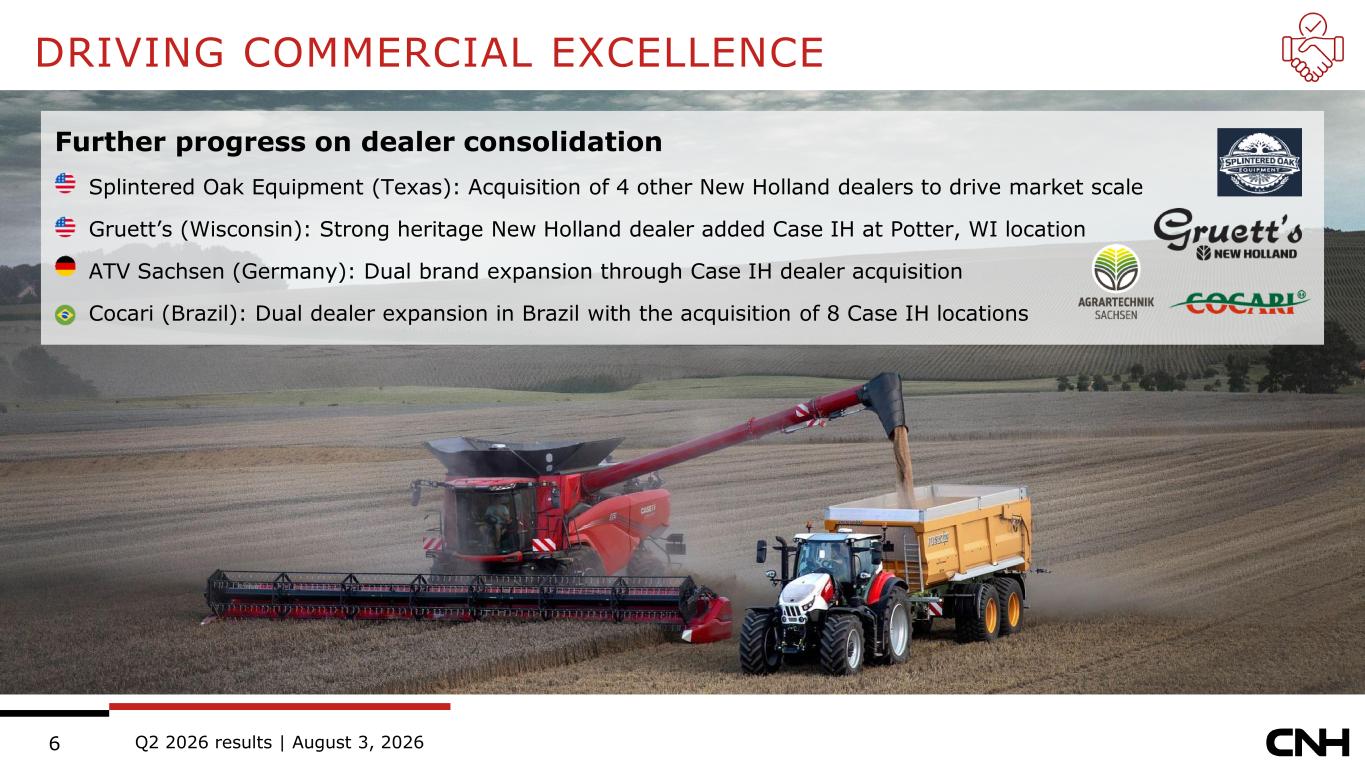
Q2 2026 results | August 3, 20266 DRIVING COMMERCIAL EXCELLENCE Further progress on dealer consolidation • Splintered Oak Equipment (Texas): Acquisition of 4 other New Holland dealers to drive market scale • Gruett’s (Wisconsin): Strong heritage New Holland dealer added Case IH at Potter, WI location • ATV Sachsen (Germany): Dual brand expansion through Case IH dealer acquisition • Cocari (Brazil): Dual dealer expansion in Brazil with the acquisition of 8 Case IH locations
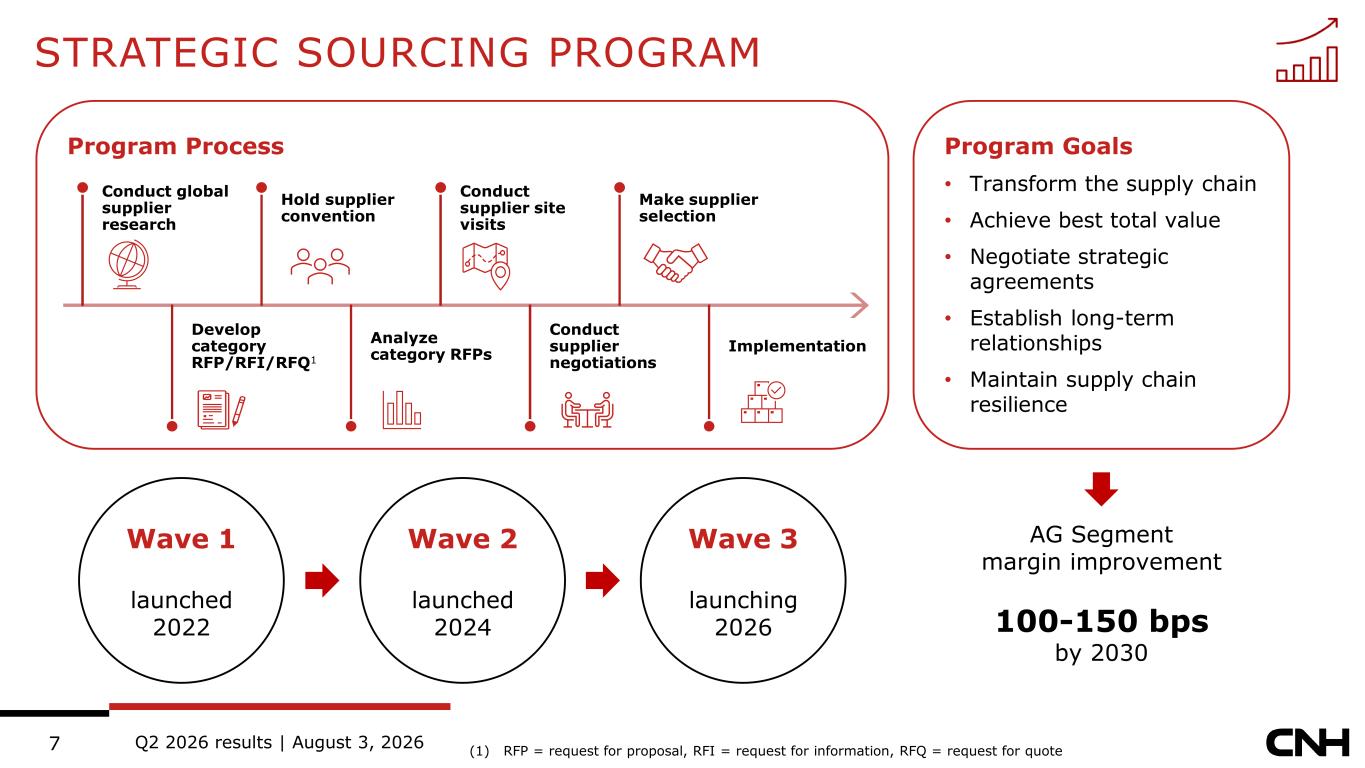
Q2 2026 results | August 3, 20267 STRATEGIC SOURCING PROGRAM (1) RFP = request for proposal, RFI = request for information, RFQ = request for quote Program Goals • Transform the supply chain • Achieve best total value • Negotiate strategic agreements • Establish long-term relationships • Maintain supply chain resilience Conduct global supplier research Develop category RFP/RFI/RFQ1 Hold supplier convention Analyze category RFPs Conduct supplier site visits Conduct supplier negotiations Make supplier selection Implementation Program Process Wave 1 launched 2022 Wave 2 launched 2024 Wave 3 launching 2026 AG Segment margin improvement 100-150 bps by 2030
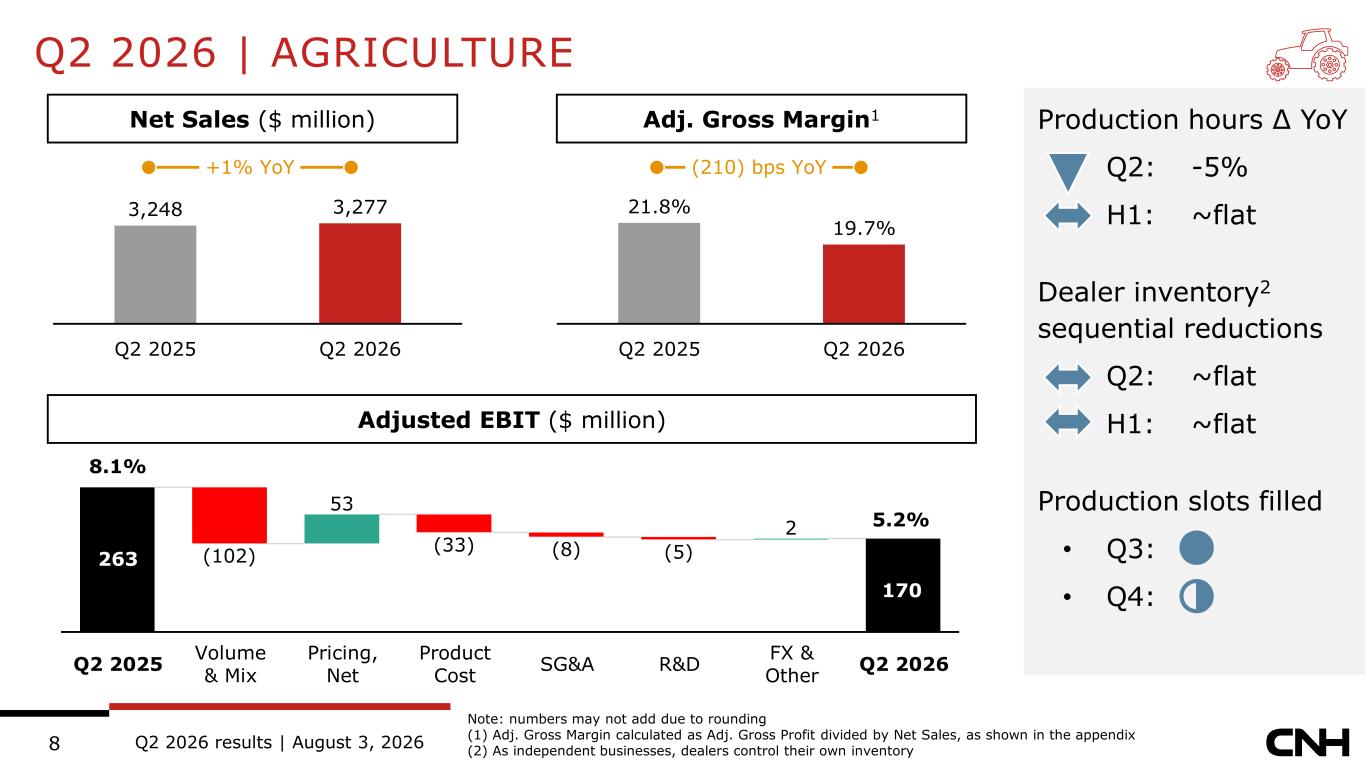
Q2 2026 results | August 3, 20268 (102) 53 (33) (8) (5) 2 Q2 2026 | AGRICULTURE Note: numbers may not add due to rounding (1) Adj. Gross Margin calculated as Adj. Gross Profit divided by Net Sales, as shown in the appendix (2) As independent businesses, dealers control their own inventory Production hours Δ YoY • Q2: -5% • H1: ~flat Dealer inventory2 sequential reductions • Q2: ~flat • H1: ~flat Production slots filled • Q3: • Q4: ● ◑ Q2 2025 Volume & Mix Pricing, Net Product Cost SG&A R&D FX & Other Q2 2026 170 3,248 3,277 Q2 2025 Q2 2026 Net Sales ($ million) Adj. Gross Margin1 Adjusted EBIT ($ million) 5.2% 8.1% +1% YoY (210) bps YoY 21.8% 19.7% Q2 2025 Q2 2026 263
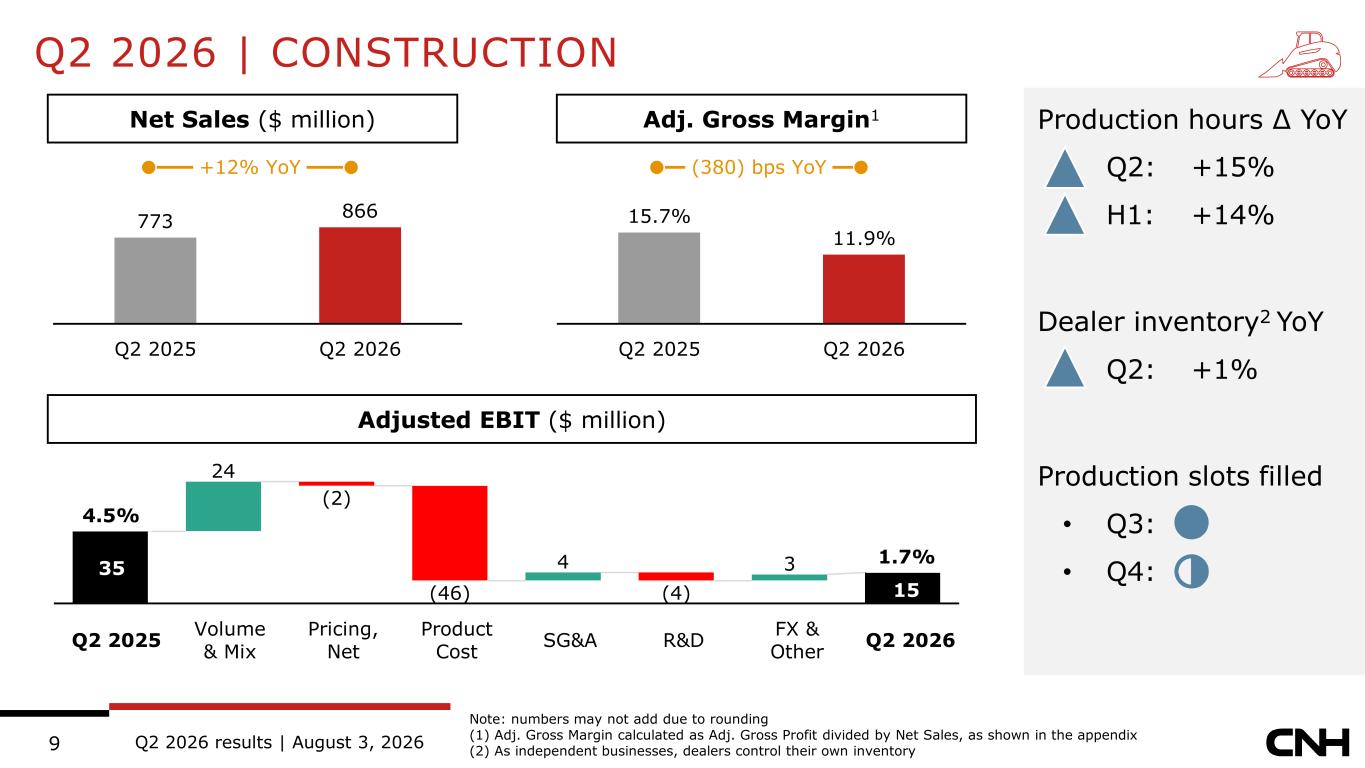
Q2 2026 results | August 3, 20269 Q2 2026 | CONSTRUCTION Note: numbers may not add due to rounding (1) Adj. Gross Margin calculated as Adj. Gross Profit divided by Net Sales, as shown in the appendix (2) As independent businesses, dealers control their own inventory Production hours Δ YoY • Q2: +15% • H1: +14% Dealer inventory2 YoY • Q2: +1% Production slots filled • Q3: • Q4: ● ◑ Q2 2025 Volume & Mix Pricing, Net Product Cost SG&A R&D FX & Other Q2 2026 24 (2) (46) 4 (4) 3 773 866 Q2 2025 Q2 2026 Net Sales ($ million) Adj. Gross Margin1 Adjusted EBIT ($ million) 1.7% 4.5% +12% YoY (380) bps YoY 15.7% 11.9% Q2 2025 Q2 2026 15 35
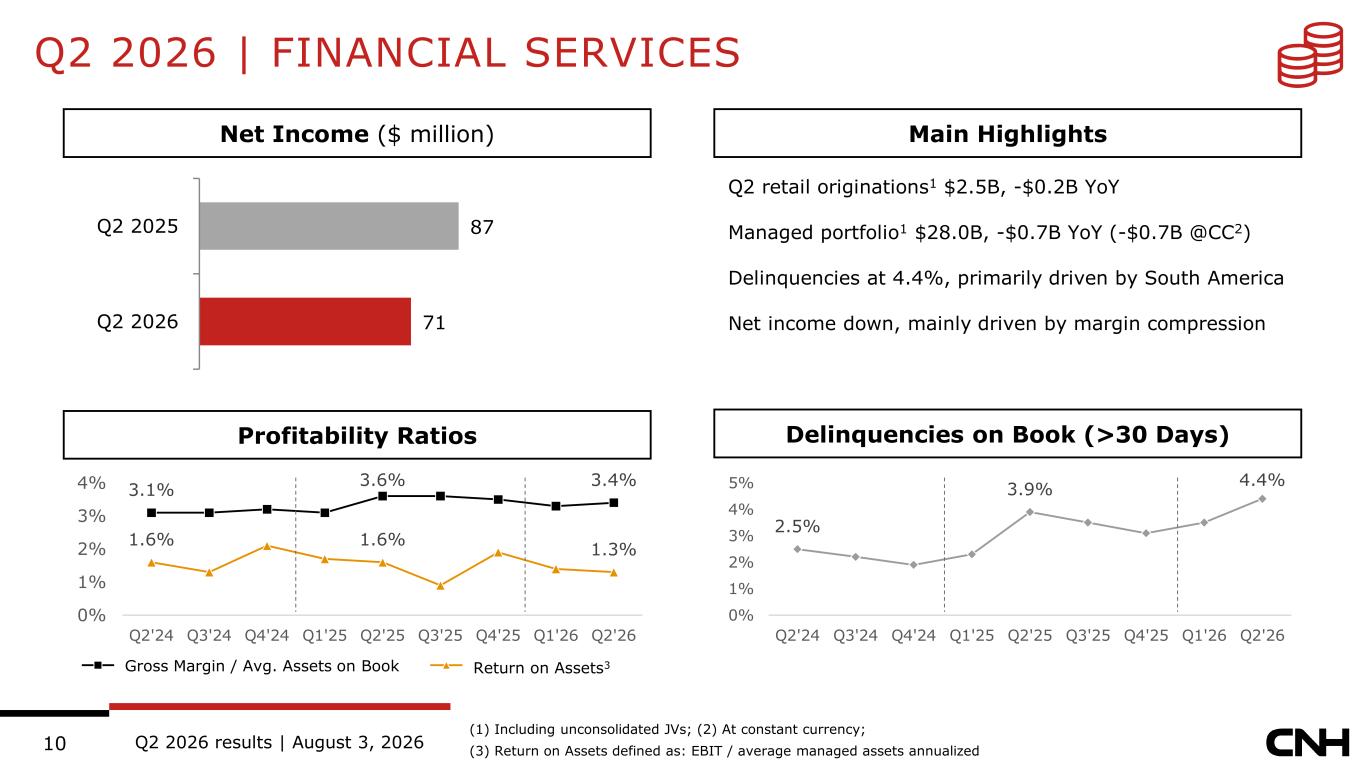
Q2 2026 results | August 3, 202610 2.5% 3.9% 4.4% 0% 1% 2% 3% 4% 5% Q2'24 Q3'24 Q4'24 Q1'25 Q2'25 Q3'25 Q4'25 Q1'26 Q2'26 3.1% 3.6% 3.4% 1.6% 1.6% 1.3% 0% 1% 2% 3% 4% Q2'24 Q3'24 Q4'24 Q1'25 Q2'25 Q3'25 Q4'25 Q1'26 Q2'26 Q2 2026 | FINANCIAL SERVICES (1) Including unconsolidated JVs; (2) At constant currency; (3) Return on Assets defined as: EBIT / average managed assets annualized Net Income ($ million) Delinquencies on Book (>30 Days)Profitability Ratios Gross Margin / Avg. Assets on Book Return on Assets3 Main Highlights 87 71 Q2 2025 Q2 2026 Q2 retail originations1 $2.5B, -$0.2B YoY Managed portfolio1 $28.0B, -$0.7B YoY (-$0.7B @CC2) Delinquencies at 4.4%, primarily driven by South America Net income down, mainly driven by margin compression
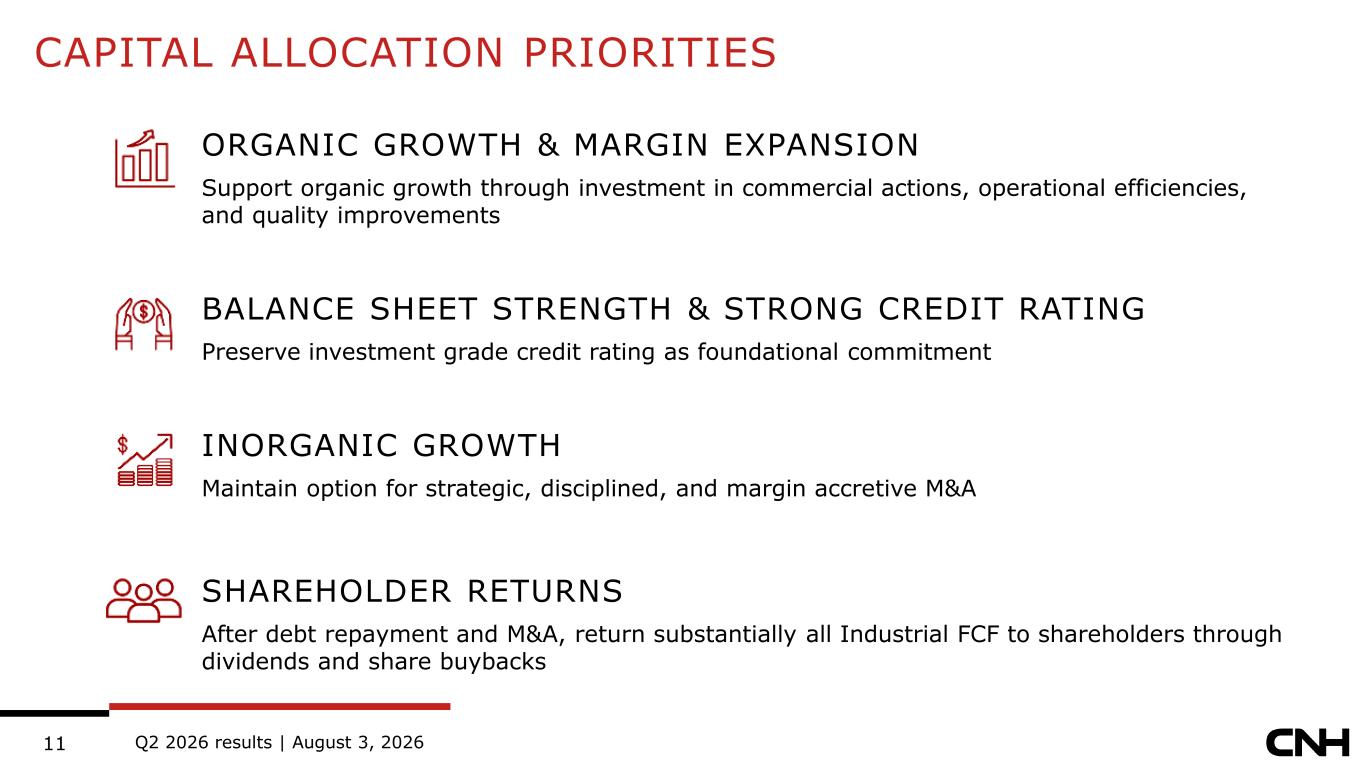
Q2 2026 results | August 3, 202611 CAPITAL ALLOCATION PRIORITIES ORGANIC GROWTH & MARGIN EXPANSION Support organic growth through investment in commercial actions, operational efficiencies, and quality improvements BALANCE SHEET STRENGTH & STRONG CREDIT RATING Preserve investment grade credit rating as foundational commitment INORGANIC GROWTH Maintain option for strategic, disciplined, and margin accretive M&A SHAREHOLDER RETURNS After debt repayment and M&A, return substantially all Industrial FCF to shareholders through dividends and share buybacks
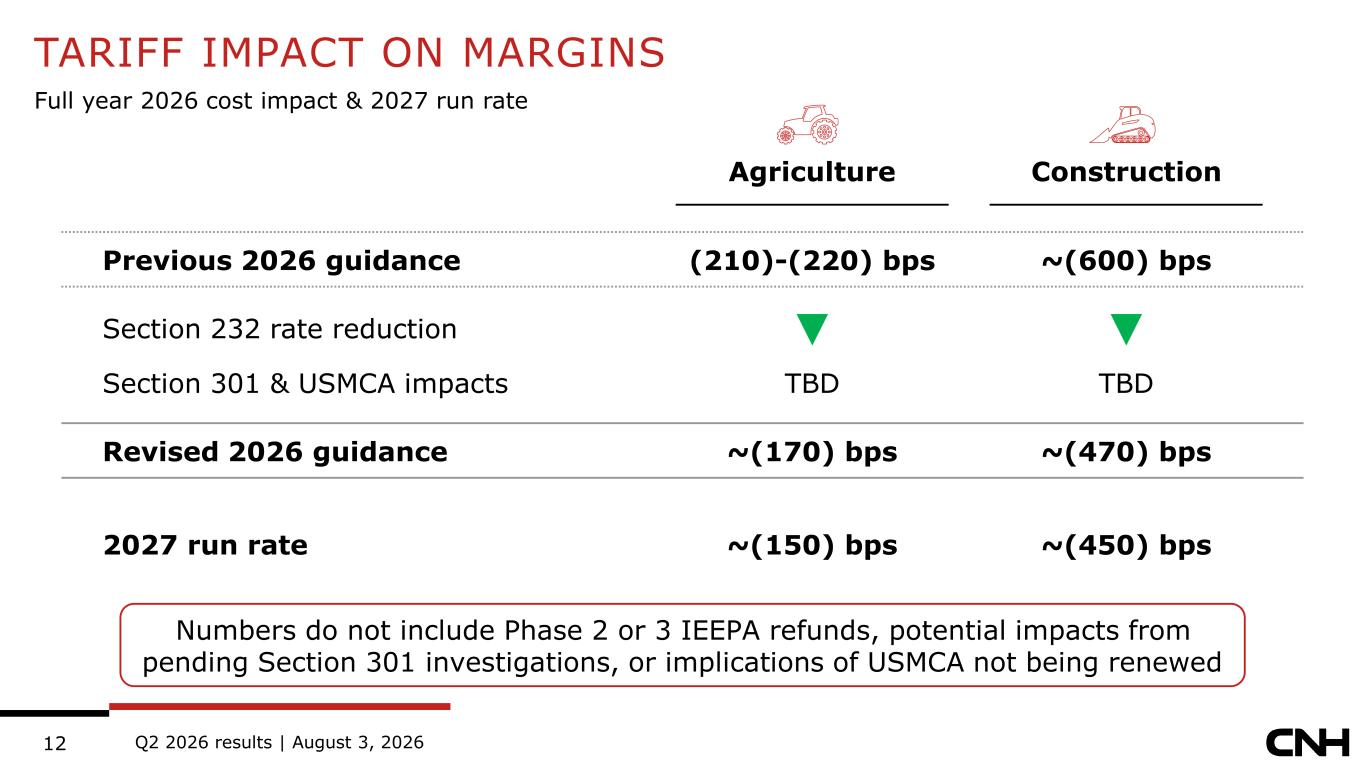
Q2 2026 results | August 3, 202612 TARIFF IMPACT ON MARGINS Full year 2026 cost impact & 2027 run rate Agriculture Construction Previous 2026 guidance (210)-(220) bps ~(600) bps Section 232 rate reduction ▼ ▼ Section 301 & USMCA impacts TBD TBD Revised 2026 guidance ~(170) bps ~(470) bps 2027 run rate ~(150) bps ~(450) bps Numbers do not include Phase 2 or 3 IEEPA refunds, potential impacts from pending Section 301 investigations, or implications of USMCA not being renewed
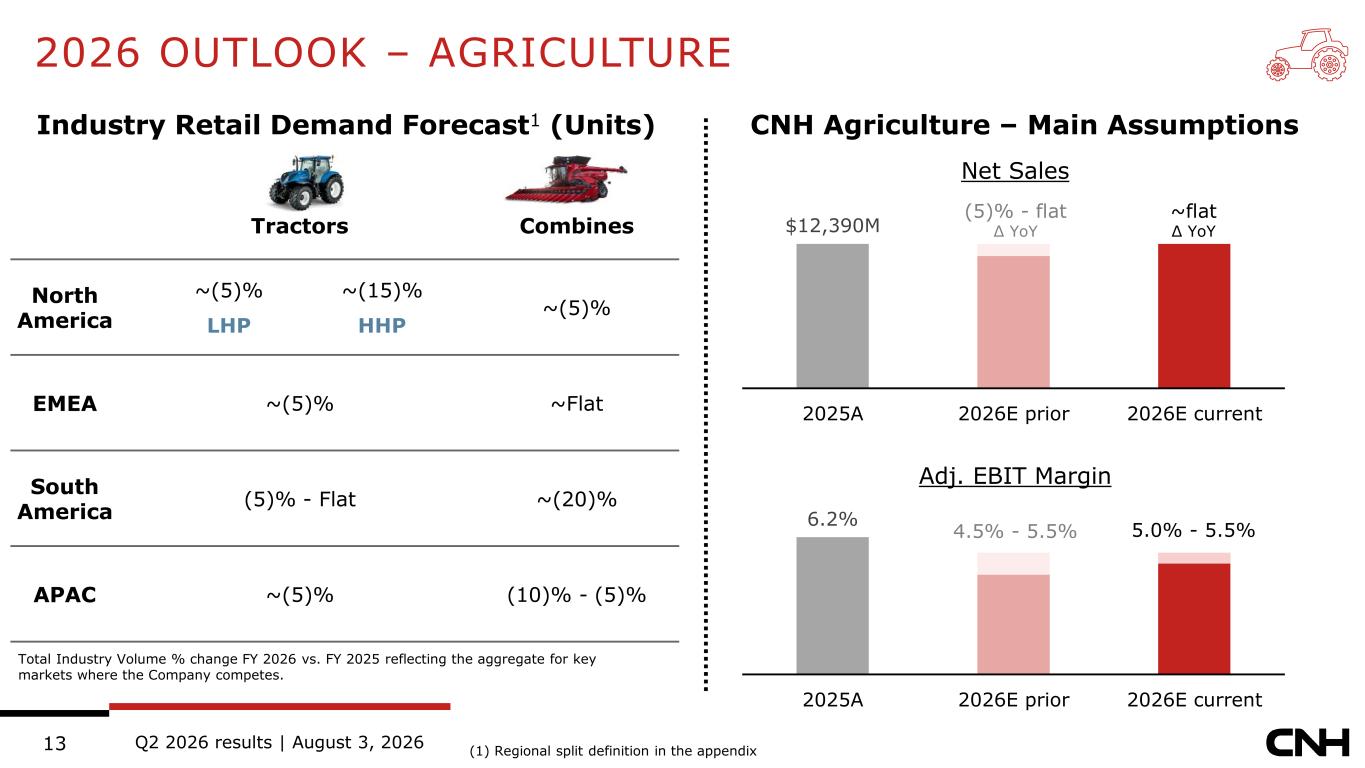
Q2 2026 results | August 3, 202613 2026 OUTLOOK – AGRICULTURE (1) Regional split definition in the appendix Industry Retail Demand Forecast1 (Units) CNH Agriculture – Main Assumptions Tractors Combines North America ~(5)% LHP ~(15)% HHP ~(5)% EMEA ~(5)% ~Flat South America (5)% - Flat ~(20)% APAC ~(5)% (10)% - (5)% Total Industry Volume % change FY 2026 vs. FY 2025 reflecting the aggregate for key markets where the Company competes. 6.2% 2025A 2026E prior 2026E current $12,390M 2025A 2026E prior 2026E current ~flat Δ YoY Net Sales Adj. EBIT Margin 5.0% - 5.5% (5)% - flat Δ YoY 4.5% - 5.5%
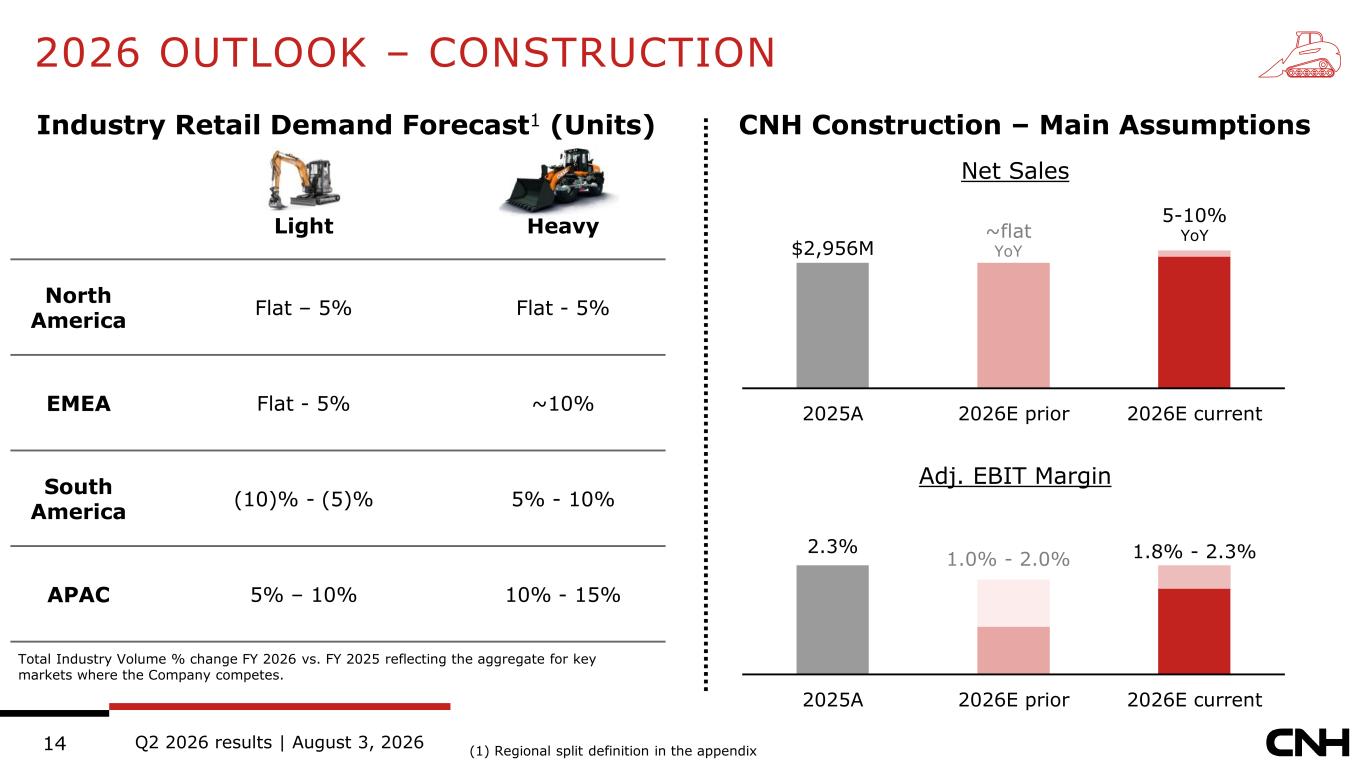
Q2 2026 results | August 3, 202614 2.3% 2025A 2026E prior 2026E current $2,956M 2025A 2026E prior 2026E current 2026 OUTLOOK – CONSTRUCTION (1) Regional split definition in the appendix Industry Retail Demand Forecast1 (Units) CNH Construction – Main Assumptions 5-10% YoY Net Sales Adj. EBIT Margin 1.8% - 2.3% Light Heavy North America Flat – 5% Flat - 5% EMEA Flat - 5% ~10% South America (10)% - (5)% 5% - 10% APAC 5% – 10% 10% - 15% Total Industry Volume % change FY 2026 vs. FY 2025 reflecting the aggregate for key markets where the Company competes. ~flat YoY 1.0% - 2.0%
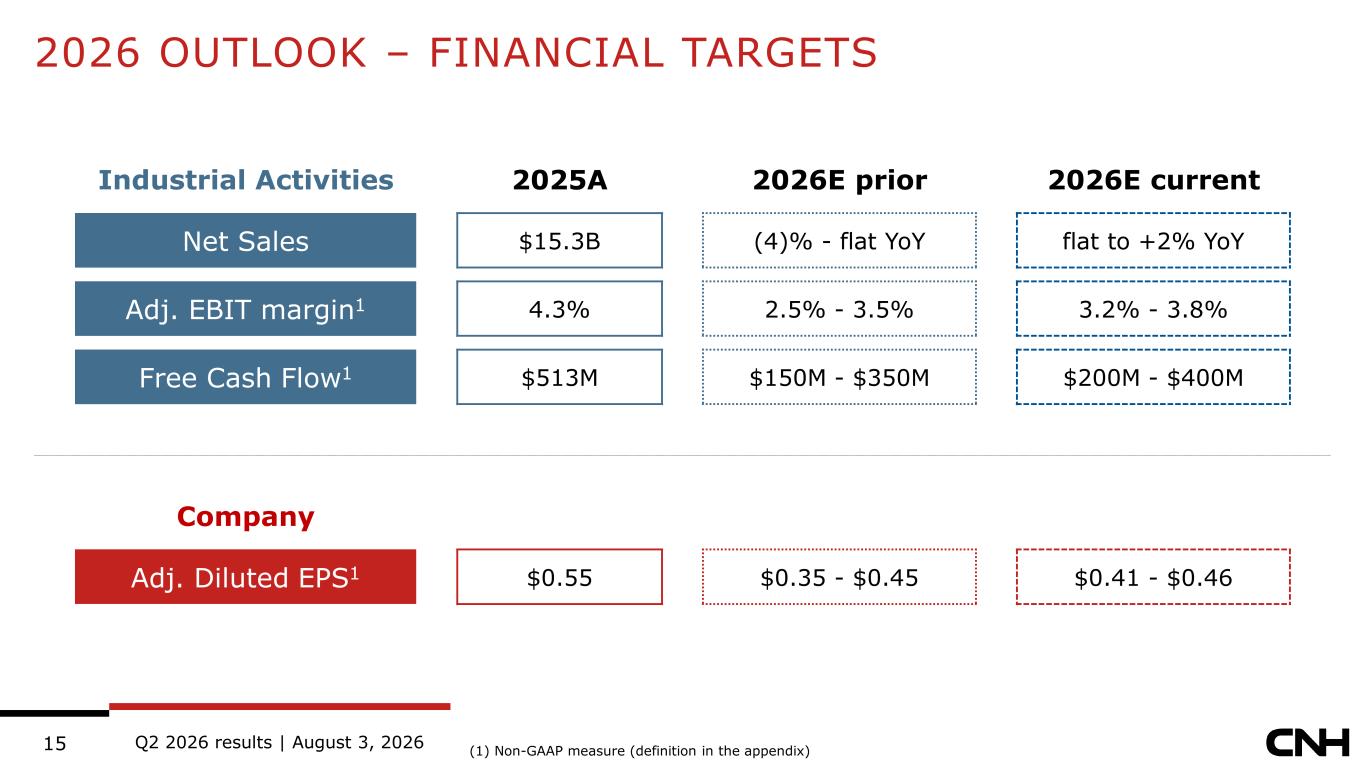
Q2 2026 results | August 3, 202615 2026 OUTLOOK – FINANCIAL TARGETS (1) Non-GAAP measure (definition in the appendix) Industrial Activities 2025A 2026E prior 2026E current Net Sales $15.3B (4)% - flat YoY flat to +2% YoY Adj. EBIT margin1 4.3% 2.5% - 3.5% 3.2% - 3.8% Free Cash Flow1 $513M $150M - $350M $200M - $400M Company Adj. Diluted EPS1 $0.55 $0.35 - $0.45 $0.41 - $0.46
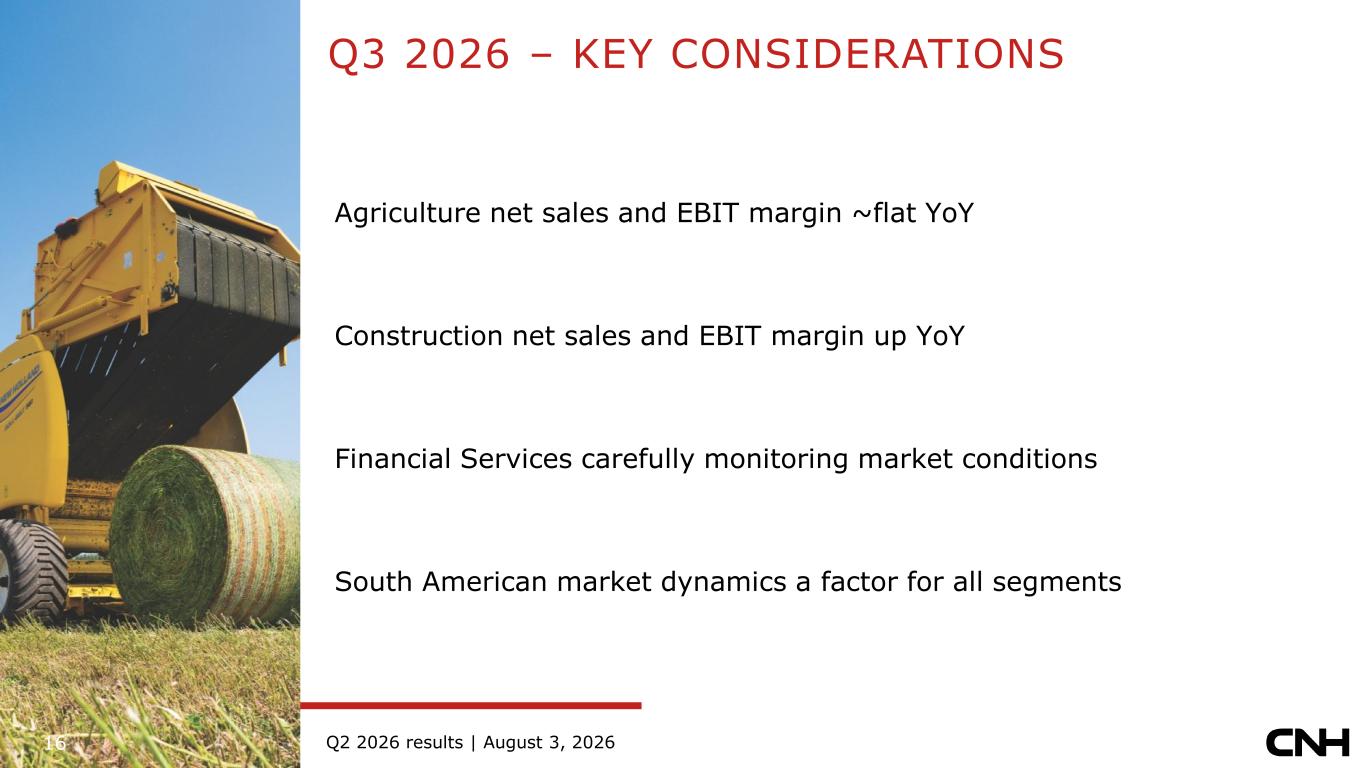
16 Q2 2026 results | August 3, 2026 Q3 2026 – KEY CONSIDERATIONS Agriculture net sales and EBIT margin ~flat YoY Construction net sales and EBIT margin up YoY Financial Services carefully monitoring market conditions South American market dynamics a factor for all segments
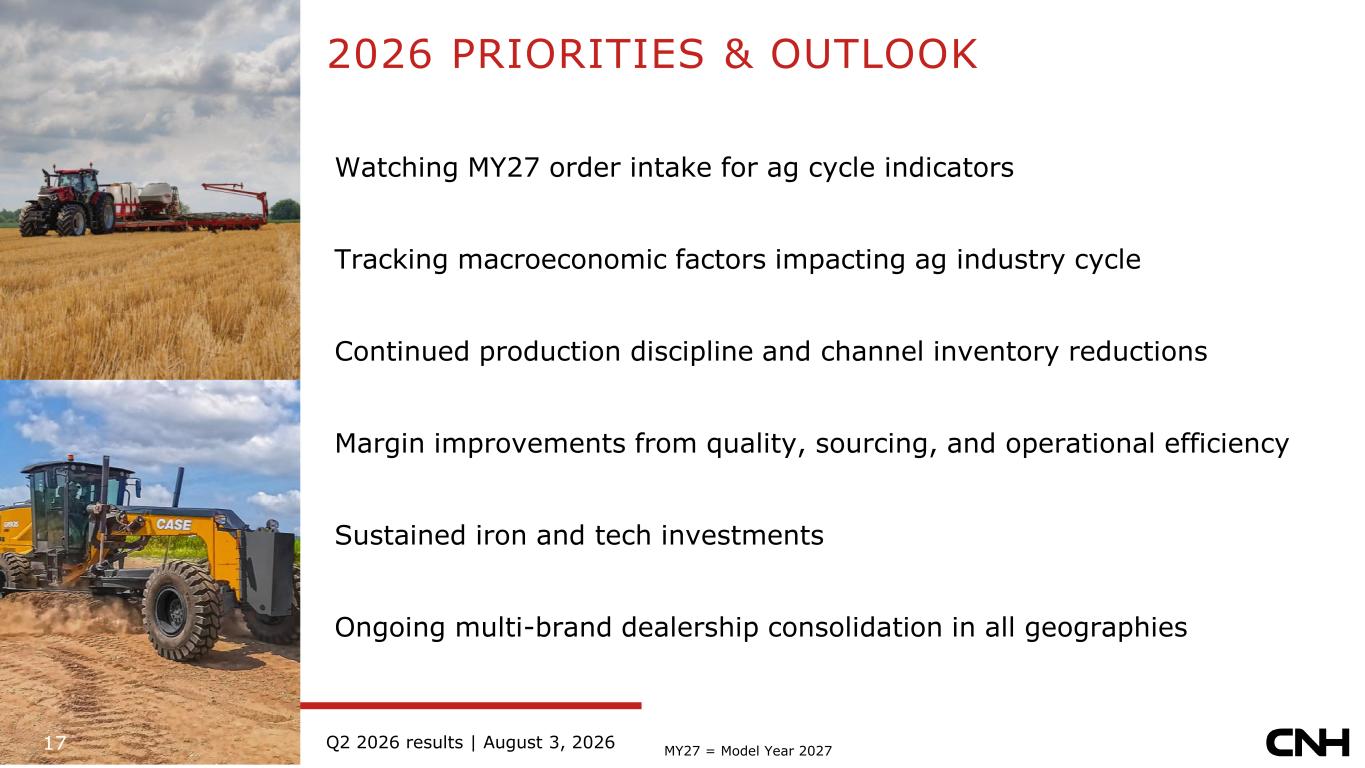
17 Q2 2026 results | August 3, 2026 2026 PRIORITIES & OUTLOOK Watching MY27 order intake for ag cycle indicators Tracking macroeconomic factors impacting ag industry cycle Continued production discipline and channel inventory reductions Margin improvements from quality, sourcing, and operational efficiency Sustained iron and tech investments Ongoing multi-brand dealership consolidation in all geographies MY27 = Model Year 2027
18 APPENDIX
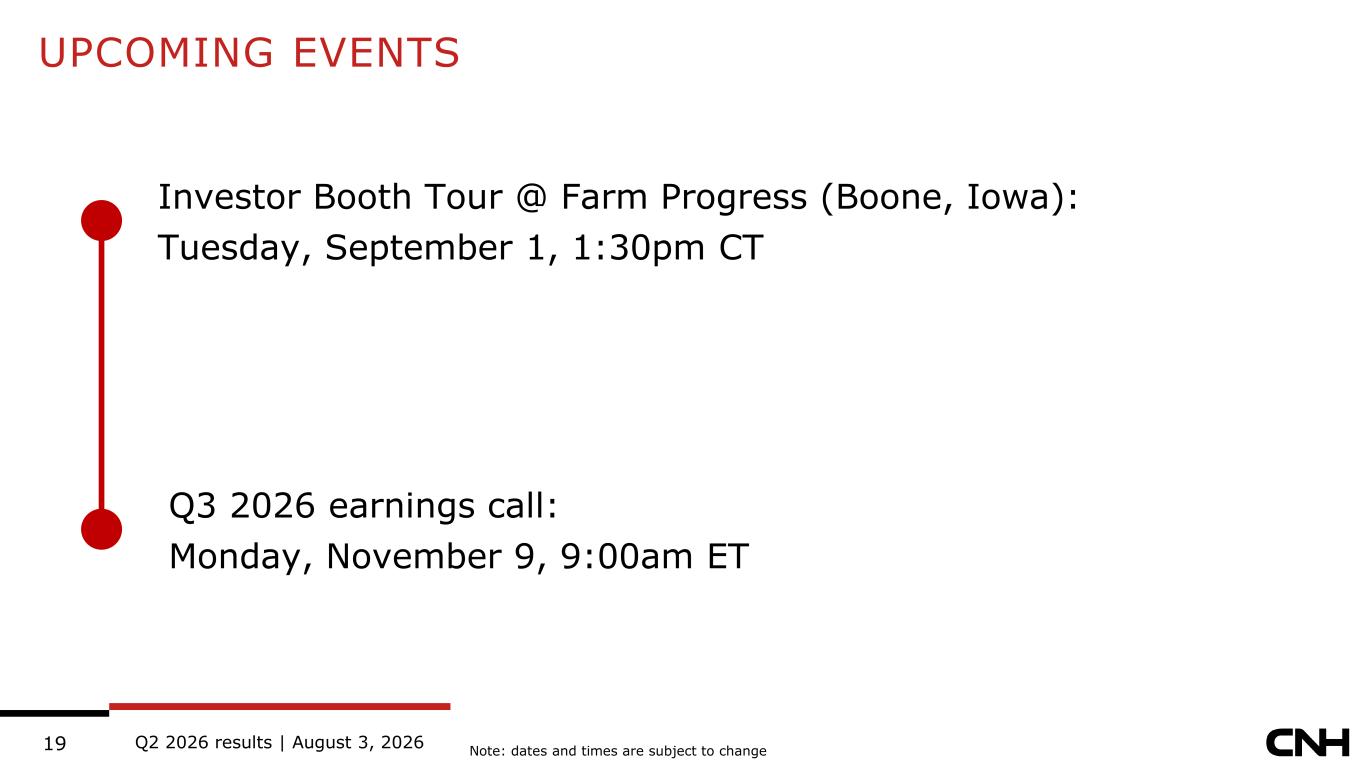
Q2 2026 results | August 3, 202619 UPCOMING EVENTS Q3 2026 earnings call: Monday, November 9, 9:00am ET Investor Booth Tour @ Farm Progress (Boone, Iowa): Tuesday, September 1, 1:30pm CT Note: dates and times are subject to change
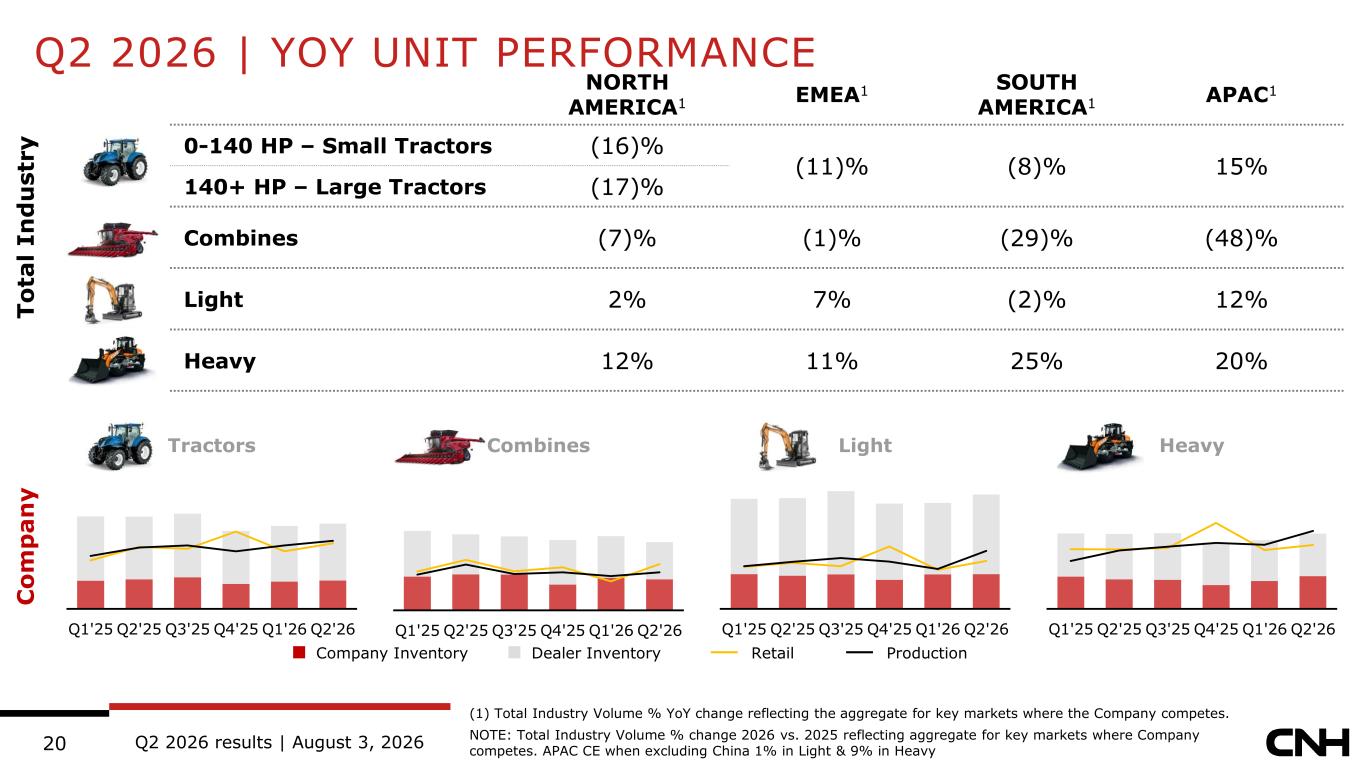
Q2 2026 results | August 3, 202620 Q2 2026 | YOY UNIT PERFORMANCE (1) Total Industry Volume % YoY change reflecting the aggregate for key markets where the Company competes. NOTE: Total Industry Volume % change 2026 vs. 2025 reflecting aggregate for key markets where Company competes. APAC CE when excluding China 1% in Light & 9% in Heavy T o ta l I n d u s tr y NORTH AMERICA1 EMEA1 SOUTH AMERICA1 APAC1 0-140 HP – Small Tractors (16)% (11)% (8)% 15% 140+ HP – Large Tractors (17)% Combines (7)% (1)% (29)% (48)% Light 2% 7% (2)% 12% Heavy 12% 11% 25% 20% Company Inventory Dealer Inventory Retail Production C o m p a n y Q1'25 Q2'25 Q3'25 Q4'25 Q1'26 Q2'26 Q1'25 Q2'25 Q3'25 Q4'25 Q1'26 Q2'26 Q1'25 Q2'25 Q3'25 Q4'25 Q1'26 Q2'26Q1'25 Q2'25 Q3'25 Q4'25 Q1'26 Q2'26 Tractors Light HeavyCombines
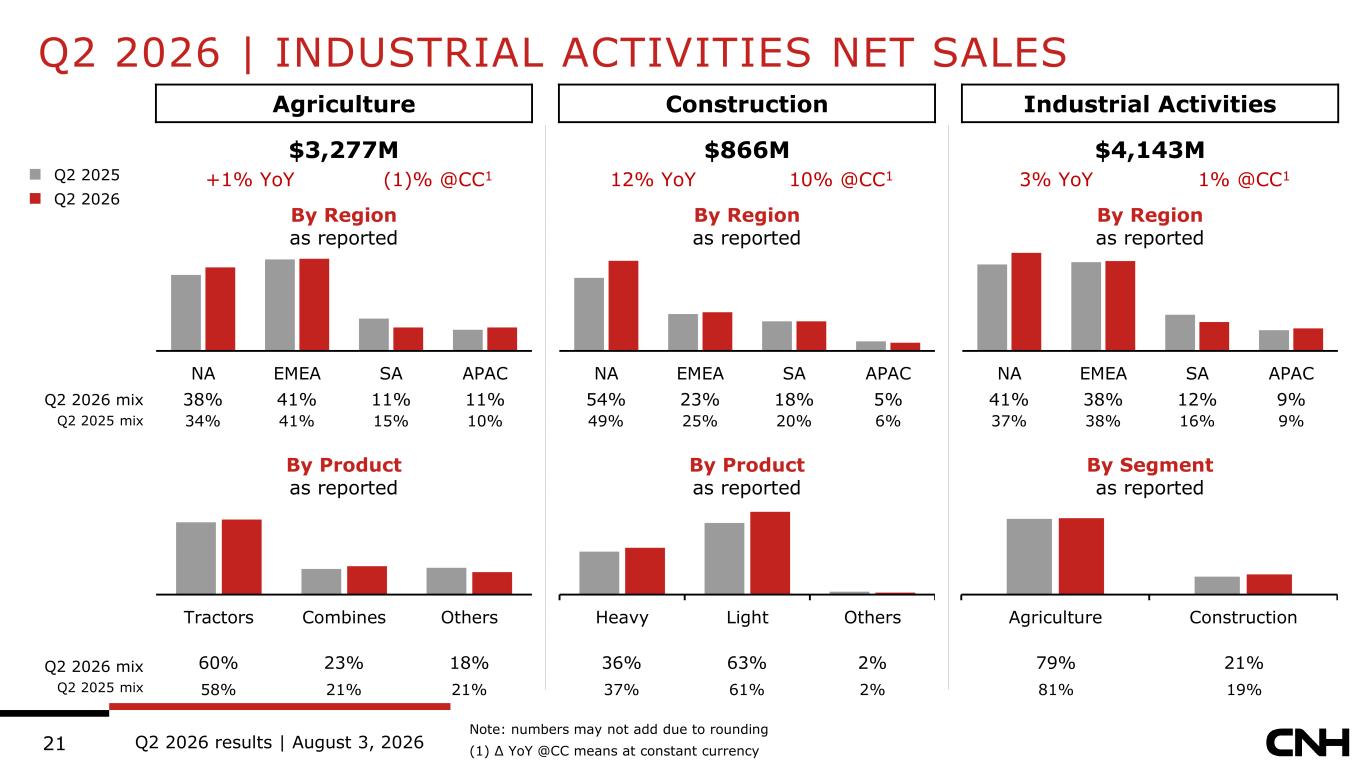
Q2 2026 results | August 3, 202621 Q2 2026 | INDUSTRIAL ACTIVITIES NET SALES Note: numbers may not add due to rounding (1) Δ YoY @CC means at constant currency Agriculture Construction Industrial Activities $3,277M $866M $4,143M +1% YoY (1)% @CC1 12% YoY 10% @CC1 3% YoY 1% @CC1 By Region as reported By Region as reported By Region as reported 38% 41% 11% 11% 54% 23% 18% 5% 41% 38% 12% 9% 34% 41% 15% 10% 49% 25% 20% 6% 37% 38% 16% 9% By Product as reported By Product as reported By Segment as reported 60% 23% 18% 36% 63% 2% 79% 21% 58% 21% 21% 37% 61% 2% 81% 19% Q2 2025 Q2 2026 Agriculture Construction NA EMEA SA APAC Tractors Combines Others Heavy Light Others NA EMEA SA APAC NA EMEA SA APAC Q2 2026 mix Q2 2025 mix Q2 2026 mix Q2 2025 mix
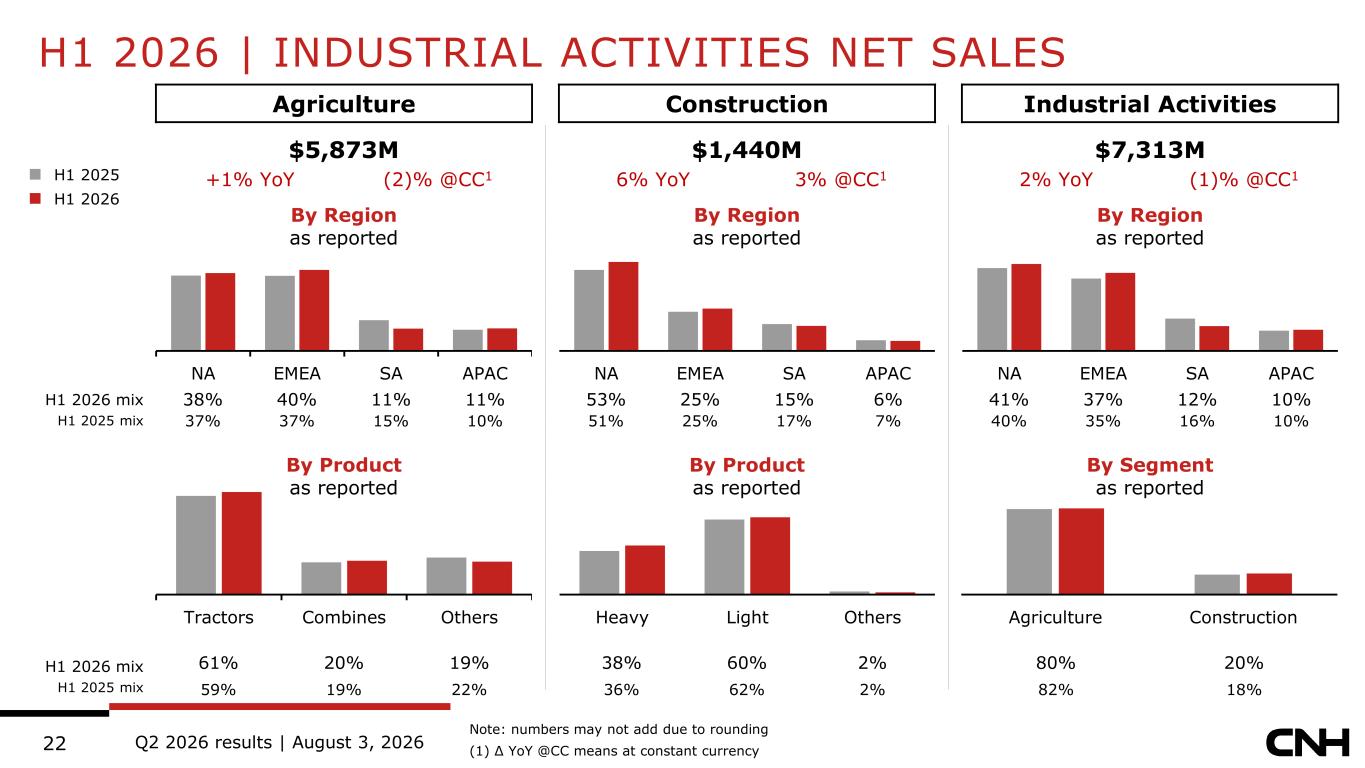
Q2 2026 results | August 3, 202622 H1 2026 | INDUSTRIAL ACTIVITIES NET SALES Note: numbers may not add due to rounding (1) Δ YoY @CC means at constant currency Agriculture Construction Industrial Activities $5,873M $1,440M $7,313M +1% YoY (2)% @CC1 6% YoY 3% @CC1 2% YoY (1)% @CC1 By Region as reported By Region as reported By Region as reported 38% 40% 11% 11% 53% 25% 15% 6% 41% 37% 12% 10% 37% 37% 15% 10% 51% 25% 17% 7% 40% 35% 16% 10% By Product as reported By Product as reported By Segment as reported 61% 20% 19% 38% 60% 2% 80% 20% 59% 19% 22% 36% 62% 2% 82% 18% H1 2025 H1 2026 Agriculture Construction NA EMEA SA APAC Tractors Combines Others Heavy Light Others NA EMEA SA APAC NA EMEA SA APAC H1 2026 mix H1 2025 mix H1 2026 mix H1 2025 mix
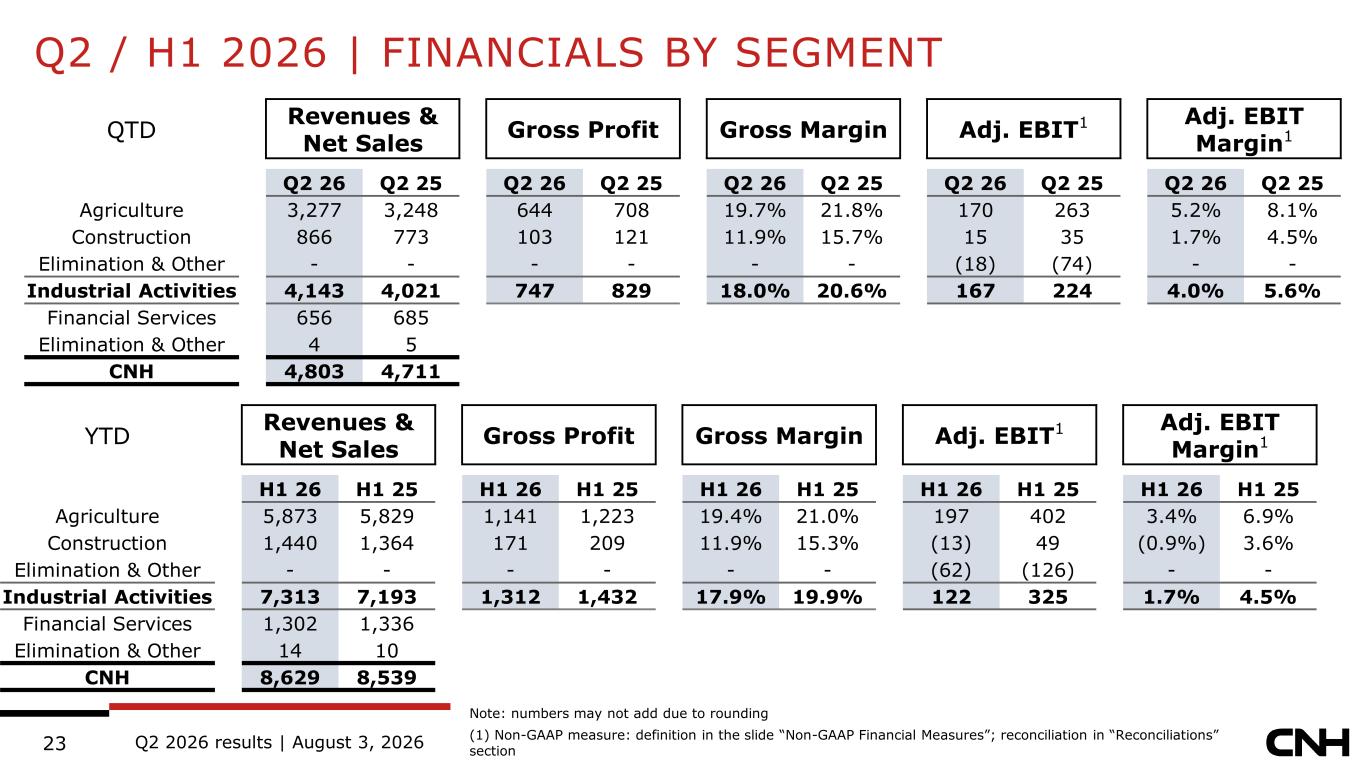
Q2 2026 results | August 3, 202623 Q2 / H1 2026 | FINANCIALS BY SEGMENT Note: numbers may not add due to rounding (1) Non-GAAP measure: definition in the slide “Non-GAAP Financial Measures”; reconciliation in “Reconciliations” section QTD Revenues & Net Sales Gross Profit Gross Margin Adj. EBIT1 Adj. EBIT Margin1 Q2 26 Q2 25 Q2 26 Q2 25 Q2 26 Q2 25 Q2 26 Q2 25 Q2 26 Q2 25 Agriculture 3,277 3,248 644 708 19.7% 21.8% 170 263 5.2% 8.1% Construction 866 773 103 121 11.9% 15.7% 15 35 1.7% 4.5% Elimination & Other - - - - - - (18) (74) - - Industrial Activities 4,143 4,021 747 829 18.0% 20.6% 167 224 4.0% 5.6% Financial Services 656 685 Elimination & Other 4 5 CNH 4,803 4,711 YTD Revenues & Net Sales Gross Profit Gross Margin Adj. EBIT1 Adj. EBIT Margin1 H1 26 H1 25 H1 26 H1 25 H1 26 H1 25 H1 26 H1 25 H1 26 H1 25 Agriculture 5,873 5,829 1,141 1,223 19.4% 21.0% 197 402 3.4% 6.9% Construction 1,440 1,364 171 209 11.9% 15.3% (13) 49 (0.9%) 3.6% Elimination & Other - - - - - - (62) (126) - - Industrial Activities 7,313 7,193 1,312 1,432 17.9% 19.9% 122 325 1.7% 4.5% Financial Services 1,302 1,336 Elimination & Other 14 10 CNH 8,629 8,539
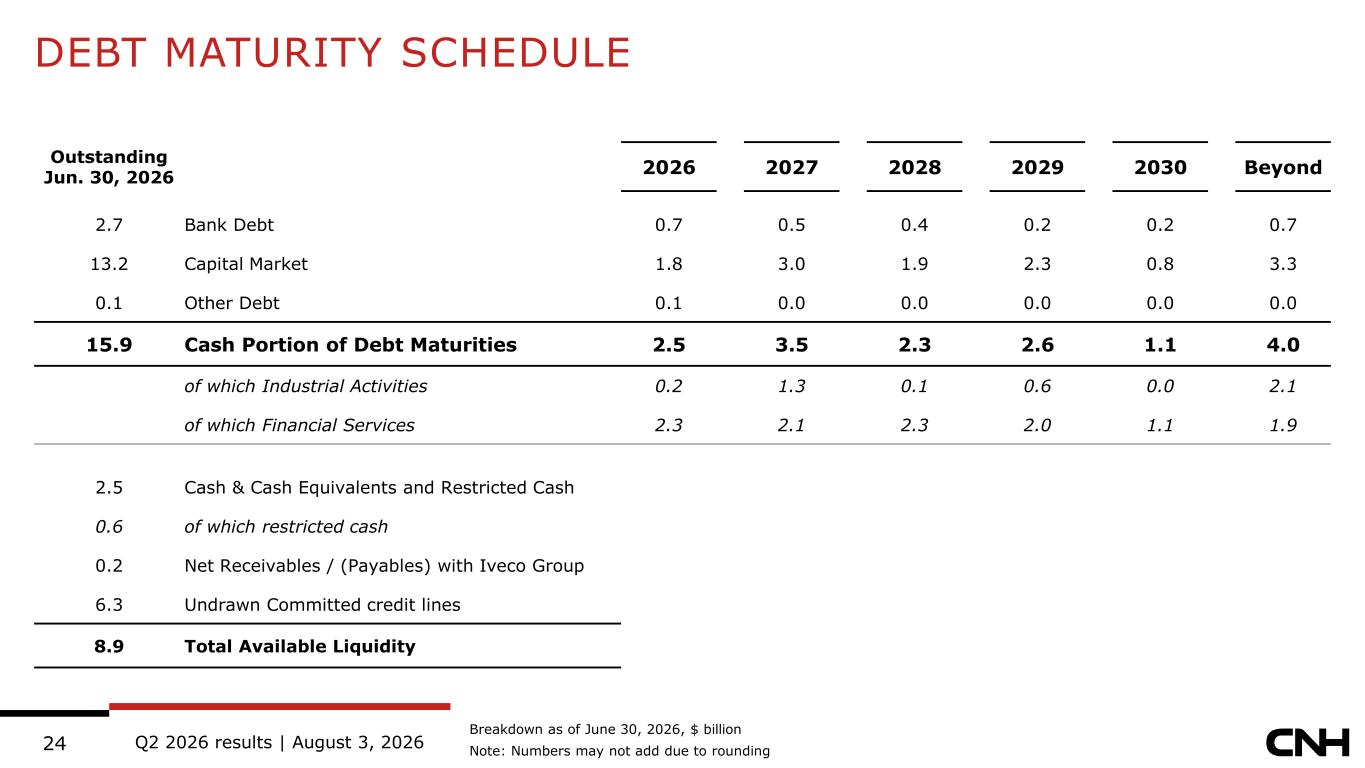
Q2 2026 results | August 3, 202624 DEBT MATURITY SCHEDULE Breakdown as of June 30, 2026, $ billion Note: Numbers may not add due to rounding Outstanding Jun. 30, 2026 2026 2027 2028 2029 2030 Beyond 2.7 Bank Debt 0.7 0.5 0.4 0.2 0.2 0.7 13.2 Capital Market 1.8 3.0 1.9 2.3 0.8 3.3 0.1 Other Debt 0.1 0.0 0.0 0.0 0.0 0.0 15.9 Cash Portion of Debt Maturities 2.5 3.5 2.3 2.6 1.1 4.0 of which Industrial Activities 0.2 1.3 0.1 0.6 0.0 2.1 of which Financial Services 2.3 2.1 2.3 2.0 1.1 1.9 2.5 Cash & Cash Equivalents and Restricted Cash 0.6 of which restricted cash 0.2 Net Receivables / (Payables) with Iveco Group 6.3 Undrawn Committed credit lines 8.9 Total Available Liquidity

25 RECONCILIATIONS
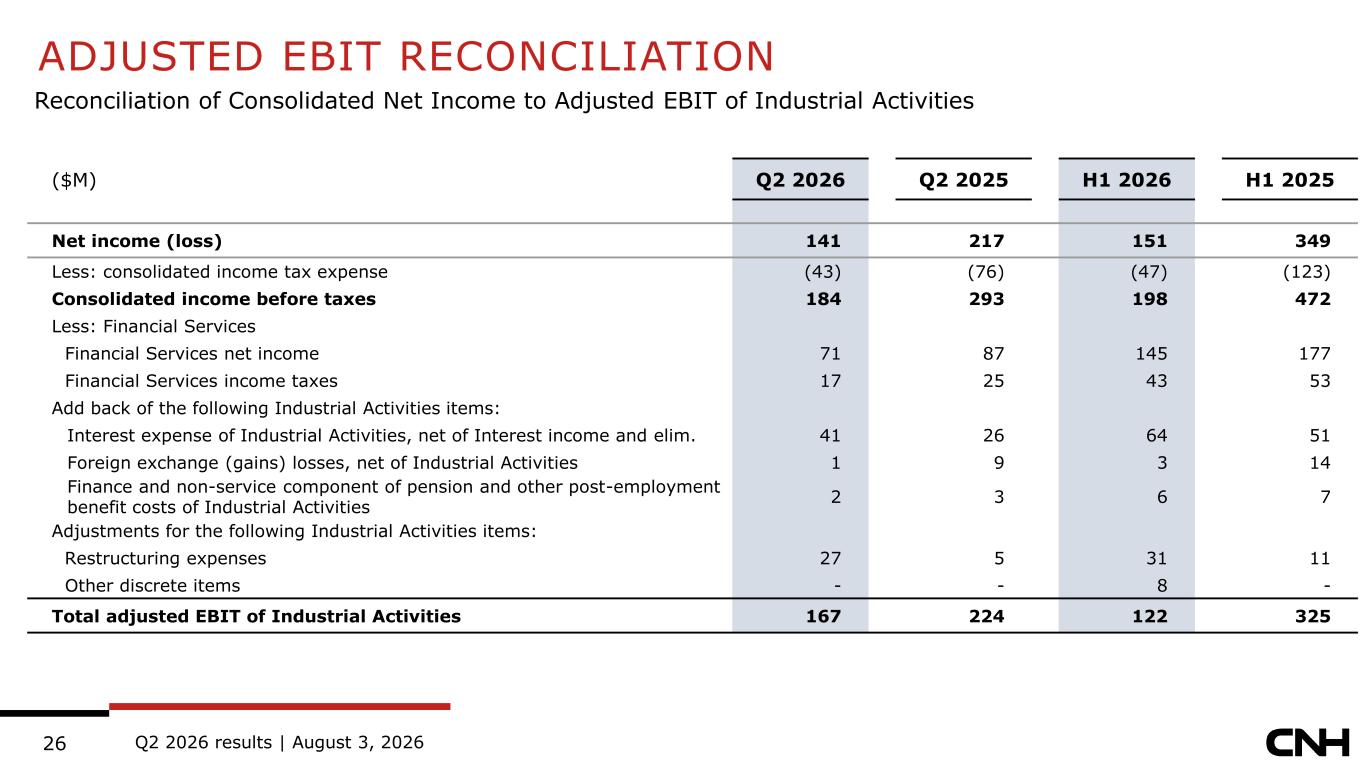
Q2 2026 results | August 3, 202626 ($M) Q2 2026 Q2 2025 H1 2026 H1 2025 Net income (loss) 141 217 151 349 Less: consolidated income tax expense (43) (76) (47) (123) Consolidated income before taxes 184 293 198 472 Less: Financial Services Financial Services net income 71 87 145 177 Financial Services income taxes 17 25 43 53 Add back of the following Industrial Activities items: Interest expense of Industrial Activities, net of Interest income and elim. 41 26 64 51 Foreign exchange (gains) losses, net of Industrial Activities 1 9 3 14 Finance and non-service component of pension and other post-employment benefit costs of Industrial Activities 2 3 6 7 Adjustments for the following Industrial Activities items: Restructuring expenses 27 5 31 11 Other discrete items - - 8 - Total adjusted EBIT of Industrial Activities 167 224 122 325 ADJUSTED EBIT RECONCILIATION Reconciliation of Consolidated Net Income to Adjusted EBIT of Industrial Activities
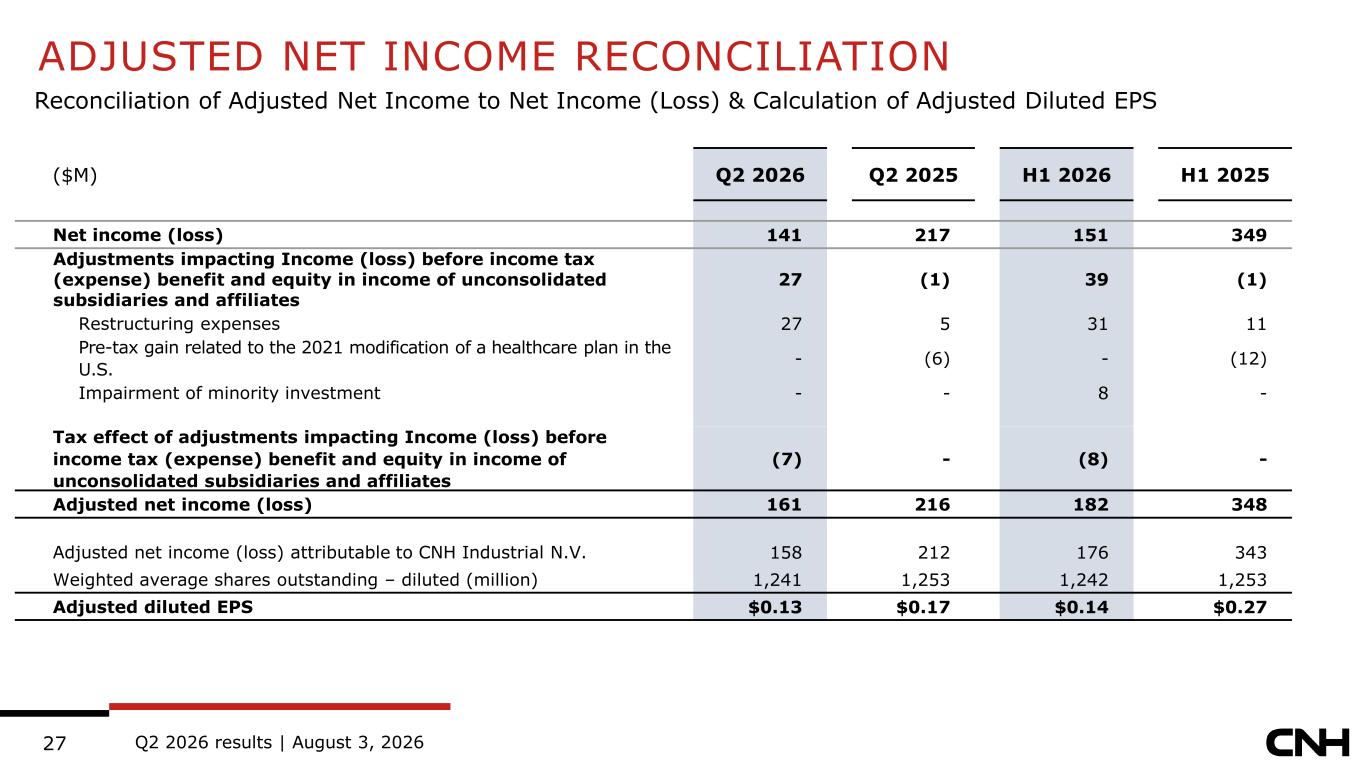
Q2 2026 results | August 3, 202627 ($M) Q2 2026 Q2 2025 H1 2026 H1 2025 Net income (loss) 141 217 151 349 Adjustments impacting Income (loss) before income tax (expense) benefit and equity in income of unconsolidated subsidiaries and affiliates 27 (1) 39 (1) Restructuring expenses 27 5 31 11 Pre-tax gain related to the 2021 modification of a healthcare plan in the U.S. - (6) - (12) Impairment of minority investment - - 8 - Tax effect of adjustments impacting Income (loss) before income tax (expense) benefit and equity in income of unconsolidated subsidiaries and affiliates (7) - (8) - Adjusted net income (loss) 161 216 182 348 Adjusted net income (loss) attributable to CNH Industrial N.V. 158 212 176 343 Weighted average shares outstanding – diluted (million) 1,241 1,253 1,242 1,253 Adjusted diluted EPS $0.13 $0.17 $0.14 $0.27 ADJUSTED NET INCOME RECONCILIATION Reconciliation of Adjusted Net Income to Net Income (Loss) & Calculation of Adjusted Diluted EPS
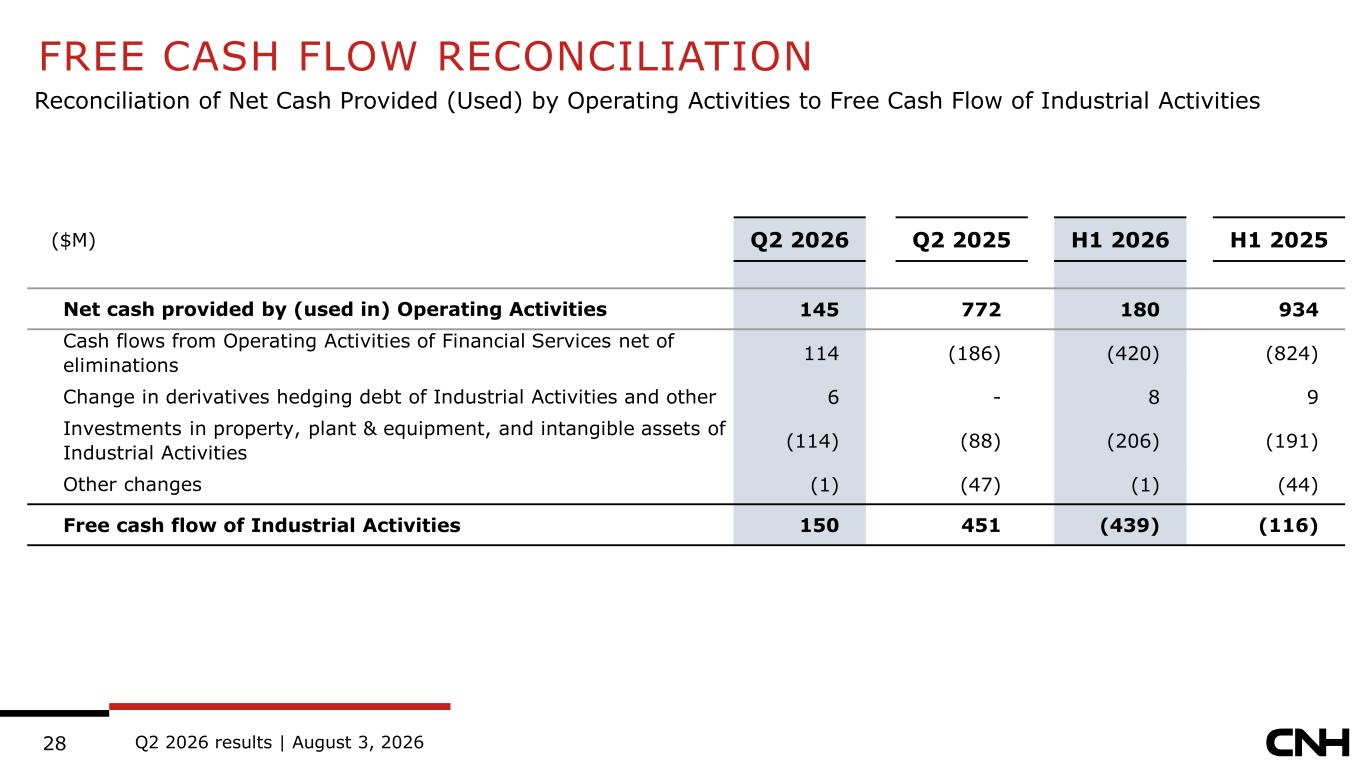
Q2 2026 results | August 3, 202628 ($M) Q2 2026 Q2 2025 H1 2026 H1 2025 Net cash provided by (used in) Operating Activities 145 772 180 934 Cash flows from Operating Activities of Financial Services net of eliminations 114 (186) (420) (824) Change in derivatives hedging debt of Industrial Activities and other 6 - 8 9 Investments in property, plant & equipment, and intangible assets of Industrial Activities (114) (88) (206) (191) Other changes (1) (47) (1) (44) Free cash flow of Industrial Activities 150 451 (439) (116) FREE CASH FLOW RECONCILIATION Reconciliation of Net Cash Provided (Used) by Operating Activities to Free Cash Flow of Industrial Activities
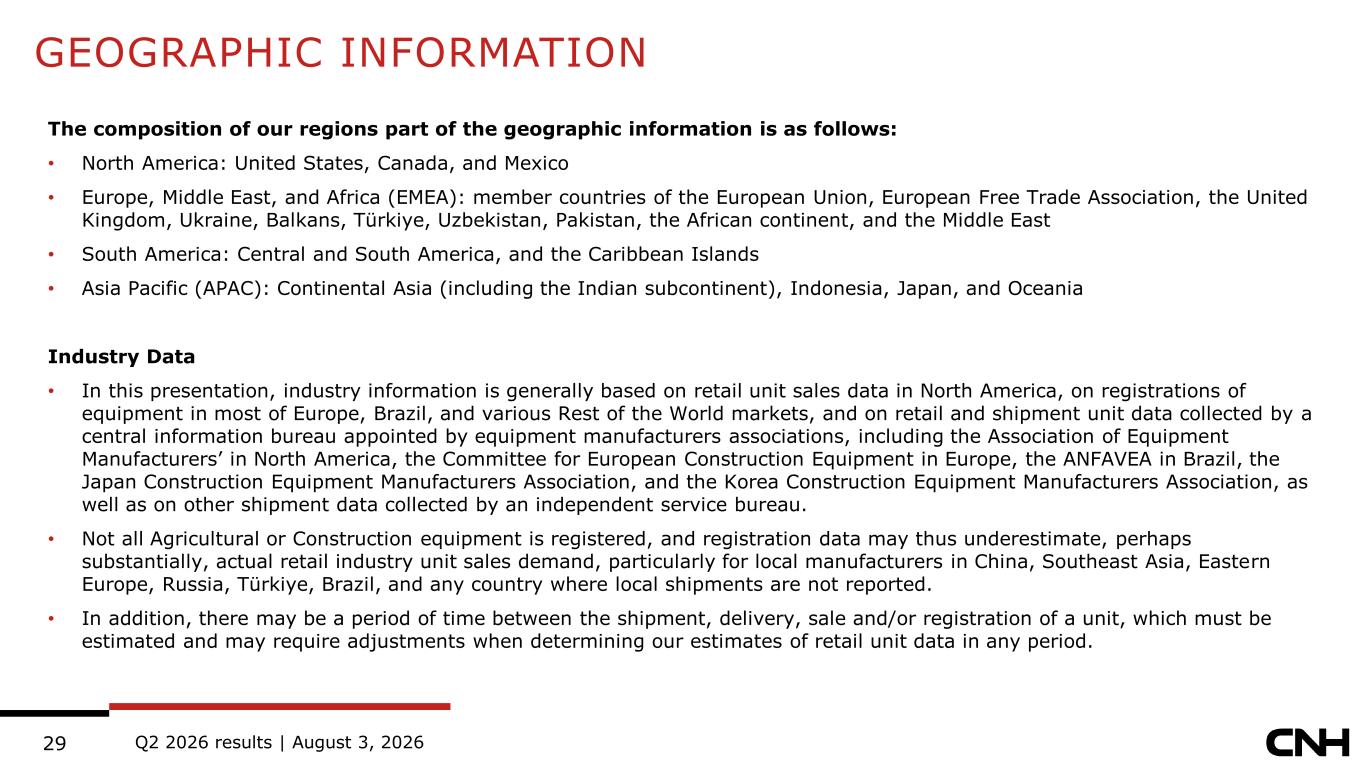
Q2 2026 results | August 3, 202629 The composition of our regions part of the geographic information is as follows: • North America: United States, Canada, and Mexico • Europe, Middle East, and Africa (EMEA): member countries of the European Union, European Free Trade Association, the United Kingdom, Ukraine, Balkans, Türkiye, Uzbekistan, Pakistan, the African continent, and the Middle East • South America: Central and South America, and the Caribbean Islands • Asia Pacific (APAC): Continental Asia (including the Indian subcontinent), Indonesia, Japan, and Oceania Industry Data • In this presentation, industry information is generally based on retail unit sales data in North America, on registrations of equipment in most of Europe, Brazil, and various Rest of the World markets, and on retail and shipment unit data collected by a central information bureau appointed by equipment manufacturers associations, including the Association of Equipment Manufacturers’ in North America, the Committee for European Construction Equipment in Europe, the ANFAVEA in Brazil, the Japan Construction Equipment Manufacturers Association, and the Korea Construction Equipment Manufacturers Association, as well as on other shipment data collected by an independent service bureau. • Not all Agricultural or Construction equipment is registered, and registration data may thus underestimate, perhaps substantially, actual retail industry unit sales demand, particularly for local manufacturers in China, Southeast Asia, Eastern Europe, Russia, Türkiye, Brazil, and any country where local shipments are not reported. • In addition, there may be a period of time between the shipment, delivery, sale and/or registration of a unit, which must be estimated and may require adjustments when determining our estimates of retail unit data in any period. GEOGRAPHIC INFORMATION
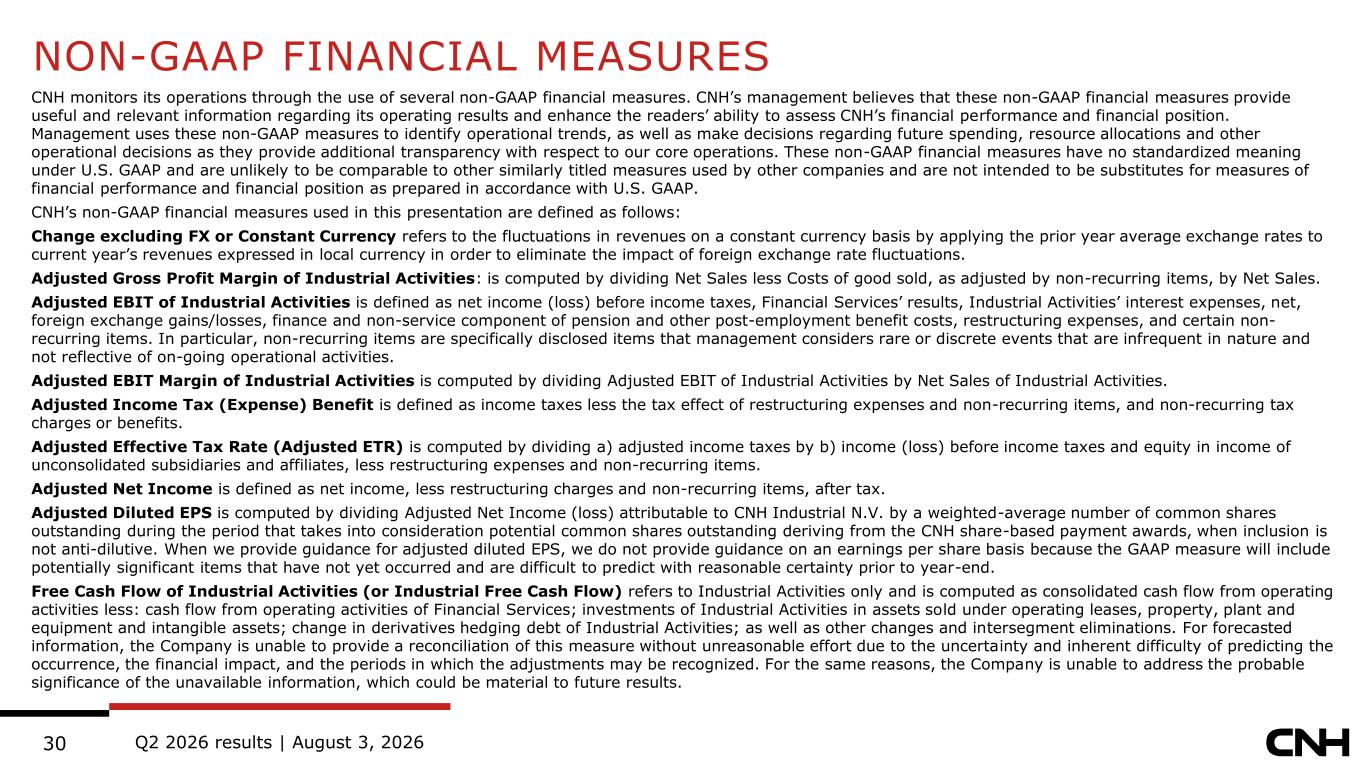
Q2 2026 results | August 3, 202630 CNH monitors its operations through the use of several non-GAAP financial measures. CNH’s management believes that these non-GAAP financial measures provide useful and relevant information regarding its operating results and enhance the readers’ ability to assess CNH’s financial performance and financial position. Management uses these non-GAAP measures to identify operational trends, as well as make decisions regarding future spending, resource allocations and other operational decisions as they provide additional transparency with respect to our core operations. These non-GAAP financial measures have no standardized meaning under U.S. GAAP and are unlikely to be comparable to other similarly titled measures used by other companies and are not intended to be substitutes for measures of financial performance and financial position as prepared in accordance with U.S. GAAP. CNH’s non-GAAP financial measures used in this presentation are defined as follows: Change excluding FX or Constant Currency refers to the fluctuations in revenues on a constant currency basis by applying the prior year average exchange rates to current year’s revenues expressed in local currency in order to eliminate the impact of foreign exchange rate fluctuations. Adjusted Gross Profit Margin of Industrial Activities: is computed by dividing Net Sales less Costs of good sold, as adjusted by non-recurring items, by Net Sales. Adjusted EBIT of Industrial Activities is defined as net income (loss) before income taxes, Financial Services’ results, Industrial Activities’ interest expenses, net, foreign exchange gains/losses, finance and non-service component of pension and other post-employment benefit costs, restructuring expenses, and certain non- recurring items. In particular, non-recurring items are specifically disclosed items that management considers rare or discrete events that are infrequent in nature and not reflective of on-going operational activities. Adjusted EBIT Margin of Industrial Activities is computed by dividing Adjusted EBIT of Industrial Activities by Net Sales of Industrial Activities. Adjusted Income Tax (Expense) Benefit is defined as income taxes less the tax effect of restructuring expenses and non-recurring items, and non-recurring tax charges or benefits. Adjusted Effective Tax Rate (Adjusted ETR) is computed by dividing a) adjusted income taxes by b) income (loss) before income taxes and equity in income of unconsolidated subsidiaries and affiliates, less restructuring expenses and non-recurring items. Adjusted Net Income is defined as net income, less restructuring charges and non-recurring items, after tax. Adjusted Diluted EPS is computed by dividing Adjusted Net Income (loss) attributable to CNH Industrial N.V. by a weighted-average number of common shares outstanding during the period that takes into consideration potential common shares outstanding deriving from the CNH share-based payment awards, when inclusion is not anti-dilutive. When we provide guidance for adjusted diluted EPS, we do not provide guidance on an earnings per share basis because the GAAP measure will include potentially significant items that have not yet occurred and are difficult to predict with reasonable certainty prior to year-end. Free Cash Flow of Industrial Activities (or Industrial Free Cash Flow) refers to Industrial Activities only and is computed as consolidated cash flow from operating activities less: cash flow from operating activities of Financial Services; investments of Industrial Activities in assets sold under operating leases, property, plant and equipment and intangible assets; change in derivatives hedging debt of Industrial Activities; as well as other changes and intersegment eliminations. For forecasted information, the Company is unable to provide a reconciliation of this measure without unreasonable effort due to the uncertainty and inherent difficulty of predicting the occurrence, the financial impact, and the periods in which the adjustments may be recognized. For the same reasons, the Company is unable to address the probable significance of the unavailable information, which could be material to future results. NON-GAAP FINANCIAL MEASURES
31 INVESTOR RELATIONS CONTACTS investors.cnh.com investor.relations@cnh.com Jason Omerza +1 (630) 740 8079 jason.omerza@cnh.com Joe Recendez +1 (708) 932 5916 joseph.recendez@cnh.com