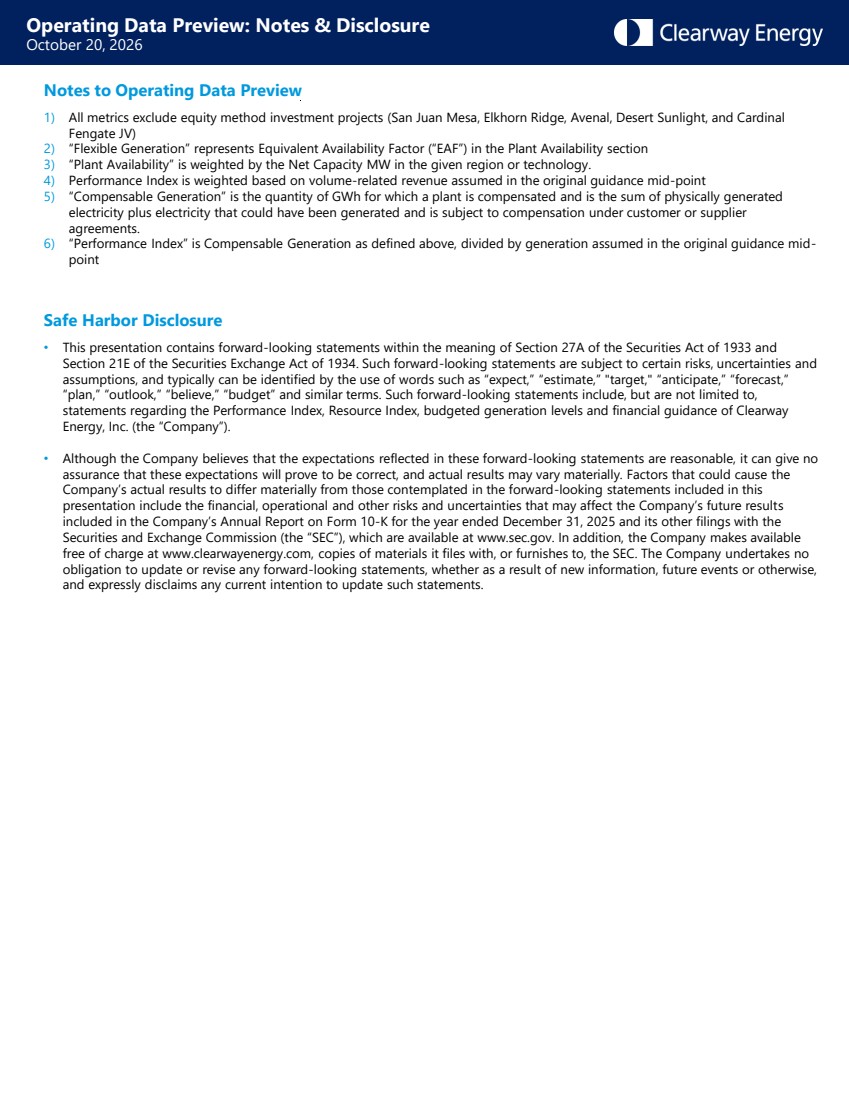
| Operating Data Preview: 3Q 2026 October 20, 2026 1Q 2026 2Q 2026 3Q 2026 4Q 2026 YTD 2026 West - CAISO 947 947 947 - 947 West - Other 708 708 708 - 708 Texas 1,288 1,288 1,288 - 1,288 Midwest 447 447 447 - 447 East 179 179 179 - 179 Total Wind 3,569 3,569 3,569 - 3,569 Total Solar 3,249 3,249 3,249 - 3,249 West - CAISO 92% 93% 94% - 93% West - Other 96% 95% 94% - 95% Texas 91% 89% 92% - 91% Midwest 97% 94% 83% - 92% East 94% 92% 88% - 92% Total Wind 93% 92% 91% - 92% Total Solar 98% 99% 97% - 98% Flexible Gen 89% 97% 94% - 93% West - CAISO 310 776 508 - 1,594 West - Other 586 545 404 - 1,535 Texas 1,413 1,399 1,138 - 3,950 Midwest 413 383 248 - 1,044 East 252 178 126 - 557 Total Wind 2,974 3,282 2,424 - 8,680 Total Solar 2,297 3,585 3,366 - 9,248 West - CAISO 73% 96% 94% - 90% West - Other 100% 100% 94% - 98% Texas 104% 93% 113% - 102% Midwest 100% 94% 81% - 93% East 104% 101% 116% - 105% Total Wind 94% 96% 98% - 95% Total Solar 99% 95% 93% - 95% Net Capacity (MW) Plant Availability (%) Compensable Generation (GWh) Performance Index (%) Key Highlights • Observed wind and solar resource in 3Q 2026 was in line with the updated forecasts underlying the Company’s revised 2026 financial guidance (issued with 2Q 2026 results on August 5, 2026), which incorporated this year’s strong El Niño / Southern Oscillation (“ENSO”) pattern; the Performance Index was consistent with quarterly CAFD expectations within the range of the 3Q 2026 sensitivity disclosure noted in the 2Q 2026 earnings presentation appendix. • Wind Compensable Generation in 3Q 2026 was in line with expectations, supported by favorable wind resource through much of the U.S. and liquidated damages paid by third-party OEMs. This was partially offset by minor variances driven by Midwest Wind availability. Solar resource was slightly below P-50 in the Western US. • 3Q 2026 Plant Availability in the Solar and Flexible Generation segments remained high at 97% and 94%, respectively. Plant Availability for 3Q 2026 in the Wind segment reflected improvement campaigns focused on highest-value assets in CAISO and Texas, while Midwest Wind and East Wind availability were driven by small projects using discontinued wind OEM technology, which are being addressed through an active improvement campaign. |
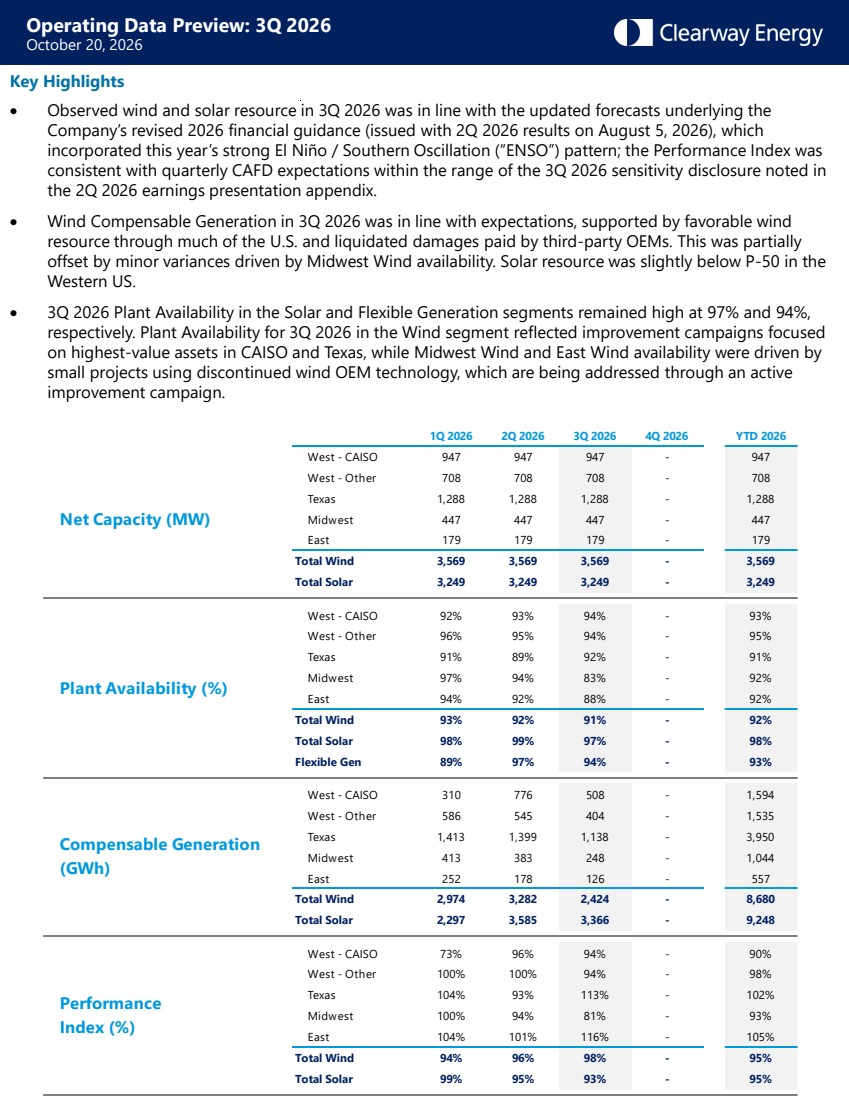
| Operating Data Preview: Notes & Disclosure October 20, 2026 Notes to Operating Data Preview 1) All metrics exclude equity method investment projects (San Juan Mesa, Elkhorn Ridge, Avenal, Desert Sunlight, and Cardinal Fengate JV) 2) “Flexible Generation” represents Equivalent Availability Factor (“EAF”) in the Plant Availability section 3) “Plant Availability” is weighted by the Net Capacity MW in the given region or technology. 4) Performance Index is weighted based on volume-related revenue assumed in the original guidance mid-point 5) “Compensable Generation” is the quantity of GWh for which a plant is compensated and is the sum of physically generated electricity plus electricity that could have been generated and is subject to compensation under customer or supplier agreements. 6) “Performance Index” is Compensable Generation as defined above, divided by generation assumed in the original guidance mid-point Safe Harbor Disclosure • This presentation contains forward-looking statements within the meaning of Section 27A of the Securities Act of 1933 and Section 21E of the Securities Exchange Act of 1934. Such forward-looking statements are subject to certain risks, uncertainties and assumptions, and typically can be identified by the use of words such as “expect,” “estimate,” "target," “anticipate,” “forecast,” “plan,” “outlook,” “believe,” “budget” and similar terms. Such forward-looking statements include, but are not limited to, statements regarding the Performance Index, Resource Index, budgeted generation levels and financial guidance of Clearway Energy, Inc. (the “Company”). • Although the Company believes that the expectations reflected in these forward-looking statements are reasonable, it can give no assurance that these expectations will prove to be correct, and actual results may vary materially. Factors that could cause the Company’s actual results to differ materially from those contemplated in the forward-looking statements included in this presentation include the financial, operational and other risks and uncertainties that may affect the Company’s future results included in the Company’s Annual Report on Form 10-K for the year ended December 31, 2025 and its other filings with the Securities and Exchange Commission (the “SEC”), which are available at www.sec.gov. In addition, the Company makes available free of charge at www.clearwayenergy.com, copies of materials it files with, or furnishes to, the SEC. The Company undertakes no obligation to update or revise any forward-looking statements, whether as a result of new information, future events or otherwise, and expressly disclaims any current intention to update such statements. |