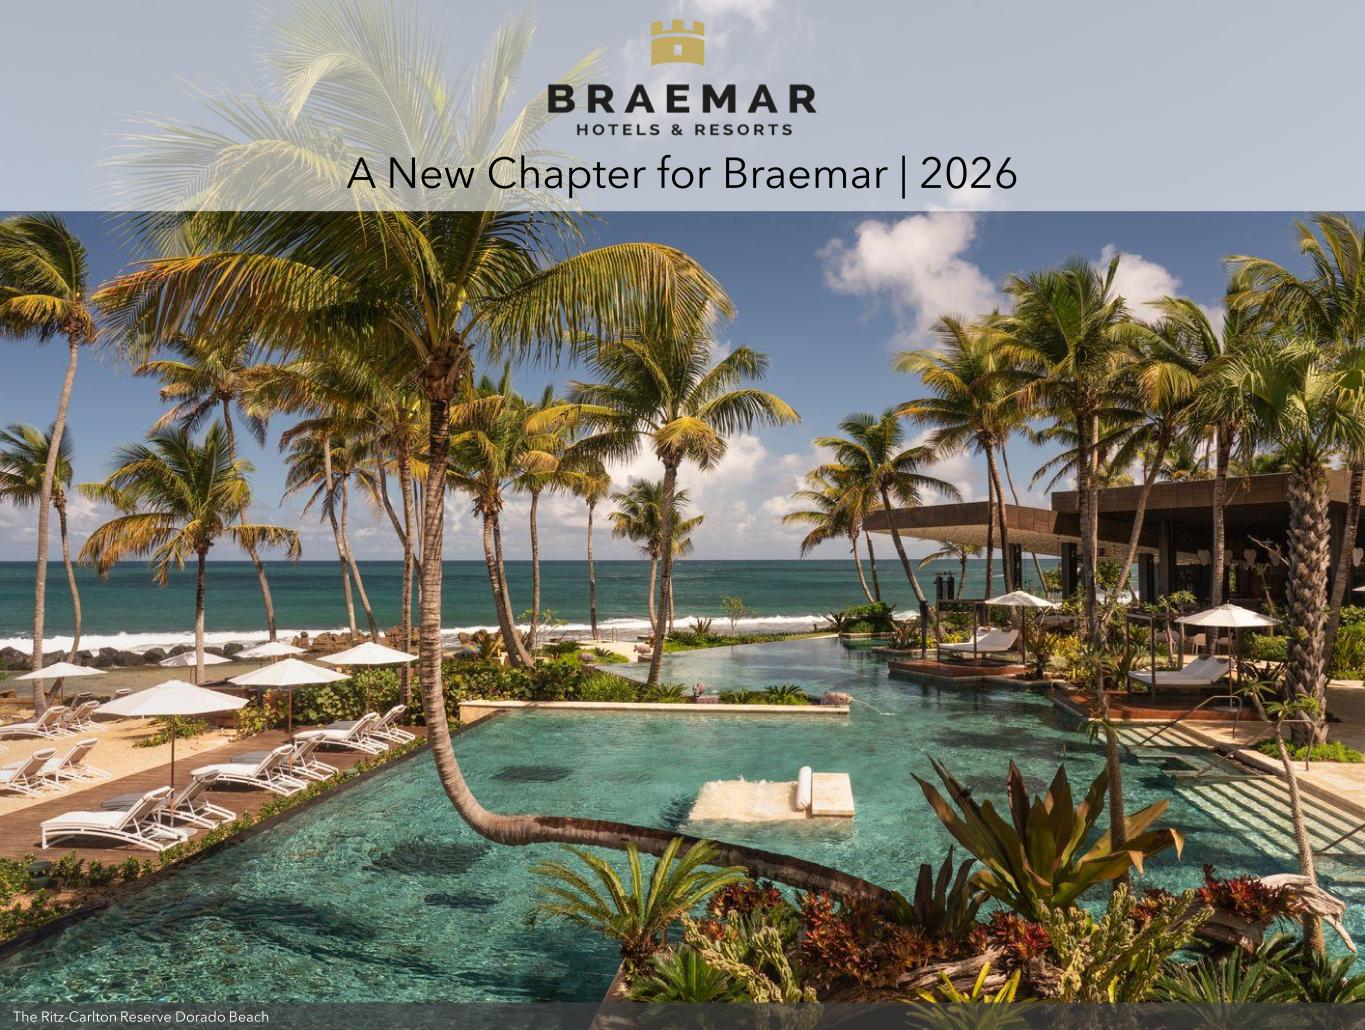
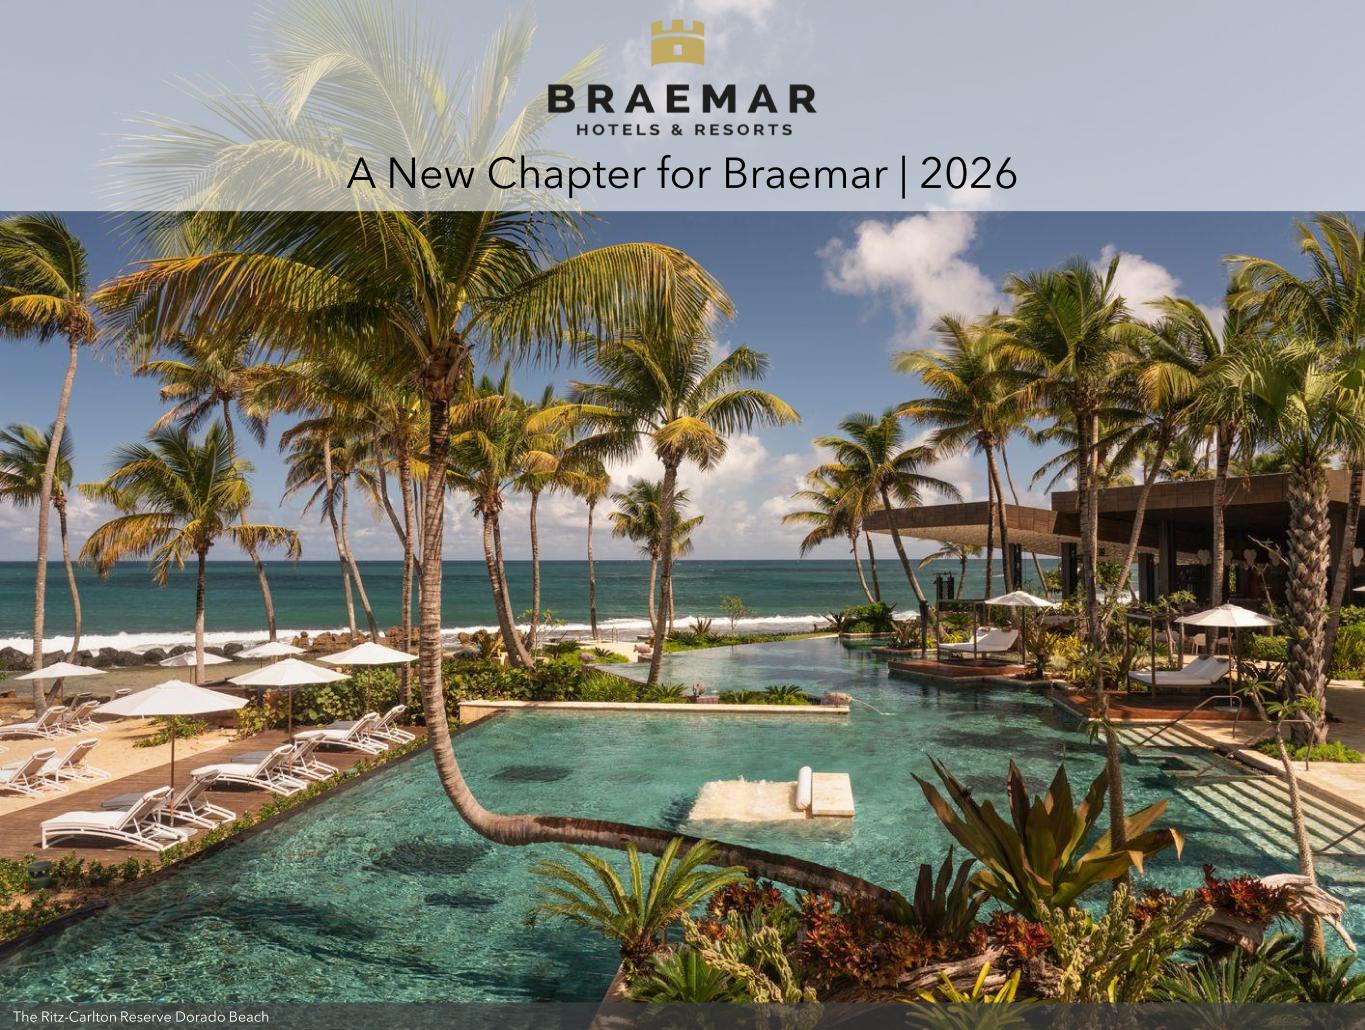
A New Chapter for Braemar | 2026 The Ritz-Carlton Reserve Dorado Beach
Investor Presentation | October 2026 2 Forward-Looking Statements In keeping with the SEC's "Safe Harbor" guidelines, certain statements made during this presentation could be considered forward-looking and subject to certain risks and uncertainties that could cause results to differ materially from those projected. When we use the words "will likely result," "may," "anticipate," "estimate," "should," "expect," "believe," "intend," or similar expressions, we intend to identify forward-looking statements. Such forward-looking statements include, but are not limited to, our business and investment strategy, our understanding of our competition, current market trends and opportunities, projected operating results, and projected capital expenditures. These forward-looking statements are subject to known and unknown risks and uncertainties, which could cause actual results to differ materially from those anticipated including, without limitation: the Risk Factors discussed in our most recent Annual Report on Form 10-K; rising interest rates and inflation; macroeconomic conditions, such as a prolonged period of weak economic growth and volatility in the capital and financial markets; uncertainty in the business sector and market volatility; general and economic business conditions affecting the lodging and travel industry; our ability to repay, refinance or restructure our debt and the debt of certain of our subsidiaries; anticipated or expected purchases or sales of assets; our projected operating results; completion of any pending transactions; risks associated with our ability to effectuate our dividend policy, including factors such as operating results and the economic outlook influencing our board’s decision whether to pay further dividends at levels previously disclosed or to use available cash to pay dividends; general volatility of the capital markets and the market price of our common stock; changes in our business or investment strategy; availability, terms and deployment of capital; availability of qualified personnel; changes in our industry and the market in which we operate, interest rates or the general economy, the degree and nature of our competition, legislative and regulatory changes, including changes to the Internal Revenue Code of 1986, as amended (the “Code”), and related rules, regulations and interpretations governing the taxation of REITs; and limitations imposed on our business and our ability to satisfy complex rules in order for us to qualify as a REIT for federal income tax purposes. These and other risk factors are more fully discussed in the Company's filings with the Securities and Exchange Commission. This presentation is for informational purposes only and is not an offer to sell, or a solicitation of an offer to buy or sell, any securities of Braemar Hotels & Resorts Inc. or any of its respective affiliates, and may not be relied upon in connection with the purchase or sale of any such security. Prior to investing in Braemar, potential investors should carefully review Braemar’s periodic filings with the Securities and Exchange Commission, including, but not limited to, Braemar’s most current Form 10-K, Form 10-Q and Form 8-Ks, including the risk factors included therein.
Investor Presentation | October 2026 3 Non-GAAP Measures This presentation contains non-GAAP financial measures, including EBITDA, EBITDAre, Adjusted EBITDAre, Hotel EBITDA, Comparable Hotel EBITDA, Comparable Hotel EBITDA Margin, FFO, NAREIT FFO, Adjusted FFO, Net Debt and Net Debt to Gross Assets. Management believes these measures are useful to investors because they exclude items that do not reflect the ongoing operating performance of the Company's hotels — principally depreciation and amortization, which is substantial for a real estate owner and does not correlate with the change in value of the Company's properties, together with financing costs, income taxes, impairment charges, gains and losses on asset dispositions, and costs associated with transactions and the Company's transition to self-management. Presenting results on this basis allows period-to-period comparisons of hotel-level and corporate operating performance, facilitates comparison with other lodging REITs that report similar measures, and reflects how management evaluates the portfolio, allocates capital and measures the performance of the Company's hotel managers. These measures are also used in the Company's internal budgeting and forecasting and, in the case of Net Debt and Net Debt to Gross Assets, in evaluating leverage and balance sheet capacity. These measures should not be considered in isolation or as substitutes for net income (loss), operating income, cash flow from operating activities, or any other measure prepared in accordance with GAAP, and they are not indicative of funds available to meet the Company's cash needs, including the ability to fund distributions. Because these measures are not standardized, the Company's presentation may not be comparable to similarly titled measures reported by other companies. Reconciliations of the historical non-GAAP measures used in this presentation to their most directly comparable GAAP measures appear in the appendix to this presentation. EBITDA is net income (loss) before interest expense and amortization of loan costs, depreciation and amortization, income taxes, and equity in (earnings) loss of unconsolidated entities, and after the Company's portion of EBITDA of OpenKey. EBITDAre is EBITDA further adjusted to exclude impairment charges on real estate and (gain) loss on the disposition of assets and hotel property, as defined by NAREIT. EBITDA yield is defined as trailing twelve month EBITDA divided by the purchase price or debt amount. A capitalization rate is determined by dividing the property's net operating income by the purchase price. Net operating income is the property's Hotel EBITDA minus a capital expense reserve of either 4% or 5% of gross revenues. Hotel EBITDA flow-through is the change in Hotel EBITDA divided by the change in total revenues. Adjusted EBITDAre is EBITDAre further adjusted to exclude amortization of favorable (unfavorable) contract assets and liabilities, transaction and conversion costs, other (income) loss, write-off of loan costs and exit fees, realized and unrealized (gain) loss on derivatives, stock- and unit-based compensation, legal, advisory and settlement costs, advisory services incentive fees, (gain) loss on extinguishment of debt, (gain) loss on insurance settlement, and severance. Hotel EBITDA is property-level net income (loss) before interest expense and amortization of loan costs, depreciation and amortization, income taxes and non-hotel EBITDA ownership expense, less EBITDA attributable to noncontrolling interests in consolidated entities. Comparable Hotel EBITDA further adjusts Hotel EBITDA to present results for all periods as though each hotel had been owned for the full period. Hotel EBITDA Margin is Hotel EBITDA divided by total hotel revenue. FFO is net income (loss) computed in accordance with GAAP, excluding gains and losses from the sale of properties and impairment charges on depreciable real estate, plus real estate– related depreciation and amortization, and after adjustments for unconsolidated entities and noncontrolling interests. NAREIT FFO is FFO as defined by NAREIT. Adjusted FFO is NAREIT FFO further adjusted for items the Company does not consider indicative of ongoing operating performance, consistent with the adjustments described under Adjusted EBITDAre. Net Debt is total indebtedness less unrestricted cash, restricted cash and the Company's loan receivable. Gross Assets is total assets plus accumulated depreciation. Net Debt to Gross Assets is Net Debt divided by Gross Assets. RevPAR, Total RevPAR, ADR and occupancy are hotel operating statistics and are not non-GAAP financial measures. Comparable operating statistics present all periods as though each hotel had been owned for the full period. The Company does not provide a reconciliation of its full year 2027 guidance for Adjusted EBITDAre, NAREIT FFO per diluted share, Adjusted FFO per diluted share or Comparable Hotel EBITDA Margin to the most directly comparable forward-looking GAAP financial measures, because it is unable to predict with reasonable certainty, and without unreasonable effort, the amount or timing of certain items required for such a reconciliation. These items include, but are not limited to, impairment charges on real estate, gains and losses on the disposition of assets and hotel properties, gains and losses on the extinguishment of debt, realized and unrealized gains and losses on derivatives, gains and losses on insurance settlements, transaction and conversion costs, severance, and the final terms and timing of the refinancing transactions described in this presentation. These items are uncertain, depend on factors outside the Company's control and could have a material effect on GAAP results for the guidance period. For the same reason, the Company is unable to address the probable significance of the unavailable information.
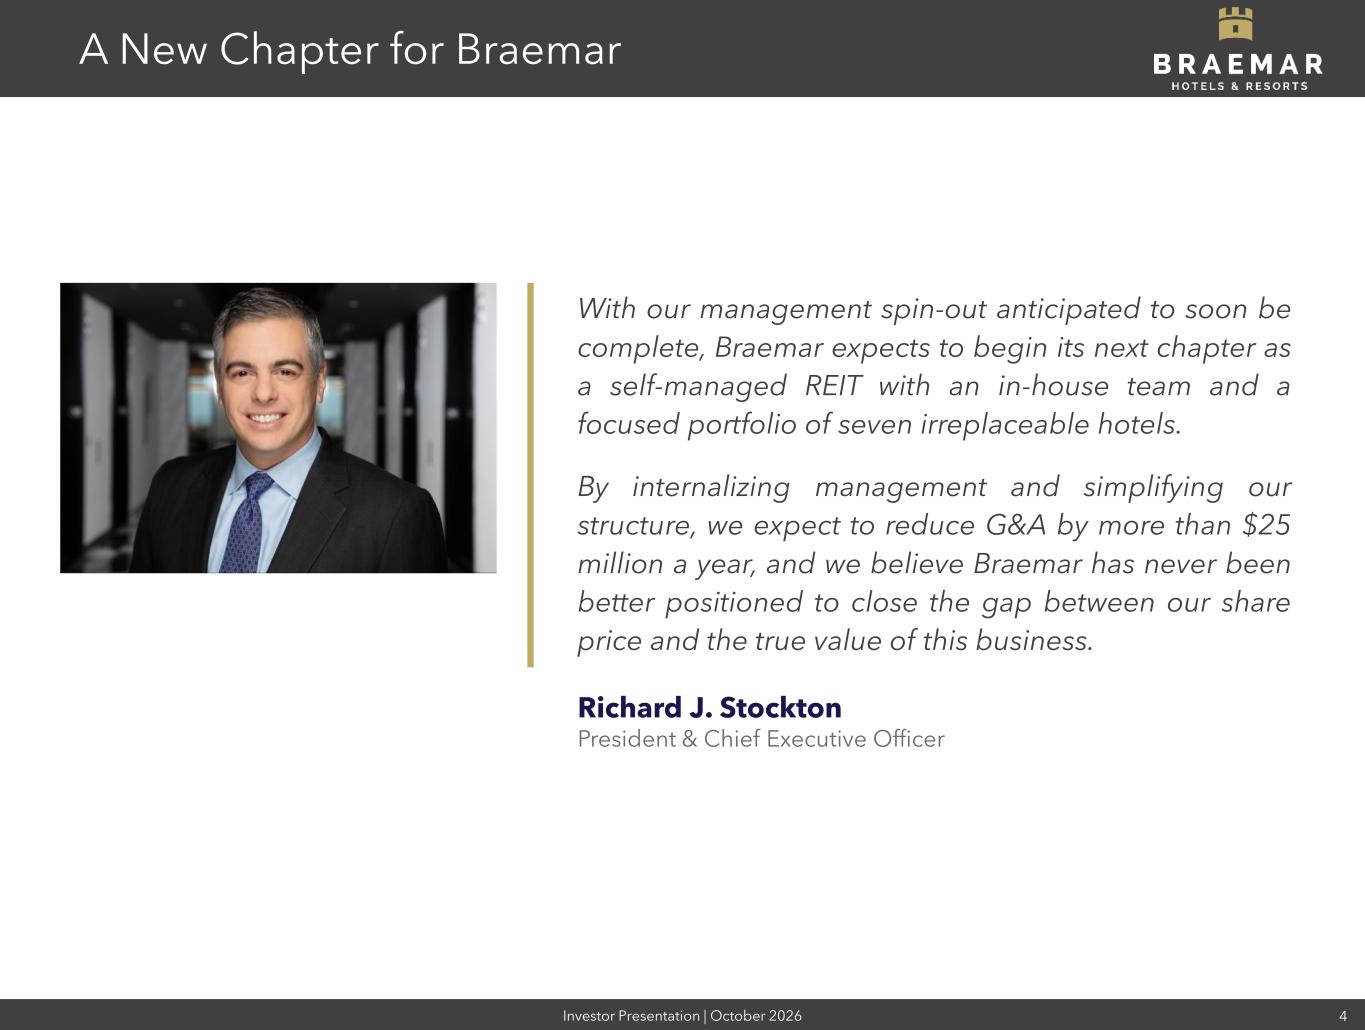
Investor Presentation | October 2026 4 A New Chapter for Braemar With our management spin-out anticipated to soon be complete, Braemar expects to begin its next chapter as a self-managed REIT with an in-house team and a focused portfolio of seven irreplaceable hotels. By internalizing management and simplifying our structure, we expect to reduce G&A by more than $25 million a year, and we believe Braemar has never been better positioned to close the gap between our share price and the true value of this business. Richard J. Stockton President & Chief Executive Officer
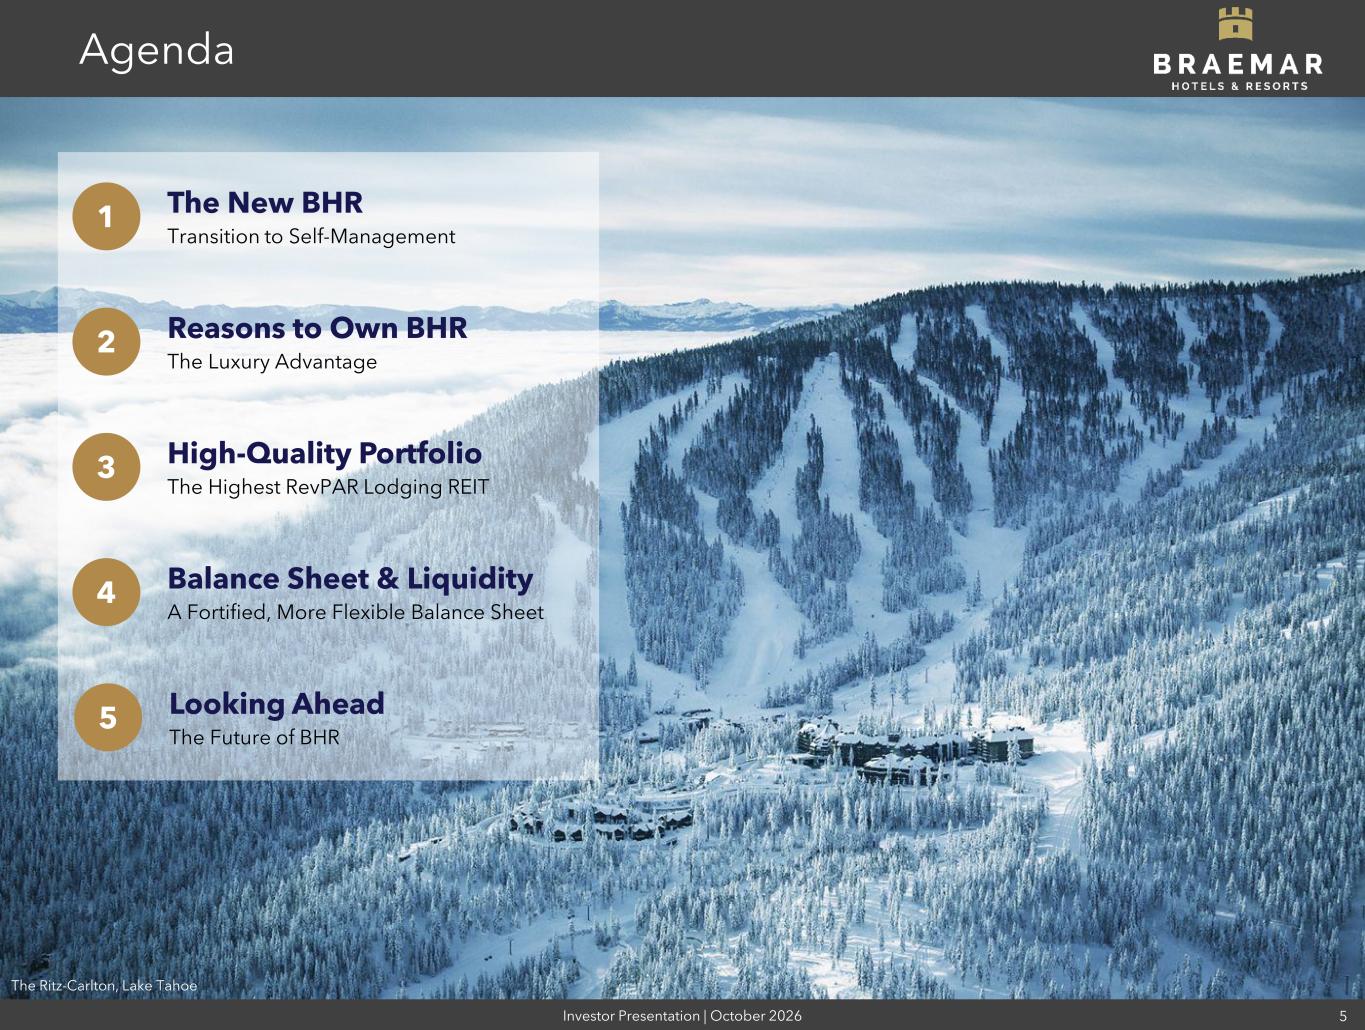
Investor Presentation | October 2026 5 Agenda 1 The New BHR Transition to Self-Management 2 Reasons to Own BHR The Luxury Advantage 3 High-Quality Portfolio The Highest RevPAR Lodging REIT 5 Looking Ahead The Future of BHR The Ritz-Carlton, Lake Tahoe 4 Balance Sheet & Liquidity A Fortified, More Flexible Balance Sheet

The New BHR Transition to Self-Management The Ritz-Carlton Reserve Dorado Beach
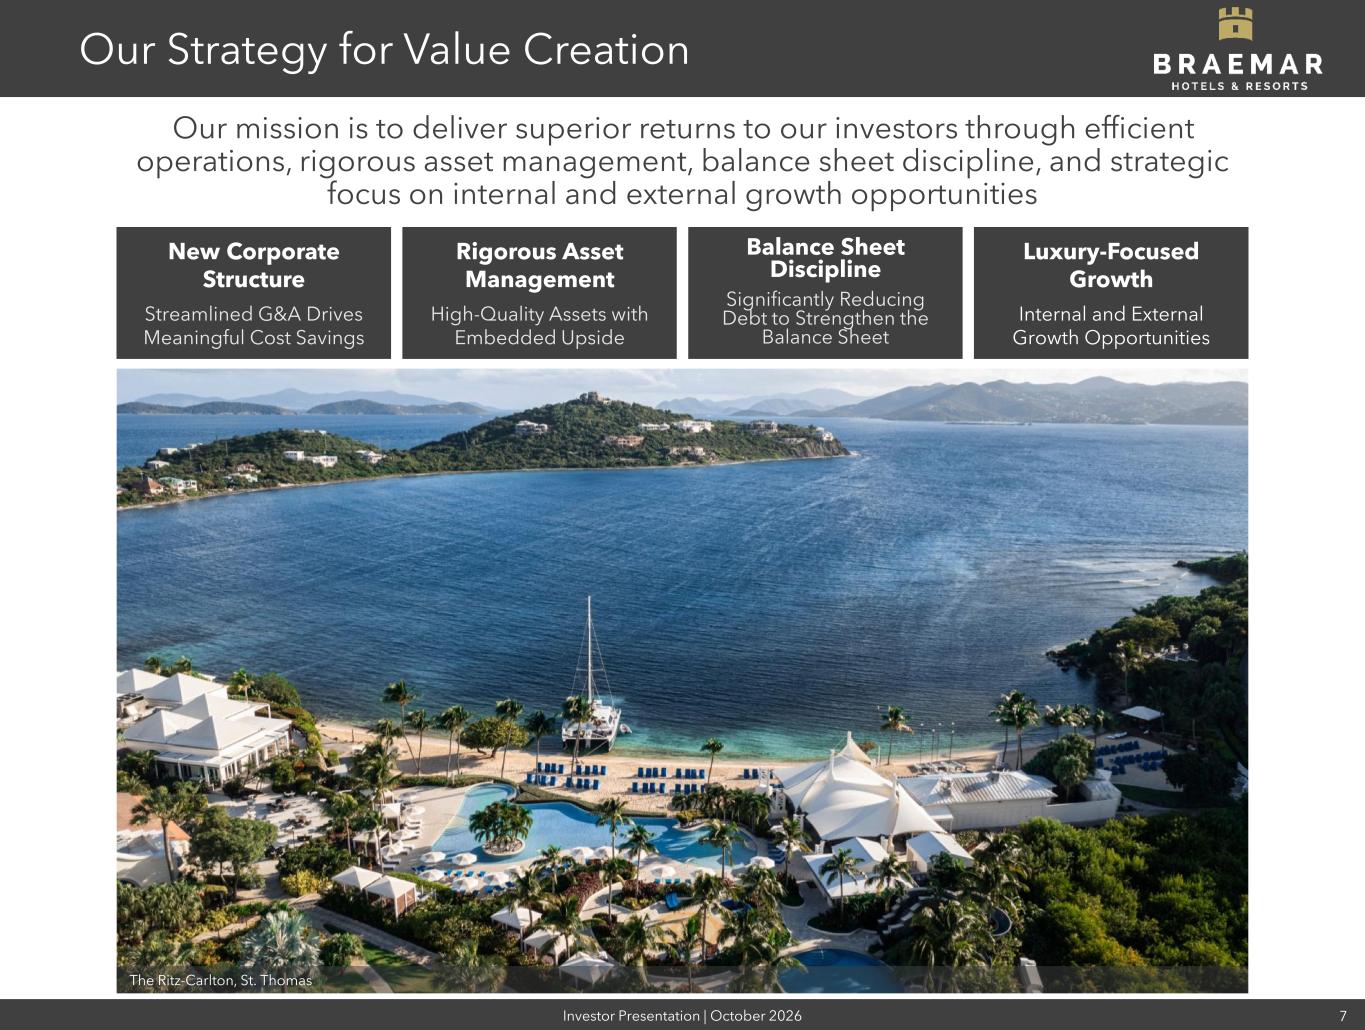
Investor Presentation | October 2026 7 Our Strategy for Value Creation Our mission is to deliver superior returns to our investors through efficient operations, rigorous asset management, balance sheet discipline, and strategic focus on internal and external growth opportunities New Corporate Structure Streamlined G&A Drives Meaningful Cost Savings Rigorous Asset Management High-Quality Assets with Embedded Upside Balance Sheet Discipline Significantly Reducing Debt to Strengthen the Balance Sheet Luxury-Focused Growth Internal and External Growth Opportunities The Ritz-Carlton, St. Thomas
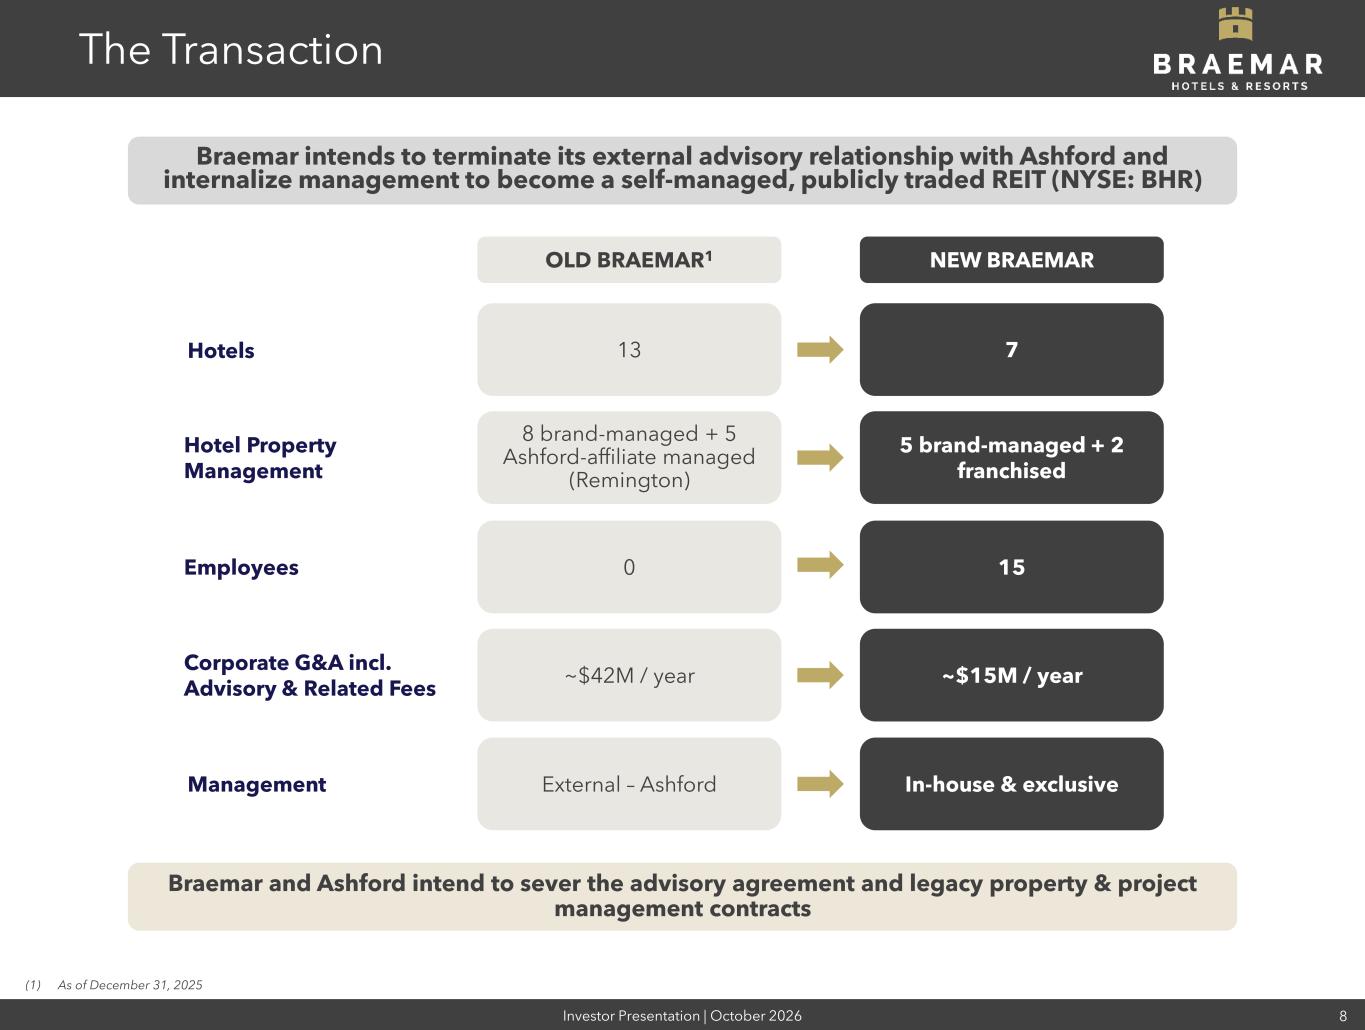
Investor Presentation | October 2026 8 The Transaction OLD BRAEMAR1 NEW BRAEMAR Hotels 13 7 Corporate G&A incl. Advisory & Related Fees ~$42M / year ~$15M / year Management External – Ashford In-house & exclusive Braemar and Ashford intend to sever the advisory agreement and legacy property & project management contracts (1) As of December 31, 2025 Employees 0 15 Hotel Property Management 8 brand-managed + 5 Ashford-affiliate managed (Remington) 5 brand-managed + 2 franchised Braemar intends to terminate its external advisory relationship with Ashford and internalize management to become a self-managed, publicly traded REIT (NYSE: BHR)
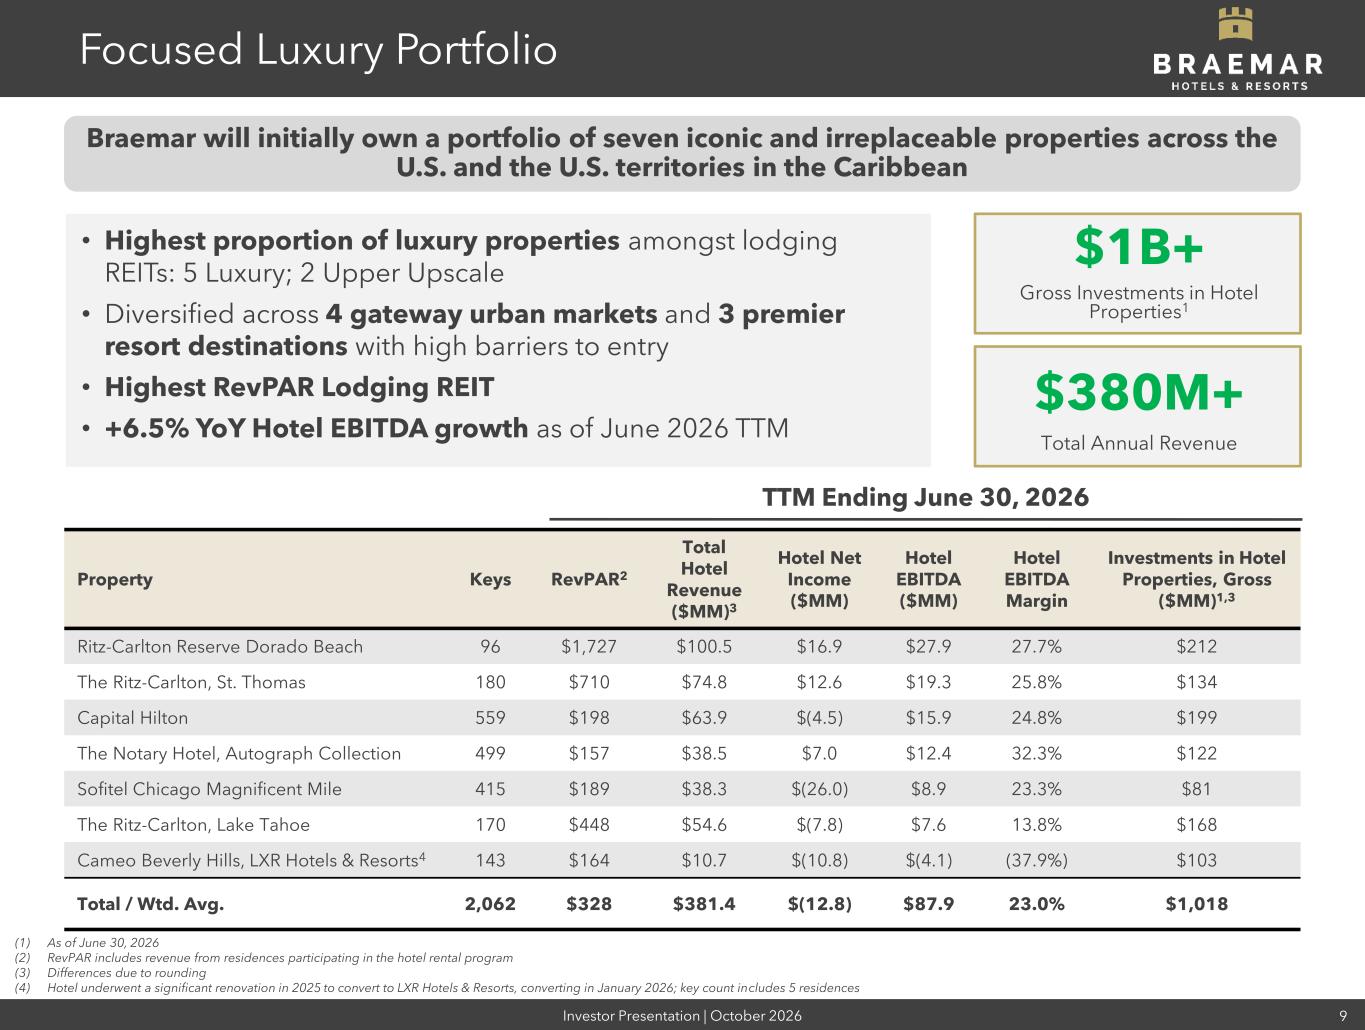
Investor Presentation | October 2026 9 Focused Luxury Portfolio (1) As of June 30, 2026 (2) RevPAR includes revenue from residences participating in the hotel rental program (3) Differences due to rounding (4) Hotel underwent a significant renovation in 2025 to convert to LXR Hotels & Resorts, converting in January 2026; key count includes 5 residences • Highest proportion of luxury properties amongst lodging REITs: 5 Luxury; 2 Upper Upscale • Diversified across 4 gateway urban markets and 3 premier resort destinations with high barriers to entry • Highest RevPAR Lodging REIT • +6.5% YoY Hotel EBITDA growth as of June 2026 TTM $1B+ Gross Investments in Hotel Properties1 $380M+ Total Annual Revenue Property Keys RevPAR2 Total Hotel Revenue ($MM)3 Hotel Net Income ($MM) Hotel EBITDA ($MM) Hotel EBITDA Margin Investments in Hotel Properties, Gross ($MM)1,3 Ritz-Carlton Reserve Dorado Beach 96 $1,727 $100.5 $16.9 $27.9 27.7% $212 The Ritz-Carlton, St. Thomas 180 $710 $74.8 $12.6 $19.3 25.8% $134 Capital Hilton 559 $198 $63.9 $(4.5) $15.9 24.8% $199 The Notary Hotel, Autograph Collection 499 $157 $38.5 $7.0 $12.4 32.3% $122 Sofitel Chicago Magnificent Mile 415 $189 $38.3 $(26.0) $8.9 23.3% $81 The Ritz-Carlton, Lake Tahoe 170 $448 $54.6 $(7.8) $7.6 13.8% $168 Cameo Beverly Hills, LXR Hotels & Resorts4 143 $164 $10.7 $(10.8) $(4.1) (37.9%) $103 Total / Wtd. Avg. 2,062 $328 $381.4 $(12.8) $87.9 23.0% $1,018 TTM Ending June 30, 2026 Braemar will initially own a portfolio of seven iconic and irreplaceable properties across the U.S. and the U.S. territories in the Caribbean
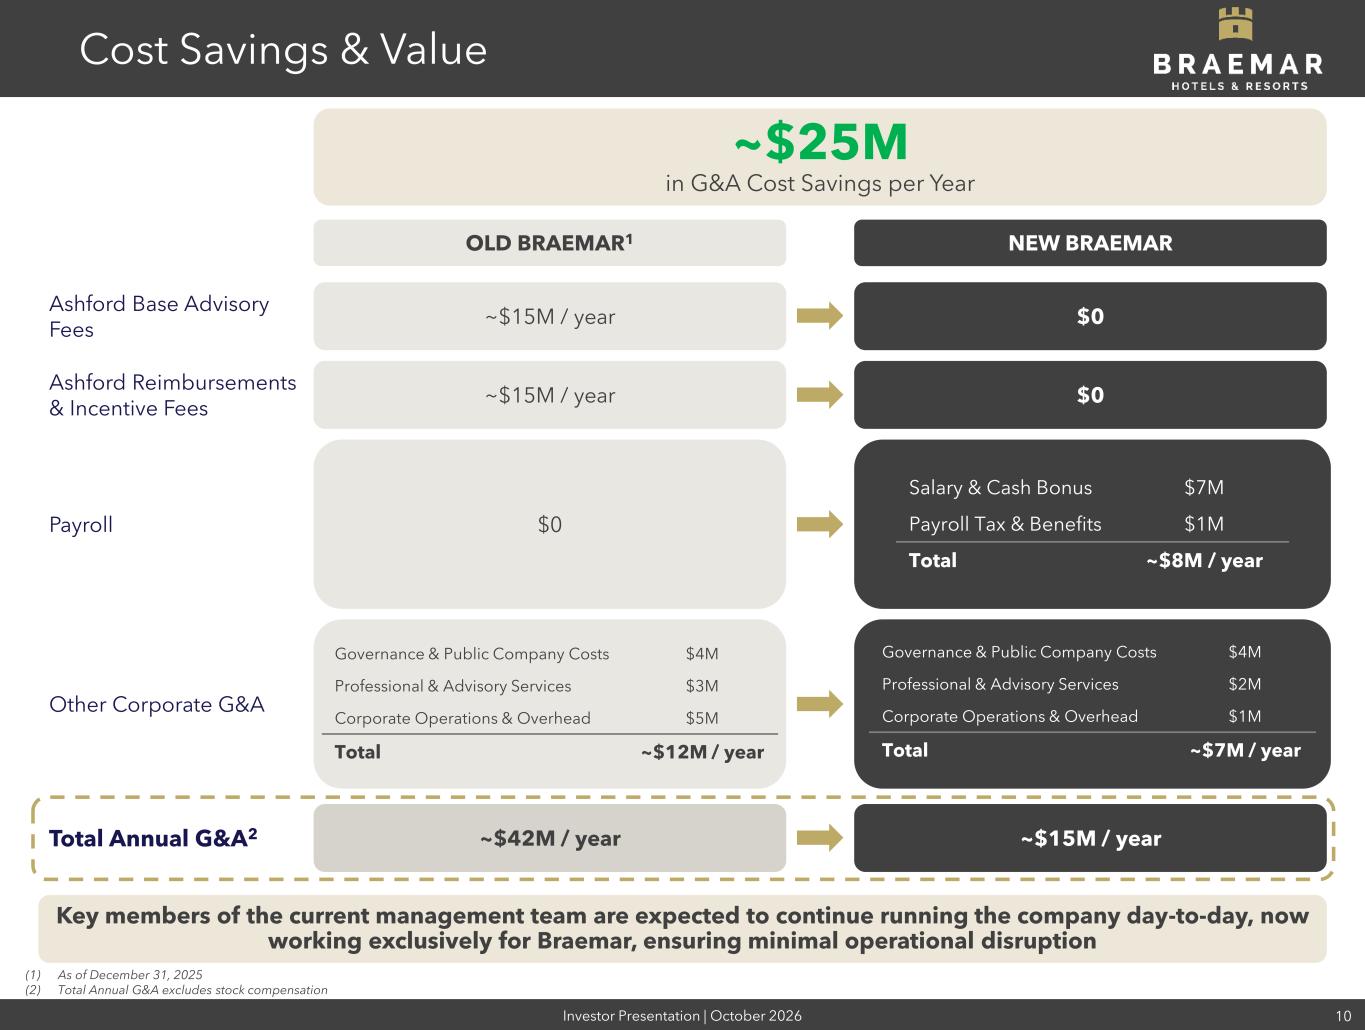
Investor Presentation | October 2026 10 Cost Savings & Value OLD BRAEMAR1 NEW BRAEMAR Ashford Base Advisory Fees ~$15M / year $0 Ashford Reimbursements & Incentive Fees ~$15M / year $0 Payroll $0 Other Corporate G&A ~$25M in G&A Cost Savings per Year Total Annual G&A2 ~$42M / year ~$15M / year Key members of the current management team are expected to continue running the company day-to-day, now working exclusively for Braemar, ensuring minimal operational disruption Salary & Cash Bonus $7M Payroll Tax & Benefits $1M Total ~$8M / year Governance & Public Company Costs $4M Professional & Advisory Services $2M Corporate Operations & Overhead $1M Total ~$7M / year Governance & Public Company Costs $4M Professional & Advisory Services $3M Corporate Operations & Overhead $5M Total ~$12M / year (1) As of December 31, 2025 (2) Total Annual G&A excludes stock compensation
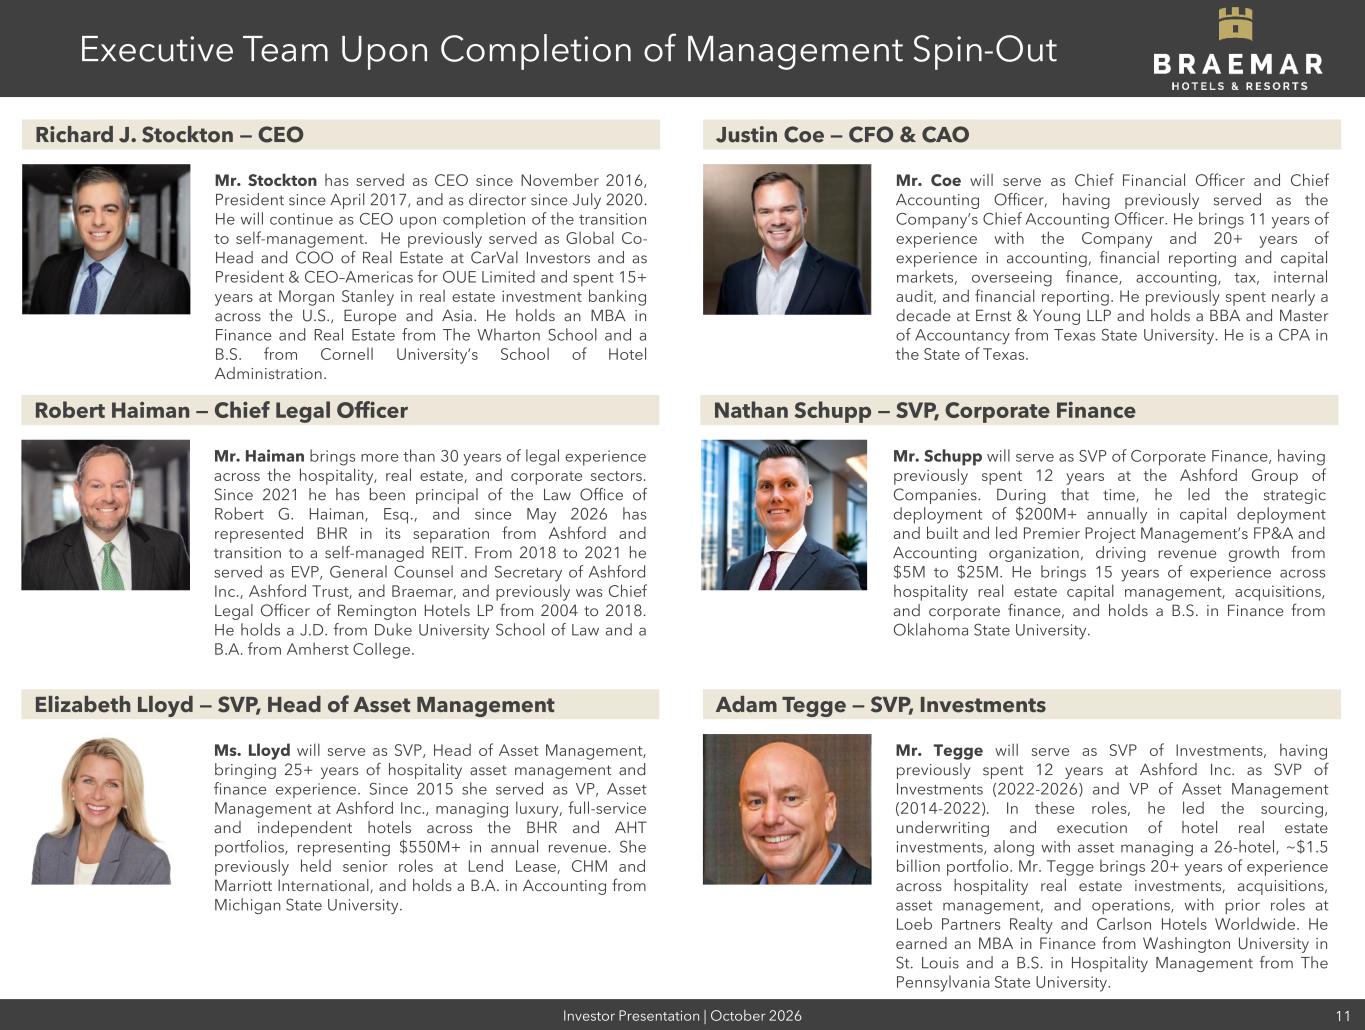
Investor Presentation | October 2026 11 Executive Team Upon Completion of Management Spin-Out Richard J. Stockton — CEO Mr. Stockton has served as CEO since November 2016, President since April 2017, and as director since July 2020. He will continue as CEO upon completion of the transition to self-management. He previously served as Global Co- Head and COO of Real Estate at CarVal Investors and as President & CEO–Americas for OUE Limited and spent 15+ years at Morgan Stanley in real estate investment banking across the U.S., Europe and Asia. He holds an MBA in Finance and Real Estate from The Wharton School and a B.S. from Cornell University’s School of Hotel Administration. Justin Coe — CFO & CAO Mr. Coe will serve as Chief Financial Officer and Chief Accounting Officer, having previously served as the Company’s Chief Accounting Officer. He brings 11 years of experience with the Company and 20+ years of experience in accounting, financial reporting and capital markets, overseeing finance, accounting, tax, internal audit, and financial reporting. He previously spent nearly a decade at Ernst & Young LLP and holds a BBA and Master of Accountancy from Texas State University. He is a CPA in the State of Texas. Robert Haiman — Chief Legal Officer Mr. Haiman brings more than 30 years of legal experience across the hospitality, real estate, and corporate sectors. Since 2021 he has been principal of the Law Office of Robert G. Haiman, Esq., and since May 2026 has represented BHR in its separation from Ashford and transition to a self-managed REIT. From 2018 to 2021 he served as EVP, General Counsel and Secretary of Ashford Inc., Ashford Trust, and Braemar, and previously was Chief Legal Officer of Remington Hotels LP from 2004 to 2018. He holds a J.D. from Duke University School of Law and a B.A. from Amherst College. Adam Tegge — SVP, Investments Mr. Tegge will serve as SVP of Investments, having previously spent 12 years at Ashford Inc. as SVP of Investments (2022-2026) and VP of Asset Management (2014-2022). In these roles, he led the sourcing, underwriting and execution of hotel real estate investments, along with asset managing a 26-hotel, ~$1.5 billion portfolio. Mr. Tegge brings 20+ years of experience across hospitality real estate investments, acquisitions, asset management, and operations, with prior roles at Loeb Partners Realty and Carlson Hotels Worldwide. He earned an MBA in Finance from Washington University in St. Louis and a B.S. in Hospitality Management from The Pennsylvania State University. Elizabeth Lloyd — SVP, Head of Asset Management Ms. Lloyd will serve as SVP, Head of Asset Management, bringing 25+ years of hospitality asset management and finance experience. Since 2015 she served as VP, Asset Management at Ashford Inc., managing luxury, full-service and independent hotels across the BHR and AHT portfolios, representing $550M+ in annual revenue. She previously held senior roles at Lend Lease, CHM and Marriott International, and holds a B.A. in Accounting from Michigan State University. Nathan Schupp — SVP, Corporate Finance Mr. Schupp will serve as SVP of Corporate Finance, having previously spent 12 years at the Ashford Group of Companies. During that time, he led the strategic deployment of $200M+ annually in capital deployment and built and led Premier Project Management’s FP&A and Accounting organization, driving revenue growth from $5M to $25M. He brings 15 years of experience across hospitality real estate capital management, acquisitions, and corporate finance, and holds a B.S. in Finance from Oklahoma State University.

The Ritz-Carlton Reserve Dorado Beach The Notary Hotel, Philadelphia, Autograph Collection Reasons to Own BHR The Luxury Advantage
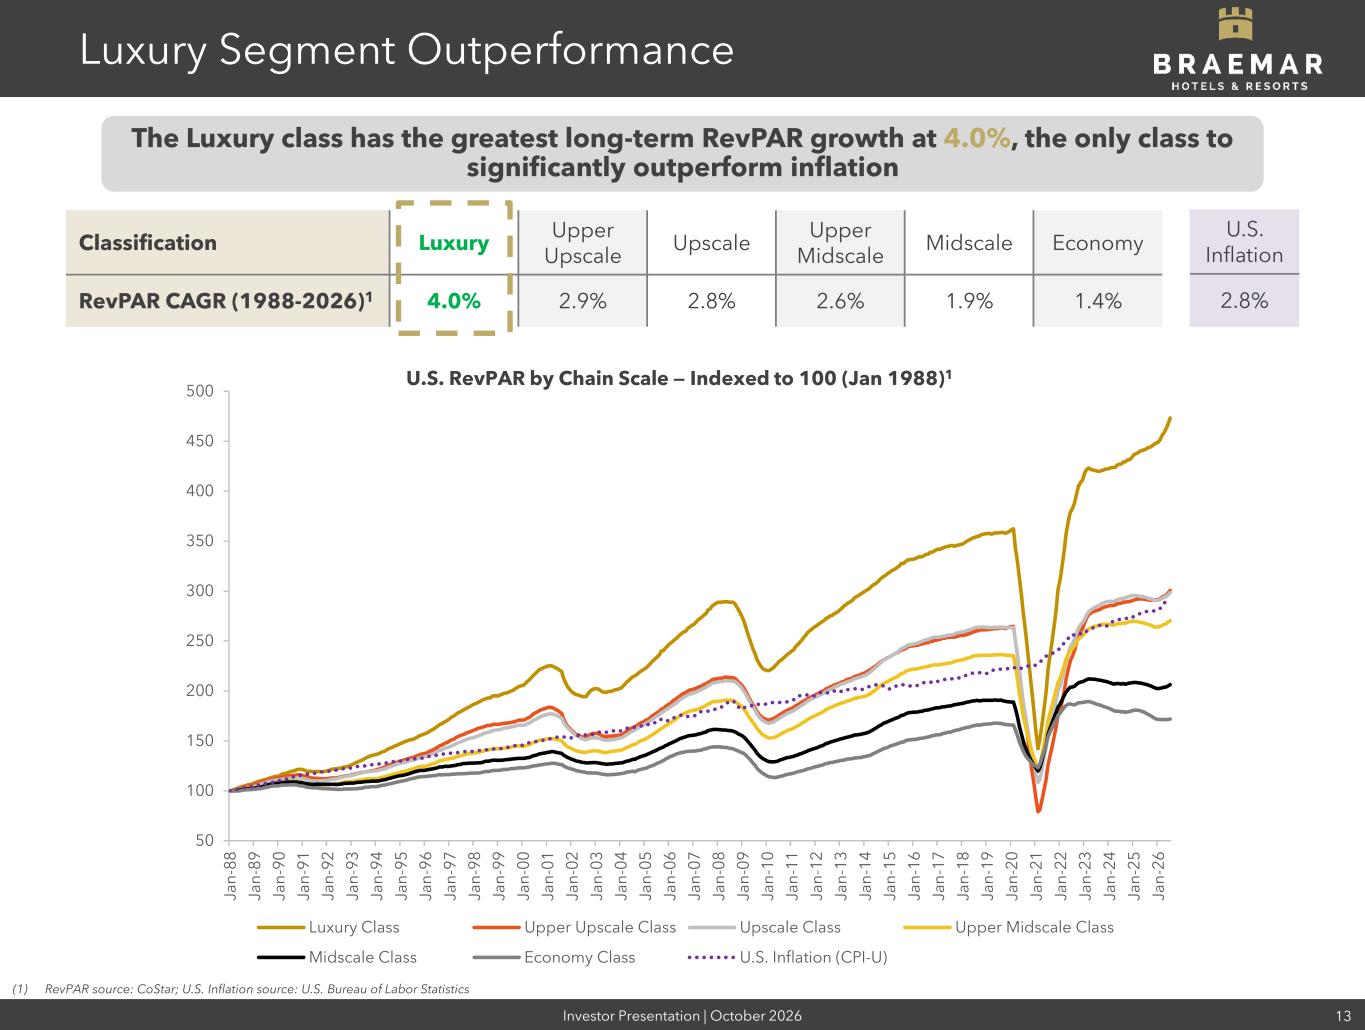
Investor Presentation | October 2026 13 Luxury Segment Outperformance Classification Luxury Upper Upscale Upscale Upper Midscale Midscale Economy RevPAR CAGR (1988-2026)1 4.0% 2.9% 2.8% 2.6% 1.9% 1.4% (1) RevPAR source: CoStar; U.S. Inflation source: U.S. Bureau of Labor Statistics U.S. RevPAR by Chain Scale — Indexed to 100 (Jan 1988)1 50 100 150 200 250 300 350 400 450 500 Ja n -8 8 Ja n -8 9 Ja n -9 0 Ja n -9 1 Ja n -9 2 Ja n -9 3 Ja n -9 4 Ja n -9 5 Ja n -9 6 Ja n -9 7 Ja n -9 8 Ja n -9 9 Ja n -0 0 Ja n -0 1 Ja n -0 2 Ja n -0 3 Ja n -0 4 Ja n -0 5 Ja n -0 6 Ja n -0 7 Ja n -0 8 Ja n -0 9 Ja n -1 0 Ja n -1 1 Ja n -1 2 Ja n -1 3 Ja n -1 4 Ja n -1 5 Ja n -1 6 Ja n -1 7 Ja n -1 8 Ja n -1 9 Ja n -2 0 Ja n -2 1 Ja n -2 2 Ja n -2 3 Ja n -2 4 Ja n -2 5 Ja n -2 6 Luxury Class Upper Upscale Class Upscale Class Upper Midscale Class Midscale Class Economy Class U.S. Inflation (CPI-U) U.S. Inflation 2.8% The Luxury class has the greatest long-term RevPAR growth at 4.0%, the only class to significantly outperform inflation
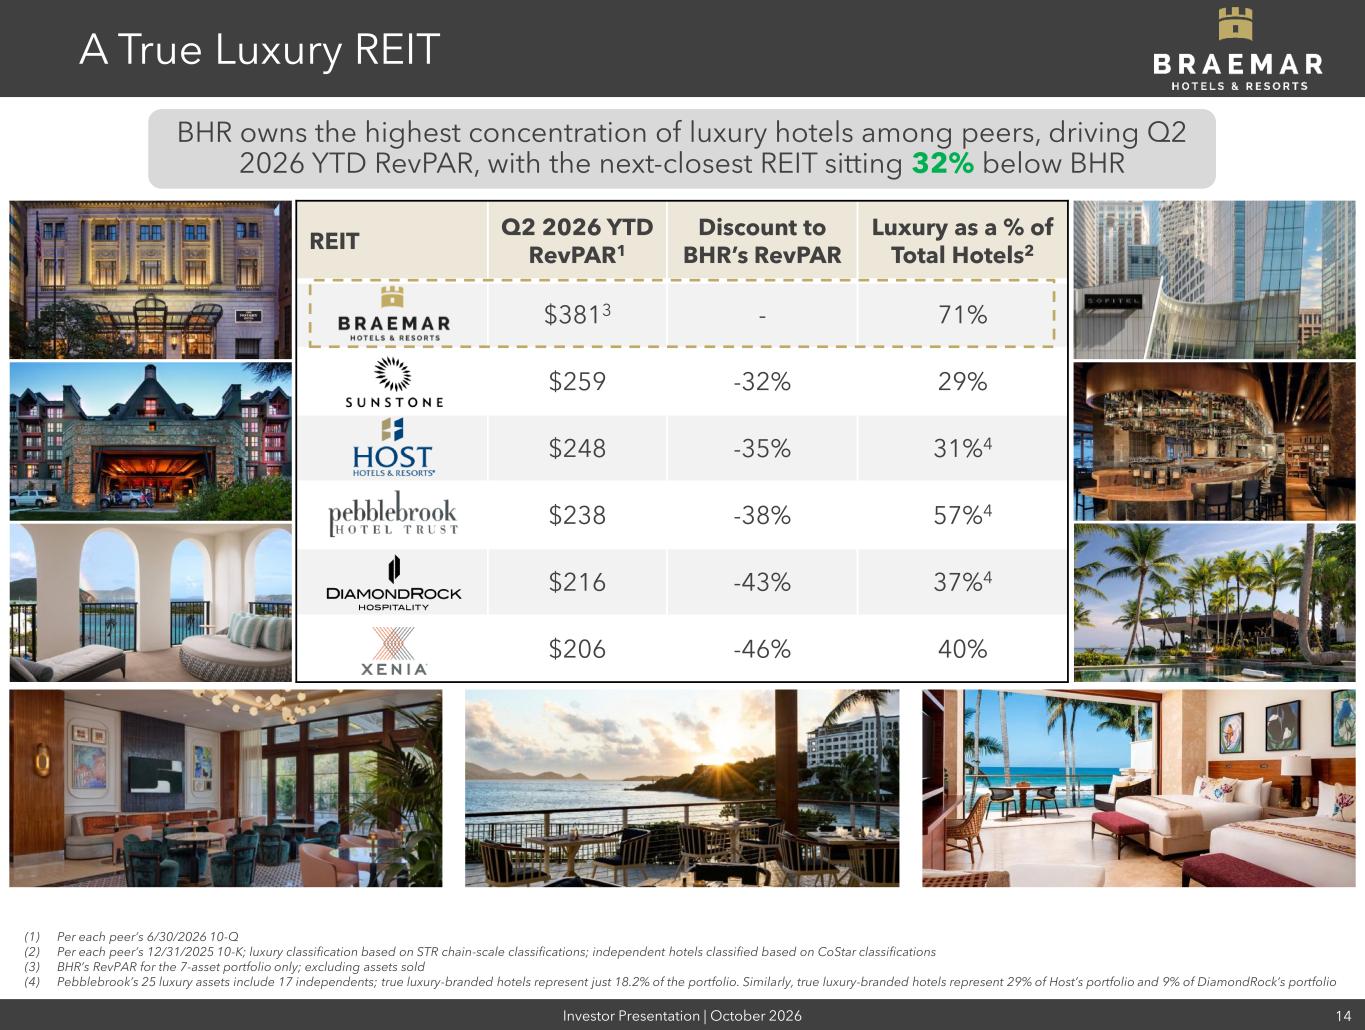
Investor Presentation | October 2026 14 A True Luxury REIT (1) Per each peer’s 6/30/2026 10-Q (2) Per each peer’s 12/31/2025 10-K; luxury classification based on STR chain-scale classifications; independent hotels classified based on CoStar classifications (3) BHR’s RevPAR for the 7-asset portfolio only; excluding assets sold (4) Pebblebrook’s 25 luxury assets include 17 independents; true luxury-branded hotels represent just 18.2% of the portfolio. Similarly, true luxury-branded hotels represent 29% of Host’s portfolio and 9% of DiamondRock’s portfolio REIT Q2 2026 YTD RevPAR1 Discount to BHR’s RevPAR Luxury as a % of Total Hotels2 $3813 - 71% $259 -32% 29% $248 -35% 31%4 $238 -38% 57%4 $216 -43% 37%4 $206 -46% 40% BHR owns the highest concentration of luxury hotels among peers, driving Q2 2026 YTD RevPAR, with the next-closest REIT sitting 32% below BHR
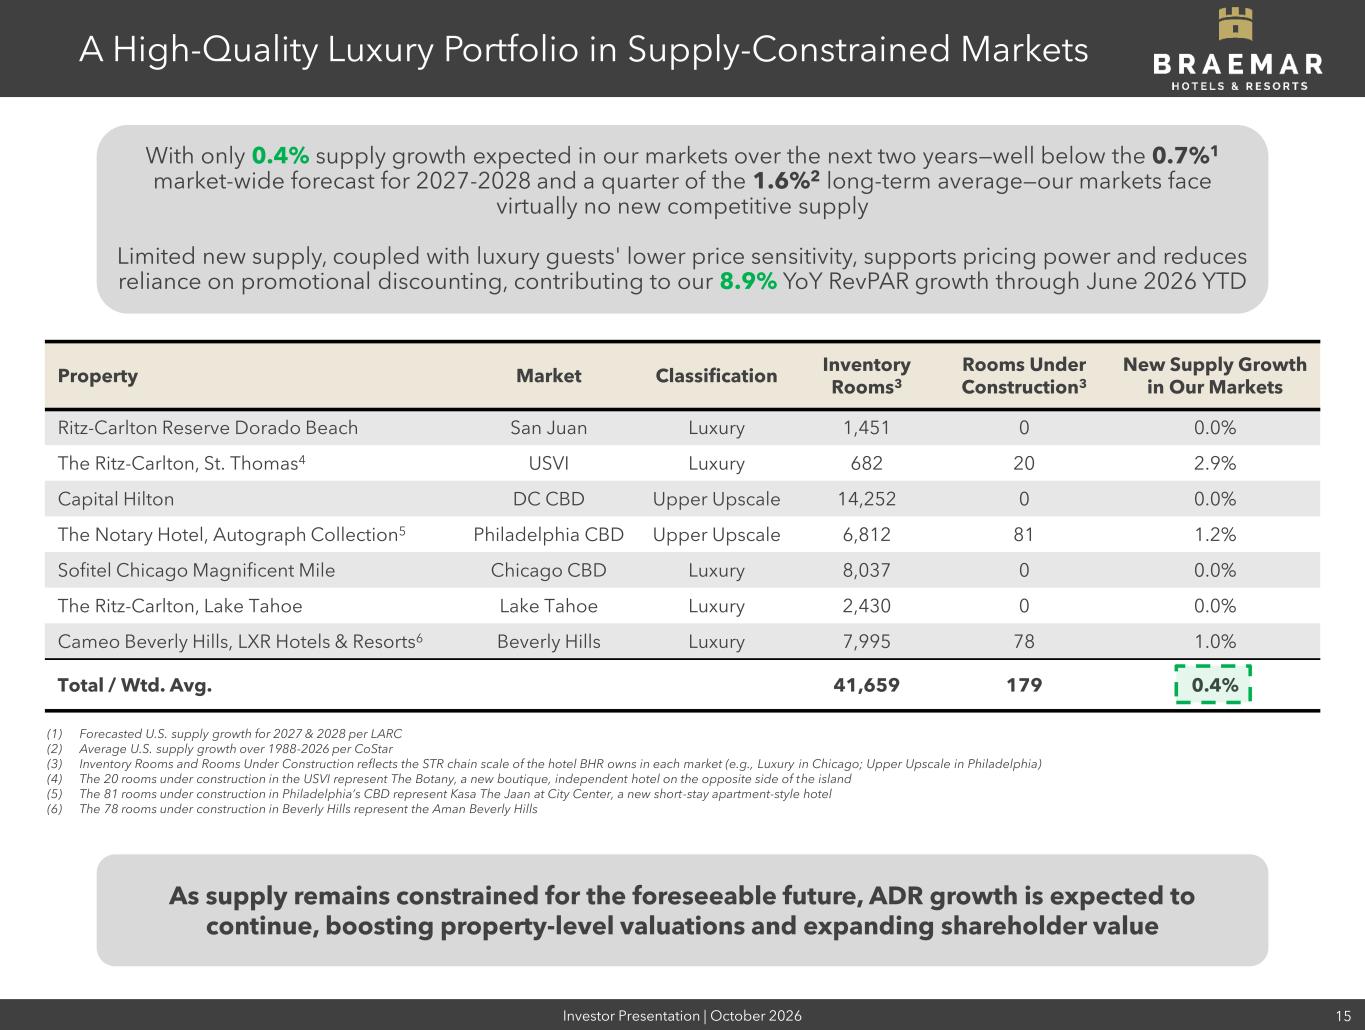
Investor Presentation | October 2026 15 With only 0.4% supply growth expected in our markets over the next two years—well below the 0.7%1 market-wide forecast for 2027-2028 and a quarter of the 1.6%2 long-term average—our markets face virtually no new competitive supply Limited new supply, coupled with luxury guests' lower price sensitivity, supports pricing power and reduces reliance on promotional discounting, contributing to our 8.9% YoY RevPAR growth through June 2026 YTD A High-Quality Luxury Portfolio in Supply-Constrained Markets Property Market Classification Inventory Rooms3 Rooms Under Construction3 New Supply Growth in Our Markets Ritz-Carlton Reserve Dorado Beach San Juan Luxury 1,451 0 0.0% The Ritz-Carlton, St. Thomas4 USVI Luxury 682 20 2.9% Capital Hilton DC CBD Upper Upscale 14,252 0 0.0% The Notary Hotel, Autograph Collection5 Philadelphia CBD Upper Upscale 6,812 81 1.2% Sofitel Chicago Magnificent Mile Chicago CBD Luxury 8,037 0 0.0% The Ritz-Carlton, Lake Tahoe Lake Tahoe Luxury 2,430 0 0.0% Cameo Beverly Hills, LXR Hotels & Resorts6 Beverly Hills Luxury 7,995 78 1.0% Total / Wtd. Avg. 41,659 179 0.4% (1) Forecasted U.S. supply growth for 2027 & 2028 per LARC (2) Average U.S. supply growth over 1988-2026 per CoStar (3) Inventory Rooms and Rooms Under Construction reflects the STR chain scale of the hotel BHR owns in each market (e.g., Luxury in Chicago; Upper Upscale in Philadelphia) (4) The 20 rooms under construction in the USVI represent The Botany, a new boutique, independent hotel on the opposite side of the island (5) The 81 rooms under construction in Philadelphia’s CBD represent Kasa The Jaan at City Center, a new short-stay apartment-style hotel (6) The 78 rooms under construction in Beverly Hills represent the Aman Beverly Hills As supply remains constrained for the foreseeable future, ADR growth is expected to continue, boosting property-level valuations and expanding shareholder value
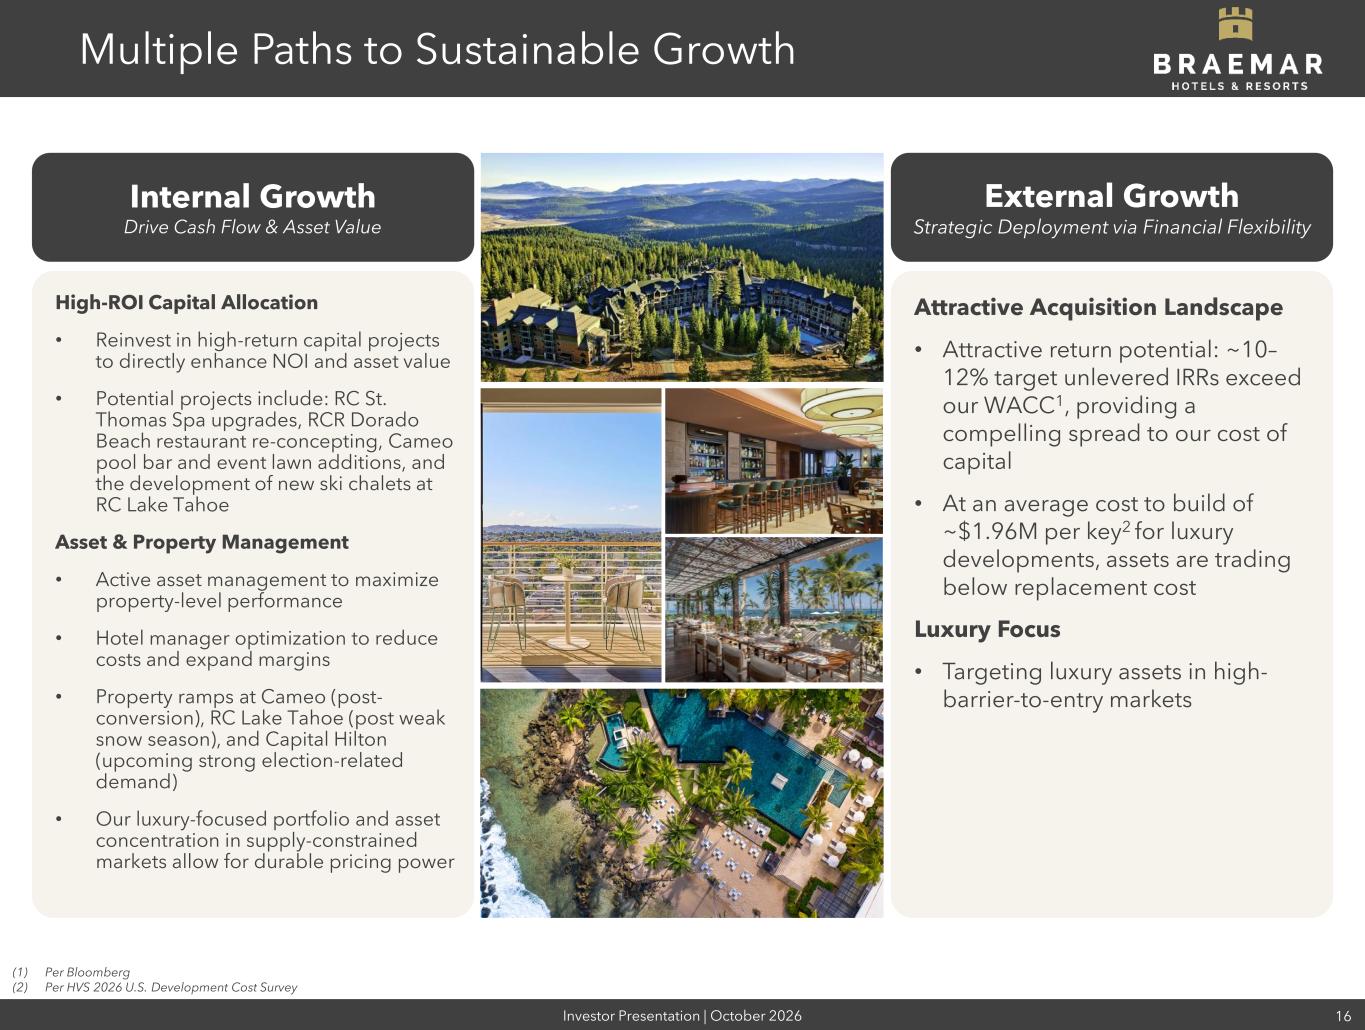
Investor Presentation | October 2026 16 Internal Growth Drive Cash Flow & Asset Value Multiple Paths to Sustainable Growth High-ROI Capital Allocation • Reinvest in high-return capital projects to directly enhance NOI and asset value • Potential projects include: RC St. Thomas Spa upgrades, RCR Dorado Beach restaurant re-concepting, Cameo pool bar and event lawn additions, and the development of new ski chalets at RC Lake Tahoe Asset & Property Management • Active asset management to maximize property-level performance • Hotel manager optimization to reduce costs and expand margins • Property ramps at Cameo (post- conversion), RC Lake Tahoe (post weak snow season), and Capital Hilton (upcoming strong election-related demand) • Our luxury-focused portfolio and asset concentration in supply-constrained markets allow for durable pricing power Attractive Acquisition Landscape • Attractive return potential: ~10– 12% target unlevered IRRs exceed our WACC1, providing a compelling spread to our cost of capital • At an average cost to build of ~$1.96M per key2 for luxury developments, assets are trading below replacement cost Luxury Focus • Targeting luxury assets in high- barrier-to-entry markets External Growth Strategic Deployment via Financial Flexibility (1) Per Bloomberg (2) Per HVS 2026 U.S. Development Cost Survey
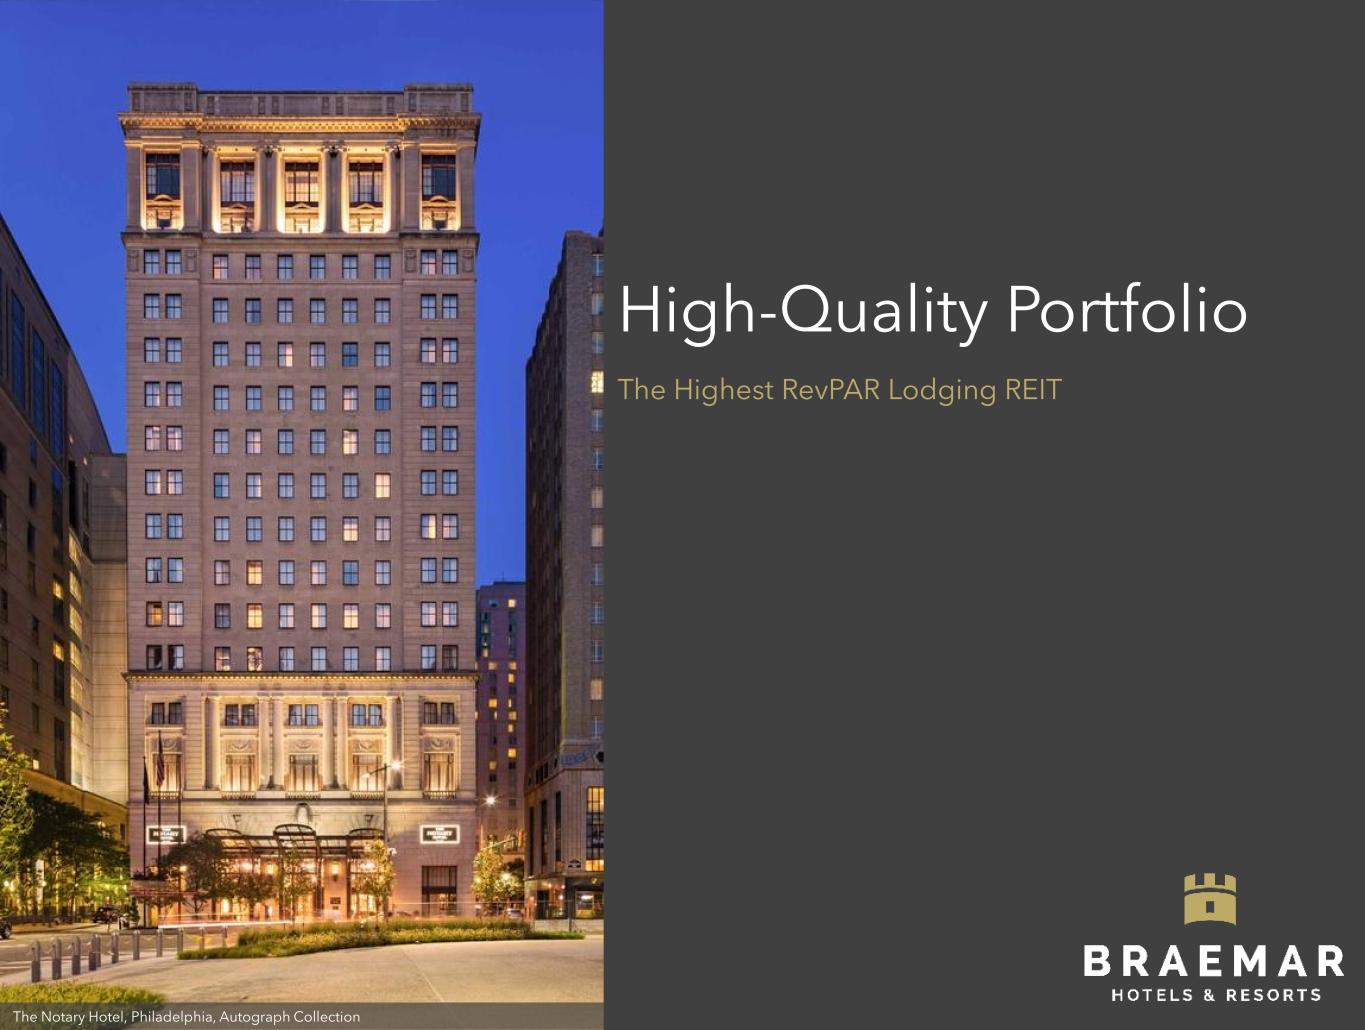
High-Quality Portfolio The Highest RevPAR Lodging REIT The Notary Hotel, Philadelphia, Autograph Collection
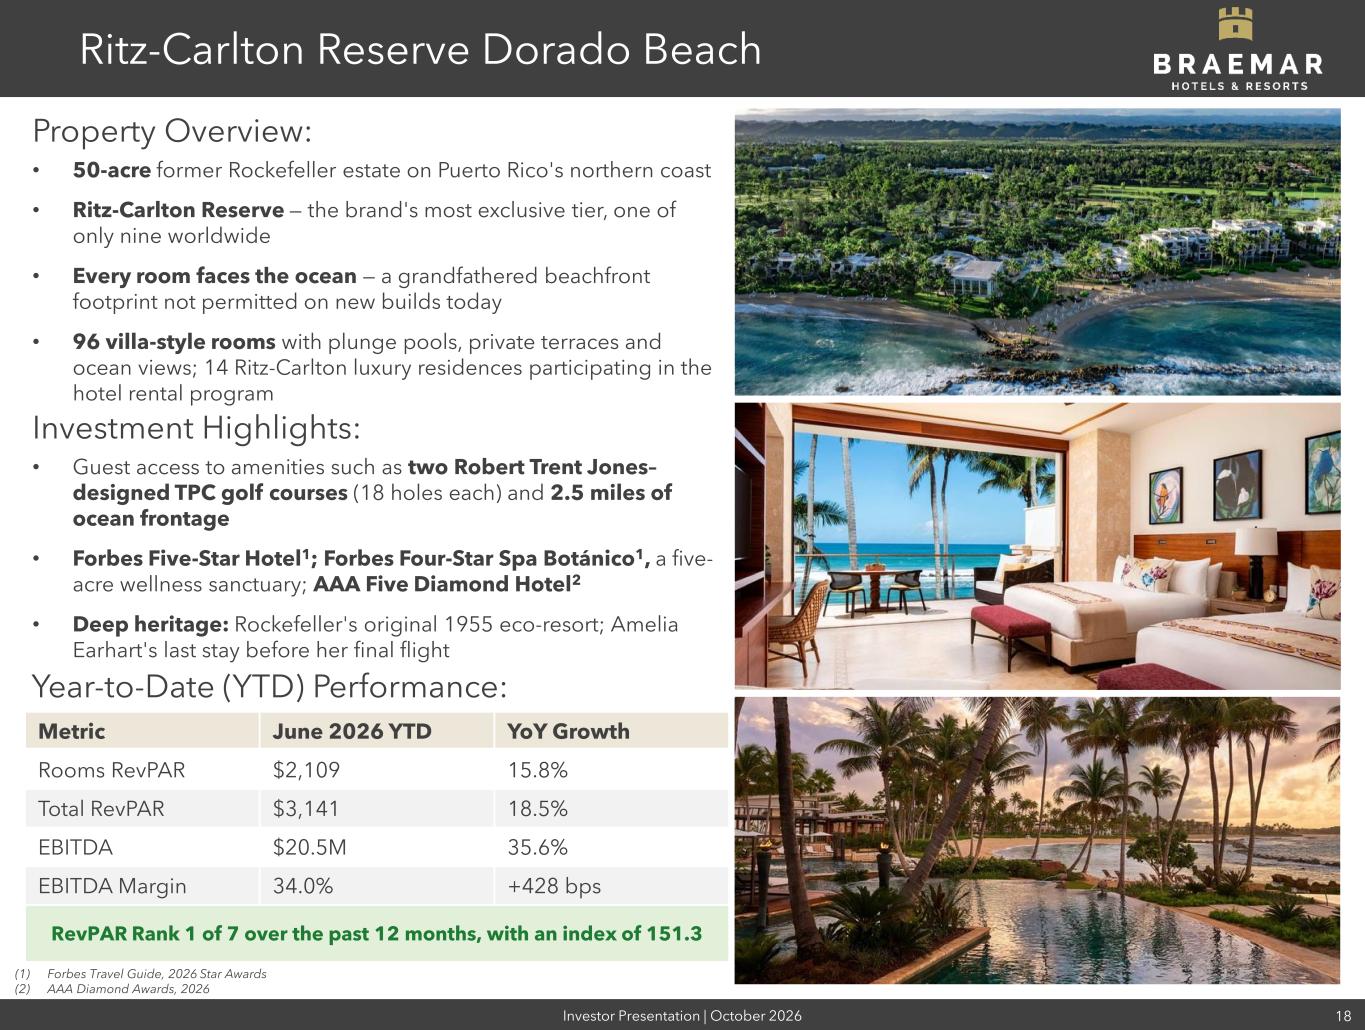
Investor Presentation | October 2026 18 Ritz-Carlton Reserve Dorado Beach Property Overview: • 50-acre former Rockefeller estate on Puerto Rico's northern coast • Ritz-Carlton Reserve — the brand's most exclusive tier, one of only nine worldwide • Every room faces the ocean — a grandfathered beachfront footprint not permitted on new builds today • 96 villa-style rooms with plunge pools, private terraces and ocean views; 14 Ritz-Carlton luxury residences participating in the hotel rental program Investment Highlights: • Guest access to amenities such as two Robert Trent Jones– designed TPC golf courses (18 holes each) and 2.5 miles of ocean frontage • Forbes Five-Star Hotel1; Forbes Four-Star Spa Botánico1, a five- acre wellness sanctuary; AAA Five Diamond Hotel2 • Deep heritage: Rockefeller's original 1955 eco-resort; Amelia Earhart's last stay before her final flight Metric June 2026 YTD YoY Growth Rooms RevPAR $2,109 15.8% Total RevPAR $3,141 18.5% EBITDA $20.5M 35.6% EBITDA Margin 34.0% +428 bps RevPAR Rank 1 of 7 over the past 12 months, with an index of 151.3 Year-to-Date (YTD) Performance: (1) Forbes Travel Guide, 2026 Star Awards (2) AAA Diamond Awards, 2026
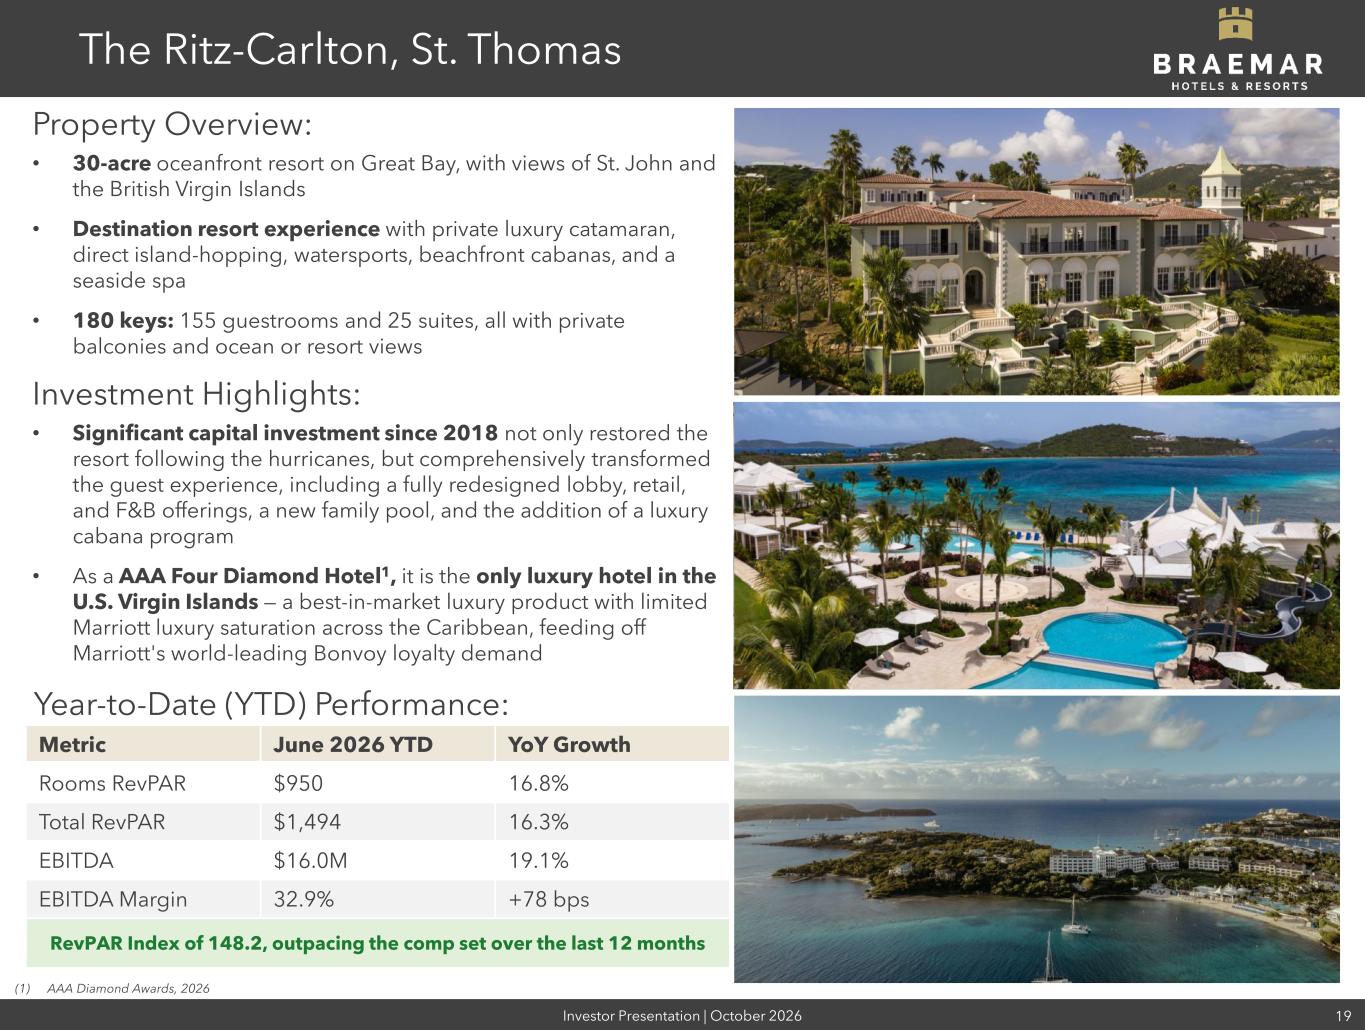
Investor Presentation | October 2026 19 The Ritz-Carlton, St. Thomas Property Overview: • 30-acre oceanfront resort on Great Bay, with views of St. John and the British Virgin Islands • Destination resort experience with private luxury catamaran, direct island-hopping, watersports, beachfront cabanas, and a seaside spa • 180 keys: 155 guestrooms and 25 suites, all with private balconies and ocean or resort views Year-to-Date (YTD) Performance: Investment Highlights: • Significant capital investment since 2018 not only restored the resort following the hurricanes, but comprehensively transformed the guest experience, including a fully redesigned lobby, retail, and F&B offerings, a new family pool, and the addition of a luxury cabana program • As a AAA Four Diamond Hotel1, it is the only luxury hotel in the U.S. Virgin Islands — a best-in-market luxury product with limited Marriott luxury saturation across the Caribbean, feeding off Marriott's world-leading Bonvoy loyalty demand (1) AAA Diamond Awards, 2026 Metric June 2026 YTD YoY Growth Rooms RevPAR $950 16.8% Total RevPAR $1,494 16.3% EBITDA $16.0M 19.1% EBITDA Margin 32.9% +78 bps RevPAR Index of 148.2, outpacing the comp set over the last 12 months
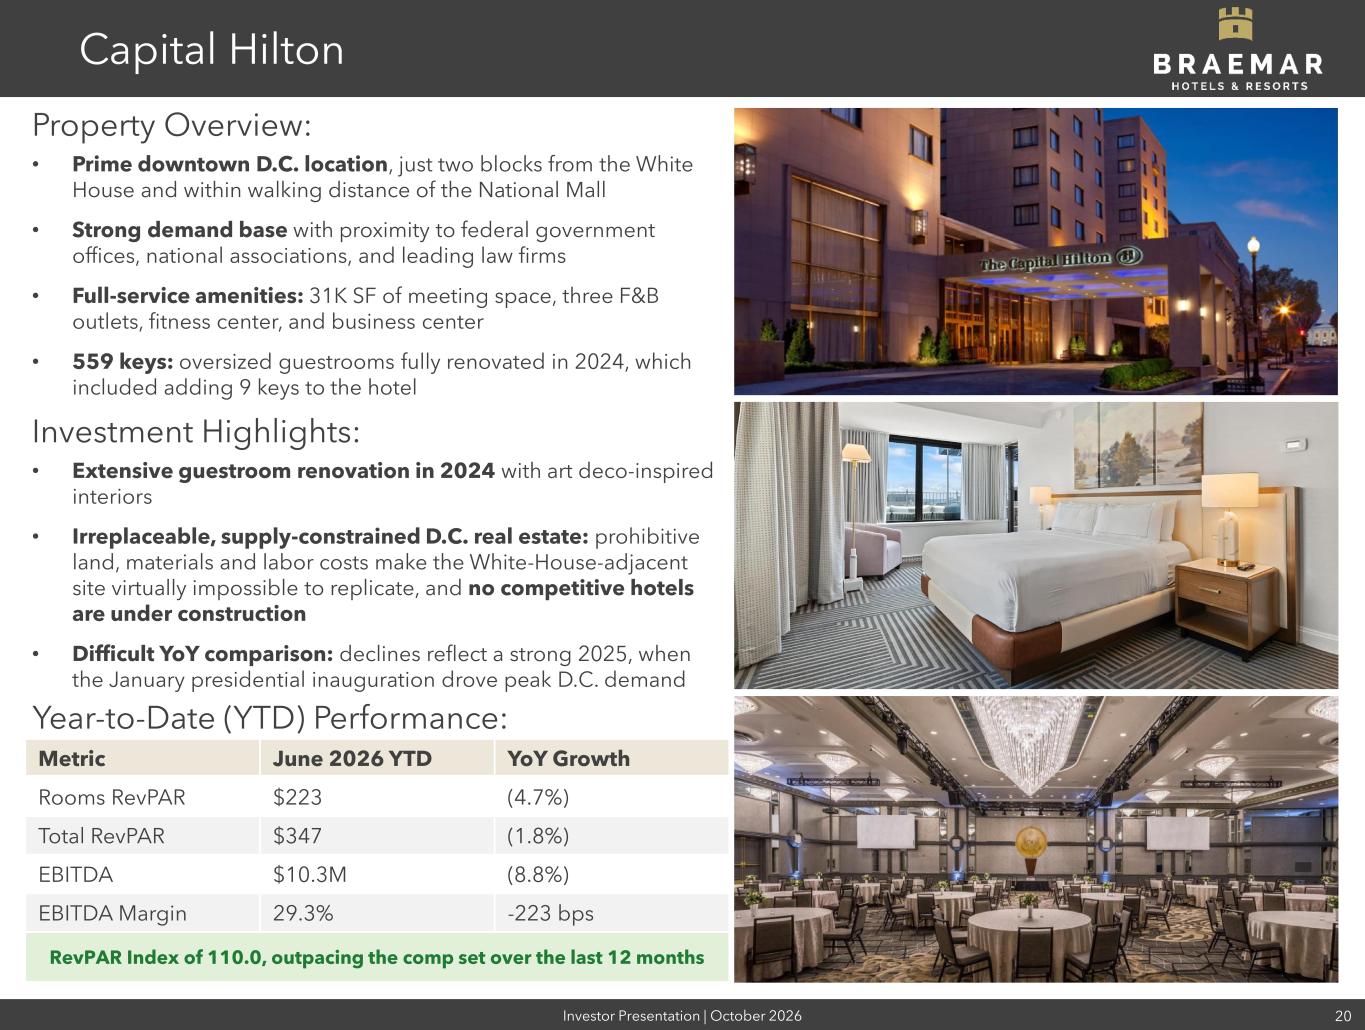
Investor Presentation | October 2026 20 Capital Hilton Property Overview: • Prime downtown D.C. location, just two blocks from the White House and within walking distance of the National Mall • Strong demand base with proximity to federal government offices, national associations, and leading law firms • Full-service amenities: 31K SF of meeting space, three F&B outlets, fitness center, and business center • 559 keys: oversized guestrooms fully renovated in 2024, which included adding 9 keys to the hotel Investment Highlights: • Extensive guestroom renovation in 2024 with art deco-inspired interiors • Irreplaceable, supply-constrained D.C. real estate: prohibitive land, materials and labor costs make the White-House-adjacent site virtually impossible to replicate, and no competitive hotels are under construction • Difficult YoY comparison: declines reflect a strong 2025, when the January presidential inauguration drove peak D.C. demand Year-to-Date (YTD) Performance: Metric June 2026 YTD YoY Growth Rooms RevPAR $223 (4.7%) Total RevPAR $347 (1.8%) EBITDA $10.3M (8.8%) EBITDA Margin 29.3% -223 bps RevPAR Index of 110.0, outpacing the comp set over the last 12 months
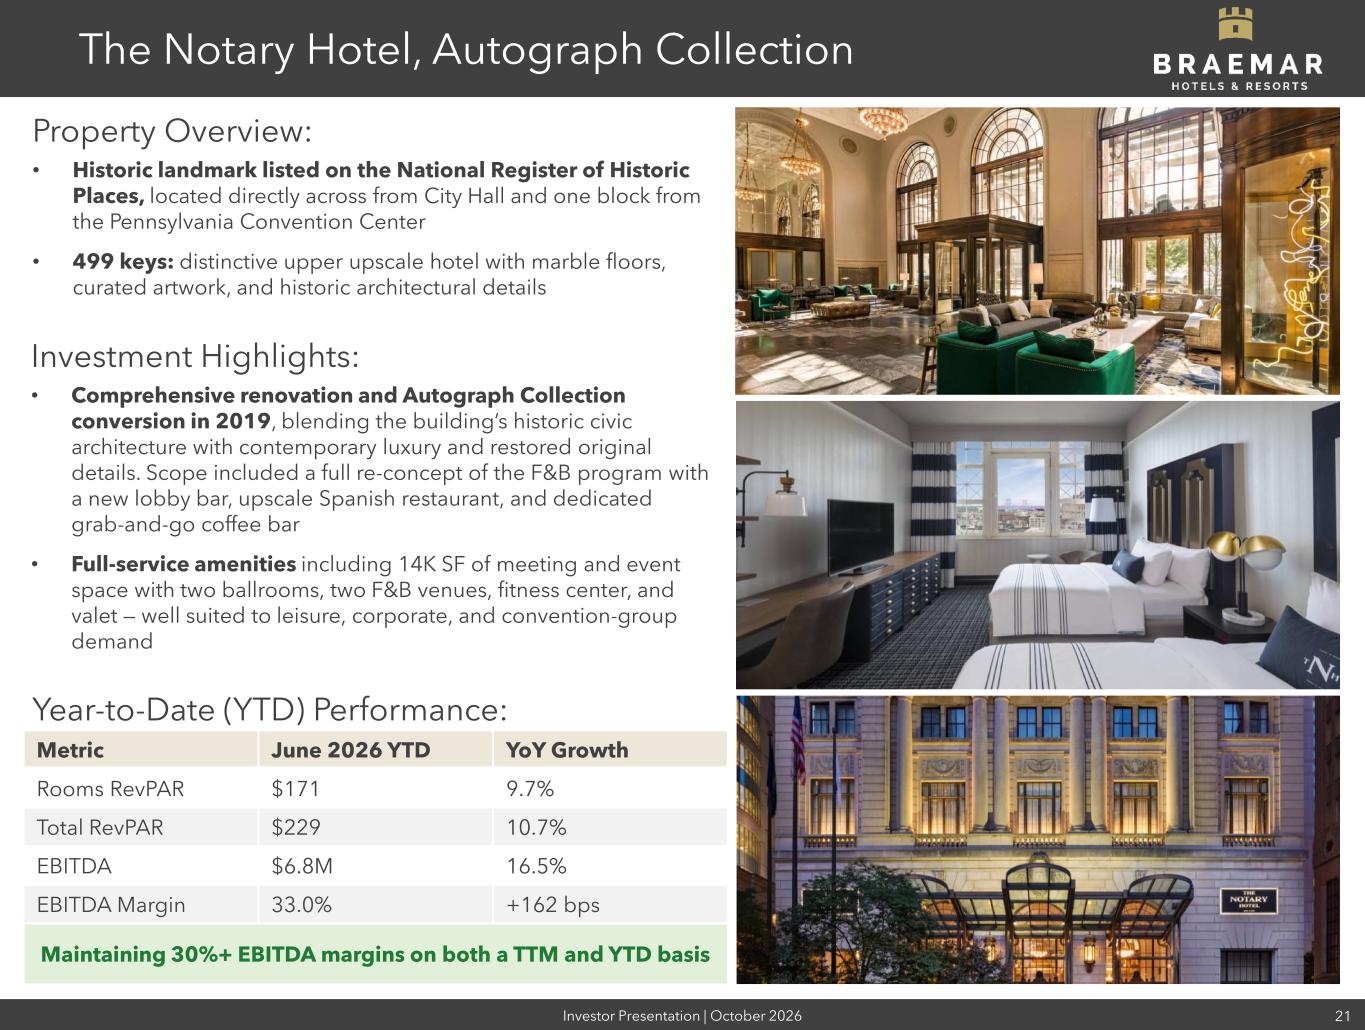
Investor Presentation | October 2026 21 The Notary Hotel, Autograph Collection Property Overview: • Historic landmark listed on the National Register of Historic Places, located directly across from City Hall and one block from the Pennsylvania Convention Center • 499 keys: distinctive upper upscale hotel with marble floors, curated artwork, and historic architectural details Investment Highlights: • Comprehensive renovation and Autograph Collection conversion in 2019, blending the building’s historic civic architecture with contemporary luxury and restored original details. Scope included a full re-concept of the F&B program with a new lobby bar, upscale Spanish restaurant, and dedicated grab-and-go coffee bar • Full-service amenities including 14K SF of meeting and event space with two ballrooms, two F&B venues, fitness center, and valet — well suited to leisure, corporate, and convention-group demand Year-to-Date (YTD) Performance: Metric June 2026 YTD YoY Growth Rooms RevPAR $171 9.7% Total RevPAR $229 10.7% EBITDA $6.8M 16.5% EBITDA Margin 33.0% +162 bps Maintaining 30%+ EBITDA margins on both a TTM and YTD basis
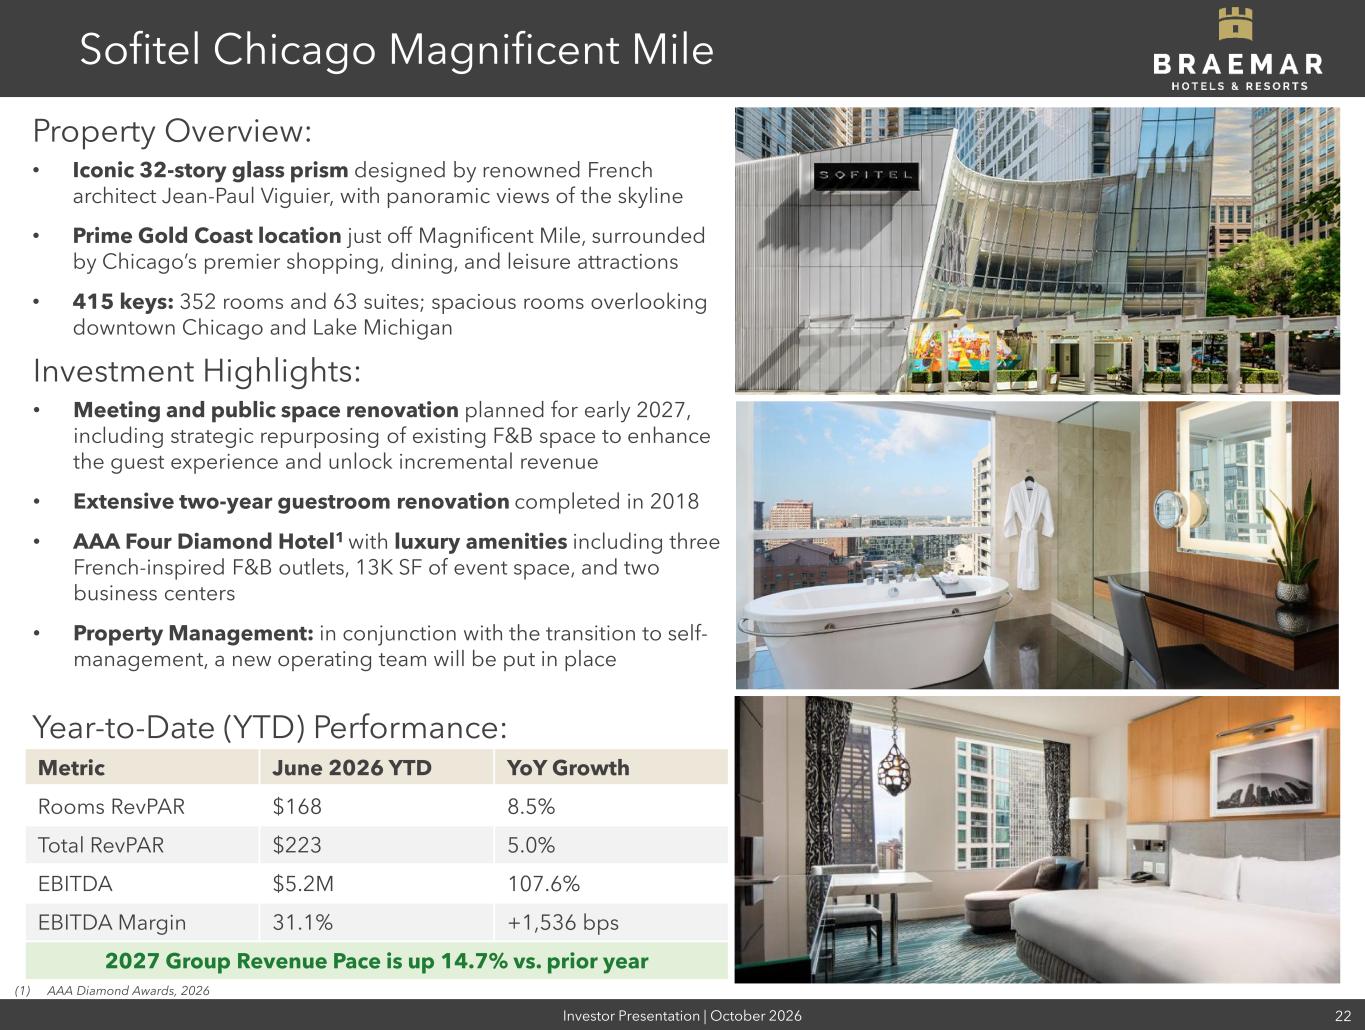
Investor Presentation | October 2026 22 Sofitel Chicago Magnificent Mile Property Overview: • Iconic 32-story glass prism designed by renowned French architect Jean-Paul Viguier, with panoramic views of the skyline • Prime Gold Coast location just off Magnificent Mile, surrounded by Chicago’s premier shopping, dining, and leisure attractions • 415 keys: 352 rooms and 63 suites; spacious rooms overlooking downtown Chicago and Lake Michigan Investment Highlights: • Meeting and public space renovation planned for early 2027, including strategic repurposing of existing F&B space to enhance the guest experience and unlock incremental revenue • Extensive two-year guestroom renovation completed in 2018 • AAA Four Diamond Hotel1 with luxury amenities including three French-inspired F&B outlets, 13K SF of event space, and two business centers • Property Management: in conjunction with the transition to self- management, a new operating team will be put in place (1) AAA Diamond Awards, 2026 Year-to-Date (YTD) Performance: Metric June 2026 YTD YoY Growth Rooms RevPAR $168 8.5% Total RevPAR $223 5.0% EBITDA $5.2M 107.6% EBITDA Margin 31.1% +1,536 bps 2027 Group Revenue Pace is up 14.7% vs. prior year
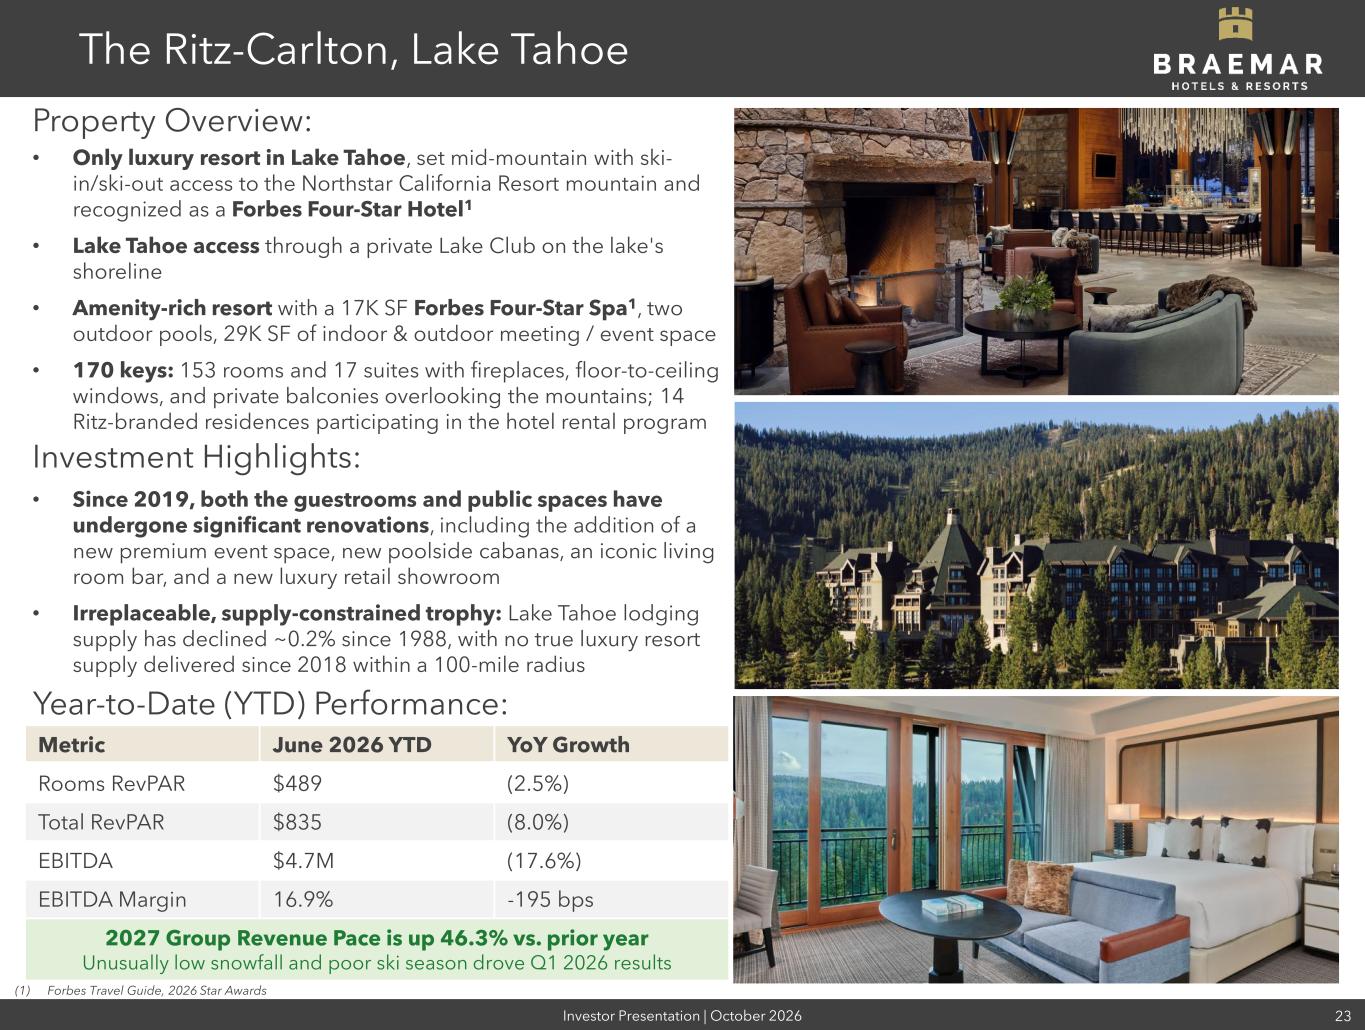
Investor Presentation | October 2026 23 The Ritz-Carlton, Lake Tahoe Property Overview: • Only luxury resort in Lake Tahoe, set mid-mountain with ski- in/ski-out access to the Northstar California Resort mountain and recognized as a Forbes Four-Star Hotel1 • Lake Tahoe access through a private Lake Club on the lake's shoreline • Amenity-rich resort with a 17K SF Forbes Four-Star Spa1, two outdoor pools, 29K SF of indoor & outdoor meeting / event space • 170 keys: 153 rooms and 17 suites with fireplaces, floor-to-ceiling windows, and private balconies overlooking the mountains; 14 Ritz-branded residences participating in the hotel rental program Investment Highlights: • Since 2019, both the guestrooms and public spaces have undergone significant renovations, including the addition of a new premium event space, new poolside cabanas, an iconic living room bar, and a new luxury retail showroom • Irreplaceable, supply-constrained trophy: Lake Tahoe lodging supply has declined ~0.2% since 1988, with no true luxury resort supply delivered since 2018 within a 100-mile radius (1) Forbes Travel Guide, 2026 Star Awards Year-to-Date (YTD) Performance: Metric June 2026 YTD YoY Growth Rooms RevPAR $489 (2.5%) Total RevPAR $835 (8.0%) EBITDA $4.7M (17.6%) EBITDA Margin 16.9% -195 bps 2027 Group Revenue Pace is up 46.3% vs. prior year Unusually low snowfall and poor ski season drove Q1 2026 results
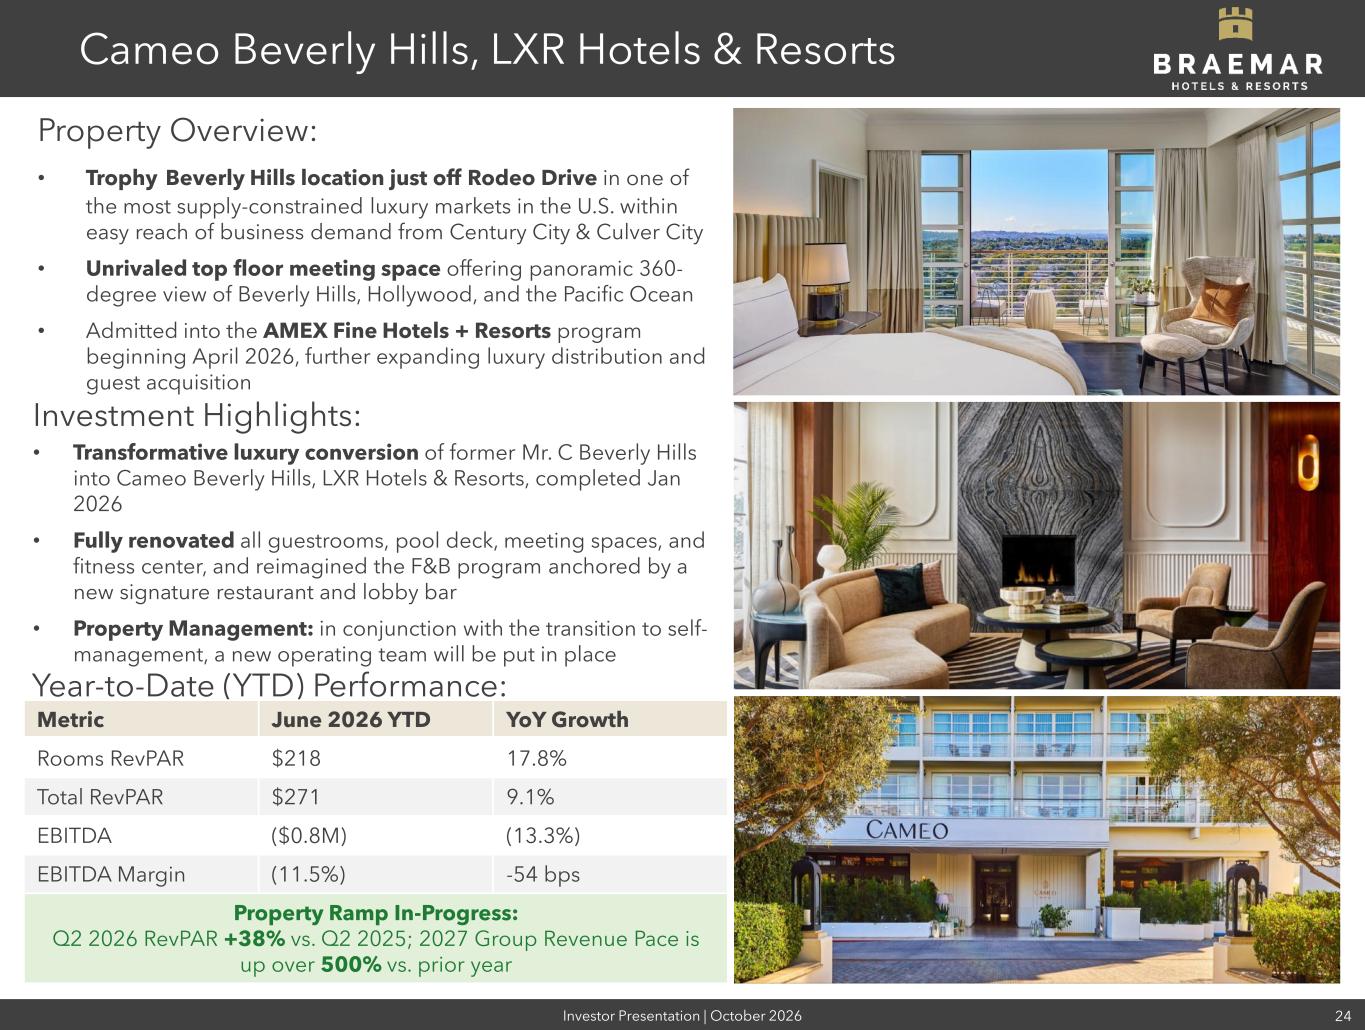
Investor Presentation | October 2026 24 Cameo Beverly Hills, LXR Hotels & Resorts Property Overview: • Trophy Beverly Hills location just off Rodeo Drive in one of the most supply-constrained luxury markets in the U.S. within easy reach of business demand from Century City & Culver City • Unrivaled top floor meeting space offering panoramic 360- degree view of Beverly Hills, Hollywood, and the Pacific Ocean • Admitted into the AMEX Fine Hotels + Resorts program beginning April 2026, further expanding luxury distribution and guest acquisition Investment Highlights: • Transformative luxury conversion of former Mr. C Beverly Hills into Cameo Beverly Hills, LXR Hotels & Resorts, completed Jan 2026 • Fully renovated all guestrooms, pool deck, meeting spaces, and fitness center, and reimagined the F&B program anchored by a new signature restaurant and lobby bar • Property Management: in conjunction with the transition to self- management, a new operating team will be put in place Year-to-Date (YTD) Performance: Metric June 2026 YTD YoY Growth Rooms RevPAR $218 17.8% Total RevPAR $271 9.1% EBITDA ($0.8M) (13.3%) EBITDA Margin (11.5%) -54 bps Property Ramp In-Progress: Q2 2026 RevPAR +38% vs. Q2 2025; 2027 Group Revenue Pace is up over 500% vs. prior year

Balance Sheet & Liquidity A Fortified, More Flexible Balance Sheet Sofitel Chicago Magnificent Mile
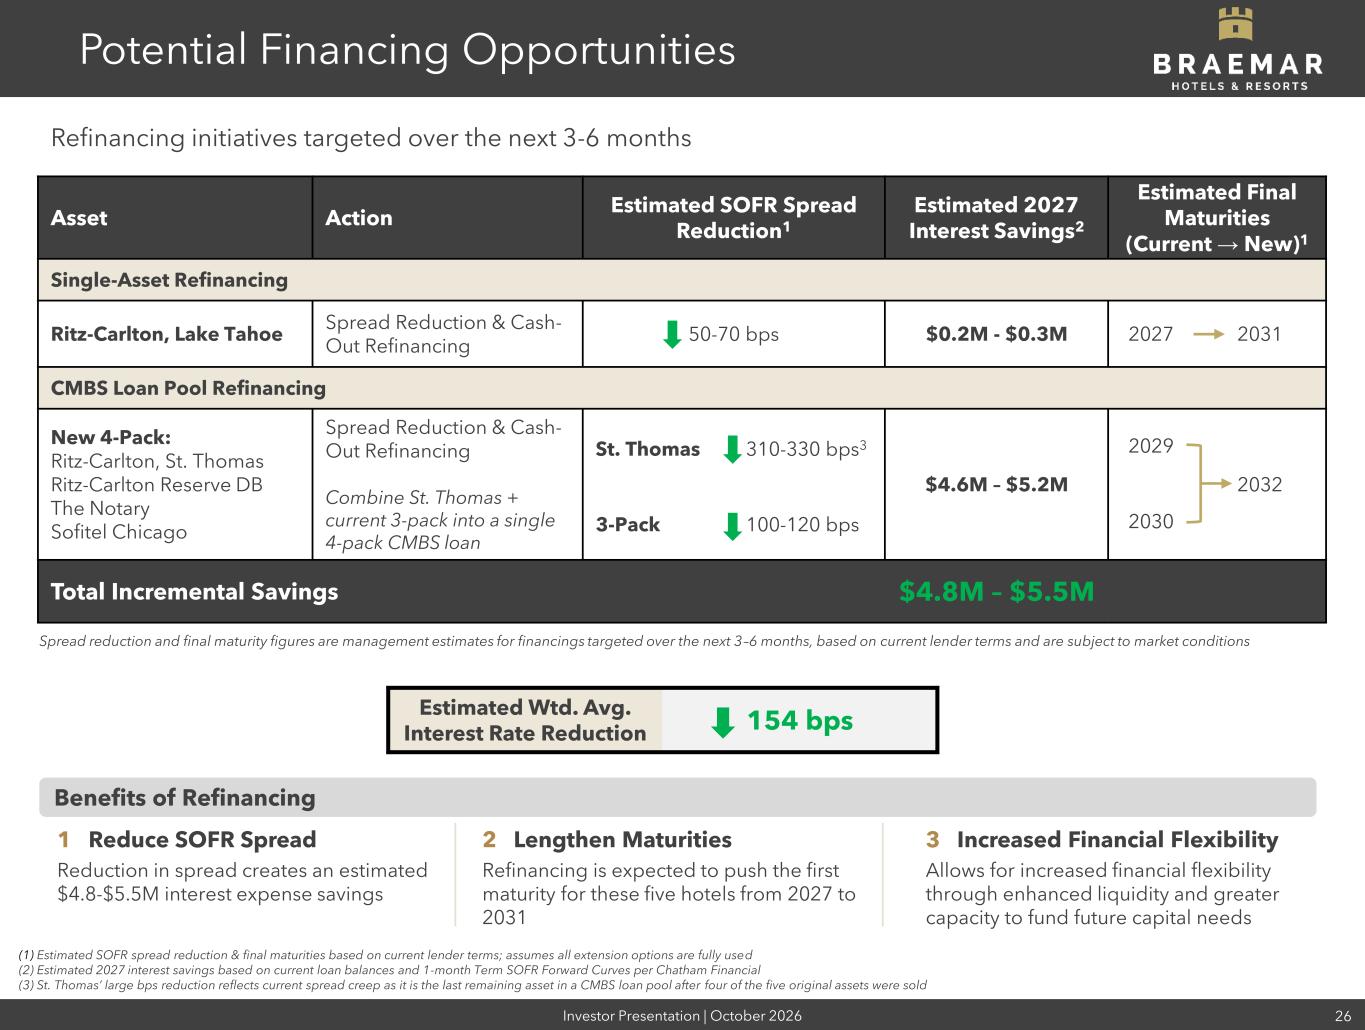
Investor Presentation | October 2026 26 Potential Financing Opportunities Refinancing initiatives targeted over the next 3-6 months Asset Action Estimated SOFR Spread Reduction1 Estimated 2027 Interest Savings2 Estimated Final Maturities (Current → New)1 Single-Asset Refinancing Ritz-Carlton, Lake Tahoe Spread Reduction & Cash- Out Refinancing 50-70 bps $0.2M - $0.3M 2027 2031 CMBS Loan Pool Refinancing New 4-Pack: Ritz-Carlton, St. Thomas Ritz-Carlton Reserve DB The Notary Sofitel Chicago Spread Reduction & Cash- Out Refinancing Combine St. Thomas + current 3-pack into a single 4-pack CMBS loan St. Thomas 310-330 bps3 $4.6M – $5.2M 2029 2032 20303-Pack 100-120 bps Total Incremental Savings $4.8M – $5.5M Spread reduction and final maturity figures are management estimates for financings targeted over the next 3–6 months, based on current lender terms and are subject to market conditions 1 Reduce SOFR Spread Reduction in spread creates an estimated $4.8-$5.5M interest expense savings 2 Lengthen Maturities Refinancing is expected to push the first maturity for these five hotels from 2027 to 2031 3 Increased Financial Flexibility Allows for increased financial flexibility through enhanced liquidity and greater capacity to fund future capital needs (1) Estimated SOFR spread reduction & final maturities based on current lender terms; assumes all extension options are fully used (2) Estimated 2027 interest savings based on current loan balances and 1-month Term SOFR Forward Curves per Chatham Financial (3) St. Thomas’ large bps reduction reflects current spread creep as it is the last remaining asset in a CMBS loan pool after four of the five original assets were sold Estimated Wtd. Avg. Interest Rate Reduction 154 bps Benefits of Refinancing
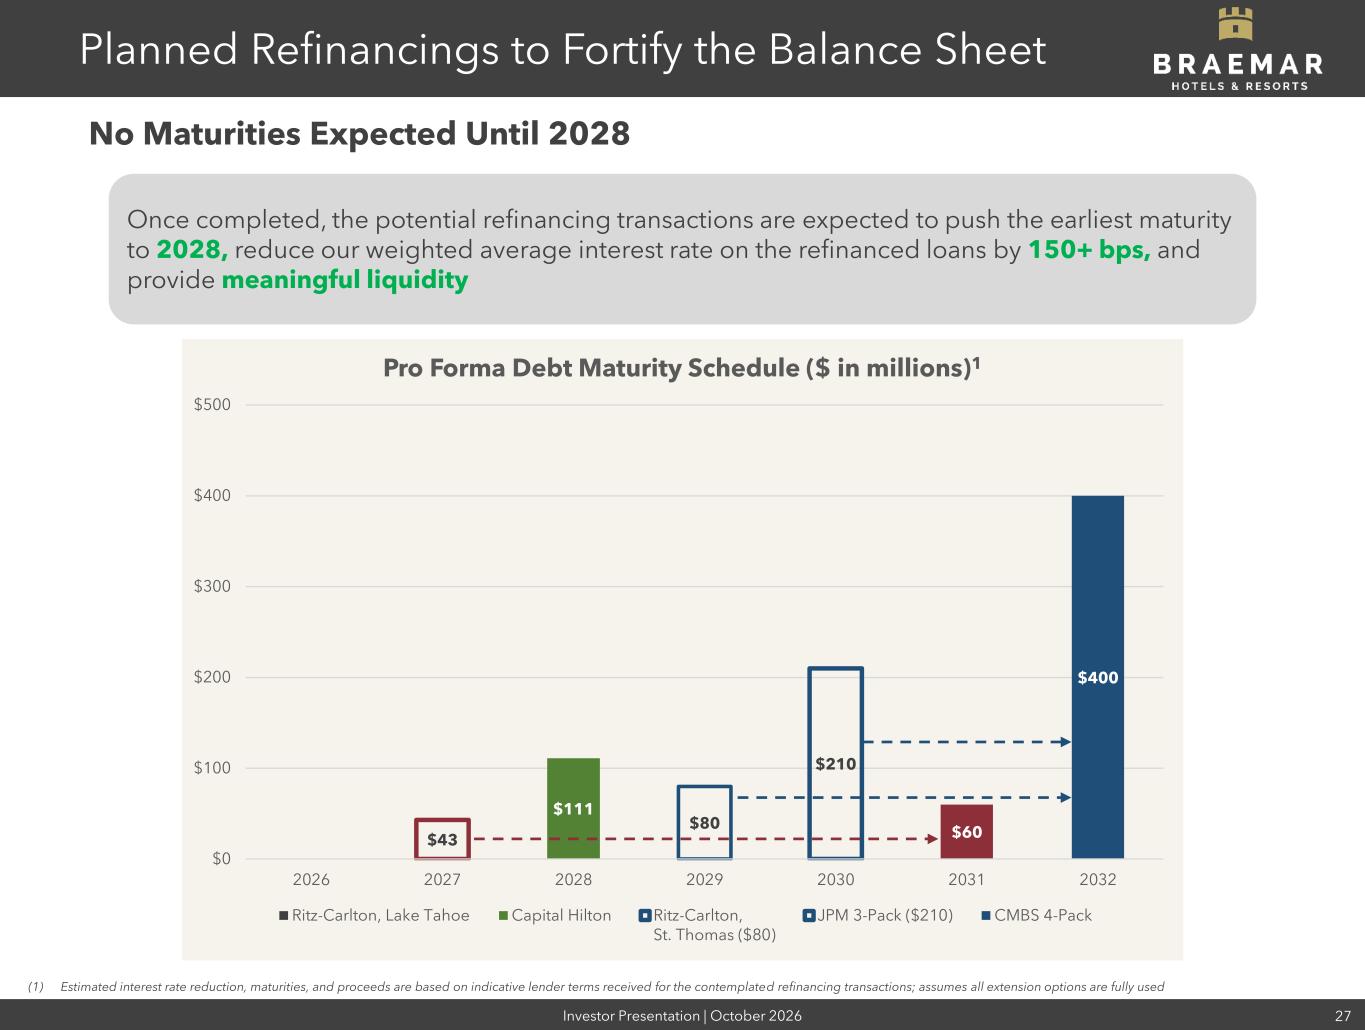
Investor Presentation | October 2026 27 $43 $60 $111 $80 $210 $400 $0 $100 $200 $300 $400 $500 2026 2027 2028 2029 2030 2031 2032 Pro Forma Debt Maturity Schedule ($ in millions)1 Ritz-Carlton, Lake Tahoe Capital Hilton Ritz-Carlton, St. Thomas ($80) JPM 3-Pack ($210) CMBS 4-Pack Planned Refinancings to Fortify the Balance Sheet No Maturities Expected Until 2028 Once completed, the potential refinancing transactions are expected to push the earliest maturity to 2028, reduce our weighted average interest rate on the refinanced loans by 150+ bps, and provide meaningful liquidity (1) Estimated interest rate reduction, maturities, and proceeds are based on indicative lender terms received for the contemplated refinancing transactions; assumes all extension options are fully used
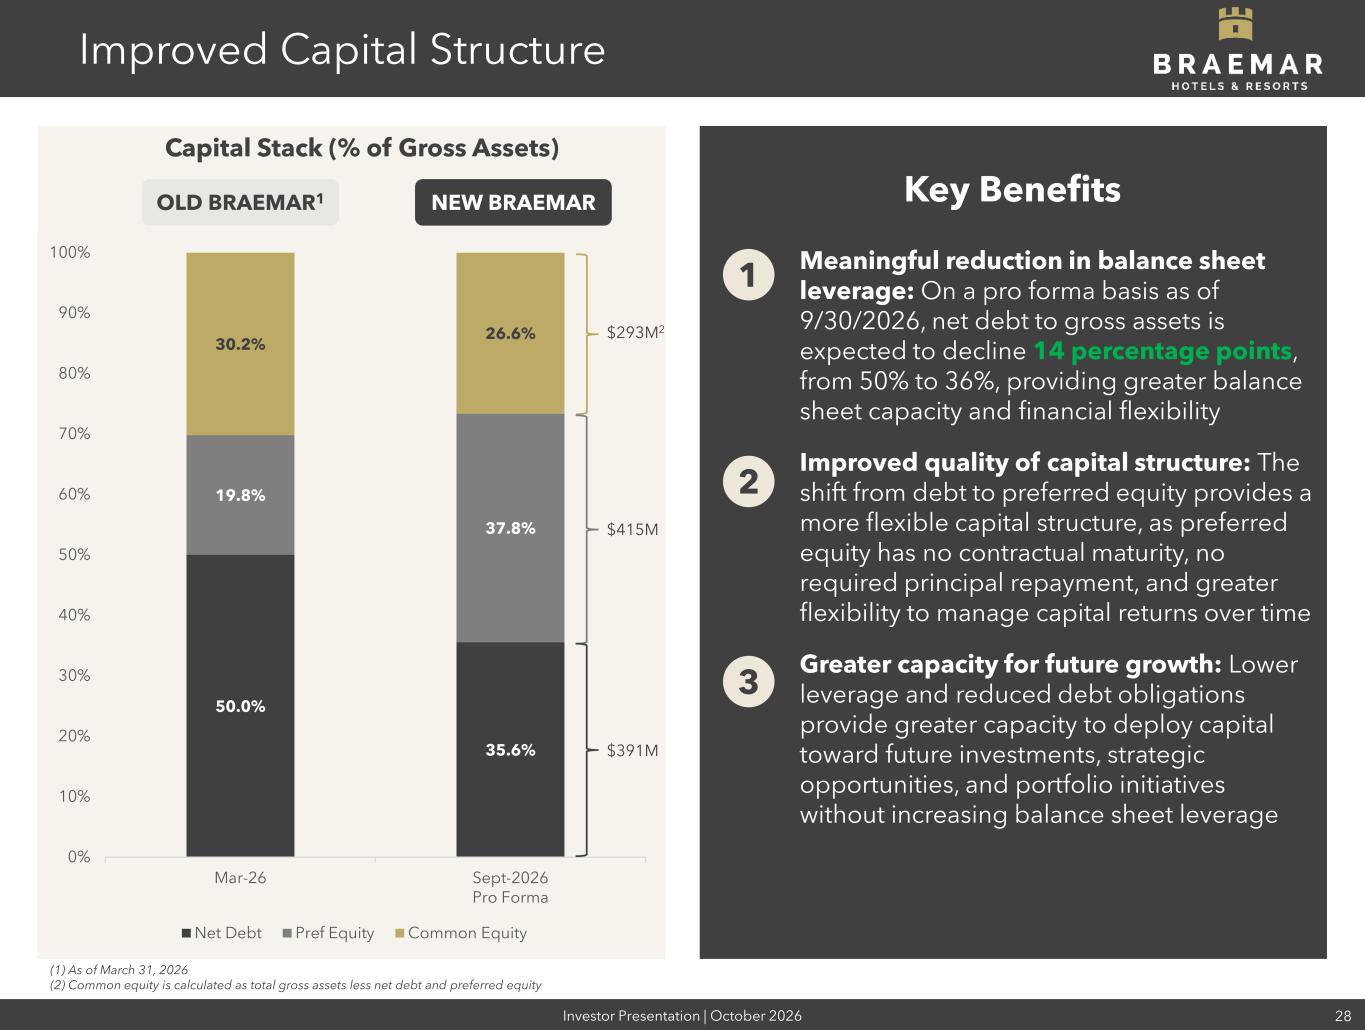
Investor Presentation | October 2026 28 50.0% 35.6% 19.8% 37.8% 30.2% 26.6% 0% 10% 20% 30% 40% 50% 60% 70% 80% 90% 100% Mar-26 Sept-2026 Pro Forma Net Debt Pref Equity Common Equity Improved Capital Structure OLD BRAEMAR1 NEW BRAEMAR Capital Stack (% of Gross Assets) Meaningful reduction in balance sheet leverage: On a pro forma basis as of 9/30/2026, net debt to gross assets is expected to decline 14 percentage points, from 50% to 36%, providing greater balance sheet capacity and financial flexibility Improved quality of capital structure: The shift from debt to preferred equity provides a more flexible capital structure, as preferred equity has no contractual maturity, no required principal repayment, and greater flexibility to manage capital returns over time Greater capacity for future growth: Lower leverage and reduced debt obligations provide greater capacity to deploy capital toward future investments, strategic opportunities, and portfolio initiatives without increasing balance sheet leverage 1 2 3 (1) As of March 31, 2026 (2) Common equity is calculated as total gross assets less net debt and preferred equity Key Benefits $391M $415M $293M2
Looking Ahead The Future of BHR Cameo Beverly Hills, LXR Hotels & Resorts
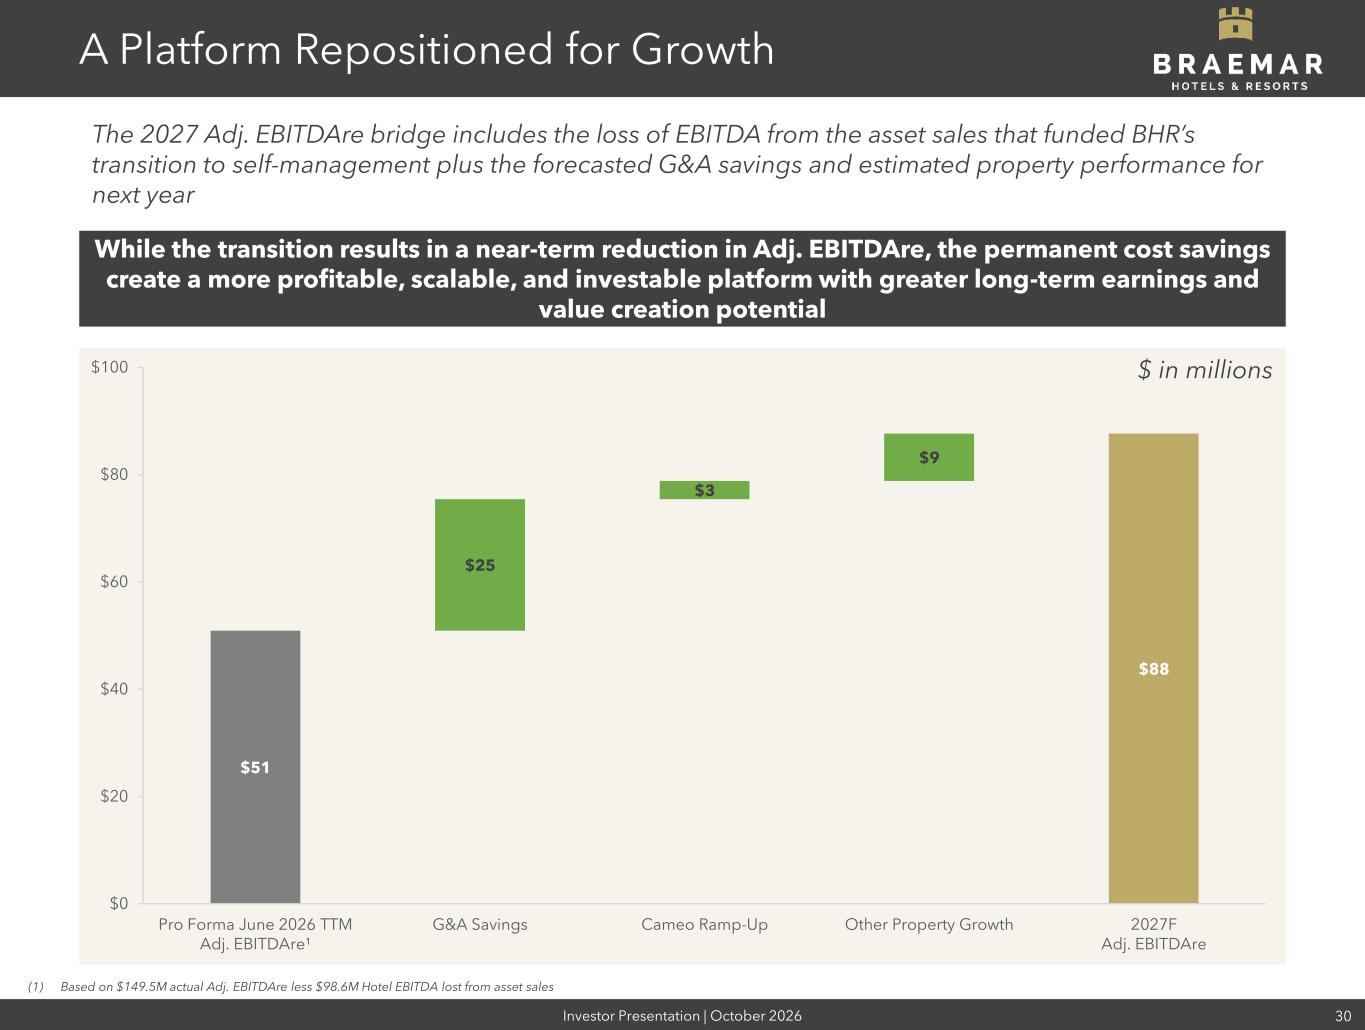
Investor Presentation | October 2026 30 $51 $25 $3 $9 $88 $0 $20 $40 $60 $80 $100 Pro Forma June 2026 TTM Adj. EBITDAre¹ G&A Savings Cameo Ramp-Up Other Property Growth 2027F Adj. EBITDAre A Platform Repositioned for Growth The 2027 Adj. EBITDAre bridge includes the loss of EBITDA from the asset sales that funded BHR’s transition to self-management plus the forecasted G&A savings and estimated property performance for next year While the transition results in a near-term reduction in Adj. EBITDAre, the permanent cost savings create a more profitable, scalable, and investable platform with greater long-term earnings and value creation potential $ in millions (1) Based on $149.5M actual Adj. EBITDAre less $98.6M Hotel EBITDA lost from asset sales
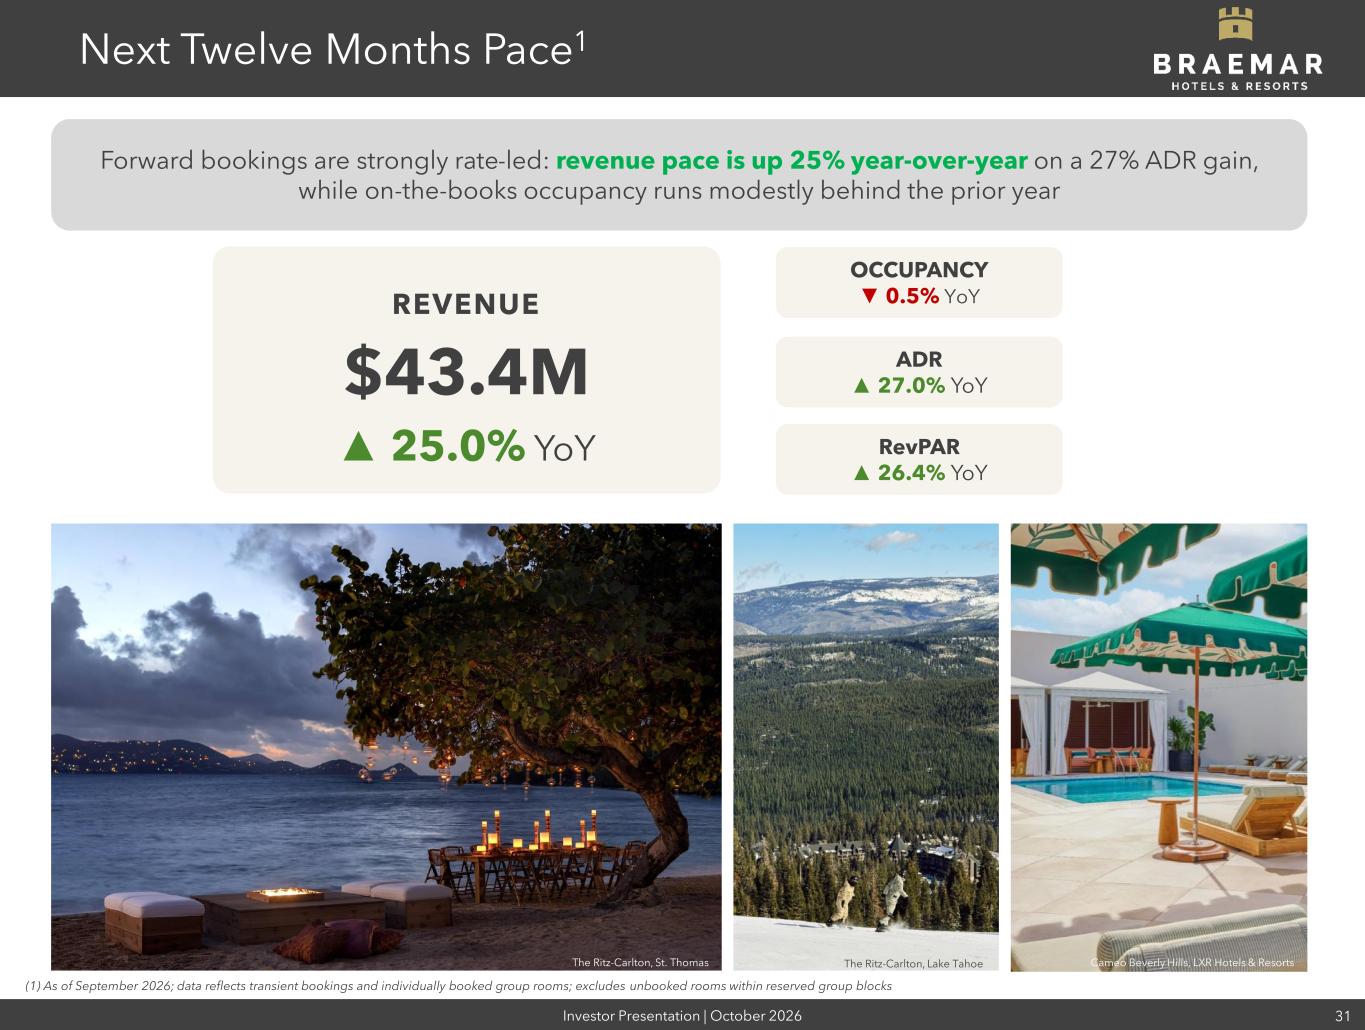
Investor Presentation | October 2026 31 Next Twelve Months Pace1 REVENUE $43.4M ▲ 25.0% YoY Forward bookings are strongly rate-led: revenue pace is up 25% year-over-year on a 27% ADR gain, while on-the-books occupancy runs modestly behind the prior year The Ritz-Carlton, St. Thomas The Ritz-Carlton, Lake Tahoe Cameo Beverly Hills, LXR Hotels & Resorts (1) As of September 2026; data reflects transient bookings and individually booked group rooms; excludes unbooked rooms within reserved group blocks OCCUPANCY ▼ 0.5% YoY ADR ▲ 27.0% YoY RevPAR ▲ 26.4% YoY
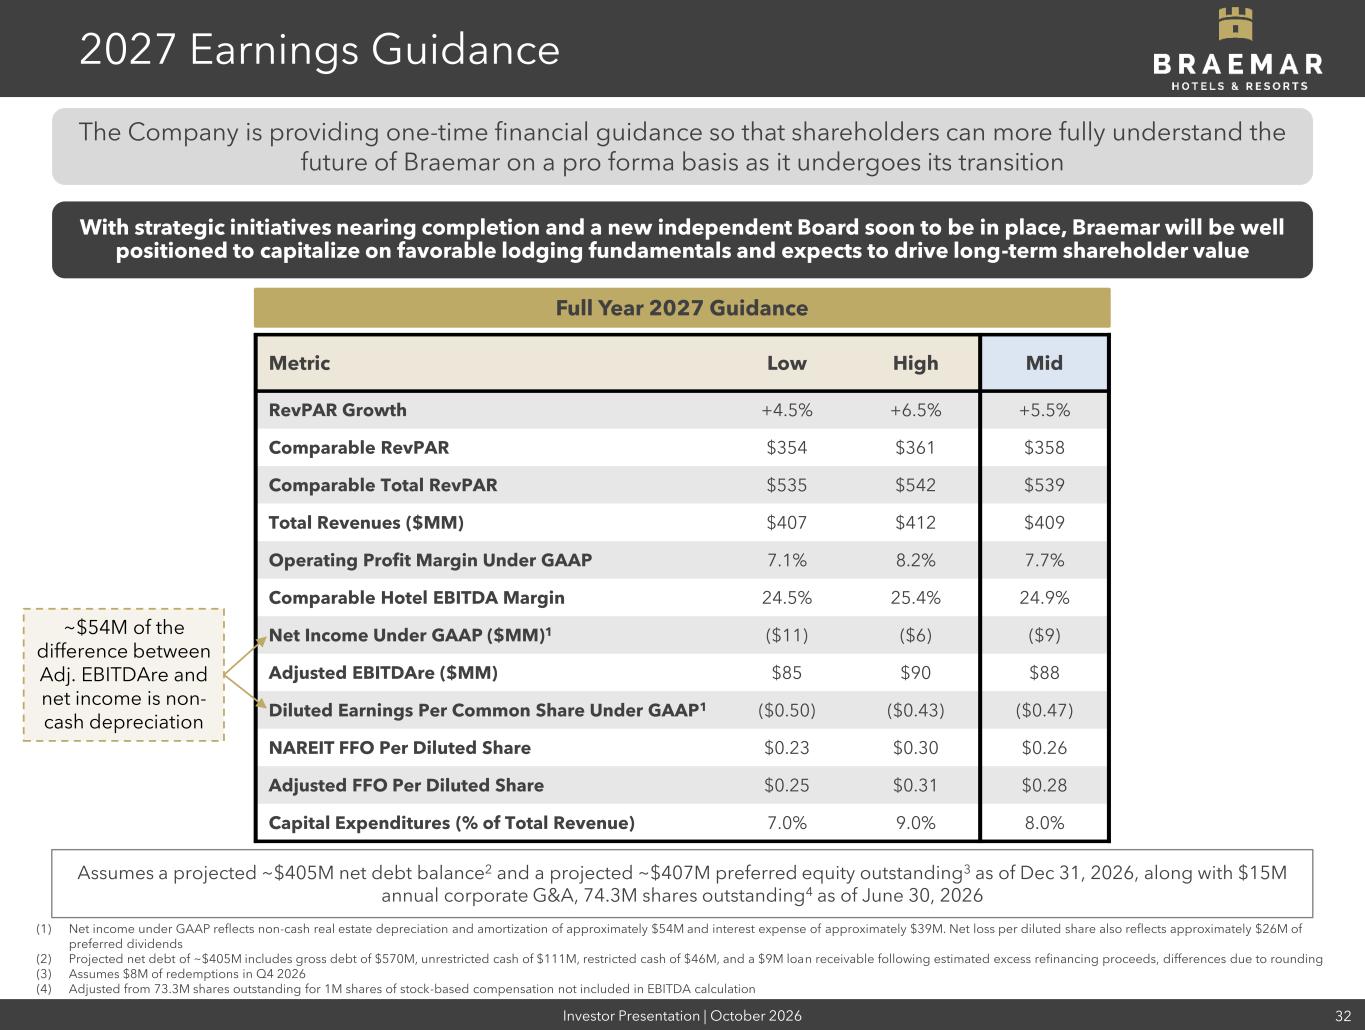
Investor Presentation | October 2026 32 With strategic initiatives nearing completion and a new independent Board soon to be in place, Braemar will be well positioned to capitalize on favorable lodging fundamentals and expects to drive long-term shareholder value The Company is providing one-time financial guidance so that shareholders can more fully understand the future of Braemar on a pro forma basis as it undergoes its transition 2027 Earnings Guidance Full Year 2027 Guidance (1) Net income under GAAP reflects non-cash real estate depreciation and amortization of approximately $54M and interest expense of approximately $39M. Net loss per diluted share also reflects approximately $26M of preferred dividends (2) Projected net debt of ~$405M includes gross debt of $570M, unrestricted cash of $111M, restricted cash of $46M, and a $9M loan receivable following estimated excess refinancing proceeds, differences due to rounding (3) Assumes $8M of redemptions in Q4 2026 (4) Adjusted from 73.3M shares outstanding for 1M shares of stock-based compensation not included in EBITDA calculation Metric Low High Mid RevPAR Growth +4.5% +6.5% +5.5% Comparable RevPAR $354 $361 $358 Comparable Total RevPAR $535 $542 $539 Total Revenues ($MM) $407 $412 $409 Operating Profit Margin Under GAAP 7.1% 8.2% 7.7% Comparable Hotel EBITDA Margin 24.5% 25.4% 24.9% Net Income Under GAAP ($MM)1 ($11) ($6) ($9) Adjusted EBITDAre ($MM) $85 $90 $88 Diluted Earnings Per Common Share Under GAAP1 ($0.50) ($0.43) ($0.47) NAREIT FFO Per Diluted Share $0.23 $0.30 $0.26 Adjusted FFO Per Diluted Share $0.25 $0.31 $0.28 Capital Expenditures (% of Total Revenue) 7.0% 9.0% 8.0% Assumes a projected ~$405M net debt balance2 and a projected ~$407M preferred equity outstanding3 as of Dec 31, 2026, along with $15M annual corporate G&A, 74.3M shares outstanding4 as of June 30, 2026 ~$54M of the difference between Adj. EBITDAre and net income is non- cash depreciation
A New Chapter for Braemar | 2026 The Ritz-Carlton Reserve Dorado Beach
Appendix
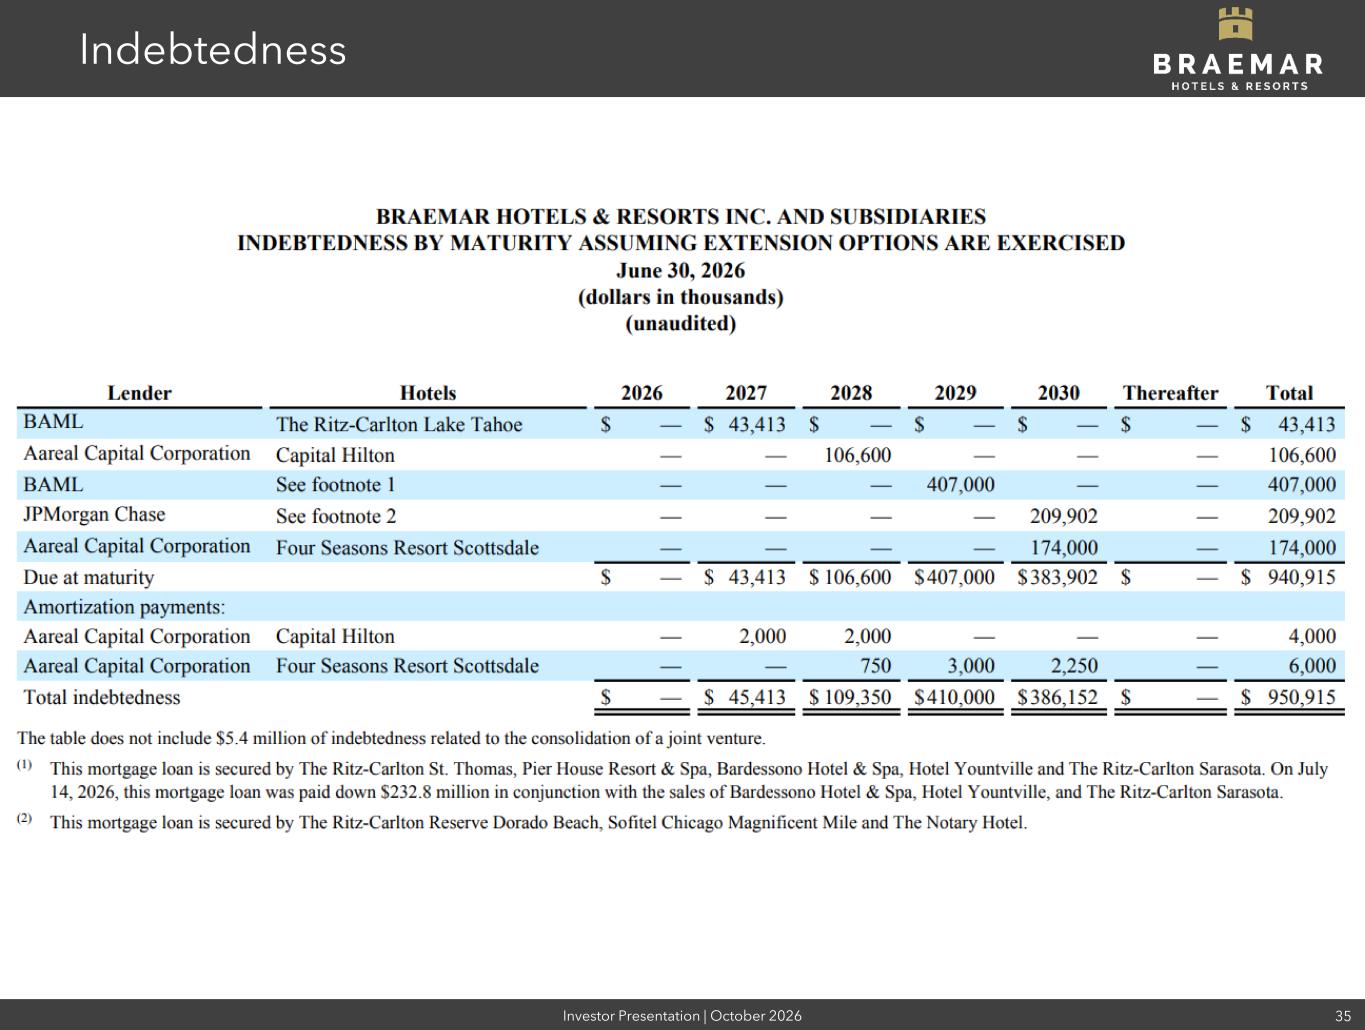
Investor Presentation | October 2026 35 Indebtedness
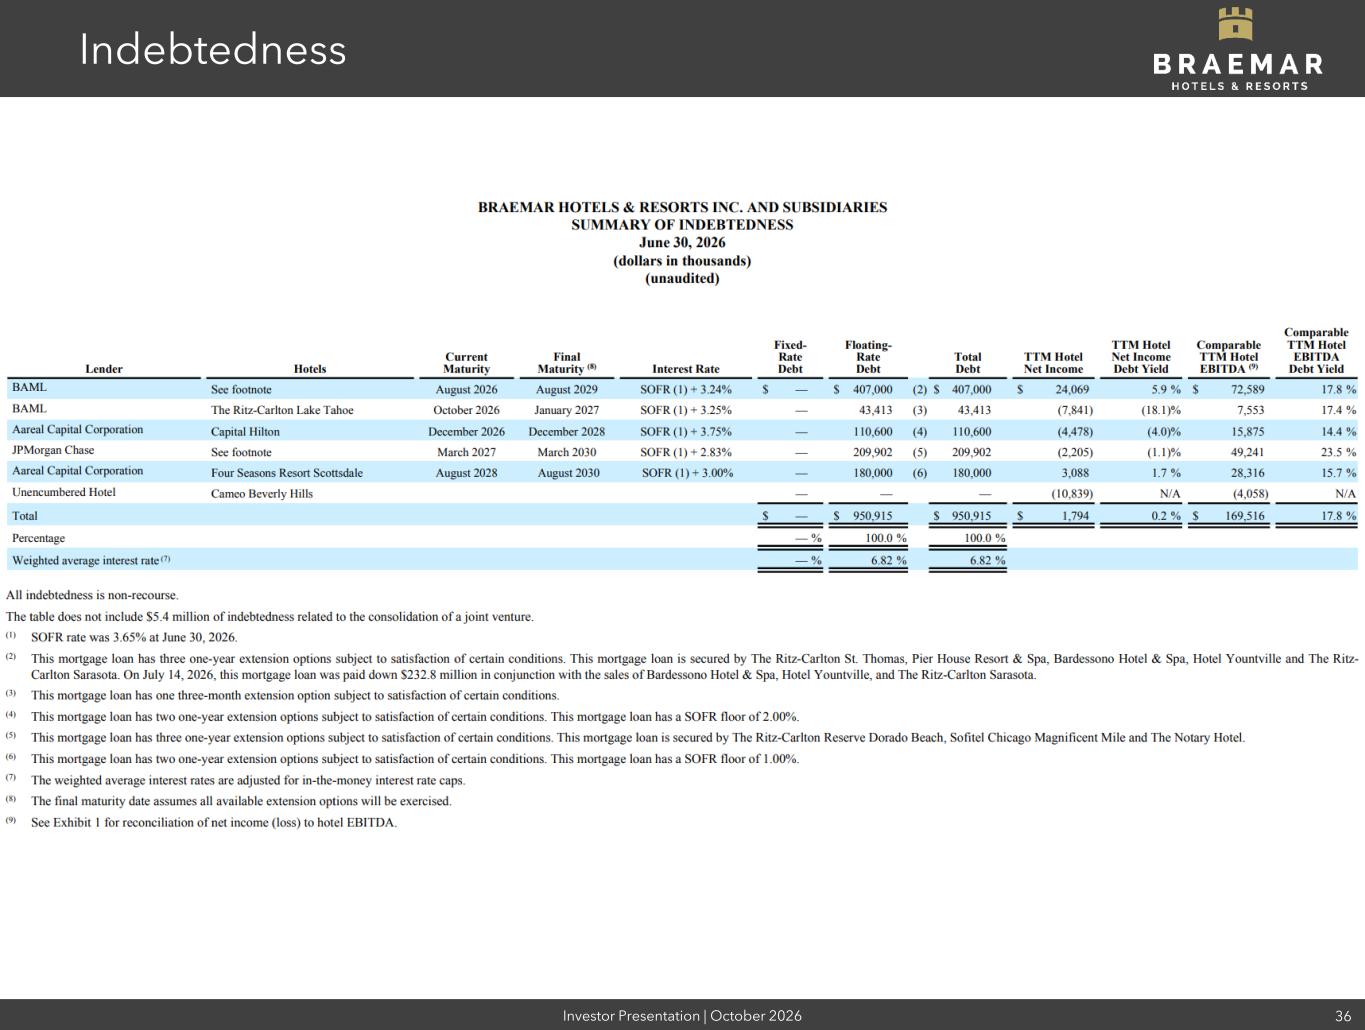
Investor Presentation | October 2026 36 Indebtedness
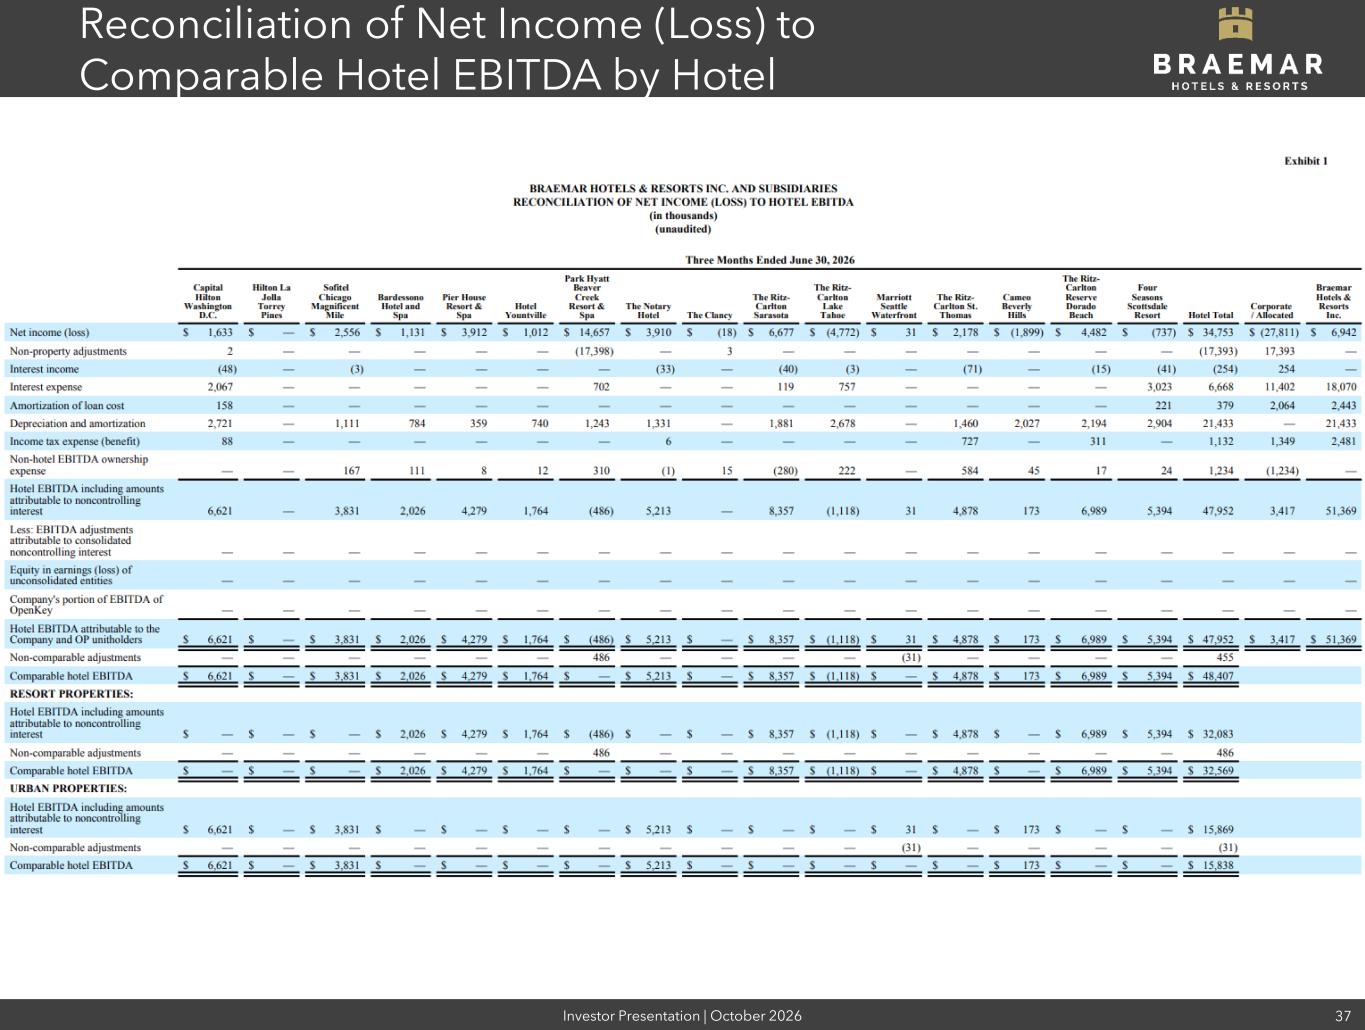
Investor Presentation | October 2026 37 Reconciliation of Net Income (Loss) to Comparable Hotel EBITDA by Hotel
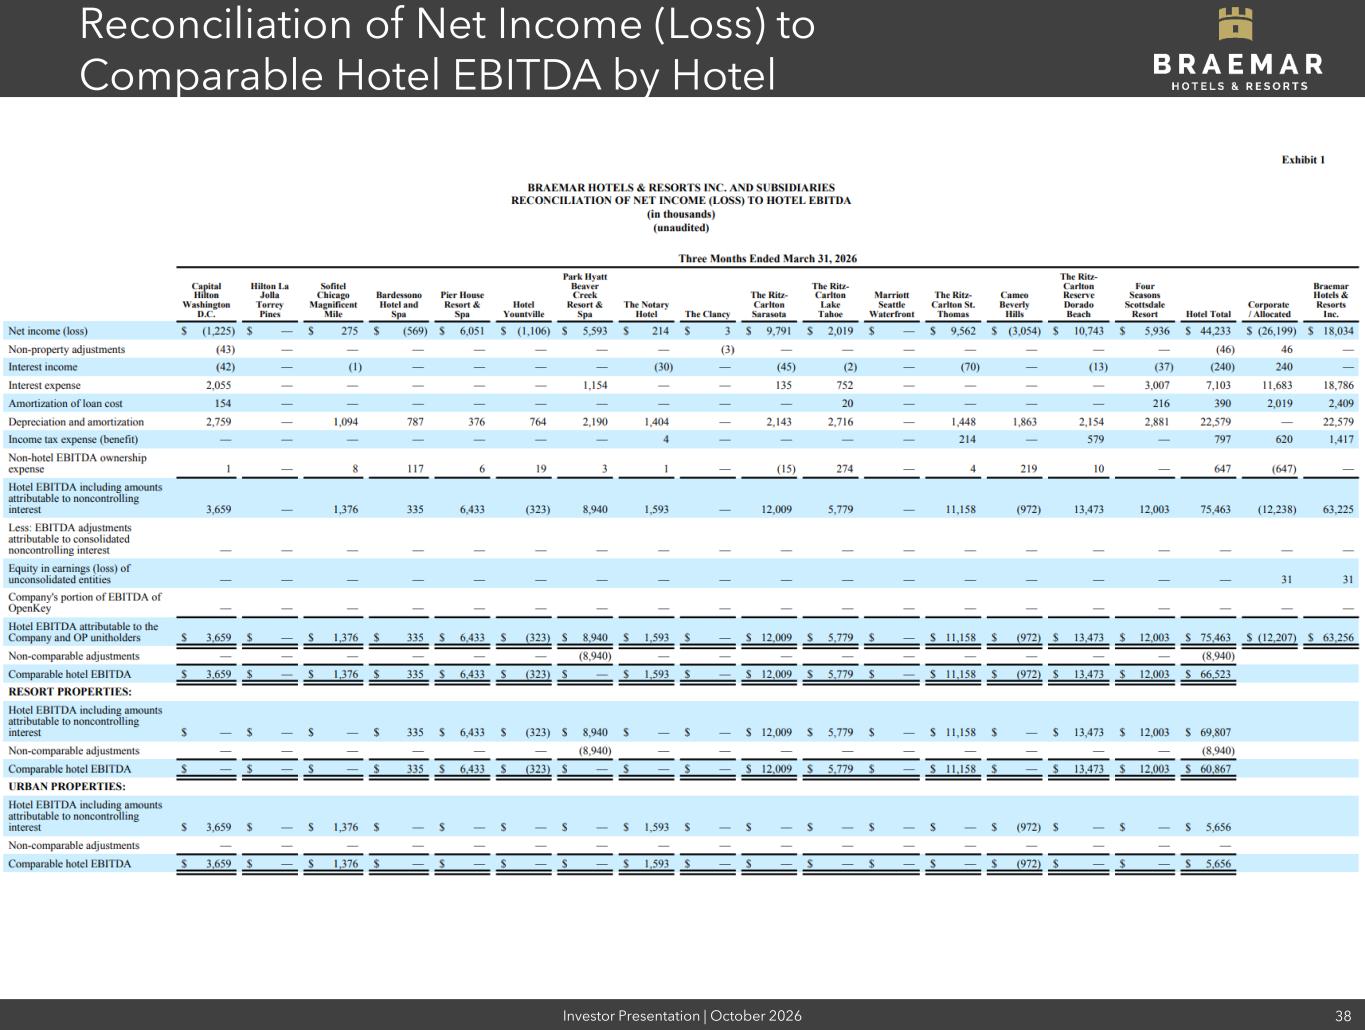
Investor Presentation | October 2026 38 Reconciliation of Net Income (Loss) to Comparable Hotel EBITDA by Hotel
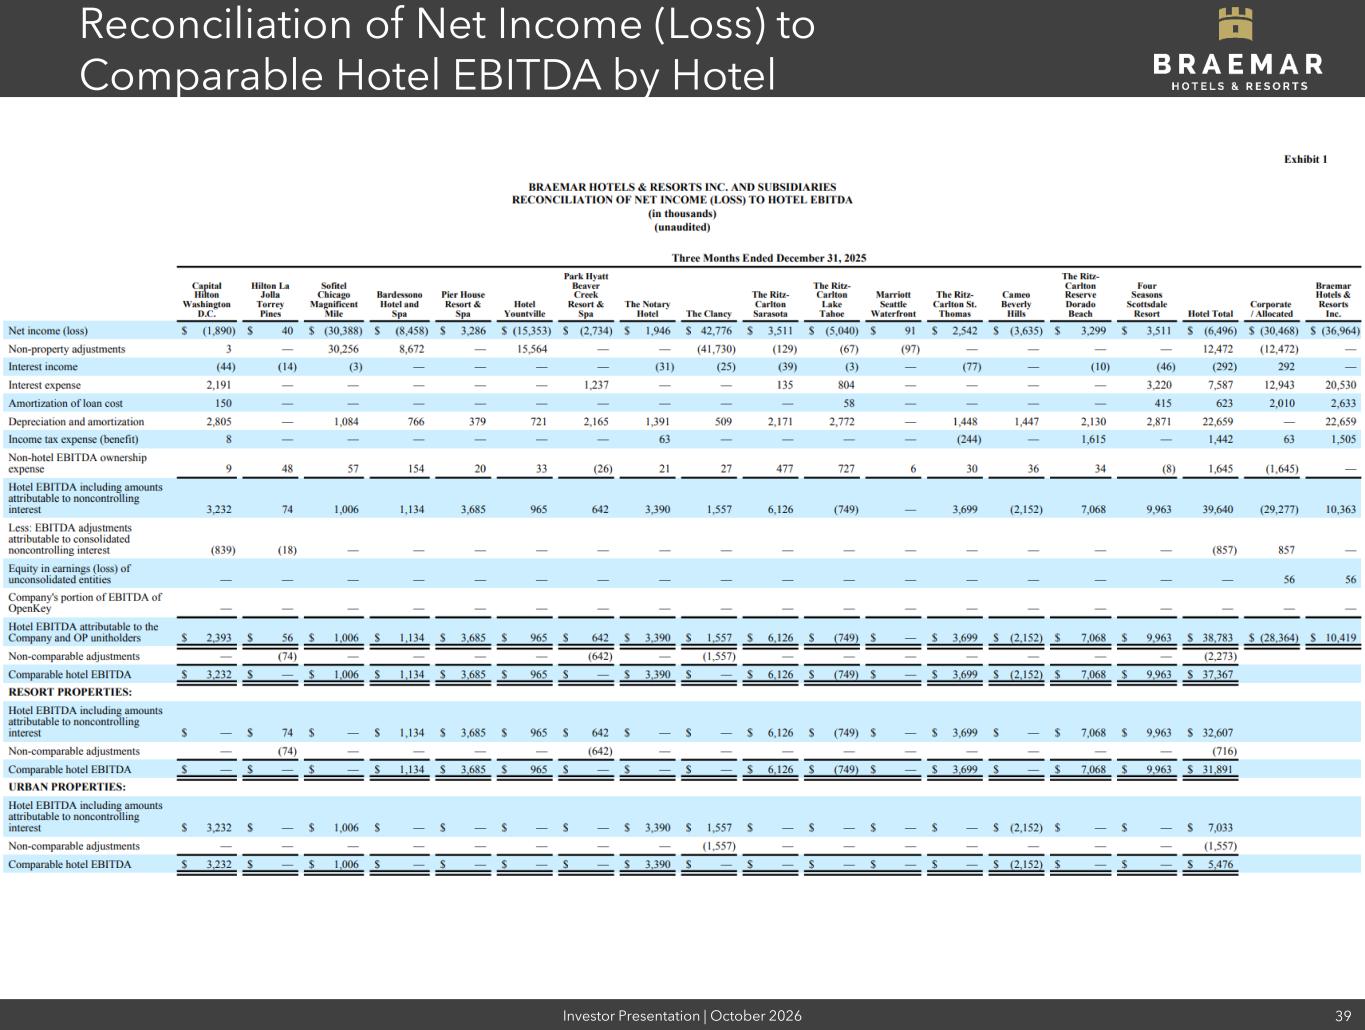
Investor Presentation | October 2026 39 Reconciliation of Net Income (Loss) to Comparable Hotel EBITDA by Hotel
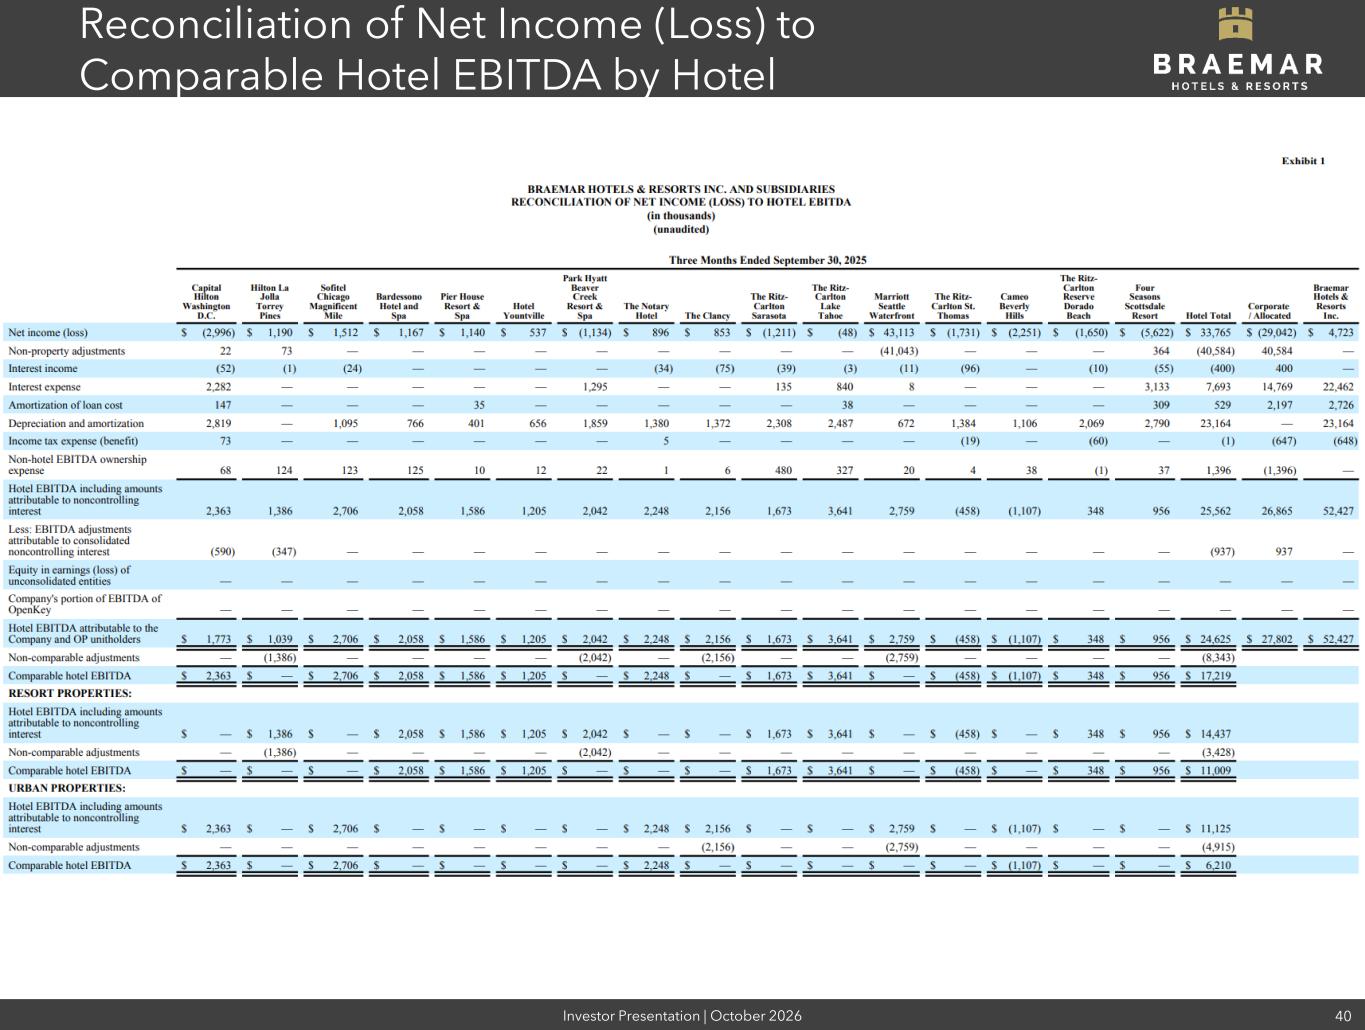
Investor Presentation | October 2026 40 Reconciliation of Net Income (Loss) to Comparable Hotel EBITDA by Hotel
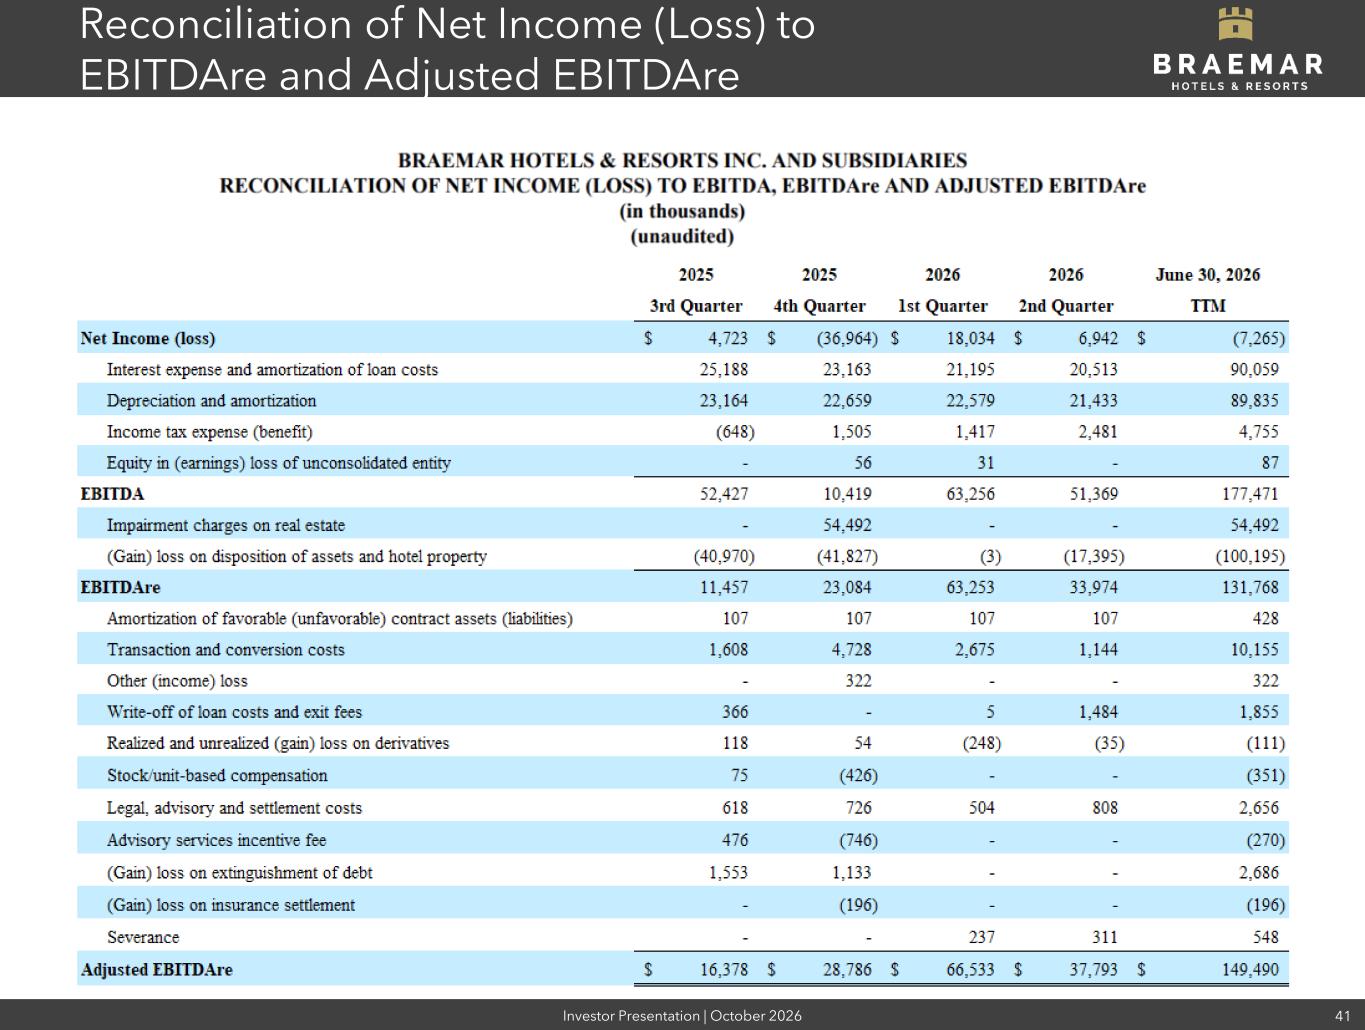
Investor Presentation | October 2026 41 Reconciliation of Net Income (Loss) to EBITDAre and Adjusted EBITDAre