.5
PRO FORMA VALUATION APPRAISAL REPORT
OF
MEMBERS MUTUAL HOLDING COMPANY
AS OF APRIL 11, 2018
4 Tower Bridge • 200 Barr Harbor Drive • Suite 300 • West Conshahacken • PA 19428-2979
phone (610) 832-1212 • toll free (800) 883-1212 • fax (610) 832-5301
www.boenninginc.com • Member FINRA/SIPC
April 11, 2018
Board of Directors
Members Mutual Holding Company
8700 W. Bryn Mawr Ave.
Chicago, IL 60631
Members of the Board:
At your request, Boenning & Scattergood Inc. (“Boenning”) completed and hereby provides an independent evaluation (the “Appraisal”) as of April 11, 2018 (the “Valuation Date”), of the estimated pro forma market value of the converted Members Mutual Holding Company, a mutual insurance holding company (“Members Mutual” or the “Company”), and its direct and indirect wholly-owned subsidiaries. Vericity Holdings, Inc. (“VHI”) is an intermediate holding company of Members Mutual and holds all of the shares of the Company’s operating subsidiaries Fidelity Life Association (“Fidelity Life” including its subsidiary America Direct “AD”, which is in run-off) and EFinancial, LLC (“Efinancial” including its subsidiaries iFramework (“iFramework”) and eCoverage.com, LLC (“eCoverage”)). This Appraisal is furnished pursuant to the Company’s Plan of Conversion, as of November 30, 2016 (the “Plan”) which was subsequently withdrawn and is expected to be updated and adopted in connection with the conversion described in this Appraisal. Under the Plan, Members Mutual proposes to convert from a mutual holding company to stock form (the “Conversion”) in a subscription rights conversion under Section 59.1 of the Illinois Insurance Code, 215 ILCS 5/59.1 (the “Code”). In conjunction with the Conversion, Members Mutual has organized a new holding company, Vericity, Inc. (“Vericity”) for the purpose of holding all the stock of Members Mutual after its conversion to stock form (“Converted Members Mutual”), and offer and sell shares of common stock, par value $0.001 per share (“Common Stock”) of Vericity though offerings (“Offering”) set at an amount equal to the estimated pro forma market value of the Company, more fully described herein.
Members Mutual Holding Company
April 11, 2018
Page 2 of 7
Pursuant to Section 5/59.l(6)(f) of the Code the estimated pro forma market value of the converted stock company (the “Pro Form a Market Value”) shall be based upon an independent evaluation by a qualified person. Furthermore, Section 59.1(6)(f) permits such Pro Forma Market Value to be the value that is estimated to be necessary to attract full subscription for the shares as indicated by the independent evaluation. The Plan addresses this requirement by requesting the independent appraiser to determine a Valuation Range and a Final Appraised Value both of which are to be based on the Pro Forma Market Value. For the purpose of this Appraisal the use of “midpoint” shall have the same meaning as Pro Forma Market Value as it relates to the requirement under Section 59.1(6)(f) of the Code.
THE PLAN OF CONVERSION
Under the Plan, Members Mutual proposes to convert from a mutual holding company to stock form in a subscription rights conversion and issue its common stock to Vericity, which will in turn offer its Common Stock for sale in the Offering which will encompass a subscription offering and a standby offering. The Common Stock in the Offering will be offered based on the following priorities:
| i) | First Priority Eligible Members – Person who is the owner of an in-force policy of insurance issued by Fidelity Life (“Member”) and who is a Member on the date of the adoption of the Plan (“Eligibility Record Date”) (“Eligible Member”). |
| ii) | ESOP – If an employee stock ownership plan (“ESOP”) is established by Vericity, the ESOP will be permitted to purchase Common Stock equal up to 10% of the total Common Stock sold in the Offering. Any oversubscription among the Eligible Members, directors and executive officers shall not cause a reduction in the number of shares to be purchased by the ESOP. In fact, the Plan indicates that the ESOP is permitted to acquire up to 10% of the total Common Stock sold in the Offering even in the event that the Maximum of the Valuation Range is reached excluding the ESOP. |
Members Mutual Holding Company
April 11, 2018
Page 3 of 7
| iii) | Second Priority Directors and Executive Officers – Persons who are directors of the Company or any subsidiary or who are deemed an executive officer of the Company. |
| iv) | Third Priority Standby Purchaser – the Company may sell shares of Common Stock to the Standby purchaser as may be necessary to reach the minimum of the Valuation Range or in the case where the minimum is met through the subscription offering, a number of shares that does not exceed the maximum of the Valuation Range when combined with the subscription offering. |
It is our understanding that, from time to time and as recently as its February 26, 2018 board of directors’ meeting, the Company has examined and considered many strategic alternatives including maintenance of the status quo, mergers with other mutual companies, expansion or acquisition of other lines of business or companies and the various forms of demutualization, of Members Mutual permitted by Illinois law. According to the Plan, after careful study and consideration. Members Mutual concluded that subscription rights method of demutualization, backstopped by a Standby Purchaser that will commit to purchase at least enough unsubscribed shares in the subscription rights conversion to ensure the successful completion of the offering, best suits Members Mutual’s circumstances.
BOENNING & SCATTERGOOD, INC.
Boenning, as part of its investment banking business, regularly is engaged in valuing assets, securities and companies in connection with various types of asset and security transactions, including mergers, acquisitions, private placements, public offerings and valuations for various other purposes, and in the determination of adequate consideration in such transactions. The background of Boenning is presented in Exhibit III. We believe that, except for the fee we will receive for our appraisal, we are independent of the Company and the other parties engaged by the Company to assist in the Conversion. Further, we believe we fully meet the requirement of a “qualified person” as required under Section 5/59.1(6)(f) of the Code.
Members Mutual Holding Company
April 11, 2018
Page 4 of 7
VALUATION METHODOLOGY
In preparing the Appraisal, we conducted an analysis of the Company that included discussions with the Company’s management and an onsite visit with Company management in Chicago, Illinois. In connection with a prior engagement, Boenning has also visited the Company’s Bellevue, Washington location, We reviewed Members Mutual’s GAAP and statutory financial statements as of and for the years ended December 31, 2015 through December 31, 2017. In addition, where appropriate, we considered information based on other available published sources that we believe are reliable, however, we cannot guarantee the accuracy and completeness of such information.
In preparing the Appraisal, we also reviewed and analyzed: (i) financial and operating information with respect to the business, operations, and prospects of the Company furnished to us by the Company; (ii) publicly available information concerning the Company that we believe to be relevant to our analysis; (iii) a comparison of the historical financial results and present financial condition of the Company with those of selected, publicly-traded insurance companies that we deemed relevant; and (iv) financial performance and market valuation data of certain publicly-traded insurance industry aggregates as provided by industry sources.
The Appraisal is based on the Company’s representation that the information contained in the Plan and additional information furnished to us by the Company including, but not limited to, the 2016 and 2017 GAAP financials, are truthful, accurate, and complete. We did not independently verify any of the financial statements and other information provided by the Company and its independent auditor, nor did we independently value the assets or liabilities of the Company. The Appraisal considers the Company only as a going concern on a stand-alone basis and should not he considered as an indication of the liquidation value of the Company.
We have investigated the competitive environment within which the Company operates and have assessed the Company’s strengths and weaknesses relative to comparable insurance
Members Mutual Holding Company
April 11, 2018
Page 5 of 7
companies. We have monitored material regulatory and legislative actions affecting financial institutions generally and, to the extent that we were aware of such matters, analyzed the potential impact of such developments on the Company and the industry as a whole. We have analyzed the potential effects of the Offering on the Company’s operating characteristics and financial performance as they relate to the Pro Forma Market Value of the Company. We have reviewed the economy and demographic characteristics of the primary market area in which the Company currently operates. We have compared the Company’s financial performance and condition with publicly-traded insurance institutions evaluated and selected in accordance with the valuation guidelines. We have reviewed conditions in the securities markets in general and the markets for insurance companies, and insurance holding companies.
Our appraised value is predicated on a continuation of the current operating environment for Members Mutual, and for all insurance companies and their holding companies. Changes in the local and national economy, the federal and state legislative and regulatory environments for insurance companies, the stock market, interest rates, and other external forces (such as natural disasters or significant world events) may occur from time to time, often with great unpredictability, and may materially impact the value of insurance stocks as a whole or the Company’s value alone. To the extent that such factors can be foreseen, they have been factored into our analysis.
VALUATION CONCLUSION
It is our opinion that, as of the Valuation Date the Pro Forma Market Value of the Company is $175.0 million with a range of $148.8 million to $201.3 million (the “Valuation Range”). The Valuation Range was based upon a fifteen percent decrease from the Pro Forma Market Value for the minimum and a fifteen percent increase from the Pro Forma Market Value to establish the maximum. Exhibits XIX and XX show the assumptions and calculations utilized in determining this Valuation Range. In determining the Pro Forma Market Value of the Company, we have taken into consideration and we have adhered to the requirements specifically set forth in Section 5/59.1(6)(f). Boenning’s use of a range, while not prescribed or prohibited by the Code, is
Members Mutual Holding Company
April 11, 2018
Page 6 of 7
requested under the Plan, normal and customary in independent appraisals, and consistent with our experience in other similar and precedent transactions. Boenning utilized the valuation standard of minority interest, freely traded within the context of Section 59.1.
LIMITING FACTORS AND CONSIDERATIONS
Our Appraisal is not intended, and must not be construed to be, a recommendation of any kind as to the advisability of participating in the Offering. Moreover, because the Appraisal is necessarily based upon estimates and projections of a number of matters, all of which are subject to change from time to time, no assurance can be given that persons who purchase shares of stock in the conversion will thereafter be able to sell such shares at prices related to the foregoing Pro Forma Market Value. The Appraisal reflects only the Valuation Range as of the Valuation Date for the Pro Forma Market Value of the Company immediately upon issuance of the stock and does not take into account any trading activity with respect to the purchase and sale of common stock in the secondary market on the date of issuance of such securities or at any time thereafter following the completion of the Offering. Any report prepared by Boenning shall not be used as an offer or solicitation with respect to the purchase or sale of any securities.
Boenning has made no recommendation regarding the merits of the decision to proceed or not to proceed with the Offering or Conversion. The results of our Appraisal are but one of the many factors the Company’s board of directors should consider in making its decision. The Company has assured Boenning that it has relied on its own counsel, accountants and other experts for legal, accounting, tax and similar professional advice.
Members Mutual Holding Company
April 11, 2018
Page 7 of 7
The Valuation Range reported herein may be updated periodically at the request of the Company or discretion of Boenning as appropriate. These updates will consider, among other factors, any developments or changes in the Company’s operating performance, financial condition, or management policies, and current conditions in the securities markets for insurance company common stocks. Should any such new developments or changes be material, in our opinion, to the Pro Forma Market Value, then appropriate adjustments will be made to the Valuation Range. The reasons for any such adjustments will be explained in detail at that time.
| Respectfully submitted. |
| /s/ BOENNING & SCATTERGOOD, INC |
| BOENNING & SCATTERGOOD, INC |
TABLE OF CONTENTS
| I. |
Introduction | 3 | ||||
| II. |
Business Overview Of Members Mutual & Subsidiaries | 9 | ||||
| III. |
Industry Overview | 50 | ||||
| IV. |
Valuation Methodologies | 61 | ||||
| V. |
Market Value Adjustments | 72 | ||||
| Exhibits | ||
| I. | Statement of General Assumptions and Limiting Conditions | |
| II. | Certification | |
| III. | Appraiser’s Background | |
| IV. | Members Mutual Historical Balance Sheet – GAAP Basis | |
| V. | Members Mutual Historical Statement of Operations – GAAP Basis | |
| VI. | Members Mutual Historical Balance Sheet Growth Analysis – GAAP Basis | |
| VII. | Members Mutual Historical Statement of Operations Growth Analysis – GAAP Basis | |
| VIII. | Members Mutual Historical Balance Sheet Common Size Analysis – GAAP Basis | |
| IX. | Members Mutual Historical Statement of Operations Common Size Analysis – GAAP Basis | |
| X. | Fidelity Life Historical Balance Sheet – Statutory Basis | |
| XI. | Fidelity Life Historical Statement of Operations – Statutory Basis | |
| XII. | Public L&H Insurance Group | |
| XIII. | Overview of the Comparable Group | |
| XIV. | Financial Condition of the Comparable Group | |
| XV. | Operating Performance of the Comparable Group | |
| XVI. | Ratio Analysis of the Comparable Group | |
| XVII. | Fidelity Life Historical Investment Portfolio | |
| XVIII. | Comparable Market Analysis | |
| XIX. | Pro Forma Assumptions for Conversion Valuation | |
| XX. | Pro Forma Conversion Valuation Range | |
| 2 |
| |||
| 1. | Introduction |
At the request of the members of the board of the Company, Boenning & Scattergood Inc. (“Boenning”) completed and hereby provides an independent appraisal (the “Appraisal”) as of April 11, 2018 (the “Valuation Date”), of the estimated pro forma market value of the converted Members Mutual Holding Company, a mutual insurance holding company (“Members Mutual” or the “Company”), and its direct and indirect wholly-owned subsidiaries. Vericity Holdings, Inc. (“VHI”) is an intermediate holding company of Members Mutual and holds all of the shares of the Company’s operating subsidiaries Fidelity Life Association (“Fidelity Life” including its subsidiary America Direct “AD”, which is in run-off) and Efinancial, LLC (“Efinancial” including its subsidiaries iFramework (“iFramework”) and eCoverage.com, LLC (“eCoverage”). This Appraisal is furnished pursuant to the Company’s Plan of Conversion, as of November 30. 2016 (the “Plan”) which was subsequently withdrawn and is expected to be updated and adopted in connection with the conversion described in this Appraisal. Under the Plan, Members Mutual proposes to convert from a mutual holding company to stock form (the “Conversion”) in a subscription rights conversion under Section 59.1 of the Illinois Insurance Code, 215 ILCS 5/59.1 (the “Code”). In conjunction with the Conversion, Members Mutual has organized a new holding company, Vericity, Inc. (“Vericity”) for the purpose of holding all the stock of Members Mutual after its conversion to stock form (“Converted Members Mutual”), and offer and sell shares of common stock, par value $0.001 per share (“Common Stock”) of Vericity though offerings (“Offering”) set at an amount equal to the estimated pro forma market value of the Company, more fully described herein.
Pursuant to Section 5/59.1(6)(f) of the Code the estimated pro forma market value of the converted stock company (the “Pro Forma Market Value”) shall be based upon an independent evaluation by a qualified person. Furthermore, Section 59.1(6)(f) permits such Pro Forma Market Value to be the value that is estimated to be necessary to attract full subscription for the shares as indicated by the independent evaluation. The Plan addresses this requirement by requesting the independent appraiser to determine a Valuation Range and a Final Appraised Value both of which are to be based on the Pro Forma Market Value. For the purpose of this Appraisal the use of
| 3 |
| |||
|
“midpoint” shall have the same meaning as Pro Forma Market Value as it relates to the requirement under Section 59.1(6)(f) of the Code.
Because the Plan involves the conversion of Members Mutual from mutual-to-stock form, the Plan must be approved by the Illinois Director of Insurance (“Illinois Director”) pursuant to the applicable provisions of the Code and the order of the Illinois Director dated January 30, 2007 (the “2007 Order”) approving the Fidelity Life Conversion Plan under which the Company’s current mutual holding company structure was created. The Company’s Plan is also subject to approval of the Eligible Members, defined herein, pursuant to Section 5/59.1(4)(c)(i) of the Code.
THE PLAN OF CONVERSION
Under the Plan, Members Mutual proposes to convert from a mutual holding company to stock form in a subscription rights conversion and issue its common stock to Vericity, which will in turn offer its Common Stock for sale in the Offering which will encompass a subscription offering and a standby offering. The Common Stock in the Offering will be offered based on the following priorities:
| i) | First Priority Eligible Members – Person who is the owner of an in-force policy of insurance issued by Fidelity Life (“Member”) and who is a Member on the date of the adoption of the Plan (“Eligibility Record Date”) (“Eligible Member”). |
| ii) | ESOP – If an employee stock ownership plan (“ESOP”) is established by Vericity, the ESOP will be permitted to purchase Common Stock equal up to 10% of the total Common Stock sold in the Offering. Any oversubscription among the Eligible Members, directors and executive officers shall not cause a reduction in the number of shares to be purchased by the ESOP. In fact, the Plan indicates that the ESOP is permitted to acquire up to 10% of the total Common Stock sold in the Offering even in the event that the Maximum of the Valuation Range is reached excluding the ESOP. |
| 4 |
| |||
|
| iii) | Second Priority Directors and Executive Officers - Persons who are directors of the Company or any subsidiary or who are deemed an executive officer of the Company. |
| iv) | Third Priority Standby Purchaser – the Company may sell shares of Common Stock to the Standby purchaser as may be necessary to reach the Minimum of the Valuation Range or in the case where the minimum is met through the subscription offering, a number of shares that does not exceed the Maximum of the Valuation Range when combined with the Subscription Offering. |
It is our understanding that, from time to time and as recently as its February 26, 2018 board of directors’ meeting, the Company has explored many strategic alternatives including maintenance of the status quo, mergers with other mutual companies, expansion or acquisition of other lines of business or companies and the various forms of demutualization of Members Mutual permitted by Illinois law. According to the Plan, after careful study and consideration, Members Mutual concluded that subscription rights method of demutualization, backstopped by a Standby Purchaser that will commit to purchase at least enough unsubscribed shares in the subscription rights conversion to ensure the successful completion of the offering, best suits Members Mutual’s circumstances.
BOENNING & SCATTERGOOD, INC.
Boenning, as part of its investment banking business, regularly is engaged in valuing assets, securities and companies in connection with various types of asset and security transactions, including mergers, acquisitions, private placements, public offerings and valuations for various other purposes, and in the determination of adequate consideration in such transactions. The background of Boenning is presented in Exhibit III. We believe that, except for the fee we will receive for our appraisal, we are independent of the Company and the other parties engaged by the Company to assist in the Conversion. Further we believe we fully meet the requirement of a “qualified person” as required under Section 5/59.1(6)(f) of the Code.
| 5 |
| |||
VALUATION METHODOLOGY
In preparing the Appraisal, we conducted an analysis of the Company that included discussions with the Company’s management and an onsite visit to the Company’s offices in Chicago. Illinois. In connection with a prior engagement. Boenning has also visited the Company’s Bellevue, Washington location. We reviewed Members Mutual’s GAAP and statutory financial statements as of and for the years ended December 31, 2015 through December 31, 2017. In addition, where appropriate, we considered information based on other available published sources that we believe are reliable, however, we cannot guarantee the accuracy and completeness of such information.
In preparing the Appraisal, we also reviewed and analyzed; (i) financial and operating information with respect to the business, operations, and prospects of the Company furnished to us by the Company; (ii) publicly available information concerning the Company that we believe to be relevant to our analysis; (iii) a comparison of the historical financial results and present financial condition of the Company with those of selected, publicly-traded insurance companies that we deemed relevant; and (iv) financial performance and market valuation data of certain publicly-traded insurance industry aggregates as provided by industry sources.
The Appraisal is based on the Company’s representation that the information contained in the Plan and additional information furnished to us by the Company, including, but not limited to, the 2016 and 2017 GAAP financials, are truthful, accurate, and complete. We did not independently verify any of the financial statements and other information provided by the Company and its independent auditor, nor did we independently value the assets or liabilities of the Company. The Appraisal considers the Company only as a going concern on a stand-alone basis and should not be considered as an indication of the liquidation value of the Company.
| 6 |
| |||
We have investigated the competitive environment within which the Company operates and have assessed the Company’s strengths and weaknesses relative to comparable insurance companies. We have monitored material regulatory and legislative actions affecting financial institutions generally and, to the extent that we were aware of such matters, analyzed the potential impact of such developments on the Company and the industry as a whole. We have analyzed the potential effects of the Offering on the Company’s operating characteristics and financial performance as they relate to the Pro Forma Market Value of the Company. We have reviewed the economy and demographic characteristics of the primary market area in which the Company currently operates. We have compared the Company’s financial performance and condition with publicly-traded insurance institutions evaluated and selected in accordance with the valuation guidelines. We have reviewed conditions in the securities markets in general and the markets for insurance companies, and insurance holding companies.
Our appraised value is predicated on a continuation of the current operating environment for Members Mutual, and for all insurance companies and their holding companies. Changes in the local and national economy, the federal and state legislative and regulatory environments for insurance companies, the stock market, interest rates, and other external forces (such as natural disasters or significant world events) may occur from time to time, often with great unpredictability, and may materially impact the value of insurance stocks as a whole or the Company’s value alone. To the extent that such factors can be foreseen, they have been factored into our analysis.
VALUATION CONCLUSION
It is our opinion that, as of the Valuation Date the Pro Forma Market Value of the Company is $175.0 million with a range of $148.8 million to $ to 201.3 million (the “Valuation Range”). The Valuation Range was based upon a fifteen percent decrease from the Pro Forma Market Value for the minimum and a fifteen percent increase from the Pro Forma Market Value to establish the maximum. Exhibits XIX and XX show the assumptions and calculations utilized in determining this Valuation Range. In determining the Pro Forma Market Value of the Company, we have taken in consideration and we have adhered to the requirements specifically set forth in Section
| 7 |
| |||
5/59.1(6)(f). Boenning’s use of a range, while not prescribed or prohibited by the Code, is requested by the Plan, is normal and customary in independent evaluations, consistent with our experience in other similar transactions. Boenning utilized the valuation standard of minority interest, freely traded within the context of Section 59.1.
LIMITING FACTORS AND CONSIDERATIONS
Our Appraisal is not intended, and must not be construed to be, a recommendation of any kind as to the advisability of participating in the Offering. Moreover, because the Appraisal is necessarily based upon estimates and projections of a number of matters, all of which are subject to change from time to time, no assurance can be given that persons who purchase shares of stock in the conversion will thereafter be able to sell such shares at prices related to the foregoing Pro Forma Market Value. The Appraisal reflects only the Valuation Range as of the Valuation Date for the Pro Forma Market Value of the Company immediately upon issuance of the stock and does not take into account any trading activity with respect to the purchase and sale of common stock in the secondary market on the date of issuance of such securities or at any time thereafter following the completion of the Offering. Any report prepared by Boenning shall not be used as an offer or solicitation with respect to the purchase or sale of any securities.
Boenning has made no recommendation regarding the merits of the decision to proceed or not to proceed with the Offering or Conversion. The results of our Appraisal are but one of the many factors the Company’s board of directors should consider in making its decision. The Company has assured Boenning that it has relied on its own counsel, accountants and other experts for legal, accounting, tax and similar professional advice.
The Valuation Range reported herein may be updated periodically at the request of the Company or discretion of Boenning as appropriate. These updates will consider, among other factors, any developments or changes in the Company’s operating performance, financial condition, or management policies, and current conditions in the securities markets for insurance company common stocks. Should any such new developments or changes be material, in our opinion, to the Pro Forma Market Value, then appropriate adjustments will be made to the Valuation Range. The reasons for any such adjustments will be explained in detail at that time.
| 8 |
| |||
II. Business Overview of Members Mutual & Subsidiaries
General Overview
Members Mutual operates as a holding company and operates primarily through its Fidelity Life and Efinancial units. Together, Fidelity Life and Efinancial attempt to address the substantial unmet need for life insurance protection products, particularly among domestic households with annual incomes of between $50,000 and $125,000, a market the Company refers to as its target Middle Market. Members Mutual’s goal is to deliver to this market affordable, easy to understand term life insurance and other insurance products through a consumer-friendly and efficient sales process. Through innovation in product design and distribution, including electronic processing, quick issuance of life insurance policies, and an emphasis on non-medically underwritten products, Members Mutual believes it is well positioned to serve its target market.
Fidelity Life is an Illinois-domiciled life insurance company that was chartered in 1896. Fidelity Life distributes life insurance products through Efinancial and other unaffiliated agents and is licensed in the District of Columbia and every state except New York and Wyoming. Texas and California are its largest states by direct premiums written and the top five states accounted for approximately 40% of total direct premiums written.
Fidelity Life Top 5 States by Direct Premiums Written
| Ordinary Life | Group Life | Total Life | ||||||||||
| Texas |
10.8 | % | 20.1 | % | 12.3 | % | ||||||
| California |
10.1 | % | 3.2 | % | 9.0 | % | ||||||
| Florida |
6.4 | % | 15.0 | % | 7.7 | % | ||||||
| North Carolina |
3.3 | % | 24.8 | % | 6.7 | % | ||||||
| Illinois |
4.8 | % | 1.3 | % | 4.2 | % | ||||||
Source: SNL Financial: represents 2017 year end data.
A.M. Best has assigned an “A-” (Excellent) rating to Fidelity Life, which is the fourth highest out of fifteen ratings. As of March 31, 2018, Fidelity Life had 120 employees and is headquartered in Chicago, Illinois and maintains certain IT staffing in Portland, Oregon.
| 9 |
| |||
Efinancial is a call center-based insurance agency that sells Fidelity Life products through its own retail distribution platform and through independent agents and other marketing organizations, which is referred to as their eIndependent channel, Efinancial, in addition to offering Fidelity Life products, sells insurance products of unaffiliated carriers, Efinancial conducts its operations primarily from two call centers located in Bellevue, Washington and Chicago, Illinois. As of March 31, 2018, Efinancial had 264 employees, Its principal office is located in Bellevue, Washington.
Members Mutual had total assets of $666,4 million and total equity of $196.2 million as of December 31, 2017, For the year ended December 31, 2017, Members Mutual had $82.9 million in net premium written and a net loss of $8.2 million.
Corporate History
The founding of Members Mutual is associated with Fidelity Life and dates back to 1896. where Fidelity Life focused on providing financial security for the growing middle class of the Midwest and Northern states as a fraternal benefit society under the name Mystic Workers of the World. By 1908, membership had passed the 50,000 mark, and in 1915, the organization had $100 million of life insurance in force, Despite one of the worst decades in U.S. financial history after the crash of 1929, management successfully increased assets by nearly 100%. In 1953, Fidelity Life converted to a mutual legal reserve life company. Shortly thereafter, Fidelity Life became affiliated with Kemper Companies (“Kemper”) through a fee-for- management service agreement. In 2004, Fidelity Life’s board of directors determined that the interest of the Company and its policyholders would be best served by ending the management agreement with Kemper and its successor entities, under which it had operated for nearly 50 years. In 2006, Fidelity Life re-launched as an independent company with a renewed commitment to providing insurance products to the underserved market of middle class Americans.
In May 2007, policyholders approved the reorganization of Fidelity Life from a mutual to a stock insurance company, with VHI established as the parent of Fidelity Life and Members
| 10 |
| |||
Mutual established as the ultimate parent. In July 2009, VHI acquired Efinancial, founded in 2001, to provide additional distribution capabilities and growth opportunities.
In 2012, Efinancial established eCoverage to help source and manage life insurance leads. eCoverage is primarily an online platform used to capture lead information and better monetize both traffic and leads. It contains a variety of landing pages for affiliates and affiliate networks to send traffic, thereby capturing consumer information on people who’ve expressed interest in receiving a life insurance quote. Using flexible business logic, eCoverage leads can be intelligently routed to the Efinancial call center or to third-party lead buyers. To help offset lead acquisition costs, eCoverage also generates revenue when consumers click on paid ads.
In 2014, Members Mutual redeemed all the Class B Common Stock that was issued in the acquisition of Efinancial. Also, in 2014, various management changes were made including James Hohmann joining the Company as CEO. Upon Mr. Hohmann’s arrival, the Company developed the new business strategy on which it is currently focused. In 2015, the Company adopted predictive analytics to further its unique approach to serving the Middle American life insurance market. In recent years, the Company further augmented its management team, adding seasoned leaders, including new management at Efinancial, with the skills and experience needed to capitalize on the middle market opportunity.
Organizational Structure and Operating Segments
Domiciled in Illinois, Members Mutual is a mutual insurance holding company. VHI, a wholly owned subsidiary of Members Mutual, is a Delaware general business corporation.
Members Mutual owns 100% of the outstanding common stock of VHI, VHI in turn owns 100% of the outstanding common stock of Fidelity Life and is the sole owner of Efinancial. With the acquisition of Efinancial, the business and operations, including employees, of America Direct (an inactive company) were transferred to Fidelity Life effective January 1, 2010, eCoverage and iFramework operate as subsidiaries of Efinancial.
| 11 |
| |||
While Fidelity Life and Efinancial are separate companies operating under the Members Mutual umbrella, they are operated on an integrated and collaborative basis for the long-term benefit of the Company overall – consistent with the tenets of its business strategy which seeks to lever the firm’s position as a product manufacturer with controlled distribution.
The organizational chart of the Company and subsidiaries discussed above is presented in the chart below:
From an operations perspective, the Company manages its business through three segments:
| • | Agency. The agency segment operates through Efinancial. Efinancial sells insurance products through its call center distribution platform and through its independent agents and other marketing organizations. |
| • | Insurance. The insurance segment operates through Fidelity Life, Fidelity Life engages in the principal business lines of core life, non-core life, closed block, annuities and assumed life. Fidelity Life offers primarily term life insurance products, and to a lesser extent accidental death and final expense products, It does not currently offer annuity contracts, separate account variable products, or universal life products. |
| 12 |
| |||
| • | Corporate. The corporate segment consists primarily of a small amount of capital required to be maintained for regulatory purposes, and also includes certain expenses considered to be corporate and not allocated to our agency or insurance segments. |
Members Mutual conveyed during our discussions that they believe that their approach to the life insurance market is better suited to successfully place life insurance where other historical models have not been as effective. Fidelity Life’s combination of innovative technology with industry experience creates value for its policyholders, distributors and the Company. As an insurance carrier with a controlled distribution model, the Company believes that it is strategically positioned to take advantage of the following competitive strengths:
| • | Middle Market access. The sales contacts made through Efinancial’s call centers are focused on the Middle Market. This stands in contrast to the life insurance industry at large, which tends to market to a more affluent clientele. |
| • | Multi-channel distribution. The Company reaches Middle Market consumers through multiple distribution channels. Through its retail channel. it engages consumers through Efinancial’s call centers using sales leads that it acquires or generates itself, and leverages product and sales processes with affinity partners to extend its reach to Middle Market consumers seeking affordable, accessible life insurance. Through its wholesale channel, the Company offers other carriers products through unaffiliated distributors. In addition. Fidelity Life also offers its products through select unaffiliated distributors. |
| • | patented products and sales processes. The Company’s RAPIDecision Life product features a method patented process that affords higher and faster placement rates than traditional fully underwritten term life insurance, Through its process, policy placement usually occurs during the initial interaction, which leads to customer satisfaction and improved economics in its call centers. The Company’s efficient process contrasts with much of the industry, where the underwriting process extends well beyond the initial interaction. In addition, the Company’s flagship RAPIDecision Life product uses predictive analytics at certain ages and face amounts to place all cause coverage products during the initial interaction. The product is priced to be profitable even at lower policy amounts, which allows the Company to align its offerings with Middle Market consumers’ ability to afford life insurance. |
| • | End-to-end lead and policy data. As a life insurance company and a direct distributor, the Company is positioned to gather end-to-end lead and policy data to develop predictive analytical models that can be applied to identify the characteristics of prospects who are more likely to exhibit favorable placement, persistency and mortality experience. The Company plans to apply this insight to optimize its marketing, sales and underwriting processes and product development. |
The Company identified through discussions with management the following growth strategies where they plan to leverage the competitive strengths reviewed above:
| • | Capitalize on the unmet need for life insurance in the Company’s target market. The Company believes it is well positioned to meet demand where there is currently a substantial unmet need for life insurance in the Middle Market. Using its quick-issue products together with its distribution platform. it plans to increase sales to Middle Market consumers by providing a convenient experience to purchase life insurance at an affordable price. |
| 13 |
| |||
| • | Use predictive analytics to generate more productive sales leads. By converting data the Company generates through its distribution platform into actionable insight using statistical analysis, it will seek to be more efficient in its acquisition and use of leads, improving its call center placement ratios and overall profitability. |
| • | Enhance and extend affinity partnerships. The Company plans to continue and selectively deepen its existing affinity partnerships and develop new and complementary affinity relationships and partnerships. The Company expects this will expand and diversify its sources of quality leads. |
| • | Expand call center operations and improve efficiency. To drive sustainable premium and Efinancial commission growth, the Company plans to expand its Efinancial call center operations by hiring additional agents. In addition. the Company evaluates its product offerings and product providers in order to examine whether the Company is addressing the needs and preferences of the Middle Market. |
| • | Explore alternative means of distribution. The Company is currently exploring distribution alternatives beyond its call center and independent distributors, including on-line and mobile application sales. |
Management did identify key risks associated with managing the unique nature of its business, including the following:
| • | It has incurred net losses over the last eight years. A significant percentage of Fidelity Life’s in-force policies have been written since 2007, and as a result it does not have an established legacy book of business and associated revenue streams like many larger life insurance companies. The lack of cash flows typically associated with a legacy business puts Fidelity Life at a disadvantage in comparison with other life insurance carriers that have a more established book of business and associated revenue streams. In addition, it has incurred a net loss in each of the eight prior fiscal years, resulting in an aggregate of approximately $98 million in net losses over that period, including a loss of $8.2 million and $15.3 million for the years ended December 31, 2017 and December 31, 2016, respectively. Its losses are due principally to operating expenses and corporate overhead exceeding revenues of its agency and insurance segments, and its inability to defer a majority of commission expense on policies produced by its affiliated agency, Efinancial. |
| • | It expects to continue to incur net losses as it develops its distribution platform. The Company plans to continue to increase sales through its affiliated distributor, Efinancial, in order to increase scale to cover operating expenses and corporate overhead. However, generally accepted accounting principles in the United States (GAAP) require that Fidelity Life immediately expense a majority of its policy acquisition costs that are incurred on sales through Efinancial, which causes it to incur a net loss in the first year on each policy sold through Efinancial. If it is successful in increasing its premium writings through its distribution platform over each of the next several years, the company expects that the impact of the immediate expense recognition will continue to contribute to its incurring consolidated net losses and reduction of its consolidated equity in each such year. |
| • | Its call center-based distribution model may not be sustainable. The products and processes that the company uses to reach the Middle Market rely heavily on retail call center-based sales. There are relatively few such call centers being operated by independent distributors. The call centers that it is familiar with tend to have low placement ratios on medically underwritten products because of the time delay involved in issuing policies and the lack of face to face sales support typically provided by traditional agents. The company has developed innovative products and processes designed to streamline the sale of life insurance and improve call center placement ratios, and has made significant investments in cultivating leads and improving its sales process. If it is not successful in utilizing its products and processes to penetrate its target Middle Market, the company may not generate sufficient revenues to offset its expenses, which will result in a material and adverse effect on its business, financial condition and results of operations. |
| • | Its target market continues to face a difficult economic environment. Difficult economic conditions in the United States and abroad have adversely affected the life insurance industry generally as well as the company’s business by reducing its investment income and causing volatility in the fair value of its investments. while economic conditions have stabilized and improved in a number of areas, economic |
| 14 |
| |||
| challenges still remain. Many middle American families, including those that comprise the company’s target Middle Market, have experienced financial hardships and stagnating income levels. Domestic and economic challenges may continue to adversely affect the company’s business in the future. |
Generation of leads is a critical component to the long-term success of the Company. Management indicated that their lead generation is concentrated among a smaller number of suppliers and represents a risk to the Company’s business and growth strategy.
Management, Directors and Employees
As of March 31, 2018, the Company has approximately 384 employees with a breakdown as follows:
| Employee Count by Entity |
||||
| Entity |
Employees | |||
| Fidelity Life |
120 | |||
| Efinancial |
264 | |||
|
|
|
|||
| Total |
384 | |||
Source: Company Management
Efinancial comprised approximately 69% of the total Members Mutual employees when accounting for their retail call center employees. The largest departments of Fidelity Life based on employee size are IT (57), Finance (25) and Corporate (19). Since September of 2016, Members Mutual has grown the employee base by 26 employees or approximately 7%.
Members Mutual is managed by an experienced group of executives and Directors led by Mr. James Hohmann, the Company’s Chief Executive Officer. Senior executives and directors of Members Mutual include:
| 15 |
| |||
James Edward Hohmann, CEO
Age: 62
Mr. Hohmann is CEO and President of Members Mutual Holding Company, the parent of Fidelity Life Association. He is also a member of the Fidelity Life Board of Directors and is accountable for the overall performance of all affiliated companies.
He began his career as a life insurance actuary at a stock life insurance company. From there he went into consulting, first with Peat Marwick (now KPMG) and then Tillinghast, Towers Perrin (now Towers Watson), where he was Managing Principal of the Chicago life office.
After consulting, Mr. Hohmann returned to the company side of the life insurance industry and over the past 15 years has primarily served in the role of company president or CEO, including President of Conseco (now CNO Financial) and President and CEO of Allstate Financial.
Most recently, Mr. Hohmann was President and CEO of FBL Financial. In that role he delivered industry leading stock performance and the company was recognized by Fortune magazine in its list of the “100 Fastest Growing Companies” based on growth in revenue, earnings per share and total return to shareholders.
Mr. Hohmann is a graduate of Northwestern University and holds an MBA from the University of Chicago.
Jim Harkensee, President & COO, Fidelity Life
Age: 60
Mr. Harkensee has P&L responsibility and overall accountability for the performance and position of Fidelity Life. He oversees the company’s strategy and operations and engages with shared services areas to insure production efficiency, quality, service and cost-effective management of resources.
Mr. Harkensee has over 30 years of experience in the insurance industry in both actuarial science and direct marketing. He was formerly president of Zurich Direct. For nine years under his
| 16 |
| |||
leadership, Zurich Direct grew to become one of the leading direct marketers of term life insurance in the United States, increasing first-year premiums from $11 .3 million to over $36 million. Mr. Harkensee began his career at Bankers Life & Casualty, later joining Zurich Life, where he was promoted to chief actuary.
Mr. Harkensee is a graduate of the University of Illinois and a Fellow of the Society of Actuaries.
Chris Campbell, President & COO, Efinancial
Age: 48
Mr. Campbell has P&L responsibility and overall accountability for the performance and position of Efinancial. He oversees the company’s strategy and operations and engages with shared services areas to insure production efficiency, quality, service and cost-effective management of resources.
Mr. Campbell has over 25 years of experience in the insurance industry. Prior to joining Efinancial, he was SVP of marketing and communications at CNO Financial, where he led initiatives that improved productivity and increased ROI, including the company’s transformation from print to digital marketing. He also previously served as Director of Strategy and Business Development at Allstate Financial. He began his career in management consulting, where he developed competitive and growth strategies for Fortune 1000 firms.
Mr. Campbell is a graduate of Dartmouth College and holds his MBA from Northwestern University.
Chris Kim, Senior Vice President, CFO
Age: 47
Mr. Kim is responsible for Fidelity Life’s accounting and financial reporting activities directing the fiscal functions of the corporation in accordance with NAIC statutory accounting and U.S. generally accepted accounting principles.
He has over 20 years of experience in public accounting and controllership with a focus on life and property/casualty insurance companies. He has extensive experience in advising private and
| 17 |
| |||
public companies on accounting and financial reporting matters related to capital raising activities and advising clients on complex accounting matters.
Prior to joining Fidelity Life, Mr. Kim was employed by PricewaterhouseCoopers LLP within its audit and transaction services practice in Chicago and New York. He also held the position of assistant controller with GE Insurance Solutions (now Swiss Re) driving global finance transformation projects.
Mr. Kim is a graduate of the University of Missouri and is a Certified Public Accountant (inactive).
John Buchanan, Executive Vice President, General Counsel & Corporate Secretary
Age: 47
Mr. Buchanan is responsible for legal matters at Fidelity Life.
He has served 20 years at Allstate in various legal roles, including leading their marketing legal team. Mr. Buchanan has also served as secretary on NJ Life and Health Guaranty Fund boards and has been involved with the ACLI, LICONY, MCCA and ACC.
Mr. Buchanan is a graduate from Northern Illinois University and holds a J.D. from John Marshall Law School.
Laura Zimmerman, Executive Vice President, Chief Marketing Officer
Age: 60
Ms. Zimmerman oversees Fidelity Life’s strategy and marketing activities with accountability for branding, communications, lead acquisition, marketing alliances, data management and predictive analytics.
Ms. Zimmerman has over 25 years of experience in executive roles at Allstate Insurance, Legg Mason Global Asset Management and The Guardian Life Insurance Co.
| 18 |
| |||
Ms. Zimmerman is a graduate of Dartmouth College and holds an MBA from Northwestern University.
Richard Hemmings, Chairman-Director
Age: 72
Richard Hemmings holds the position of Executive Chairman of Fidelity Life Association. Prior to his appointment to that office in 2014, he was Chairman and CEO of the company from 2005 to 2014.
Prior to joining Fidelity Life, he was a partner in the Chicago law firm of Lord, Bissell and Brook for 25 years. He also served as counsel to the NAIC and was the Michigan Insurance Commissioner before entering private law practice in 1980. In addition to his duties as Executive Chairman of the Board of Fidelity Life Association, Mr. Hemmings is a member of the Board of Directors for First MetLife Investors Insurance Co., a New York affiliate of MetLife that does not compete with Fidelity Life Association.
Mr. Hemmings is a graduate of the University of Wisconsin – Madison and holds a J.D. from the University of Pittsburgh.
Linda Walker Binue, Director
Age: 66
Linda Walker Bynoe is President and CEO of Telemat Ltd., Chicago, Illinois, a project management and consulting firm, since 1995, and previously as Chief Operating Officer since 1989.
Ms. Bynoe began her career in public accounting, obtaining her Certified Public Accountant (CPA) designation. After obtaining her Masters in Business Administration (MBA), she joined the investment banking firm Morgan Stanley, serving in various executive capacities within the Capital Markets Division and as a Vice President from 1985 until 1989.
| 19 |
| |||
She is also a Director of Anixter (NYSE:AXE), Equity Residential (NYSE:EQR), Northern Trust Corporation (NASDAQ:NTRS) and Prudential Retail Mutual Funds. Ms. Bynoe has served on the Fidelity Life Association Board of Directors since 2002.
Ms. Bynoe is a graduate of Northeastern University and holds an MBA from Harvard University.
John Fibiger, Director
Age: 87
Mr. Fibiger was elected to the Fidelity Life Board in 2004. He previously was an executive of Transamerica Life Companies servicing as Executive Vice President and Chief Financial Officer from 1991-1993, President from 1994-1995 and Board Chairman from 1995-1997. From 1981 to 1989, Mr. Fibiger was President of the New England Mutual Life Insurance Company. Previously he also held various offices with New England Life and Bankers Life Insurance Company of Nebraska. Mr. Fibiger is a Fellow of the Society of Actuaries and member of the American Academy of Actuaries for which he was President from 1987 to 1988.
He served as a trustee of the Menninger Foundation, Houston, TX (formerly located in Topeka, KS) and was Chairman of the Menninger Fund. He is currently a trustee of the Austin Symphony Orchestra and a life trustee of the Museum of Science in Boston.
Steven Groot, Director
Age: 69
Mr. Groot was first elected to the Board of Fidelity Life Association in 2006. He is an actuary and attorney who served in various actuarial and management capacities with Allstate Insurance Company from 1970 through 2002.
During his career, he led activities in nonstandard auto insurance, Internet and call center distribution and servicing, and international operations. He served on Allstate Insurance Company’s Board of Directors from 1994 through 2002, where he was a member of the executive committee and investment committee.
| 20 |
| |||
Mr. Groot is a Fellow of the Casualty Actuarial Society, a Member of the American Academy of Actuaries, and a member of the state bar of California. He currently serves as a member of the Board of Directors of CEM Insurance Company, a privately held property and casualty insurer, and is a life trustee of Lawrence Hall Youth Services in Chicago, Illinois.
James Schacht, Director
Age: 77
As President of the Schacht Group, Mr. Schacht advises national and international clients on regulation, restructuring and insolvency, litigation and public policy issues. Prior to forming his own firm, he led Navigant Consulting’s Restructuring, Run-off and Insolvency Practice. He also led the insurance regulatory practices at both Coopers and Lybrand and PricewaterhouseCoopers and was Director of the Illinois Department of Insurance on three occasions at the request of two governors.
For more than 25 years, Mr. Schacht has been an active leader within the National Association of Insurance Commissioners serving on numerous task forces and committees. Several of his reform initiatives garnered national attention, particularly the development of the NAIC’s Insurance Regulatory Information System, the development of the first NAIC Handbooks on Statutory Accounting Practices and Procedures, Risk Based Capital, the Financial Regulation Standards and Accreditation Program and numerous model laws and regulations. He organized and conducted the first meetings of international insurance regulators that led to the formation of the IAIS.
Mr. Schacht frequently writes on emerging issues and is an oft-requested speaker. He and his colleagues have prepared numerous groundbreaking public policy studies on insurance regulation for the National Conference of Insurance Legislators and other industry trade associations.
Insurance Operation Product Offerings
Fidelity Life’s individual life product portfolio was initially designed to capture sales through direct distributors operating large call centers, independent marketing organizations, brokers and worksite distribution. However, increasingly, Fidelity Life’s focus has evolved to
| 21 |
| |||
reaching Middle American households with quick issue products distributed through Efinancial and select independent (unaffiliated) distributors. Fidelity Life’s business lines consist of its Core Life, Non-Core Life, Closed Block and Annuities and Assumed Life lines. The Company’s breakdown of net premiums written is as follows:
The Company’s individual life product portfolio includes a wide range of products that meet the demand of Middle American market consumers by shortening the sales process by leveraging innovation in product design and new ways of non-medical underwriting. The Company has built electronic application systems, known as the Rapid Application system, and its successor system, FLASH, that permit it to issue policies during the course of a single sales call or shortly thereafter without the need to contact the customer after the initial call. This streamlined process allows the Company to mitigate the loss of business as a result of a customer not following through on the underwriting process. For the year ended December 31, 2017, nearly all of the company’s new insurance policies were processed through its Rapid Application or FLASH systems.
| 22 |
| |||
Individual Life Products
| • | Rapid Decision. The principal life insurance products offered by Fidelity Life fall within the “Rapid Decision” product line. The Rapid Decision product line includes primarily term and final expense insurance products. |
| • | Rapid Decision Life. Rapid Decision Life is a product introduced in 2008 and is primarily marketed by Efinancial and select unaffiliated distributors. The Rapid Decision Life product was specifically designed to address the problem of low product placement in direct distribution for medically underwritten business, stemming in part from the typical length of the life insurance underwriting process. The Rapid Decision Life product incorporates the following features: |
| • | A patented Rapid Decision underwriting process, which allows for quick issue of a policy providing a blend of “all cause” term life insurance coverage and accidental death benefit coverage. |
| • | An option permitting policyholders to begin a traditional medical underwriting process within the first six months after policy issuance. |
| • | Depending on the underwriting results, policyholders completing medical underwriting may have the option to reduce or eliminate the accidental death coverage and increase the proportion of the “all cause” term life insurance coverage under the policy with no increase in premium. |
| • | Policyholders not completing medical underwriting (or failing to meet medical underwriting standards) may retain the original coverage blend of term life and accidental death benefit coverage at the existing premium rates. |
| • | In 2015, the Company introduced predictive analytics as part of its underwriting process, which allows qualified customers to receive 100% “all cause” coverage without a medical exam. |
| • | Rapid Decision Express. Rapid Decision Express is a quick issue, non-medically underwritten level term insurance product. It includes typical term lengths of 10, 15 and 20 years, and a maximum face amount of $250,000 that varies by age and is lower at older ages. Rapid Decision Express includes one risk class each for males, females, |
| 23 |
| |||
smokers and non-smokers, and underwriting approvals are made based upon a simplified application process where the consumer’s answers are verified by database information that is gathered for the approval process.
| • | Rapid Decision Senior Life. Life Term and Whole Life. Fidelity Life’s Senior Life Term and Whole life products are designed for impaired risk individuals in particular age range (50 to 70 for term and 50 to 85 for whole life). Senior Life Term and Whole Life products are underwritten utilizing the Rapid Decision underwriting process and offer graded death benefits over an initial three-year period (coverage increases in years two and three, with full coverage starting in year four). |
| • | Rapid Decision Final Expense. Rapid Decision Final Expense provides protection for individuals between the ages of 50 and 85 that can help lessen the burden of covering one’s final expenses such as medical costs, funeral costs and credit card debt. This permanent whole life coverage is available for amounts from $5,000 to $35.000. |
| • | Rapid Decision Guaranteed Issue. Rapid Decision Guaranteed Issue is permanent whole life coverage available up to $20,000 for individuals age 50 to 85. Policy issuance does not require a medical examination nor answers to any health questions. As a result, the policy requires no underwriting and all applicants within the age requirement can be approved. |
| • | Accidental Death Benefit. Fidelity Life offers accidental death benefit insurance as both a policy rider and as stand-alone policy coverage. The accidental death benefit product covers death due to accidental causes as defined in the policy. Accidental death benefit is a quick issue product with limited underwriting. |
| • | Lifetime Benefit Term. LifeTime Benefit Term is a patented worksite product offering. Worksite policies like LifeTime Benefit Term are provided to employer and other groups for sales to their employees, participants and members. LifeTime Benefit Term insurance offers higher face amounts per premium dollar than universal life and |
| 24 |
| |||
is sold on a group policy basis by offering future paid up coverage additions after the policy has been in force for five years. LifeTime Benefit Term policies can be kept by the individual after they leave employment with the group. The Company has been issued a patent for one variation of the LifeTime Benefit Term product. Fidelity Life largely ceased writing this business directly in 2014 and entered into a licensing agreement and reinsurance agreement under which the product is licensed to Combined Insurance Company of America and 50% of the business written is reinsured by Fidelity Life. The licensing agreement provides Combined with an exclusive, non-transferable license to market the LifeTime Benefit Term product. In the event Combined fails to meet certain sales volumes for the product, the license becomes non-exclusive or, in certain circumstances, terminable at the option of Fidelity Life. The license agreement would terminate if Combined were to stop selling the product, exit the worksite market, or if Fidelity Life ceased assuming reinsurance on the product from Combined. Additionally, Combined may terminate the license with 60 days’ notice. Fidelity Life continues to manage the in-force block of LifeTime Benefit Term policies, which is in run-off.
The annualized placed premium by product totals are as follows:
| 25 |
| |||
The Company breaks its products into core and non-core products. The core products constitute RAPIDecision ®Life, LifeTime Benefit Term, and final Expense. RAPIDecision Life mortality experience has been consistent with pricing assumptions, and the Company is continuing to expand this product. LifeTime Benefit Term is a Fidelity Life patented worksite product and is licensed to and written by Combined Insurance. Combined Insurance is growing this product offering.
The Non-core products are Other Life Term, Accidental Death Benefit and Closed Block / Reinsurance Assumed. Other term Life products are offered to help maintain select distribution relationships. The Accidental Death Benefit product was deemphasized based on a strategic decision in 2015. However, it remains profitable, and lapse rates have declined. The Closed Block/Reinsurance Assumed products consist of all business prior to September 30, 2006 and is performing in line with expectations.
Agency Segment
This segment primarily consists of the operations of Efinancial. Efinancial is a call center-based insurance agency that markets life insurance for Fidelity Life and unaffiliated insurance companies, Efinancial’s primary operations are conducted through employee agents from two call center locations (eSales channel). In addition to the eSales channel, Efinancial operates an eIndependent channel, assisting independent agents that desire to offer products manufactured by the carriers that Efinancial represents, and sells insurance sales leads to independent agents and other marketing organizations. For the twelve months ended December 31, 2017, Efinancial’s agency segment revenue earned 76% through the retail channel, 10% through the eIndependent channel, and 14% through the sale of insurance leads.
The agency segment’s main source of revenue is commissions earned on the sale of insurance policies sold through the retail channel. Efinancial’s employee agents utilize insurance sales leads to contact or be contacted by potential customers to assess potential customers’ insurance needs, level of interest in buying insurance and preliminary health information. When the customer is interested in acquiring insurance, the Efinancial employee agent works with the customer to select a carrier and compile the necessary underwriting information. After the
| 26 |
| |||
underwriting information is submitted to the carrier, Efinancial operating personnel work with the customer and the insurance carrier to complete the underwriting process, which can occur during the initial contact or within 24-48 hours for non-medically underwritten policies and 20-90 days or longer for medically underwritten policies.
Agency segment expenses consist of marketing costs to acquire potential customers, salary and bonuses paid to employee agents, salary and other costs of employees involved in managing the underwriting process for Efinancial’s insurance applications, sales management, agent licensing, training and compliance costs. Other agency segment expenses include costs associated with financial and administrative employees, facilities rent, and information technology. After payroll, the most significant agency segment expense is the cost of acquiring leads. Efinancial partially offsets its sales leads expense through revenues derived from the resale of leads that are not well suited for its call centers, and from advertising revenues from individuals who click on specific advertisements while viewing one of Efinancial’s web pages.
In the Company’s eIndependent channel, it subcontracts with its independent agents who sell through Efinancial’s contracts with its unaffiliated insurance carriers. In consideration for using its carrier contracts and services, the Company receive a portion of the commission earned by the independent agent from the carrier. The Company also recognizes revenue from the sale of insurance sales leads. Lead revenue totaled approximately 14% of segment revenues in 2017. Its agency operations segment recognizes income (loss) to the extent that commissions and other revenue exceed (are less than) its marketing, agency and overhead costs for the period.
Importantly, Efinancial provides the Company with insight into and data on consumer behavior when investigating and buying life insurance that other, traditional sale channel focused companies might not be able to obtain from their outside independent agent partners. For the year ended December 31, 2017, approximately 80% of Efinancial’s retail commission revenue is Fidelity Life product. Efinancial’s market insight and significant placement of Fidelity Life policies helps create an important feedback loop to continually improve their products. The Company is trying to transform the traditional method of purchasing life insurance by understanding the consumer’s needs better and designing products, delivery channels and purchasing processes to better fit its target policyholder goals.
| 27 |
| |||
Marketing and Distribution
Efinancial’s business relies heavily on the use of insurance sales leads. Sales leads are records of personal and contact information of potential purchasers of life insurance. The Company analyzes these sales leads to enable its agents to make contact with consumers that are believed to be more likely than the general population to purchase life insurance products. Efinancial uses a combination of marketing methods to obtain insurance sales leads to support its operations. Efinancial acquires a significant portion of its sales leads from third party vendors specializing in insurance sales leads. Additionally, Efinancial develops leads through its proprietary websites (including efinancial.com, termfinder.com, and ecoverage.com) and through the websites provided to affinity partners for their customers to learn about life insurance.
The Company evaluates the profitability of sales leads by analyzing their cost and productivity based on the sales resulting from these sales leads. This information is tracked using ALISS. Using this information, the sales lead acquisition process is managed through negotiation of costs based on lead quality, and productivity is optimized by routing sales leads to call center agents that data indicates will have the best chance of obtaining a sale. As a result of this business model, Efinancial’s marketing expenses are a significant part of the total cost of doing business. Management stated that historically, this business model had been impacted due to the overall quality of leads that were not meeting objectives. To help counter this and in an effort to reduce its overall expense related to the production of leads, the Company resells leads which are not optimal candidates for use in its call centers. If leads are unable to be resold, then the overall marketing expense would be higher, due to the lack of offset in the marketing expenses with revenue from the sale of leads.
The Company focuses on supporting a limited number of independent distributors that strive to maintain consistency with their overall strategy. During 2017, the Efinancial’s eSales division processed 98,249 applications for insurance and issued 56,526 policies for an application to issue ratio of 58%. Efinancial accounts for a significant majority of the total premiums placed by Fidelity Life. For distribution other than by Efinancial, the Company’s strategy is to establish
| 28 |
| |||
long term relationships with a limited number of independent distribution organizations that extend its reach into its target market and are complementary to Efinancial.
Administrative, Claims and Underwriting
Fidelity Life contracts with third party service providers to provide a number of key functions that are traditionally performed in-house in the life insurance industry. These functions include claims management, records management, transition services from previous TPA, Payment Processing / collections, policyholder contact, underwriting, investment portfolio management, internal audit, filing of insurance policy forms with state regulatory agencies and income tax return preparation. In addition, Fidelity Life uses outside third parties to provide in-force policy administration, reinsurance and contract administration.
Administrative, Claims & Underwriting
| Function |
Performed By |
Comments | ||
| New Business Application Entry | Xchanging Technology | Low cost, accurate, round-the-clock data entry staff | ||
| Policy Issue | FLA Staff Xchanging Technology | Combination of in-house staff for more difficult cases and external resources for standard processing | ||
| Worksite | Vision Financial | Full service voluntary worksite administrator | ||
| Data Center | SunGard | SunGard provides a hardened data center for all FLA production applications | ||
Source: Company Management
The Company utilizes Concentrix Insurance Solutions as its primary third-party administrator. Through the use of the various outside vendors, Fidelity Life is able to outsource some business functions in an effort to obtain turnkey, high quality, yet affordable, solutions. This model was adopted to reduce the fixed cost investment in the Company’s insurance operations, provide operating flexibility and allow access to specialized skills as needed. In doing so, Fidelity
| 29 |
| |||
Life believes it can contract with partners that possess a wide range of experience and with established capabilities that would be costly and time consuming to develop internally. The challenges posed by outsourcing include dependence on third party providers and skills required to manage TPA’s to, among other things, assure stability and reduce risks in key operations.
To support the nine internal underwriters of Fidelity Life, the Company utilizes the underwriting services of IBU, Inc. and CRL Plus. Fidelity Life applications are assigned via the Rapid App system to either a Fidelity Life underwriter or one of its outside underwriters noted above. Given the quick issue nature of many of its products, it is important to be able to access underwriting services on an as-needed basis. Using outsourced contract underwriters provides the needed flexibility.
In their typical underwriting process, Fidelity Life’s contract underwriters access the information on a potential customer through a web-based interface and approve or decline the individual case based on Fidelity Life’s underwriting rules. If necessary, a member of the contract underwriting team can be joined to an initial phone call with a potential customer. While Fidelity Life’s in-house underwriting team does engage in certain case underwriting activities, the team’s primary function is to manage and supervise the contract underwriters. The in-house underwriting team oversees the contract underwriters to review their compliance with the Company’s underwriting standards.
Reserving Methodology
Policy Reserves:
Individual Life, Accidental Death, and Supplementary Riders: Establishing an adequate liability for future obligations to policyholders requires the use of assumptions. Estimating liabilities for future policy benefits on life and health insurance products requires the use of assumptions relative to future investment yields, mortality, morbidity, persistency, and other assumptions based on historical experience, modified as necessary to reflect anticipated trends and to include provisions for possible adverse deviation. The vast majority of the Company’s life insurance reserves are
| 30 |
| |||
established in accordance with FAS 60 and the assumptions are “locked in”. The Company does continually reassess the assumptions as applied to future policies.
Contract Holder Deposits: The cash value annuities assumed block business, known as the KILICO block, has its policy reserves equal to the account value of the annuities at the valuation date.
Deposit Funds: The dividends and other funds left on deposit has its policy reserves set equal to the account value of the funds at the valuation date.
Payout Annuities: The payout annuities block of business, known as the Direct Annuities, has its policy reserves equal to the discounted present value of the expected payments, taking expected mortality into account.
Claim Reserves:
As is the case with most life insurers, claim reserves are a relatively small part of the Company’s reserves; these reserves are established for claims where the Company has already been notified of a potential claim (pending claims) and for unknown claims (Incurred but Not Reported (“IBNR”)). Pending claims are reserved for using the face amount of the underlying claim. IBNR is set up using factors that are based on prior experience. The adequacy of the claim reserves is reviewed regularly and factors are updated as necessary.
Loss Recognition Testing (LRT):
To determine the adequacy of net liabilities, the Company performs Loss Recognition Testing (“LRT”). Under LRT, future cash flows are projected using best estimate assumptions at the valuation date. For each block of business, the discounted value of these cash flows is compared to the net liability balance (benefit reserves minus DAC). If the discounted value of the cash flows exceeds the net liability balance, the reported net liability would be increased—first by reducing DAC and, if required, increasing the recorded liability.
| 31 |
| |||
Reinsurance
Fidelity Life uses reinsurance arrangements with multiple reinsurance carriers to limit their claims risk under insurance contracts and to mitigate the impact of the insurance policies issued on statutory policyholder surplus. Additionally, the reinsurance arrangements provide Fidelity Life with access to underwriting technology and risk management expertise from its reinsurance partners. In accordance with insurance industry practice, Fidelity Life reinsures a portion of its loss exposure and pays reinsurers a portion of the gross premiums received on all policies reinsured. The Company evaluates their reinsurance needs, including the appropriate amount and structure of particular reinsurance arrangements, based on a number of factors, including the expertise of particular reinsurance carriers (and their technology platforms) required to support various life insurance products, the estimated variability of claims experience, the estimated future impact of new business written on statutory reserves and the costs of reinsurance, Fidelity Life is party to many reinsurance contracts on a coinsurance basis for a pro rata share of their retained risk. Fidelity Life reinsures 100% of any risk on a policy in excess of $300,000 (maximum retention of $300,000).
Fidelity Life had reinsurance recoverables of $143.9 million as of December 31, 2017. The five largest reinsurers accounted for 68% of Fidelity Life’s reinsurance recoverables with the single largest accounting for 28%.
Current reinsurance arrangements open for new business are with Hannover Life Reassurance Company and Swiss Re Life & Health America, Inc. The following is a brief summary of the reinsurance agreements relating to these arrangements:
| • | Hannover Life Reassurance Company. Under the Company’s agreements with Hannover Life, the Company cedes claims liability under certain term life policies in the Open Block – Active business to Hannover Life on a coinsurance basis. Depending upon the face amount of the product reinsured and subject to a company retention limit of $300,000, the Company cedes 50% or more of the claims liability to Hannover Life. |
| 32 |
| |||
| Reinsurance premiums are determined according to the amount reinsured with Hannover Life per policy. These agreements do not have a fixed term. |
| • | Swiss Re. Swiss Re Life & Health America, Inc. Under the Company’s agreement with Swiss Re, the Company cede to Swiss Re 50% of claims liability, subject to certain per life limits, under the accidental death benefit policies and its associated riders, on a coinsurance basis. Either party may terminate the agreements with respect to future business with 90 days written notice to the other party. |
| • | The Company reinsures 90% of any accidental death benefit riders on life insurance policies with Swiss Re on a yearly renewable term basis. Reinsurance premiums are determined according to the amount reinsured with Swiss Re per rider. Swiss Re has the right to modify the reinsurance premium rates upon 90 days written notice. If the Company does not accept such modified reinsurance premium rates and is unable to agree upon a revised rate structure within 60 days of Swiss Re’s original notice, then the reinsurance premium rates then in effect continue unchanged. However, Swiss Re may, upon 30 days written notice, terminate the reinsurance on any policy or rider for which the Company have not accepted Swiss Re’s modified reinsurance premium rate. This agreement does not have a fixed term. Either party may terminate the agreement with respect to future business with 90 days written notice to the other party. |
The Company reinsures its Rapid Decision Final Expense and Rapid Decision Guaranteed Issue products with Swiss Re, on an 80% coinsurance basis. Either party may terminate the agreements with respect to future business with 90 days written notice to the other party.
Ceding contracts on the historical in force life insurance block is provided by a diverse group comprised of seventeen reinsurers. Included in this group is Scottish Re U.S., Inc. (“Scottish Re”). Scottish Re’s ratings were withdrawn in 2009 as a result of a deteriorating financial position and Scottish Re’s entering into a voluntary supervision agreement with the Delaware Department of Insurance. On May 1, 2013, substantially all of the reinsurance agreements with Scottish Re US, Inc. were novated, whereby Hannover Life Reassurance
| 33 |
| |||
Company was substituted for Scottish Re under such agreements. The novation resulted in no gain or loss and had no impact on financial statements.
Through Hannover since 2013, Fidelity Life also maintains a reserve financing agreement designed to enhance its ability to continue to grow its core life insurance business. In 2016, Fidelity Life added another tranche to the reserve financing agreement with Hannover to include business similar to business reinsured in the 2013 tranche, but issued between October 1, 2012 and June 30, 2016. The second tranche was included in a restated treaty with identical terms with the only change being to extend the recapture date to December 31, 2027.
Investment Overview
The Company’s investment strategy is to maintain a high quality, balanced, well-diversified investment portfolio supporting the insurance contracts written and capital requirements. The Company’s investments are managed according to written guidelines approved by the board of directors. Portfolio performance is measured against established benchmarks while incorporating a risk adjusted yield focus for (“Liability Portfolios”) and a total return basis (“Capital & Surplus Portfolio”). The investment strategy is regularly reviewed in light of market trends, developments and changes in the business. At December 31, 2017, Fidelity Life’s distribution of total invested assets was as follows:
Source: SNL Financial.
| 34 |
| |||
The Company utilizes independent outside investment managers for all of its portfolios. Wellspring Capital Advisors is the primary manager and provides overall investment and surplus portfolio management and consulting services. General Re- New England Asset Management, Inc., Advantus Capital Management, Inc., Tortoise Capital Advisors, Guggenheim Partners Investment Management, LLC, and Innovative Capital Advisors, LLC, all provide specialized investment services to the Company.
Fidelity Life has a diversified bond portfolio with a blend of maturities skewed to the medium-term as mentioned above. The weighted average credit quality of the portfolio is A. The S&P ratings for the bonds held by Fidelity Life range from AAA to CCC, which shows the Company’s willingness to buy less than investment grade bonds in order to drive yield on the portfolio higher. Moreover, the Company holds a large percentage of corporate bonds which traditionally carry more risk than government securities.
The bond maturities range from less than 1 year to greater than 10 years with the majority being less than 10 years. Long-term bonds with a maturity greater than 10 years made up 13.7% of the bond portfolio. The duration of the bond portfolio is 6.1 years as of December 31, 2017. The balance of the investment portfolio consists of common stock, mortgage loans and other invested assets.
| 35 |
| |||
Note: Represents breakdown of investments with known maturity.
Source: SNL Financial.
Management believes that it maintains a very conservative investment portfolio allocation together with higher yielding bonds (high yield and private placements) that are limited to specific total dollar allocations and done through managers that specialize in the asset class. Fidelity Life’s guidelines include asset concentration guidelines that limit the amount that it can hold in any one issuer of securities, asset quality guidelines applied on a portfolio basis and for individual issues that establish a minimum asset quality standard for portfolios and establish minimum asset quality standards for investment purchases and investment holding, liquidity guidelines that limit the amount of illiquid assets that can be held at any time, and diversification guidelines that limit the exposure at any time to the total portfolio by investment sectors.
Fidelity Life has incurred a reduction in investment yield for each year from 2013 through 2017, which is consistent with the overall life industry. The life industry saw a decrease in yield from 2013 to 2017. From 2013 to 2017 the gross yield on bonds in Fidelity Life’s portfolio has trailed the life industry average by a margin ranging from 2 to 65 basis points. For 2017, Fidelity Life yielded 4.48% on its bond portfolio, while the life industry average was 4.50%. For 2017, Fidelity Life yielded 3.99% on its entire investment portfolio while the life industry yielded 4.58% over the same period. Fidelity Life does not invest significantly in equities or utilize any “exotic” investment products to enhance yields.
| 36 |
| |||
Competitors
The life insurance industry is a mature industry that has been in a consolidation and transition phase. As a product manufacturer with controlled distribution, the Company’s competitors include both other life insurance carriers, as well as distribution organizations that market life insurance direct to consumer. The relative similarity of available insurance products and marketing methods means that most firms compete on premium pricing, underwriting, and purchase experience.
In general, many of the Company’s principal competitors are larger and more established, with higher capital and surplus and higher financial strength ratings than Fidelity Life. The company views the following firms as its principal competitors; AccuQuote, American General Life and Accident Insurance Company, Massachusetts Mutual Life Insurance Company, Protective Life Insurance Company, and SelectQuote Insurance Services, Inc. Brief descriptions of these companies are included below.
| • | AccuQuote – Byron Udell & Associates, operating as AccuQuote provides term life quotes to people in the United States. It sells life insurance and selected annuities, as well as offers child life, long term care, health, and auto insurance. The company also offers life insurance needs calculator service. Byron Udell & Associates, Inc. was founded in 1986 and is based in Wheeling, Illinois with a satellite branch office in Golden, Colorado. |
| • | American International Group – provides insurance products and services for commercial, institutional, and individual customers in the United States and internationally. The company operates in two segments: AIG Property Casualty, and AIG Life and Retirement. The AIG Life and Retirement segment offers a suite of products and services to individuals and groups, including term life insurance, universal life insurance, accident and health insurance, fixed and variable deferred annuities, fixed payout annuities, mutual funds, and financial planning. This segment distributes its products through banks, broker-dealers, financial advisors, independent marketing organizations, insurance agents, |
| 37 |
| |||
| structured settlement brokers, benefit consultants, and direct-to-consumer platforms. The company also provides private residential mortgage guaranty insurance, and direct investment book services, as well as engages in derivatives intermediary activities. American International Group, Inc. was founded in 1919 and is based in New York, New York. In addition, AIG Direct Insurance Services, Inc. – a subsidiary of AIG American General – operates as a life insurance agency primarily via internet and telephone channels, representing American General, Gerber Life, Fidelity Life, Globe Life, and ING. It offers term life insurance products, estate planning, return of premium term life, smokers’ term life, universal life, and whole life insurance products, accidental death, disability, key person, auto, pet, health, and travel insurance products. |
| • | Health I.Q. – a direct-to-consumer insurance agency focused on sales through its call-center business model, Health I.Q. offers term life insurance from a variety of carriers, including Ameritas, SBLI, and Assurity. The company offers lower-cost, “special rate” life insurance for health-conscious individuals. Founded in 2013, Health I.Q. launched in 2016, and is headquartered in Mountain View, California. |
| • | Massachusetts Mutual Life Insurance Company – a leading mutual life insurance company, MassMutual offers a wide range of financial products and services, including life insurance, disability income insurance, long-term care insurance, annuities, retirement plans, and other employee benefits. In addition, MassMutual is the parent company of Haven Life, a direct-to-consumer agency that offers term life insurance online. |
| • | Protective Life Insurance Company – a wholly owned subsidiary of Dai-ichi Life, Protective is a multi-line manufacturer that serves the U.S. middle market and mass affluent consumer. Through its multi-channel distribution strategy, the company offers life insurance through agents, financial institutions, affinity partners, and direct to consumer digital distribution. It has launched several strategic partnerships, including those with Costco, GEICO, Social Finance (SoFi), and BB&T Crump. Through its Life product line, the company offers term, whole life, and universal life products. |
| 38 |
| |||
| • | SelectQuote Insurance Services, Inc. – term life insurance sales agency in the United States. It offers auto and home insurance, and Medicare supplement insurance solutions. The company was founded in 1984 to be a direct marketer of term life insurance and is based in San Francisco, California. |
A.M. Best Rating
A.M. Best is a widely recognized rating agency dedicated to the insurance industry. A.M. Best provides ratings known as the Financial Strength Rating (“FSR”) and Issuer Credit Rating (“ICR”) which rate the financial health of insurance companies. The FSR is defined as an independent opinion of an issuer’s financial strength and ability to meet its ongoing insurance policy and contract obligations. This rating is assigned to insurance companies. The ICR is defined as an independent opinion of an issuer/entity’s ability to meet its ongoing senior financial obligations. This rating is assigned to insurance companies and related holding companies and other legal entities authorized to issue financial obligations. The objective of A.M. Best’s rating system is to provide an independent opinion of an insurer’s financial strength and its ability to meet ongoing obligations to policyholders. The assigned rating is derived from an in-depth evaluation and analysis of a company’s balance sheet strength, operating performance, and business profile. The FSR scale is comprised of 13 individual ratings grouped into seven categories (excluding rating which are under regulatory supervision, in liquidation, or suspended). The ICR scale for an insurance company is broken into two groups which arc Investment Grade and Non-Investment Grade. Each of these groups consists of four category rankings of credit quality (excluding the category for insurance companies under regulatory supervision/liquidation).
A.M. Best currently assigns a Best’s Rating of an “A-” (Excellent) to Fidelity Life, effective July 13, 2017, which is the fourth highest of 16 ratings and the category “Excellent” represents the second of ten categories. Insurance companies rated “A-” are considered by A.M. Best to have “an excellent ability to meet their ongoing obligations” to policyholders. In addition, A.M. Best has rated the Company’s outlook, generally defined as 12 to 36 months, as “Stable” which indicates a low likelihood of a rating change due to stable financial/market trends. Best’s Rating
| 39 |
| |||
for Fidelity Life is based on strong risk-adjusted capitalization, its well-performing fixed income investment portfolio, ongoing expansion and distribution initiatives and the continued benefits derived from its acquisition of Efinancial.
Partially offsetting these strengths are the challenges to improve consistency of net operating performance, grow total adjusted capital while it continues its rapid top-line growth strategies and to effectively administer its closed block of fixed-annuity business.
Despite the challenges and risks, A.M. Best comments on the enhancement to the Company’s risk-adjusted capitalization through various de-risking strategies stemming from its investment portfolio. A.M. Best believes that the Company’s current capital is sufficient to absorb its near-term new business growth expectations despite declines in total adjusted capital over the past years until an uptick in 2014.
A.M. Best Rating History
| Date |
FSR | ICR | ||||||
| 6/24/2017 |
A- | a- | ||||||
| 6/24/2016 |
A- | a- | ||||||
| 6/11/2015 |
A- | a- | ||||||
| 6/19/2014 |
A- | a- | ||||||
| 6/25/2013 |
A- | a- | ||||||
Source: A.M. Best
Note: FSR—Financial Strength Rating; ICR—Issuer Credit Rating
In discussing the A.M. Best rating with management, management expressed a strong desire to maintain its current rating or improve it. Management also indicated that they were uncertain if a reduction in their A.M. Best rating would meaningfully affect their product’s attractiveness and ability of the Company to execute on their growth plans.
Reasons for Offering
According to the Plan and discussions with management, after careful study and consideration, Members Mutual concluded that a mutual-to-stock form conversion best suits
| 40 |
| |||
Members Mutual’s strategic goals. To best meet the growth opportunities identified earlier, Members Mutual examined ways to increase its access to capital in order to pursue increased marketing, customer acquisitions through increased marketing spend and organic growth of distribution and sales of life insurance. Members Mutual examined various alternatives ranging from maintenance of the status quo, mergers with other mutuals, expansion or acquisition of other lines of businesses or companies and various forms of demutualization of Members Mutual permitted by Illinois law. After careful study and consideration, Members Mutual concluded at a February 26, 2018 board meeting that the subscription rights method of demutualization, backstopped by a Standby Purchaser that will commit to purchase at least enough unsubscribed shares in the subscription rights conversion to ensure the successful completion of the offering, best suits Members Mutual’s circumstances.
Members Mutual considered, among other things, that a subscription rights demutualization would:
| • | permit Members Mutual to achieve needed scale through access to capital; |
| • | provide for a more traditional corporate governance structure; |
| • | enhance corporate financial flexibility for future strategic options; |
| • | permit Members Mutual to adopt stock incentive plans to enhance its ability to attract and retain highly qualified employees, executives and directors; |
| • | improve the visibility of the Fidelity Life and Efinancial brands; and |
| • | enable Members Mutual to have public stock for use as acquisition currency. |
Further, based on discussion with management, the Company is keenly aware that even with significant capital access from the Offering, the path ahead to long-term sustainable profitability will be a long one. In the short and near term, management is aware that any actions taken in terms of the deployment of capital will not create an attractive ROAE opportunity.
Management cites following possible uses of proceeds:
| • | achieving scale and capital to support future growth; |
| • | providing additional standby capital for Fidelity Life and Efinancial to support the growth of their operations; |
| 41 |
| |||
| • | development or acquisition of new lead generation capabilities; |
| • | growing the direct call center operations of Efinancial; |
| • | enabling opportunities with additional distribution organizations; and |
| • | marketing and advertising campaigns. |
Importantly, even after consideration of the uses of capital above, they will not be sufficient to utilize all capital raised in the Offering. This may lead to potential investors’ perception of “excess” or unproductive capital and cause investors to be somewhat more negative as it relates to the Offering opportunity.
| 42 |
| |||
Consolidated Financial Condition
Table 1 presents selected data concerning Members Mutual’s financial position and Exhibit IV presents the Company’s balance sheet as of December 31, 2015 through December 31, 2017.
Table 1
MMHC Consolidated
Selected Financial Condition Data
($000)
| Balance Sheet Data as of: |
12/31/2015 | 12/31/2016 | 12/31/2017 | |||||||||
| Total assets |
666,887 | 654,394 | 666,414 | |||||||||
| Investments and cash |
421,379 | 404,412 | 404,826 | |||||||||
| Reinsurance recoverables |
144,218 | 146,004 | 143,915 | |||||||||
| Total liabilities |
450,405 | 451,411 | 470,211 | |||||||||
| Policy reserves |
412,248 | 424,914 | 437,692 | |||||||||
| Total equity |
216,482 | 202,983 | 196,203 | |||||||||
| Total tangible equity |
214,275 | 200,940 | 194,323 | |||||||||
| Investments and cash/ assets |
63.2 | % | 61.8 | % | 60.7 | % | ||||||
| Policy reserves/ equity |
190.4 | % | 209.3 | % | 223.1 | % | ||||||
| Total equity/ assets |
32.5 | % | 31.0 | % | 29.4 | % | ||||||
| Tangible equity/ assets |
32.1 | % | 30.7 | % | 29.2 | % | ||||||
Source: MMHC consolidated GAAP financial statements.
The Company’s total assets decreased 1.9% from $666.9 million at December 31, 2015 to $654.4 million at December 31, 2016 and increased 1.8% to $666.4 million at December 31, 2017. Total assets were primarily comprised of investments and cash and reinsurance recoverable. At December 31, 2017 these two accounts comprised 82.3% of total assets. Investments and cash ranged from 60.8% to 63.2% of total assets over the period analyzed. At December 31, 2016, investments and cash reduced 4.0% to $404.4 million ($421.4 million at December 31, 2015). The Company’s total cash and invested assets grew to $404.8 million as of December 31, 2017 from $404.4 million as of December 31, 2016. All investments are recorded at fair value. Reinsurance recoverables increased from $144.2 million at December 31, 2015 to $146.0 million at December 31, 2016.
| 43 |
| |||
The Company’s total liabilities increased 0.2% from $450.4 million at December 31, 2015 to $451.4 million at December 31, 2016 and increased to $470.2 million at December 31, 2017. Total liabilities were primarily comprised of liabilities to policyholders (including benefits & claims, policyholder account balances, and other policyholder liabilities), which accounted for 93.1% of total liabilities at December 31, 2017. Policy reserves grew 3.1% from $412.2 million at December 31, 2015 to $424.9 million at December 31, 2016 and increased a further 3.0% over the twelve-month period to $437.7 million at December 31, 2017.
The Company’s total equity decreased by 6.2% from $216.5 million at December 31, 2015 to $203.0 million at December 31, 2016 and decreased by 3.3% at December 31, 2017 to $196.2 million. The continued decline in GAAP equity is a result of persistent losses on a consolidated basis even though Fidelity Life has operated profitably in 2015, 2016, and 2017 on a statutory basis. At December 31, 2017 intangible assets were approximately $1.9 million, resulting in a tangible book value of $194.3 million.
As shown in the following table, the Company’s return on average assets (“ROAA”) and return on average equity (“ROAE”) have improved since 2016 but continue to reflect a lack of profitability. The Company has not produced meaningful GAAP net income in its current form, nor does management forecast it to do so for the next few years. The Offering will add additional equity to the Company further depressing a nominal or negative ROAE.
Table 2
MMHC Consolidated
ROAE and ROAA
| 12/31/2015 | 12/31/2016 | 12/31/2017 | ||||||||||
| ROAA |
(1.21 | %) | (2.32 | %) | (1.25 | %) | ||||||
| ROAE |
(3.66 | %) | (7.31 | %) | (4.13 | %) | ||||||
Source: MMHC consolidated GAAP financial statements.
| 44 |
| |||
Consolidated Income and Expense Trends
Table 3 displays the Company’s earnings results and selected operating ratios for fiscal years 2015 to 2017. Exhibit V includes the Company’s annual income statements for fiscal years 2015 to 2017. Members Mutual’s operating results are influenced by factors affecting the L&H insurance industry in general as well as specific issues related to the Company’s growth strategy. The performance of the L&H insurance industry is subject to significant variations due to fluctuations in the financial markets, fluctuations in interest rates, general economic conditions, and other factors.
Table 3
MMHC Consolidated
Selected Operating Performance Data
($000)
| 12/13/2015 | 12/31/2016 | 12/31/2017 | ||||||||||||||||||||||
| Revenues: |
||||||||||||||||||||||||
| Life insurance premiums-net |
$ | 72,443 | 66.9 | % | $ | 78,138 | 69.1 | % | $ | 82,873 | 71.5 | % | ||||||||||||
| Net investment income |
15,797 | 14.6 | % | 15,957 | 14.1 | % | 15,119 | 13.0 | % | |||||||||||||||
| Net realized investment (losses) gain |
(394 | ) | (0.4 | %) | 530 | 0.5 | % | 571 | 0.5 | % | ||||||||||||||
| Earned commission and other |
20,409 | 18.9 | % | 18,374 | 16.3 | % | 17,307 | 14.9 | % | |||||||||||||||
|
|
|
|
|
|
|
|
|
|
|
|
|
|||||||||||||
| Total revenue |
108,255 | 100.0 | % | 112,999 | 100.0 | % | 115,870 | 100.0 | % | |||||||||||||||
| Benefits and Expenses: |
||||||||||||||||||||||||
| Insurance policy benefits-net |
46,633 | 43.1 | % | 59,536 | 52.7 | % | 56,035 | 48.4 | % | |||||||||||||||
| Interest credited to policy account balances |
4,235 | 3.9 | % | 3,914 | 3.5 | % | 3,776 | 3.3 | % | |||||||||||||||
| General operating expenses |
56,129 | 51.8 | % | 58,538 | 51.8 | % | 55,912 | 48.3 | % | |||||||||||||||
| Amortization of deferred policy acquisition costs (“DAC”) |
12,422 | 11.5 | % | 13,018 | 11.5 | % | 10,926 | 9.4 | % | |||||||||||||||
| Amortization of intangible assets |
210 | 0.2 | % | 164 | 0.1 | % | 163 | 0.1 | % | |||||||||||||||
|
|
|
|
|
|
|
|
|
|
|
|
|
|||||||||||||
| Total benefits and expenses |
119,629 | 110.5 | % | 135,170 | 119.6 | % | 126,812 | 109.4 | % | |||||||||||||||
| (Loss) income before taxes |
(11,374 | ) | (10.5 | %) | (22,171 | ) | (19.6 | %) | (10,942 | ) | (9.4 | %) | ||||||||||||
| Income tax (benefit) expense |
(3,184 | ) | (2.9 | %) | (6,833 | ) | (6.0 | %) | (2,701 | ) | (2.3 | %) | ||||||||||||
|
|
|
|
|
|
|
|
|
|
|
|
|
|||||||||||||
| Net income (loss) |
(8,190 | ) | (7.6 | %) | (15,338 | ) | (13.6 | %) | (8,241 | ) | (7.1 | %) | ||||||||||||
| Less: Net income attributable to noncontrolling interests |
— | 0.0 | % | — | 0.0 | % | — | 0.0 | % | |||||||||||||||
|
|
|
|
|
|
|
|
|
|
|
|
|
|||||||||||||
| Net income (loss) attributable to MMHC |
$ | (8,190 | ) | (7.6 | %) | $ | (15,338 | ) | (13.6 | %) | $ | (8,241 | ) | (7.1 | %) | |||||||||
|
|
|
|
|
|
|
|||||||||||||||||||
| Other Metrics: |
||||||||||||||||||||||||
| Operating income1 |
(10,770 | ) | (9.9 | %) | (22,537 | ) | (19.9 | %) | (11,350 | ) | (9.8 | %) | ||||||||||||
| General operating expenses and DAC/net life insurance premiums |
94.6 | % | 91.6 | % | 80.7 | % | ||||||||||||||||||
| Net life and annuity benefits net life insurance premiums |
64.4 | % | 76.2 | % | 67.6 | % | ||||||||||||||||||
Source: MMHC consolidated GAAP financial statements.
| (1) | Operating income defined as pretax income excluding realized investment gains (losses) and amortization of intangibles. |
Members Mutual’s total revenue increased from $108.3 million in fiscal year 2015 to $115.9 million in 2017. Insurance premiums increased by $4.7 million from 2016 to 2017. Net premiums earned increased from $72.4 million in fiscal year 2015 to $82.9 million in 2017.
| 45 |
| |||
Net realized investment losses and gains ranged from a loss of $0.4 million to a gain of $0.6 million over the periods analyzed. Earned commission and other revenue decreased from $20.5 million in fiscal year 2015 to $18.4 million for 2016, and decreased further to $17.3 million in 2017. Decrease in commission was largely due to an increase in the sale of FLA products whose commissions are eliminated in intercompany GAAP accounting. Net investment income in 2017 decreased.
Members Mutual’s net loss in fiscal year 2017 of $8.2 million was an improvement from to its loss in 2016 of $15.3 million. Total benefits and expenses increased $15.5 million or 13.0% from $119.6 million in fiscal year 2015 to $135.2 million in 2016 due to what management indicated was an abnormally bad year, with benefits in excess of what their underwriting models predicted. In fiscal year 2017, total benefits and expenses decreased $8.4 million or 6.2% to $126.8 million from $135.2 million in 2016 as benefits returned to more expected levels. In 2017, general operating expenses declined $2.6 million from $58.5 million to $55.9 million as management restructured costs at eFinancial and other areas.
Key measurements of the core profitability of a life insurance company are its expense ratio and its benefits ratio. These ratios are generally calculated based on a company’s statutory financials; however, for purposes of this analysis, we have calculated the following ratios based on GAAP financials using the formulas below:
| • | General operating expenses plus amortized deferred acquisition costs as a percentage of net insurance life premiums (“Expense Ratio”); and |
| • | Net life and annuity benefits as a percentage of net life insurance premiums (“Benefits Ratio”). |
The Company’s Expense Ratio decreased from 94.6% in fiscal year 2015 to 80.7% for 2017, as a result of lower DAC amortization due to lower policy lapses and increased premiums. On the other hand, the Benefits Ratio increased from 64.4% in fiscal year 2015 to 67.6% for 2017. This increase is primarily due to an increase in net life insurance benefits resulting from higher net benefits paid and increased reserves.
| 46 |
| |||
Statutory Financial Data Overview
State insurance laws and regulations require Fidelity Life to file financial statements with state insurance departments everywhere it does business, and the operations of Fidelity are subject to examination by those departments, Fidelity Life prepares statutory financial statements in accordance with accounting practices and procedures prescribed or permitted by these departments. Certain accounting standards differ under statutory accounting practices (“SAP”) as compared to GAAP. For example, premium income is recognized on a pro rata basis over the term covered by the insurance policy, while the related acquisition costs are expensed when incurred under SAP. Under GAAP, both premium income and the related policy acquisition costs are recognized on a pro rata basis over the term of the insurance policy. Therefore, the GAAP operating results and financial data for Fidelity Life do not match to the SAP presentation. Exhibit XI presents summary statutory financial data for Fidelity Life over the three-year period for the years ended December 31, 2015 to 2017. On a statutory basis, Fidelity Life registered positive earnings in 2015, 2016, and 2017.
Closed Block
Fidelity Life, as part of the reorganization to a mutual holding company structure, established what is known as a closed block (“Closed Block”). Fidelity Life Closed Block contains two types of participating policies:
| • | Type A Policies: policies in classes to which policy dividends have been declared in the past. |
| • | Type B Policies: policies in classes as to which no dividends have been paid or were expected, referred to as “Non-Dividend Paying Policies.” |
As to the Type A policies, the objective of the Closed Block is to provide reasonable assurance to the participating policyholders that assets will be available to provide for the continuation of experience-based dividends for those participating policies that have historically
| 47 |
| |||
had such dividends declared. The Type A block contains participating policies which historically have been credited with experience-based dividends.
As to the Type B policies, the objective of the Closed Block is to provide for the funding of the benefits guaranteed in the policies and, to the extent that future experience with respect to such policies is more favorable than current experience, to provide for the potential of future dividends to the owners of the policies. However, the establishment of the Type B block was not intended to provide dividends on policies for which no dividends are expected.
According to management there were approximately 7,100 policies in the Type A block and 17,800 policies in the Type B block as of December 31, 2017. All dividends are subject to declaration by the Company’s board of directors.
The Closed Block was funded at inception (October 1, 2006) with assets in an amount which are expected to be sufficient to support the Closed Block activity, including payment of claims, expenses, and taxes and to provide for continuation of dividends, to the extent applicable, for the life of the policies. Management has indicated the Closed Block operates for the benefit of participating policyholders to provide “reasonable assurance’’ as to dividend expectations. The Closed Block is designed such that if the assets of the Closed Block are not sufficient to pay the benefits guaranteed under the policies, then Fidelity Life will he required to make such payments from general funds. A certain portion of the initial funding, plus accumulated interest, is eligible to be reverted to Fidelity Life if not required to fund benefits. Any such transfer back to Fidelity Life must be approved in advance by the Illinois Department of Insurance (“IDOI”).
The assets and liabilities within the Closed Block are included in Members Mutual’s consolidated financial statements on the same basis as other accounts of the Company. The Closed Block’s contribution to Members Mutual financial statements are shown in the following table.
| 48 |
| |||
Table 4
MMHC Consolidated
Closed Block GAAP Balance Sheet and Income Statement
($000)
Source: Registration Statement.
As of December 31, 2017, the Closed Block assets exceeded liabilities by $5.3 million and decreased Members Mutual’s net income by approximately $0.1 million. In 2017, the impact of tax reform on the DTA in the Closed Block resulted in a one-time write down and decrease in net income attributable to the Closed Block. Without regard for the DTA impact, the Closed Block would have shown profits similar to prior years, and similarly offset a portion of the MMHC net loss.
Historical Closed Block Contribution
| 2015 | 2016 | 2017 | ||||||||||
| Closed Block Net Income |
$ | 2,314 | $ | 1,927 | $ | (149 | ) | |||||
| MMHC Net Income |
(15,338 | ) | (15,338 | ) | (8,241 | ) | ||||||
| % of MMHC |
13.11 | % | 11.16 | % | (1.84 | %) | ||||||
| Closed Block “Equity”(1) |
4,056 | 5,474 | 5,286 | |||||||||
| MMHC Equity |
202,983 | 202,983 | 196,203 | |||||||||
| % of MMHC |
2.00 | % | 2.70 | % | 2.69 | % | ||||||
| Closed Block Assets |
142,202 | 126,935 | 110,779 | |||||||||
| MMHC Assets |
$ | 654,394 | $ | 654,394 | $ | 666,414 | ||||||
| % of MMHC |
21.73 | % | 19.40 | % | 16.62 | % | ||||||
Source: Registration Statement.
| (1) | Represents excess of closed block liabilities over designated assets |
| 49 |
| |||
| III. | Industry Overview |
Current State of Industry
The climate surrounding life insurance companies has been largely dictated by the prolonged low interest rate environment. Because life insurers have such long-lived obligations, they rely on achieving substantial long-term returns in their investment portfolios to fund those obligations.
Source: SNL Financial
The Federal Reserve suspended its third round of quantitative easing in October 2014, ending its more than half decade-long program of purchasing financial assets and increasing money supply in order to spur economic growth. A stronger economy with a lower unemployment rate prompted the Fed to vote in favor of ending the program, but the positive outlook did not sway the Fed to increase interest rates. It took another year before the Federal Reserve decided to raise its key interest rate by 0.25% from being near zero since 2008. This was the first interest rate hike in nearly a decade and was primarily driven by the country’s continued economic recovery and strengthening since the Great Recession. Factors that led to the interest rate increase include: indications of a stronger labor market with a lower unemployment rate and steady economic expansion. In February 2018, Jerome Powell was sworn-in as Chairman of the Federal Reserve.
| 50 |
| |||
Powell succeeds Janet Yellen who served as Chair since February 2014. During her tenure, the Fed’s key interest rate increased to a level of 1.50%, which has not been seen since 2008. In March 2018, Chairman Powell continued this course and a 0.25% hike was approved to put the federal funds rate at 1.75%. This was the sixth-rate hike since the FOMC began raising rates in December 2015. The Fed stated that its path of rate hikes could be more aggressive as the economic outlook has strengthened in recent months. The increase in interest rates benefits investment returns as insurance providers can invest premiums and matured investments into higher yielding bonds. Over the last five years, the life insurance industry’s net yield on invested assets has declined from 4.9% to 4.6%. Despite the interest rate increase by the Fed and a robust economic labor market, 10-year Treasury yields continue to trade near its record low level. Concerns over the deceleration of international economies and monetary policy have caused investors to seek the safety of U.S. Treasuries.
Life insurers remain uncertain of how government policies and the political landscape may affect the industry. The Dodd-Frank Wall Street Reform and Consumer Protection Act established the U.S. Department of the Treasury’s Federal Insurance Office, the Financial Stability Oversight Council (FSOC), and the Office of Financial Research. The Treasury’s Federal Insurance Office has the authority to monitor all aspects of the insurance sector. The Federal Reserve will soon be an important regulator of some of the largest life insurers—a major change in the standard order that could have real effects on what products are offered and the price charged for them. The Financial Stability Oversight Council’s three primary purposes include: (1) to identify risks to the financial stability of the United States that could arise from the material financial distress or failure, or ongoing activities, of large, interconnected bank holding companies or nonbank financial companies, or that could arise outside the financial services marketplace; (2) to promote market discipline, by eliminating expectations on the part of shareholders, creditors, and counterparties of such companies that the U.S. government will shield them from losses in the event of failure; and (3) to respond to emerging threats to the stability of the U.S. financial system. Designation as a SIFI (Systemically Important Financial Institution) by the Financial Stability Oversight Council could carry a regulatory burden and insurers, such as MetLife, have strenuously resisted the designation. The Fed may require SIFIs to abide by capital requirements similar to those required of banks. However, regulatory requirements that may hold true for bank holding companies may
| 51 |
| |||
not be appropriate for nonbank financial institutions. In 2014 MetLife was labeled a systemically important financial institution by the Financial Stability Oversight Council, which would subject the company to special regulation by the Federal Reserve. But in 2016 the Federal District Court ruled that the company did not pose a threat to the financial stability of the United States and the FSOC subsequently appealed the ruling.
In 2018, placing life insurance policies could be a harder sell in the United States given the potential impact of new fiduciary standards set by the US Department of Labor on the sale of retirement-related products. Final form of the fiduciary rule is still being debated but many insurers have already made meaningful changes to accommodate the regulation. Most uncertainty revolves around compliance demands for the sale of retirement related products. In a survey conducted by Deloitte, nearly all 21 members of the Securities Industry and Financial Markets Association (SIFMA) report making changes to retirement products in response to the fiduciary rule, including limiting or eliminating asset classes and certain product structures. The study also showed a shift of retirement assets into fee-based or advisory programs rather than commission-based sales.1
Insurance customers demand easier accessibility to products, flexible solutions that fit their changing needs, and information transparency. Technology has enabled new startups to enter the market and capitalize on the changing life insurance landscape and incumbents to optimize operations and develop growth strategies for the future. Companies are able to harness technology innovations to adapt to the various ways customers are purchasing and receiving insurance. Existing insurers are investing into new technologies in order to provide better product offerings, product accessibility, and user experience for customers. John Hancock launched Protection UL with Vitality, which rewards policyholders with premium savings for health-related activities that is tracked through personalized devices. Sureify offers a platform that enables insurers to underwrite life insurance based on data received from wearable technology. According to the 2017 Insurance Barometer Study by LIMRA, 32% of people purchased or attempted to purchase life insurance online, a 4% increase from 2016.2
| 1 | 2018 Insurance Outlook; Deloitte |
| 2 | 2017 Insurance Barometer Study Shows an Improving Climate for Life Insurance; LIMRA |
| 52 |
| |||
The industry continues to innovate new methods to reach underserved customers. In recent years, the purchasing of life insurance has been trending towards direct transactions, particularly over the internet. The internet provides a great deal of information for customers who want to research insurance options. According to the 2017 Insurance Barometer Study by the Life and Health Insurance Foundation for Education and LIMRA, 22% of consumers say they would be willing to purchase life insurance using a Peer-to-Peer method. Not surprisingly, younger generations are more likely to purchase life insurance online than older generations, but most people would prefer to work with a financial professional.3 25% of adults would prefer to purchase life insurance directly via the Internet, mail, or over the phone with younger consumers showing the most interest in purchasing life insurance through the Internet. Among those ages 25 to 44, 31% said they would prefer to buy directly.4
Most Americans acknowledge they may need more life insurance, but a report by LIMRA notes that individual life insurance ownership has been declining for over 50 years with the coverage gap widening by $1 trillion from 2012 to 2015.5 While economic conditions have stabilized and improved in a number of areas, economic challenges still remain. Many middle American families, including those that comprise Fidelity Life’s target Middle Market, have experienced financial hardships as a result of the Great Recession and stagnating income levels. A recent study by LIMRA, found that 65% of Americans say they won’t buy life insurance because they believe the cost is too expensive and other living expenses maintain priority over having coverage.6 Many Americans believe keeping a life insurance policy in-force will be a financial burden on their household, despite the fact that the cost of basic term life insurance has decreased by nearly 50% over the past decade.
| 3 | Life Insurance Awareness Month, September 2015; LIMRA |
| 4 | The Life/Health Industry; Insurance Information Institute. |
| 5 | LIMRA: Life Insurance Coverage Gap Substantial and Growing |
| 6 | 2015 Insurance Barometer Study Finds Americans Continue to Overestimate Cost of Life Insurance |
| 53 |
| |||
Source: ACLI Fact Book; 2016.
According to LIMRA Research, individual life insurance new annualized premium increased 2% for the first half of 2016. In the second quarter of 2016, total individual life insurance policies sold grew for the seventh consecutive quarter at 1%. As shown above, 2015 was the first meaningful annual increase in individual life insurance policies in decades.
Performance
As of April 11, 2018, the S&P 500 Life & Health Sub-Industry Index had a total return of (7.72)% year to date, behind the S&P 500 Index, which has a year to date return of (1.44)%. The life industry has been weighed down by poor operating results. In the fourth quarter 2017, the U.S. life industry pretax operating profit fell 28.3% compared to the third quarter (admittedly, a portion of this decline was from DTA write-downs across the industry). There is an expectation that interest rate hikes will continue to provide a lift in returns for the insurance industry.
| 54 |
| |||
Source: SNL Financial; Life Investment Analysis.
Over the last five years, return on average assets (“ROAA”) has ranged from 0.61% to 0.73% with ROAA for 2017 at 0.62%. Return on average equity (“ROAE”) has ranged from 10.54% to 12.85% for the last five years with ROAE for 2017 at 10.86%. Benefit ratio, expense ratio, and commission ratio have remained within a fairly consistent range over the last five years.
Operating Ratios (%)
| 55 |
| |||
Life Statutory Industry Performance
| Period |
2013 Y | 2014 Y | 2015 Y | 2016 Y | 2017 Y | |||||||||||||||
| Operating Ratios (%) |
||||||||||||||||||||
| Growth Rate—Direct Premium & Annuity Considerations |
(5.58 | ) | 2.42 | 2.84 | 0.34 | (0.51 | ) | |||||||||||||
| Growth Rate—Premium & Annuity Considerations |
(10.08 | ) | 15.05 | (1.40 | ) | (6.00 | ) | (2.78 | ) | |||||||||||
| Growth Rate—Operating Income |
5.59 | (22.08 | ) | 10.98 | 23.28 | (9.93 | ) | |||||||||||||
| Growth Rate—Revenue |
(5.98 | ) | 12.18 | (3.39 | ) | 0.44 | (3.92 | ) | ||||||||||||
| Change in Policyholder Dividend |
2.95 | 4.92 | 11.21 | (0.23 | ) | (4.04 | ) | |||||||||||||
| Effective Tax Rate |
13.60 | 20.62 | 19.43 | 24.27 | 18.98 | |||||||||||||||
| Net Yield Avg. Invested Assets |
4.85 | 4.83 | 4.66 | 4.56 | 4.54 | |||||||||||||||
| Pre-Tax Operating Margin |
8.04 | 5.58 | 6.41 | 7.87 | 7.38 | |||||||||||||||
| Return on Average Equity |
12.85 | 10.96 | 11.17 | 10.54 | 10.96 | |||||||||||||||
| Pre-Tax Operating ROAE |
19.10 | 14.29 | 15.08 | 17.93 | 15.72 | |||||||||||||||
| Return on Avenge Assets |
0.73 | 0.61 | 0.64 | 0.61 | 0.63 | |||||||||||||||
Source: SNL Financial; Life Statutory Financials.
These factors, among others, have caused a significant deterioration in the price-to-book ratio for the life insurance business over the last five years. Currently, the price-to-book for the life insurance industry as a whole is 94.5% as of April 11, 2018 while at the end of 2007 the industry price-to-book ratio stood at 102.1%. This severe multiple contraction shows the life insurance industry has not rebounded well from the financial crisis of 2008.7 The market perceives lack of growth and difficult investment conditions will make profitability a challenge for life insurers.
According to SNL Financial, life insurance industry reserves and deposits have grown each year from 2013 to 2017. Reserves for life insurance sub-segment ordinary life increased from 2016 to 2017 by 4.2%. In addition, reserves for the insurance sub-segment of individual annuity increased by 2.7%. For the same period, reserves for industry sub-segment industrial life declined by 2.0%. Of the four major segments shown in the left pie chart below, accident & health grew most from 2016 to 2017 at 4.8% followed by life at 3.8% for the same period.
| 7 | SNL Financial. |
| 56 |
| |||
Source: SNL Financial; Life Reserve Analysis.
Outlook
A.M. Best affirmed its negative outlook rating for the U.S. life/annuity market segment in 2018. The continued negative outlook was due to market and regulatory concerns. A.M. Best is concerned about the low interest rate environment, which has been a concern for almost a decade. The flattening of the yield curve has impacted net yields year-over-year on invested asset portfolio for life insurance companies. This trend is not expected to go away according to Anthony McSwieney of A.M. Best. As a result, companies are switching their asset allocation to instruments which are more credit focused and less liquid as compared to prior years. A.M. Best believes during a stressed scenario, companies could have difficulty producing comparative yields. Low growth in premium and annuity sales are dampening prospects for the industry. On the regulation side, a lower tax environment is positive for the industry. However, balance sheet items such as deferred tax assets will need to be written down in a lower rate environment.8 A negative outlook rating means expectations for the market segment is likely to experience unfavorable financial and market trends.
Fitch Ratings revised its U.S. life insurance sector outlook to stable due to “Better than expected operating performance and a benign credit environment likely to continue into next
| 8 | A.M. Best: Market Segment Outlook for U.S. Life/Annuity Sector Remains Negative, 12/12/2017. |
| 57 |
| |||
year.”8 Managing Director, Douglas Meyer of Fitch Ratings said, “Operating performance has surpassed expectations over the past year thanks to favorable equity and credit markets.” According to Fitch, low interest rates are still pressuring interest margins on in-force business, though recent results have benefited from higher than expected variable investment income and modest credit losses. Fitch noted that a number of U.S. life insurers took significant exits in underperforming legacy interest-sensitive businesses.9
Life Insurance Industry Portfolio Yield
| Period Ended | 2013 Y | 2014 Y | 2015 Y | 2016 Y | 2017 Y | |||||||||||||||
| Investment Yields by Type (%) | ||||||||||||||||||||
| Net Yield on Invested Assets |
4.85 | 4.83 | 4.66 | 4.56 | 4.54 | |||||||||||||||
| Gross Yield - Bonds (excl affiliates) |
5.00 | 4.90 | 4.72 | 4.65 | 4.47 | |||||||||||||||
| Gross Yield - Preferred Stocks (excl affiliates) |
6.54 | 6.17 | 5.98 | 5.81 | 5.72 | |||||||||||||||
| Gross Yield - Common Stocks (excl affiliates) |
2.90 | 2.90 | 2.81 | 3.62 | 2.84 | |||||||||||||||
| Gross Yield - Mortgage Loans |
5.64 | 5.39 | 5.13 | 4.88 | 4.64 | |||||||||||||||
| Gross Yield - Real Estate |
14.42 | 14.39 | 15.35 | 14.42 | 14.26 | |||||||||||||||
| Gross Yield - Contract Loans |
6.02 | 6.01 | 5.83 | 5.96 | 5.95 | |||||||||||||||
| Gross Yield - Cash and Short Term |
0.47 | 0.49 | 0.49 | 0.90 | 1.32 | |||||||||||||||
| Gross Yield - All Other Inv. Assets |
7.48 | 8.26 | 7.49 | 7.07 | 8.72 | |||||||||||||||
Source: SNL Financial; Life Investment Analysis.
Source: SNL Financial; Life Investment Analysis, represents most recent industry data.
| 8 | A.M. Best: Market Segment Outlook for U.S. Life/Annuity Sector Remains Negative, 12/12/2017. |
| 9 | Fitch 2018 Outlook: U.S. Life Insurance Outlook to Stable, 12/6/2017. |
| 58 |
| |||
Net yield on invested assets has declined from 2013 to 2017. Bonds, preferred stocks, mortgage loans, real estate, and contract loans saw gross yields decline while common stocks, cash and short term, and all other invested assets saw a climb in gross yields over the past five years. Due to the challenges in the current investment market many insurers have weighted more toward riskier assets classes, such as fixed income securities on the lower end of the credit scale. Moody’s Investors Service Inc. expects more insurers to increase their investments in these assets as low rates continue to negatively affect them. Private placements, commercial mortgage loans, high-yield bonds and bank loans are among the asset classes that life insurers are investing in to help boost their yields. Ratings agencies are concerned insurers may be tempted to invest in riskier assets in order to increase yield. Fitch remains concerned about the strategies life insurers may use to reach for additional yield.10
Continued shifting of demographics will shape industry demand in the near future and create opportunities for insurers to broaden their customer base by catering to the specific needs of certain demographics. Millennials are currently underserved by the life insurance industry and are unaware of how insurance products can fit their financial planning strategies. Millennials have needs and buying habits that differ from prior generations which requires insurance carriers to shift their strategies for reaching this market. According to Pew Research Center, Millennials are highly diverse and are on track to be the most educated generation in history. However, Millennials have accumulated large debt burdens from borrowing to finance their higher education with the average debt of $35,051 for the class of 2015.11 In 2016, student loans surpassed $1.2 trillion and are only behind mortgages for largest consumer debts. This debt burden has shifted Millennial’s spending habits and has pushed off typical life milestones, such as home ownership, marriage, and starting families. Millennials have also been slow to plan for their future financial needs due to priorities on current financial needs.12
Baby Boomers are another large demographic that will continue to influence the industry. They are the wealthiest generation in American history and are nearing retirement age According to the Pew Research Center, approximately 10,000 Americans turn age 65 every day. However,
| 10 | US life insurers shaken by rock-bottom rates. The Financial Times, 3/2/2016. |
| 11 | America’s growing student-loan-debt crisis, MarketWatch, 1/19/2016. |
| 12 | How the life insurance industry will change in 2016, LifeHealthPro, 11/11/2015. |
| 59 |
| |||
many Baby Boomers are expected to work and retire later as their retirement plans were greatly impacted by the Great Recession. Americans continue to have longer life expectancies, which creates new challenges when planning for financial needs in the later years in life, LIMRA Secure Retirement Institute findings suggest a person should, at a minimum, plan to cover financial needs through their mid-90’s, which is far from what was suggested in the 1950’s.13 Building financial security for over a decade greater than the current average life expectancy can be challenging and may require consumers to utilize financial products to meet their specific needs.
Technology development continues to be an opportunity for innovation within the insurance industry. Consumers, especially younger generations, are more adept with technology and comfortable utilizing technology to perform research and make purchasing decisions. Utilizing technology to better analyze data, build relationships with consumers, and market product offerings toward targeted demographics will allow insurers to expand growth opportunities. A.M. Best Spring 2016 Insurance Industry Survey asked insurers what they view as keys to their organization’s success in the next two years. The primary factors include upgrading information systems and improving customer experience.14 Lincoln National Corp. recently announced it completed work on a project with iPipeline, an insurance software company, to build an online, largely automated life insurance application and underwriting system to more efficiently target millennial customers.15 Lincoln hopes to broaden its customer base beyond their current customer demographic. Online student loan refinancing startup, Social Finance Inc. (SoFi), announced its plan to offer life insurance in 2016. SoFi’s customer base is mostly comprised of college graduates who utilize its services to refinance student loans at low interest rates. The company hopes to attract customers who haven’t used its existing services by being able to utilize technology to underwrite life insurance faster.16 Ladder, an insurance technology (“InsurTech”) startup, is offering direct-to-consumer policies within minutes. The platform targets younger consumers who may historically have avoided purchasing coverage and does not charge annual policy fees or employ commissioned agents.17
| 13 | When Planning for Retirement, 90 is the new 70, LIMRA, 1/20/2016. |
| 14 | Best’s Review, 9/2016. |
| 15 | Lincoln seeks mass youth market with iPipeline automated insurance. The Philadelphia Inquirer, 6/6/2016. |
| 16 | SoFi Plans to Offer Life Insurance by End of Year, Bloomberg, 9/21/2016. |
| 17 | New Insurtech Ladder is digitizing life insurance,” Business Insider, 1/11/2017. |
| 60 |
| |||
IV. Valuation Methodologies
General Overview
Boenning considered several established valuation methodologies for this Appraisal, including the income approach (discounted cash flow), asset-based approach, and comparable market approach. The comparable market approach was chosen to determine the Pro Forma Market Value, because: (i) it has been widely accepted as a valuation approach by insurance industry analysts and applicable regulatory authorities: (ii) where possible, the generally employed valuation method in initial public offerings is the comparable market approach (which has also been relied upon to determine the Pro Forma Market Value of previous insurance company mutual-to-stock conversions using the subscription rights method); and (iii) reliable market and financial data are readily available for most comparable companies.
Various income approaches include a capitalization of earnings and a discounted cash flow analysis and reflect the economic principle that the value of a subject investment, or subject business interest, is the present value of the economic income expected to be generated by the investment. The income capitalization approach relies on either a single period or multiple periods considered to be representative of recurring benefits, which are capitalized by a capitalization rate chosen from comparable companies or from risk-adjusted rates of return required by investors in a particular line of business. When multiple periods are used, income is estimated for several future periods. This income is discounted to the present time period, with or without a terminal value, depending upon the circumstances of the particular company.
Due to the Company’s lack of historical earnings and the absence of supportable income projections, we did not utilize an income approach, Additionally, the Company has reported a trend of uneven and unprofitable operating results in recent years. Furthermore, a large number of publicly traded insurance companies are represented in the stock market, are widely followed by analysts and investors, and are traded actively. The trading characteristics of these public companies allow analysis and investors to gain and apply knowledge about the comparative
| 61 |
| |||
fundamentals of these companies as they relate to financial performance and market valuations, thus strengthening the case for utilizing the comparable market approach noted above.
Asset-based valuation approaches may be either on a going concern, orderly disposition, or forced liquidation basis. Going concern asset-based valuations are often used in the case of companies that hold readily marketable assets such as an investment company. The Company holds assets for the purpose of producing income to support its insurance operations. While a portion of Members Mutual’s assets are readily marketable, its primary business is not investment in assets for resale. Financial service companies are rarely valued on the basis of their assets at liquidation value or the disposal of individual assets or groups of assets. While the stock market may use a concept of “book value” as a pricing benchmark, few investors recognize the overall value of a financial service company as being its net book value at any point in time because of the significant differences in composition of balance sheet assets and liabilities and risks associated with business, market, credit, and interest rate factors that the concept of simple “book value” does not fully recognize. For an insurance company such as Members Mutual, the asset-based approach could lead to valuation conclusions that do not fully take into account the enterprise as a whole and the accompanying risk factors or intangible benefits related to the business franchise. Therefore, we have elected not to utilize this approach and have concentrated on the comparable market approach.
The comparable market approach provides a basis for determining estimates of going-concern valuations where a regular and active market exists for the stocks of comparable companies. The comparable market approach measures the value of an asset through an analysis of recent transactions in the common stock of companies sharing valuation characteristics with the subject company. When applied to the valuation of equity interests, consideration is given to the financial condition and operating performance of the company being appraised relative to those of publicly-traded companies. These companies are potentially subject to similar economic, environmental and political facts and considered to be reasonable investment alternatives. Publicly-traded companies provide indications of value of a freely-traded minority interest, i.e. non-control.
| 62 |
| |||
The comparable market approach derives valuation benchmarks from the trading patterns of selected comparable companies that, due to certain factors such as financial performance and operating strategies, enable the appraiser to estimate the potential value of the subject institution in a mutual-to-stock conversion offering. In this Section IV, our valuation analysis focuses on the selection and comparison of the Company with a comparable group of publicly-traded insurance companies. Section V. discusses market value adjustments, both discounts and premiums, to account for perceived differences between the Company and the comparable group of companies discussed below.
Selection Criteria
When applying the comparative market approach, the appraiser would ideally utilize companies identical to the subject company in terms of lines of business, growth, profitability, and composition of earnings. Since there are no publicly traded companies identical to the Company, we selected a peer group of publicly-traded Life and Health (“L&H”) insurance companies that potentially share similar valuation characteristics with the Company (“Comparable Group”). Selected financial data for L&H insurance companies listed on U.S. stock exchanges is shown in Exhibit XII as compiled from data obtained from S&P Global Market Intelligence (“Capital IQ” or “SNL Financial”), a leading provider of financial and market data. Several criteria, discussed below, were used to select the individual members of the Comparable Group from the overall universe of the publicly-traded L&H insurance segment (“Public L&H Insurance Group”). However, in determining the Comparable Group, Boenning was mindful of the need to maintain a group of companies of a meaningful size.
Operating Characteristics: A company’s operating characteristics affect investors’ expected rates of return on a company’s stock under various business and economic scenarios, and they influence the market’s general perception of the quality and attractiveness of a given company. Operating characteristics, which may vary in importance during the business cycle, include financial variables such as profitability, capitalization, growth, risk exposure, liquidity, and other factors such as lines of business and management strategies.
| 63 |
| |||
Marketability/Liquidity of a Stock: Marketability of a stock reflects the relative ease and promptness with which a security may be sold when desired, at a representative current price, without material concession in price merely because of the necessity of sale. Marketability also connotes the existence of buying interest as well as selling interest and is usually indicated by trading volumes and the spread between the bid and ask price for a security. Liquidity of the stock issue refers to the organized market exchange process whereby the security can be converted into cash. The use of listed companies covered by the SNL Financial database provides a Comparable Group that conforms to this selection criterion.
Specifically, in determining the Comparable Group, we began by gathering an initial list of publicly-traded L&H companies in the United States. This screen produced 22 L&H insurance companies with total assets ranging from $49.0 million to $832.1 billion and total equity ranging from $2.2 million to $58.9 billion, as shown in Exhibit XII.
Exhibit XII
Public L&H Insurance Group
As of 12/31/2017 Unless Otherwise Noted
| Company Name |
Ticker | Total Assets ($000) |
Total Policy Reserves ($000) |
Total Equity ($000) |
Tangible Equity ($000) |
Cash and Investments ($000) |
Cash and Investments / Assets (%) |
Policy Reserves / Equity (x) |
Total Equity / Assets (%) |
Tangible Equity / Assets (%) |
Life Premiums LOB (%)* |
|||||||||||||||||||||||||||||||
| MetLife, Inc. |
MET | 719,892,000 | 378,810,000 | 58,870,000 | 49,280,000 | 456,768,000 | 63.45 | 6.43 | 8.18 | 6.85 | 43.66 | |||||||||||||||||||||||||||||||
| Prudential Financial, Inc. |
PRU | 832,136,000 | 411,917,000 | 54,511,000 | 53,610,000 | 484,407,000 | 58.21 | 7.56 | 6.55 | 6.44 | 36.07 | |||||||||||||||||||||||||||||||
| Aflac Incorporated |
AFL | 137,217,000 | 99,147,000 | 24,598,000 | NA | 123,659,000 | 90.12 | 4.03 | 17.93 | NA | 20.03 | |||||||||||||||||||||||||||||||
| Lincoln National Corporation |
LNC | 281,763,000 | 103,096,000 | 17,322,000 | 15,896,000 | 114,717,000 | 40.71 | 5.95 | 6.15 | 5.64 | 30.59 | |||||||||||||||||||||||||||||||
| Genworth Financial, Inc. |
GNW | 105,297,000 | 76,228,000 | 15,328,000 | 15,027,000 | 76,267,000 | 72.43 | 4.97 | 14.56 | 14.27 | 17.01 | |||||||||||||||||||||||||||||||
| Brighthouse Financial, Inc. |
BHF | 224,192,000 | 77,384,000 | 14,580,000 | 14,580,000 | 84,195,000 | 37.55 | 5.31 | 6.50 | 6.50 | 6.41 | |||||||||||||||||||||||||||||||
| Principal Financial Group, Inc. |
PFG | 253,941,200 | 72,024,100 | 12,921,900 | 10,538,400 | 84,573,500 | 33.30 | 5.57 | 5.09 | 4.15 | 16.27 | |||||||||||||||||||||||||||||||
| Voya Financial, Inc. |
VOYA | 222,532,000 | 67,671,000 | 11,039,000 | 10,853,000 | 70,943,000 | 31.88 | 6.13 | 4.96 | 4.88 | 5.82 | |||||||||||||||||||||||||||||||
| Unum Group |
UNM | 64,013,100 | 49,174,900 | 9,574,900 | 9,236,300 | 53,121,400 | 82.99 | 5.14 | 14.96 | 14.43 | 22.49 | |||||||||||||||||||||||||||||||
| Reinsurance Group of America, Incorporated |
RGA | 60,514,818 | 43,582,957 | 9,569,535 | 9,562,535 | 52,994,677 | 87.57 | 4.55 | 15.81 | 15.80 | 46.39 | |||||||||||||||||||||||||||||||
| Torchmark Corporation |
TMK | 23,474,985 | 13,931,831 | 6,231,421 | 5,789,830 | 17,853,047 | 76.05 | 2.24 | 26.54 | 24.66 | 68.35 | |||||||||||||||||||||||||||||||
| CNO Financial Group, Inc. |
CNO | 33,110,300 | 23,534,000 | 4,847,500 | 4,847,500 | 28,611,400 | 86.41 | 4.85 | 14.64 | 14.64 | 21.22 | |||||||||||||||||||||||||||||||
| American Equity Investment Life Holding Company |
AEL | 62,030,736 | 56,425,557 | 2,850,157 | 2,850,157 | 51,734,750 | 83.40 | 19.80 | 4.59 | 4.59 | 0.28 | |||||||||||||||||||||||||||||||
| National Western Life Group, Inc. |
NWLI | 12,225,094 | 10,226,493 | 1,832,174 | 1,832,174 | 11,035,470 | 90.27 | 5.58 | 14.99 | 14.99 | 29.40 | |||||||||||||||||||||||||||||||
| Primerica, Inc. |
PRI | 12,460,703 | 6,640,409 | 1,419,101 | 1,367,588 | 3,025,105 | 24.28 | 4.68 | 11.39 | 10.98 | 99.59 | |||||||||||||||||||||||||||||||
| FBL Financial Group, Inc. |
FFG | 10,066,613 | 7,684,593 | 1,388,850 | 1,378,911 | 8,803,179 | 87.45 | 5.53 | 13.80 | 13.70 | 50.94 | |||||||||||||||||||||||||||||||
| Kansas City Life Insurance Company |
KCLI | 4,530,670 | 3,213,903 | 737,155 | 737,155 | 3,520,893 | 77.71 | 4.36 | 16.27 | 16.27 | 55.33 | |||||||||||||||||||||||||||||||
| Independence Holding Company |
IHC | 1,040,623 | 544,054 | 434,243 | 368,877 | 503,363 | 48.37 | 1.25 | 41.73 | 35.45 | 18.84 | |||||||||||||||||||||||||||||||
| Citizens, Inc. |
CIA | 1,644,453 | 1,300,790 | 223,513 | 209,928 | 1,352,180 | 82.23 | 5.82 | 13.59 | 12.77 | 94.18 | |||||||||||||||||||||||||||||||
| Security National Financial Corporation |
SNFC.A | 982,173 | 608,969 | 148,568 | 145,802 | 671,157 | 68.33 | 4.10 | 15.13 | 14.84 | 87.46 | |||||||||||||||||||||||||||||||
| UTG, Inc. |
UTGN | 406,445 | 278,257 | 110,432 | 110,432 | 359,220 | 88.38 | 2.52 | 27.17 | 27.17 | 95.68 | |||||||||||||||||||||||||||||||
| Midwest Holding Inc.** |
MDWT | 49,023 | 45,460 | 2,222 | 1,522 | 22,899 | 46.71 | 20.46 | 4.53 | 3.10 | 57.04 | |||||||||||||||||||||||||||||||
| Group Aggregate |
||||||||||||||||||||||||||||||||||||||||||
| Overall L&H Insurance Group Mean |
139,250,906 | 68,339,512 | 11,297,258 | 9,915,386 | 78,597,193 | 66.26 | 6.22 | 13.87 | 12.96 | 41.96 | ||||||||||||||||||||||||||||||||
| Overall L&H Insurance Group Median |
46,812,559 | 33,558,479 | 5,539,461 | 4,847,500 | 40,173,075 | 74.24 | 5.22 | 14.18 | 13.70 | 33.33 | ||||||||||||||||||||||||||||||||
Source: SNL Financial
| * | Note: Life Premiums LOB (%) as of 2017 Year. |
| ** | Data as of 9/30/2017 |
| 64 |
| |||
In order to form a sub-group with more similar characteristics to the Company, we then included only the companies with under $10.0 billion in equity. This resulted in a group of 14 companies ranging in total equity from $2.2 million to $9.6 billion.
Boenning notes that three of the six smaller (less than $1.0 billion in equity) companies in the Public L&H Group are traded on the OTC market. To support our generation of a meaningful number of companies in our Comparable Group, especially at the smaller size range, we have not removed companies listed on alternative (OTC) exchanges.
Independence Holding Company and Citizens, Inc. were excluded from the comparable companies due to product offerings and clientele which differ significantly from the Company. Independence Holding Company provides mostly accident and health products. Citizens, Inc. offers whole life insurance and endowment policies to high net worth and high-income residents in Latin America and the Pacific Rim.
From this sub-group we then began to examine the product offerings and diversification of each remaining comparable company. In order to refine our selection of comparable companies, we removed any company that does not generate a meaningful percentage of revenue from traditional life insurance.18 Based on this, we eliminated American Equity Investment Life Holding Company, CNO Financial Group, Inc., Fidelity & Guaranty Life, National Western Life Group, Inc, Reinsurance Group of America, Incorporated, and Unum Group. We also eliminated Midwest Holdings Inc. because the company had not filed their financial statements in a timely basis as of the date of this report. Further, Midwest Holdings Inc. had less than a $1.00 share price and extremely low market capitalization and liquidity.
| 18 | Each company’s percentage of life premiums was calculated as follows: life premiums, annuity considerations and considerations for supplementary contracts with life contingencies by line of business as a percent of total company premiums, annuity considerations and considerations for supplementary contracts with life contingencies. |
| 65 |
| |||
After making these adjustments to the Public L&H Insurance Group our screen yielded the six companies presented below (the “Comparable Group”):
Exhibit XIII
Overview of the Comparable Group
As of 12/31/2017 Unless Otherwise Noted
| Company Name |
Ticker | Exchange | Total Assets ($000) |
Total Policy Reserves ($000) |
Total Equity ($000) |
Policy Reserves / Equity (x) |
Total Equity / Assets (%) |
Net Life Insurance in Force ($000)2 |
Life Premiums LOB (%)¹ |
Annuity Premiums LOB (%)¹ |
A&H Premiums LOB (%)¹ |
|||||||||||||||||||||||||||||
| Torchmark Corporation |
TMK | NYSE | 23,182,343 | 14,069,871 | 5,820,301 | 2.42 | 25.11 | 182,408,876 | 68.35 | 1.00 | 30.64 | |||||||||||||||||||||||||||||
| Primerica, Inc. |
PRI | NYSE | 12,492,739 | 6,697,324 | 1,426,501 | 4.69 | 11.42 | 98,555,300 | 99.59 | 0.18 | 0.22 | |||||||||||||||||||||||||||||
| FBL Financial Group, Inc. |
FFG | NYSE | 10,038,793 | 7,842,679 | 1,264,187 | 6.20 | 12.59 | 49,068,018 | 50.94 | 47.79 | 0.07 | |||||||||||||||||||||||||||||
| Kansas City Life Insurance Company |
KCLI | OTCQX | 4,470,464 | 3,209,881 | 703,155 | 4.56 | 15.73 | 18,452,000 | 55.33 | 29.67 | 11.41 | |||||||||||||||||||||||||||||
| Security National Financial Corporation |
SNFC.A | NASDAQ | 982,173 | 608,969 | 148,568 | 4.10 | 15.13 | 1,698,584 | 87.46 | 12.41 | 0.13 | |||||||||||||||||||||||||||||
| UTG, Inc. |
UTGN | OTC Pink | 406,445 | 278,257 | 110,432 | 2.52 | 27.17 | 958,000 | 95.68 | 4.09 | 0.21 | |||||||||||||||||||||||||||||
| Group Aggregate |
||||||||||||||||||||||||||||||||||||||||
| Comparable Group Mean |
8,595,493 | 5,451,164 | 1,578,857 | 4.08 | 17.86 | 58,523,463 | 76.23 | 15.86 | 7.11 | |||||||||||||||||||||||||||||||
| Comparable Group Median |
7,254,629 | 4,953,603 | 983,671 | 4.33 | 15.43 | 33,760,009 | 77.91 | 8.25 | 0.21 | |||||||||||||||||||||||||||||||
| MMHC |
666,414 | 437,692 | 196,203 | 2.23 | 29.44 | 31,029,192 | 96.23 | 0.14 | 3.62 | |||||||||||||||||||||||||||||||
Source: S&P Global Market Intelligence and Company financial statements
| ¹ | Statutory metric as of 12/31/2017 representing the company at the Life Group Level, the highest level consolidated insurance company unit. For MMHC, these figures represent Fidelity Life Association, A Legal Reserve Life Insurance Company. |
| ² | Net Life Insurance in Force for MMHC represents the statutory calculation of life insurance in force excluding annuity as of the most recent year. |
While none of the companies in the Comparable Group are identical to the Company and there does not appear to be a company that is a perfectly comparable or peer company from a valuation standpoint, we believe that the Comparable Group on the whole provide a meaningful basis of financial comparison for valuation purposes, and is a useful approximation for determining how an investor might value the Company.
Summary Profiles of the Comparable Group Companies19
Torchmark Corporation (NYSE:TMK)
Torchmark Corporation provides individual life and supplemental health insurance, and annuities, to middle income households in the United States. Its life insurance products include traditional and interest sensitive whole-life insurance, term life insurance, and other life insurance; and supplemental limited-benefit health insurance products comprise cancer and accident plans, as well as Medicare Supplements plans and Medicare Part D prescription drug insurance. The company’s annuity products consist of single-premium and flexible-premium deferred annuities. The company sells its products through direct mail, Internet, television, magazine, exclusive agents, and independent agents in the United States, Canada, and New Zealand. Torchmark Corporation was founded in 1900 and is headquartered in McKinney, Texas.
| 19 | Comparable Group Companies’ business descriptions sourced from SNL Financial and Capital IQ. |
| 66 |
| |||
Primerica, Inc. (NYSE:PRI)
Primerica, Inc. distributes financial products to middle income households in the United States and Canada. The company operates in three segments: Term Life Insurance, Investment and Savings Products, and Corporate and Other Distributed Products. The Term Life Insurance segment underwrites individual term life insurance products. The Investment and Savings Products segment distributes and sells mutual funds, variable annuities, fixed annuities, and segregated funds. The Corporate and Other Distributed Products segment offers long-term care insurance products, prepaid legal services, insurance, and debt consolidation referrals, as well as mail-order student life and short-term disability benefit insurance products. Primerica, Inc. was founded in 1927 and is based in Duluth, Georgia.
FBL Financial Group, Inc. (NYSE:FFG)
FBL Financial Group, Inc., through its subsidiaries, sells individual life insurance and annuity products in the United States. The company provides whole life, term life, and universal life policies; annuity and investment products; fixed rate annuities and supplementary contracts; and a line of personal and commercial property-casualty insurance products. It also offers marketing and distribution services for the sale of mutual funds and insurance products. The company markets its products through exclusive agents and agency managers. FBL Financial Group, Inc. was founded in 1993 and is headquartered in West Des Moines, Iowa.
Kansas City Life Insurance Company (OTCQX:KCLI)
Kansas City Life Insurance Company, together with its subsidiaries, focuses on underwriting, sale, and administration of life insurance and annuity products in the United States. It operates through three segments, including; Individual Insurance and Group Insurance. The company offers individual life insurance and annuity products, such as traditional products; interest sensitive products, including universal life, variable universal life, fixed deferred annuities, and variable annuities; and variable products. It also provides group products comprising life, dental, vision, and long-term and short-term disability products, as well as offers eIndependent broker-dealer that assists in the distribution and marketing of its proprietary variable life and variable annuity
| 67 |
| |||
products through third party broker-dealers; and in the servicing of closed blocks of variable insurance business retained by the company. The company markets its products through a sales force of independent general agents, agents, group brokers, and third-party marketing arrangements in 48 states and the District of Columbia. Kansas City Life Insurance Company was founded in 1895 and is headquartered in Kansas City, Missouri.
Security National Financial Corporation (NasdaqGM:SNFC.A)
Security National Financial Corporation provides life insurance, cemetery and mortuary services, and mortgage loans. The company’s Life Insurance segment engages in selling and servicing selected lines of life insurance, annuity products, and accident and health insurance products. It also provides funeral plans and interest-sensitive life insurance, as well as other traditional life and accident, and health insurance products. This segment sells its products through direct agents, brokers, and independent licensed agents. Its Cemetery and Mortuary segment offers various funeral related services. This segment operates mortuaries and cemeteries in Utah, California, and Arizona. It sells its products and services through sales representatives. The company’s Mortgage Loans segment originates and underwrites residential and commercial loans for new construction, existing homes, and real estate projects primarily in Utah, Florida, California, Illinois, Texas, and Kansas. Security National Financial Corporation was founded in 1965 and is headquartered in Salt Lake City, Utah.
UTG, Inc. (OTCPK:UTGN)
UTG, Inc. provides individual life insurance products and services in the United States. It also offers insurance administrative services for other non-related entities. The company has a customer base consisting of policyholders, fraternal members, securities and shareholders and numbers nearly 550,000 people and is located in all 50 states. UTG, Inc. was founded in 1984 and is headquartered in Springfield, Illinois.
| 68 |
| |||
Recent Financial Comparisons
Exhibit XIV summarizes certain key financial comparisons between the Company and the Comparable Group. Financial data for the Company and the Comparable Group are shown as of for the fiscal period ended December 31, 2017.
Exhibit XIV
Financial Condition of the Comparable Group
As of 12/31/2017 Unless Otherwise Noted
| Company |
Ticker | Total Assets ($000) |
Total Policy Reserves ($000) |
Total Equity ($000) |
Tangible Equity ($000) |
Cash and Investments ($000) |
Cash & Investments / Policy Reserves (%) |
Cash and Investments / Assets (%) |
Policy Reserves / Equity (x) |
Total Equity / Assets (%) |
Tangible Equity / Assets (%) |
|||||||||||||||||||||||||||||||
| Torchmark Corporation |
TMK | 23,474,985 | 13,931,831 | 6,231,421 | 5,789,830 | 17,853,047 | 128.15 | 76.05 | 2.24 | 26.54 | 24.66 | |||||||||||||||||||||||||||||||
| Primerica, Inc. |
PRI | 12,460,703 | 6,640,409 | 1,419,101 | 1,367,588 | 3,025,105 | 45.56 | 24.28 | 4.68 | 11.39 | 10.98 | |||||||||||||||||||||||||||||||
| FBL Financial Group, Inc. |
FFG | 10,066,613 | 7,684,593 | 1,388,850 | 1,378,911 | 8,803,179 | 114.56 | 87.45 | 5.53 | 13.80 | 13.70 | |||||||||||||||||||||||||||||||
| Kansas City Life Insurance Company |
KCLI | 4,530,670 | 3,213,903 | 737,155 | 737,155 | 3,520,893 | 109.55 | 77.71 | 4.36 | 16.27 | 16.27 | |||||||||||||||||||||||||||||||
| Security National Financial Corporation |
SNFC.A | 982,173 | 608,969 | 148,568 | 145,802 | 671,157 | 110.21 | 68.33 | 4.10 | 15.13 | 14.84 | |||||||||||||||||||||||||||||||
| UTG, Inc. |
UTGN | 406,445 | 278,257 | 110,432 | 110,432 | 359,220 | 129.10 | 88.38 | 2.52 | 27.17 | 27.17 | |||||||||||||||||||||||||||||||
| Group Aggregate |
||||||||||||||||||||||||||||||||||||||||||
| Comparable Group Mean |
8,653,598 | 5,392,994 | 1,672,588 | 1,588,286 | 5,705,434 | 106.19 | 70.37 | 3.90 | 18.38 | 17.94 | ||||||||||||||||||||||||||||||||
| Comparable Group Median |
7,298,642 | 4,927,156 | 1,063,003 | 1,052,372 | 3,272,999 | 112.38 | 76.88 | 4.23 | 15.70 | 15.56 | ||||||||||||||||||||||||||||||||
| MMHC |
666,414 | 437,692 | 196,203 | 194,323 | 404,826 | 92.49 | 60.75 | 2.23 | 29.44 | 29.16 | ||||||||||||||||||||||||||||||||
Source: S&P Global Market Intelligence and Company financial statements
Members Mutual’s cash and investments figure of $404.8 million at December 31, 2017 was well below the mean and median of the Comparable Group of $5.7 billion and $3.3 billion, respectively. The Company’s total assets of $666.4 million at December 31, 2017 were significantly below both the Comparable Group’s mean of $8.7 billion and median of $7.3 billion. The Company’s total equity of $196.2 million at December 31, 2017 was within the range of the Comparable Group, but still below the Comparable Group’s mean and median total equity of $1.7 billion and $1.1 billion, respectively. The Company’s tangible equity was $194.3 million at December 31, 2017, which was below the mean and median of the Comparable Group at $1.5 billion and $1.1 billion, respectively.
The Company’s ratios of total equity to total assets and tangible equity to total assets were 29.4% and 29.2%, respectively, at December 31, 2017. These ratios significantly exceed the mean and median ratios of the Comparable Group. As noted earlier in the Appraisal report, management indicated little immediate use for the capital they will raise through the Offering, Further, the Company will not see any positive ROAE impact in the near or mid-term from any of its contemplated use of capital initiatives. These dynamics weigh on the Company’s Pro Forma Market Value and puts it further afield from the Comparable Group.
| 69 |
| |||
Exhibit XV compares the Company with the Comparable Group on selected measures of operating performance and profitability.
Exhibit XV
Operating Performance of the Comparable Group
As of and for the LTM Period Ended 12/31/2017 Unless Otherwise Noted
| Company Name |
Ticker | Total Policy Income ($000) |
Total Revenue ($000) |
Policy Income/ Equity (%) |
Net Income ($000) |
Inv. Yield (%) |
ROAA (%) |
ROAE (%) |
3 Year Average | Net Margin (%) |
||||||||||||||||||||||||||||||||||
| ROAA (%) |
ROAE (%) |
|||||||||||||||||||||||||||||||||||||||||||
| Torchmark Corporation |
TMK | 3,282,935 | 4,155,573 | 52.68 | 1,454,494 | 5.13 | 6.46 | 28.57 | 3.88 | 17.39 | 35.00 | |||||||||||||||||||||||||||||||||
| Primerica, Inc. |
PRI | 961,338 | 1,689,102 | 67.74 | 350,255 | 2.90 | 2.93 | 27.38 | 2.23 | 20.54 | 20.74 | |||||||||||||||||||||||||||||||||
| FBL Financial Group, Inc. |
FFG | 308,683 | 735,478 | 22.23 | 194,355 | 4.96 | 1.98 | 15.55 | 1.45 | 11.29 | 26.43 | |||||||||||||||||||||||||||||||||
| Kansas City Life Insurance Company |
KCLI | 293,953 | 450,702 | 39.88 | 51,541 | 4.28 | 1.15 | 7.34 | 0.76 | 4.85 | 11.44 | |||||||||||||||||||||||||||||||||
| Security National Financial Corporation |
SNFC.A | 70,412 | 276,925 | 47.39 | 14,113 | 4.94 | 1.44 | 10.22 | 1.59 | 10.99 | 5.10 | |||||||||||||||||||||||||||||||||
| UTG, Inc. |
UTGN | 7,457 | 28,734 | 6.75 | 4,813 | 5.82 | 1.19 | 4.94 | 0.62 | 2.66 | 16.75 | |||||||||||||||||||||||||||||||||
| Group Aggregate |
||||||||||||||||||||||||||||||||||||||||||||
| Comparable Group Mean |
820,796 | 1,222,752 | 39.45 | 344,929 | 4.67 | 2.53 | 15.67 | 1.76 | 11.29 | 19.24 | ||||||||||||||||||||||||||||||||||
| Comparable Group Median |
301,318 | 593,090 | 43.64 | 122,948 | 4.95 | 1.71 | 12.88 | 1.52 | 11.14 | 18.74 | ||||||||||||||||||||||||||||||||||
| MMHC |
82,873 | 115,870 | 42.24 | (8,241 | ) | 3.85 | (1.25 | ) | (4.13 | ) | (1.59 | ) | (5.03 | ) | (7.11 | ) | ||||||||||||||||||||||||||||
Source: S&P Global Market Intelligence and Company financial statements
The Company’s total revenue of $115.9 million for the fiscal period ending December 31, 2017 was within the range of the Comparable Group, but materially below the Comparable Group’s mean and median total revenue of $1.2 billion and $593.1 million, respectively. All of the companies within the Comparable Group had positive ROAA and ROAE for the fiscal period ending December 31, 2017. Members Mutual generated losses over the same period, with ROAA and ROAE that were both negative at (1.25%) and (4.13%) for the fiscal period ending December 31, 2017. Members Mutual compared unfavorably during the last three years, in terms of both ROAA and ROAE as the Company had negative returns whereas the Comparable Group medians were meaningfully positive. The Company’s total policy income of $82.9 million for the fiscal period ending December 31, 2017 was in the lower half of the range of the Comparable Group, only higher than Security National Financial Corporation and UTG, Inc. The Comparable Group’s mean and median total policy revenue were $820.8 million and $301.3 million, respectively.
Additionally, Members Mutual had an investment yield of 3.85%, which was lower than all but one company (Primerica, Inc.) in the Comparable Group (median is 4.95%) while Members Mutual’s net margin of (7.11%) was also lower than all the companies in the Comparable Group (mean is 19.24%, median is 18.74%).
| 70 |
| |||
Exhibit XV compares the Company with the Comparable Group on selected ratios commonly used as life insurance industry metrics.
Exhibit XVI
Ratio Analysis of the Comparable Group
As of and for the LTM Period Ended 12/31/2017 Unless Otherwise Noted
| Lapse & Surrender Ratio1 (%) |
Benefit Ratio (%) |
Expense Ratio (%) |
Commission Ratio (%) |
Surplus Notes/ C&S (%) |
Dividend Payout Ratio (%) |
Fixed Maturities/ Total Investments (%) |
Effective Tax Rate (%) |
|||||||||||||||||||||||||||
| Torchmark Corporation |
TMK | 21.02 | 43.31 | 16.30 | 29.41 | 4.18 | 4.91 | 95.69 | (75.56 | ) | ||||||||||||||||||||||||
| Primerica, Inc. |
PRI | 8.85 | 11.05 | 62.49 | 106.14 | 0.00 | 10.25 | 97.31 | 7.71 | |||||||||||||||||||||||||
| FBL Financial Group, Inc. |
FFG | 5.10 | 43.82 | 15.09 | 9.61 | 0.00 | 42.06 | 83.33 | (28.62 | ) | ||||||||||||||||||||||||
| Kansas City Life Insurance Company |
KCLI | 5.64 | 84.08 | 20.46 | 13.21 | 0.00 | 20.30 | 72.20 | (75.49 | ) | ||||||||||||||||||||||||
| Security National Financial Corporation |
SNFC.A | 10.01 | 55.41 | 22.10 | 24.87 | 46.92 | 0.00 | 36.49 | (87.37 | ) | ||||||||||||||||||||||||
| UTG, Inc. |
UTGN | 3.28 | 232.19 | 137.80 | 3.28 | 0.00 | 0.00 | 53.49 | (45.58 | ) | ||||||||||||||||||||||||
| Group Aggregate |
||||||||||||||||||||||||||||||||||
| Comparable Group Mean |
8.98 | 78.31 | 45.71 | 31.09 | 8.52 | 12.92 | 73.08 | (50.82 | ) | |||||||||||||||||||||||||
| Comparable Group Median |
7.24 | 49.61 | 21.28 | 19.04 | 0.00 | 7.58 | 77.76 | (60.54 | ) | |||||||||||||||||||||||||
| MMHC |
11.82 | 43.83 | 53.37 | 60.12 | 0.00 | 687.60 | 85.91 | NM | ||||||||||||||||||||||||||
Source: S&P Global Market Intelligence and Company financial statements
| ¹ | Statutory metric as of 12/31/2017 representing the company at the Life Group Level, the highest level consolidated insurance company unit. For MMHC, these figures represent Fidelity Life Association, A Legal Reserve Life Insurance Company. |
The Company’s benefit ratio for the fiscal period ended December 31, 2017 of 43.83% was lower than the Comparable Group’s mean of 78.31% and median of 49.61%. The benefit ratio includes death benefits, matured endowments, annuity benefits, accident & health benefits, guarantees, group conversions, and life contingent contract pay as a percent of premiums, annuity considerations and considerations for supplementary contracts with life contingencies. Members Mutual’s expense ratio was 53.37%, which was within the range, but above (“worse than”) the mean of 45.71% and median of 21.28% of the Comparable Group. The commission ratio for Members Mutual was 60.12%, which was within the range, but higher (“worse than”) than the Comparable Group’s mean and median of 31.09% and 19.04%, respectively.
| 71 |
| |||
V. Market Value Adjustments
General Overview
In the foregoing sections of this Appraisal, the Company’s relative operating performance is considered against the operating metrics of the Comparable Group. The Pro Forma Market Value reflects these considerations and also certain, additional market valuation adjustments relative to the Comparable Group. This section of the Appraisal identifies such categories of market value adjustments and how the adjustments impact the Company’s Pro Forma Market Value. Relative to the Comparable Group, the valuation adjustments in this Section are made from the viewpoints of potential investors, which could include policyholders with subscription rights and unrelated third parties, who could acquire the stock of the subject company. It is assumed that these potential investors are aware of all relevant and necessary facts as they would pertain to the value of the Company relative to other publicly-traded insurance companies and relative to alternative investments.
The concluded Valuation Range is predicated on the assumption that the current operating environment will continue for the Company and the insurance industry in general. Changes in the Company’s operating performance along with changes in the regional and national economies, the stock market, interest rates, the regulatory environment, and other external factors may occur from time to time, often with great unpredictability, which could materially impact the Pro Forma Market Value of the Company or the trading market values of insurance company stocks in general. Therefore, the Valuation Range provided herein is subject to a re-evaluation prior to the actual completion of the Offering.
The market value adjustments, which are based on certain financial and other criteria, include among others:
| • | Relative size; |
| • | Profitability and earnings prospects; |
| • | Strength and depth of management; |
| • | Liquidity of the issue; |
| 72 |
| |||
| • | Subscription interest; |
| • | Stock market conditions; |
| • | Dividend outlook; and |
| • | New issue risks. |
In prior insurance industry subscription rights conversion appraisals (essentially all were non-life companies), market value adjustments encompassing many of the criteria noted above have ranged from 15% to almost 70% at the midpoint. The table below is provided for informational purposes only, but shows the absolute range of the discount midpoint of other similar transaction with a median midpoint discount of 42.0%.
| Company Name |
Year Date |
Discount Midpoint |
||||||
| Nodak Mutual Insurance Company |
2017 | 40.0 | % | |||||
| Illinois Casualty Company |
2017 | 45.0 | % | |||||
| Standard Mutual Insurance Company |
2016 | 40.0 | % | |||||
| ARI Mutual Insurance Company |
2015 | 45.0 | % | |||||
| First Nonprofit Insurance Company |
2012 | 34.0 | % | |||||
| Penn Millers Holding Corporation |
2009 | 25.0 | % | |||||
| Eastern Insurance Holdings, Inc. (Educators) |
2006 | 42.0 | % | |||||
| Fremont Michigan Insuracorp, Inc. (est) |
2004 | 58.0 | % | |||||
| Mercer Insurance Group |
2003 | 46.0 | % | |||||
| NCRIC Group, Inc. (est) |
2003 | 15.0 | % | |||||
| American Physicians Capital, Inc. |
2000 | 36.0 | % | |||||
| MEEMIC Holdings, Inc. (est) |
1999 | 67.0 | % | |||||
| Old Guard Group, Inc. |
1997 | 45.0 | % | |||||
| Median |
42.0 | % | ||||||
Discounts for the transactions noted above are estimates based on information available in public filings.
Size Disadvantage
Larger companies with greater resources frequently are able to be more competitive given their access to marketing and management talent, economics of scale, sophistication and greater diversification in underwriting. Additionally, greater size may offer increased investor protection in the event of extraordinary events and unforeseen losses.
| 73 |
| |||
Members Mutual’s assets as of December 31, 2017 were $666.4 million, approximately 90.9% less than the Comparable Group median of $7.3 billion. Members Mutual’s total revenue for the fiscal period ending December 31, 2017 of $115.9 million is substantially less than the Comparable Group median of $593.1 million, which also indicates a much smaller company than the Comparable Group. Members Mutual is larger than the smallest (in terms of total equity) two companies in the Comparable Group, but much smaller than the largest four companies in the group.
As such, a downward adjustment is warranted as compared to the Comparable Group.
Profitability and Earnings Prospects
An investor comparing the Company to the Comparable Group would consider both recent profit trends and future earnings prospects of the Company. Profitability and earnings prospects are reflective of, and dependent upon a company’s ability to grow revenue and control expenses. An investor’s analysis would incorporate revenue growth prospects as well as profitability expectations, and the related risk of achieving the expected results.
In determining the Company’s future earnings prospects and related risks, an investor would consider the Company’s historical performance and estimated future performance as well as its likelihood of achieving such future performance. The Company has not produced meaningful GAAP net income in its current form, nor does management forecast so for the next few years. The Plan is predicated on the Company’s ability to execute its business plan, raise capital, add personnel, expand, and achieve profitability.
We do not believe investors would place much weight on the Company’s forecast and earnings prospects relative to the Comparable Group’s prospects because the plans are dependent upon the Company’s ability to obtain and effectively deploy capital and effect its expansion plan, all which are speculative in nature.
| 74 |
| |||
Since 2015 the Company has demonstrated a slight increase in revenue. The Company’s revenue increased from $108.3 million for the fiscal year ended 2015 to $115.9 million in 2017, representing an increase of 7.0%, Generation of leads is a critical component to the long-term growth of premium revenue and success of the Company. Comparatively, revenue growth for the Comparable Group over the same time period ranged from (1.2%) to 20.3%, with a mean of 5.5% and a median of 2.0%. Only two of the companies in the Comparable Group, Security National Financial Corporation and UTG, Inc., experienced revenue declines over the same period.
Revenue growth aside, Members Mutual’s profitability, as measured by net income, drastically underperformed all of the companies in the Comparable Group. Members Mutual’s net income margin was negative and substantially lower than the Comparable Group’s mean and median net income margins of 18.74% and 19.33%, respectively. Over the past three years, the Comparable Group had average net income margins of 12.87% compared to Members Mutual’s average net income margin of (7.11%).
The Company’s lack of profitability and underperformance relative to the Comparable Group can also be seen in terms of ROAA and ROAE. The Company’s ROAA was negative at 1.25% for the fiscal period ended December 31, 2017, compared to the Comparable Group’s mean and median of 2.54% and 1.71%, respectively. Similarly, the Company’s ROAE was negative at 4.13% for the fiscal period ended December 31, 2017 compared to the Comparable Group’s positive mean and median of 15.49% and 12.88%, respectively.
The Company’s level of underperformance is even more acute compared to the two worst performing (of six) members of the Comparable Group based on its December 31, 2017 ROAA and ROAE of (1.25%) and (4.13%), respectively. This group, which includes Kansas City Life Insurance Company and UTG, Inc. had a median ROAA and ROAE at December 31, 2017 of 0.13% and 5.84%, respectively, outperforming the Company’s results, but dramatically lagging the four better performing members of the Comparable Group by 54.1% on ROAA and 72.4% on ROAE. Thus the Company’s lack of profitability stands in stark contrast to the better performing members of the Comparable Group and even underperforms the worst performers of the Comparable Group. Further, the Company has not produced meaningful GAAP net income in its
| 75 |
| |||
current form, nor does management forecast so in the near term. The Offering will add additional equity to the Company further depressing a nominal or negative ROAE relative to its peers.
Based on this ROAA and ROAE analysis, of particular note is the median price-to-book ratio of the two worst performers of the Comparable Group being 66.3%, which is a discount of 52.8% compared to the median of the four better performing companies in the Comparable Group and a 34.9% discount to the overall median of the Comparable Group including all six constituents. Therefore, it would appear that those companies which produce lower returns/profitability exhibit lower price-to-book value ratios. Members Mutual’s worse performance relative to the poorer performers in the Comparable Group is an important factor in determining the appropriate discount for earnings/profitability and supports a price-to-book ratio lower than the 66.3% indicated by the poorer performing members of the Comparable group. Additional detail is outlined in Exhibit XVIII.
The Conversion will result in additional capital invested in the Company. As discussed earlier, identified use of capital initiatives will not only result in near-term improvements to ROAE and further will also not be sufficient to absorb all the capital raised. These dynamics could lead to potential investors’ perception of “excess” or unproductive capital and reduce their overall interest in considering to participate in the Offering.
As such, a downward adjustment is warranted as compared to the Comparable Group.
Management
A management team’s primary charge is to articulate and implement a strategic plan, which includes creating value through revenue growth, profit, risk mitigation and the efficient utilization of resources. The financial characteristics of the Company and a review of its strategic plans suggest that senior management and the board of directors have professionally managed the enterprise, and have implemented its new business model. We believe investors will consider that the Company’s management is comprised of a team of experienced insurance executives with practical knowledge in all of the key areas of the Company’s operations, and that they have
| 76 |
| |||
developed a detailed, strategic growth plan. To this end, the Company has experienced a level of turnover among the senior members of its management team, particularly at eFinancial. Turnover can create a disruptive environment for the Company and a dilutive effect on the institutional knowledge of the Company.
Each of these are important considerations given that the Company is a smaller insurer, and that smaller life insurers are often at a competitive disadvantage in terms of economies of scale and attracting management teams.
Given these factors, relative to its publicly traded peers, a neutral adjustment is warranted.
Liquidity of the Issue
The development of a public market depends upon the presence in the marketplace of a sufficient number of willing buyers and sellers at any given time and the existence of market makers to facilitate stock trade transactions. Therefore, stock liquidity is predicated upon the development of a broad, efficient marketplace for given security.
Each of the six companies in the Comparable Group are listed and traded on major stock exchanges or over-the-counter bulletin boards. Three are listed on the New York Stock Exchange, one is listed on the NASDAQ, and the remaining two are traded OTC. We assume the Company would trade on the NASDAQ based on its total market capitalization. It should be noted that a partial discount for a lack of liquidity is implicit in the companies in the Comparable Group, given that such companies exhibit a median average weekly trading volume over the last month of 0.58% of shares outstanding while the median for the Public L&H Insurance Group is 2.58%.
There is no assurance that an established and liquid market for the Common Stock will develop or that the Company would continually meet listing requirements. We note that a public listing of Members Mutual, given reasonable valuation assumptions, would result in a company that falls solidly around the median of the Comparable Group based on pro forma equity. Thus, the resulting relative market value of Members Mutual’s Common Stock compared to the insurers
| 77 |
| |||
in the Comparable Group would lead us to conclude that it is reasonable that liquidity will be no better or no worse than the group. However, simultaneously, we recognize that it may take some time for investors, analysts, brokers, and market makers to understand and begin following Members Mutual in a manner similar to the companies in the Comparable Group and in the immediate and short-term would likely result in a less liquid market post-offering than the Comparable Group.
As such, we believe a downward adjustment is appropriate to address these factors.
Subscription Interest
The subscription interest market value adjustment endeavors to give effect to the level of investors’ confidence that an Offering will be successful and is required by 5/59.1(6)(f) which states:
(f) Total price of stock. The plan shall set the total price of the capital stock equal to the estimated pro forma market value of the converted stock company based upon an independent evaluation by a qualified person. The pro forma market value may be the value that is estimated to be necessary to attract full subscription for the shares as indicated by the independent evaluation.
To gain insight, an investor would look to similar, previous offerings and also consider the particular attributes of the Plan and the external environment for capital offerings.
While mutual-to-stock conversions are commonplace in the savings institution industry (in prior years, IPOs of savings institution stocks have attracted a significant investor interest), such conversions and demutualizations are far less common in the insurance industry, Our understanding of previous insurance demutualizations (all were property & casualty companies (“P&C”), not life insurance companies), which include Old Guard, Mercer, Eastern, NODAK and Penn Millers, is that all were oversubscribed, although purchasers with subscription rights for Eastern, NODAK and Penn Millers common stock did not purchase enough stock to reach the pro forma Valuation Range, and a community offering was required.
| 78 |
| |||
There were nine announced savings bank conversion offerings in 2017 at a mean and median price/book of 82.3% and 71.6%, respectively.
More directly, the life industry has been experiencing a challenging market, characterized by a historically low rate environment hurting fixed income investment yield levels coupled with a middle class who does not prioritize the need for life insurance coverage. These characteristics are reflected in the price-to-book value of the life insurance industry at 94.5% as of April 11, 2018.
Conversely, there have been a limited number of demutualizing insurance companies using the subscription rights method (again, all non-life companies), which have attracted varying degrees of investor interest.
While precedent subscription rights demutualization outcomes would typically provide a reasonable level of confidence to potential investors of the likelihood that the Offering can be successfully completed, there have only been a limited number of such transactions and almost all involved non-life companies. Members Mutual will also be the first traditional life insurance company to convert as a subscription rights conversion transaction. We also believe the Offering would also be the largest subscription rights conversion yet completed in the insurance industry. As such, no exact precedents exist to be used as examples for valuation purposes and several novel risks are present. We cannot draw conclusions as to how this process will be received by the policyholders and the public. Due to the novel nature of the offering, policyholders may show little interest because they may not fully understand what they are purchasing or because they may not have a strong affinity with their life insurer. Such a lack of affinity could be particularly acute with policyholders who purchased coverage via phone or the internet as these avenues can be less personal in nature. Additionally, the Company’s policyholder base is comprised of “Middle America” which by definition has less disposable or investable income than more affluent demographics. In this way, the Company’s policyholders are potentially less likely to participate in an offering than those in a large insurer which cross-sells other financial products to its clients having greater net worth. Also, the Company’s 400+ group policyholders are mainly small and
| 79 |
| |||
medium-sized companies which might not typically invest in IPOs / stock offerings. Their participation is uncertain and could be extremely limited.
Somewhat countering the above-listed forces, Raymond James and Griffin Financial (the “Underwriters”) have been engaged by Members Mutual as financial advisors in connection with the Offering of the Common Stock. The Underwriters will assist the Company with the solicitation of purchase orders for shares of Common Stock in the subscription offering and arrange a community offering or Standby Purchaser. Management indicated there is also the potential that a small number of “professional investors” have purchased insurance policies in recent years due to rumors about the Company’s potential demutualization.
Given the aforementioned numerous uncertainties, a discount in excess of a standard new issue discount should be applied to induce potential shareholders to purchase shares and attract a full subscription.
Stock Market Conditions
Table 6 summarizes the recent performance of various insurance stock indexes maintained by SNL Financial, along with selected other industry and broader market indexes. The SNL Insurance Index of all publicly-traded insurance companies returned 10.74% over the twelve-month period ended April 11, 2018. The SNL U.S. Insurance L&H Index lagged by 10.73% with a 0.01% return over the same period. Both the SNL Insurance Index and SNL U.S. Insurance L&H Index lagged behind the broader market indices. This is reflected by the performance of the Standard & Poor’s 500 and Russell 3000, which returned 12.25% and 12.24%, respectively, over the last year.
| 80 |
| |||
Table 6
Selected Stock Market Index Performance
As of April 11, 2018
| Total Return (%) | ||||||||||||
| Close | YTD | 1 Year | ||||||||||
| SNL Insurance Indexes |
||||||||||||
| SNL U.S. Insurance |
980.79 | (4.97 | ) | 10.74 | ||||||||
| SNL U.S. Insurance Underwriter |
970.24 | (5.16 | ) | 10.94 | ||||||||
| SNL U.S. Insurance Broker |
1,500.93 | (2.21 | ) | 9.28 | ||||||||
| S&P Insurance |
386.39 | (2.68 | ) | 6.79 | ||||||||
| NASDAQ Insurance |
8,226.91 | (3.15 | ) | 0.68 | ||||||||
| S&P Insurance Brokers |
652.09 | 3.44 | 14.64 | |||||||||
| S&P Multi-line Insurance |
107.21 | (7.88 | ) | (5.41 | ) | |||||||
| SNL Sector Indexes |
||||||||||||
| SNL U.S. Insurance Multiline |
198.05 | (12.17 | ) | 7.64 | ||||||||
| SNL U.S. Insurance L&H |
937.12 | (8.80 | ) | 0.01 | ||||||||
| S&P L&H |
384.36 | (8.85 | ) | 1.78 | ||||||||
| SNL U.S. Insurance P&C |
921.78 | 0.00 | 9.89 | |||||||||
| S&P P&C |
549.76 | 1.88 | 14.04 | |||||||||
| SNL U.S. Reinsurance |
1,263.73 | 14.52 | 8.06 | |||||||||
| SNL U.S. Managed Care |
3,232.72 | (1.92 | ) | 31.44 | ||||||||
| SNL U.S. Title Insurer |
1,763.47 | (0.20 | ) | 11.43 | ||||||||
| SNL U.S. Mortgage & Finl Guaranty |
90.01 | (12.68 | ) | (3.58 | ) | |||||||
| SNL Asset Size Indexes |
||||||||||||
| SNL U.S. Insurance < $250M |
1,197.47 | (4.82 | ) | 22.55 | ||||||||
| SNL U.S. Insurance $250M-$500M |
522.65 | (18.59 | ) | (2.85 | ) | |||||||
| SNL U.S. Insurance $500M-$1B |
1,098.48 | 2.46 | 20.01 | |||||||||
| SNL U.S. Insurance $1B-$2.5B |
2,172.34 | 3.70 | 14.59 | |||||||||
| SNL U.S. Insurance $2.5B-$10B |
1,214.86 | (5.83 | ) | 9.50 | ||||||||
| SNL U.S. Insurance > $10B |
921.07 | (5.21 | ) | 10.94 | ||||||||
| SNL U.S. Insurance > $1B |
1,008.22 | (5.17 | ) | 10.90 | ||||||||
| SNL U.S. Insurance < $1B |
1,269.15 | (4.32 | ) | 14.94 | ||||||||
| SNL Market Cap Indexes |
||||||||||||
| SNL Micro Cap U.S. Insurance |
233.21 | (10.68 | ) | (8.83 | ) | |||||||
| SNL Small Cap U.S. Insurance |
1,008.88 | 3.96 | 20.05 | |||||||||
| SNL Mid Cap U.S. Insurance |
694.01 | (3.22 | ) | 8.68 | ||||||||
| SNL Large Cap U.S. Insurance |
907.37 | (6.41 | ) | 11.99 | ||||||||
| Broad Market Indexes |
||||||||||||
| S&P 500 |
2,642.19 | (1.99 | ) | 12.25 | ||||||||
| S&P Mid-Cap |
1,882.09 | (1.84 | ) | 9.43 | ||||||||
| S&P Small-Cap |
951.53 | 0.91 | 13.71 | |||||||||
| S&P Financials |
454.47 | (1.98 | ) | 16.93 | ||||||||
| SNL All Financial Institutions |
974.12 | (3.15 | ) | 14.71 | ||||||||
| MSCI US IMI Financials |
1,672.57 | (1.60 | ) | 15.51 | ||||||||
| Russell 1000 |
1,465.45 | (1.91 | ) | 12.23 | ||||||||
| Russell 2000 |
1,546.81 | (0.21 | ) | 12.34 | ||||||||
| Russell 3000 |
1,567.50 | (1.78 | ) | 12.24 | ||||||||
| MSCI AC World (USD) |
509.43 | (1.42 | ) | 13.86 | ||||||||
Source: SNL Financial
| 81 |
| |||
Stock market performance is factored into the liquidity of issue discount and stock market volatility is factored into new issue discount. Therefore, we conclude that no adjustment is warranted for the stock market conditions.
Dividend Outlook
When reviewing a company from an investment perspective, investors will consider a company’s capital base and its ability to pay future dividends. The payment of dividends on common stock will be subject to determination and declaration by a company’s board of directors and generally depends upon its financial condition, operating results, liquidity requirements, market opportunities, capital requirements of subsidiaries, legal requirements and regulatory constraints.
Four of the six companies in the Comparable Group currently pay regular dividends and 15 companies of the Public L&H Insurance Group regularly pays dividends. The mean of current dividend yields for the Comparable Group and the Public L&H Insurance Group were 1.59% and 1.55%, respectively. Companies with new stock issues generally appear to defer dividend payments pending the post-offering determination of alternative deployment strategies and the development of seasoned trading patterns.
While there are no plans post-Offering to implement a dividend program we believe that this only puts the Company at a slight disadvantage relative to the minimal yield of the Comparable Group. Initially the Company will have no significant source of cash flow other than dividends from Efinancial and Fidelity Life, if any, and the investment earnings on any net proceeds of the offering not contributed to Efinancial or Fidelity Life. Therefore, the payment of dividends will depend significantly upon the receipt of dividends from Efinancial or Fidelity Life and the amount of net proceeds of the offering retained by Vericity that may be available for the declaration of dividends.
Therefore, we have concluded that no adjustment is warranted at the present time for purposes of dividend outlook.
| 82 |
| |||
New Issue Discount
A “new issue” discount that reflects investor concerns and investment risks inherent in all IPOs is a factor to be considered for purposes of valuing companies converting from mutual-to-stock form in the subscription rights method. The necessity to build a new issue discount into the stock price of a converting insurance company relates to uncertainty among investors. In this regard, investors are concerned about the lack of a seasoned trading history for the converting company, its operation in an intensely competitive industry, underlying concerns regarding interest rate and economic recovery trends, potential risk inherent in the stock market, and the ever-changing landscape of competitors and insurance product marketing.
We therefore believe that a downward adjustment is warranted for new issue in the pricing of the Pro Forma Market Value.
Summary of Adjustments
Based on the market value adjustments discussed above, the Pro Forma Market Value should reflect the following, valuation adjustments relative to the Comparable Group:
| Adjustments |
||||
| Size |
Downward | |||
| Earnings prospects |
Downward | |||
| Management |
Neutral | |||
| Liquidity of issue |
Downward | |||
| Subscription interest |
Downward | |||
| Stock market conditions |
Neutral | |||
| Dividend outlook |
Neutral | |||
| New issue |
Downward | |||
Individual discounts and premiums are not necessarily additive and may, to some extent, offset or overlay each other. As an initial point, we conclude that the Company’s pro forma valuation should be discounted relative to the worst performers of the Comparable Group given the Company’s underperformance compared to these members of this. As a reference, this worse performing subgroup’s median price-to-book of 66.3% is a discount of 52.8% compared to the
| 83 |
| |||
better performing peer group (140.4%) and a discount of 34.9% compared to the median price-to-book of the overall group (101.8%) inclusive of all six companies.
Upon consideration of the Comparable Group date as well as the important differences between Members Mutual and the Comparable Group (discussed above and taken as a whole), we have concluded that a discount range of approximately 50% to 60% at the midpoint based on the price-to-book valuation metric is reasonable and appropriate for determining the Pro Forma Market Value relative to the Comparable Group’s trading ratios.
Valuation Approach
In determining the Pro Forma Market Value of the Company, we have employed the comparable market valuation approach and considered the following pricing ratios: price-to-book value per share (“P/B”), price-to-earnings per share (“P/E”), price-to-assets (“P/A”), price-to-revenue per share (“P/R”) and price-to-tangible book value per share (“P/TB”). We believe price-to-book value is the primary determinant of an investor’s interest in a subscription rights conversion of an insurance company. The other multiples mentioned above (P/E, P/A, P/R and P/TB) are of secondary value in determining interest in, and, the value of, a subscription rights conversion. Displayed below are the trading market price valuation ratios of the Comparable Group as of April 11, 2018 and value for Members Mutual. Exhibits XIX and XX display the pro forma assumptions and calculations utilized in analyzing the Company’s valuation ratios. In reaching our conclusions, we evaluated the relationship of the Company’s pro forma valuation ratios relative to the Comparable Group’s market valuation data.
| 84 |
| |||
Exhibit XVIII
Comparative Market Valuation Analysis
As of and for the LTM Period Ended 12/31/2017
| 4/11/2018 Closing Price ($ ) |
Market Value $MM |
Price/ Book (%) |
Price/ Tangible Book (%) |
Price/ LTM EPS (x) |
Price/ LTM Revenue (x) |
Price/ Total Assets (%) |
Pro forma Equity/ Assets (%) |
Current Dividend Yield (%) |
||||||||||||||||||||||||||||
| MMHC Fully Converted |
||||||||||||||||||||||||||||||||||||
| Pro Forma Valuation Minimum |
10.00 | 148.8 | 46.40 | 46.66 | NM | 1.25 | 18.81 | 40.54 | 0.00 | |||||||||||||||||||||||||||
| Pro Forma Valuation Midpoint |
10.00 | 175.0 | 50.89 | 51.18 | NM | 1.46 | 21.50 | 42.24 | 0.00 | |||||||||||||||||||||||||||
| Pro Forma Valuation Maximum |
10.00 | 201.3 | 54.82 | 55.10 | NM | 1.67 | 24.03 | 43.84 | 0.00 | |||||||||||||||||||||||||||
| Comparable Group Mean |
2,682.6 | 128.79 | 132.96 | 10.05 | 1.87 | 21.83 | 17.86 | 1.14 | ||||||||||||||||||||||||||||
| Comparable Group Median |
1,088.1 | 101.77 | 102.23 | 8.61 | 2.32 | 18.95 | 15.43 | 0.90 | ||||||||||||||||||||||||||||
| Comparable Group |
||||||||||||||||||||||||||||||||||||
| Torchmark Corporation |
83.42 | 9,495.0 | 153.41 | 165.11 | 6.83 | 2.25 | 40.86 | 25.11 | 0.76 | |||||||||||||||||||||||||||
| Primerica, Inc. |
96.55 | 4,254.4 | 301.07 | 312.41 | 12.69 | 2.44 | 34.05 | 11.42 | 1.04 | |||||||||||||||||||||||||||
| FBL Financial Group, Inc. |
70.85 | 1,759.8 | 127.46 | 128.38 | 9.14 | 2.39 | 17.51 | 12.59 | 2.65 | |||||||||||||||||||||||||||
| Kansas City Life Insurance Company |
43.00 | 416.4 | 56.49 | 56.49 | 8.08 | 0.93 | 9.31 | 15.73 | 2.40 | |||||||||||||||||||||||||||
| Security National Financial Corporation |
5.38 | 86.7 | 58.22 | 59.32 | 6.18 | 0.31 | 8.83 | 15.13 | 0.00 | |||||||||||||||||||||||||||
| UTG, Inc. |
25.00 | 83.1 | 76.08 | 76.08 | 17.36 | 2.88 | 20.39 | 27.17 | 0.00 | |||||||||||||||||||||||||||
| Performing median (n = 4) |
3,007.07 | 140.43 | 146.74 | 7.98 | 2.32 | 25.78 | 13.86 | 0.90 | ||||||||||||||||||||||||||||
| Poor performing median (n = 2) |
249.75 | 66.28 | 66.28 | 12.72 | 1.91 | 14.85 | 21.45 | 1.20 | ||||||||||||||||||||||||||||
| Discount of poor to performing |
52.80 | 54.83 | -59.34 | 17.91 | 42.39 | -54.76 | -33.69 | |||||||||||||||||||||||||||||
Source: SNL Financial and Company financial statements
"Poor Performing" defined as companies with less than 1% ROAA 8% ROAE on a 3-year average basis
Note: Data as of 12/31/2017 other than stock price, market capitalization, P/BV, P/TBV and P/LTM EPS.
As of April 11, 2018, the mean and median P/B ratios for the Comparable Group were 128.8% and 101.8%, respectively. Given this wide spread in the mean and median, Boenning has considered the influence on the resulting discounts noted below as it relates to our determination of the pro forma midpoint value. In consideration of the foregoing analysis along with the additional adjustments discussed in this Section and the assumptions summarized in Exhibit XIX and XX, we have determined a pro forma midpoint value of $175.0 million for the Company on a fully-converted basis, which implies an aggregate midpoint pro forma P/B ratio of 51%.
The Company’s pro forma P/B valuation ratio reflects a discount to the Comparable Group’s 101.8% median ratio of 50.0% at the valuation midpoint. The Company’s pro forma P/B valuation ratio reflects a discount to the Comparable Group’s mean ratio of 128.8%, measuring 60.3% at the valuation midpoint.
Based on the P/A measure, the Company’s pro forma midpoint valuation of $175.0 million reflects a P/A ratio of 21.5%. The Company’s pro forma P/A valuation ratio reflects a premium to the Comparable Group’s median ratio of 19.0%, measuring a premium of 13.4% at the valuation
| 85 |
| |||
midpoint. The Company’s P/A valuation ratio reflects a discount to the Comparable Group’s 21.8% mean ratio of 1.5% at the valuation midpoint.
Based on the P/R measure, the Company’s pro forma midpoint valuation of $175.0 million reflects a P/R ratio of 1.46x. The Company’s pro forma P/R valuation ratio reflects a discount to the Comparable Group’s mean ratio of 1.87x, measuring a discount of (22.0%) at the valuation midpoint. The Company’s P/R valuation ratio reflects a discount to the Comparable Group’s 2.32x median ratio of (37.2%) at the valuation midpoint.
Based on the P/TB measure, the Company’s pro forma midpoint valuation of $175.0 million reflects a P/TB ratio of 51%. The Company’s pro forma P/TB valuation ratios reflects discounts to the Comparable Group’s mean ratio of 133.0%, measuring 61.5% at the valuation midpoint. The Company’s P/TB valuation ratio reflects a discount to the Comparable Group’s 102.2% median ratio of 49.9% at the valuation midpoint.
Boenning believes the P/E metric is not a useful tool for comparison in this Appraisal due to the Company reporting negative earnings for the LTM period as well as the impact of growth on net income relative to the Comparable Group. For this reason, a P/E comparative analysis would not be meaningful.
In our opinion, these levels of discounts are appropriate to reflect the previously discussed adjustments for size, management, earnings prospects, liquidity of the issue, subscription interest, and the new issue discount. Moreover, this discount to the Comparable Group P/B ratio of approximately 55% at the midpoint of our discount range (50%-60%) results in a price-to-pro forma book value ratio (50.9%) that represents a discount of 23.2% to the 66.3% median P/B ratio of the two (of six) worst performing members of the Comparable Group and a discount of 46.2% to the overall life insurance industry P/B ratio median of 94.5%, as noted earlier in Section III. The Company’s ability to deploy the excess capital requires the sustained current levels of growth while profitability requires dramatic improvements in returns on both assets and equity.
| 86 |
| |||
Valuation Conclusion
It is our opinion that, as of April 11, 2018, the Pro Forma Market Value of the Company is $175.0 million, and the Pro Forma Market Value was within the range of $148.8 to $201.3 million. The Valuation Range was based upon a fifteen percent decrease from the midpoint of the Pro Forma Market Value to determine the minimum and a fifteen percent increase from the Pro Forma Market Value to establish the maximum. Exhibits XIX and XX show the assumptions and calculations utilized in determining the Pro Forma Market Value and Valuation Range. In determining the Pro Forma Market Value of the Company, we have taken in consideration and we have adhered to the requirements specifically set forth in Sections 59.1, in particular subsection 59.1(6)(f). Boenning utilized the valuation standard of minority interest, freely traded within the context of Section 59.1.
| 87 |
| |||
EXHIBIT I
STATEMENT OF GENERAL ASSUMPTIONS AND LIMITING CONDITIONS
This Appraisal is subject to the following general assumptions and limiting conditions.
| 1. | No investigation has been made of, and no responsibility is assumed for, the legal description of the property being valued or legal matters, including title or encumbrances. Title to the properly is assumed to be good and marketable unless otherwise stated. The property is assumed to be free and clear of any liens, easements or encumbrances unless otherwise stated. |
| 2. | Information furnished by others, upon which all or portions of this analysis is based, is believed to be reliable, but has not been verified except as set forth in this Appraisal. No warranty is given as to the accuracy of such information. |
| 3. | This Appraisal has been made only for the purpose stated and shall not be used for any other purpose. |
| 4. | Except as specified in our engagement letter, neither Boenning nor any individual signing or associated with this report shall be required by reason of this Appraisal to give further consultation, provide testimony, or appear in court or other legal proceeding. |
| 5. | No responsibility is taken for changes in market conditions and no obligation is assumed to revise this Appraisal to reflect events or conditions which occur subsequent to the date hereof. |
| 6. | The date to which the analysis expressed in this Appraisal apply is set forth in the letter of transmittal. Our Appraisal is based on the purchasing power of the United States dollar as of that date. |
| 7. | It is assumed that all required licenses, certificates of occupancy, consents, or other legislative or administrative authority from any local, state, or national government or private entity or organization have been or can readily be obtained or renewed. |
| 8. | Full compliance with all applicable federal, state and local zoning, use, environmental and similar laws and regulations is assumed, unless otherwise stated. |
| 9. | Competent management is assumed. |
| 10. | The Appraisal is predicated on the financial structure prevailing as of the date of this report. |
EXHIBIT II
CERTIFICATION
We certify that, to the best of our knowledge and belief:
| • | The facts and data reported by the reviewer and used in the review process are true and correct; |
| • | The analyses, opinions, and conclusions in this Appraisal are limited only by the assumptions and limiting conditions stated in this Appraisal, and are our personal, impartial and unbiased professional analyses, opinions and conclusions; |
| • | We have no present or prospective interest in the property that is the subject of this Appraisal, and we have no personal interest or bias with respect to the parties involved; |
| • | Our engagement in this assignment was not contingent upon developing or reporting predetermined results; |
| • | Our compensation is not contingent on an action or event resulting from the analyses, opinions, or conclusions in, or the use of, this report; |
| • | We have made a personal visit to the Company. |
| /s/ Anthony A. Latini, Jr. |
| Anthony A. Latini, Jr. |
| /s/ James W. Adducci |
| James W. Adducci |
Exhibit III
Overview of Boenning
Founded in 1914, Boenning & Scattergood, Inc. is one of the oldest independent securities, asset management and investment banking firms in the Mid-Atlantic region, providing individual, institutional, corporate and municipal clients a full complement of financial services including equity research, investment banking, public finance, asset management as well as equity and fixed income sales and trading.
Background of Appraisers
Anthony A. Latini, Jr., CFA – Managing Director
Tony leads the firm’s insurance practice and has over 30 years of experience with the property/casualty and life segments. His merger & acquisition transaction experience includes approximately $2 billion in transaction value and he has assisted in raising in excess of $1 billion in debt and junior capital. Prior to joining Boenning & Scattergood, Mr. Latini was Managing Director of Curtis Financial Group’s financial services industry group. He has also held positions at Berwind Financial L.P., Evans & Company, Inc. and CoreStates Financial Corp. Tony received his Bachelor of Science degree in Economics with a concentration in Finance from the Wharton School of the University of Pennsylvania. He holds the Chartered Financial Analyst designation and the FINRA Series 7, 24, 63, and 79 licenses. Tony has experience with working on subscription rights conversions and demutualizations dating to 1989.
James Adducci – Director
James has 18 years of investment banking experience working with public and private companies executing exclusive sale assignments, buy-side transactions, financings and various other strategic advisory assignments. James has completed more than 60 transactions totaling more than $1 billion in value. James has been involved with multiple deals involving companies in the insurance sector. Prior to joining Boenning in 2004, James worked in the diversified industrials group at Dresdner Kleinwort in New York where he focused on cross-border M&A transactions. James received his BA in Economics from Carleton College. He is registered with FINRA and holds the Series 7 and 63 licenses, James has experience with working on five demutualizations.
Exhibit IV
MEMBERS MUTUAL HOLDING COMPANY
Consolidated Balance Sheet - GAAP Basis
As of December 31, 2015 - 2017
| ASSETS ($000) | 2015 | 2016 | 2017 | |||||||||
| INVESTMENTS: |
||||||||||||
| Fixed maturities - available for sale - at fair value |
$ | 361,911 | $ | 339,075 | $ | 337,668 | ||||||
| Fixed maturities - trading - at fair value |
0 | 0 | 0 | |||||||||
| Equity securities - available for sale - at fair value |
379 | 379 | 109 | |||||||||
| Equity securities - trading - at fair value |
4,022 | 5,908 | 5,596 | |||||||||
| Mortgage loans (net of valuation allowances) |
29,384 | 32,295 | 42,852 | |||||||||
| Limited partnership interests |
2,104 | 1,557 | 899 | |||||||||
| Policy loans |
6,752 | 5,776 | 5,936 | |||||||||
| Other invested assets |
0 | 0 | 0 | |||||||||
|
|
|
|
|
|
|
|||||||
| Total investments |
404,552 | 384,990 | 393,060 | |||||||||
| CASH AND CASH EQUIVALENTS |
16,827 | 19,422 | 11,766 | |||||||||
| DEFERRED POLICY ACQUISITION COSTS |
86,490 | 81,233 | 82,319 | |||||||||
| ACCRUED INVESTMENT INCOME |
3,563 | 3,346 | 3,323 | |||||||||
| COMMISSIONS AND AGENT BALANCES RECEIVABLE |
1,592 | 1,093 | 2,034 | |||||||||
| CURRENT INCOME TAXES RECEIVABLE |
0 | 3,463 | 4,925 | |||||||||
| REINSURANCE RECOVERABLES |
144,218 | 146,004 | 143,915 | |||||||||
| INTANGIBLE ASSETS |
2,207 | 2,043 | 1,880 | |||||||||
| GOODWILL |
0 | 0 | 0 | |||||||||
| OTHER ASSETS |
7,438 | 12,800 | 23,192 | |||||||||
|
|
|
|
|
|
|
|||||||
| TOTAL ASSETS |
$ | 666,887 | $ | 654,394 | $ | 666,414 | ||||||
|
|
|
|
|
|
|
|||||||
| LIABILITIES AND EQUITY |
||||||||||||
| LIABILITIES: |
||||||||||||
| Future policy benefits and claims |
$ | 270,651 | $ | 290,500 | $ | 302,782 | ||||||
| Policyholder account balances |
108,153 | 103,884 | 98,899 | |||||||||
| Other policyholder liabilities |
33,444 | 30,530 | 36,011 | |||||||||
| Policyholder dividend obligation |
7,428 | 9,652 | 11,097 | |||||||||
| Deferred income tax liability |
3,255 | 0 | 0 | |||||||||
| Reinsurance liabilities and payables |
8,993 | 4,753 | 7,468 | |||||||||
| Other liabilities |
18,481 | 12,092 | 13,954 | |||||||||
|
|
|
|
|
|
|
|||||||
| Total liabilities |
450,405 | 451,411 | 470,211 | |||||||||
|
|
|
|
|
|
|
|||||||
| EQUITY: |
||||||||||||
| Retained earnings |
211,984 | 196,646 | 188,405 | |||||||||
| Accumulated other comprehensive income |
4,498 | 6,337 | 7,798 | |||||||||
|
|
|
|
|
|
|
|||||||
| Total equity Members Mutual Holding Company |
216,482 | 202,983 | 196,203 | |||||||||
| Total equity |
216,482 | 202,983 | 196,203 | |||||||||
|
|
|
|
|
|
|
|||||||
| TOTAL LIABILITIES AND EQUITY |
$ | 666,887 | $ | 654,394 | $ | 666,414 | ||||||
|
|
|
|
|
|
|
|||||||
Exhibit V
MEMBERS MUTUAL HOLDING COMPANY
Consolidated Statement of Operations - GAAP Basis
Years ended December 31, 2015 - 2017
| ($000) | 2015 | 2016 | 2017 | |||||||||
| REVENUES: |
||||||||||||
| Insurance premiums |
$ | 72,443 | $ | 78,138 | $ | 82,873 | ||||||
| Net investment income |
15,797 | 15,957 | 15,119 | |||||||||
| Total realized investment gains (losses) |
(394 | ) | 530 | 571 | ||||||||
| Earned commissions |
13,989 | 11,375 | 11,514 | |||||||||
| Other income |
6,420 | 6,999 | 5,793 | |||||||||
|
|
|
|
|
|
|
|||||||
| Total revenues |
108,255 | 112,999 | 115,870 | |||||||||
| BENEFITS AND EXPENSES: |
||||||||||||
| Life, annuity, and health claim benefits |
46,633 | 59,536 | 56,035 | |||||||||
| Interest credit to policyholder account balances |
4,235 | 3,914 | 3,776 | |||||||||
| General operating expenses |
56,129 | 58,538 | 55,912 | |||||||||
| Amortization of deferred policy acquisition costs |
12,422 | 13,018 | 10,926 | |||||||||
| Amortization of intangible assets |
210 | 164 | 163 | |||||||||
|
|
|
|
|
|
|
|||||||
| Total benefits and expenses |
119,629 | 135,170 | 126,812 | |||||||||
|
|
|
|
|
|
|
|||||||
| INCOME (LOSS) BEFORE INCOME TAXES |
(11,374 | ) | (22,171 | ) | (10,942 | ) | ||||||
| INCOME TAX EXPENSE (BENEFIT) |
(3,184 | ) | (6,833 | ) | (2,701 | ) | ||||||
|
|
|
|
|
|
|
|||||||
| NET INCOME (LOSS) |
(8,190 | ) | (15,338 | ) | (8,241 | ) | ||||||
| NET INCOME (LOSS) ATTRIBUTABLE TO MEMBERS MUTAL HOLDING COMPANY |
$ | (8,190 | ) | $ | (15,338 | ) | $ | (8,241 | ) | |||
|
|
|
|
|
|
|
|||||||
Source: MMHC GAAP Income Statement (Consolidated Audited by Deloitte & Touche LLP); Company management.
Exhibit VI
MEMBERS MUTUAL HOLDING COMPANY
Consolidated Balance Sheet - Growth Analysis GAAP Basis
As of December 31, 2015 - 2017 and CAGR
| ASSETS ($000) | 2015 | 2016 | 2017 | CAGR | ||||||||||||
| INVESTMENTS: |
||||||||||||||||
| Fixed maturities - available for sale - at fair value |
(3.88 | %) | (6.31 | %) | (0.41 | %) | (3.41 | %) | ||||||||
| Fixed maturities - trading - at fair value |
— | — | — | — | ||||||||||||
| Equity securities - available for sale - at fair value |
— | 0.00 | % | (71.24 | %) | (46.37 | %) | |||||||||
| Equity securities - trading - at fair value |
961.21 | % | 46.89 | % | (5.28 | %) | 17.96 | % | ||||||||
| Mortgage loans (net of valuation allowances) |
70.24 | % | 9.91 | % | 32.69 | % | 20.76 | % | ||||||||
| Limited partnership interests |
(48.73 | %) | (26.00 | %) | (42.26 | %) | (34.63 | %) | ||||||||
| Policy loans |
(10.00 | %) | (14.45 | %) | 2.77 | % | (6.24 | %) | ||||||||
| Real estate |
— | — | — | — | ||||||||||||
|
|
|
|
|
|
|
|
|
|||||||||
| Total investments |
(0.30 | %) | (4.84 | %) | 2.10 | % | (1.43 | %) | ||||||||
| CASH AND CASH EQUIVALENTS |
(37.03 | %) | 15.42 | % | (39.42 | %) | (16.38 | %) | ||||||||
| DEFERRED POLICY ACQUISITION COSTS |
(5.39 | %) | (6.08 | %) | 1.34 | % | (2.44 | %) | ||||||||
| ACCRUED INVESTMENT INCOME |
(1.98 | %) | (6.09 | %) | (0.69 | %) | (3.43 | %) | ||||||||
| COMMISSIONS AND AGENT BALANCES RECEIVABLE |
(80.15 | %) | (31.34 | %) | 86.09 | % | 13.03 | % | ||||||||
| CURRENT INCOME TAXES RECEIVABLE |
— | — | 42.22 | % | — | |||||||||||
| REINSURANCE RECOVERABLES |
1.04 | % | 1.24 | % | (1.43 | %) | (0.11 | %) | ||||||||
| INTANGIBLE ASSETS |
(8.67 | %) | (7.43 | %) | (7.98 | %) | (7.71 | %) | ||||||||
| GOODWILL |
— | — | — | — | ||||||||||||
| OTHER ASSETS |
39.21 | % | 72.09 | % | 81.19 | % | 76.58 | % | ||||||||
|
|
|
|
|
|
|
|
|
|||||||||
| TOTAL ASSETS |
(2.79 | %) | (1.87 | %) | 1.84 | % | (0.04 | %) | ||||||||
|
|
|
|
|
|
|
|
|
|||||||||
| LIABILITIES AND EQUITY |
||||||||||||||||
| LIABILITIES: |
||||||||||||||||
| Future policy benefits and claims |
4.60 | % | 7.33 | % | 4.23 | % | 5.77 | % | ||||||||
| Policyholder account balances |
(5.62 | %) | (3.95 | %) | (4.80 | %) | (4.37 | %) | ||||||||
| Other policyholder liabilities |
4.10 | % | (8.71 | %) | 17.95 | % | 3.77 | % | ||||||||
| Policyholder dividend obligation |
(19.71 | %) | 29.94 | % | 14.97 | % | 22.23 | % | ||||||||
| Deferred income tax liability |
(68.97 | %) | (100.00 | %) | — | (100.00 | %) | |||||||||
| Reinsurance liabilities and payables |
89.25 | % | (47.15 | %) | 57.12 | % | (8.87 | %) | ||||||||
| Other liabilities |
(24.59 | %) | (34.57 | %) | 15.40 | % | (13.11 | %) | ||||||||
|
|
|
|
|
|
|
|
|
|||||||||
| Total liabilities |
(0.89 | %) | 0.22 | % | 4.16 | % | 2.18 | % | ||||||||
|
|
|
|
|
|
|
|
|
|||||||||
| EQUITY: |
||||||||||||||||
| Retained earnings |
(3.72 | %) | (7.24 | %) | (4.19 | %) | (5.73 | %) | ||||||||
| Accumulated other comprehensive income |
(60.56 | %) | 40.88 | % | 23.06 | % | 31.67 | % | ||||||||
|
|
|
|
|
|
|
|
|
|||||||||
| Total equity Members Mutual Holding Company |
(6.52 | %) | (6.24 | %) | (3.34 | %) | (4.80 | %) | ||||||||
| Total equity |
(6.52 | %) | (6.24 | %) | (3.34 | %) | (4.80 | %) | ||||||||
|
|
|
|
|
|
|
|
|
|||||||||
| TOTAL LIABILITIES AND EQUITY |
(2.79 | %) | (1.87 | %) | 1.84 | % | (0.04 | %) | ||||||||
|
|
|
|
|
|
|
|
|
|||||||||
Source: MMHC GAAP Balance Sheet (Consolidated Audited by Deloitte & Touche LLP); Company management.
Exhibit VII
MEMBERS MUTUAL HOLDING COMPANY
Consolidated Statement of Operations - Growth Analysis GAAP Basis
Years ended December 31, 2015 - 2017 and CAGR
| ($000) | 2015 | 2016 | 2017 | CAGR | ||||||||||||
| REVENUES: |
||||||||||||||||
| Insurance premiums |
10.04 | % | 7.86 | % | 6.06 | % | 6.96 | % | ||||||||
| Net investment income |
11.76 | % | 1.01 | % | (5.25 | %) | (2.17 | %) | ||||||||
| Total realized investment gains (losses) |
(106.54 | %) | (234.52 | %) | 7.74 | % | NM | |||||||||
| Earned commissions |
2.12 | % | (18.69 | %) | 1.22 | % | (9.28 | %) | ||||||||
| Other income |
11.23 | % | 9.02 | % | (17.23 | %) | (5.01 | %) | ||||||||
|
|
|
|
|
|
|
|
|
|||||||||
| Total revenues |
2.65 | % | 4.38 | % | 2.54 | % | 3.46 | % | ||||||||
| BENEFITS AND EXPENSES: |
||||||||||||||||
| Life, annuity, and health claim benefits |
4.87 | % | 27.67 | % | (5.88 | %) | 9.62 | % | ||||||||
| Interest credit to policyholder account balances |
(6.70 | %) | (7.58 | %) | (3.53 | %) | (5.57 | %) | ||||||||
| General operating expenses |
(0.58 | %) | 4.29 | % | (4.49 | %) | (0.19 | %) | ||||||||
| Amortization of deferred policy acquisition costs |
(11.64 | %) | 4.80 | % | (16.07 | %) | (6.21 | %) | ||||||||
| Amortization of intangible assets |
(31.37 | %) | (21.90 | %) | (0.61 | %) | (11.90 | %) | ||||||||
|
|
|
|
|
|
|
|
|
|||||||||
| Total benefits and expenses |
(0.17 | %) | 12.99 | % | (6.18 | %) | 2.96 | % | ||||||||
|
|
|
|
|
|
|
|
|
|||||||||
| INCOME (LOSS) BEFORE INCOME TAXES |
NM | 94.93 | % | (50.65 | %) | (1.92 | %) | |||||||||
| INCOME TAX EXPENSE (BENEFIT) |
NM | 114.60 | % | (60.47 | %) | (7.90 | %) | |||||||||
|
|
|
|
|
|
|
|
|
|||||||||
| NET INCOME (LOSS) |
NM | NM | NM | 0.31 | % | |||||||||||
| NET INCOME (LOSS) ATTRIBUTABLE TO MEMBERS MUTAL HOLDING COMPANY |
NM | NM | NM | 0.31 | % | |||||||||||
|
|
|
|
|
|
|
|
|
|||||||||
Source: MMHC GAAP Balance Sheet (Consolidated Audited by Deloitte & Touche LLP); Company management.
Exhibit VIII
MEMBERS MUTUAL HOLDING COMPANY
Consolidated Balance Sheet - Common Size Analysis GAAP Basis
As of December 31, 2015 - 2017
| ASSETS ($000) | 2015 | 2016 | 2017 | |||||||||
| INVESTMENTS: |
||||||||||||
| Fixed maturities - available for sale - at fair value |
54.27 | % | 51.82 | % | 50.67 | % | ||||||
| Fixed maturities - trading - at fair value |
0.00 | % | 0.00 | % | 0.00 | % | ||||||
| Equity securities - available for sale - at fair value |
0.06 | % | 0.06 | % | 0.02 | % | ||||||
| Equity securities - trading - at fair value |
0.60 | % | 0.90 | % | 0.84 | % | ||||||
| Mortgage loans (net of valuation allowances) |
4.41 | % | 4.94 | % | 6.43 | % | ||||||
| Limited partnership interests |
0.32 | % | 0.24 | % | 0.13 | % | ||||||
| Policy loans |
1.01 | % | 0.88 | % | 0.89 | % | ||||||
| Real estate |
0.00 | % | 0.00 | % | 0.00 | % | ||||||
|
|
|
|
|
|
|
|||||||
| Total investments |
60.66 | % | 58.83 | % | 58.98 | % | ||||||
| CASH AND CASH EQUIVALENTS |
2.52 | % | 2.97 | % | 1.77 | % | ||||||
| DEFERRED POLICY ACQUISITION COSTS |
12.97 | % | 12.41 | % | 12.35 | % | ||||||
| ACCRUED INVESTMENT INCOME |
0.53 | % | 0.51 | % | 0.50 | % | ||||||
| COMMISSIONS AND AGENT BALANCES RECEIVABLE |
0.24 | % | 0.17 | % | 0.31 | % | ||||||
| CURRENT INCOME TAXES RECEIVABLE |
0.00 | % | 0.53 | % | 0.74 | % | ||||||
| REINSURANCE RECOVERABLES |
21.63 | % | 22.31 | % | 21.60 | % | ||||||
| INTANGIBLE ASSETS |
0.33 | % | 0.31 | % | 0.28 | % | ||||||
| GOODWILL |
0.00 | % | 0.00 | % | 0.00 | % | ||||||
| OTHER ASSETS |
1.12 | % | 1.96 | % | 3.48 | % | ||||||
|
|
|
|
|
|
|
|||||||
| TOTAL ASSETS |
100.00 | % | 100.00 | % | 100.00 | % | ||||||
|
|
|
|
|
|
|
|||||||
| LIABILITIES AND EQUITY |
||||||||||||
| LIABILITIES: |
||||||||||||
| Future policy benefits and claims |
40.58 | % | 44.39 | % | 45.43 | % | ||||||
| Policyholder account balances |
16.22 | % | 15.87 | % | 14.84 | % | ||||||
| Other policyholder liabilities |
5.01 | % | 4.67 | % | 5.40 | % | ||||||
| Deferred income tax liability |
0.49 | % | 0.00 | % | 0.00 | % | ||||||
| Reinsurance liabilities and payables |
1.35 | % | 0.73 | % | 1.12 | % | ||||||
| Other liabilities |
2.77 | % | 1.85 | % | 2.09 | % | ||||||
|
|
|
|
|
|
|
|||||||
| Total liabilities |
67.54 | % | 68.98 | % | 70.56 | % | ||||||
|
|
|
|
|
|
|
|||||||
| EQUITY: |
||||||||||||
| Retained earnings |
31.79 | % | 30.05 | % | 28.27 | % | ||||||
| Accumulated other comprehensive income |
0.67 | % | 0.97 | % | 1.17 | % | ||||||
|
|
|
|
|
|
|
|||||||
| Total equity Members Mutual Holding Company |
32.46 | % | 31.02 | % | 29.44 | % | ||||||
| Total equity |
32.46 | % | 31.02 | % | 29.44 | % | ||||||
|
|
|
|
|
|
|
|||||||
| TOTAL LIABILITIES AND EQUITY |
100.00 | % | 100.00 | % | 100.00 | % | ||||||
|
|
|
|
|
|
|
|||||||
Source: MMHC GAAP Balance Sheet (Consolidated Audited by Deloitte & Touche LLP); Company management.
Exhibit IX
MEMBERS MUTUAL HOLDING COMPANY
Consolidated Statement of Operations - Common Size Analysis GAAP Basis
Years Ended December 31, 2015 - 2017
| ($000) | 2015 | 2016 | 2017 | |||||||||
| REVENUES: |
||||||||||||
| Insurance premiums |
66.92 | % | 69.15 | % | 71.52 | % | ||||||
| Net investment income |
14.59 | % | 14.12 | % | 13.05 | % | ||||||
| Total realized investment gains (losses) |
(0.36 | %) | 0.47 | % | 0.49 | % | ||||||
| Earned commissions |
12.92 | % | 10.07 | % | 9.94 | % | ||||||
| Other income |
5.93 | % | 6.19 | % | 5.00 | % | ||||||
|
|
|
|
|
|
|
|||||||
| Total revenues |
100.00 | % | 100.00 | % | 100.00 | % | ||||||
| BENEFITS AND EXPENSES: |
||||||||||||
| Life, annuity, and health claim benefits |
43.08 | % | 52.69 | % | 48.36 | % | ||||||
| Interest credit to policyholder account balances |
3.91 | % | 3.46 | % | 3.26 | % | ||||||
| General operating expenses |
51.85 | % | 51.80 | % | 48.25 | % | ||||||
| Amortization of deferred policy acquisition costs |
11.47 | % | 11.52 | % | 9.43 | % | ||||||
| Amortization of intangible assets |
0.19 | % | 0.15 | % | 0.14 | % | ||||||
|
|
|
|
|
|
|
|||||||
| Total benefits and expenses |
110.51 | % | 119.62 | % | 109.44 | % | ||||||
|
|
|
|
|
|
|
|||||||
| INCOME (LOSS) BEFORE INCOME TAXES |
(10.51 | %) | (19.62 | %) | (9.44 | %) | ||||||
| INCOME TAX EXPENSE (BENEFIT) |
(2.94 | %) | (6.05 | %) | (2.33 | %) | ||||||
|
|
|
|
|
|
|
|||||||
| NET INCOME (LOSS) |
(7.57 | %) | (13.57 | %) | (7.11 | %) | ||||||
| NET INCOME (LOSS) ATTRIBUTABLE TO MEMBERS MUTAL HOLDING COMPANY |
(7.57 | %) | (13.57 | %) | (7.11 | %) | ||||||
|
|
|
|
|
|
|
|||||||
Source: MMHC GAAP Balance Sheet (Consolidated Audited by Deloitte & Touche LLP); Company management.
Exhibit X
FIDELITY LIFE ASSOCIATION
Statement of Condition - Statutory Basis
Years ended December 31, 2015 - 2017
| 2015 | 2016 | 2017 | ||||||||||
| ADMITTED ASSETS |
||||||||||||
| CASH AND INVESTED ASSETS: |
||||||||||||
| Bonds |
$ | 346,900,519 | $ | 319,932,703 | $ | 313,949,677 | ||||||
| Preferred stocks |
500,000 | 500,000 | 1,890,108 | |||||||||
| Common stocks |
4,400,905 | 6,286,027 | 5,705,063 | |||||||||
| Mortgage loans |
29,383,675 | 32,294,847 | 42,852,316 | |||||||||
| Real estate held for the production of income |
— | — | — | |||||||||
| Real estate held for sale |
— | — | — | |||||||||
| Contract loans |
6,752,372 | 5,775,752 | 5,935,583 | |||||||||
| Cash, cash equivalents, and short-term investments |
13,643,228 | 16,989,667 | 10,491,451 | |||||||||
| Other invested assets |
3,642,276 | 3,083,984 | 3,188,532 | |||||||||
|
|
|
|
|
|
|
|||||||
| Total cash and invested assets |
405,222,975 | 384,862,980 | 384,012,730 | |||||||||
| AMOUNTS RECOVERABLE FROM REINSURERS |
6,354,792 | 10,577,720 | 6,401,666 | |||||||||
| FEDERAL INCOME TAX RECOVERABLE |
— | — | 359,348 | |||||||||
| NET DEFERRED TAX ASSET |
— | — | — | |||||||||
| PREMIUMS DEFERRED AND UNCOLLECTED |
3,097,253 | 3,741,941 | 6,009,279 | |||||||||
| INVESTMENT INCOME DUE AND ACCRUED |
3,561,354 | 3,344,151 | 3,321,329 | |||||||||
| GUARANTEE FUND NOTE RECEIVABLE FROM AFFILIATE |
2,000,000 | 2,000,000 | 2,000,000 | |||||||||
| RECEIVABLE UNDER ACCIDENT AND HEALTH ARRANGEMENTS |
||||||||||||
| OTHER ASSETS |
960,297 | 486,916 | 4,201,143 | |||||||||
|
|
|
|
|
|
|
|||||||
| TOTAL |
$ | 421,196,671 | $ | 405,013,708 | $ | 406,305,495 | ||||||
|
|
|
|
|
|
|
|||||||
| LIABILITIES AND SURPLUS |
||||||||||||
| LIABILITIES: |
||||||||||||
| Life and annuity reserves |
$ | 222,176,104 | $ | 224,620,202 | $ | 229,890,567 | ||||||
| Deposit-type funds: |
8,699,662 | |||||||||||
| Supplemental contracts wothout life contingencies |
22,057 | 22,057 | ||||||||||
| Beneficiary account |
||||||||||||
| Dividend accumulations |
10,269,047 | 9,307,330 | ||||||||||
| Premium deposit funds |
32,861 | 27,824 | ||||||||||
| Claims and benefits payable to policyholders |
14,290,990 | 13,444,724 | 13,679,607 | |||||||||
| Amounts payable on reinsurance |
7,708,773 | 4,752,530 | 7,467,750 | |||||||||
| Interest maintenance reserve |
5,537,603 | 4,708,186 | 4,455,978 | |||||||||
| Other policyholder funds |
1,477,654 | 1,538,298 | 1,523,092 | |||||||||
|
|
|
|
|
|
|
|||||||
| Total policy liabilities |
261,515,089 | 258,421,151 | 265,716,656 | |||||||||
| Asset valuation reserve |
3,004,882 | 3,522,161 | 3,529,689 | |||||||||
| Other liabilities |
22,931,976 | 10,845,166 | 9,454,466 | |||||||||
|
|
|
|
|
|
|
|||||||
| Total liabilities |
287,451,947 | 272,788,478 | 278,700,811 | |||||||||
|
|
|
|
|
|
|
|||||||
| SURPLUS: |
||||||||||||
| Common capital stock |
2,500,000 | 2,500,000 | 2,500,000 | |||||||||
| Aggregate write-ins for other than special surplus |
||||||||||||
| Unassigned surplus |
131,244,724 | 129,725,230 | 125,104,684 | |||||||||
|
|
|
|
|
|
|
|||||||
| Total surplus |
133,744,724 | 132,225,230 | 127,604,684 | |||||||||
|
|
|
|
|
|
|
|||||||
| TOTAL |
$ | 421,196,671 | $ | 405,013,708 | $ | 406,305,495 | ||||||
|
|
|
|
|
|
|
|||||||
Source: 2015 - 2017 Statutory Regulatory Filing.
Exhibit XI
FIDELITY LIFE ASSOCIATION
Statement of Operations - Statutory Basis
Years ended December 31, 2015 - 2017
| 2015 | 2016 | 2017 | ||||||||||
| INCOME: |
||||||||||||
| Premium and annuity considerations |
$ | 69,079,087 | $ | 60,281,676 | $ | 61,051,719 | ||||||
| Net investment income |
15,932,388 | 15,987,397 | 15,290,416 | |||||||||
| Amortization of interest maintenance reserve |
1,155,196 | 846,565 | 709,622 | |||||||||
| Reinsurance ceding commissions and allowances |
37,644,478 | 30,203,366 | 32,105,487 | |||||||||
| Other income |
5,220 | 115,571 | 93,898 | |||||||||
| Total income |
123,816,369 | 107,434,575 | 109,251,142 | |||||||||
| BENEFITS AND EXPENSES: |
||||||||||||
| Death benefits |
17,006,098 | 18,158,386 | 16,643,973 | |||||||||
| Matured endowments |
1,444,207 | 963,213 | 835,474 | |||||||||
| Annuity benefits |
10,853,574 | 6,584,144 | 8,925,039 | |||||||||
| Surrender benefits |
1,200,625 | 1,890,160 | 1,059,366 | |||||||||
| Disability and accident and health benefits |
320,956 | 247,034 | 348,159 | |||||||||
| Interest on policy and contract funds |
||||||||||||
| Interest and adjustments on policy or deposit-type contracts |
421,753 | 539,309 | 441,771 | |||||||||
| Payments on supplementary contracts with life contingencies |
9,529 | 4,883 | 4,883 | |||||||||
| Increase in aggregate reserves for life policies and contracts |
5,632,776 | 2,444,096 | 5,270,365 | |||||||||
| Commissions |
36,841,378 | 31,977,806 | 36,706,252 | |||||||||
| General expenses |
33,321,531 | 32,155,346 | 32,777,134 | |||||||||
| Insurance taxes, licenses, and fees |
3,747,383 | 3,969,077 | 4,155,940 | |||||||||
| Increase in loading on deferred and uncollected premiums |
(460,691 | ) | 633,470 | 720,422 | ||||||||
| Dividends to policyholders |
1,195,673 | 1,197,201 | 1,095,636 | |||||||||
| Total benefits and expenses |
111,534,792 | 100,764,125 | 108,984,414 | |||||||||
| NET LOSS FROM OPERATIONS BEFORE FEDERAL INCOME TAXES AND REALIZED CAPITAL GAINS |
12,281,577 | 6,670,450 | 266,728 | |||||||||
| FEDERAL INCOME TAX BENEFIT |
258,000 | 1,133,166 | (708,982 | ) | ||||||||
| NET LOSS FROM OPERATIONS BEFORE REALIZED CAPITAL LOSSES |
12,023,577 | 5,537,284 | 975,710 | |||||||||
| REALIZED CAPITAL GAINS (LOSSES): |
||||||||||||
| Gross realized capital gains (losses) |
||||||||||||
| Related federal income tax expense |
||||||||||||
| Realized gains transferred to the interest maintenance reserve |
||||||||||||
| Total realized capital gains (losses) |
229,321 | (301,179 | ) | 42,318 | ||||||||
| NET INCOME (LOSS) |
$ | 12,252,898 | $ | 5,236,105 | $ | 1,018,028 | ||||||
Source: 2015 - 2017 Statutory Regulatory Filing.
Exhibit XII
| Public L&H Insurance Group As of 12/31/2017 Unless Otherwise Noted |
||||||||||||||||||||||||||||||||||||||||||
| Company Name |
Ticker | Total Assets ($000) |
Total Policy Reserves ($000) |
Total Equity ($000) |
Tangible Equity ($000) |
Cash and Investments ($000) |
Cash and Investments / Assets (%) |
Policy Reserves / Equity (x) |
Total Equity / Assets (%) |
Tangible Equity / Assets (%) |
Life Premiums LOB (%)* |
|||||||||||||||||||||||||||||||
| MetLife, Inc. |
MET | 719,892,000 | 378,810,000 | 58,870,000 | 49,280,000 | 456,768,000 | 63.45 | 6.43 | 8.18 | 6.85 | 43.66 | |||||||||||||||||||||||||||||||
| Prudential Financial, Inc. |
PRU | 832,136,000 | 411,917,000 | 54,511,000 | 53,610,000 | 484,407,000 | 58.21 | 7.56 | 6.55 | 6.44 | 36.07 | |||||||||||||||||||||||||||||||
| Aflac Incorporated |
AFL | 137,217,000 | 99,147,000 | 24,598,000 | NA | 123,659,000 | 90.12 | 4.03 | 17.93 | NA | 20.03 | |||||||||||||||||||||||||||||||
| Lincoln National Corporation |
LNC | 281,763,000 | 103,096,000 | 17,322,000 | 15,896,000 | 114,717,000 | 40.71 | 5.95 | 6.15 | 5.64 | 30.59 | |||||||||||||||||||||||||||||||
| Genworth Financial, Inc. |
GNW | 105,297,000 | 76,228,000 | 15,328,000 | 15,027,000 | 76,267,000 | 72.43 | 4.97 | 14.56 | 14.27 | 17.01 | |||||||||||||||||||||||||||||||
| Brighthouse Financial, Inc. |
BHF | 224,192,000 | 77,384,000 | 14,580,000 | 14,580,000 | 84,195,000 | 37.55 | 5.31 | 6.50 | 6.50 | 6.41 | |||||||||||||||||||||||||||||||
| Principal Financial Group, Inc. |
PFG | 253,941,200 | 72,024,100 | 12,921,900 | 10,538,400 | 84,573,500 | 33.30 | 5.57 | 5.09 | 4.15 | 16.27 | |||||||||||||||||||||||||||||||
| Voya Financial, Inc. |
VOYA | 222,532,000 | 67,671,000 | 11,039,000 | 10,853,000 | 70,943,000 | 31.88 | 6.13 | 4.96 | 4.88 | 5.82 | |||||||||||||||||||||||||||||||
| Unum Group |
UNM | 64,013,100 | 49,174,900 | 9,574,900 | 9,236,300 | 53,121,400 | 82.99 | 5.14 | 14.96 | 14.43 | 22.49 | |||||||||||||||||||||||||||||||
| Reinsurance Group of America, Incorporated |
RGA | 60,514,818 | 43,582,957 | 9,569,535 | 9,562,535 | 52,994,677 | 87.57 | 4.55 | 15.81 | 15.80 | 46.39 | |||||||||||||||||||||||||||||||
| Torchmark Corporation |
TMK | 23,474,985 | 13,931,831 | 6,231,421 | 5,789,830 | 17,853,047 | 76.05 | 2.24 | 26.54 | 24.66 | 68.35 | |||||||||||||||||||||||||||||||
| CNO Financial Group, Inc. |
CNO | 33,110,300 | 23,534,000 | 4,847,500 | 4,847,500 | 28,611,400 | 86.41 | 4.85 | 14.64 | 14.64 | 21.22 | |||||||||||||||||||||||||||||||
| American Equity Investment Life Holding Company |
AEL | 62,030,736 | 56,425,557 | 2,850,157 | 2,850,157 | 51,734,750 | 83.40 | 19.80 | 4.59 | 4.59 | 0.28 | |||||||||||||||||||||||||||||||
| National Western Life Group, Inc. |
NWLI | 12,225,094 | 10,226,493 | 1,832,174 | 1,832,174 | 11,035,470 | 90.27 | 5.58 | 14.99 | 14.99 | 29.40 | |||||||||||||||||||||||||||||||
| Primerica, Inc. |
PRI | 12,460,703 | 6,640,409 | 1,419,101 | 1,367,588 | 3,025,105 | 24.28 | 4.68 | 11.39 | 10.98 | 99.59 | |||||||||||||||||||||||||||||||
| FBL Financial Group, Inc. |
FFG | 10,066,613 | 7,684,593 | 1,388,850 | 1,378,911 | 8,803,179 | 87.45 | 5.53 | 13.80 | 13.70 | 50.94 | |||||||||||||||||||||||||||||||
| Kansas City Life Insurance Company |
KCLI | 4,530,670 | 3,213,903 | 737,155 | 737,155 | 3,520,893 | 77.71 | 4.36 | 16.27 | 16.27 | 55.33 | |||||||||||||||||||||||||||||||
| Independence Holding Company |
IHC | 1,040,623 | 544,054 | 434,243 | 368,877 | 503,363 | 48.37 | 1.25 | 41.73 | 35.45 | 18.84 | |||||||||||||||||||||||||||||||
| Citizens, Inc. |
CIA | 1,644,453 | 1,300,790 | 223,513 | 209,928 | 1,352,180 | 82.23 | 5.82 | 13.59 | 12.77 | 94.18 | |||||||||||||||||||||||||||||||
| Security National Financial Corporation |
SNFC.A | 982,173 | 608,969 | 148,568 | 145,802 | 671,157 | 68.33 | 4.10 | 15.13 | 14.84 | 87.46 | |||||||||||||||||||||||||||||||
| UTG, Inc. |
UTGN | 406,445 | 278,257 | 110,432 | 110,432 | 359,220 | 88.38 | 2.52 | 27.17 | 27.17 | 95.68 | |||||||||||||||||||||||||||||||
| Midwest Holding Inc.** |
MDWT | 49,023 | 45,460 | 2,222 | 1,522 | 22,899 | 46.71 | 20.46 | 4.53 | 3.10 | 57.04 | |||||||||||||||||||||||||||||||
| Group Aggregate |
||||||||||||||||||||||||||||||||||||||||||
| Overall L&H Insurance Group Mean |
139,250,906 | 68,339,512 | 11,297,258 | 9,915,386 | 78,597,193 | 66.26 | 6.22 | 13.87 | 12.96 | 41.96 | ||||||||||||||||||||||||||||||||
| Overall L&H Insurance Group Median |
46,812,559 | 33,558,479 | 5,539,461 | 4,847,500 | 40,173,075 | 74.24 | 5.22 | 14.18 | 13.70 | 33.33 | ||||||||||||||||||||||||||||||||
Source: SNL Financial
| * | Note: Life Premiums LOB (%) as of 2017 Year. |
| ** | Data as of 9/30/2017 |
Exhibit XIII
| Overview of the Comparable Group As of 12/31/2017 Unless Otherwise Noted |
||||||||||||||||||||||||||||||||||||||||
| Company Name |
Ticker | Exchange | Total Assets ($000) |
Total Policy Reserves ($000) |
Total Equity ($000) |
Policy Reserves / Equity (x) |
Total Equity / Assets (%) |
Net Life Insurance in Force ($000)² |
Life Premiums LOB (%)¹ |
Annuity Premiums LOB (%)¹ |
A&H Premiums LOB (%)¹ |
|||||||||||||||||||||||||||||
| Torchmark Corporation |
TMK | NYSE | 23,474,985 | 13,931,831 | 6,231,421 | 2.24 | 26.54 | 182,408,876 | 68.35 | 1.00 | 30.64 | |||||||||||||||||||||||||||||
| Primerica, Inc. |
PRI | NYSE | 12,460,703 | 6,640,409 | 1,419,101 | 4.68 | 11.39 | 98,555,300 | 99.59 | 0.18 | 0.22 | |||||||||||||||||||||||||||||
| FBL Financial Group, Inc. |
FFG | NYSE | 10,066,613 | 7,684,593 | 1,388,850 | 5.53 | 13.80 | 49,068,018 | 50.94 | 47.79 | 0.07 | |||||||||||||||||||||||||||||
| Kansas City Life Insurance Company |
KCLI | OTCQX | 4,530,670 | 3,213,903 | 737,155 | 4.36 | 16.27 | 18,452,000 | 55.33 | 29.67 | 11.41 | |||||||||||||||||||||||||||||
| Security National Financial Corporation |
SNFC.A | NASDAQ | 982,173 | 608,969 | 148,568 | 4.10 | 15.13 | 1,698,584 | 87.46 | 12.41 | 0.13 | |||||||||||||||||||||||||||||
| UTG, Inc. |
UTGN | OTC Pink | 406,445 | 278,257 | 110,432 | 2.52 | 27.17 | 958,000 | 95.68 | 4.09 | 0.21 | |||||||||||||||||||||||||||||
| Group Aggregate |
||||||||||||||||||||||||||||||||||||||||
| Comparable Group Mean |
8,653,598 | 5,392,994 | 1,672,588 | 3.90 | 18.38 | 58,523,463 | 76.23 | 15.86 | 7.11 | |||||||||||||||||||||||||||||||
| Comparable Group Median |
7,298,642 | 4,927,156 | 1,063,003 | 4.23 | 15.70 | 33,760,009 | 77.91 | 8.25 | 0.21 | |||||||||||||||||||||||||||||||
| MMHC |
666,414 | 437,692 | 196,203 | 2.23 | 29.44 | 31,029,192 | 96.23 | 0.14 | 3.62 | |||||||||||||||||||||||||||||||
Source: S&P Global Market Intelligence and Company financial statements
| ¹ | Statutory metric as of 12/31/2017 representing the company at the Life Group Level, the highest level consolidated insurance company unit. For MMHC, these figures represent Fidelity Life Association, A Legal Reserve Life Insurance Company. |
| ² | Net Life Insurance in Force for MMHC represents the statutory calculation of life insurance in force excluding annuity as of the most recent year. |
Exhibit XIV
| Financial Condition of the Comparable Group As of 12/31/2017 Unless Otherwise Noted |
||||||||||||||||||||||||||||||||||||||||||
| Company |
Ticker | Total Assets ($000) |
Total Policy Reserves ($000) |
Total Equity ($000) |
Tangible Equity ($000) |
Cash and Investments ($000) |
Cash & Investments / Policy Reserves (%) |
Cash and Investments / Assets (%) |
Policy Reserves / Equity (x) |
Total Equity / Assets (%) |
Tangible Equity / Assets (%) |
|||||||||||||||||||||||||||||||
| Torchmark Corporation |
TMK | 23,474,985 | 13,931,831 | 6,231,421 | 5,789,830 | 17,853,047 | 128.15 | 76.05 | 2.24 | 26.54 | 24.66 | |||||||||||||||||||||||||||||||
| Primerica, Inc. |
PRI | 12,460,703 | 6,640,409 | 1,419,101 | 1,367,588 | 3,025,105 | 45.56 | 24.28 | 4.68 | 11.39 | 10.98 | |||||||||||||||||||||||||||||||
| FBL Financial Group, Inc. |
FFG | 10,066,613 | 7,684,593 | 1,388,850 | 1,378,911 | 8,803,179 | 114.56 | 87.45 | 5.53 | 13.80 | 13.70 | |||||||||||||||||||||||||||||||
| Kansas City Life Insurance Company |
KCLI | 4,530,670 | 3,213,903 | 737,155 | 737,155 | 3,520,893 | 109.55 | 77.71 | 4.36 | 16.27 | 16.27 | |||||||||||||||||||||||||||||||
| Security National Financial Corporation |
SNFC.A | 982,173 | 608,969 | 148,568 | 145,802 | 671,157 | 110.21 | 68.33 | 4.10 | 15.13 | 14.84 | |||||||||||||||||||||||||||||||
| UTG, Inc. |
UTGN | 406,445 | 278,257 | 110,432 | 110,432 | 359,220 | 129.10 | 88.38 | 2.52 | 27.17 | 27.17 | |||||||||||||||||||||||||||||||
| Group Aggregate |
||||||||||||||||||||||||||||||||||||||||||
| Comparable Group Mean |
8,653,598 | 5,392,994 | 1,672,588 | 1,588,286 | 5,705,434 | 106.19 | 70.37 | 3.90 | 18.38 | 17.94 | ||||||||||||||||||||||||||||||||
| Comparable Group Median |
7,298,642 | 4,927,156 | 1,063,003 | 1,052,372 | 3,272,999 | 112.38 | 76.88 | 4.23 | 15.70 | 15.56 | ||||||||||||||||||||||||||||||||
| MMHC |
666,414 | 437,692 | 196,203 | 194,323 | 404,826 | 92.49 | 60.75 | 2.23 | 29.44 | 29.16 | ||||||||||||||||||||||||||||||||
Source: S&P Global Market Intelligence and Company financial statements
Exhibit XV
| Operating Performance of the Comparable Group As of and for the LTM Period Ended 12/31/2017 Unless Otherwise Noted |
||||||||||||||||||||||||||||||||||||||||||||
| Ticker | Total Policy Income ($000) |
Total Revenue ($000) |
Policy Income/ Equity (%) |
Net Income ($000) |
Inv. Yield (%) |
ROAA (%) |
ROAE (%) |
3 Year Average | Net Margin (%) |
|||||||||||||||||||||||||||||||||||
| Company Name |
ROAA (%) |
ROAE (%) |
||||||||||||||||||||||||||||||||||||||||||
| Torchmark Corporation |
TMK | 3,282,935 | 4,155,573 | 52.68 | 1,454,494 | 5.13 | 6.46 | 28.57 | 3.88 | 17.39 | 35.00 | |||||||||||||||||||||||||||||||||
| Primerica, Inc. |
PRI | 961,338 | 1,689,102 | 67.74 | 350,255 | 2.90 | 2.93 | 27.38 | 2.23 | 20.54 | 20.74 | |||||||||||||||||||||||||||||||||
| FBL Financial Group, Inc. |
FFG | 308,683 | 735,478 | 22.23 | 194,355 | 4.96 | 1.98 | 15.55 | 1.45 | 11.29 | 26.43 | |||||||||||||||||||||||||||||||||
| Kansas City Life Insurance Company |
KCLI | 293,953 | 450,702 | 39.88 | 51,541 | 4.28 | 1.15 | 7.34 | 0.76 | 4.85 | 11.44 | |||||||||||||||||||||||||||||||||
| Security National Financial Corporation |
SNFC.A | 70,412 | 276,925 | 47.39 | 14,113 | 4.94 | 1.44 | 10.22 | 1.59 | 10.99 | 5.10 | |||||||||||||||||||||||||||||||||
| UTG, Inc. |
UTGN | 7,457 | 28,734 | 6.75 | 4,813 | 5.82 | 1.19 | 4.94 | 0.62 | 2.66 | 16.75 | |||||||||||||||||||||||||||||||||
| Group Aggregate |
||||||||||||||||||||||||||||||||||||||||||||
| Comparable Group Mean |
820,796 | 1,222,752 | 39.45 | 344,929 | 4.67 | 2.53 | 15.67 | 1.76 | 11.29 | 19.24 | ||||||||||||||||||||||||||||||||||
| Comparable Group Median |
301,318 | 593,090 | 43.64 | 122,948 | 4.95 | 1.71 | 12.88 | 1.52 | 11.14 | 18.74 | ||||||||||||||||||||||||||||||||||
| MMHC |
82,873 | 115,870 | 42.24 | (8,241 | ) | 3.85 | (1.25 | ) | (4.13 | ) | (1.59 | ) | (5.03 | ) | (7.11 | ) | ||||||||||||||||||||||||||||
Source: S&P Global Market Intelligence and Company financial statements
Exhibit XVI
| Ratio Analysis of the Comparable Group As of and for the LTM Period Ended 12/31/2017 Unless Otherwise Noted |
||||||||||||||||||||||||||||||||||||
| Lapse & Surrender Ratio1 (%) |
Benefit Ratio (%) |
Expense Ratio (%) |
Commission Ratio (%) |
Surplus Notes/ C&S (%) |
Dividend Payout Ratio (%) |
Fixed Maturities/ Total Investments (%) |
Effective Tax Rate (%) |
|||||||||||||||||||||||||||||
| Torchmark Corporation |
TMK | 21.02 | 43.31 | 16.30 | 29.41 | 4.18 | 4.91 | 95.69 | (75.56 | ) | ||||||||||||||||||||||||||
| Primerica, Inc. |
PRI | 8.85 | 11.05 | 62.49 | 106.14 | 0.00 | 10.25 | 97.31 | 7.71 | |||||||||||||||||||||||||||
| FBL Financial Group, Inc. |
FFG | 5.10 | 43.82 | 15.09 | 9.61 | 0.00 | 42.06 | 83.33 | (28.62 | ) | ||||||||||||||||||||||||||
| Kansas City Life Insurance Company |
KCLI | 5.64 | 84.08 | 20.46 | 13.21 | 0.00 | 20.30 | 72.20 | (75.49 | ) | ||||||||||||||||||||||||||
| Security National Financial Corporation |
SNFC.A | 10.01 | 55.41 | 22.10 | 24.87 | 46.92 | 0.00 | 36.49 | (87.37 | ) | ||||||||||||||||||||||||||
| UTG, Inc. |
UTGN | 3.28 | 232.19 | 137.80 | 3.28 | 0.00 | 0.00 | 53.49 | (45.58 | ) | ||||||||||||||||||||||||||
| Group Aggregate |
||||||||||||||||||||||||||||||||||||
| Comparable Group Mean |
8.98 | 78.31 | 45.71 | 31.09 | 8.52 | 12.92 | 73.08 | (50.82 | ) | |||||||||||||||||||||||||||
| Comparable Group Median |
7.24 | 49.61 | 21.28 | 19.04 | 0.00 | 7.58 | 77.76 | (60.54 | ) | |||||||||||||||||||||||||||
| MMHC |
11.82 | 43.83 | 53.37 | 60.12 | 0.00 | 687.60 | 85.91 | NM | ||||||||||||||||||||||||||||
Source: S&P Global Market Intelligence and Company financial statements
| ¹ | Statutory metric as of 12/31/2017 representing the company at the Life Group Level, the highest level consolidated insurance company unit. For MMHC, these figures represent Fidelity Life Association, A Legal Reserve Life Insurance Company. |
Exhibit XVII
Fidelity Life Association
Investment Portfolio
Years Ended December 31, 2015 - 2017
Data displayed in $000 unless otherwise noted
| 2015 Y | 2016 Y | 2017 Y | ||||||||||
| Period Ended |
12/31/2015 | 12/31/2016 | 12/31/2017 | |||||||||
| Net Investment Income |
15,932 | 15,987 | 15,290 | |||||||||
| Realized Capital Gains |
229 | (301 | ) | 42 | ||||||||
| Unrealized Capital Gains |
(662 | ) | 640 | (179 | ) | |||||||
| Investment Portfolio Composition (%) |
||||||||||||
| Total Cash & Investments |
405,223 | 384,863 | 384,013 | |||||||||
| Affiliated Cash & Investments |
0 | 0 | 0 | |||||||||
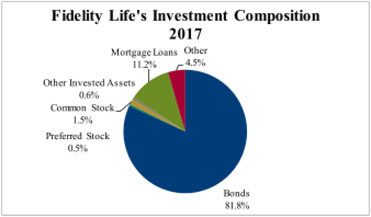
| Unaff. Bonds / Unaff. Investments |
85.57 | 83.13 | 81.76 | |||||||||
| Unaff. Preferred Stocks / Unaff. Investments |
0.12 | 0.13 | 0.49 | |||||||||
| Unaff. Common Stocks / Unaff. Investments |
1.09 | 1.63 | 1.49 | |||||||||
| Unaff. Mortgage Loans / Unaff. Investments |
7.25 | 8.39 | 11.16 | |||||||||
| Real Estate / Unaff. Investments |
0.00 | 0.00 | 0.00 | |||||||||
| Contract Loans / Unaff. Investments |
1.67 | 1.50 | 1.55 | |||||||||
| Unaff. Cash & Short Term / Unaff. Investments |
3.37 | 4.41 | 2.73 | |||||||||
| Unaff. Other Investments / Unaff. Investments |
0.94 | 0.80 | 0.83 | |||||||||
| Investment Yields by Type (%) |
||||||||||||
| Net Yield on Invested Assets |
3.98 | 4.07 | 3.99 | |||||||||
| Gross Yield - Bonds (excl affiliates) |
4.45 | 4.52 | 4.48 | |||||||||
| Gross Yield - Preferred Stocks (excl affiliates) |
6.37 | 6.38 | 4.66 | |||||||||
| Gross Yield - Common Stocks (excl affiliates) |
3.80 | 5.93 | 6.22 | |||||||||
| Gross Yield - Mortgage Loans |
5.23 | 5.08 | 5.39 | |||||||||
| Gross Yield - Real Estate |
NA | NA | NA | |||||||||
| Gross Yield - Contract Loans |
6.53 | 5.67 | 3.58 | |||||||||
| Gross Yield - Cash and Short Term |
0.01 | 0.17 | 0.48 | |||||||||
| Gross Yield - All Other Inv. Assets |
5.24 | 7.10 | 7.94 | |||||||||
| Bond Portfolio Composition (%) |
||||||||||||
| Total Bonds (incl Short-Term) ($000) |
346,901 | 319,933 | 313,950 | |||||||||
| U.S Government / Total Bonds |
1.59 | 1.29 | 2.30 | |||||||||
| Foreign Government / Total Bonds |
0.04 | 0.04 | 0.04 | |||||||||
| States, Territories & Possessions / Total Bonds |
0.32 | 0.34 | 0.35 | |||||||||
| Political Subdivisions / Total Bonds |
0.30 | 0.32 | 0.48 | |||||||||
| Special Revenue / Total Bonds |
18.41 | 17.23 | 17.62 | |||||||||
| Public Utilities / Total Bonds |
NA | NA | NA | |||||||||
| Industrial / Total Bonds |
79.34 | 80.73 | 78.86 | |||||||||
| Credit Tenant Loans / Total Bonds |
NA | NA | NA | |||||||||
| Affiliated / Total Bonds |
0.00 | 0.00 | 0.00 | |||||||||
| Privately Placed Bonds / Total Bonds |
26.55 | 27.66 | 28.62 | |||||||||
| Privately Placed Bonds / C&S |
68.43 | 66.93 | 70.41 | |||||||||
| Bond Average Asset Quality (NAIC Des # 1-6) |
||||||||||||
| U.S Government |
1.00 | 1.00 | 1.00 | |||||||||
| Foreign Government |
2.00 | 2.00 | 2.00 | |||||||||
| States, Territories & Possessions |
1.00 | 1.00 | 1.00 | |||||||||
| Political Subdivisions |
1.47 | 1.48 | 1.32 | |||||||||
| Special Revenue |
1.00 | 1.00 | 1.00 | |||||||||
| Public Utilities |
NA | NA | NA | |||||||||
| Industrial |
1.47 | 1.53 | 1.56 | |||||||||
| Credit Tenant Loans |
NA | NA | NA | |||||||||
| Affiliated |
NA | NA | NA | |||||||||
| Total Bonds |
1.38 | 1.43 | 1.45 | |||||||||
| Bonds Rated 3-6 / Total Bonds |
5.52 | 7.90 | 9.40 | |||||||||
| Bonds Rated 3-6 / C&S |
14.24 | 19.12 | 23.12 | |||||||||
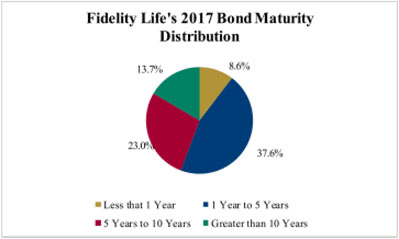
| Bond Maturity Distribution (%) |
||||||||||||
| < 1 Year / Total Bonds |
12.79 | 6.91 | 8.59 | |||||||||
| 1 - 5 Years / Total Bonds |
41.02 | 45.35 | 37.57 | |||||||||
| 5 - 10 Years / Total Bonds |
23.92 | 20.93 | 23.00 | |||||||||
| 10 - 20 Years / Total Bonds |
7.01 | 11.89 | 13.72 | |||||||||
| > 20 Years / Total Bonds |
15.26 | 14.92 | 17.12 | |||||||||
| Preferred Stock Portfolio Composition (%) |
||||||||||||
| Total Preferred Stock (incl Nonadmitted) ($000) |
500 | 500 | 1,890 | |||||||||
| Public Utilities / Total Preferred |
NA | NA | NA | |||||||||
| Banks, Trust & Unaffil Insurance / Total Preferred |
NA | NA | NA | |||||||||
| Industrial & Misc / Total Preferred |
100.00 | 100.00 | 100.00 | |||||||||
| Affiliated / Total Preferred |
0.00 | 0.00 | 0.00 | |||||||||
| Common Stock Portfolio Composition (%) |
||||||||||||
| Total Common Stock (incl Nonadmitted) ($000) |
4,401 | 6,286 | 5,705 | |||||||||
| Public Utilities / Total Common |
NA | NA | NA | |||||||||
| Banks, Trust & Unaffil Insurance / Total Common |
NA | NA | NA | |||||||||
| Industrial & Misc / Total Common |
100.00 | 100.00 | 100.00 | |||||||||
| Affiliated / Total Common |
0.00 | 0.00 | 0.00 | |||||||||
| Mortgage Loan Portfolio Composition (%) |
||||||||||||
| Total Mortgage Loans (incl Nonadmitted) ($000) |
29,929 | 32,785 | 43,120 | |||||||||
| Mortgages in Good Standing / Total |
95.33 | 95.97 | 98.37 | |||||||||
| Restructured Mortgages / Total |
4.67 | 3.83 | 1.63 | |||||||||
| Mortgages 90+ Due / Total |
0.00 | 0.00 | 0.00 | |||||||||
| Mortgages in Foreclosure / Total |
0.00 | 0.20 | 0.00 | |||||||||
| Mortgages in Foreclosure / C&S |
0.00 | 0.05 | 0.00 | |||||||||
| Real Estate Composition (%) |
||||||||||||
| Total Real Estate (incl Nonadmitted) ($000) |
0 | 0 | 0 | |||||||||
| Real Estate Occupied / Total |
NA | NA | NA | |||||||||
| Income Producing Real Estate / Total |
NA | NA | NA | |||||||||
| Real Estate Held for Sale / Total |
NA | NA | NA | |||||||||
Source: SNL Financial.
Exhibit XVIII
| Comparative Market Valuation Analysis As of and for the LTM Period Ended 12/31/2017 |
||||||||||||||||||||||||||||||||||||
| 4/11/2018 Closing Price ($) |
Market Value $MM |
Price/ Book (%) |
Price/ Tangible Book (%) |
Price/ LTM EPS (x) |
Price/ LTM Revenue (x) |
Price/ Total Assets (%) |
Pro forma Equity/ Assets (%) |
Current Dividend Yield (%) |
||||||||||||||||||||||||||||
| MMHC Fully Converted |
||||||||||||||||||||||||||||||||||||
| Pro Forma Valuation Minimum |
10.00 | 148.8 | 46.40 | 46.66 | NM | 1.25 | 18.81 | 40.54 | 0.00 | |||||||||||||||||||||||||||
| Pro Forma Valuation Midpoint |
10.00 | 175.0 | 50.89 | 51.18 | NM | 1.46 | 21.50 | 42.24 | 0.00 | |||||||||||||||||||||||||||
| Pro Forma Valuation Maximum |
10.00 | 201.3 | 54.82 | 55.10 | NM | 1.67 | 24.03 | 43.84 | 0.00 | |||||||||||||||||||||||||||
| Comparable Group Mean |
2,683.0 | 128.79 | 132.96 | 10.05 | 1.87 | 21.83 | 17.86 | 1.14 | ||||||||||||||||||||||||||||
| Comparable Group Median |
1,088.1 | 101.77 | 102.23 | 8.61 | 2.32 | 18.95 | 15.43 | 0.90 | ||||||||||||||||||||||||||||
| Comparable Group |
||||||||||||||||||||||||||||||||||||
| Torchmark Corporation |
83.42 | 9,497.5 | 153.41 | 165.11 | 6.83 | 2.25 | 40.86 | 25.11 | 0.76 | |||||||||||||||||||||||||||
| Primerica, Inc. |
96.55 | 4,254.4 | 301.07 | 312.41 | 12.69 | 2.44 | 34.05 | 11.42 | 1.04 | |||||||||||||||||||||||||||
| FBL Financial Group, Inc. |
70.85 | 1,759.8 | 127.46 | 128.38 | 9.14 | 2.39 | 17.51 | 12.59 | 2.65 | |||||||||||||||||||||||||||
| Kansas City Life Insurance Company |
43.00 | 416.4 | 56.49 | 56.49 | 8.08 | 0.93 | 9.31 | 15.73 | 2.40 | |||||||||||||||||||||||||||
| Security National Financial Corporation |
5.38 | 86.7 | 58.22 | 59.32 | 6.18 | 0.31 | 8.83 | 15.13 | 0.00 | |||||||||||||||||||||||||||
| UTG, Inc. |
25.00 | 83.1 | 76.08 | 76.08 | 17.36 | 2.88 | 20.39 | 27.17 | 0.00 | |||||||||||||||||||||||||||
| Performing median (n = 4) |
3,007.07 | 140.43 | 146.74 | 7.98 | 2.32 | 25.78 | 13.86 | 0.90 | ||||||||||||||||||||||||||||
| Poor performing median (n = 2) |
249.75 | 66.28 | 66.28 | 12.72 | 1.91 | 14.85 | 21.45 | 1.20 | ||||||||||||||||||||||||||||
| Discount of poor to performing |
52.80 | 54.83 | -59.34 | 17.91 | 42.39 | -54.76 | -33.69 | |||||||||||||||||||||||||||||
Source: S&P Global Market Intelligence and Company financial statements
"Poor Performing" defined as companies with less than 1% ROAA 8% ROAE on a 3-year average basis
Note: Data as of 12/31/2017 other than stock price, market capitalization, P/BV, P/TBV and P/LTM EPS .
Exhibit XIX
Members Mutual Holding Company
Pro Forma Assumption for Conversion Valuation
| 1. | The initial offering price is $10.00 per share and the number of shares offered is calculated by dividing the estimated pro forma market value by the offering price. |
| 2. | Total conversion and offering expenses are estimated at $15.1 million at the midpoint. The transaction expenses as estimated by Fidelity Life management is based on certain incurred fixed costs as well as variable costs associated with the level of subscription from policyholder subscription and a syndication (as defined in Raymond James engagement letter). Assumes that a traditional SRC occurs. |
| 3. | It is assumed that 3% of the shares offered for sale will be acquired by an employee stock ownership plan (“ESOP”) Pro forma adjustments have been made to earnings and equity to reflect the impact of the ESOP. The aggregate purchase price of shares of common stock to be purchased by the ESOP in the offering represents unearned compensation and is reflected as a reduction in capital, It is further assumed that the ESOP purchase is funded by a loan from Members Mutual. No reinvestment is assumed on proceeds used to fund the ESOP. The amount of this borrowing has been reflected as a reduction from gross proceeds to determine the estimated net funds available for reinvestment. The ESOP expense reflects recognition of expense based upon shares committed to be allocated under the ESOP. For purposes of this calculation, the average market value was assumed to be equal to the initial offering price of $10.00. |
| 4. | Assumes 4% of shares offered for sale will be acquired by the Company for a restricted stock plan to be ratably allocated and expensed over 5 years. |
| 5. | The net investable proceeds are fully invested at the beginning of the applicable period. The net investable proceeds are invested to yield a return of 2.79% which represents the estimated yield on the 10-year U.S. Treasury bond as of April 11, 2018 The effective federal income tax rate was assumed to be 21.0%, resulting in an after-tax yield of 2.20%. |
| 6. | The net increase in earnings excludes after-tax ESOP amortization over 10 years and LTIP after tax expense over 5 years. |
| 7. | For the earnings per share (“EPS”) calculations, pro forma per share amounts have been computed by dividing pro forma amounts by the total outstanding number of shares of stock, adjusted to give effect to the purchase of ESOP shares in accordance with Statement of Position (“SOP”) 93-6, Under SOP 93-6, the weighted average of the ESOP shares that have not been committed for release are subtracted from total shares outstanding when calculated EPS. |
| 8. | No effect has been given in the pro forma equity calculation for the assumed earnings on the net proceeds. |
| 9. | For the book value and asset calculations, pro forma per share amounts have been computed by dividing pro forma amounts by the total outstanding number of shares of stock. |
| 10. | The additional shares that Members Mutual expects to issue after the Conversion in conjunction with the grant of options have not been considered in our analysis. |
Exhibit XX
Pro Forma Conversion Valuation Range - Full Conversion Basis
(Dollars in Thousands, except per share data)
| Minimum | Midpoint | Maximum | ||||||||||
| Total implied shares outstanding |
14,875,000 | 17,500,000 | 20,125,000 | |||||||||
| Offering price1 |
$ | 10.00 | $ | 10.00 | $ | 10.00 | ||||||
|
|
|
|
|
|
|
|||||||
| Implied Gross Proceeds: |
$ | 148,750 | $ | 175,000 | $ | 201,250 | ||||||
| Less: estimated expenses2 |
(13,952 | ) | (15,113 | ) | (16,273 | ) | ||||||
|
|
|
|
|
|
|
|||||||
| Implied net offering proceeds |
134,798 | 159,887 | 184,977 | |||||||||
| Less: ESOP Plan Purchase3 |
(4,463 | ) | (5,250 | ) | (6,038 | ) | ||||||
| Less: LTIP Plan Purchase4 |
(5,950 | ) | (7,000 | ) | (8,050 | ) | ||||||
|
|
|
|
|
|
|
|||||||
| Net investable proceeds5 |
$ | 124,385 | $ | 147,637 | $ | 170,890 | ||||||
|
|
|
|
|
|
|
|||||||
| Net Income: |
||||||||||||
| LTM ended 12/31/2017 |
(8,241 | ) | (8,241 | ) | (8,241 | ) | ||||||
| Pro forma income on net proceeds5 |
2,742 | 3,254 | 3,767 | |||||||||
| Pro forma ESOP expense amortization adjustment |
(353 | ) | (415 | ) | (477 | ) | ||||||
| Pro forma LTIP adjustment |
(940 | ) | (1,106 | ) | (1,272 | ) | ||||||
|
|
|
|
|
|
|
|||||||
| Pro forma net income6 |
(6,792 | ) | (6,508 | ) | (6,223 | ) | ||||||
| Pro forma earnings per share7 |
(0.47 | ) | (0.38 | ) | (0.32 | ) | ||||||
| Total Revenue: |
||||||||||||
| LTM ended 12/31/2017 |
115,870 | 115,870 | 115,870 | |||||||||
| Pro forma revenue on net proceeds, pre-tax |
3,470 | 4,119 | 4,768 | |||||||||
|
|
|
|
|
|
|
|||||||
| Pro forma total revenue |
119,340 | 119,989 | 120,638 | |||||||||
| Pro forma total revenue per share |
8.02 | 6.86 | 5.99 | |||||||||
| Total Equity: |
||||||||||||
| Total equity at 12/31/2017 |
196,203 | 196,203 | 196,203 | |||||||||
| Net offering proceeds |
134,798 | 159,887 | 184,977 | |||||||||
| Less: ESOP plan purchase |
(4,463 | ) | (5,250 | ) | (6,038 | ) | ||||||
| Less: LTIP plan purchase |
(5,950 | ) | (7,000 | ) | (8,050 | ) | ||||||
|
|
|
|
|
|
|
|||||||
| Pro forma total equity8 |
320,588 | 343,840 | 367,093 | |||||||||
| Pro forma book value per share9 |
21.55 | 19.65 | 18.24 | |||||||||
| Tangible Equity: |
||||||||||||
| Total tangible equity at 12/31/2017 |
194,323 | 194,323 | 194,323 | |||||||||
| Net offering proceeds |
134,798 | 159,887 | 184,977 | |||||||||
| Less: ESOP plan purchase |
(4,463 | ) | (5,250 | ) | (6,038 | ) | ||||||
| Less: LTIP plan purchase |
(5,950 | ) | (7,000 | ) | (8,050 | ) | ||||||
|
|
|
|
|
|
|
|||||||
| Pro forma tangible equity |
318,708 | 341,960 | 365,213 | |||||||||
| Pro forma tangible book value per share9 |
21.43 | 19.54 | 18.15 | |||||||||
| Total Assets: |
||||||||||||
| Total assets at 12/31/2017 |
666,414 | 666,414 | 666,414 | |||||||||
| Net offering proceeds |
134,798 | 159,887 | 184,977 | |||||||||
| Less: ESOP plan purchase |
(4,463 | ) | (5,250 | ) | (6,038 | ) | ||||||
| Less: LTIP plan purchase |
(5,950 | ) | (7,000 | ) | (8,050 | ) | ||||||
|
|
|
|
|
|
|
|||||||
| Pro forma total assets |
790,799 | 814,051 | 837,304 | |||||||||
| Pro forma total assets per share9 |
53.16 | 46.52 | 41.61 | |||||||||
| Pro Forma Ratios: |
||||||||||||
| Price / LTM EPS |
NM | NM | NM | |||||||||
| Price / LTM Revenue |
1.25 | 1.46 | 1.67 | |||||||||
| Price / Book Value |
0.46 | 0.51 | 0.55 | |||||||||
| Price / Tangible Book Value |
0.47 | 0.51 | 0.55 | |||||||||
| Price / Total Assets |
0.19 | 0.21 | 0.24 | |||||||||
| Total Equity / Assets |
40.54 | % | 42.24 | % | 43.84 | % | ||||||
| Tangible Equity / Assets |
40.30 | % | 42.01 | % | 43.62 | % | ||||||
Note: See Exhibit XIX for explanation of assumptions.